Data Acquisition System MICRO-PAM
50
Printed in Germany Data Acquisition System MICRO-PAM Manual Software: WinControl-3.29 Firmware: MICRO-HEAD Version 127 2.174/11.2020 2. Edition: November 9, 2020 MicroPam02.docx Heinz Walz GmbH, 2019 Heinz Walz GmbH · Eichenring 6 · 91090 Effeltrich · Germany Phone +49 9133 77650 · Telefax +49 9133 5395 [email protected] · www.walz.com
Transcript of Data Acquisition System MICRO-PAM

Printed in Germany
Data Acquisition System
MICRO-PAM
Manual
Software: WinControl-3.29 Firmware: MICRO-HEAD Version 127
2.174/11.2020 2. Edition: November 9, 2020
MicroPam02.docx
Heinz Walz GmbH, 2019
Heinz Walz GmbH · Eichenring 6 · 91090 Effeltrich · Germany Phone +49 9133 77650 · Telefax +49 9133 5395
[email protected] · www.walz.com


Contents
C1
CONTENTS
1 SAFETY INSTRUCTIONS ............................................................................... 1 1.1 GENERAL SAFETY INSTRUCTIONS .................................................................. 1 1.2 SPECIAL SAFETY INSTRUCTIONS.................................................................... 1 2 MICRO-PAM: GENERAL DESCRIPTION ........................................................ 3 3 MICRO-PAM SYSTEMS ............................................................................ 4 3.1 MICRO-HEAD/3B ................................................................................. 4 3.2 ONLINE CONFIGURATION ......................................................................... 7
3.2.1 PC Interface Box MONI-IB4/LAN ........................................... 7 3.3 STAND-ALONE CONFIGURATION .............................................................. 8
3.3.1 PC Interface Box MONI-IB1 ................................................... 8 3.3.2 MONI-DA Data Acquisition System ..................................... 10
3.4 GENERAL COMMENTS ............................................................................. 11 4 WINCONTROL-3 SOFTWARE ..................................................................... 12 4.1 INSTALLATION OF WINCONTROL-3 ............................................................ 12 4.2 RUNNING WINCONTROL-3 ...................................................................... 14 4.3 CHART WINDOW .................................................................................... 14 4.4 MONI-BUS WINDOW .............................................................................. 17 4.5 SAT-CHART WINDOW ............................................................................ 19 4.6 LIGHT CURVE WINDOW ........................................................................... 20 4.7 SETTINGS WINDOW ................................................................................ 24 5 SATURATION PULSE ANALYSIS ................................................................... 28 5.1 FIVE FLUORESCENCE LEVELS...................................................................... 28 5.2 FLUORESCENCE RATIO PARAMETERS .......................................................... 30 5.3 RELATIVE ELECTRON TRANSPORT RATE (ETR) .............................................. 32 6 GUARANTEE .......................................................................................... 36 6.1 MANUFACTURER’S GUARANTEE ................................................................ 36 6.2 CONDITIONS .......................................................................................... 36 6.3 INSTRUCTIONS ....................................................................................... 37 6.4 APPLICABLE LAW .................................................................................... 38 7 SPECIFICATIONS ...................................................................................... 39 7.1 ONLINE CONFIGURATION ....................................................................... 39
7.1.1 Measuring Head MICRO-HEAD/3B ...................................... 39 7.1.2 PC Interface Box MONI-IB4/LAN ......................................... 40
7.2 STAND-ALONE CONFIGURATION ............................................................ 41 7.2.1 Measuring Head MICRO-HEAD/3B ...................................... 41 7.2.2 Data Acquisition MONI-DA .................................................. 41 7.2.3 Transport Box ...................................................................... 42 7.2.4 PC Interface Box MONI-IB1 ................................................. 42 7.2.5 Solar Panel MONI-SP ........................................................... 43

Contents
C2
7.2.6 Fluorometer Software/Computer Minimum Requirements. 43 7.3 ACCESSORIES FOR STAND-ALONE CONFIGURATION .................................... 43
7.3.1 Four-Way Distributor MICRO-HUB ...................................... 43 7.3.2 PC Interface USB-0 ............................................................... 44 7.3.3 Satellite Modem .................................................................. 44
8 INDEX ................................................................................................... 45

Safety Instructions
1
1 Safety Instructions
1.1 General Safety Instructions
- Read and follow safety and operating instructions prior to
operation of the device. Pay attention to all safety warn-
ings.
- The devices, MICRO HEAD/3B measuring head and data
acquisition system MONI-DA, are designed for outdoor
use. Still, avoid as much as possible exposure of devices
to dust, sand and dirt.
- Keep all ports of MONI-DA and MICRO HEAD/3B abso-
lutely clean and dry.
- Run all cables so that stepping on or stumbling over them
is excluded.
- Ensure that neither liquids nor foreign bodies get inside
the device.
- Do not put these devices near sources of heat.
- Connect the device only to the power source indicated in
operating instructions or on the device. If the device is not
in use, remove the mains plug from the socket.
- Do not open housing of MICRO-HEAD/3B, interface
boxes or MONI-DA. There are no serviceable parts inside.
The device may only be repaired by the manufacturer.
1.2 Special Safety Instructions
- The MICRO-PAM system is a highly sensitive measuring
system which should be only used for research purposes,

Safety Instructions
2
as specified in this manual. Follow the instructions of this
manual in order to avoid potential harm to the user and
damage to the instrument.
- The measuring heads MICRO HEAD/3B can emit very
strong light! In order to avoid harm to your eyes, never
look directly into the light port or fiber optics of the meas-
uring heads.

General Description
3
2 MICRO-PAM: General Description
The MICRO-PAM is a system integrating up to 16 measuring
heads for long-term monitoring of plant photosynthesis. The
simultaneous monitoring of several sites is now a well-proven
concept to evaluate photosynthesis of different plants under
natural conditions.
The individual measuring head of the MICRO-PAM system is a
PAM fluorometer called MICRO-HEAD/3B. The head is
equipped with a high-performance blue LED. A 3 mm diameter
light guide optically connects this LED to the sample. The MI-
CRO-HEAD/3B is equipped with a leaf temperature and a hu-
midity sensor. The measuring heads are particularly compact
and energy-efficient PAM fluorometers.
In the simplest form, a MICRO-PAM system consists of a com-
puter to which up to four measuring heads can be connected.
In the absence of line power, the data acquisition system MONI-
DA replaces the computer. Special adapter boxes allow MI-
CRO-PAM systems comprising up to 16 measuring heads con-
nected to a single MONI-DA.
MONI-DA-based systems can be upgraded by a modem. In this
configuration, the MONI-DA sends data to the user’s computer
via a dedicated server.

MICRO-PAM Systems
4
3 MICRO-PAM Systems
3.1 MICRO-HEAD/3B
The measuring head MICRO-HEAD/3B is shown in Fig. 1 (p. 5).
The head consists of a plastic box with special protection against
the ultraviolet radiation. The box contains all optoelectronic com-
ponents for PAM fluorescence analysis. Light guide and cable port
are placed at opposite sides of the box. The MICRO-HEAD/3B
uses the same blue LED for measuring light, actinic light and sat-
uration pulses. The normalized emission spectrum of this LED is
depicted in Fig. 2 (p. 6).
The box is supported by an aluminum plate. Two holes in the alu-
minum plate extent to the plastic box. Each channel is closed by
a special ventilation membrane. One channel gives access to the
internal humidity sensor.
Mounted 1 cm beneath, a bipartite aluminum structure forms the
leaf clip in front of the light guide. The other end has a recess to
connect the measuring head to a stand. One gooseneck-type
stand is provided for each measuring head.
The leaf clip is held together by magnets. Open leaf clip only by
applying pressure on the lever at the bottom of the MICRO-
HEAD/3B (see Fig. 1, p. 5).
The sample plane of the leaf clip and the fiber optics form an angle
of 60°. The PAR sensor is mounted on the clip around 5 mm above
the sample plane. For distant light sources like the sun, the PAR
reading applies for the sample level.

MICRO-PAM Systems
5
Fig. 1: MICRO-HEAD/3B.
The thermocouple mounted to a steal spring is placed below the
clip. When needed, adjust thermocouple to the sample by manu-
ally bending the spring.
The indicator LED of the measuring head (cf. Fig. 1, p. 5) shines
green when fluorescence values range between 300 and 700. The
LED turns red when the fluorescence value is outside of this
range. With the sample in the dark or exposed to dim light, the
fiber should be positioned so that signal LED shines green, that is,
the signal is in the target range of 300 to 700.
The signal should not fall much below the lower limit of the target
range to avoid low signal quality; the signal should not exceed the
upper limit to avoid signal saturation during a saturating pulse. The
principle considerations for estimating the upper target range are
outlined in Table 1 which considers that the highest PAM value is
4000 and assumes an FV/FM value of 0.84.

MICRO-PAM Systems
6
Fig. 2: Relative Spectrum Emission of Blue Power LED.
Table 1: Maximum F0 of a Dark-acclimated Leaf.
640
84.0
)(
)(
0
0
Max
MaxMV
MaxM
MaxMaxM
MaxM
V
F
FFwith
F
FF
F
F
(FM)Max, maximum possible FM value = maximum value of MICRO-PAM = 4000.
(F0)MAX, unknown maximum F0 value (the FM associated with this F0, or with smaller F0, is not saturating).
(FV/FM)Max, assumed maximum possible PS II photochemical yield.

MICRO-PAM Systems
7
3.2 ONLINE Configuration
In the ONLINE configuration of the MICRO-PAM, the software
WinControl-3, running on a Windows computer, controls data ac-
quisition. The interface box MONI-IB4/LAN connects up to four
measuring heads to the computer. The ONLINE configuration re-
quires line current for the measuring heads and for the computer.
In addition to USB communication, the interface box MONI-
IB4/LAN permits connecting to a local area network (LAN, Fig. 3).
RS-232 is available for special applications.
3.2.1 PC Interface Box MONI-IB4/LAN The PC Interface Box MONI-IB4/LAN can connect up to four MI-
CRO-HEAD/485 to a computer. The measuring heads are pow-
ered via the MONI-IB4/LAN (Fig. 3, page 7). Accordingly, the box
is equipped with 4 RS 485 ports, one port for the charger and 1
USB port. In addition, the MONI-IB4/LAN possesses a port for
Ethernet and another one for RS232 communication.
Fig. 3: MICRO-PAM ONLINE configuration.
The scheme shows the standard package MICRO-3B-SET4. PC, Ethernet cable and
RS-232 cable must be ordered separately. Weatherproof parts are drawn on light-
green background.

MICRO-PAM Systems
8
3.3 STAND-ALONE Configuration
The STAND-ALONE configuration of the MICRO-PAM is designed
for field research without line current. Control of measuring heads
and data acquisition is performed by the weatherproof MONI-DA
data acquisition system. The battery of the MONI-DA is charged
by solar panels.
For long nights at polar sites, an external high-capacity battery can
support the internal battery of the MONI-DA.
The MONI-DA has seven so-called MONI-BUS ports to which
measuring heads MICRO-HEAD/3B can be connected. The
MONI-HUB permits connecting four measuring heads to a single
MONI-BUS port. Thus, the number of measuring heads can ex-
ceed the number of seven. Because of memory-limitations, the
maximum number of measuring heads is 16.
3.3.1 PC Interface Box MONI-IB1 The PC Interface Box MONI-IB1 connects the MONI-DA data ac-
quisition system to a Windows computer (Fig. 4, page 9). Accord-
ingly, the box is equipped with an RS 485 ports and a 1 USB port.
When connected to a computer, the STAND-ALONE configuration
is operated in the online mode, that is, the software WinControl-3
controls the MONI setup and acquires data. However, data ac-
quired in the stand-alone mode by the MONI-DA cannot be down-
loaded via the MONI-IB1 box. In this case, the MicroSD card in the
MONI-DA must be readout. Also charging the MONI-DA battery
with line current requires the MONI-IB1 box.
MICRO-PAM Systems
9
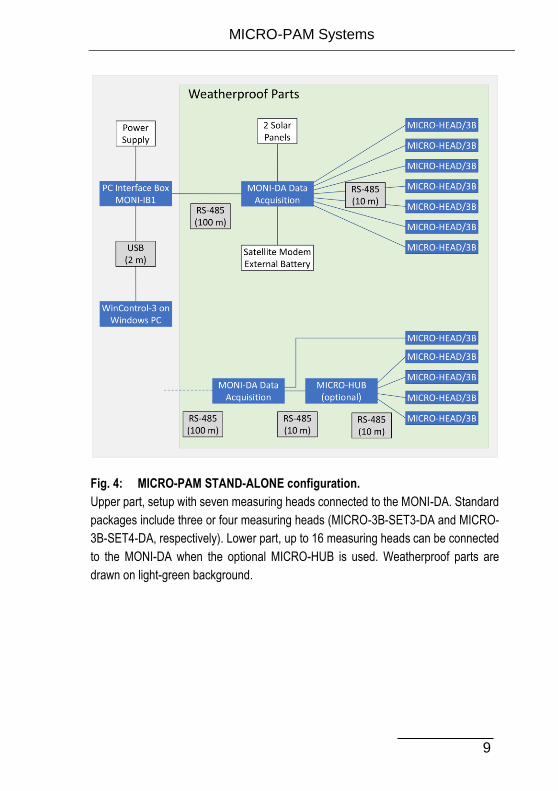
Fig. 4: MICRO-PAM STAND-ALONE configuration.
Upper part, setup with seven measuring heads connected to the MONI-DA. Standard
packages include three or four measuring heads (MICRO-3B-SET3-DA and MICRO-
3B-SET4-DA, respectively). Lower part, up to 16 measuring heads can be connected
to the MONI-DA when the optional MICRO-HUB is used. Weatherproof parts are
drawn on light-green background.

MICRO-PAM Systems
10
Fig. 5: MONI-DA.
3.3.2 MONI-DA Data Acquisition System
See separate manual.

MICRO-PAM Systems
11
3.4 General Comments
- Take care that the PAR sensor is not shaded by a neigh-
boring leaf.
- Position thermocouple carefully to avoid penetration of del-
icate samples.
- Under rainy conditions, a water droplet can persist on the
tip of the fiber optics. The droplet changes the optical prop-
erties of the measuring heads and may cause a signal
drop. As a signal reduction will affect all fluorescence lev-
els, the Y(II) remains unaffected, in most cases.
- Do not carry out saturation pulse analysis at high fre-
quency as this might stress the sample, particularly during
the night. A 30 min interval is sufficient for most studies.
On request, we provide a batch file which reduces the SAT
pulse frequency automatically during dark periods.
- When data of individual heads or of the entire system are
repeatedly missing, check if water has get in any of the
plug connections.

WinControl-3
12
4 WinControl-3 Software
4.1 Installation of WinControl-3
The WinControl-3 software is provided on the Walz “Software &
Manuals CD”. Always, check the Walz website for the latest soft-
ware version:
https://www.walz.com/downloads/overview.html
To install WinControl-3 from the Walz “Software & Manuals CD”
- Insert CD and approve execution of program “shelExec.exe”
to open the Walz welcome screen in your default browser.
- Consecutively, click Chl fluorescence & P700 (top bar)
MICRO-PAM (left menu), and EXE-File (“Software WinCon-
trol” box on the left). Execute WinControl-3 setup file or save
it on your computer and execute later.
Procedure
Installation of WinControl-3 is mostly automatic. Dialog boxes ap-
pearing during setup provide advice or allow configuration of Win-
Control-3. To install WinControl-3, proceed as follows.
- Close other programs as advised by the setup wizard.
- Accept default folder for program installation or choose dif-
ferent folder.
- Select “Standard” Installation as the “JUNIOR-PAM Teach-
ing Edition” runs only with JUNIOR-PAM fluorometers.
- Install USB driver. Install optional links to WinControl-3 (icon
or shortcut).

WinControl-3
13
FIRMWARE UPDATE
The term “firmware” denotes software residing on the flash
memory inside the MICRO-HEAD/3B or MONI-DA. Firmware is
included in the WinControl-3 software.
When WinControl-3 devices are connected to the computer, firm-
ware update can be carried out during installation of WinControl-
3. Alternatively, run firmware update later using the program “PAM
Firmware Update”. PAM Firmware Update is available in the Win-
Control-3 software folder (Table 2).
Always after installation of a new version of WinControl-3, running
PAM Firmware Update is important because new software prop-
erties may function only in the presence of the latest firmware.
For firmware update, measuring heads MICRO-HEAD/3B must be
connected via interface (MONI-IB4/LAN or MONI-IB4/LAN) to the
computer. Firmware update does not work when the MICRO-
HEAD/3B are connected to the MONI-DA.
Table 2: WinControl-3 in Windows Start Menu.

WinControl-3
14
4.2 Running WinControl-3
Launch software via desktop icon or the WinControl-3 folder in the
Start menu of Windows (Table 2, p. 13). The software will auto-
matically detect all devices connected and being compatible with
the WinControl-3 software. The following section will provide an
overview on the operation of a MICRO-PAM system by WinCon-
trol-3. More details are available in the Manual for the JUNIOR-
PAM Teaching Fluorometer.
https://www.walz.com/products/chl_p700/junior-pam/downloads.html
4.3 Chart Window
The Chart window (Fig. 6) continuously records PAM fluorescence
(Ft) and the results of saturation pulse analysis. The amount of
data produced by a MICRO-PAM system might be confusing. To
get an overview, reduce the number of data displayed by selecting
parameters on the “Val.” panel, or by selecting channels on the
“Rec.” panel or by both.
In the same way, data display can be controlled in other windows
(Induct. Curve, Light Curve, and Report). In the latter case, the
data selection also corresponds to the data exported as CSV file.
On the chart, an X axis interval can be marked by the cursor with
the left mouse button pressed. A right click in the marked area
opens a context menu. All marked data are also highlighted in the
SAT Chart window and the Report.
Table 3 summarizes and explains the commands of the Chart
Window.

WinControl-3
15
Table 3: Chart Commands.
Icon Com-
mand
Comment
Delete Delete current data (all records and report data)
Load Delete current data and load previously saved
data. Same function as Load Data in File menu.
Save
Save all records of the current experiment. Same
function as Save Data in File menu
Chart
Print current chart
Switch
Grid
on/off
Graph design command
Fig. 6: Chart Window. Screenshot taken with predecessor model HEX-PAM.

WinControl-3
16
Icon Com-
mand
Comment
View
Sym-
bols
on/off
Graph design command
View
Lines
Graph design command
Float Create a floating chart window. Graph settings and
data selection of the new chart are independent of
the WinControl-3 main window.
Record
Online
Record continuously Ft, PAR* and Temp*. For
long-term measurements, Rec. Online may be
turned off when memory size is small.
Sam-
pling
Fre-
quency
Dropdown menu with three different sampling fre-
quencies for online record: <5/s>, <1/s>, and
<1/10s>. The frequency setting affects only online
data (Ft, PAR*, and Temp*, see below). The high-
est sampling frequency of <5/s> applies only to Ft:
sampling of PAR* and Temp* occurs with <1/s>
maximally. The actual intervals between measure-
ments vary depending on communication between
fluorometer and computer.
Options Menu with 4 items of which two (Zoom to Selection
and Export Selection) are available only after chart
data have been selected. To select data, place
mouse cursor in the Chart area, move mouse cur-
sor with left mouse button pressed parallel to the
x-axis across the data of interest: the selection will
be highlighted. The options menu is also available
by placing the cursor within the selected area and
clicking the right mouse button. A single left-button
click in the chart area removes an existing selec-
tion.
Float
Rec. Online
5/s
Options

WinControl-3
17
Icon Com-
mand
Comment
Not that a selection made in the chard highlights
the associated data in the SAT-Chart and the Re-
port windows.
Export All Export All
Export all data currently graphed (online and satu-
rating pulse analysis data) as CSV file.
4.4 Moni-Bus Window
The Moni-Bus Window provides an overview to all devices con-
nected to the MICRO-PAM. Fig. 7 (p. 18) depicts the situation of
6 measuring heads connected to a MONI-DA. The numbers pre-
ceded by a hash in column 1 are channel numbers. Graphical and
numerical data in WinControl-3 are always associated to the chan-
nel number.
The second column (Comment) can be edited. These comments
are stored in the MICRO-PAM flash memory.

WinControl-3
18
Fig. 7: Moni-Bus Window. Screenshot taken with predecessor model HEX-PAM.
The swung dash (~) indi-cates that the Fo’ is calcu-lated: Oxborough, Baker NR (1997) Photosynth
Res 54: 135-142

WinControl-3
19
4.5 SAT-Chart Window
The SAT chart window displays fluorescence kinetics of the cur-
rent experiments. In saturation pulse analysis, the FM and FM’ lev-
els are determined as the maximum of these curves. Factory set-
tings of saturation pulse width and intensity are adjusted reach a
plateau with normal green leaves (Fig. 9A). Some samples do not
reach a plateau with standards settings (Fig. 9B). In this case, the
saturation pulse intensity or/and length should be increased. Also,
fluorescence kinetics can reach a maximum clearly before the end
of the saturation pulse (Fig. 9C). This does not result in erroneous
FM or FM’ values because these values correspond to the maxi-
mum of fluorescence kinetics. In this case, saturation pulse inten-
sity or/and length might be decreased.
Fig. 8: SAT Chart Window. Screenshot taken with predecessor model HEX-PAM.

WinControl-3
20
Some samples, particularly low light grown or senescing plants,
exhibit somewhat decreased FV/FM values with standard settings
but show normal fluorescence kinetics. These samples increase
the FV/FM with decreasing saturation pulse intensity. Therefore,
testing the FV/FM at saturation pulse intensities below (and above)
standard settings is worthwhile to optimize your saturation pulse
settings.
Fig. 9: Fluorescence Kinetics induced by a Saturation Pulse.
4.6 Light Curve Window
The Light Curve window provides the button to start a light curve
and to view the results of saturation pulse analysis plotted against
PAR (Fig. 10, p. 21). The experimental course of a light curve is
defined on the settings page.
A light curve program exposes a sample to stepwise increasing
intensities of actinic illumination. In “Rapid Light Curves” (RLC),
the time interval of each light step is short (down to 10 s) and full
equilibration of photosynthetic reactions is not reached within an
illumination interval. Typically, the RLC starts at a PAR value
somewhat below that of the natural environment. RLC measure-
ments are carried out with samples in their momentary acclimation
status, that is, without dark-acclimation period to determine F0 and
FM. This way, RLC data can provide information on the present
acclimation state of photosynthesis. Obviously, without F0 and FM

WinControl-3
21
determination, those fluorescence ratio parameters requiring F0
and FM (like NPQ) are not available.
Fig. 10: Light Curve Window. Screenshot taken with predecessor model HEX-PAM.
If illumination steps are long enough to reach steady state of pho-
tosynthesis, fluorescence-based light curves may be com-pared
with classical light response curves (P-I curves). Naturally, any
limitation by insufficient CO2 supply must be avoided during such
long-term light curves.
The following cardinal parameters can be derived from a light
curve of ETR versus PAR:
α, electrons/photons: Initial slope of RLC which is related to
quantum efficiency of photosynthesis.

WinControl-3
22
ETRm, µmol electrons/(m2 · s): Maximum electron transport
rate.
EK, µmol photons/(m2 · s): Minimum saturating irradiance.
WinControl-3 uses two empirical functions to estimate these car-
dinal parameters: the functions REG1 and REG2 (cf. Fig. 10, p.
21) which have been introduced by Platt et al. (1980) and Jassby
and Platt (1976), respectively, to describe classical light response
curves of photosynthesis.
Jassby AD, Platt T (1976) Mathematical formulation of the relationship between photo-
synthesis and light for phytoplankton. Limnol Oceanogr 21: 540-547
Platt T, Gallegos CL, Harrison WG (1980) Photoinhibition of photosynthesis in natural
assemblages of marine phytoplankton. J Mar Res 38: 687-701
REG1 In case of REG1, the α results from fitting
mPotmPot ETR
PAR
ETR
PAR
mPot e)e1(ETRETR
to the light curve data using the Levenberg-Marquardt algorithm.
The latter equation considers photoinhibition of photosynthesis by
high light intensities. Therefore, the fitting procedure yields esti-
mates for β, the “photoinhibition parameter“ (Platt et al., 1980),
and for ETRmPot, the maximum potential light-saturated electron
transport rate which would be observed if photoinhibition was ab-
sent.
Platt et al. (1980) introduced the “Photoinhibition Index” (Ib) to
quantify photoinhibition. The authors defined Ib as the PAR value
required to photoinhibit ETRmPot by the factor of 1/e according to:
mPotb ETRI
WinControl-3
23
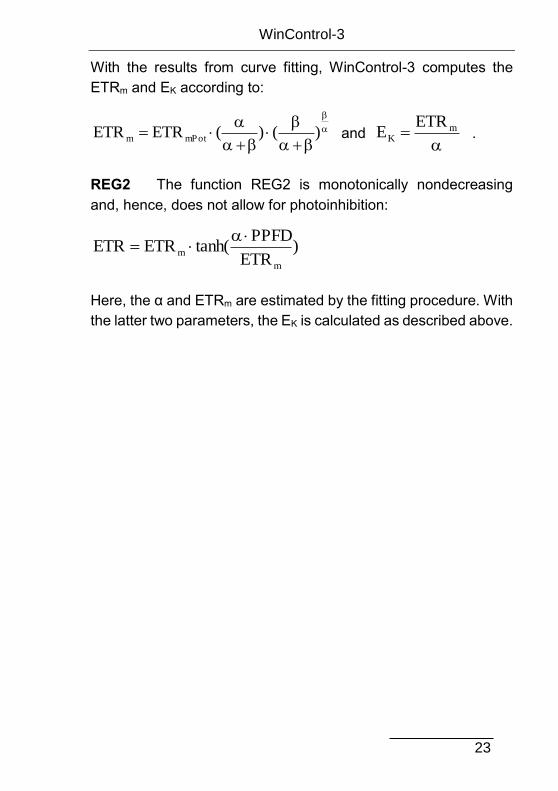
With the results from curve fitting, WinControl-3 computes the
ETRm and EK according to:
)()(ETRETR mPotm and
m
K
ETRE .
REG2 The function REG2 is monotonically nondecreasing
and, hence, does not allow for photoinhibition:
)ETR
PPFDtanh(ETRETR
m
m
Here, the α and ETRm are estimated by the fitting procedure. With
the latter two parameters, the EK is calculated as described above.
WinControl-3
24
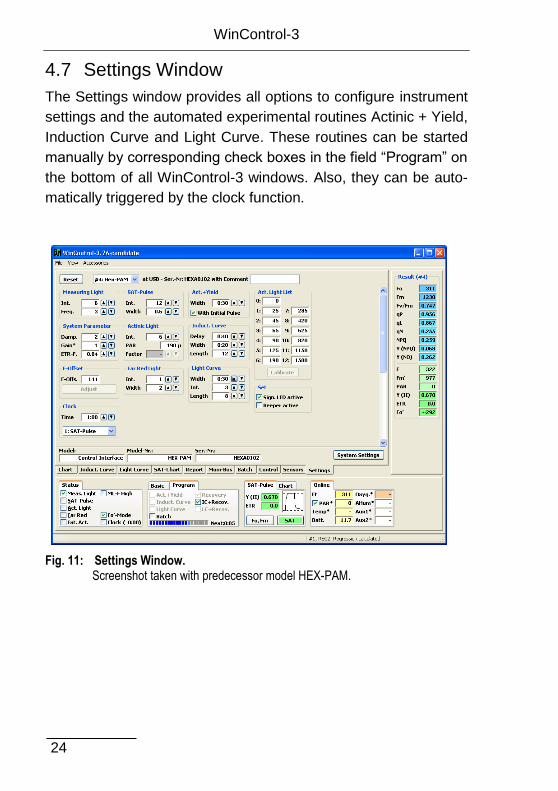
4.7 Settings Window
The Settings window provides all options to configure instrument
settings and the automated experimental routines Actinic + Yield,
Induction Curve and Light Curve. These routines can be started
manually by corresponding check boxes in the field “Program” on
the bottom of all WinControl-3 windows. Also, they can be auto-
matically triggered by the clock function.
Fig. 11: Settings Window. Screenshot taken with predecessor model HEX-PAM.

WinControl-3
25
Measuring light
Int. (intensity) and Freq. (frequency, see Table 4) adjustment. Fre-
quency high (100 Hz) is active during saturation pulse analysis.
Table 4: Measuring Light Frequencies.
Setting Frequency, Hz
1 5
2 10
3 15
4 20
5 25
high 100
Damping
Damping is a software-based filter that specifically suppresses
high frequency noise and, thus, can improve signal quality. Default
setting for damping is 2 (two). Changing damping to higher values
can make the MICRO-PAM response slow.
Gain
Gain corresponds to an electronic amplification factor. Settings 1
to 4 are available.
Adjust F-Offset
The command determines the background signal for subtraction
from the total signal. Background signals must possess the mod-
ulation characteristics of measuring light to be recognized by a
PAM fluorometer. These signals can arise from:
- Fluorescence from suspension media or detector filter ex-
cited by measuring light.
- Traces of modulated excitation light transmitted by the de-
tector filter.
- Non-optical modulated "electronic noise".

WinControl-3
26
Usually, the background signal increases with measuring light in-
tensity and signal amplification (gain). Therefore, the Adjust com-
mand determines the background signal for all measuring light in-
tensities and all gain settings. The currently active offset is dis-
played in the Moni-Bus Window with disconnected measuring
heads.
Procedure
- Choose dim environment.
- Switch off any flickering light sources like fluorescent lamps
or computer screens.
- Point fiber tip away from any objects, keep fiber tip clear.
- Run “Adjust F-Offset”
Clock Interval and Item
Adjust clock interval between 10 s and 60 min by adjusting the
time interval (up/down keys) or enter numbers after double click.
Choose clock item from drop down menu.
Clock items are saturation pulse analysis, Actinic + Yield, Induc-
tion Curve and Light Curve. A recovery experiment can be per-
formed after induction and light curves (LC+Rec and LC+Rec).
SAT-Pulse
Adjust intensity (settings 1 to 12) and interval (width, 0.2 to 2.0 s)
of saturation pulses.
Actinic Light
Adjust intensity of actinic light (settings 1 to 12). Values of the ac-
tinic light list are used.
Far Red Light
Does not apply for standard measuring heads of MICRO-PAM
systems.

WinControl-3
27
Actinic + Yield
The behavior of the Actinic + Yield program is defined by two fac-
tors: the duration (width) of actinic illumination (possible settings
from 5 s to 5 min) and the option to start actinic illumination without
preceding saturation pulse analysis (Initial pulse). The current ac-
tinic light intensity is used.
Induction Curve
Delay (range 5 s to 10 min) defines the dark interval between sat-
uration pulse analysis with the dark-acclimated sample (F0, FM de-
terminations) and beginning of actinic illumination.
Width (range 5 s to 10 min) is the time interval between two suc-
cessive saturation pulse analyses in the light phase.
Length is the number of saturation pulse analyses carried out dur-
ing actinic illumination. Thus, the duration of actinic illumination is
“Length – 1” times Width
Light Curve
Width defines the interval between two successive saturation
pulse analyses in the light phase. Intensity specifies the actinic
intensity setting for the first light step (see “Act. Light List”). Length
is the number of light steps which can range from 2 to 12. If length
= 5 and intensity = 2, 5 light steps with intensity settings 2, 3, 4, 5,
and 6 will be performed. The time required for a light curve results
from Length times Width.
Calibrate
Calibration routine for actinic light. Requires measuring head with
PAR sensor.

Saturation Pulse Analysis
28
5 Saturation Pulse Analysis
5.1 Five Fluorescence Levels
Fig. 12: Fluorescence levels of Saturation Pulse Analysis. AL, Actinic Light; D, dark; SP, Saturation Pulse; FR, Far red illumination.
Usually, five different levels of modulated fluorescence are ac-
quired by PAM fluorometers. Two of these levels (F0 and FM) must
be measured with the dark-acclimated sample. The three other
levels (F0’, F, and FM’) are measured with the actinic light-exposed
sample or in a dark period following this light treatment (see Fig.
12, page 28). Some parameters of saturation pulse analysis re-
quire fluorescence measurement of the same sample in both the
dark-acclimated and light-exposed state (Table 5, p. 34).

Saturation Pulse Analysis
29
Because PAM fluorescence is excited by µs pulses of constant
amplitude, variations between fluorescence levels are usually in-
terpreted as variation in chlorophyll fluorescence yield. This ap-
plies for variations between different types of fluorescence levels
(e.g. between F0 and FM) and for variations of the same type of
fluorescence level (e.g. the change of FM’ during a fluorescence
induction curve).
Measurements with Dark-Acclimated Samples
F0 Minimum fluorescence level excited by very low intensity of
measuring light to keep PS II reaction centers open.
FM Maximum fluorescence level elicited by a pulse of saturating
light (Saturation Pulse) which closes all PS II reaction centers.
Measurements with Illuminated Samples
F0’ Minimum fluorescence level of illuminated sample. The F0’ is
lowered relative to F0 by non-photochemical quenching. The
measuring routine for F0’ determines the F0’ level during a dark
interval following a Saturation Pulse. In this dark interval, far red
light is applied which selectively drives PS I. As a consequence,
electrons are removed from the intersystem electron transport
chain and opening of PS II reaction centers is efficiently acceler-
ated (see Fig. 12, page 28, time point 75 s). Ideally, far red opens
PS II in less than 5 s and it is often assumed that during this short
interval light-driven energization of the photosynthetic membrane
decays very little.
If the F0’ Mode is not available or switched off, the F0’ will be cal-
culated according to Oxborough and Baker (1997, reference in
Table 6, p. 35):
Saturation Pulse Analysis
30
MM FFF
F
111
1
0
0
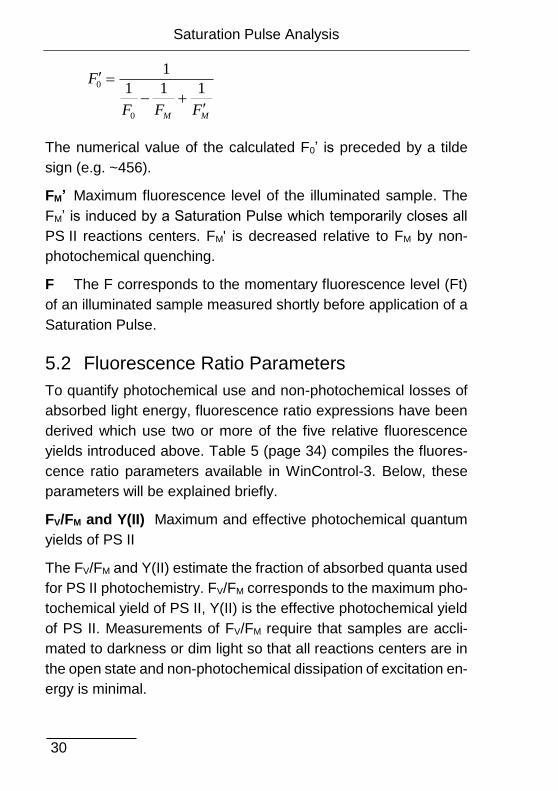
The numerical value of the calculated F0’ is preceded by a tilde
sign (e.g. ~456).
FM’ Maximum fluorescence level of the illuminated sample. The
FM’ is induced by a Saturation Pulse which temporarily closes all
PS II reactions centers. FM' is decreased relative to FM by non-
photochemical quenching.
F The F corresponds to the momentary fluorescence level (Ft)
of an illuminated sample measured shortly before application of a
Saturation Pulse.
5.2 Fluorescence Ratio Parameters
To quantify photochemical use and non-photochemical losses of
absorbed light energy, fluorescence ratio expressions have been
derived which use two or more of the five relative fluorescence
yields introduced above. Table 5 (page 34) compiles the fluores-
cence ratio parameters available in WinControl-3. Below, these
parameters will be explained briefly.
FV/FM and Y(II) Maximum and effective photochemical quantum
yields of PS II
The FV/FM and Y(II) estimate the fraction of absorbed quanta used
for PS II photochemistry. FV/FM corresponds to the maximum pho-
tochemical yield of PS II, Y(II) is the effective photochemical yield
of PS II. Measurements of FV/FM require that samples are accli-
mated to darkness or dim light so that all reactions centers are in
the open state and non-photochemical dissipation of excitation en-
ergy is minimal.

Saturation Pulse Analysis
31
In algae and cyanobacteria, however, the dark-acclimated state
often is not showing maximal PS II quantum yield, as the PS II
acceptor pool may be reduced in the dark by stromal reductants
and, consequently, the so-called state 2 is formed exhibiting low
PS II quantum yield. In this case, preillumination with moderate far
red light should precede determinations of F0 and FM.
The Y(II) value estimates the photochemical use of excitation en-
ergy in the light. It is lowered with respect to FV/FM by partial clo-
sure of PS II centers and various types of non-photochemical en-
ergy losses induced by illumination.
qP and qL Coefficients of photochemical fluorescence quenching
Both parameters estimate the fraction of open PS II reaction cen-
ters. The qP is based on the concept of separated PS II antenna
units (puddle model), whereas the qL assumes interconnected PS
II antenna units (lake model) which appears to be the more realis-
tic situation in leaves (cf. Kramer et al., 2004). Determinations of
qP an qL do not require fluorescence measurements with the dark-
acclimated sample except that the F0’ is calculated according to
Oxborough and Baker (1997).
qN and NPQ Parameters of non-photochemical quenching
Both parameters are associated with non-photochemical quench-
ing of excitation energy, mainly involving a low thylakoid lumen
pH- and a zeaxanthin-dependent quenching mechanism. The qN
and the NPQ parameters require fluorescence measurements
with the sample in the dark-acclimated and in the light-exposed
states (cf. Table 5, page 34).
Calculation of NPQ (or SVN; Gilmore and Yamamoto, 1991) cor-
responds to the Stern-Volmer equation for fluorescence quench-
ing which predicts proportionality between fluorescence quench-
ing (NPQ) and the concentration of fluorescence-quenching cen-
ters in the photosynthetic antennae (e.g. zeaxanthin).

Saturation Pulse Analysis
32
Y(NO), Y(NPQ) and Y(II) Complementary PS II yields
Genty et al. (1996) presented expressions describing the partition-
ing of absorbed excitation energy in PS II between three funda-
mental pathways the sum of which adds up to one:
Y(NO) non-regulated losses of excitation energy including heat
dissipation and fluorescence emission,
Y(NPQ) regulated energy losses of excitation energy by heat dis-
sipation involving ∆pH- and zeaxanthin-dependent mechanisms,
and
Y(II) use of excitation energy for charge separation.
This concept of "complementary PS II quantum yields" is useful to
analyze the partitioning of absorbed light energy in photosynthetic
organisms. For instance, in the presence of strong light, a much
higher Y(NPQ) than Y(NO) indicates that excess excitation energy
is safely dissipated at the antenna level and that photosynthetic
energy fluxes are well-regulated.
In variance, high values of Y(NO) would signify that excess exci-
tation energy is reaching the reaction centers, resulting in strong
reduction of PS II acceptors and photodamage, e.g. via formation
of reactive oxygen species.
5.3 Relative Electron Transport Rate (ETR)
Relative electron transfer rates are calculated according to:
ETR = PAR · ETR-Factor · PPS2/PPS1+2 · Y(II).
The basic idea of the ETR equation is to multiply Y(II), the effective
photochemical quantum yield of PS II, by an estimate for the pho-
ton flux density absorbed by all PS II in the sample. The latter es-
timate is derived from three numbers:

Saturation Pulse Analysis
33
(1) PAR Quantum flux density of photosynthetically active
radiation (PAR) impinging on the sample.
(2) ETR-Factor Sample absorptance (= 1 – transmittance)
The ETR-Factor describes the fraction of incident photons ab-
sorbed by the sample. The most frequently used default value for
green leaves is 0.84 meaning that 84% of incoming light is ab-
sorbed. The ETR-Factor can be lower in bleached leaves or
leaves containing considerable amounts of non-photosynthetic
pigments like anthocyanins.
(3) PPS2/PPS1+2 Relative distribution of absorbed PAR to photo-
system II
The default PPS2/PPS1+2 is 0.5 which assumes the PS II contributes
50% to total sample absorptance. The PPS2/PPS1+2 may deviate
from the idealized factor of 0.5 depending on wavelength of light
and acclimation status of the sample.

Saturation Pulse Analysis
34
Table 5: Fluorescence Ratio Parameters.
Source Equation Sample State
Range [Theory]
[Experiment]
Maximum photochemical quan-tum yield of PS II (Kitajima and Butler, 1975)
M
M
M
V
F
FF
F
F 0 Dark
[0, 1] [0, ~0.84]
Effective photochemical quantum yield of PS II (Genty et al., 1989)
M
M
F
FFIIY
)( Light
[0, 1] [0,~ 0.84]
Quantum yield of light-induced (ΔpH- and zeaxanthin-depend-ent) non-photochemical fluores-cence quenching (Genty et al. 1996)*
MM F
F
F
FNPQY
)( Dark and
Light [0, 1]
[0, ~ 0.9]
Quantum yield of non-regulated heat dissipation and fluorescence emission: this type of energy loss does not involve the action of a trans-thylakoid ΔpH and zeaxan-thin (Genty et al. 1996)*
MF
FNOY )( Dark and
Light [0, 1]
[0, ~ 0.9]
Stern-Volmer type non-photo-chemical fluorescence quenching (Bilger +and Björkman, 1990)
1
M
M
F
FNPQ Dark and
Light [0, ∞] [0, ~4]
Coefficient of photochemical fluo-rescence quenching (Schreiber et al. 1986 as formulated by van Kooten and Snel, 1990)
0FF
FFq
M
MP
Light. If F0’ calculated, Dark and
Light
[0, 1] [0, 1]
Coefficient of photochemical fluo-rescence quenching assuming in-terconnected PS II antennae (Kramer et al. 2004)
F
Fqq PL
0
As qP’. [0, 1] [0, 1]
Coefficient of non-photochemical fluorescence quenching (Schreiber et al. 1986 as formu-lated by van Kooten and Snel, 1990)
0
01FF
FFq
M
MN
Dark and
Light [0, 1]
[0, ~0.95]
* Kramer et al. (2004) have derived more complex equations for Y(NO) and Y(NPQ). Klughammer and Schreiber (2008) have demonstrated that the equations by Kramer et al. (2004) can be transformed into the simple equations of (Genty et al. 1996) which are used by the MINI-PAM-II and WinControl-3.

Saturation Pulse Analysis
35
Table 6: References Cited in Table 5
- Bilger W, Björkman O (1990) Role of the xanthophyll cycle in photoprotection
elucidated by measurements of light-induced absorbance changes, fluorescence
and photosynthesis in leaves of Hedera canariensis. Photosynth Res 25:173-185
- Genty B, Briantais J-M, Baker NR (1989) The relationship between the quantum
yield of photosynthetic electron transport and quenching of chlorophyll fluores-
cence. Biochim Biophys Acta 990: 87–92
- Genty B, Harbinson J, Cailly AL and Rizza F (1996) Fate of excitation at PS II in
leaves: the non-photochemical side. Presented at: The Third BBSRC Robert Hill
Symposium on Photosynthesis, March 31 to April 3, 1996, University of Sheffield,
Department of Molecular Biology and Biotechnology, Western Bank, Sheffield,
UK, Abstract P28
- Kitajima M, Butler WL (1975) Quenching of chlorophyll fluorescence and primary
photochemistry in chloroplasts by dibromothymoquinone. Biochim Biophys Acta
376:105-115
- Klughammer C and Schreiber U (2008) Complementary PS II quantum yields
calculated from simple fluorescence parameters measured by PAM fluorometry
and the Saturation Pulse method. PAM Application Notes 1: 27-35
(http://www.walz.com/e_journal/pdfs/PAN078007.pdf)
- Kramer DM, Johnson G., Kiirats O, Edwards GE (2004) New flux parameters for
the determination of QA redox state and excitation fluxes. Photosynth Res 79:
209-218
- Oxborough K, Baker NR (1997) Resolving chlorophyll a fluorescence images of
pho-tosynthetic efficiency into photochemical and non-photochemical compo-
nents - calculation of qP and Fv'/Fm' without measuring Fo'. Photosynth Res 54
135-142
- Schreiber U, Schliwa U, Bilger W (1986) Continuous recording of photochemical
and non-photochemical chlorophyll fluorescence quenching with a new type of
modulation fluorometer. Photosynth Res 10: 51–62
- van Kooten O, Snel J (1990) The use of chlorophyll fluorescence nomenclature
in plant stress physiology. Photosynth Res 25: 147–150

Guarantee
36
6 Guarantee
6.1 Manufacturer’s Guarantee
Under this Manufacturer’s Guarantee (“Guarantee”), subject to the
Conditions and Instructions below, Heinz Walz GmbH, Germany
(“Manufacturer”), guarantees (§443 BGB) to the end customer and
user (“Customer”) that all products supplied by it shall substantially
conform in material respects to the Specifications for 24 months
from the delivery date (date on invoice). In this Guarantee, “Spec-
ifications” means the product’s features (as may be amended by
Manufacturer from time to time), which are set out under the head-
ings “specifications” and/or “technical specifications” within the
product’s respective brochure, data sheet, or respective tab on the
Manufacturer’s website for such product, and which may be in-
cluded with the documents for the product when delivered. In case
of an eligible guarantee claim, this Guarantee entitles the Cus-
tomer to repair or replacement, at the Manufacturer’s option, and
this Guarantee does not include any other rights or remedies.
6.2 Conditions
This Guarantee shall not apply to:
Any defects or damage directly or indirectly caused by or
resulting from the use of unauthorized replacement parts
and/or service performed by unauthorized personnel.
Any product supplied by the Heinz Walz GmbH, Germany
which has been subjected to misuse, abuse, abnormal
use, negligence, alteration or accident.
Damage caused from improper packaging during shipment
or any acts of God.
Batteries, cables, calibrations, fiberoptics, fuses, gas fil-
ters, lamps, thermocouples, and underwater cables.

Guarantee
37
Defects that could reasonably have been detected upon
inspection of the product when received by the Customer
and not promptly noticed within ten (10) days to Heinz
Walz GmbH.
Submersible parts of the DIVING-PAM or the underwater
version of the MONITORING-PAM have been tested to be
watertight down to the maximum operating depth indicated
in the respective manual. Guarantee shall not apply for div-
ing depths exceeding the maximum operating depth. Fur-
ther, guarantee shall not apply for damage resulting from
improper operation of devices, in particular, the failure to
properly seal ports or sockets.
6.3 Instructions
To obtain warranty service, please follow the instructions
below:
The Walz Service Information Form available at
http://www.walz.com/support/repair_service.html must be
completed and returned to Heinz Walz GmbH, Germany.
The product must be returned to Heinz Walz GmbH, Ger-
many, within 30 days after Heinz Walz GmbH, Germany
has received written notice of the defect. Postage, insur-
ance, and/or shipping costs incurred in returning equip-
ment for guarantee service are at customer expense. Duty
and taxes are covered by Walz.
All products being returned for guarantee service must be
carefully packed and sent freight prepaid.
Heinz Walz GmbH, Germany is not responsible or liable
for missing components or damage to the unit caused by
handling during shipping. All claims or damage should be
directed to the shipping carrier.

Guarantee
38
6.4 Applicable law
This Guarantee is governed by German law. Place of jurisdiction
is Bamberg, Germany.

Specifications
39
7 Specifications
7.1 ONLINE Configuration
7.1.1 Measuring Head MICRO-HEAD/3B
GENERAL DESIGN
Housing: Polymer housing with optical block and fiber connector
on one side, and a combined power line/RS485 socket on the
opposite side
MICRO HEAD/BK Leaf Clip: Consisting of 2 aluminum frames
(3.5 x 2.5 cm), held together by magnet, 0.4 cm distance be-
tween sample plane of leaf clip and lightguide, angle between
sample plane and optical light guide: 60°
Cables: RS 485 data/power cable, 10 m standard length, con-
necting MICRO-HEAD/3B and MONI-IB4/LAN PC Interface Box.
RS 485 adapter cable, 0.6 m long, to connect MICRO-HEAD/3B
to optional PC Interface Box MONI IB4/LAN or to optional MONI
DA system for data acquisition
Flexible stand: Baseplate of acrylic glass 10 x 10 x 0.5 cm (L x
W x H); flexible goose neck consisting of 20 links, 1.7 cm maxi-
mum diameter, 30 cm length, one end with metal thread
equipped with 1 butterfly nut, 1 nut and 2 washers. Weight 114 g
Dimensions: Complete head with leaf clip, 13.5 x 3.5 x 4 cm (L
x W x H)
Power consumption: Peak loads during saturating pulses 3 W.
During measuring mode 0.15 W
Operating temperature: -15 to +40 °C
Weight: 96 g

Specifications
40
LIGHT EMISSION
Modulated fluorescence excitation: Blue power LED (typical
peak wavelength 470 nm, full width at half maximum 22 nm).
Photosynthetically active radiation (PAR) of measuring light at
level of the sample clip range from 0.15 to 1.5 μmol m-2 s-1 at low
modulation frequencies (5 to 25 Hz), and from 1.5 to 22.5
μmol m-2 s-1 at high modulation frequencies (100 Hz)
Actinic light: Same power LED as for modulated light. At sam-
ple level of leaf clip, 3000 μmol m-2 s -1span> maximum PAR of
actinic light, 8000 μmol m-2 s-1 maximum PAR of saturating
flashes
SENSORS
Fluorescence: PIN-photodiode protected by longpass filter (50%
transmittance at 645 nm). Selective window amplifier to measure
pulse amplitude modulated (PAM) fluorescence
Photosynthetically active radiation (PAR): External LS-C sen-
sor for selective PAR measurement, range 0 to 7000
μmol m-2 s-1, cosine-corrected for light incident at angles between
-30° to +30° from the surface normal
Temperature: Thermocouple: Ni-CrNi, wire diameter 0.1 mm, -
20 to +60 °C
Humidity: Capacitive-type humidity sensor on a specialized ana-
log and digital integrated circuit, 0 - 100% relative humidity
7.1.2 PC Interface Box MONI-IB4/LAN
Housing: Aluminum case with RS-232, USB-B, Ethernet, power
supply sockets, and four M12 5-pole sockets for RS-485 commu-
nication

Specifications
41
Interfacing: The interface box connects a computer with up to
four MICRO HEAD/3B (or one MONI-DA). RS-485 serial data
communication is used between interface box and MICRO
HEAD/3B or MONI-DA. RS232, USB or Ethernet communication
is used between interface box and computer
Recommended maximum cable lengths: To computer via
USB and RS-232: 2 m. To computer via Ethernet, 100 m. To MI-
CRO HEAD/3B MONI-HEAD/485via RS-485: 10 m. To MONI-DA
via RS-485, 100 m
Dimensions: 12 x 9.3 x 3 cm (L x W x H)
Weight: 400 g
Operating Power supply: Input: 100 to 240 V AC, 50 to 60 Hz.
Output: 19 V DC, 3.7 A. Dimensions: 13.2 x 5.8 x 3 cm (L x W x
H). Weight: 310 g. Temperature: 0 to +40 °C
7.2 STAND-ALONE Configuration
7.2.1 Measuring Head MICRO-HEAD/3B
As described for ONLINE configuration
7.2.2 Data Acquisition MONI-DA
Housing: Robust water-proof cylinder consisting of a polyvinyl
chloride (PVC) tube and poly-oxymethylene (POM) endplates.
One endplate with 2 male M12 5-pole sockets connected in par-
allel (MONI-IB4/LAN communication, charging voltage), one
male M12 5-pole socket for auxiliaries, and 7 female M12 5-pole
sockets (MONI-HEAD/485 communication)
Dimensions: Cylinder with diameter of 16 cm and length of 24
cm

Specifications
42
Data management: Dual data storage on internal 8 MByte circu-
lar flash buffer and an industrial grade 512 MByte removable mi-
croSD flash card. Wireless data transfer via cellular phone or sat-
ellite modem. Online data transfer using RS-485 serial data com-
munication.
Power consumption: 5 mW in standby mode. Operating mode,
depends on the number of MONIHEAD/485 connected (see
MONI-HEAD/485 power consumption)
Battery: 12 V / 7.5 Ah (96 Wh) LiFePO4 battery.
Operating temperature: -30 to +60 °C
Weight: 5.4 kg
7.2.3 Transport Box
Design: Aluminum box with custom foam packing for MONITOR-
ING-PAM including MONI-DA
Dimensions: 80 cm x 40 cm x 34 cm (L x W x H); 60 liter
Weight: 4.9 kg
7.2.4 PC Interface Box MONI-IB1
Housing: Aluminum case with USB-B socket, power supply
socket, and M12 5-pole socket for RS-485 communication
Links: The interface box connects a computer with a MONI-DA
using RS-485 serial data communication. The same line is used
to charge the MONI-DA battery. USB communication is used be-
tween interface box and computer
Recommended maximum cable lengths: To computer via
USB: 2 m. To MONI-DA via RS-485,
100 m

Specifications
43
Dimensions: 9.7 x 6.3 x 3.5 cm (L x W x H)
Weight: 270 g
Operating temperature: 0 to +40 °C
7.2.5 Solar Panel MONI-SP
Design: Polycrystalline silicon panel. Highly resistant to water,
abrasion, hail impact and other severe weather conditions.
Equipped with a 4 m cable and plug for the AUX or INPUT
socket of the Data Acquisition System MONI-DA. Several panels
can be connected in parallel to provide sufficient power under
conditions of low insolation
Electrical characteristics: Vmax, 15.0 V, Imax, 0.63 A (at 1000
W/m2 sunlight). VOC, 19.6 V. ISC, 0.80 A
Dimensions: 50 x 35 cm (L x W)
Weight: 1.2 kg (incl. cable and plug)
7.2.6 Fluorometer Software/Computer Minimum Requirements
As described for ONLINE configuration
7.3 Accessories for STAND-ALONE Configura-
tion
7.3.1 Four-Way Distributor MICRO-HUB
Housing: Aluminum case with one M12 5-pole connector and
four M8 5-pole connectors
Links: The interface box connects up to four MICRO-HEAD/3B
Measuring Heads to one single MONI-BUS port of a MONI-DA
data acquisition system

Specifications
44
Recommended maximum cable lengths: 10 m between MI-
CRO-HEAD/3B and MICRO-HUB, and between MICRO-HUB
and MONI-DA
Dimensions: 10 x 6 x 3.5 cm (L x W x H)
Weight: 228 g
Operating temperature: -30 to +40 °C
7.3.2 PC Interface USB-0
Housing: Plastic block with one USB-B line and one line for RS-
485 communication firmly attached
Interfacing: The interface cable connects a USB port of a com-
puter with the input socket of the MONI-DA.
Cable lengths: USB: 0.9 m. RS-485, 2 m
Dimensions of block: 4.5 x 3.0 x 1.5 cm (L x W x H)
Weight including cables: 145 g
Operating temperature: 0 to +40 °C
7.3.3 Satellite Modem
Specification depend on available devices at the time of order
Subject to change without prior notice

MICRO-PAM Systems
45
8 Index
Actinic + Yield ...................................... 27
Actinic Light ......................................... 26
Chart Commands ................................ 15
Chart Window ...................................... 14
Clock ................................................... 26
Comments ........................................... 11
Contents ................................................ 1
Damping .............................................. 25
Data Error ............................................ 11
EK ........................................................ 21
Electron Transport Rate ...................... 32
Equation Light Curve ........................... 21
Equations ............................................ 34
ETR ..................................................... 32
ETRm ................................................... 21
Export All ............................................. 17
F0 Adjustment ........................................ 6
Figures
01 Online Configuration .................... 7
02 Stand-alone Configuration ........... 9
03 MONI-DA ................................... 10
04 Measuring Head .......................... 5
05 Emission Spectrum ..................... 6
06 Chart Window ............................ 15
07 Moni-Bus Window ..................... 18
08 SAT Chart Window .................... 19
09 Saturation Pulse Kinetics .......... 20
10 Light Curve Window .................. 21
11 Settings Window ........................ 24
12 Fluorescence levels ................... 28
FIRMWARE ......................................... 13
Float ................................................... 16
Fluorescence Levels .......................... 28
Fluorescence Ratio Parameters ........ 34
Fm Definition ...................................... 29
Fm’ Definition ..................................... 30
Fo Definition ....................................... 29
Fo’
Calculation .................................... 30
Definition ....................................... 29
Measurement ................................ 29
F-Offset .............................................. 25
Fv/Fm Definition ................................. 30
Gain ................................................... 25
General Description ............................. 3
Guarantee .......................................... 36
Humidity Sensor ................................... 4
Indicator LED ....................................... 5
Induction Curve .................................. 27
Light Curve ................................... 21, 27
Light Curve Theory ............................ 21
Light Curve Window ........................... 20
Measuring Head ................................... 4
Measuring Light ................................. 25
Measuring Light Frequencies ............. 25
MICRO-HEAD/3B .............................. 39
MICRO-HEAD/3B ................................ 4
MICRO-HUB ...................................... 43
MICRO-PAM System ........................... 4
Moni Bus Window .............................. 17
MONI-DA ................................. 3, 10, 41
MONI-IB1 ........................................... 42

Index
46
MONI-IB4/LAN ............................ 7, 8, 40
MONI-SP ............................................ 43
Non-photochemical Quenching .......... 31
NPQ Definition .................................... 31
Online Configuration ....................... 7, 39
Print .................................................... 15
qL Definition ........................................ 31
qN Definition ....................................... 31
qP Definition ....................................... 31
Rapid Light Curve ............................... 21
Record Online ..................................... 16
References
Fluorescence Ratio Parameters .... 35
Saturation Pulse Analysis .............. 35
REG1 ............................................ 22, 23
Safety Instructions
General ............................................ 1
Special ............................................. 1
Sampling Frequency ........................... 16
SAT Chart Window ............................. 19
SAT Pulse ........................................... 20
SAT-Pulse .......................................... 26
Saturation Pulse Analysis ............. 28, 34
Saturation Pulse Kinetics .................... 20
Save ................................................... 15
Settings
Actinic + Yield ................................ 27
Actinic Light ................................... 26
Clock .............................................. 26
Damping ........................................ 25
F-Offset .......................................... 25
Gain ............................................. 25
Induction Curve ............................ 27
Light Curve ................................... 27
Measuring Light ........................... 25
SAT-Pulse .................................... 26
Settings Window ................................ 24
Signal Drop ........................................ 11
Signal Error ........................................ 11
Signal LED ........................................... 5
Solar Panel ........................................ 43
Specifications ..................................... 39
Stand-alone Configuration ................... 8
Tables
01 F0 Adjustment ............................ 6
02 WinControl-3-Start Menu ........ 13
03 Chart Commands .................... 15
04 Measuring Light Frequencies .. 25
05 Parameters ............................. 34
06 References .............................. 35
Temperature Sensor ............................ 5
Trouble Shooting ................................ 11
USB Driver ......................................... 12
WinControl-3
Installation .................................... 12
Start Menu ................................... 14
Y(II) Definition .................................... 30
Y(NO) Definition ................................. 32
Y(NPQ) Definition .............................. 32
α ......................................................... 21