![IEEE TRANSACTIONS ON ULTRASONICS, FERROELECTRICS, AND … · 2020. 6. 23. · with the Shannon–Nyquist theorem [9]. Four times sampling, however, can lead to substantial amounts](https://static.fdocuments.net/doc/165x107/610a4f91319f09736547d7bd/ieee-transactions-on-ultrasonics-ferroelectrics-and-2020-6-23-with-the-shannonanyquist.jpg)
DATA ACQUISITION AND NYQUIST SAMPLING THEOREM · 1 DATA ACQUISITION AND NYQUIST SAMPLING THEOREM ME...
16
1 DATA ACQUISITION AND NYQUIST SAMPLING THEOREM ME 4231 Rajesh Rajamani Department of Mechanical Engineering University of Minnesota PC Based Control System Loop { Read voltages from sensors Compute voltage to be sent to actuator Send voltage to actuator }
-
Upload
truongliem -
Category
Documents
-
view
219 -
download
0
Transcript of DATA ACQUISITION AND NYQUIST SAMPLING THEOREM · 1 DATA ACQUISITION AND NYQUIST SAMPLING THEOREM ME...

1
DATA ACQUISITION AND NYQUIST SAMPLING THEOREM
ME 4231 Rajesh Rajamani
Department of Mechanical Engineering University of Minnesota
PC Based Control System
Loop
{
Read voltages from sensors
Compute voltage to be sent to actuator
Send voltage to actuator
}

2
PC Based Control System
Example: Automotive Cruise Control
Loop
{
Read voltages from wheel speed sensors, determine speed of vehicle
Compute difference between desired speed and actual speed
}
PC Based Control System
Example: Automotive Cruise Control
Loop
{
Compute whether throttle angle should be increased or decreased and by how
much
Compute voltage to be sent to throttle actuator
Send voltage to throttle actuator
}

3
DATA ACQUISITION CARD
Common Tasks
Read voltages
a2d (analog to digital conversion)
digital inputs
The signal from a sensor can be analog or digital
Send out voltages
d2a (digital to analog conversion)
digital outputs
The voltage to be sent to an actuator can be analog or digital
DATA ACQUISITION
Weighted-resistor D2A (digital 2 analog conversion)
+
MSB
LSB
Electronic
switches
R/8
R/4
R/2
R
V ref
Summing
Amplifier

4
DATA ACQUISTION
Analog-to-digital conversion
Analog to digital
conversion Sample
and hold
Analog
signal
Digital
signal
DIGITIZATION
Two types of digitization
Digitization in time, called “sampling” Depends on speed and complexity of real-time program
Depends on speed of data acquisition card
Digitization in value Depends on resolution of data acquisition card
(12 bit, 16 bit, etc)

5
DIGITIZATION
Digitization in time (“sampling”)
0 1 2 3 4 5 6 7 8 9 10-1
-0.8
-0.6
-0.4
-0.2
0
0.2
0.4
0.6
0.8
1
T
Sampling time
DIGITIZATION
Digitization in value
0 1 2 3 4 5 6 7 8 9 10-1
-0.8
-0.6
-0.4
-0.2
0
0.2
0.4
0.6
0.8
1
Depends on resolution of data acquisition system

6
DATA ACQUISITION
Successive Approximation A2D
Analog input Comparator
Gate
Clock
1 0 1 0
D2A
Counter
DATA ACQUISITION
Data acquisition card from Sensoray in lab
Model 626 PCI Multi-function I/O board
16 differential analog inputs (16-bit)
4 analog outputs (14-bit)
48 digital I/O channels
6 24 bit up/down counters

7
SAMPLING THEOREM
The sampling theorem states that for a limited bandwidth (band-
limited) signal with maximum frequency fmax, the equally spaced
sampling frequency fs must be greater than twice of the maximum
frequency fmax, i.e.,
fs > 2·fmax
in order to have the signal be uniquely reconstructed without
aliasing.
The frequency 2·fmax is called the Nyquist sampling rate.
Sampling theorem articulated by Nyquist in 1928
Mathematically proved by Shannon in 1949.
Some books use the term "Nyquist Sampling Theorem", and
others use "Shannon Sampling Theorem".
Under Sampling
When the sampling rate is lower than or equal to the
Nyquist rate, a condition defined as under sampling, it
is impossible to rebuild the original signal according to
the sampling theorem.

8
ALIASING
Suppose we are sampling a sine wave. How often do we need to
sample it to figure out its frequency?
ALIASING
If we sample at 1 time per cycle, we can think it's a constant
9
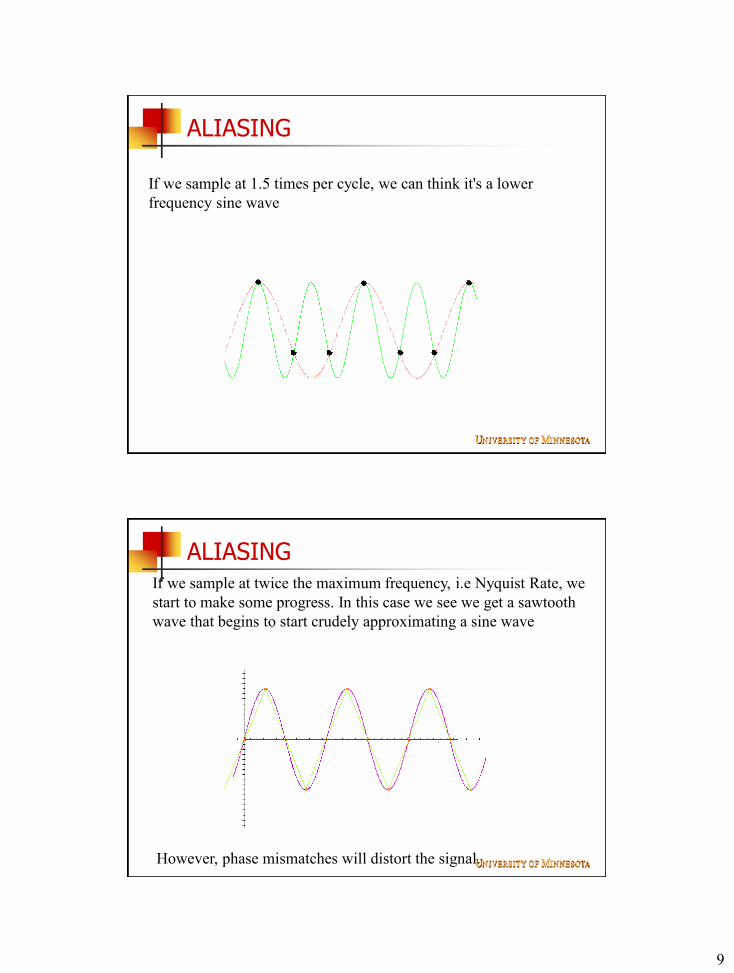
ALIASING
If we sample at 1.5 times per cycle, we can think it's a lower
frequency sine wave
ALIASING If we sample at twice the maximum frequency, i.e Nyquist Rate, we
start to make some progress. In this case we see we get a sawtooth
wave that begins to start crudely approximating a sine wave
However, phase mismatches will distort the signal.

10
ALIASING Sampling at many times per cycle
For loss-less digitization, the sampling rate should be at least twice
the maximum frequency responses. Indeed many times more the
better.
ALIASING

11
ANTI-ALIAS FILTERS
Therefore, an analog filter is typically applied before sampling to
ensure that signal components with frequencies greater than half the
sample frequency are highly reduced. This is called an anti-aliasing
filter.
The quality of analog-to-digital-converters (A/D-Converters)
depends critically upon that filter, since a poor filter causes phase
distortion and other difficulties.
ANTI-ALIAS FILTERS
Demonstration of the effects of aliasing using a real world music signal
Frequency components in music signal

12
ANTI-ALIAS FILTERS
Original audio signal sampled at 44kHz (CD quality audio)
Same audio signal sampled at 4 kHz
ANTI-ALIAS FILTERS
Audio signal sampled at 4 kHz
The sampling frequency is again at 4 kHZ, but the audio signal is first processed with an anti-aliasing filter.

13
A2D Conversion
. . . 12 npossible combinations,
other than zero n bit binary number
1 0 0 1
1 0 3 possible combinations - 3 non-zero numbers can be represented
e.g.
. . . 1 0 0 1
sign bit
n bit binary number
12 1 n positive numbers 12 n
negative numbers can be represented
A2D Conversion
For a 16-bit a2d, set to operate between -10 to 10 V,
what voltages do 15,000 and 15,001 correspond to ?
Hence numbers from -32768 to 32767 can be represented
3276712 1 n
15,000: VVV
V5778.410 x
767,32
000,15
767,32
000,15
max
15,001: VVV
V5781.410 x
767,32
001,15
767,32
001,15
max
Vz
V 10 x 767,32
z : 0for zV
zV 10
768,32 x 0z for

14
D2A Conversion
For a 14-bit d2a, set to operate between -10 to 10 V,
what voltages do 4,000 and 4,001 correspond to ?
Hence numbers from -8192 to 8191 can be represented
819112 1 n
4,000: VVV
V8834.410 x
191,8
000,4
191,8
000,4
max
4,001: VVV
V8846.410 x
191,8
001,4
191,8
001,4
max
Vz
V 10 x 191,8
z : 0for z0z forV
zV 10
192,8 x
PC Based Control System
Loop
{
Read voltages from sensors
Compute voltage to be sent to actuator
Send voltage to actuator
Wait until sampling time has been reached
}

15
Lab 3
Task 1
Demonstration of the A2D Converter
Set the power supply to different voltages
Check and see if your a2d program can read those voltages correctly
Change the voltage range settings in your program and repeat
Lab 3
Task 2
Demonstration of the D2A Converter
Send out different voltages from channel 0 by writing a program that takes a user input from the screen
The user enters an integer number, e.g. 6000
Check the output voltage on a multimeter to see if your program works correctly

16
Lab 3
Task 3
Demonstration of Aliasing with the A2D Converter
Set the sampling frequency to be 1000 Hz
Change input signal frequency on the function generator to vary from 50Hz to 1500 Hz according to the given table
For each input frequency write down the estimated frequency of the output signal from the oscilloscope.


