
Darwin Analytics at CommaGroup
25
Darwin Analytics To be the smartest marketer in the room.
-
Upload
darwin-analytics -
Category
Data & Analytics
-
view
51 -
download
1
Transcript of Darwin Analytics at CommaGroup

Darwin AnalyticsTo be the smartest marketer in the room.
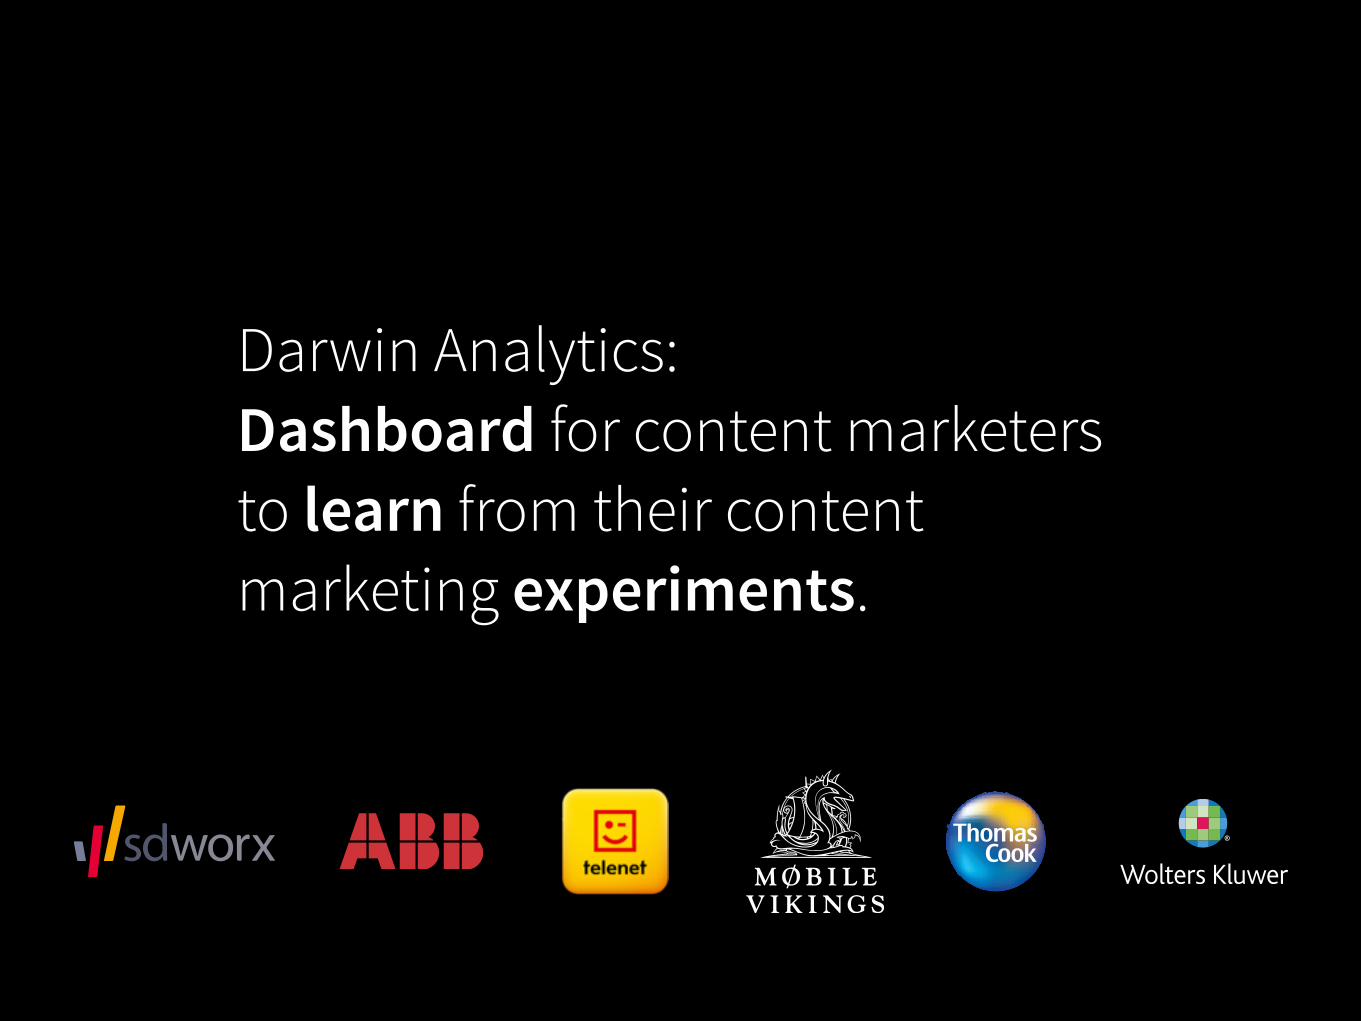
Darwin Analytics: Dashboard for content marketers to learn from their content marketing experiments.


Ten years ago…


Today…

Marketing is more complicated than ever before.

• From 1 to 5 channels. Websites, blogs, a mailinglist, social media.There’s not a channel you can afford not to use.
• From 1 to 20 content pieces a week. Every channel has it’s own pace. But you can’t be on Twitter without a daily tweet. Or have a blog without posting three items a week.
• From 2 to 80 important metrics.Every piece of content you publish has on average 4 important metrics attached to it. How many people saw, liked, shared, commented on your content? It all matters.
MORE COMPLICATED THAN EVER.

Marketing is changing faster than ever before.

• A new channel every six months. Who heard about snapchat a year ago? And when did Pinterest suddenly pop up? Maybe we should try YO, our target audience seems to use it.
• Channels changing constantly. Google updates the search algorithm. Twitter decides to turn favorites into retweets. Facebook changes edgerank. All the while, you need to keep up.
• No-one can teach you.The SEO guru you spoke last week, learned you some things that aren’t applicable anymore. The Facebook manual you read yesterday is already outdated.
CHANGING FASTER THAN EVER.

How can you win?

How can you become the smartest marketer in the room?

Every piece of content is an experiment.

Write
Measure
Learn

1/3 !
Organize all your content efforts.

2/3 !
Score all your content efforts.

3/3 !
Learn from your experiments.

• Organize all your content efforts. Bring all your content marketing efforts together in one place. Organize them in topics, campaigns, content types.
• Score all your content efforts. Determine what a successful piece of content looks like. Which metrics prove success? Score all your content efforts accordingly.
• Learn from your experiments. Because you perform huge amounts of organized experiments, you can actually learn from them. Which topics work for a specific campaign? Which content types perform better for a certain topic?
HOW TO BE THE SMARTEST MARKETER IN THE ROOM

Write
Measure
Learn


Pssst…

Thank you