Effets secondaires des ARV Cours IMEA Roland Landman Cours IMEA Roland Landman.
Upload
yoshio-zamoraCategory
view
74download
5description
Exploring The Relationship Between Urban Morphology And
Resilience In A Few Neighbourhoods In
Pretoria
Darren Nel & Karina Landman University of Pretoria
Contents
• Introduction
• Resilience and urban form• Comparison of four neighbourhoods • The evolution of the suburban tree• Conclusion
2
Introduction
• Recent studies in urban planning highlighted importance of urban resilience
• Of these – few starting to show relevance of urban morphology for resilience– Attributes & indicators– Also linked to typical structure: tree or leaf– Paving way for new ways to study urban
phenomena
3
Urban Resilience
• Amount of change system can experience without collapse or total transformation
• Specific sub-systems more vulnerable to such changes due to disturbances–Maybe because it is still recovering from
disturbances or shocks• Important to understand pattern of
disturbances and ability of urban system to deal with these to strengthen resilience
4

Resilience and urban form
• “Urban resilience can be understood as the robustness of urban structures and networks against random failures” (Salat 2012)
• Failures: small scale (disruption in local transport networks or energy supply) or large scale
• Influenced by urban form
5

Lattice (tree) or semi-lattice
• Alexander (1965): Cities may reflect lattice (no overlaps) or semi-lattice (overlaps)
City should not be a tree
– Need to allow
for social & spatial
overlaps
6
Tree or a leaf
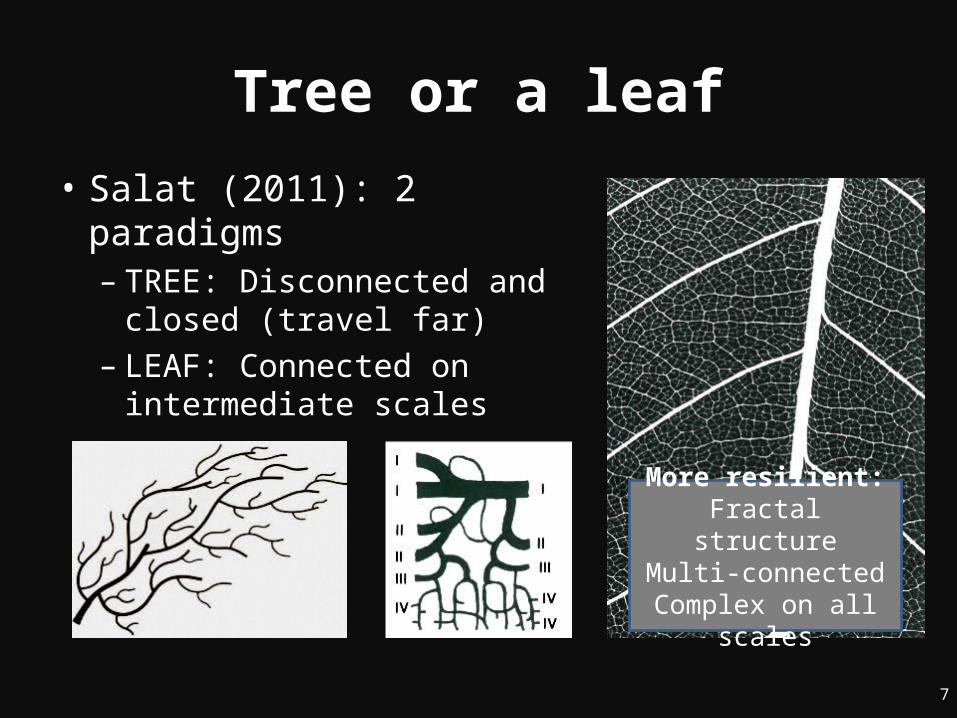
• Salat (2011): 2 paradigms– TREE: Disconnected and
closed (travel far)– LEAF: Connected on
intermediate scales
More resilient: Fractal structureMulti-connected
Complex on all scales
7
Resilience and urban form
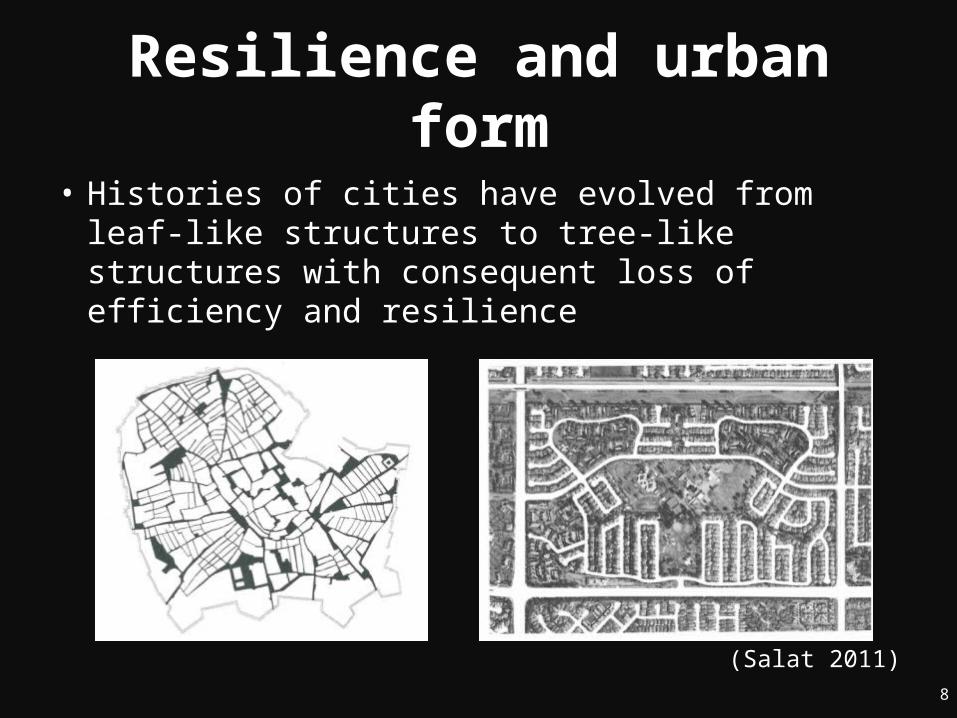
• Histories of cities have evolved from leaf-like structures to tree-like structures with consequent loss of efficiency and resilience
(Salat 2011)8
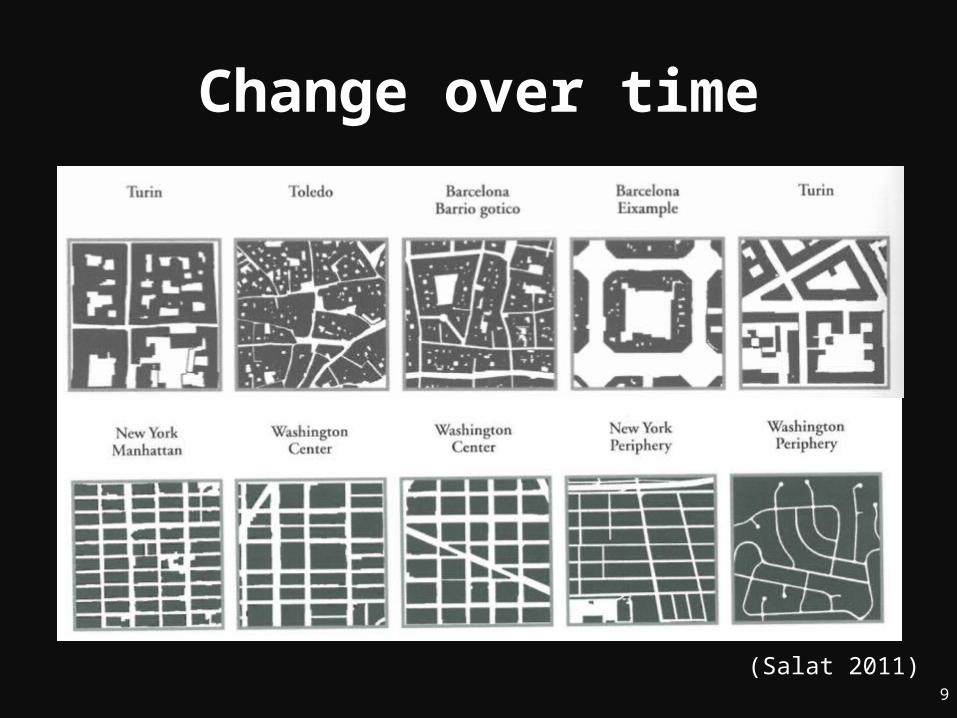
Change over time
(Salat 2011)9
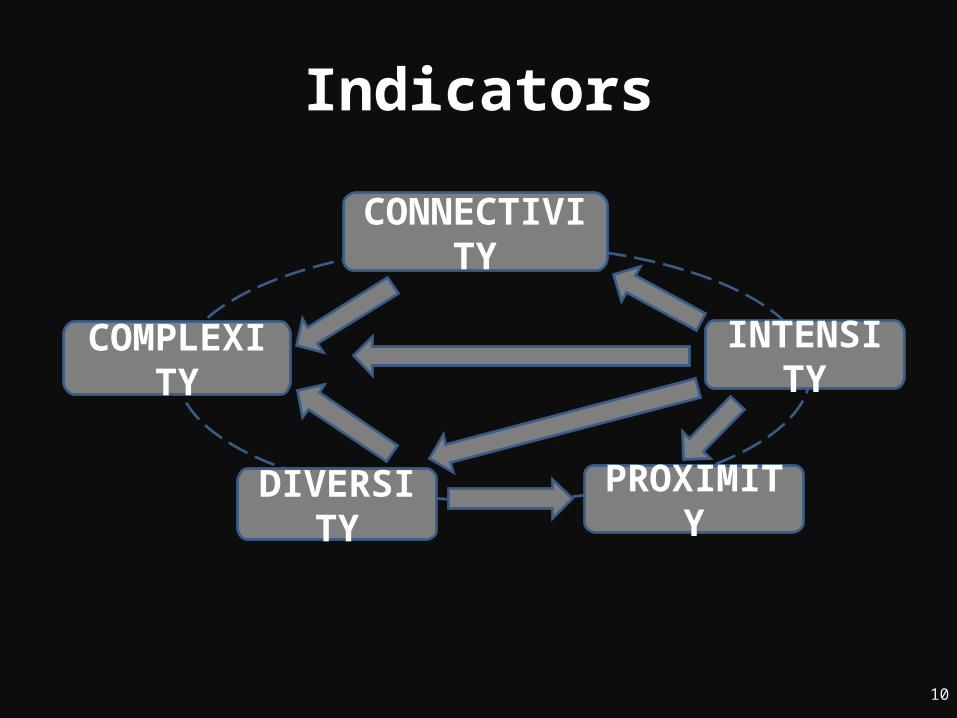
Indicators
COMPLEXITY INTENSITY
DIVERSITY PROXIMITY
CONNECTIVITY
10

Complexity
• Quality environments: complex, diverse & with overlap
• Due to incremental change and adaptation over time
• Essential for resilient city: – Rich urban fabric through
multiple points of contact, engage & interface
– Link to connectivity & diversity(Salat 2011)
11
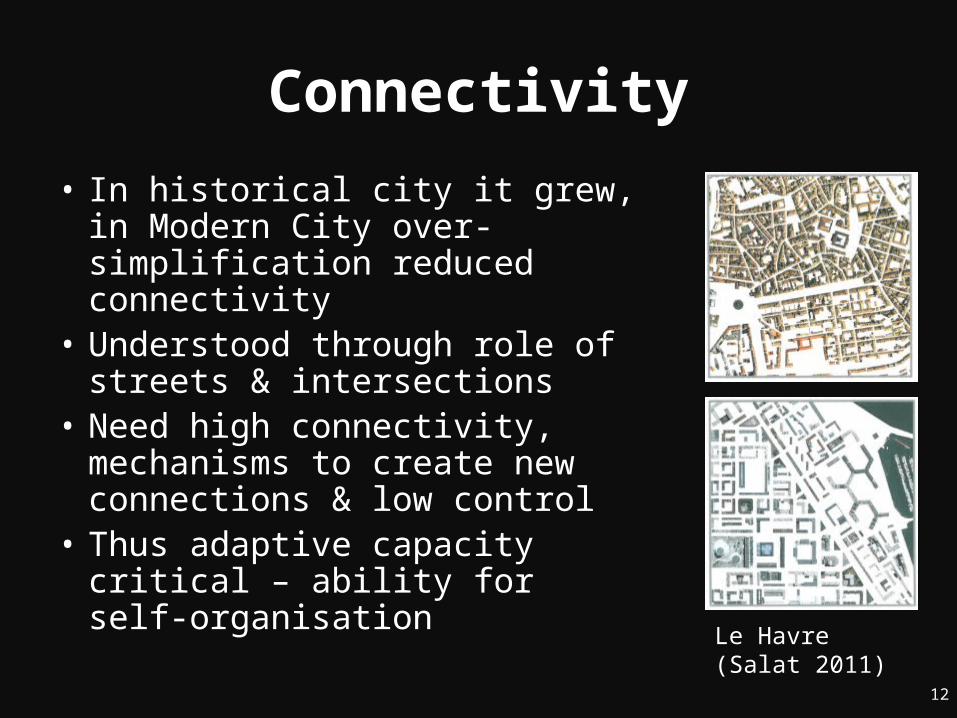
Connectivity
• In historical city it grew, in Modern City over-simplification reduced connectivity
• Understood through role of streets & intersections
• Need high connectivity, mechanisms to create new connections & low control
• Thus adaptive capacity critical – ability for self-organisation
Le Havre (Salat 2011)
12

Diversity
• Complexity & adaptive capacity enhanced through diversity
• Among similar objects at same scale– E.g. population groups, income groups,
housing units• Or objects at different scales– E.g. metropolitan facilities or landmarks in
selective areas• Increased diversity also allows for
greater redundancy and thus ability to cope with disturbances
13
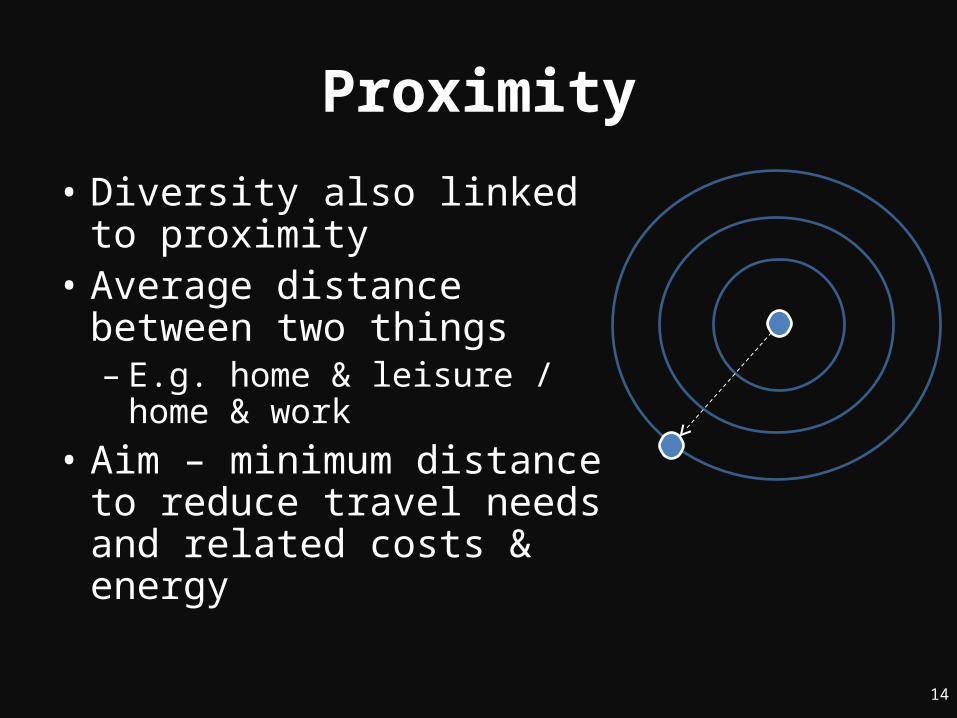
Proximity
• Diversity also linked to proximity
• Average distance between two things– E.g. home & leisure /
home & work• Aim – minimum
distance to reduce travel needs and related costs & energy
14
Intensity (density)
• Biggest opportunity for generation of urban opportunity through intense interactions & high levels of population support
• Link to complexity & diversity• Concentration of object in given area• -E.g. people or housing
15
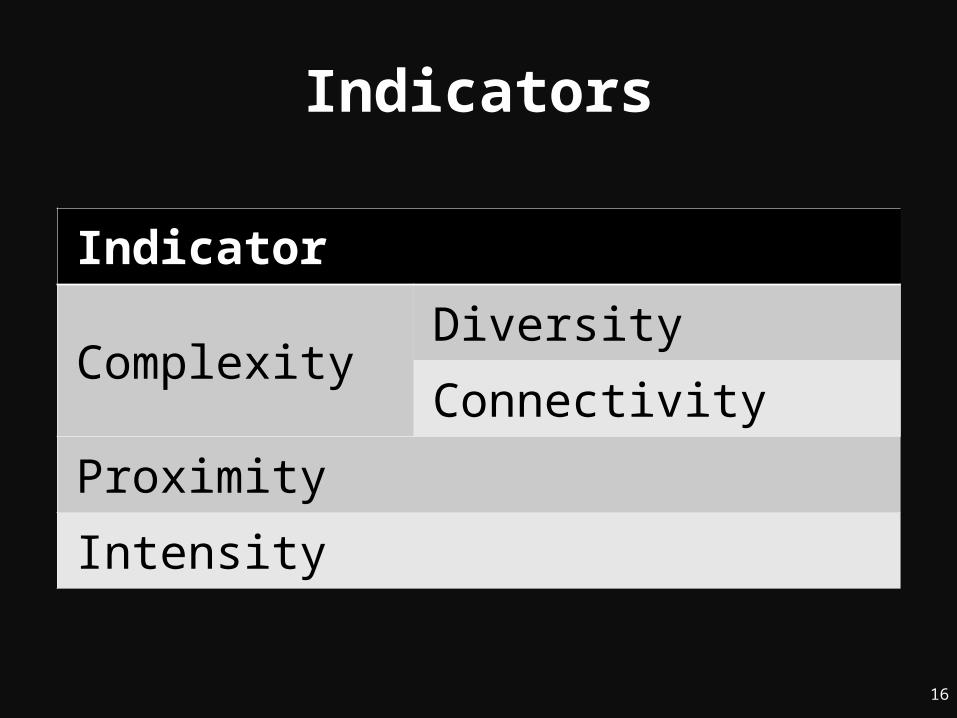
Indicators
Indicator
ComplexityDiversity
Connectivity
Proximity
Intensity
16
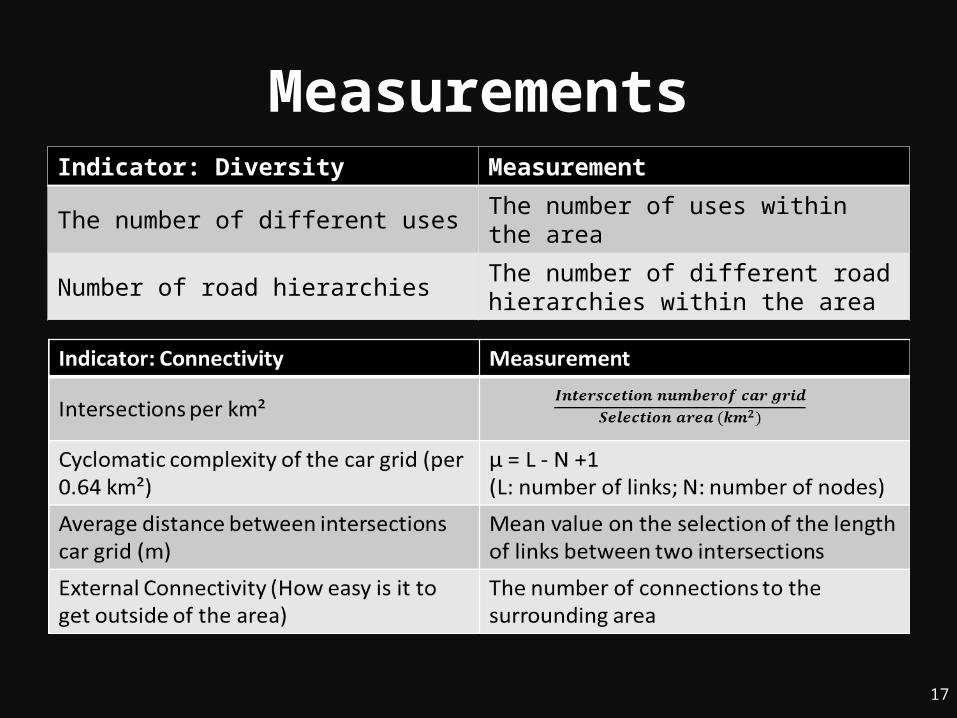
MeasurementsIndicator: Diversity Measurement
The number of different uses The number of uses within the area
Number of road hierarchies The number of different road hierarchies within the area
17
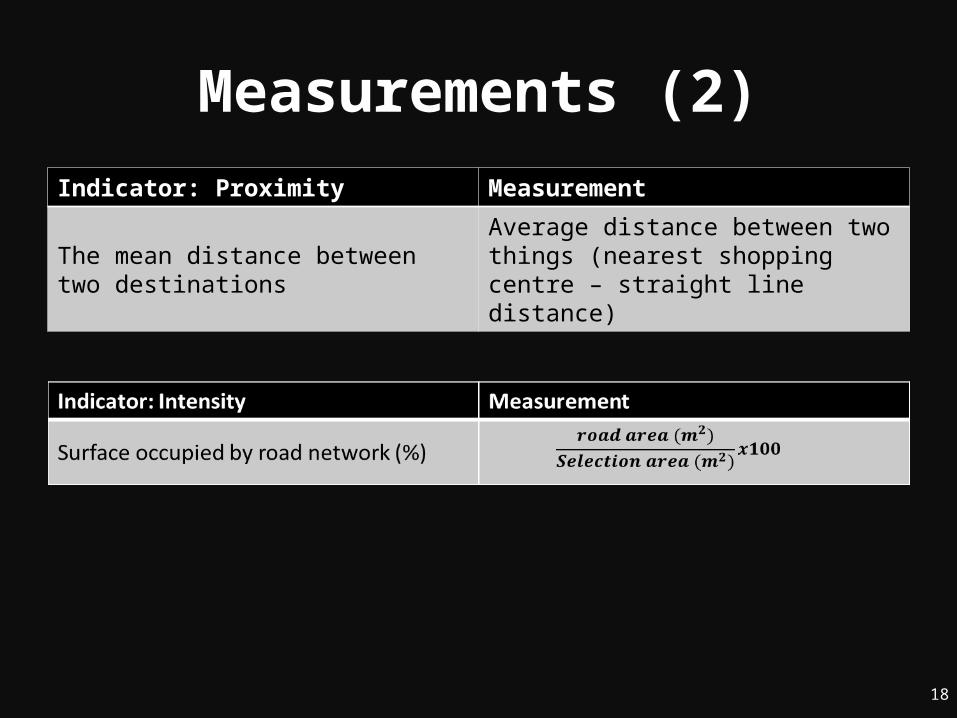
Measurements (2)Indicator: Proximity Measurement
The mean distance between two destinations
Average distance between two things (nearest shopping centre – straight line distance)
18

• Connectivity– Nodes
(Intersections)– Connections– Distance between
intersections – Cyclomatic
complexity
Measurements (3)
19
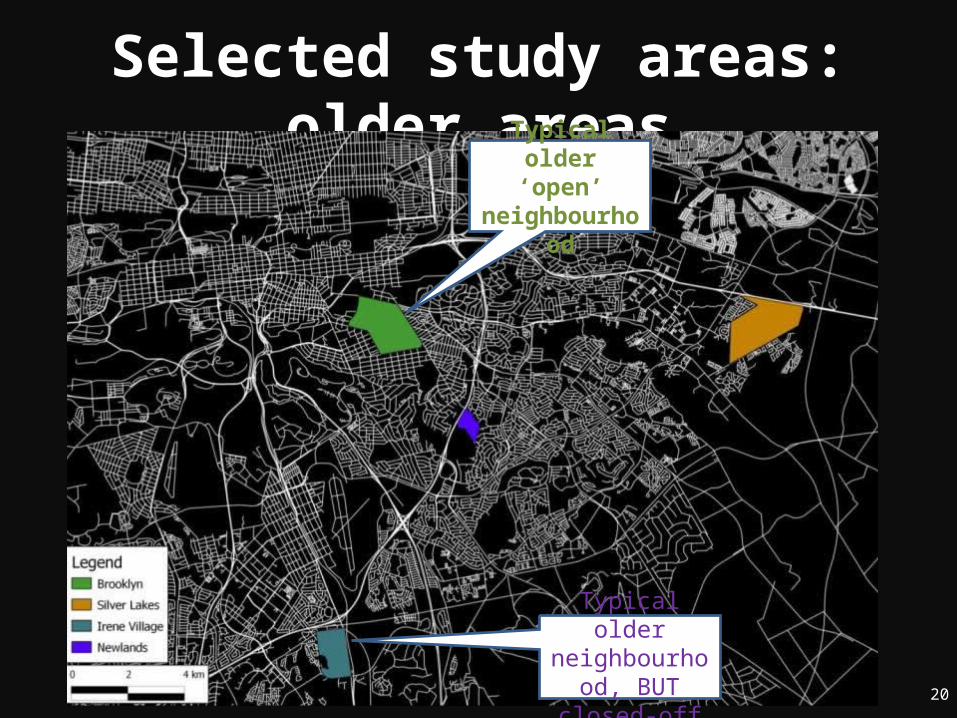
Selected study areas: older areas
Typical older neighbourhood, BUT closed-off
Typical older ‘open’
neighbourhood
20
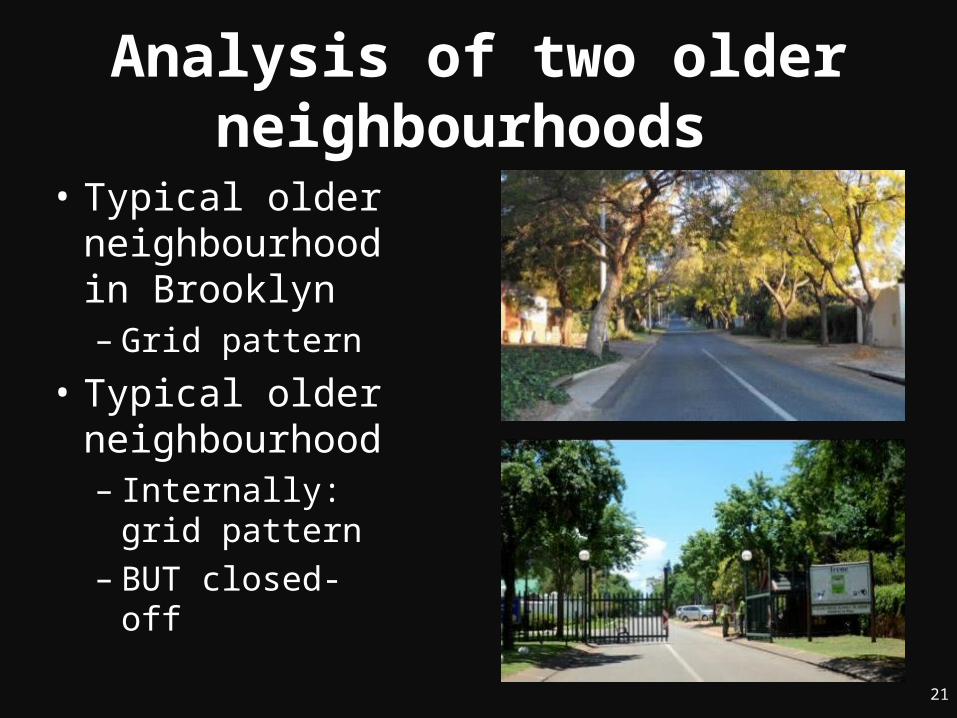
Analysis of two older neighbourhoods
• Typical older neighbourhood in Brooklyn– Grid pattern
• Typical older neighbourhood– Internally: grid
pattern– BUT closed-off
21

Case 1: Brooklyn
22
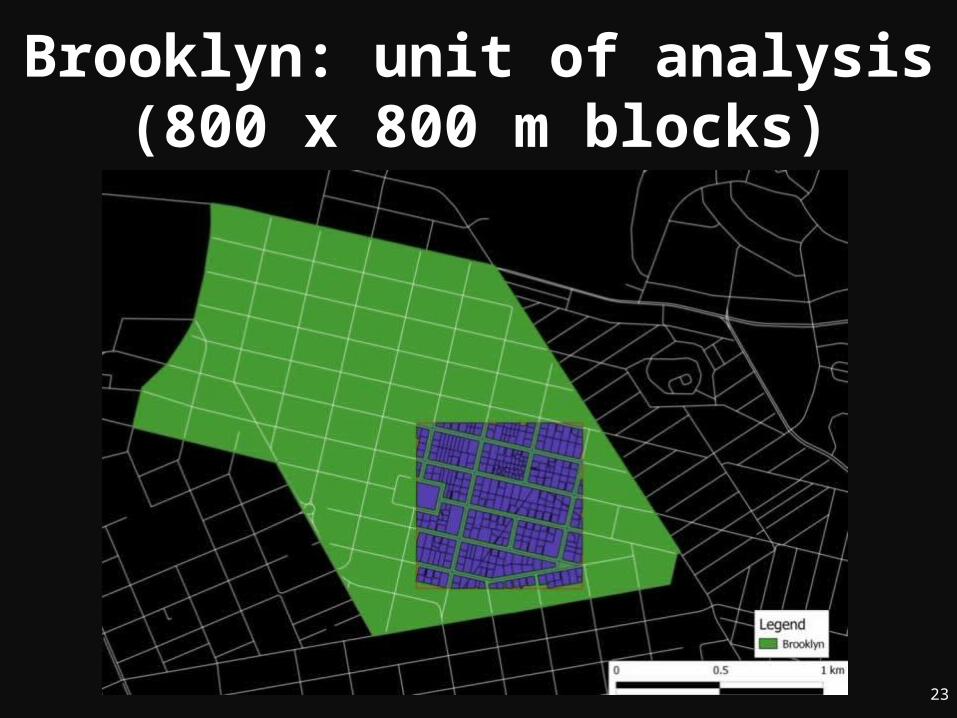
Brooklyn: unit of analysis(800 x 800 m blocks)
23
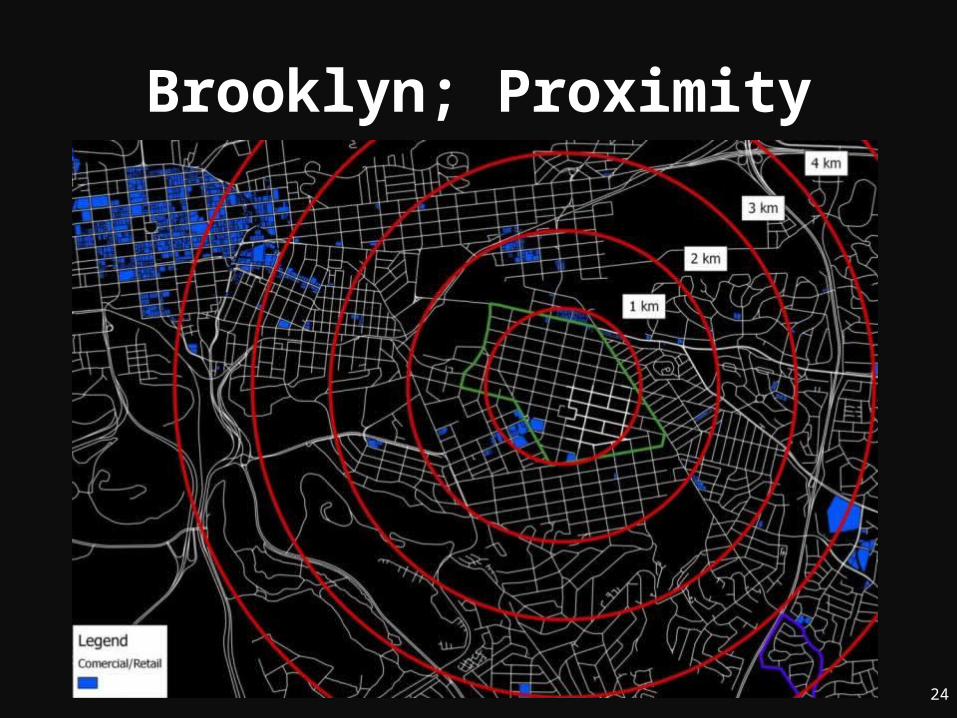
Brooklyn; Proximity
24
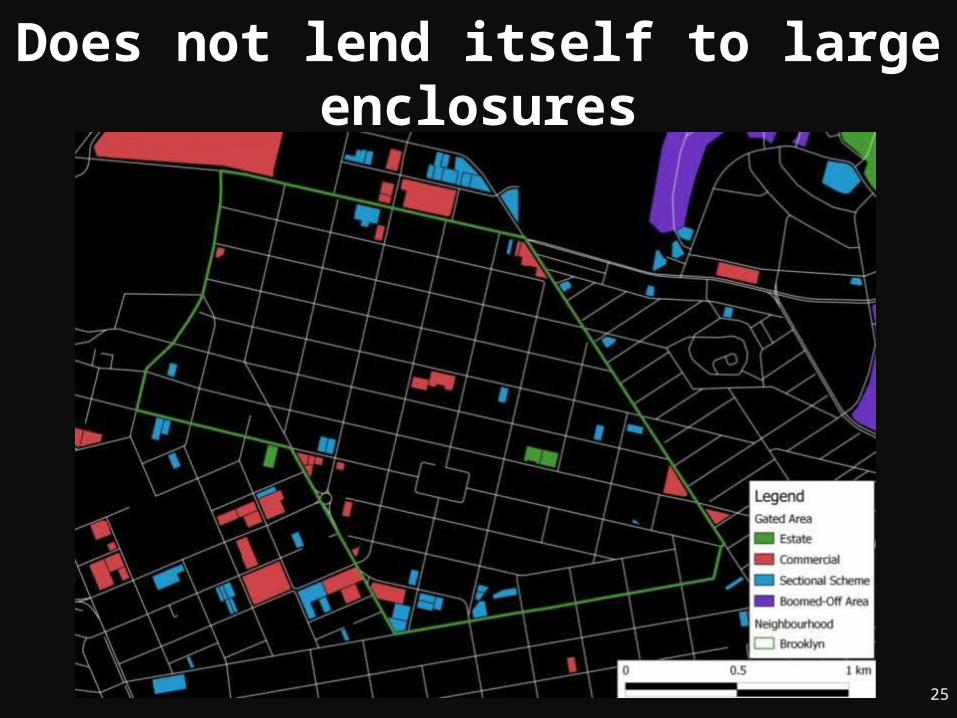
Does not lend itself to large enclosures
25

Case 2: Irene
26

Irene: unit of analysis (800 x 800 m blocks)
27
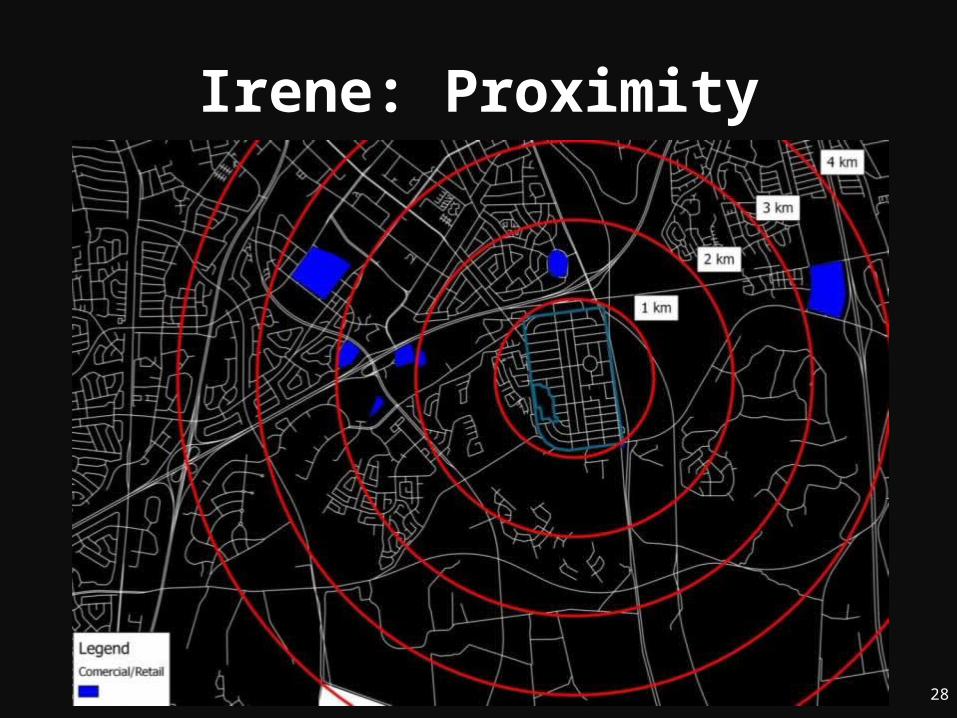
Irene: Proximity
28

Selected area of concentration
29
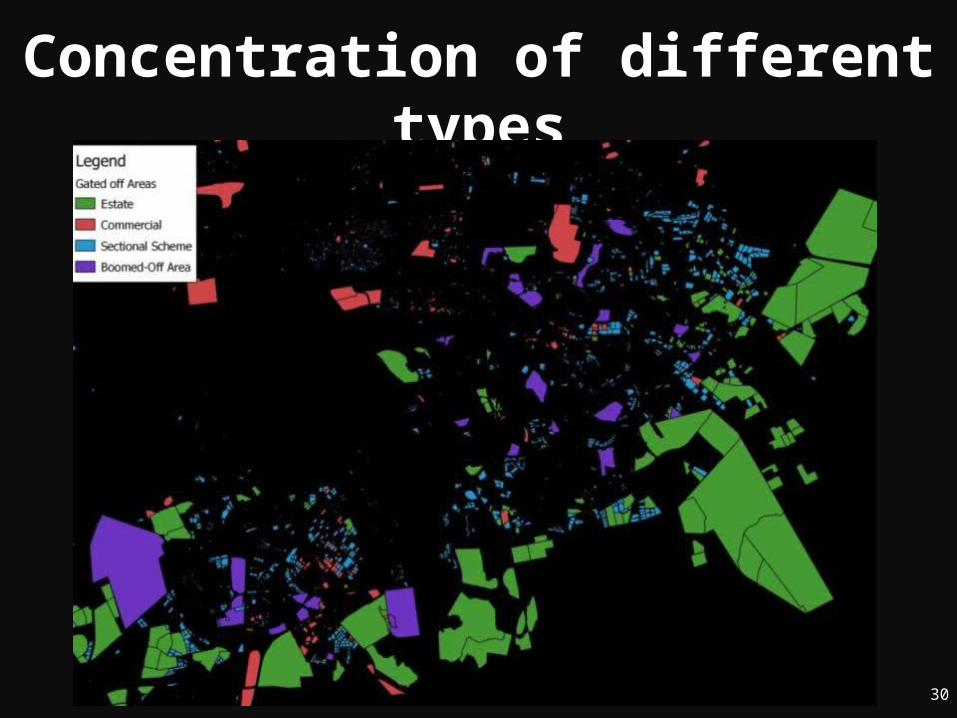
Concentration of different types
30

Concentration of different types
31
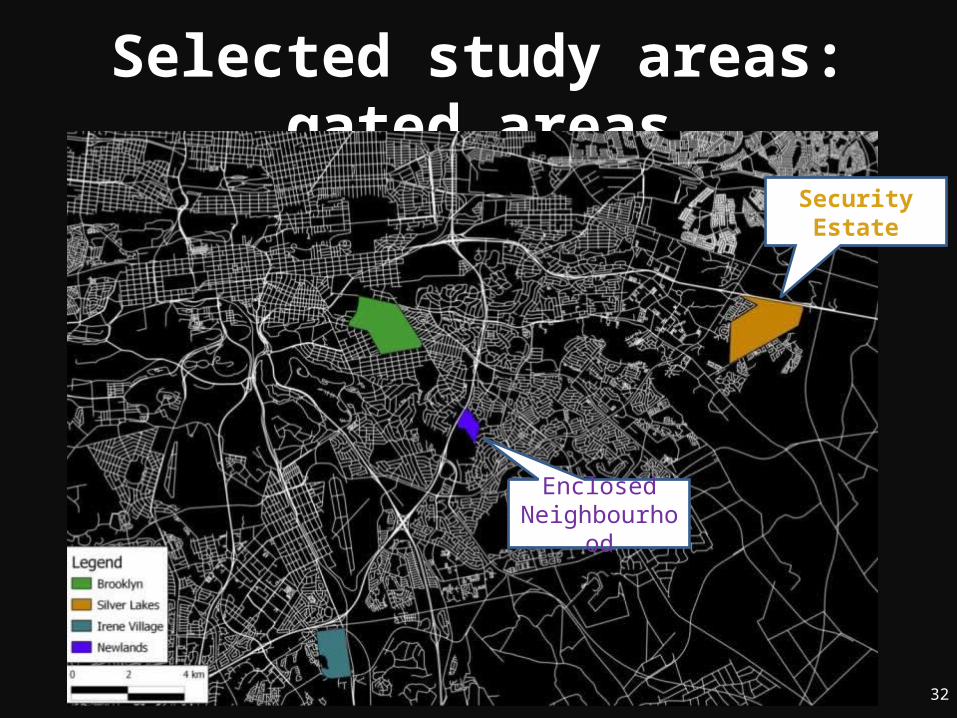
Selected study areas: gated areas
Enclosed Neighbourhood
Security Estate
32
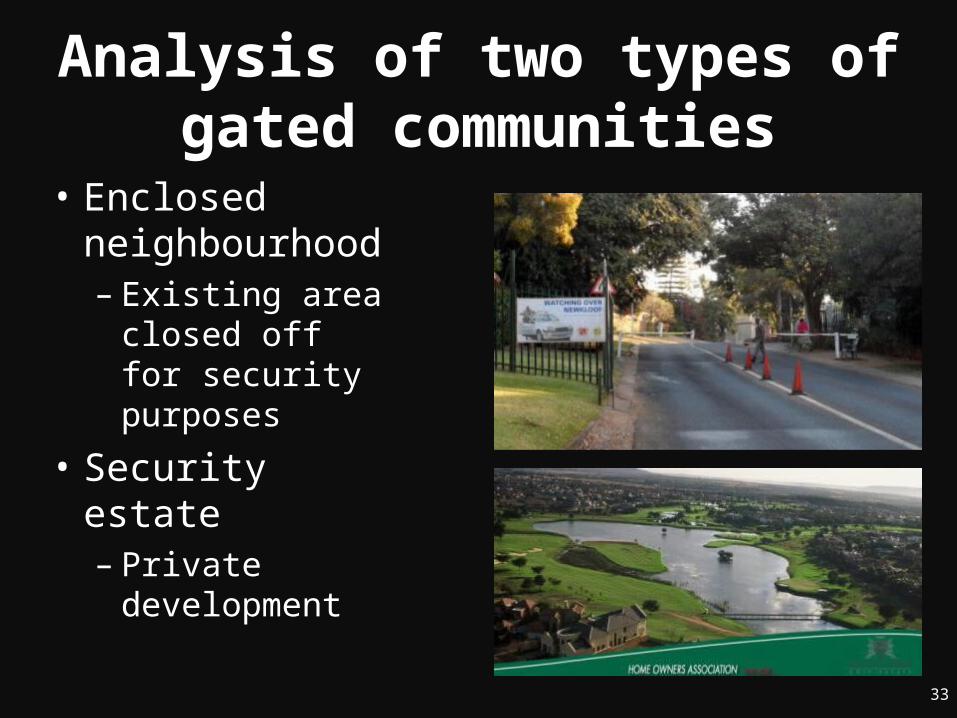
Analysis of two types of gated communities
• Enclosed neighbourhood– Existing area
closed off for security purposes
• Security estate– Private
development
33

Case 3: Newlands
34
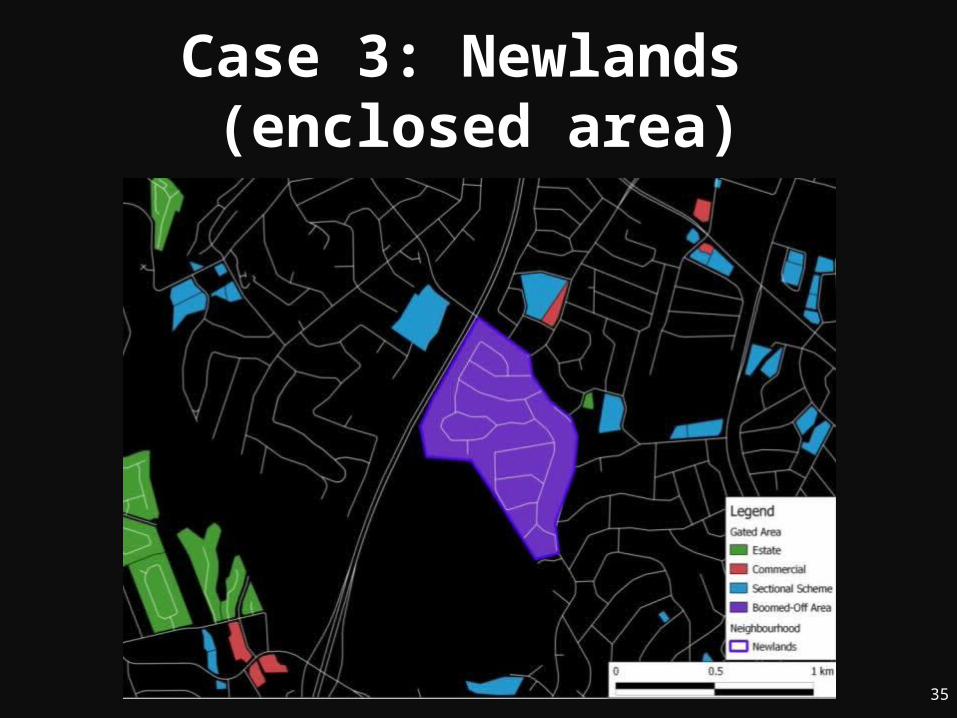
Case 3: Newlands (enclosed area)
35
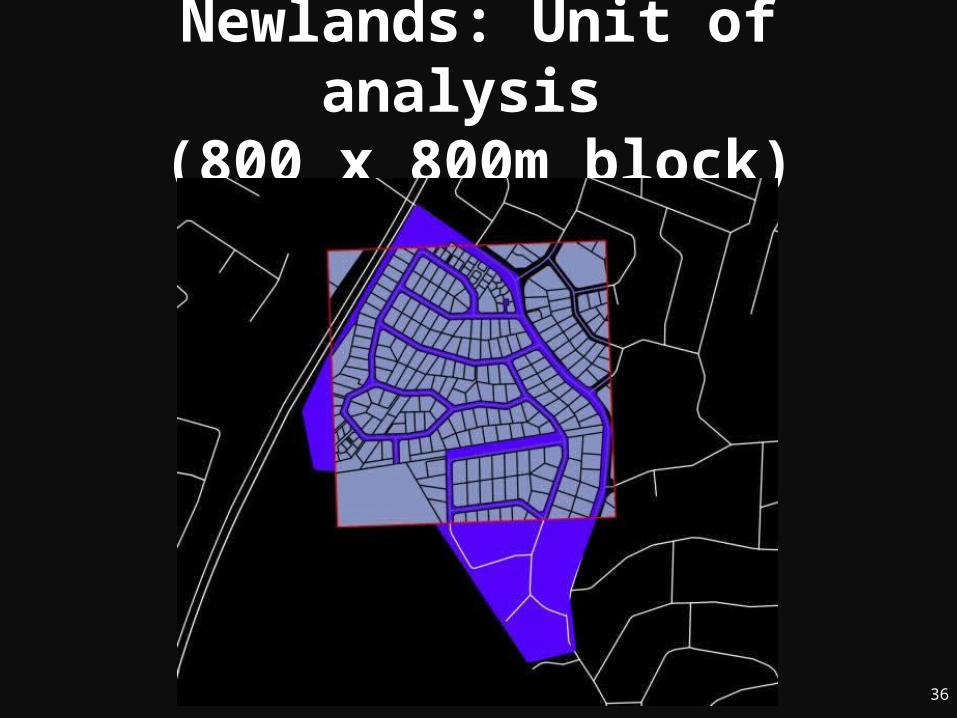
Newlands: Unit of analysis
(800 x 800m block)
36

Newlands: Proximity
37
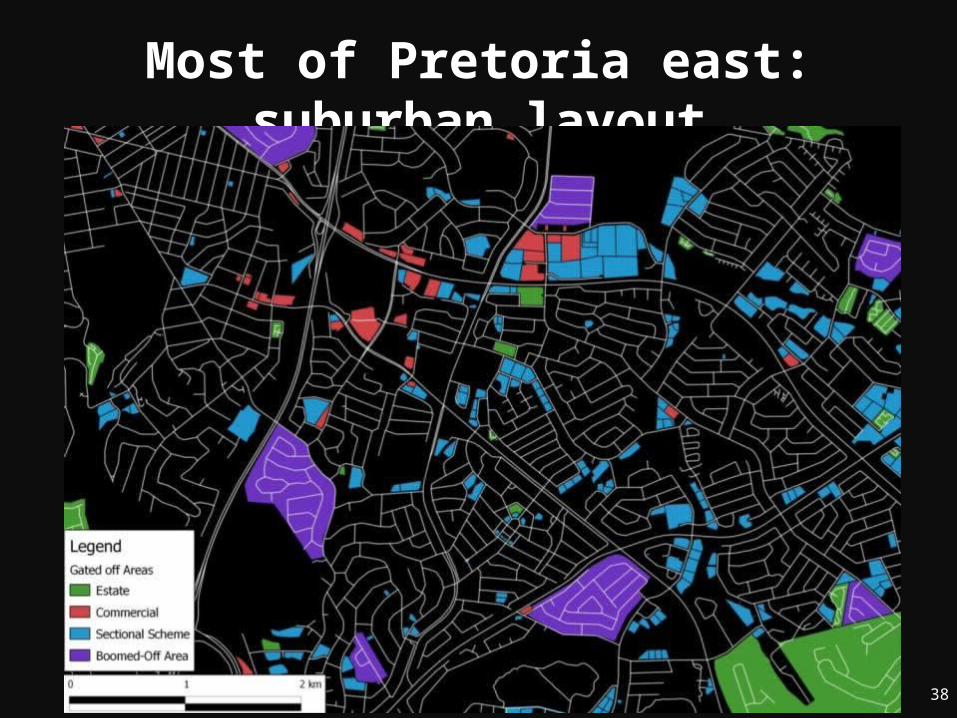
Most of Pretoria east: suburban layout
38

Case 4: Silver Lakes
39

Silver Lakes: unit of analysis
(800 x 800 m block)
40
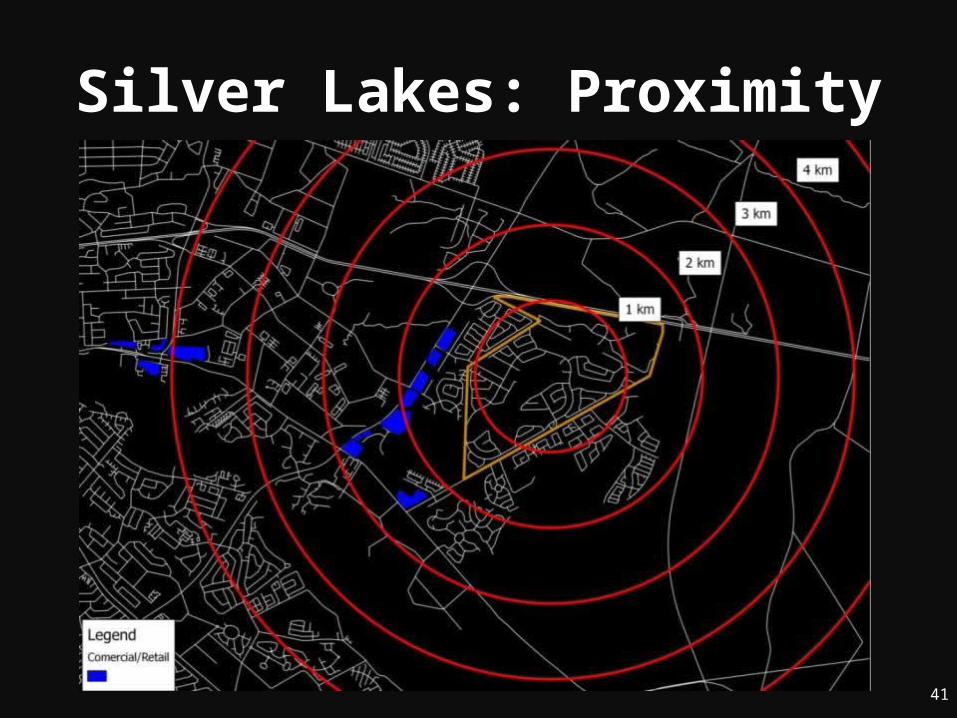
Silver Lakes: Proximity
41
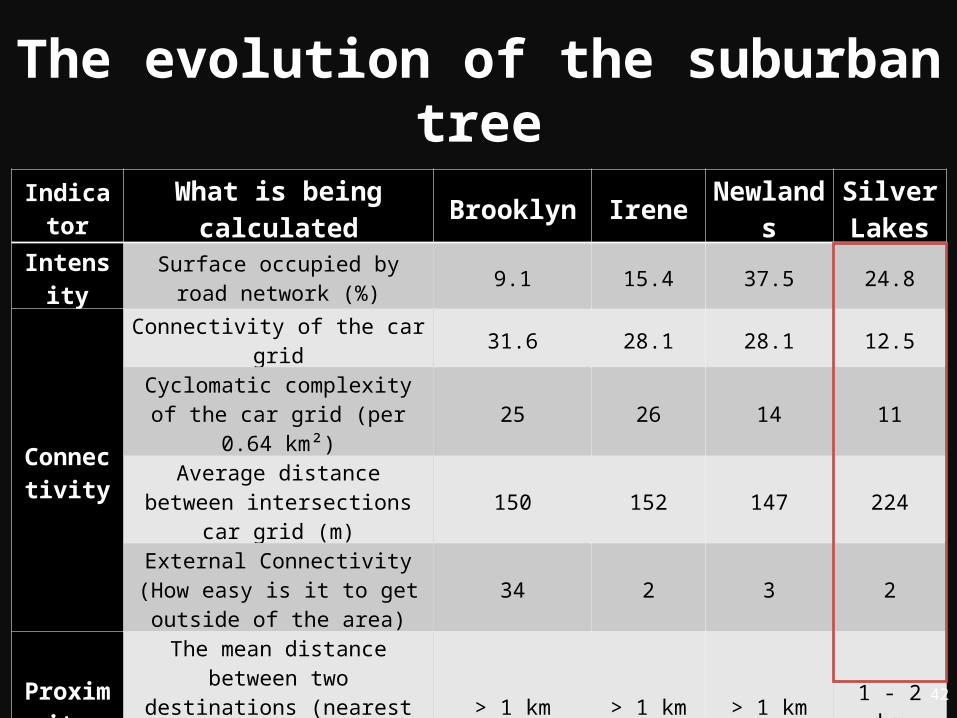
The evolution of the suburban tree
Indicator What is being calculated Brooklyn Irene NewlandsSilver Lakes
IntensitySurface occupied by road network
(%)9.1 15.4 37.5 24.8
Connectivity
Connectivity of the car grid 31.6 28.1 28.1 12.5Cyclomatic complexity of the car
grid (per 0.64 km²)25 26 14 11
Average distance between intersections car grid (m)
150 152 147 224
External Connectivity (How easy is it to get outside of the area)
34 2 3 2
Proximity
The mean distance between two destinations (nearest major
shopping centre – straight line distance)
> 1 km > 1 km > 1 km 1 - 2 km
DiversityThe number of different uses < 6 < 6 1 2Number of road hierarchies 2 1 2 1
42
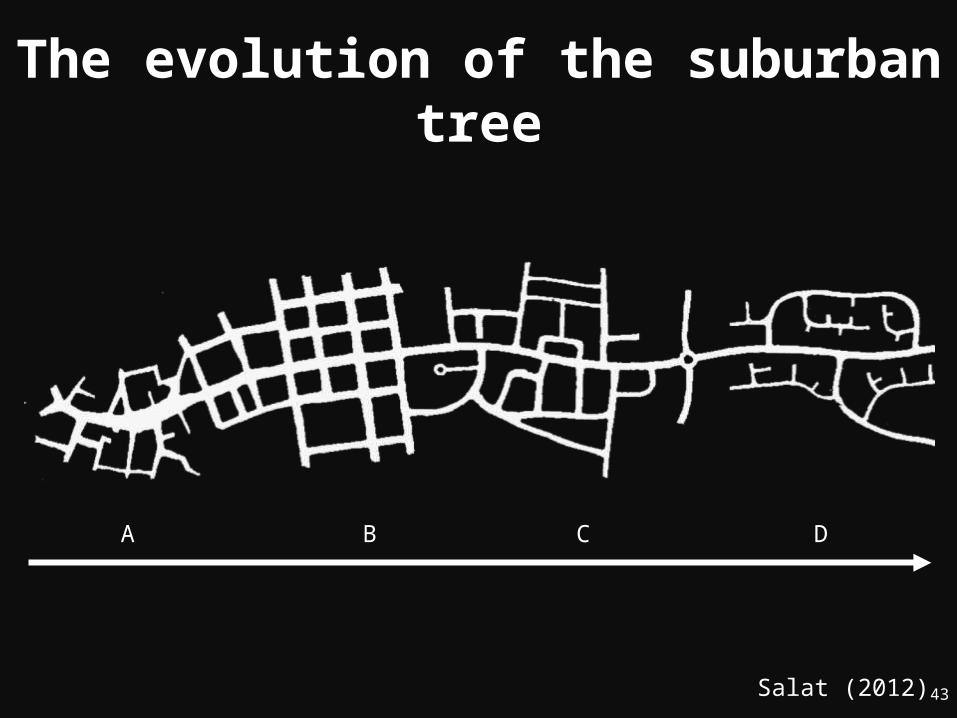
The evolution of the suburban tree
Salat (2012)
A B C D
43
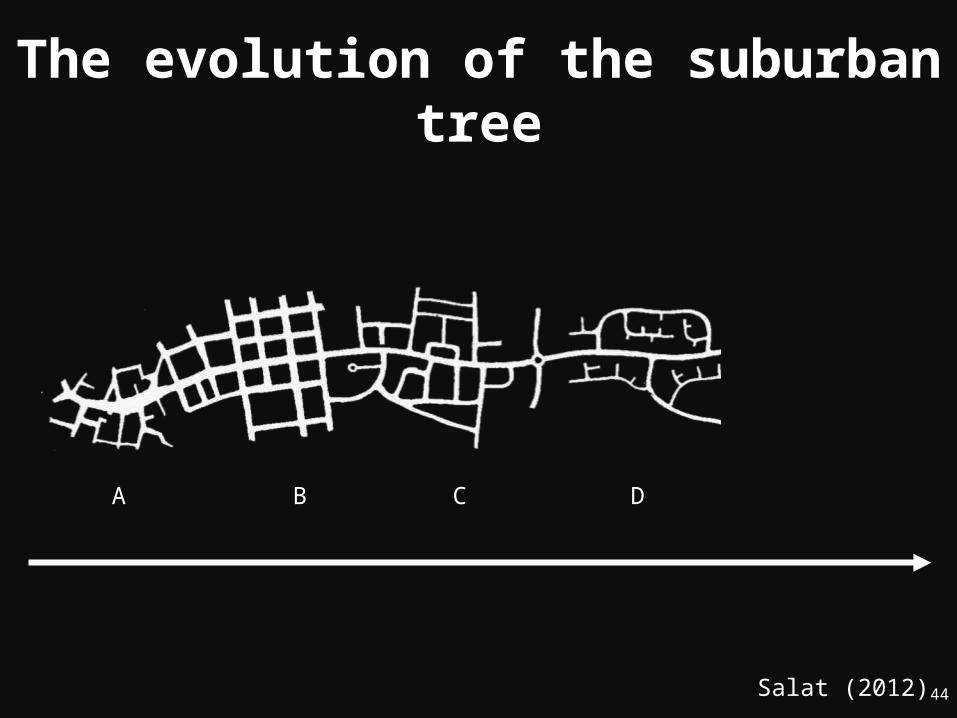
The evolution of the suburban tree
Salat (2012)
A B C D
44
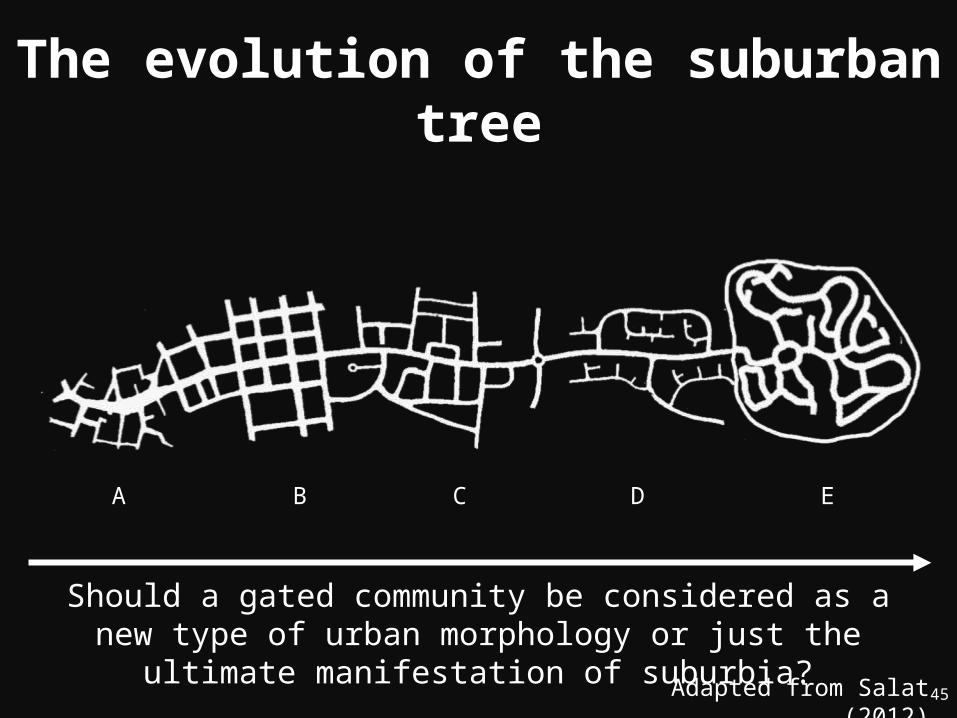
The evolution of the suburban tree
Adapted from Salat (2012)
A B C D E
Should a gated community be considered as a new type of urban morphology or just the ultimate manifestation of suburbia?
45
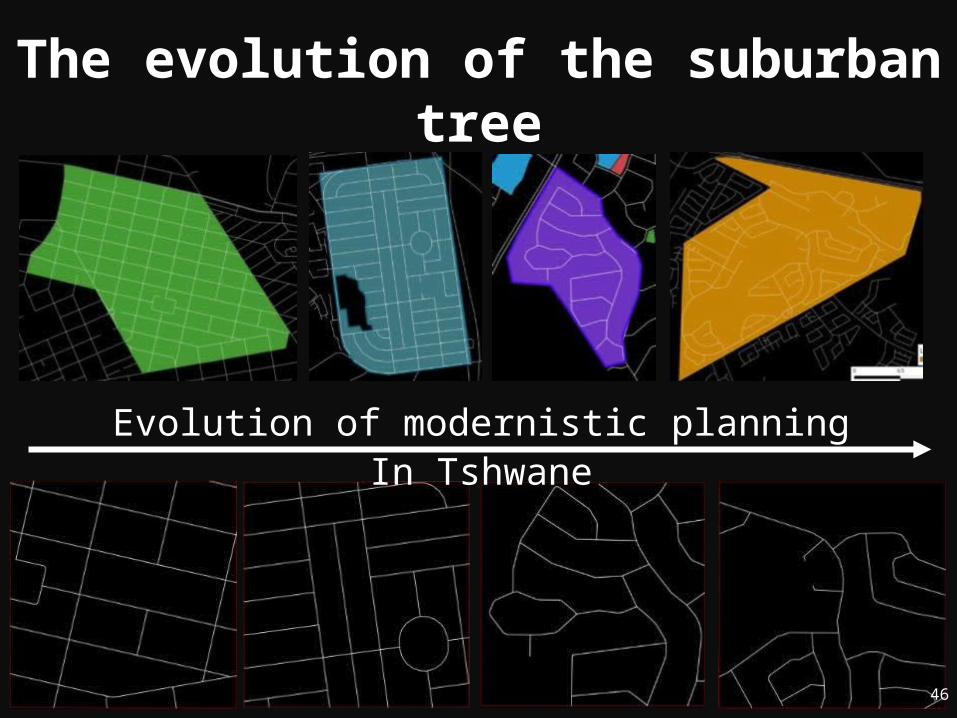
The evolution of the suburban tree
Evolution of modernistic planning In Tshwane
46
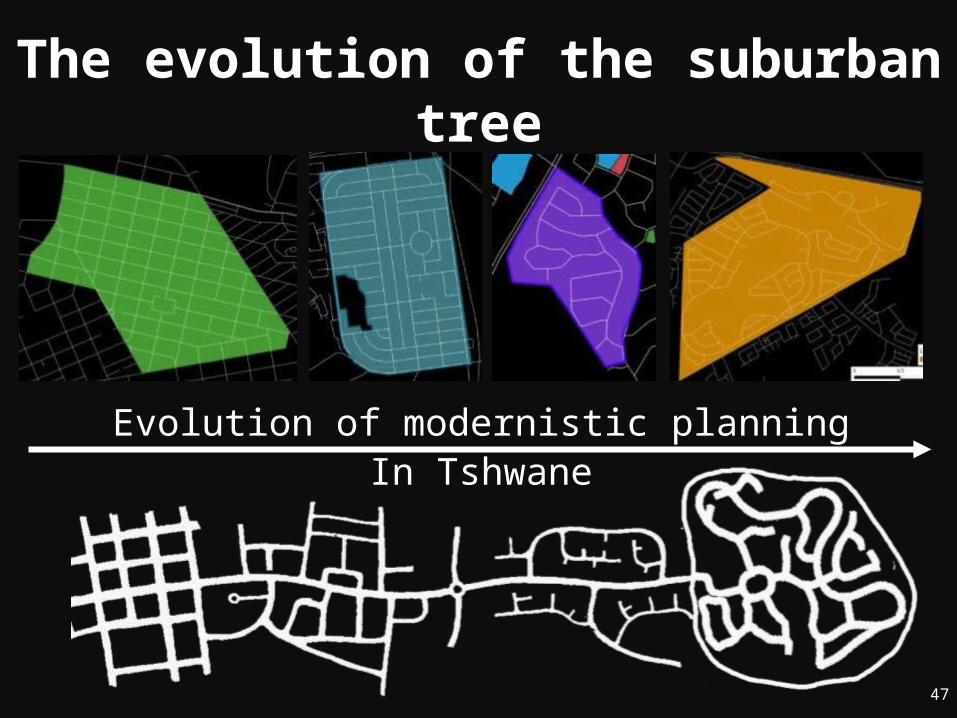
The evolution of the suburban tree
Evolution of modernistic planning In Tshwane
47
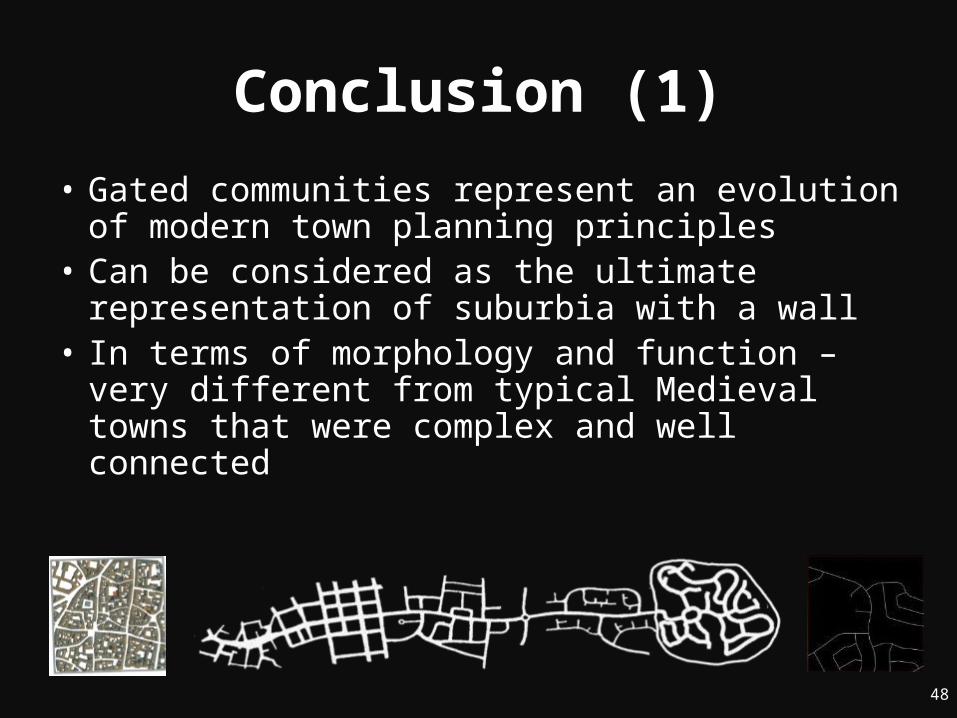
Conclusion (1)
• Gated communities represent an evolution of modern town planning principles
• Can be considered as the ultimate representation of suburbia with a wall
• In terms of morphology and function – very different from typical Medieval towns that were complex and well connected
48
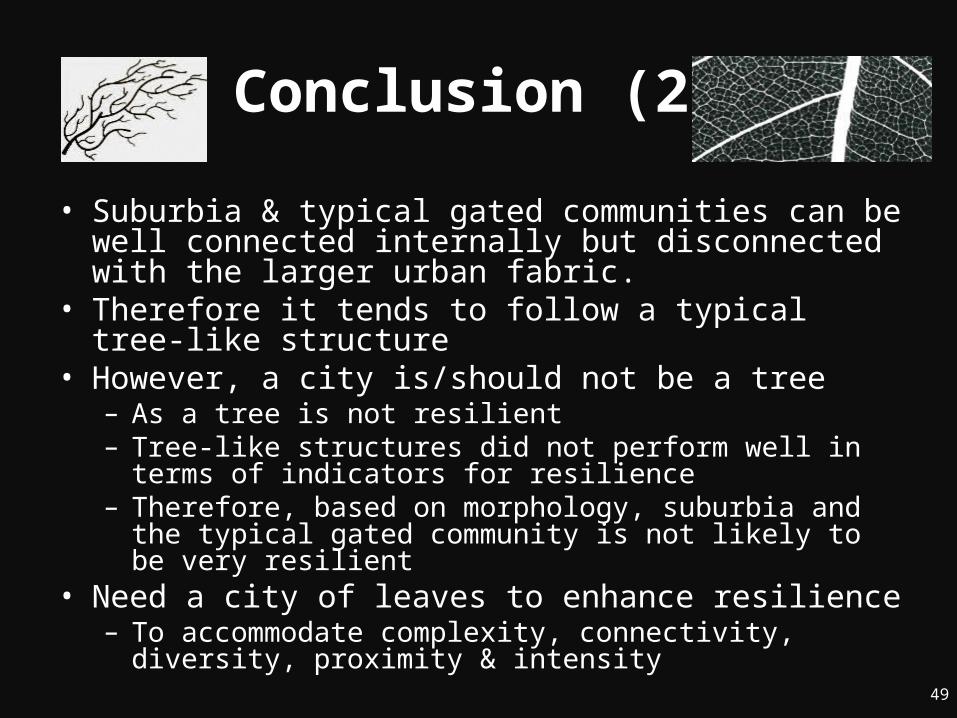
Conclusion (2)
• Suburbia & typical gated communities can be well connected internally but disconnected with the larger urban fabric.
• Therefore it tends to follow a typical tree-like structure
• However, a city is/should not be a tree– As a tree is not resilient– Tree-like structures did not perform well in terms of
indicators for resilience– Therefore, based on morphology, suburbia and the
typical gated community is not likely to be very resilient
• Need a city of leaves to enhance resilience– To accommodate complexity, connectivity,
diversity, proximity & intensity 49
Questions?
50
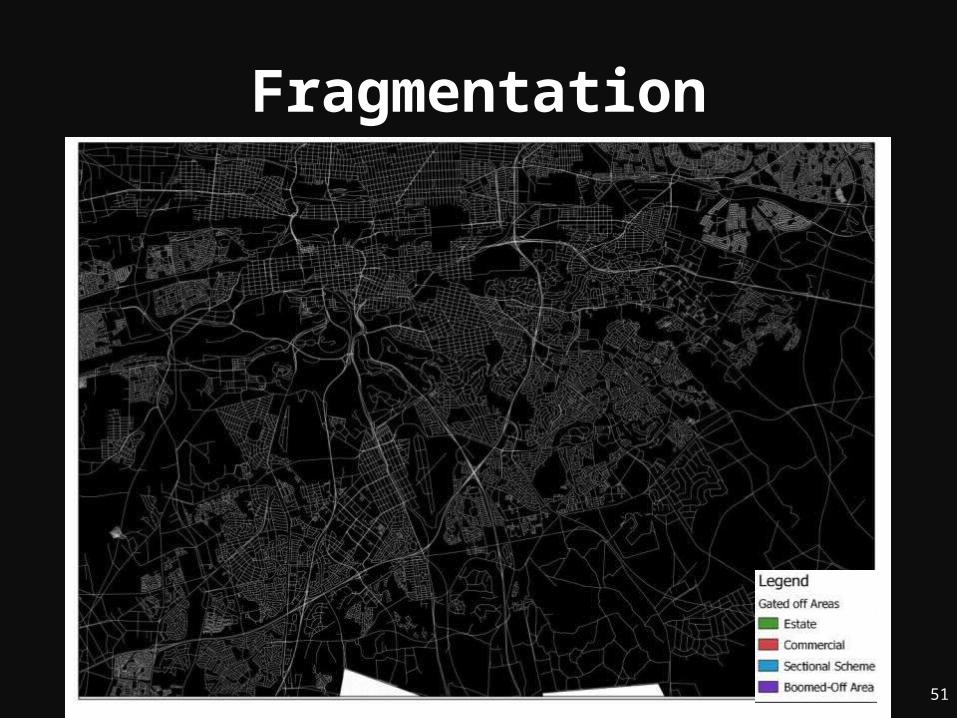
Fragmentation
51
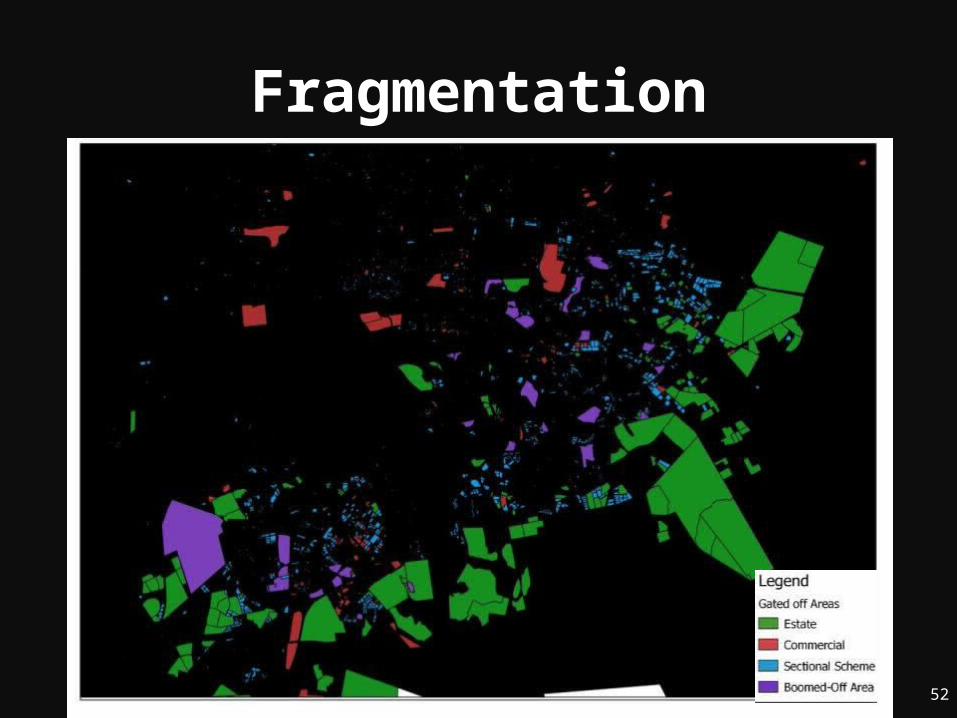
Fragmentation
52
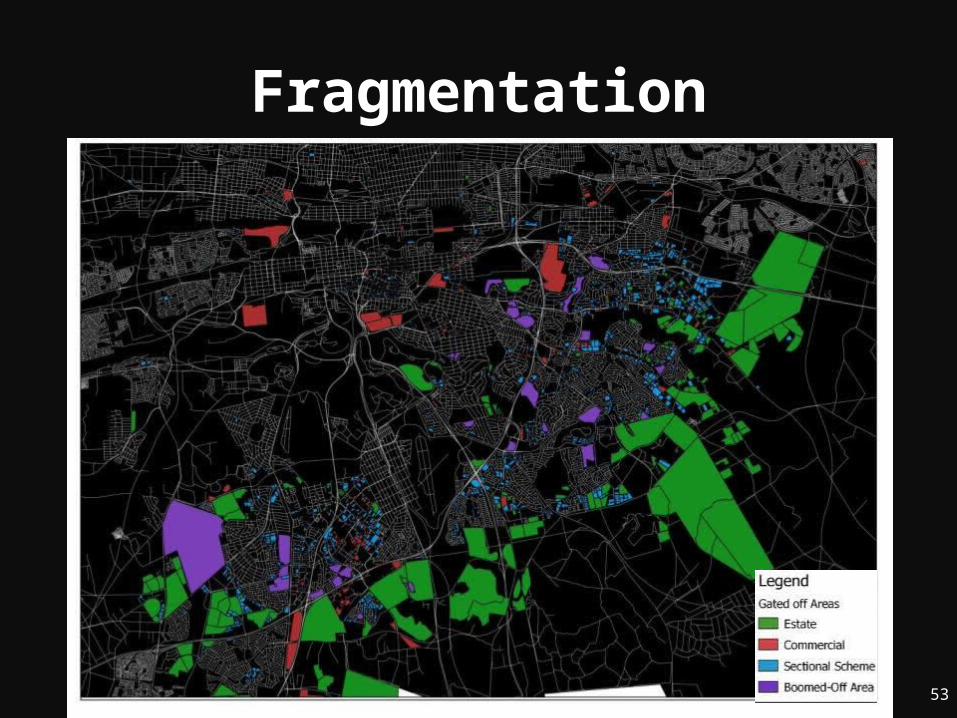
Fragmentation
53