
DARLING INTERNATIONAL INC - AnnualReports.co.uk€¦ · · 2016-09-28DARLING INTERNATIONAL INC...
123
DARLING INTERNATIONAL INC FORM 10-K (Annual Report) Filed 03/03/10 for the Period Ending 01/02/10 Address 251 O CONNOR RIDGE BLVD STE 300 IRVING, TX 75038 Telephone 9727170300 CIK 0000916540 Symbol DAR SIC Code 2070 - Fats And Oils Industry Food Processing Sector Consumer/Non-Cyclical Fiscal Year 12/08 http://www.edgar-online.com © Copyright 2010, EDGAR Online, Inc. All Rights Reserved. Distribution and use of this document restricted under EDGAR Online, Inc. Terms of Use.
-
Upload
truongngoc -
Category
Documents
-
view
216 -
download
3
Transcript of DARLING INTERNATIONAL INC - AnnualReports.co.uk€¦ · · 2016-09-28DARLING INTERNATIONAL INC...

DARLING INTERNATIONAL INC
FORM 10-K(Annual Report)
Filed 03/03/10 for the Period Ending 01/02/10
Address 251 O CONNOR RIDGE BLVDSTE 300IRVING, TX 75038
Telephone 9727170300CIK 0000916540
Symbol DARSIC Code 2070 - Fats And Oils
Industry Food ProcessingSector Consumer/Non-Cyclical
Fiscal Year 12/08
http://www.edgar-online.com© Copyright 2010, EDGAR Online, Inc. All Rights Reserved.
Distribution and use of this document restricted under EDGAR Online, Inc. Terms of Use.

UNITED STATES SECURITIES AND EXCHANGE COMMISSION
Washington, D.C. 20549 ______________________________________
FORM 10-K
(Mark One)
OR
Commission File Number 001-13323
DARLING INTERNATIONAL INC. (Exact name of registrant as specified in its charter)
Registrant's telephone number, including area code: ( 972) 717-0300
Securities registered pursuant to Section 12(b) of the Act:
Securities registered pursuant to Section 12(g) of the Act: None
Indicate by check mark if the Registrant is a well-known seasoned issuer, as defined in Rule 405 of the Securities Act. Yes X No ____ Indicate by check mark if the Registrant is not required to file reports pursuant to Section 13 or Section 15(d) of the Act. Yes ___ No X
Indicate by check mark whether the Registrant (1) has filed all reports required to be filed by Section 13 or 15(d) of the Securities Exchange Act of 1934 during the preceding 12 months (or for such shorter period that the Registrant was required to file such reports), and (2) has been subject to such filing requirements for the past 90 days. Yes X No ____
Indicate by check mark whether the Registrant has submitted electronically and posted on its corporate Website, if any, every Interactive Data File required to be submitted and posted pursuant to Rule 405 of Regulation S-T (§232.405 of this chapter) during the preceding 12 months (or for such shorter period that the Registrant was required to submit and post such files). Yes ____ No ___
X ANNUAL REPORT PURSUANT TO SECTION 13 or 15(d) OF THE SECURITIES EXCHANGE
ACT OF 1934 For the fiscal year ended January 2, 2010
TRANSITION REPORT PURSUANT TO SECTION 13 or 15(d) OF THE SECURITIES EXCHANGE ACT OF 1934
For the transition period from _______________ to _______________
Delaware 36-2495346 (State or other jurisdiction (I.R.S. Employer of incorporation or organization) Identification No.) 251 O'Connor Ridge Blvd., Suite 300
Irving, Texas 75038 (Address of principal executive offices) (Zip Code)
Title of Each Class Name of Exchange on Which Registered
Common Stock $0.01 par value per share New York Stock Exchange ("NYSE")

Indicate by check mark if disclosure of delinquent filers pursuant to Item 405 of Regulation S-K is not contained herein, and will not be contained, to the best of the Registrant’s knowledge, in definitive proxy or information statements incorporated by reference in Part III of this Form 10-K or any amendment to this Form 10-K. X
Page 1

Indicate by check mark whether the Registrant is a large accelerated filer, an accelerated filer, a non-accelerated filer, or a smaller reporting company. See the definitions of “large accelerated filer,” “accelerated filer” and “smaller reporting company” in Rule 12b-2 of the Exchange Act.
Indicate by check mark whether the Registrant is a shell company (as defined in Rule 12b-2 of the Act). Yes ____ No X
As of the last day of the Registrant’s most recently completed second fiscal quarter, the aggregate market value of the shares of common stock held by nonaffiliates of the Registrant was approximately $524,387,000 based upon the closing price of the common stock as reported on the NYSE on that day. (In determining the market value of the Registrant’s common stock held by non-affiliates, shares of common stock beneficially owned by directors, officers and holders of more than 10% of the Registrant’s common stock have been excluded. This determination of affiliate status is not necessarily a conclusive determination for other purposes.)
There were 82,226,690 shares of common stock, $0.01 par value, outstanding at February 24, 2010.
DOCUMENTS INCORPORATED BY REFERENCE
Selected designated portions of the Registrant’s definitive Proxy Statement in connection with the Registrant’s 2010 Annual Meeting of stockholders are incorporated by reference into Part III of this Annual Report.
Large accelerated filer X Accelerated filer Non-accelerated filer Smaller reporting company
(Do not check if a smaller
reporting company)
Page 2
DARLING INTERNATIONAL INC. AND SUBSIDIARIES FORM 10-K FOR THE FISCAL YEAR ENDED JANUARY 2, 2010
TABLE OF CONTENTS
Page No. PART I. Item 1. BUSINESS 4 Item 1A. RISK FACTORS 9 Item 1B. UNRESOLVED STAFF COMMENTS 16 Item 2. PROPERTIES 16 Item 3. LEGAL PROCEEDINGS 18 Item 4. SUBMISSION OF MATTERS TO A VOTE OF SECURITY HOLDERS 18 PART II. Item 5. MARKET FOR REGISTRANT’S COMMON EQUITY, RELATED
STOCKHOLDER MATTERS AND ISSUER PURCHASES OF EQUITY SECURITIES 19
Item 6. SELECTED FINANCIAL DATA 22 Item 7. MANAGEMENT’S DISCUSSION AND ANALYSIS OF FINANCIAL
CONDITION AND RESULTS OF OPERATIONS 24 Item 7A. QUANTITATIVE AND QUALITATIVE DISCLOSURES ABOUT
MARKET RISK 48 Item 8. FINANCIAL STATEMENTS AND SUPPLEMENTARY DATA 50 Item 9. CHANGES IN AND DISAGREEMENTS WITH ACCOUNTANTS ON
ACCOUNTING AND FINANCIAL DISCLOSURE 92 Item 9A. CONTROLS AND PROCEDURES 92 Item 9B. OTHER INFORMATION 93 PART III. Item 10. DIRECTORS, EXECUTIVE OFFICERS AND CORPORATE
GOVERNANCE 94 Item 11. EXECUTIVE COMPENSATION 94 Item 12. SECURITY OWNERSHIP OF CERTAIN BENEFICIAL OWNERS AND
MANAGEMENT AND RELATED STOCKHOLDER MATTERS 94 Item 13. CERTAIN RELATIONSHIPS AND RELATED TRANSACTIONS, AND
DIRECTOR INDEPENDENCE 94 Item 14. PRINCIPAL ACCOUNTING FEES AND SERVICES 94 PART IV. Item 15. EXHIBITS, FINANCIAL STATEMENT SCHEDULES 95 SIGNATURES 99
Page 3

PART I
ITEM 1. BUSINESS GENERAL Founded by the Swift meat packing interests and the Darling family in 1882, Darling International Inc. (“Darling”) was incorporated in Delaware in 1962 under the name “Darling-Delaware Company, Inc.” On December 28, 1993, Darling changed its name from “Darling-Delaware Company, Inc.” to “Darling International Inc.” The address of Darling’s principal executive office is 251 O’Connor Ridge Boulevard, Suite 300, Irving, Texas, 75038, and its telephone number at this address is (972) 717-0300.
Darling is a leading provider of rendering, recycling and recovery solutions to the nation’s food industry. Darling collects and recycles animal by-products and used cooking oil from food service establishments and provides grease trap cleaning services to many of the same establishments. In fiscal 2006, Darling, through its wholly-owned subsidiary Darling National LLC, a Delaware limited liability company (“Darling National”), completed the acquisition of substantially all of the assets of National By-Products, LLC, an Iowa limited liability company (“NBP”). Darling and its subsidiaries, including Darling National, are collectively referred to herein as the “Company”. The Company processes raw materials at 45 facilities located throughout the United States into finished products such as protein (primarily meat and bone meal, “MBM”), tallow (primarily bleachable fancy tallow, “BFT”), yellow grease (“YG”) and hides. The Company sells these products nationally and internationally, primarily to producers of livestock feed, oleo-chemicals, bio-fuels, soaps, pet foods and leather goods for use as ingredients in their products or for further processing.
Commencing in 1998, as part of an overall strategy to better commit financial resources, the Company’s operations were organized into
two segments. These are: 1) Rendering, the core business of turning inedible food by-products from meat and poultry processors, butcher shops, grocery stores and food service establishments into high quality feed ingredients and fats for other industrial applications; and 2) Restaurant Services, a group focused on growing the grease collection business and grease collection equipment sales while expanding the line of services, which includes grease trap servicing, and the National Service Center (“NSC”), offered to food service establishments and food processors. The NSC schedules services such as fat and bone and used cooking oil collection as well as trap cleaning for contracted customers using the Company’s resources or third party providers. For the financial results of the Company’s business segments, see Note 18 of Notes to Consolidated Financial Statements.
The Company’s net external sales from continuing operations by operating segment were as follows (in thousands):
PROCESSING OPERATIONS The Company creates finished products primarily through the drying, grinding, separating and blending of its various raw materials. The process starts with the collection of animal processing by-products (fat, bones, feathers and offal) from meat processors, grocery stores, butcher shops, meat markets and food service establishments, as well as used cooking oil from food service establishments and grocery stores.
The animal processing by-products are ground and heated to extract water and separate oils from animal tissue as well as to make the material suitable as an ingredient for animal feed. Protein is separated from the cooked material by pressing the material, then grinding and sifting it through screens. The separated tallow is centrifuged and/or refined for purity. The primary finished products derived from the processing of animal by-products are tallow and protein. Other by-products include feather meal and blood meal. Used cooking oil from food service establishments is processed under a separate procedure that involves heat processing and settling, as well as refining, resulting in derived yellow grease, feed-grade animal fat or oleo-chemical feedstocks.
Fiscal 2009
Fiscal 2008
Fiscal 2007
Continuing operations: Rendering $458,573
76.7% $585,108
72.5% $464,468 72.0%
Restaurant Services 139,233 23.3 222,384 27.5 180,845 28.0 Total $ 597,806 100.0
% $ 807,492 100.0
% $
645,313 100.0 %
Page 4

PURCHASE AND COLLECTION OF RAW MATERIALS The Company operates a fleet of approximately1,000 trucks and tractor-trailers to collect raw materials from approximately 110,000 food service establishments, butcher shops, grocery stores and independent meat and poultry processors. The raw materials collected are manufactured into the finished products sold by the Company. The Company replaces or upgrades its vehicle fleet as needed to maintain efficient operations. Rendering materials are collected in one of two manners. Certain large suppliers, such as large meat processors and poultry processors, are furnished with bulk trailers in which the raw material is loaded. The Company transports these trailers directly to a processing facility. Certain of the Company’s rendering facilities are highly dependent on one or a few suppliers. Should any of these suppliers choose alternate methods of disposal, cease their operations, have their operations interrupted by casualty or otherwise cease using the Company’s collection services, these operating facilities would be materially and adversely affected. The Company provides the remaining suppliers, primarily grocery stores and butcher shops, with containers in which to deposit the raw material. The containers are picked up by or emptied into Company trucks on a periodic basis. The type and frequency of service is determined by individual supplier requirements, the volume of raw material generated by the supplier, supplier location and weather, among other factors. Used cooking oil from food service establishments is placed in various sizes and types of containers which are supplied by the Company. In some instances, these containers are loaded directly onto the trucks, while in other instances the oil is pumped through a vacuum hose into the truck. The Company also sells a container for used cooking oil collection to food service establishments called CleanStar ® , which is a proprietary self-contained collection system that is housed either inside or outside the establishment, with the used cooking oil pumped directly into collection vehicles via an outside valve. The frequency of all forms of raw material collection is determined by the volume of oil generated by the food service establishment. The raw materials collected by the Company are transported either directly to a processing plant or to a transfer station where materials from several collection routes are loaded into trailers and transported to a processing plant. Collections of animal processing by-products generally are made during the day, and materials are delivered to plants for processing within 24 hours of collection to deter spoilage. Collection of used cooking oil can be made at any time of the day or night, depending on supplier preference; these materials may be held for longer periods of time before processing. Depending on market conditions, the Company either charges a collection fee to offset a portion of the expense incurred in collecting raw material or will pay for the raw material. During the 2009 fiscal year, the Company’s largest single supplier accounted for approximately 5% of the total raw material processed by the Company, and the 10 largest raw materials suppliers accounted for approximately 25% of the total raw material processed by the Company. For a discussion of the Company’s competition for raw materials, see “Competition.” Many of the Company’s suppliers supply raw material under supplier agreements. While the Company does not anticipate problems in the availability or supply of raw material in the future, a significant decrease in raw material volume could materially and adversely affect the Company’s business and results of operations. RAW MATERIALS PRICING The Company has two primary pricing arrangements with its raw materials suppliers. Approximately 53% of the Company's annual volume of raw materials is acquired on a "formula" basis. Under a formula arrangement, the charge or credit for raw materials is tied to published finished product commodity prices after deducting a fixed processing fee. The Company acquires the remaining annual volume of raw material under "non-formula" arrangements whereby suppliers are either paid a fixed price, are not paid, or are charged a collection fee, depending on various economic and competitive factors.
Page 5
The credit received or amount charged for raw material under both formula and non-formula arrangements is based on various factors,
including the type of raw materials, the expected value of the finished product to be produced, the anticipated yields, the volume of material generated by the supplier and processing and transportation costs. Competition among processors to procure raw materials also affects the price paid for raw materials. See "Competition."
Formula prices are generally adjusted on a weekly, monthly or quarterly basis while non-formula prices or charges are adjusted as needed to respond to changes in finished product prices or related operating costs. FINISHED PRODUCTS The finished products that result from processing of animal by-products are oils, primarily BFT and YG; MBM, a protein; and hides. Oils are used as ingredients in the production of pet food, animal feed, soaps and as a substitute for traditional fuels. Oleo-chemical producers use these oils as feedstocks to produce specialty ingredients used in paint, rubber, paper, concrete, plastics and a variety of other consumer and industrial products. MBM is used primarily as a high protein additive in pet food and animal feed. Hides are sold to leather distributors and manufacturers for the production of leather goods. Predominantly all of the Company's finished products are commodities that compete with other commodities such as corn, soybean oil and soybean meal. While the Company's finished products are generally sold at prices prevailing at the time of sale, the Company’s ability to deliver large quantities of finished products from multiple locations and to coordinate sales from a central location enables the Company to occasionally receive a premium over the then-prevailing market price. MARKETING, SALES AND DISTRIBUTION OF FINISHED PRODU CTS The Company sells its finished products worldwide. Commodity sales are primarily managed through the Company's commodity trading department which is headquartered in Irving, Texas. The Company also maintains a sales office in Des Moines, Iowa for the sale and distribution of selected products. This sales force is in contact with several hundred customers daily and coordinates the sale and assists in the distribution of most finished products produced at the Company's processing plants. The Company sells its finished products internationally through commodities brokers, Company agents and directly to customers, in various countries. The Company has no material foreign operations, but exports a portion of its products to customers in various foreign countries or regions including Asia, the European Union, the Pacific Rim, North Africa, Mexico and South America. Total export sales were $70.8 million, $132.2 million and $171.6 million for the years ended January 2, 2010, January 3, 2009 and December 29, 2007, respectively. The level of export sales varies from year to year depending on the relative strength of domestic versus overseas markets. The Company obtains payment protection for most of its foreign sales by requiring payment before shipment or by requiring bank letters of credit or guarantees of payment from U.S. government agencies. The Company ordinarily is paid for its products in U.S. dollars and has not experienced any material currency translation losses or any material foreign exchange control difficulties. See Note 18 of Notes to Consolidated Financial Statements for a breakdown of the Company’s sales by domestic and foreign customers. Following diagnosis of the first U.S. case of bovine spongiform encephalopathy (“BSE”) on December 23, 2003, many countries banned imports of U.S.-produced beef and beef products, including MBM and initially BFT, though this initial ban on tallow was relaxed to permit imports of U.S.-produced tallow with less than 0.15% impurities. As of February 24, 2010, most foreign markets that were closed to U.S. beef following the discovery of the first U.S. case of BSE had been reopened to U.S beef, although some countries only accept boneless beef or beef from cattle less than 30 months of age. Japan is more restrictive and only permits imports of U.S. beef from cattle that are age verified to be 20 months of age or younger at slaughter. Export markets for MBM containing beef material produced in the U.S. have remained closed with the exception of the Indonesia market.
Page 6

The Company’s management monitors market conditions and prices for its finished products on a daily basis. If market conditions or
prices were to significantly change, the Company’s management would evaluate and implement any measures that it may deem necessary to respond to the change in market conditions. For larger formula-based pricing suppliers, the indexing of finished product price to raw material cost effectively fixes the gross margin on finished product sales at a stable level, providing some protection to the Company from price declines. Finished products produced by the Company are shipped primarily FOB plant by truck and rail from the Company's plants shortly following production. While there are some temporary inventory accumulations at various port locations for export shipments, inventories rarely exceed three weeks’ production and, therefore, the Company uses limited working capital to carry inventories and reduces its exposure to fluctuations in commodity prices. Other factors that influence competition, markets and the prices that the Company receives for its finished products include the quality of the Company's finished products, consumer health consciousness, worldwide credit conditions and U.S. government foreign aid. From time to time, the Company enters into arrangements with its suppliers of raw materials pursuant to which these suppliers buy back the Company’s finished products. COMPETITION Management of the Company believes that the most competitive aspect of the business is the procurement of raw materials rather than the sale of finished products. During the last ten plus years, pronounced consolidation within the meat processing industry has resulted in bigger and more efficient slaughtering operations, the majority of which utilize “captive” processors (rendering operations integrated with the meat or poultry packing operation). Simultaneously, the number of small meat processors, which have historically been a dependable source of supply for non-captive processors, has decreased significantly. The slaughter rates in the meat processing industry have declined, and as a result the availability, quantity and quality of raw materials available to the independent processors from these sources have all decreased. These factors have been offset, in part, however, by increasing environmental consciousness. The need for food service establishments to comply with environmental regulations concerning the proper disposal of used restaurant cooking oil should continue to provide a growth area for this raw material source. The rendering and restaurant services industries are highly fragmented and very competitive. The Company competes with other rendering and restaurant services businesses and alternative methods of disposal of animal processing by-products and used restaurant cooking oil provided by trash haulers, waste management companies and bio-diesel companies, as well as the alternative of illegal disposal. Major competitors for the collection of raw material include: Baker Commodities in the West and Griffin Industries in Texas and the Southeast. Each of these businesses competes in both the Rendering and Restaurant Services segments. Another major competitor in the restaurant services business is Restaurant Technologies, Inc. In marketing its finished products domestically and abroad, the Company faces competition from other processors and from producers of other suitable commodities. Tallows and greases are, in certain instances, substitutes for soybean oil and palm stearine, while MBM is a substitute for soybean meal. Consequently, the prices of BFT, YG and MBM correlate with these substitute commodities. The markets for finished products are impacted mainly by the worldwide supply of and demand for fats, oils, proteins and grains. SEASONALITY The amount of raw materials made available to the Company by its suppliers is relatively stable on a weekly basis except for those weeks which include major holidays, during which the availability of raw materials declines because major meat and poultry processors are not operating. Weather is also a factor. Extremely warm weather adversely affects the ability of the Company to make higher quality products because the raw material deteriorates more rapidly than in cooler weather, while extremely cold weather, in certain instances, can hinder the collection of raw materials. Weather can vary significantly from one year to the next and may impact comparability of operating results of the Company between periods.
Page 7

INTELLECTUAL PROPERTY The Company maintains valuable trademarks, service marks, copyrights, trade names, trade secrets, proprietary technologies and similar intellectual property, and considers its intellectual property to be of material value. The Company has registered or applied for registration of certain of its intellectual property, including the tricolor triangle used in the Company’s signage and logos and the names "Darling," "Darling Restaurant Services" and "CleanStar." The Company’s policy generally is to pursue intellectual property protection considered necessary or advisable. EMPLOYEES AND LABOR RELATIONS As of January 2, 2010, the Company employed approximately 1,820 persons full-time. Approximately 45% of the total number of employees are covered by collective bargaining agreements; however, the Company has no national or multi-plant union contracts. Management believes that the Company’s relations with its employees and their representatives are good. There can be no assurance, however, that new agreements will be reached without union action or will be on terms satisfactory to the Company. REGULATIONS
The Company is subject to the rules and regulations of various federal, state and local governmental agencies. Material rules and regulations and the applicable agencies include:
See Item 1A “Risk Factors – The Company’s business may be affected by the impact of BSE and other food safety issues,” for more information regarding certain FDA rules that affect the Company’s business, including changes to the BSE Feed Rule.
On December 30, 2003, the Secretary of Agriculture announced new beef slaughter/meat processing regulations to assure consumers of the safety of the meat supply. These regulations prohibit non-ambulatory animals from entering the food chain, require removal of specific risk materials at slaughter and prohibit carcasses from cattle tested for BSE from entering the food chain until the animals are shown negative for BSE.
On November 19, 2007, APHIS implemented revised import regulations that allowed Canadian cattle over 30 months of age and born after March 1, 1999 and bovine products derived from such cattle to be imported into the U.S. for any use. Imports of Canadian cattle younger than 30 months of age have been allowed since March 2005. Imports of SRM from Canadian born cattle slaughtered in Canada are not permitted.
• The Food and Drug Administration (“FDA”), which regulates food and feed safety. Effective August 1997, the FDA promulgated a rule prohibiting the use of mammalian proteins, with some exceptions, in feeds for cattle, sheep and other ruminant animals (21 CFR 589.2000, referred to herein as the “BSE Feed Rule”) to prevent further spread of BSE, commonly referred to as “mad cow disease.”On April 25, 2008, the FDA amended 21 CFR 589.2000 and added 21 CFR 589.2001 to prohibit the use of certain cattle materials in all feed and food for animals. These changes became effective on October 26, 2009. Company management believes the Company is in compliance with the provisions of these rules.
• The United States Department of Agriculture (“USDA”), which regulates collection and production methods. Within the USDA, two agencies exercise direct regulatory oversight of the Company’s activities:
– Animal and Plant Health Inspection Service (“APHIS”) certifies facilities and claims made for exported materials; establishes and enforces import requirements for live animals and animal products, and
– Food Safety Inspection Service (“FSIS”) regulates sanitation and food safety programs.
• The Environmental Protection Agency (“EPA”), which regulates air and water discharge requirements, as well as local and state agencies governing air and water discharge.
Page 8
These material rules and regulations and other rules and regulations promulgated by other agencies may influence the Company’s
operating results at one or more facilities. AVAILABLE INFORMATION Under the Securities Exchange Act of 1934, the Company is required to file annual, quarterly and special reports, proxy statements and other information with the SEC, which can be read and/or copies made at the SEC’s Public Reference Room at 100 F Street N.E., Room 1580, Washington D.C. 20549. Please call the SEC at 1-800-SEC-0330 for further information about the Public Reference Room. The SEC maintains a web site at http://www.sec.gov that contains reports, proxy and information statements, and other information regarding issuers that file electronically with the SEC. The Company files electronically with the SEC. The Company makes available, free of charge, through its investor relations web site, its reports on Forms 10-K, 10-Q and 8-K, and amendments to those reports, as soon as reasonably practicable after they are filed with, or furnished to, the SEC pursuant to Section 13(a) or 15(d) of the Exchange Act. The Company’s website is http://www.darlingii.com and the address for the Company’s investor relations web site is http://www.darlingii.com/investors.aspx . ITEM 1A. RISK FACTORS Any investment in the Company will be subject to risks inherent to the Company’s business. Before making an investment decision in the Company, you should carefully consider the risks described below together with all of the other information included in or incorporated by reference into this report. If any of the events described in the following risk factors actually occurs, the Company’s business, financial condition, prospects or results of operations could be materially and adversely affected. If any of these events occurs, the trading price of the Company’s securities could decline and you may lose all or part of your investment. The Company’s results of operations and cash flow may be reduced by decreases in the market price of its products. The Company’s finished products are commodities, the prices of which are quoted on established commodity markets. Accordingly, the Company’s results of operations will be affected by fluctuations in the prevailing market prices of these finished products. A significant decrease in the market price of the Company’s products would have a material adverse effect on the Company’s results of operations and cash flow. In addition, the Company’s principal products are not future exchange trading commodities.
• State Departments of Agriculture , which regulate animal by-product collection and transportation procedures and animal feed quality.
• The United States Department of Transportation (“USDOT”), as well as local and state agencies, which regulate the operation of the Company’s commercial vehicles.
• The Securities and Exchange Commission (“SEC”), which regulates securities and information required in annual and quarterly reports filed by publicly traded companies.
Page 9

The most competitive aspect of the Company’s business is the procurement of raw materials. The Company’s management believes that the most competitive aspect of the Company’s business is the procurement of raw materials rather than the sale of finished products. Pronounced consolidation within the meat packing industry has resulted in bigger and more efficient slaughtering operations, the majority of which utilize “captive” processors. Simultaneously, the number of small meat processors, which have historically been a dependable source of supply for non-captive processors, such as the Company, has decreased significantly. The slaughter rates in the meat processing industry have declined, and as a result the availability, quantity and quality of raw materials available to the independent processors from these sources have all decreased. In addition, the Company has seen an increase in the use of restaurant grease in the production of bio-diesel. Furthermore, the general performance of the U.S. economy, declining U.S. consumer confidence and the inability of consumers and companies to obtain credit due to the current lack of liquidity in the financial markets, could have a negative impact on the Company’s raw material volume, such as through the forced closure of raw material suppliers. A significant decrease in available raw materials or a closure of a raw material supplier could materially and adversely affect the Company’s business and results of operations including the carrying value of the Company’s assets. The rendering and restaurant services industry is highly fragmented and very competitive. The Company competes with other rendering and restaurant services businesses and alternative methods of disposal of animal processing by-products and used restaurant cooking oil provided by trash haulers, waste management companies and bio-diesel companies, as well as the alternative of illegal disposal. In addition, restaurants experience theft of used cooking oil. Depending on market conditions, the Company either charges a collection fee to offset a portion of the cost incurred in collecting raw material or will pay for the raw material. To the extent suppliers of raw materials look to alternate methods of disposal, whether as a result of the Company’s collection fees being deemed too expensive or otherwise, the Company’s raw material supply will decrease and the Company’s collection fee revenues will decrease, which could materially and adversely affect the Company’s business and results of operations. The Company is highly dependent on natural gas and diesel fuel. The Company’s operations are highly dependent on the use of natural gas and diesel fuel. The Company consumes significant volumes of natural gas to operate boilers in its plants to generate steam to heat raw material. Natural gas prices represent a significant cost of factory operation included in cost of sales. The Company also consumes significant volumes of diesel fuel to operate its fleet of tractors and trucks used to collect raw material. Diesel fuel prices represent a significant component of cost of collection expenses included in cost of sales. The Company continually manages these costs. Although prices for natural gas and diesel fuel remained relatively low during fiscal 2009 as compared to recent history, these prices can be volatile and there can be no assurance that these prices will not increase in the near future, thereby representing an ongoing challenge to the Company’s operating results for future periods. A material increase in energy prices for natural gas and diesel fuel over a sustained period of time could materially adversely affect the Company’s business, financial condition and results of operations. See Item 7, “Management’s Discussion and Analysis,” for a recent history of natural gas pricing. Certain of the Company’s 45 operating facilities are highly dependent upon a few suppliers. Certain of the Company’s rendering facilities are highly dependent on one or a few suppliers. Should any of these suppliers choose alternate methods of disposal, cease their operations, have their operations interrupted by casualty or otherwise cease using the Company’s collection services, these operating facilities may be materially and adversely affected, which could materially and adversely affect the Company’s business, earnings, balance sheet and/or cash flows. The Company’s business may be affected by worldwide government energy policies. Pursuant to the requirements established by the Energy Independence and Security Act of 2007 on February 3, 2010 the EPA finalized regulations for the National Renewable Fuel Standard Program (RFS2). The regulation mandates the domestic use of biomass-based diesel (biodiesel or renewable diesel) of 1.15 billion gallons in 2010, 0.8 billion gallons in 2011 and 1.0 billion gallons in 2012. Beyond 2012 the regulation requires a minimum of 1.0 billion gallons of biomass-based diesel for each year thru 2022, which amount is subject to increase by the EPA Secretary. Biomass-based diesel also qualifies to fulfill the non-specified portion of the advanced biofuel requirement. In order to qualify as a “renewable fuel” each type of fuel from each type of feedstock is required to lower greenhouse gas emissions (GHG) by levels specified in the regulation. The EPA has determined that biofuels (either biodiesel or renewable diesel) produced from waste oils, fats and greases result in an 86% reduction in GHG emissions exceeding the 50% requirement established by the regulation. Prices for the Company’s finished products may be impacted by worldwide government policies relating to renewable fuels and greenhouse gas emissions. Programs like RFS2 and tax credits for biofuels both in the U.S. and abroad may positively impact the demand for the Company’s finished products. Accordingly, changes to or discontinuing of these programs could have a negative impact on the Company’s business and results of operations.
Page 10

The Company may incur material costs and liabilities in complying with government regulations.
The Company is subject to the rules and regulations of various federal, state and local governmental agencies. Material rules and regulations and the applicable agencies include:
The applicable rules and regulations promulgated by these agencies may influence the Company’s operating results at one or more facilities. Furthermore, the loss of or failure to obtain necessary federal, state or local permits and registrations at one or more of the Company’s facilities could halt or curtail operations at impacted facilities, which could adversely affect the Company’s operating results. The Company’s failure to comply with applicable rules and regulations could subject it to: 1) administrative penalties and injunctive relief; 2) civil remedies, including fines, injunctions and product recalls; and 3) adverse publicity. There can be no assurance that the Company will not incur material costs and liabilities in connection with these rules and regulations. The Company is and may continue to be adversely affected by the ongoing world financial crisis.
The continuing turmoil existing in world financial, credit, commodities and stock markets may have a significant negative effect on the Company’s business. The Company’s forward view into the possible effects of this turmoil is limited. Among other things, the Company may be adversely impacted because its domestic and international customers and suppliers may not be able to access sufficient capital to continue to operate their businesses, or to operate them at prior levels. A decline in consumer confidence or changing patterns in the availability and use of disposable income by consumers can negatively affect both the Company’s suppliers and customers. Declining discretionary consumer spending or the loss or impairment of a meaningful number of the Company’s suppliers or customers could lead to a dislocation in either raw material availability or customer demand. Tightened credit supply could negatively affect the Company’s customers’ ability to pay for the Company’s products on a timely basis or at all, and could result in a requirement for additional bad debt reserves. Although many of the Company’s customer contracts are formula-based, continued volatility in the commodities markets could negatively impact the Company’s revenues and overall profits. Counter party risk on finished product sales can also impact revenue and operating profits when customers either are unable to obtain credit or refuse to take delivery of finished product due to market price declines. If the existing financial and credit crisis negatively impacts a lender in the Company’s credit facility, the ability of that lender to fund its portion of the commitment could be impaired. The inability of a lender to fund its committed portion of the facility does not excuse other lenders from funding their portions of the commitment.
• The FDA, which regulates food and feed safety;
• The USDA, including its agencies APHIS and FSIS, which regulates collection and production methods;
• The EPA, which regulates air and water discharge requirements, as well as local and state agencies governing air and water discharge;
• State Departments of Agriculture, which regulate animal by-product collection and transportation procedures and animal feed quality;
• The USDOT, as well as local and state transportation agencies, which regulate the operation of the Company’s commercial vehicles; and
• The SEC, which regulates securities and information required in annual and quarterly reports filed by publicly traded companies.
Page 11

Multi-employer defined benefit pension plans to which the Company contributes may be under-funded.
The Company contributes to several multi-employer defined benefit pension plans based on obligations arising under collective bargaining agreements covering union-represented employees. The Company does not manage these multi-employer plans. Based upon the most currently available information from plan administrators, some of which information is more than a year old, the Company believes that some of these multi-employer plans are under-funded due partially to a decline in the value of the assets supporting these plans, a reduction in the number of actively participating members for whom employer contributions are required and the level of benefits provided by the plans. In addition, the Pension Protection Act, enacted in August 2006, went into effect in January 2008 and requires under-funded pension plans to improve their funding ratios within prescribed intervals based on the level of their under-funding. As a result, the Company’s required contributions to these plans may increase in the future. Furthermore, under current law regarding multi-employer defined benefit plans, any of a plan’s termination, the Company’s voluntary withdrawal from any under-funded plan, or the mass withdrawal of all contributing employers from any under-funded multi-employer defined benefit plan, would require the Company to make payments to the plan for the Company’s proportionate share of the multi-employer plan’s unfunded vested liabilities. Moreover, if a multi-employer defined benefit plan fails to satisfy certain minimum funding requirements, the Internal Revenue Service may impose a nondeductible excise tax of 5% on the amount of the accumulated funding deficiency for those employers contributing to the fund. Requirements to pay increased contributions, withdrawal liability and excise taxes could negatively impact the Company’s liquidity and results of operations. The Company’s business may be affected by the impact of BSE and other food safety issues.
Effective August 1997, the FDA promulgated the BSE Feed Rule in an effort to prevent the spread of BSE. Detection of the first case of BSE in the U.S. in December 2003 resulted in additional U.S. government regulations, finished product export restrictions by foreign governments, market price fluctuations for the Company’s finished products and reduced demand for beef and beef products by consumers. Even though the export markets for U.S. beef have been significantly re-opened, most of these markets remain closed to MBM derived from U.S. beef. Continued concern about BSE in the U.S. may result in additional regulatory and market related challenges that may affect the Company’s operations or increase the Company’s operating costs.
The following are recent developments and recent regulatory history with respect to BSE in the U.S.:
• Enforcement of the rule “ Substances Prohibited From Use in Animal Food or Feed ” (the “Final BSE Rule”), which FDA published on April 25, 2008, began on October 26, 2009. The Final BSE Rule amended 21 CFR 589.2000 and added 21 CFR 589.2001 to prohibit the use of certain cattle materials in all feed and food for animals. Such prohibited cattle materials include: (1) the entire carcass of cattle positive for BSE; (2) brain and spinal cord from cattle aged 30 months and older; (3) the entire carcass of cattle aged 30 months and older that were not inspected and passed for human consumption and from which the brain and spinal cord were not or cannot be “effectively” removed; and (4) tallow derived from the listed prohibited cattle materials unless such tallow contains no more than 0.15% insoluble impurities. The Final BSE Rule also prohibits the use of tallow derived from any cattle materials in feed for cattle and other ruminant animals, if such tallow contains more than 0.15% insoluble impurities. Except for these new restrictions on tallow, materials derived from cattle younger than 30 months of age and not positive for BSE are not affected by the Final BSE Rule and may still be used in feed and food for animals pursuant to 21 CFR 589.2000. The insoluble impurity restrictions for tallow, however, do not affect its use in feed for poultry, pigs and other non-ruminant animals, unless such tallow was derived from the cattle materials prohibited by the Final BSE Rule. After completing previously published drafts, the FDA finalized its Guidance for Industry on compliance with the Final BSE Rule on May 6, 2009. The Company has made capital expenditures and implemented new processes and procedures to be compliant with the Final BSE Rule at all of its operations. Based on the foregoing, while the Company acknowledges that unanticipated issues may arise as the FDA implements the Final BSE Rule and conducts compliance inspections, the Company does not currently anticipate that the Final BSE Rule will have a significant impact on its operations or financial performance. Notwithstanding the foregoing, the Company can provide no assurance that unanticipated costs and/or reductions in raw material volumes related to the Company’s implementation of and compliance with the Final BSE Rule will not negatively impact the Company’s operations and financial performance.
Page 12

The occurrence of BSE in the U.S. may result in additional finished product export restrictions by foreign governments, market price fluctuations for the Company’s finished products and/or reduced demand for beef and beef products by consumers. Legislative and regulatory efforts to address BSE concerns and preempt adulterations of feed ingredients, may result in additional U.S. government regulations and/or increase the Company’s operating costs.
The following are recent developments with respect to human food, pet food and animal feed safety:
Restrictions imposed by the Company’s credit agreement and future debt agreements may limit its ability to finance future operations or capital needs or engage in other business activities that may be in the Company’s interest.
The Company’s credit agreement currently, and future debt agreements may, restrict its ability to:
• The Food and Drug Administration Amendments Act of 2007 (“the Act”) was signed into law on September 27, 2007 as a result of Congressional concern for pet and livestock food safety, following the discovery of adulterated imported pet and livestock food in March 2007. The Act directs the Secretary of Health and Human Services (“HHS”) and the FDA to promulgate significant new requirements for the pet food and animal feed industries. As a prerequisite to new requirements specified by the Act, the FDA was directed to establish a Reportable Food Registry , which was implemented on September 8, 2009. On June 11, 2009, the FDA issued “ Guidance for Industry: Questions and Answers Regarding the Reportable Food Registry as Established by the Food and Drug Administration Amendments Act of 2007: Draft Guidance” . Stakeholder comments and questions about the Reportable Food Registry that were submitted to the docket or during public meetings were incorporated into a second draft guidance, which was published on September 8, 2009. In this most recent draft guidance, the FDA defined a reportable food, which the manufacturer or distributor would be required to report in the Reportable Food Registry, to include materials used as ingredients in animal feeds and pet foods, if there is reasonable probability that the use of such materials will cause serious adverse health consequences or death to humans or animals. The impact of the Act and implementation of the Reportable Food Registry on the Company, if any, will not be clear until the FDA finalizes its guidance and clarifies certain interpretive and enforcement issues pertaining to the treatment of animal feed and pet food under the Act. As of February 24, 2010, the FDA’s guidance for compliance to the Reportable Food Registry had not been finalized. The Company believes that it has adequate procedures in place to assure that its finished products are safe to use in animal feed and pet food and does not currently anticipate that the Act will have a significant impact on its operations or financial performance.
• On November 7, 2007, the FDA released its Food Protection Plan (the “2007 Plan”), which describes strategies the FDA proposes to use for improving food and animal feed safety and the additional resources and authorities that, in the FDA’s opinion, are needed to implement the 2007 Plan for imported and domestically produced ingredients and products. Legislation will be necessary for the FDA to obtain these additional authorities. While food and feed safety issues continue to be debated by Congress, it has not granted such new authorities to the FDA as of February 24, 2010.
• incur additional indebtedness;
• pay dividends and make other distributions;
• make restricted payments;
• create liens;
• merge, consolidate or acquire other businesses;
• sell or otherwise dispose of assets;
• make investments, loans and advances;
• guarantee indebtedness or other obligations;
• enter into operating leases or sale-leaseback, synthetic leases, or similar transactions;
• make changes to its capital structure; and
• engage in new lines of business unrelated to the Company’s current businesses.
Page 13

These terms may negatively impact the Company’s ability to finance future operations, implement its business strategy, fund its capital needs or engage in other business activities that may be in its interest. In addition, the Company’s credit agreement requires, and future indebtedness may require, the Company to maintain compliance with specified financial ratios. Although the Company is currently in compliance with the financial ratios and does not plan on engaging in transactions that may cause the Company not to be in compliance with the ratios, its ability to comply with these ratios may be affected by events beyond its control, including the risks described in the other risk factors and elsewhere in this report. A breach of any restrictive covenant or the Company’s inability to comply with any required financial ratio could result in a default under the credit agreement. In the event of a default under the credit agreement, the lenders under the credit agreement may elect to declare all borrowings outstanding, together with accrued and unpaid interest and other fees, to be immediately due and payable. The lenders will also have the right in these circumstances to terminate any commitments they have to provide further financing, including under the revolving credit facility. If the Company is unable to repay these borrowings when due, whether as a result of acceleration of the debt or otherwise, the lenders under the credit agreement will have the right to proceed against the collateral, which consists of substantially all of the Company’s assets, including real property and cash. If the indebtedness under the credit agreement were accelerated, the Company’s assets may be insufficient to repay this indebtedness in full under those circumstances. Any future credit agreements or other agreement relating to the Company’s indebtedness to which the Company may become a party may include the covenants described above and other restrictive covenants. The Company’s business may be negatively impacted by the occurrence of any disease correctly or incorrectly linked to animals.
The emergence of 2009 H1N1 flu (initially know as “Swine Flu”) in North America during the spring of 2009 was initially linked to hogs even though hogs have not been determined to be the source of the outbreak in humans. The 2009 H1N1 flu has since spread to affect the human populations in countries throughout the world, although as of the date of this report its severity is similar to seasonal flu and it has had little impact on hog production. Management does not believe that the 2009 H1N1 flu will have a material impact on the operations of the Company; however, an increase in the severity of the 2009 H1N1 flu or the occurrence of any other disease that is correctly or incorrectly linked to animals and which has a negative impact on meat consumption or animal production could have a negative impact on the volume of raw materials available to the Company or the demand for the Company’s finished products. Another such animal disease is avian influenza (“H5N1”), or Bird Flu, which is a highly contagious disease affecting chickens and other poultry species throughout Asia and Europe. The H5N1 strain is highly pathogenic, which has caused concern that a pandemic could occur if the disease migrates from birds to humans. This highly pathogenic strain has not been detected in North or South America as of February 24, 2010, but low pathogenic strains that are not a threat to human health have occurred in the U.S. and Canada in recent years. The U.S. Department of Agriculture (“USDA”) has developed safeguards to protect the U.S. poultry industry from H5N1. These safeguards are based on import restrictions, disease surveillance and a response plan for isolating and depopulating infected flocks if the disease is detected. Notwithstanding these safeguards, any significant outbreak of Bird Flu in the U.S. could have a negative impact on the Company’s business by reducing demand for MBM. The Company’s success is dependent on the Company’s key personnel. The Company’s success depends to a significant extent upon a number of key employees, including members of senior management. The loss of the services of one or more of these key employees could have a material adverse effect on the Company’s results of operations and prospects. The Company believes that its future success will depend in part on its ability to attract, motivate and retain skilled technical, managerial, marketing and sales personnel. Competition for these types of skilled personnel is intense and there can be no assurance that the Company will be successful in attracting, motivating and retaining key personnel. The failure to hire and retain these personnel could materially adversely affect the Company’s business and results of operations.
Page 14

In certain markets the Company is highly dependent upon the continued and uninterrupted operation of a single operating facility.
Darling’s facilities are subject to various federal, state and local environmental and other permitting requirements, depending on their locations. Periodically, these permits may be reviewed and subject to amendment or withdrawal. Applications for an extension or renewal of various permits may be subject to challenge by community and environmental activists and others. In the event of a casualty, condemnation, work stoppage, permitting withdrawal or delay or other unscheduled shutdown involving one of the Company’s facilities, in a majority of the Company’s markets the Company would utilize a nearby operating facility to continue to serve its customers in the affected market. In certain markets, however, the Company does not have alternate operating facilities. In the event of a casualty, condemnation, work stoppage, permitting withdrawal or delay or other unscheduled shutdown in these markets, the Company may experience an interruption in its ability to service its customers and to procure raw materials. This may materially and adversely affect the Company’s business and results of operations in those markets. In addition, after an operating facility affected by a casualty, condemnation, work stoppage, permitting withdrawal or delay or other unscheduled shutdown is restored, there could be no assurance that customers who in the interim choose to use alternative disposal services would return to use the Company’s services. The market price of the Company’s common stock could be volatile. The market price of the Company’s common stock has been subject to volatility and, in the future, the market price of the Company’s common stock could fluctuate widely in response to numerous factors, many of which are beyond the Company’s control. These factors include, among other things, fluctuations in commodities prices, actual or anticipated variations in the Company’s operating results, earnings releases by the Company, changes in financial estimates by securities analysts, sales of substantial amounts of the Company’s common stock, performance of joint venture investments, market conditions in the industry and the general state of the securities markets, governmental legislation or regulation, currency and exchange rate fluctuations, as well as general economic and market conditions, such as recessions. The Company’s ability to pay any dividends on its common stock may be limited. The Company has not paid any dividends on its common stock since January 3, 1989. The Company’s current financing arrangements permit the Company to pay cash dividends on its common stock within limitations defined in its credit agreement. Any future determination to pay cash dividends on the Company’s common stock will be at the discretion of the Company’s board of directors and will be based upon the Company’s financial condition, operating results, capital requirements, plans for expansion, restrictions imposed by any financing arrangements, and any other factors that the board of directors determines are relevant. Furthermore, the Company’s ability to pay any cash or non-cash dividends on its common stock is subject to applicable provisions of state law and to the terms of its credit agreement. The Company may issue additional common stock or preferred stock, which could dilute shareholder interests. The Company’s certificate of incorporation, as amended, does not limit the issuance of additional common stock or the issuance of preferred stock. As of February 24, 2010, the Company has available for issuance 17,370,030 authorized but unissued shares of common stock and 1,000,000 authorized but unissued shares of preferred stock that may be issued in series.
Page 15

The Company could incur a material weakness in its internal control over financial reporting that requ ires remediation.
The Company’s disclosure controls and procedures were deemed to be effective in fiscal 2009. However, any future failures by the Company to maintain the effectiveness of its disclosure controls and procedures, including its internal control over financial reporting, could subject the Company to a loss of public confidence in its internal control over financial reporting and in the integrity of the Company’s public filings and financial statements and could harm the Company’s operating results or cause the Company to fail to timely meet its regulatory reporting obligations. Consequences of a material weakness such as those listed in the foregoing sentence could have a negative effect on the trading price of the Company’s stock. Terrorist attacks or acts of war may cause damage or disruption to the Company and its employees, facilities, information systems, security systems, suppliers and customers, which could significantly impact the Company’s net sales, costs and expenses and financial condition. Terrorist attacks, such as those that occurred on September 11, 2001, have contributed to economic instability in the U.S., and further acts of terrorism, bioterrorism, violence or war could affect the markets in which the Company operates, the Company’s business operations, the Company’s expectations and other forward-looking statements contained or incorporated in this report. The threat of terrorist attacks in the U.S. since September 11, 2001 continues to create many economic and political uncertainties. The potential for future terrorist attacks, the U.S. and international responses to terrorist attacks and other acts of war or hostility, including the ongoing war in Iraq, may cause greater uncertainty and cause the Company’s business to suffer in ways that cannot currently be predicted. Events such as those referred to above could cause or contribute to a general decline in investment valuations, which in turn could reduce the market value of shareholder investments. In addition, terrorist attacks, particularly acts of bioterrorism, that directly impact the Company’s facilities or those of the Company’s suppliers or customers could have an impact on the Company’s sales, supply chain, production capability and costs and the Company’s ability to deliver its finished products. ITEM 1B. UNRESOLVED STAFF COMMENTS
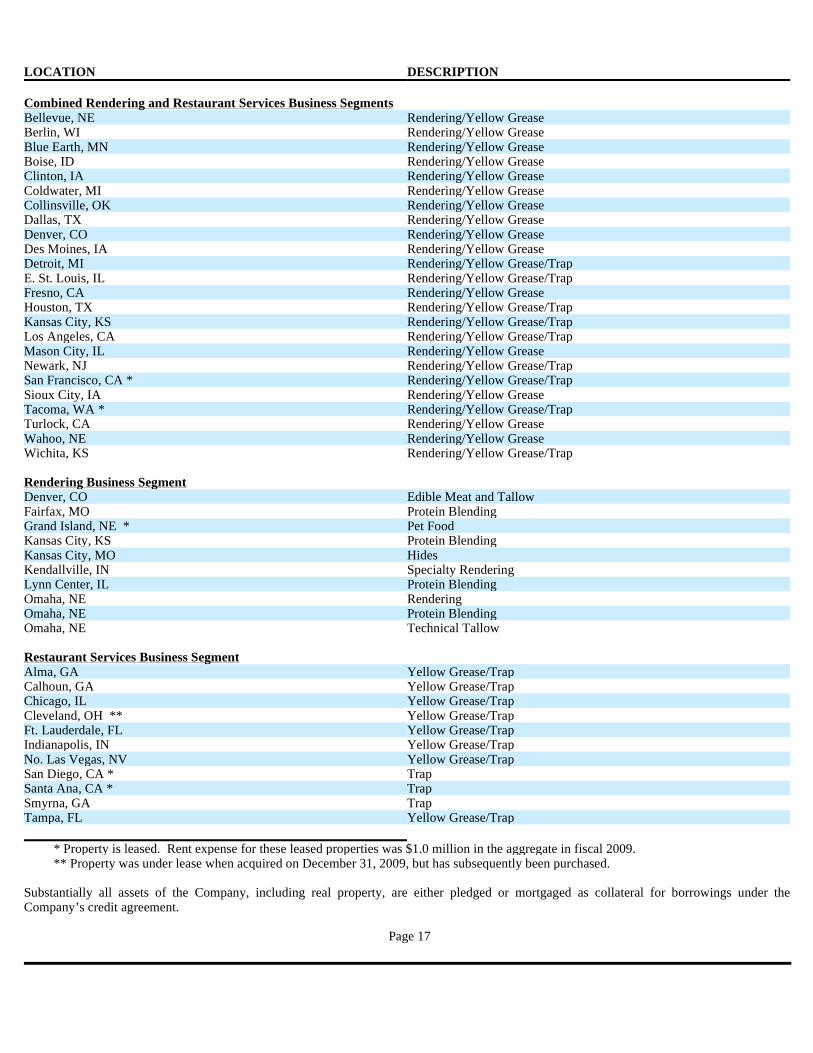
None. ITEM 2. PROPERTIES The Company’s corporate headquarters is located at 251 O’Connor Ridge Boulevard, Suite 300, Irving, Texas, in an office facility where the Company leases approximately 27,000 square feet. As of January 2, 2010, the Company’s 45 operating facilities consisted of 25 full service rendering plants, eight yellow grease/trap plants, four blending plants, three trap plants, one edible meat plant, one technical tallow plant, one hide plant, one pet food plant and one specialty rendering plant. All of these facilities are owned except for six leased facilities, one of which was under lease when acquired, but has subsequently been purchased prior to the filing of this report on Form 10-K. In addition, the Company owns or leases 36 transfer stations in the U.S., some of which also process yellow grease and trap. These transfer stations serve as collection points for routing raw material to the processing plants set forth below. Some locations service a single business segment while others service both business segments. The following is a listing of the Company’s operating facilities by business segment:
Page 16
Combined Rendering and Restaurant Services Business Segments
Rendering Business Segment
Restaurant Services Business Segment
Substantially all assets of the Company, including real property, are either pledged or mortgaged as collateral for borrowings under the Company’s credit agreement.
LOCATION DESCRIPTION
Bellevue, NE Rendering/Yellow Grease Berlin, WI Rendering/Yellow Grease Blue Earth, MN Rendering/Yellow Grease Boise, ID Rendering/Yellow Grease Clinton, IA Rendering/Yellow Grease Coldwater, MI Rendering/Yellow Grease Collinsville, OK Rendering/Yellow Grease Dallas, TX Rendering/Yellow Grease Denver, CO Rendering/Yellow Grease Des Moines, IA Rendering/Yellow Grease Detroit, MI Rendering/Yellow Grease/Trap E. St. Louis, IL Rendering/Yellow Grease/Trap Fresno, CA Rendering/Yellow Grease Houston, TX Rendering/Yellow Grease/Trap Kansas City, KS Rendering/Yellow Grease/Trap Los Angeles, CA Rendering/Yellow Grease/Trap Mason City, IL Rendering/Yellow Grease Newark, NJ Rendering/Yellow Grease/Trap San Francisco, CA * Rendering/Yellow Grease/Trap Sioux City, IA Rendering/Yellow Grease Tacoma, WA * Rendering/Yellow Grease/Trap Turlock, CA Rendering/Yellow Grease Wahoo, NE Rendering/Yellow Grease Wichita, KS Rendering/Yellow Grease/Trap
Denver, CO Edible Meat and Tallow Fairfax, MO Protein Blending Grand Island, NE * Pet Food Kansas City, KS Protein Blending Kansas City, MO Hides Kendallville, IN Specialty Rendering Lynn Center, IL Protein Blending Omaha, NE Rendering Omaha, NE Protein Blending Omaha, NE Technical Tallow
Alma, GA Yellow Grease/Trap Calhoun, GA Yellow Grease/Trap Chicago, IL Yellow Grease/Trap Cleveland, OH ** Yellow Grease/Trap Ft. Lauderdale, FL Yellow Grease/Trap Indianapolis, IN Yellow Grease/Trap No. Las Vegas, NV Yellow Grease/Trap San Diego, CA * Trap Santa Ana, CA * Trap Smyrna, GA Trap Tampa, FL Yellow Grease/Trap * Property is leased. Rent expense for these leased properties was $1.0 million in the aggregate in fiscal 2009. ** Property was under lease when acquired on December 31, 2009, but has subsequently been purchased.
Page 17

ITEM 3. LEGAL PROCEEDINGS The Company is a party to several lawsuits, claims and loss contingencies arising in the ordinary course of its business, including assertions by certain regulatory and governmental agencies related to permitting requirements and air, wastewater and storm water discharges from the Company’s processing facilities. The Company’s workers compensation, auto and general liability policies contain significant deductibles or self-insured retentions. The Company estimates and accrues its expected ultimate claim costs related to accidents occurring during each fiscal year and carries this accrual as a reserve until these claims are paid by the Company. As a result of the matters discussed above, the Company has established loss reserves for insurance, environmental and litigation matters. At January 2, 2010 and January 3, 2009, the reserves for insurance, environmental and litigation contingencies reflected on the balance sheet in accrued expenses and other non-current liabilities for which there are no potential insurance recoveries were approximately $15.6 million and $17.3 million, respectively. Management of the Company believes these reserves for contingencies are reasonable and sufficient based upon present governmental regulations and information currently available to management; however, there can be no assurance that final costs related to these matters will not exceed current estimates. The Company believes that the likelihood is remote that any additional liability from these lawsuits and claims that may not be covered by insurance would have a material effect on the financial statements. Lower Passaic River Area . The Company has been named as a third party defendant in a lawsuit pending in the Superior Court of New Jersey, Essex County, styled New Jersey Department of Environmental Protection, The Commissioner of the New Jersey Department of Environmental Protection Agency and the Administrator of the New Jersey Spill Compensation Fund, as Plaintiffs, vs. Occidental Chemical Corporation, Tierra Solutions, Inc., Maxus Energy Corporation, Repsol YPF, S.A., YPF, S.A., YPF Holdings, Inc., and CLH Holdings, as Defendants (Docket No. L-009868-05) (the “Tierra/Maxus Litigation”). In the Tierra/Maxus Litigation, which was filed on December 13, 2005, the plaintiffs seek to recover from the defendants past and future cleanup and removal costs, as well as unspecified economic damages, punitive damages, penalties and a variety of other forms of relief, purportedly arising from the alleged discharges into the Passaic River of a particular type of dioxin and other unspecified hazardous substances. The damages being sought by the plaintiffs from the defendants are likely to be substantial. On February 4, 2009, two of the defendants, Tierra Solutions, Inc. (“Tierra”) and Maxus Energy Corporation (“Maxus”), filed a third party complaint against over 300 entities, including the Company, seeking to recover all or a proportionate share of cleanup and removal costs, damages or other loss or harm, if any, for which Tierra or Maxus may be held liable in the Tierra/Maxus Litigation. Tierra and Maxus allege that Standard Tallow Company, an entity that the Company acquired in 1996, contributed to the discharge of the hazardous substances that are the subject of this case while operating a former plant site located in Newark, New Jersey. The Company is investigating these allegations, has entered into a joint defense agreement with many of the other third-party defendants and intends to defend itself vigorously. Additionally, in December 2009, the Company, along with numerous other entities, received notice from the United States Environmental Protection Agency (EPA) that the Company (as successor-in-interest to Standard Tallow Company) is considered a potentially responsible party with respect to alleged contamination in the lower Passaic River area which is part of the Diamond Alkali Superfund Site located in Newark, New Jersey. In the letter, EPA requested that the Company join a group of other parties in funding a remedial investigation and feasibility study at the site. As of the date of this report, the Company has not agreed to participate in the funding group. The Company’s ultimate liability for investigatory costs, remedial costs and/or natural resource damages in connection with the lower Passaic River area cannot be determined at this time; however, as of the date of this report, there is nothing that leads the Company to believe that these matters will have a material effect on the Company’s financial position or results of operation. ITEM 4. SUBMISSION OF MATTERS TO A VOTE OF SECUR ITY HOLDERS No matters were submitted to a vote of security holders during the quarter ended January 2, 2010.
Page 18

PART II ITEM 5. MARKET FOR REGISTRANT’S COMMON EQUITY, REL ATED STOCKHOLDER MATTERS AND ISSUER PURCHASES OF EQUITY SECURITIES The Company’s common stock is traded on the New York Stock Exchange (“NYSE”) under the symbol “DAR”. The following table sets forth, for the quarters indicated, the high and low closing sales prices per share for the Company’s common stock as reported on the NYSE.
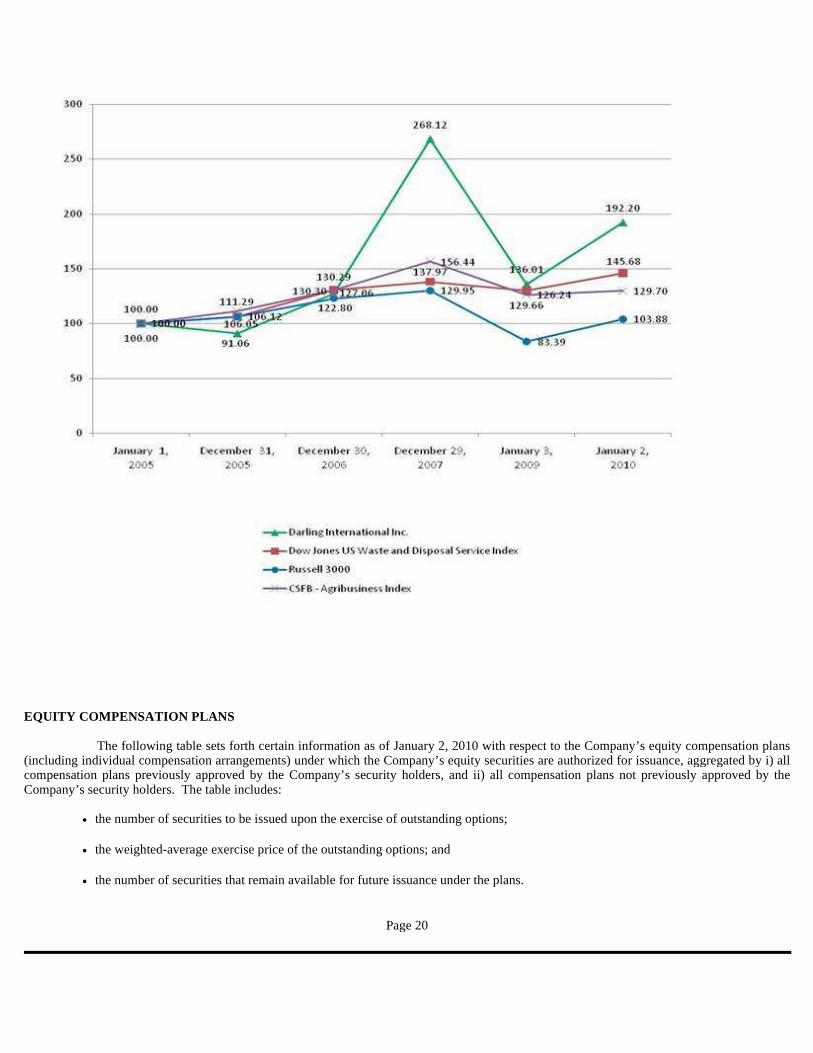
On February 24, 2010, the closing sales price of the Company’s common stock on the NYSE was $8.31. The Company has been notified by its stock transfer agent that as of February 24, 2010, there were 120 holders of record of the common stock. The Company has not paid any dividends on its common stock since January 3, 1989 and does not expect to pay cash dividends in 2010. The Company’s current financing arrangements permit the Company to pay cash dividends on its common stock within limitations defined in its credit agreement. Any future determination to pay cash dividends on the Company’s common stock will be at the discretion of the Company’s board of directors and will be based upon the Company’s financial condition, operating results, capital requirements, plans for expansion, restrictions imposed by any financing arrangements, and any other factors that the board of directors determines are relevant. Set forth below is a line graph comparing the change in the cumulative total stockholder return on the Company’s common stock with the cumulative total return of the Russell 3000 Index, the Dow Jones US Waste and Disposal Service Index, and the CSFB-Agribusiness Index for the period from January 1, 2005 to January 2, 2010, assuming the investment of $100 on January 1, 2005 and the reinvestment of dividends. The stock price performance shown on the following graph only reflects the change in the Company’s stock price relative to the noted indices and is not necessarily indicative of future price performance.
Market Price
Fiscal Quarter High Low 2009: First Quarter $ 6.39 $ 2.94 Second Quarter $ 8.24 $ 4.14 Third Quarter $ 8.13 $ 6.33 Fourth Quarter $ 8.39 $ 6.80 2008: First Quarter $14.29 $ 10.16 Second Quarter $17.29 $ 12.33 Third Quarter $17.15 $ 10.79 Fourth Quarter $11.11 $ 3.53
Page 19
EQUITY COMPENSATION PLANS The following table sets forth certain information as of January 2, 2010 with respect to the Company’s equity compensation plans (including individual compensation arrangements) under which the Company’s equity securities are authorized for issuance, aggregated by i) all compensation plans previously approved by the Company’s security holders, and ii) all compensation plans not previously approved by the Company’s security holders. The table includes:
• the number of securities to be issued upon the exercise of outstanding options;
• the weighted-average exercise price of the outstanding options; and
• the number of securities that remain available for future issuance under the plans.
Page 20

Plan Category
(a) Number of securities
to be issued upon exercise of outstanding
options, warrants and rights
(b) Weighted-average exercise price of
outstanding options, warrants
and rights
(c) Number of securities remaining available for future issuance
under equity compensation plans (excluding securities
reflected in column (a)) Equity compensation plans approved by security holders
810,205 (1)
$3.75
2,906,738
Equity compensation plans not approved by security holders
– – –
Total 810,205 $3.75 2,906,738
(1) Includes shares underlying options that have been issued pursuant to the Company’s 2004 Omnibus Incentive Plan (the “2004 Plan”) as approved by the Company’s stockholders. See Note 12 of Notes to Consolidated Financial Statements for information regarding the material features of the 2004 Plan.
Page 21

ITEM 6. SELECTED FINANCIAL DATA
SELECTED HISTORICAL CONSOLIDATED FINANCIAL DATA
The following table presents selected consolidated historical financial data for the periods indicated. The selected historical consolidated financial data set forth below should be read in conjunction with “Management’s Discussion and Analysis of Financial Condition and Results of Operations” and the Consolidated Financial Statements of the Company for the three years ended January 2, 2010, January 3, 2009, and December 29, 2007, and the related notes thereto.
(dollars in thousands, except per share data)
Fiscal 2009 Fiscal 2008 Fiscal 2007 Fiscal 2006 Fiscal 2005 Fifty-two
Weeks Ended January 2, 2010 (i)
Fifty-three Weeks Ended
January 3, 2009 (h)
Fifty-two Weeks Ended December 29,
2007
Fifty-two Weeks Ended December 30,
2006 (g)
Fifty-two Weeks Ended December 31,
2005
Statement of Operations Data: Net sales $ 597,806 $ 807,492 $ 645,313 $ 406,990 $ 308,867 Cost of sales and operating expenses 440,111 614,708 483,453 321,416 241,707 Selling, general and administrative expenses (a) 61,530 59,761 57,999 45,649 35,240 Depreciation and amortization 25,226 24,433 23,214 20,686 15,787 Goodwill impairment(b) - 15,914 - - -
Operating income 70,939 92,676 80,647 19,239 16,133 Interest expense 3,105 3,018 5,045 7,184 6,157 Other (income)/expense, net (c) 955 (258 ) 570 4,682 (903 ) Income from continuing operations before income
taxes 66,879 89,916 75,032 7,373 10,879 Income tax expense 25,089 35,354 29,499 2,266 3,184 Income from continuing operations 41,790 54,562 45,533 5,107 7,695 Income/(loss) from discontinued operations, net of tax - - - - 46 Net Income $ 41,790 $ 54,562 $ 45,533 $ 5,107 $ 7,741 Basic earnings per common share (d) $ 0.51 $ 0.67 $ 0.56 $ 0.07 $ 0.12 Diluted earnings per common share (d) $ 0.51 $ 0.66 $ 0.56 $ 0.07 $ 0.12 Weighted average shares outstanding (d) 82,142 81,685 81,091 74,310 63,929 Diluted weighted average shares outstanding (d) 82,475 82,246 81,916 75,259 64,525
Other Financial Data: Adjusted EBITDA (e) $ 96,165 $ 133,023 $ 103,861 $ 39,925 $ 31,920 Depreciation 21,398 19,266 18,332 16,134 11,903 Amortization 3,828 5,167 4,882 4,552 3,884 Capital expenditures (f) 23,638 31,006 15,552 11,800 21,406
Balance Sheet Data: Working capital $ 75,100 $ 67,446 $ 34,385 $ 17,865 $ 40,407 Total assets 426,171 394,375 351,338 320,806 190,772 Current portion of long-term debt 5,009 5,000 6,250 5,004 5,026 Total long-term debt less current portion 27,539 32,500 37,500 78,000 44,502 Stockholders’ equity 284,877 236,578 200,984 151,325 73,680
(a) Included in selling, general and administrative expenses is a loss on a legal settlement of approximately $2.2 million offset by a gain on a separate legal settlement of approximately $1.0 million in fiscal 2007.
(b) Includes a goodwill impairment charge of $15.9 million in the fourth quarter of fiscal 2008.
(c) Included in other (income)/expense in fiscal 2006 is a write-off of deferred loan costs of approximately $2.6 million and early retirement fees of approximately $1.9 million for the early retirement of senior subordinated notes and termination of the previous senior credit agreement.
(d) The Company has prepared the current period earnings per share computations and retrospectively only revised the Company’s comparative prior period computations for fiscal 2008 and 2007 to include in basic and diluted earnings per share non-vested and restricted share awards considered participating securities as a result of the Company’s January 4, 2009 adoption of the provisions of the Financial Accounting Standards Board’s (“FASB”) Accounting Standards Codification™ (ASC) Topic 260, Earnings Per Share pertaining to

whether instruments granted in share-based payment transactions are participating securities prior to vesting and therefore, need to be included in the earnings allocation in computing earnings per share under the two class method.
Page 22

Reconciliation of Net Income to Adjusted EBITDA
(e) Adjusted EBITDA is presented here not as an alternative to net income, but rather as a measure of the Company’s operating performance and is not intended to be a presentation in accordance with generally accepted accounting principles (GAAP). Since EBITDA is not calculated identically by all companies, the presentation in this report may not be comparable to those disclosed by other companies.
Adjusted EBITDA is calculated below and represents, for any relevant period, net income/(loss) plus depreciation and amortization, goodwill and long-lived asset impairment, interest expense, (income)/loss from discontinued operations, net of tax, income tax provision and other income/(expense). The Company believes adjusted EBITDA is a useful measure for investors because it is frequently used by securities analysts, investors and other interested parties in the evaluation of companies in our industry. In addition, management believes that adjusted EBITDA is useful in evaluating our operating performance compared to that of other companies in our industry because the calculation of adjusted EBITDA generally eliminates the effects of financing, income taxes and certain non-cash and other items that may vary for different companies for reasons unrelated to overall operating performance. As a result, the Company’s management uses adjusted EBITDA as a measure to evaluate performance and for other discretionary purposes. However, adjusted EBITDA is not a recognized measurement under U.S. GAAP, should not be considered as an alternative to net income as a measure of operating results or to cash flow as a measure of liquidity, and is not intended to be a presentation in accordance with GAAP. Also, since adjusted EBITDA is not calculated identically by all companies, the presentation in this report may not be comparable to those disclosed by other companies.
In addition to the foregoing, management also uses or will use adjusted EBITDA to measure compliance with certain financial covenants under the Company’s credit agreement. The amounts shown below for adjusted EBITDA differ from the amounts calculated under similarly titled definitions in the Company’s credit agreement, as those definitions permit further adjustment to reflect certain other non-cash charges.
(dollars in thousands)
January 2, 2010
January 3, 2009
December 29,
2007
December 30,
2006
December 31,
2005 Net income $ 41,790 $ 54,562 $ 45,533 $ 5,107 $ 7,741
Depreciation and amortization 25,226 24,433 23,214 20,686 15,787 Goodwill impairment - 15,914 - - - Interest expense 3,105 3,018 5,045 7,184 6,157 (Income)/loss from discontinued operations, net of tax - - - - (46 ) Income tax expense 25,089 35,354 29,499 2,266 3,184 Other (income)/expense 955 (258 ) 570 4,682 (903 ) Adjusted EBITDA $ 96,165 $ 133,023 $ 103,861 $ 39,925 $ 31,920
(f) Excludes the capital assets acquired as part of acquiring substantially all of the assets of NBP of approximately $51.9 million in fiscal 2006 and API Recycling’s used cooking oil collection business of $3.4 million in fiscal 2008. Also excludes the capital assets acquired in fiscal 2009 from Boca Industries, Inc. and Sanimax USA, Inc. of approximately $8.0 million.
(g) Fiscal 2006 includes 33 weeks of contribution from the acquired NBP assets.
(h) Fiscal 2008 includes 19 weeks of contribution from the API Recycling used cooking oil collection business.
(i) Fiscal 2009 includes 45 weeks of contribution from the acquired assets of Boca Industries, Inc. and does not include any contribution from assets acquired from Sanimax USA, Inc. as the acquisition occurred on December 31, 2009.
Page 23

The following Management’s Discussion and Analysis of Financial Condition and Results of Operations contains forward-looking statements that involve risks and uncertainties. The Company’s actual results could differ materially from those anticipated in these forward-looking statements as a result of certain factors, including those set forth in Item 1A of this report under the heading “Risk Factors.” The following discussion should be read in conjunction with the historical consolidated financial statements and notes thereto included in Item 8 of this report. The Company is organized along two operating business segments, Rendering and Restaurant Services. See Note 18 of Notes to Consolidated Financial Statements. Overview The Company is a leading provider of rendering, recycling and recovery solutions to the nation’s food industry. The Company collects and recycles animal by-products and used cooking oil from food service establishments and provides grease trap cleaning services to many of the same establishments. The Company processes raw materials at 45 facilities located throughout the U.S. into finished products such as protein (primarily meat and bone meal, “MBM”), tallow (primarily bleachable fancy tallow, “BFT”), yellow grease (“YG”) and hides. The Company sells these products nationally and internationally, primarily to producers of livestock feed, oleo-chemicals, bio-fuels, soaps, pet foods and leather goods for use as ingredients in their products or for further processing. All of the Company’s finished products are commodities and are priced relative to competing commodities, primarily corn, soybean oil and soybean meal. Finished product prices will track as to nutritional and industry value to the ultimate customer’s use of the product. For additional information on the Company’s business, see Item 1, “Business,”and for additional information on the Company’s segments, see Note 18 of Notes to Consolidated Financial Statements. In fiscal 2009, the Company endured many challenges. Earnings stabilized after a volatile fourth quarter of fiscal 2008 resulting in the third best year in the Company’s 127 year history. Driving this performance were improved and historically high finished product values for MBM. Raw material tonnage declined significantly year over year driven by lower cattle, hog and poultry slaughters. Restaurant grease volumes declined as well driven by continued economic challenges in the U.S. The continued weak U.S. and world economy and resulting decline in consumer confidence has reduced meat consumption, leading the Company's suppliers to curtail slaughters. On a positive note, the Company saw a significant reduction in its energy input costs for both natural gas and diesel. Additionally, the Company was able to take effective cost cutting measures to offset the lower raw material tonnage. Operating income decreased by $21.8 million in fiscal 2009 compared to fiscal 2008. The continuing challenges faced by the Company indicate there can be no assurance that operating results achieved by the Company in fiscal 2009 are indicative of future operating performance of the Company. Summary of Critical Issues Faced by the Company during Fiscal 2009
ITEM 7.
MANAGEMENT ’S DISCUSSION AND ANALYSIS OF FINANCIAL CONDITION AN D RESULTS OF OPERATIONS
• Lower raw material volumes were collected from suppliers during fiscal 2009 as compared to fiscal 2008. Management believes the decline in the general performance of the U.S. economy and weaker year over year slaughter rates in the meat processing industry contributed to a decline in raw material volumes collected by the Company during the year. The Company’s decline in raw material volume was impacted by the closure of smaller meat processor operations and the reduced overrun volume and production cutbacks from larger integrated processors, which has occurred as a result of the current challenging economic environment. The financial impact of lower raw material volumes is summarized below in Results of Operations.
• Energy prices for natural gas and diesel fuel declined during fiscal 2009 as compared to fiscal 2008, as overall lower energy costs continued to decline in response to a decline in the general performance of the U.S. and global economy. Lower energy prices were favorable to the Company’s cost of sales. The financial impact of lower energy costs is summarized below in Results of Operations.
Page 24

Summary of Critical Issues and Known Trends Faced by the Company in Fiscal 2009 and Thereafter Critical Issues and Challenges
Worldwide Government Energy Policies
Other Food Safety and Regulatory Issues
• Lower finished product prices for BFT and YG as compared to fiscal 2008 are a result of the decline in both corn and soybean oil prices over the same period, as well as continuing instability in the U.S. economy and world economy. Finished product prices for MBM and soybean meal, its principal competing commodity product, were comparable to the prior period due to good export demand for proteins. The decline in overall finished product prices was unfavorable to the Company’s sales revenue, but this unfavorable result was partially offset by the positive impact on raw material cost, due to the Company’s formula pricing arrangements with raw material suppliers, which index raw material cost to the prices of finished product derived from the raw material. The financial impact of finished goods prices on sales revenue and raw material cost is summarized below in Results of Operations. Comparative sales price information for BFT, YG and MBM, the Company's principal products, as derived from the Jacobsen index, an established trading exchange publisher used by management, is listed below in Summary of Key Indicators.
• The decline of the general performance of the U.S. economy has forced the Company’s raw material suppliers to reduce their volumes during fiscal 2009. If this volume reduction continues or accelerates, there could be a negative impact on the Company’s ability to obtain raw materials for the Company’s operations.
• The Company consumes significant volumes of natural gas to operate boilers in its plants, which generate steam to heat raw material. Natural gas prices represent a significant cost of factory operation included in cost of sales. The Company also consumes significant volumes of diesel fuel to operate its fleet of tractors and trucks used to collect raw material. Diesel fuel prices represent a significant component of cost of collection expenses included in cost of sales. Although prices for natural gas and diesel fuel remained relatively low during fiscal 2009 as compared to recent history, these prices can be volatile and there can be no assurance that these prices will not increase in the near future, thereby representing an ongoing challenge to the Company’s operating results for future periods. A material increase in energy prices for natural gas and diesel fuel over a sustained period of time could materially adversely affect the Company’s business, financial condition and results of operations.
• Finished product prices for BFT and YG commodities decreased during fiscal 2009 as compared to fiscal 2008. No assurance can be given that this decrease in commodity prices for BFT and YG will not continue in the future. Finished product prices for MBM and other competing proteins during fiscal 2009 were relatively flat as compared to fiscal 2008; however, no assurance can be given that protein prices will continue at the same level in future periods. A future decrease in commodity prices, coupled with a further decline of the general performance of the U.S. economy and the inability of some consumers and companies to obtain credit due to the continuing lack of liquidity in the financial markets, could have a significant impact on the Company’s earnings for fiscal 2010 and into future periods.
• As previously noted, prices for the Company’s finished products may be impacted by worldwide government policies relating to renewable fuels and greenhouse gas emissions, and programs such as RFS2 and tax credits for biofuels both in the U.S. and abroad may positively impact the demand for the Company’s finished products. See the risk factor entitled “The Company’s business may be affected by worldwide government energy policies,” on page 10, for more information regarding RFS2 and how changes to these worldwide government policies could have a negative impact on the Company’s business and results of operations.
• Effective August 1997, the FDA promulgated the BSE Feed Rule prohibiting the use of mammalian proteins, with some exceptions, in feeds for cattle, sheep and other ruminant animals. The intent of this rule is to prevent the spread of BSE, commonly referred to as “mad cow disease.” As previously noted, the FDA has amended the BSE Feed Rule, which the FDA began enforcing on October 26, 2009. Management has followed this proposed amendment throughout its history in order to assess and minimize the impact of its implementation on the Company. See the risk factor entitled “The Company’s business may be affected by the impact of BSE and other food safety issues,” beginning on page 12, for more information about BSE, including the Final BSE Rule, and other food safety issues and their potential effects on the Company, including the effects of potential additional government regulations, finished product export restrictions by foreign governments, market price fluctuations for finished goods, reduced demand for beef and beef products by consumers and increases in operating costs resulting from BSE-related concerns.
Page 25

Even though the export markets for U.S. beef have been significantly re-opened, most of these markets remain closed to MBM derived from U.S. beef. Continued concern about BSE in the U.S. may result in additional regulatory and market related challenges that may affect the Company’s operations and/or increase the Company’s operating costs.
These challenges indicate there can be no assurance that fiscal 2009 operating results are indicative of future operating performance of
the Company. Results of Operations Fifty-two Week Fiscal Year Ended January 2, 2010 (“Fiscal 2009”) Compared to Fifty-three Week Fiscal Year Ended January 3, 2009 (“Fiscal 2008”) Fiscal 2008 includes an additional week of operations which occurs every five to six years. In Fiscal 2008 the additional week increased both net sales and costs by approximately $10 million with an immaterial effect on operating income and net income. Summary of Key Factors Impacting Fiscal 2009 Results:
Principal factors that contributed to a $21.8 million decrease in operating income, which are discussed in greater detail in the following section, were:
These decreases to operating income were partially offset by:
Summary of Key Indicators of Fiscal 2009 Performance:
Principal indicators that management routinely monitors and compares to previous periods as an indicator of problems or improvements in operating results include:
These indicators and their importance are discussed below in greater detail.
• Lower raw material volumes, and • Lower finished product prices.
• Lower raw material costs, • Lower energy costs, primarily related to natural gas and diesel fuel, and • Prior year goodwill impairment.
• Finished product commodity prices, • Raw material volume, • Production volume and related yield of finished product, • Energy prices for natural gas quoted on the NYMEX index and diesel fuel, • Collection fees and collection operating expense, and • Factory operating expenses.
Page 26

Finished Product Commodity Prices. Prices for finished product commodities that the Company produces are reported each business
day on the Jacobsen index, an established trading exchange price publisher. The Jacobsen index reports industry sales from the prior day’s activity by product. The Jacobsen index includes reported prices for MBM and BFT (which are end products of the Company’s Rendering Segment) and YG (which is an end product of the Company’s Restaurant Services Segment). The Company regularly monitors Jacobsen index reports on MBM, BFT and YG because they provide a daily indication of the Company’s revenue performance against business plan benchmarks. Although the Jacobsen index provides one useful metric of performance, the Company’s finished products are commodities that compete with other commodities such as corn, soybean oil and soybean meal on nutritional and functional values and therefore actual pricing for the Company’s finished products, as well as competing products, can be quite volatile. In addition, the Jacobsen index does not provide forward or future period pricing. The Jacobsen prices quoted below are for delivery of the finished product at a specified location. Although the Company’s prices generally move in concert with reported Jacobsen prices, the Company’s actual sales prices for its finished products may vary significantly from the Jacobsen index because of delivery timing differences and because the Company’s finished products are delivered to multiple locations in different geographic regions which utilize different price indexes. Average Jacobsen prices (at the specified delivery point) for Fiscal 2009, compared to average Jacobsen prices for Fiscal 2008 follow:
The overall decrease in average prices for BFT and YG of the finished products the Company sells had an unfavorable impact on revenue that was partially offset by a positive impact to the Company’s raw material cost resulting from formula pricing arrangements, which compute raw material cost based upon the price of finished product.
Raw Material Volume. Raw material volume represents the quantity (pounds) of raw material collected from Rendering Segment suppliers, such as butcher shops, grocery stores and independent beef, pork and poultry processors, and from Restaurant Services Segment suppliers, such as food service establishments. Raw material volumes from the Company’s Rendering Segment suppliers provide an indication of the future production of MBM and BFT finished products, and raw material volumes from the Company’s Restaurant Services Segment suppliers provide an indication of the future production of YG finished products. Production Volume and Related Yield of Finished Product. Finished product production volumes are the end result of the Company’s production processes, and directly impact goods available for sale, and thus become an important component of sales revenue. In addition, physical inventory turn-over is impacted by both the availability of credit to the Company’s customers and suppliers and reduced market demand which can lower finished product inventory values. Yield on production is a ratio of production volume (pounds), divided by raw material volume (pounds) and provides an indication of effectiveness of the Company’s production process. Factors impacting yield on production include quality of raw material and warm weather during summer months, which rapidly degrades raw material. The quantities of finished products produced varies depending on the mix of raw materials used in production. For example, raw material from cattle yields more fat and protein than raw material from pork or poultry. Accordingly, the mix of finished products produced by the Company can vary from quarter to quarter depending on the type of raw material being received by the Company. The Company cannot increase the production of protein or fat based on demand since the type of raw material will dictate the yield of each finished product. Energy Prices for Natural Gas quoted on the NYMEX Index and Diesel Fuel. Natural gas and heating oil commodity prices are quoted each day on the NYMEX exchange for future months of delivery of natural gas and diesel fuel. The prices are important to the Company because natural gas and diesel fuel are major components of factory operating and collection costs and natural gas and diesel fuel prices are an indicator of achievement of the Company’s business plan.
Avg. Price Fiscal 2009
Avg. Price Fiscal 2008
Increase/
(Decrease)
% Increase/
(Decrease) Rendering Segment:
MBM (Illinois) $338.09/ton $333.17 /ton $4.92/ton 1.5% BFT (Chicago) $ 25.21/cwt $ 34.21 /cwt $ (9.00)/cwt (26.3)%
Restaurant Services Segment: YG (Illinois) $ 20.73/cwt $ 27.75 /cwt $ (7.02)/cwt (25.3)%
Page 27
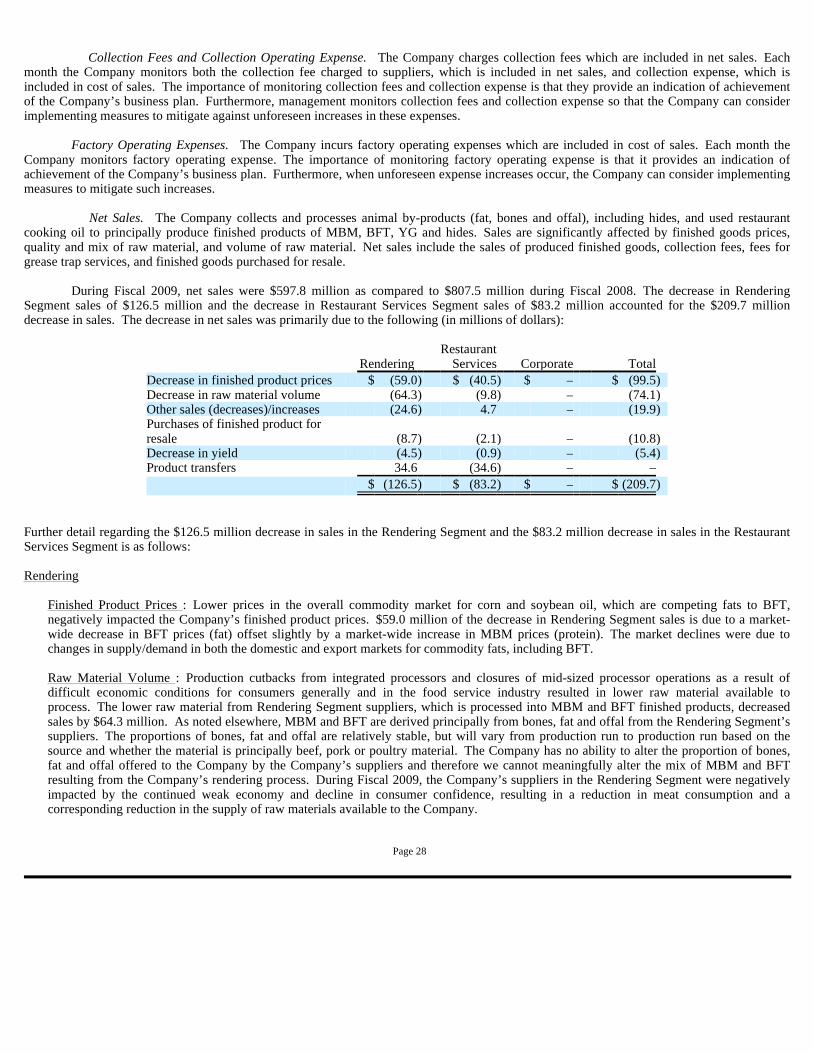
Collection Fees and Collection Operating Expense. The Company charges collection fees which are included in net sales. Each month the Company monitors both the collection fee charged to suppliers, which is included in net sales, and collection expense, which is included in cost of sales. The importance of monitoring collection fees and collection expense is that they provide an indication of achievement of the Company’s business plan. Furthermore, management monitors collection fees and collection expense so that the Company can consider implementing measures to mitigate against unforeseen increases in these expenses.
Factory Operating Expenses. The Company incurs factory operating expenses which are included in cost of sales. Each month the Company monitors factory operating expense. The importance of monitoring factory operating expense is that it provides an indication of achievement of the Company’s business plan. Furthermore, when unforeseen expense increases occur, the Company can consider implementing measures to mitigate such increases. Net Sales. The Company collects and processes animal by-products (fat, bones and offal), including hides, and used restaurant cooking oil to principally produce finished products of MBM, BFT, YG and hides. Sales are significantly affected by finished goods prices, quality and mix of raw material, and volume of raw material. Net sales include the sales of produced finished goods, collection fees, fees for grease trap services, and finished goods purchased for resale.
During Fiscal 2009, net sales were $597.8 million as compared to $807.5 million during Fiscal 2008. The decrease in Rendering Segment sales of $126.5 million and the decrease in Restaurant Services Segment sales of $83.2 million accounted for the $209.7 million decrease in sales. The decrease in net sales was primarily due to the following (in millions of dollars):
Further detail regarding the $126.5 million decrease in sales in the Rendering Segment and the $83.2 million decrease in sales in the Restaurant Services Segment is as follows: Rendering
Finished Product Prices : Lower prices in the overall commodity market for corn and soybean oil, which are competing fats to BFT, negatively impacted the Company’s finished product prices. $59.0 million of the decrease in Rendering Segment sales is due to a market-wide decrease in BFT prices (fat) offset slightly by a market-wide increase in MBM prices (protein). The market declines were due to changes in supply/demand in both the domestic and export markets for commodity fats, including BFT.
Raw Material Volume : Production cutbacks from integrated processors and closures of mid-sized processor operations as a result of difficult economic conditions for consumers generally and in the food service industry resulted in lower raw material available to process. The lower raw material from Rendering Segment suppliers, which is processed into MBM and BFT finished products, decreased sales by $64.3 million. As noted elsewhere, MBM and BFT are derived principally from bones, fat and offal from the Rendering Segment’s suppliers. The proportions of bones, fat and offal are relatively stable, but will vary from production run to production run based on the source and whether the material is principally beef, pork or poultry material. The Company has no ability to alter the proportion of bones, fat and offal offered to the Company by the Company’s suppliers and therefore we cannot meaningfully alter the mix of MBM and BFT resulting from the Company’s rendering process. During Fiscal 2009, the Company’s suppliers in the Rendering Segment were negatively impacted by the continued weak economy and decline in consumer confidence, resulting in a reduction in meat consumption and a corresponding reduction in the supply of raw materials available to the Company.
Rendering Restaurant
Services Corporate Total Decrease in finished product prices $ (59.0 ) $ (40.5 ) $ – $ (99.5 ) Decrease in raw material volume (64.3 ) (9.8 ) – (74.1 ) Other sales (decreases)/increases (24.6 ) 4.7 – (19.9 ) Purchases of finished product for resale (8.7 ) (2.1 ) – (10.8 ) Decrease in yield (4.5 ) (0.9 ) – (5.4 ) Product transfers 34.6 (34.6 ) – – $ (126.5 ) $ (83.2 ) $ – $ (209.7 )
Page 28

Other Sales : The $24.6 million decrease in other Rendering Segment sales was primarily due to lower prices and volumes on hides. Hide volumes were down due to lower dead stock volume and lower slaughter rates at beef processors, as well as the Company’s decision not to skin as many hides since the cost to process the hides was more than the value of the finished product. Prices were impacted by difficult economic conditions and decreased demand for leather goods. The lower dead stock volume was due primarily to unseasonably good weather in Fiscal 2009.
Purchases of Finished Product for Resale : The Company purchased less finished product for resale from third party suppliers in Fiscal 2009 compared to the same period in Fiscal 2008 by $8.7 million. Lower domestic and export demand for finished products reduced the need to source third party product.
Yield : The raw material processed in Fiscal 2009 compared to the same period of Fiscal 2008 yielded less finished product for sale and reduced sales by $4.5 million. The reduction in cattle kills by the packing industry during the year impacted yields since cattle offal is a higher yielding material than pork and poultry offal.
Product Transfers : Depending on the Company’s customers’ finished product quality specifications and the quality of raw material the Company receives from meat processors and other sources, from time to time BFT material must be downgraded and sold as YG. Generally, product transfers occur when BFT is downgraded and the product is reclassified as YG, which is a Restaurant Services Segment product. Product transfers from the Rendering Segment to the Restaurant Services Segment were less in Fiscal 2009 compared to the same period in Fiscal 2008. When less product is transferred from the Rendering Segment to the Restaurant Services Segment, more BFT is available for sale by the Rendering Segment and YG sales will decrease correspondingly. The increased BFT available in Fiscal 2009 compared to Fiscal 2008 resulted in an increase in Rendering Segment sales of $34.6 million.
Restaurant Services
Finished Product Prices : Lower prices in the commodity markets for competing fats and corn negatively impacted the Company’s YG finished product prices. The $40.5 million decrease in Restaurant Services Segment sales was due to a significant decrease in prices for YG and competing commodity products. The market declines were due to weaker demand in both the domestic and export markets for YG.
Raw Material Volume : Difficult economic conditions in the food service industry impacted the volume of raw material available for collection. Lower raw material volume from used cooking oil suppliers decreased YG sales by $9.8 million. As noted elsewhere, YG is produced by the Company’s Restaurant Services Segment as a result of refining used cooking oil collected from the Company’s food service establishment suppliers. During Fiscal 2009, the Company’s suppliers in the Restaurant Services Segment were negatively impacted by the continued weak economy and decline in consumer confidence, resulting in reduced patronage of restaurants, longer usage by restaurants of cooking oil and a corresponding reduction in the supply of used cooking oil available to the Company.
Other Sales : The $4.7 million increase in other sales was primarily from the current year acquisitions in the Restaurant Services Segment.
Purchases of Finished Product for Resale : The $2.1 million decrease in sales resulted from the Company purchasing less finished product for resale from third party suppliers in Fiscal 2009 as compared to the same period in Fiscal 2008. With less demand for finished products, the Company’s need to source additional third party product for sales decreased.
Yield : The Company believes that YG yields have declined because of the current economic environment in the U.S. that has caused the food service industry to use their current oil longer, which decreases the volumes and quality of cooking oil picked up from suppliers. This lowers yields and lowers the amount of finished product available for sale resulting in reduced sales of $0.9 million.
Product Transfers : Product transfers from the Rendering Segment to the Restaurant Services Segment were less in Fiscal 2009 as compared to the same period in Fiscal 2008. The reduction in product transfers was a result of less BFT (a Rendering Segment product) being downgraded and transferred to the Restaurant Services Segment to be sold as YG in Fiscal 2009 compared to Fiscal 2008. As a result, Restaurant Services Segment sales were reduced by $34.6 million in Fiscal 2009.
Page 29

Cost of Sales and Operating Expenses. Cost of sales and operating expenses include the cost of raw material, the cost of product
purchased for resale and the cost to collect raw material, which includes diesel fuel and processing costs including natural gas. The Company utilizes both fixed and formula pricing methods for the purchase of raw materials. Fixed prices are adjusted where possible for changes in competition. Significant changes in finished goods market conditions impact finished product inventory values, while raw materials purchased under formula prices are correlated with specific finished goods prices. Energy costs, particularly diesel fuel and natural gas, are significant components of the Company’s cost structure. The Company has the ability to burn alternative fuels at a majority of its plants to help manage the Company’s price exposure to volatile energy markets.
During Fiscal 2009, cost of sales and operating expenses were $440.1 million as compared to $614.7 million during Fiscal 2008. Decreases in Rendering Segment cost of sales and operating expenses of $108.5 million and the decrease in Restaurant Services Segment cost of sales and operating expenses of $67.0 million accounted for a majority of the $174.6 million decrease in cost of sales and operating expenses. The decrease in cost of sales and operating expenses was primarily due to the following (in millions of dollars):
Further detail regarding the $108.5 million decrease in cost of sales and operating expenses in the Rendering Segment and the $67.0 million decrease in the Restaurant Services Segment is as follows: Rendering
Raw Material Costs : In Fiscal 2009 approximately 53% of the Company’s annual volume of raw material was acquired on a “formula”basis. Under a formula arrangement, the cost of raw material is tied to the finished product market for MBM and BFT. Since finished product prices were lower in Fiscal 2009 as compared to Fiscal 2008, the raw material costs decreased by $56.4 million.
Energy Costs : Both natural gas and diesel fuel are major components of collection and factory operating costs to the Rendering Segment. The lower energy costs of $24.4 million reflect the lower cost of natural gas and diesel fuel during Fiscal 2009 as compared to Fiscal 2008.
Other Expense : Other expense decreased $28.8 million in cost of sales and operating expenses principally due to lower hide prices and volumes. Hide volumes were down due to lower dead stock volumes and lower slaughter rates at beef processors, as well as the Company’s decision not to skin as many hides since the cost to process the hides was more than the value of the finished product. Prices were impacted by difficult economic conditions and decreased demand for leather goods. The lower dead stock volume was due primarily to unseasonably good weather in Fiscal 2009.
Raw Material Volume : Production cutbacks from integrated processors and closures of mid-sized processor operations resulted in lower raw material available to be processed. The lower raw material reduced the cost of sales by $19.7 million.
Rendering Restaurant
Services Corporate Total Decrease in raw material costs $ (56.4 ) $ (25.6 ) $ – $ (82.0 ) Decreases in energy costs, primarily natural gas and diesel fuel (24.4 ) (3.1 ) (0.3 ) (27.8 ) Other expense (decreases)/increases (28.8 ) 0.9 1.2 (26.7 ) Decrease in raw material volume (19.7 ) (2.8 ) – (22.5 ) Purchases of finished product for resale (10.6 ) (1.8 ) – (12.4 ) Multi -employer pension plans mass withdrawal termination (3.2 ) – – (3.2 ) Product transfers 34.6 (34.6 ) – – $ (108.5 ) $ (67.0 ) $ 0.9 $ (174.6 )
Page 30

Purchases of Finished Product for Resale : The Company purchased less finished product for resale from third party suppliers in Fiscal 2009 compared to the same period in Fiscal 2008 by $10.6 million.
Product Transfers : In Fiscal 2009, less BFT failed to meet customer finished product quality specifications than in Fiscal 2008, and therefore less BFT was downgraded to YG value and transferred from the Rendering Segment to the Restaurant Services Segment. Since the Rendering Segment had relatively more BFT available for sale in Fiscal 2009, cost of sales related to product transfers increased $34.6 million.
Restaurant Services
Raw Material Costs : YG finished product prices were lower in the Fiscal 2009 as compared to Fiscal 2008, which caused the raw material costs to decrease by $25.6 million.
Raw Material Volume : Difficult economic conditions in the food service industry impacted the volume of raw material available to collect. Lower raw material volume from used cooking oil suppliers decreased cost of sales by $2.8 million.
Energy Costs : Diesel fuel and natural gas are major components of collection and operating costs to the Restaurant Services Segment. The lower energy costs of $3.1 million reflect the lower cost of diesel fuel and natural gas during Fiscal 2009 as compared to the same period in Fiscal 2008.
Other Expense : The $0.9 million increase in other expense was primarily due to current year acquisitions in the Restaurant Services Segment that more than offset efforts by the operations groups to reduce collection expense.
Purchases of Finished Product for Resale : The $1.8 million decrease in cost of sales is from purchasing less finished product for resale from third party suppliers.
Product Transfers : Because less BFT was downgraded for failure to meet customer specifications and subsequently sold by the Restaurant Services Segment as YG in Fiscal 2009 compared to Fiscal 2008, the cost of sales was reduced by $34.6 million year over year.
Selling, General and Administrative Expenses. Selling, general and administrative expenses were $61.5 million during Fiscal 2009, a $1.7 million increase (2.8%) from $59.8 million during Fiscal 2008. The increase in selling, general and administrative expenses is primarily due to the following (in millions of dollars):
Depreciation and Amortization. Depreciation and amortization charges increased $0.8 million (3.3%) to $25.2 million during Fiscal 2009 as compared to $24.4 million during Fiscal 2008. The increase in depreciation and amortization is primarily due to an overall increase in depreciable capital assets on the balance sheet. Interest Expense. Interest expense was $3.1 million during Fiscal 2009 compared to $3.0 million during Fiscal 2008, an increase of $0.1 million, primarily due to an increase in fees from the amended credit agreement that was partially offset by a decrease in outstanding balance related to the Company’s debt. Other Income/Expense. Other expense was $1.0 million in Fiscal 2009, a $1.3 million increase from other income of $0.3 million in Fiscal 2008. The increase in other expense is primarily due to a decrease in interest income on the Company’s interest bearing accounts due to lower rates and increases in other non-operating expenses, which includes approximately $0.5 million of costs associated with the expected renewable diesel joint venture project.
Rendering Restaurant
Services Corporate Total Other expense (decreases)/increases $ (0.2 ) $ (0.2 ) $ 2.0 $ 1.6 Consulting fees – – 0.7 0.7 Payroll and related benefits expense 0.8 0.8 (1.1 ) 0.5 Bad debt expense (decreases)/ increases (0.8 ) (0.5 ) 0.2 (1.1 ) $ (0.2 ) $ 0.1 $ 1.8 $ 1.7
Psge 31

Income Taxes. The Company recorded income tax expense of $25.1 million for Fiscal 2009, compared to income tax expense of $35.4
million recorded in Fiscal 2008, a decrease of $10.3 million, primarily due to a decrease in pre-tax earnings of the Company in Fiscal 2009. The effective tax rate for Fiscal 2009 and Fiscal 2008 is 37.5 % and 39.3%, respectively. The difference from the federal statutory rate of 35% in Fiscal 2009 and Fiscal 2008 is primarily due to state taxes. Results of Operations Fifty-three Week Fiscal Year Ended January 3, 2009 (“Fiscal 2008”) Compared to Fifty-two Week Fiscal Year Ended December 29, 2007 (“Fiscal 2007”) Fiscal 2008 includes an additional week of operations which occurs every five to six years. In Fiscal 2008 the additional week increased both net sales and costs by approximately $10 million with an immaterial effect on operating income and net income. Summary of Key Factors Impacting Fiscal 2008 Results:
Principal factors that contributed to a $12.1 million increase in operating income, which are discussed in greater detail in the following section, were:
These increases to operating income were partially offset by:
Summary of Key Indicators of Fiscal 2008 Performance:
Principal indicators that management routinely monitors and compares to previous periods as an indicator of problems or improvements in operating results include:
These indicators and their importance are discussed below in greater detail.
Finished Product Commodity Prices. Prices for finished product commodities that the Company produces are reported each business day on the Jacobsen index, an established trading exchange price publisher. The Jacobsen index reports industry sales from the prior day’s activity by product. The Jacobsen index includes reported prices for MBM and BFT (which are end products of the Company’s Rendering Segment) and YG (which is an end product of the Company’s Restaurant Services Segment). The Company regularly monitors Jacobsen index reports on MBM, BFT and YG because they provide a daily indication of the Company’s revenue performance against business plan benchmarks. Although the Jacobsen index provides one useful metric of performance, the Company’s finished products are commodities that compete with other commodities such as corn, soybean oil and soybean meal on nutritional and functional values and therefore actual pricing for the Company’s finished products, as well as competing products, can be quite volatile. In addition, the Jacobsen index does not provide forward or future period pricing. The Jacobsen prices quoted below are for delivery of the finished product at a specified location. Although the Company’s prices generally move in concert with reported Jacobsen prices, the Company’s actual sales prices for its finished products may vary significantly from the Jacobsen index because of delivery timing differences and because the Company’s finished products are delivered to multiple locations in different geographic regions which utilize different price indexes. Average Jacobsen prices (at the specified delivery point) for Fiscal 2008, compared to average Jacobsen prices for Fiscal 2007 follow:
• Higher finished product prices.
• Higher raw material costs, • Goodwill impairment, • Higher energy costs, primarily related to natural gas and diesel fuel, and • Higher payroll and incentive-related benefits.
• Finished product commodity prices, • Raw material volume, • Production volume and related yield of finished product, • Energy prices for natural gas quoted on the NYMEX index and diesel fuel, • Collection fees and collection operating expense, and • Factory operating expenses.
Psge 32

The increase in average prices of the finished products the Company sells had a favorable impact on revenue that was partially offset by a negative impact to the Company’s raw material cost resulting from formula pricing arrangements, which compute raw material cost based upon the price of finished product. The global economic environment in the fourth quarter caused the Company’s finished product commodity prices to decline significantly subsequent to the third quarter of Fiscal 2008 as commodity prices remained volatile. The following table shows the average Jacobsen index for the fourth quarter of Fiscal 2008 for MBM, BFT and YG as compared to Fiscal 2007.
Raw Material Volume. Raw material volume represents the quantity (pounds) of raw material collected from Rendering Segment suppliers, such as butcher shops, grocery stores and independent beef, pork and poultry processors, and from Restaurant Services Segment suppliers, such as food service establishments. Raw material volumes from the Company’s Rendering Segment suppliers provide an indication of the future production of MBM and BFT finished products, and raw material volumes from the Company’s Restaurant Services Segment suppliers provide an indication of the future production of YG finished products. Production Volume and Related Yield of Finished Product. Finished product production volumes are the end result of the Company’s production processes, and directly impact goods available for sale, and thus become an important component of sales revenue. In addition, physical inventory turn-over is impacted by both the availability of credit to the Company’s customers and suppliers and reduced market demand which can lower finished product inventory values. Yield on production is a ratio of production volume (pounds), divided by raw material volume (pounds) and provides an indication of effectiveness of the Company’s production process. Factors impacting yield on production include quality of raw material and warm weather during summer months, which rapidly degrades raw material. The quantities of finished products produced varies depending on the mix of raw materials used in production. For example, raw material from cattle yields more fat and protein than raw material from pork or poultry. Accordingly, the mix of finished products produced by the Company can vary from quarter to quarter depending on the type of raw material being received by the Company. The Company cannot increase the production of protein or fat based on demand since the type of raw material will dictate the yield of each finished product. Energy Prices for Natural Gas quoted on the NYMEX Index and Diesel Fuel. Natural gas and heating oil commodity prices are quoted each day on the NYMEX exchange for future months of delivery of natural gas and diesel fuel. The prices are important to the Company because natural gas and diesel fuel are major components of factory operating and collection costs and natural gas and diesel fuel prices are an indicator of achievement of the Company’s business plan.
Avg. Price Fiscal 2008
Avg. Price Fiscal 2007
Increase
% Increase
Rendering Segment: MBM (Illinois) $333.17/ton $233.51 /ton $99.66/ton 42.7% BFT (Chicago) $ 34.21/cwt $ 27.89 /cwt $ 6.32/cwt 22.7%
Restaurant Services Segment: YG (Illinois) $ 27.75/cwt $ 21.62 /cwt $ 6.13/cwt 28.4%
Avg. Price 4th Quarter
2008
Avg. Price 4th Quarter
2007
Decrease
%
Decrease Rendering Segment:
MBM (Illinois) $261.56/ton $270.77 /ton $ (9.21/ton) (3.4%) BFT (Chicago) $ 17.59/cwt $ 30.68 /cwt $(13.09/cwt) (42.7%)
Restaurant Services Segment: YG (Illinois) $ 14.76/cwt $ 23.45 /cwt $ (8.69/cwt) (37.1%)
Page 33

Collection Fees and Collection Operating Expense. The Company charges collection fees which are included in net sales. Each month the Company monitors both the collection fee charged to suppliers, which is included in net sales, and collection expense, which is included in cost of sales. The importance of monitoring collection fees and collection expense is that they provide an indication of achievement of the Company’s business plan. Furthermore, management monitors collection fees and collection expense so that the Company can consider implementing measures to mitigate against unforeseen increases in these expenses.
Factory Operating Expenses. The Company incurs factory operating expenses which are included in cost of sales. Each month the Company monitors factory operating expense. The importance of monitoring factory operating expense is that it provides an indication of achievement of the Company’s business plan. Furthermore, when unforeseen expense increases occur, the Company can consider implementing measures to mitigate such increases. Net Sales. The Company collects and processes animal by-products (fat, bones and offal), including hides, and used restaurant cooking oil to principally produce finished products of MBM, BFT, YG and hides. Sales are significantly affected by finished goods prices, quality and mix of raw material, and volume of raw material. Net sales include the sales of produced finished goods, collection fees, fees for grease trap services, and finished goods purchased for resale.
During Fiscal 2008, net sales were $807.5 million as compared to $645.3 million during Fiscal 2007. The increases in Rendering Segment sales of $120.7 million and the increase in Restaurant Services Segment sales of $41.5 million accounted for the $162.2 million increase in sales. The increase in net sales was primarily due to the following (in millions of dollars):
Further detail regarding the $120.7 million increase in sales in the Rendering Segment and the $41.5 million increase in sales in the Restaurant Services Segment is as follows: Rendering
Finished Product Prices : Higher prices for Fiscal 2008 in the overall commodity market for corn, soybean oil and soybean meal, which are competing proteins and fats to MBM and BFT, positively impacted the Company’s finished product prices. $148.4 million of the increase in Rendering sales is due to a market-wide increase in MBM prices (protein) and in BFT prices (fat). The market increases were due to changes in supply/demand as a result of new demand for bio-fuels and growing consumption for commodity proteins and fats, including MBM and BFT.
Raw Material Volume : The lower raw material from Rendering Segment suppliers, which is processed into MBM and BFT finished products decreased sales by $0.1 million.
Other Sales : The $3.5 million decrease in other Rendering sales was primarily due to lower prices and volumes on hides. Hide volumes were down due to lower dead stock volume and lower slaughter rates at beef processors. Prices were impacted by difficult economic conditions and decreased demand for leather goods.
Purchases of Finished Product for Resale : The Company purchased less finished product for resale from third party suppliers in Fiscal 2008 compared to the same period in Fiscal 2007 by $10.4 million. Lower domestic and export demand for finished products reduced the need to source third party product.
Rendering Restaurant
Services Corporate Total Higher finished product prices $ 148.4 $ 39.7 $ – $ 188.1 Purchases of finished product for resale (10.4 ) 1.0 – (9.4 ) Decrease in yield (5.0 ) (2.7 ) – (7.7 ) Decrease in other sales (3.5 ) (2.1 ) – (5.6 ) Decrease in raw material volume (0.1 ) (3.1 ) – (3.2 ) Product transfers (8.7 ) 8.7 – – $ 120.7 $ 41.5 $ – $ 162.2
Page 34

Yield : The raw material processed in Fiscal 2008 compared to the same period of Fiscal 2009 yielded less finished product for sale and reduced sales by $5.0 million. The reduction in cattle kills by the meat processing industry during the year impacted yields since cattle offal is a higher yielding material than pork and poultry offal.
Product Transfers : Depending on the Company’s customers’ finished product quality specifications and the quality of raw material the Company receives from meat processors and other sources, from time to time BFT material must be downgraded and sold as YG. Generally, product transfers occur when BFT is downgraded and the product is reclassified as YG, which is a Restaurant Services Segment product. Product transfers from the Rendering Segment to the Restaurant Services Segment were more in Fiscal 2008 compared to the same period in Fiscal 2007. When more product is transferred from the Rendering Segment to the Restaurant Services Segment, less BFT is available for sale by the Rendering Segment and YG sales will increase correspondingly. The decreased BFT available in Fiscal 2008 compared to Fiscal 2007 resulted in a decrease in Rendering Segment sales of $8.7 million.
Restaurant Services
Finished Product Prices : Higher prices in the commodity markets for competing fats and corn positively impacted the Company’s YG finished product prices. The $39.7 million increase in Restaurant Services sales was due to a significant increase in prices for YG and competing commodity products. The market increases were due to stronger demand for bio-fuels and growing consumption for YG.
Raw Material Volume : Difficult economic conditions in the food service industry impacted the volume of raw material available for collection. Lower raw material volume from used cooking oil suppliers decreased YG sales by $3.1 million.
Other Sales : The $2.1 million decrease in other sales was primarily from a decrease in collection fees as a result of the higher market price for YG.
Purchases of Finished Product for Resale : The $1.0 million increase in sales resulted from the Company purchasing more finished product for resale from third party suppliers in Fiscal 2008 as compared to the same period in Fiscal 2007. With more demand for YG finished products, the Company’s need to source additional third party product for sales increased in order to meet the Company’s customers’ needs.
Yield : The Company believes that YG yields have declined because of the current economic environment in the U.S. that has caused the food service industry to use their current oil longer, which decreases the volumes and quality of cooking oil picked up from suppliers. This lowers yields and lowers the amount of finished product available for sale resulting in reduced sales of $2.7 million.
Product Transfers : Product transfers from the Rendering Segment to the Restaurant Services Segment were more in Fiscal 2008 as compared to the same period in Fiscal 2007. The increase in product transfers was a result of more BFT (a Rendering Segment product) being downgraded and transferred to the Restaurant Services Segment to be sold as YG in Fiscal 2008 compared to Fiscal 2007. As a result, Restaurant Services Segment sales were increased by $8.7 million in Fiscal 2008.
Cost of Sales and Operating Expenses. Cost of sales and operating expenses include the cost of raw material, the cost of product purchased for resale and the cost to collect raw material, which includes diesel fuel and processing costs including natural gas. The Company utilizes both fixed and formula pricing methods for the purchase of raw materials. Fixed prices are adjusted where possible for changes in competition. Significant changes in finished goods market conditions impact finished product inventory values, while raw materials purchased under formula prices are correlated with specific finished goods prices. Energy costs, particularly diesel fuel and natural gas, are significant components of the Company’s cost structure. The Company has the ability to burn alternative fuels at a majority of its plants to help manage the Company’s price exposure to volatile energy markets.
Page 35

During Fiscal 2008, cost of sales and operating expenses were $614.7 million as compared to $483.5 million during Fiscal 2007. The
increases in Rendering Segment cost of sales and operating expenses of $89.2 million and the increase in Restaurant Services Segment cost of sales and operating expenses of $42.2 million accounted for a majority of the $131.2 million increase in cost of sales and operating expenses. The increase in cost of sales and operating expenses was primarily due to the following (in millions of dollars):
Further detail regarding the $89.2 million increase in cost of sales and operating expenses in the Rendering Segment and the $42.2 million increase in the Restaurant Services Segment is as follows: Rendering
Raw Material Costs : In Fiscal 2008 approximately 58% of the Company’s annual volume of raw material was acquired on a “formula”basis. Under a formula arrangement, the cost of raw material is tied to the finished product market for MBM and BFT. Since finished product prices were higher in the Fiscal 2008 as compared to Fiscal 2007, the raw material costs increased by $81.2 million.
Energy Costs : Both natural gas and diesel fuel are major components of collection and factory operating costs to the Rendering Segment. The higher energy costs of $13.6 million reflect higher cost of natural gas and diesel fuel costs during Fiscal 2008 as compared to Fiscal 2007.
Other Expense : Other expense including payroll and related benefits increased $9.6 million in cost of sales and operating expenses. Increases in overall payroll wages and employee benefits, including increased medical costs in Fiscal 2008 as compared to Fiscal 2007 were the primary causes of the increase in other expense.
Purchases of Finished Product for Resale : The Company purchased less finished product for resale from third party suppliers in Fiscal 2008 compared to the same period in Fiscal 2007 by $10.1 million.
Product Transfers : In Fiscal 2008, more BFT failed to meet customer finished product quality specifications than in Fiscal 2007, and therefore more BFT was downgraded to YG value and transferred from the Rendering Segment to the Restaurant Services Segment. Since the Rendering Segment had relatively less BFT available for sale in Fiscal 2008, cost of sales related to product transfers decreased $8.7 million.
Restaurant Services
Raw Material Costs : YG finished product prices were significantly higher in the Fiscal 2008 as compared to Fiscal 2007, which caused the raw material costs to increase by $25.1 million.
Energy Costs : Diesel fuel and natural gas are major components of collection and operating costs to the Restaurant Services Segment. The higher energy costs of $3.0 million reflect the higher cost of diesel fuel and natural gas during Fiscal 2008 as compared to the same period in Fiscal 2007.
Rendering Restaurant
Services Corporate Total Higher raw material costs $ 81.2 $ 25.1 $ – $ 106.3 Higher energy costs, primarily natural gas and diesel fuel 13.6 3.0 – 16.6 Payroll and related benefits 6.0 2.2 – 8.2 Increase/(decrease) in other expenses 3.6 2.1 (0.2 ) 5.5 Multi-employer pension plans mass withdrawal termination 2.4 – – 2.4 Sale of judgment 1.2 – – 1.2 Purchases of finished product for resale (10.1 ) 1.1 – (9.0 ) Product transfers (8.7 ) 8.7 – – $ 89.2 $ 42.2 $ (0.2 ) $ 131.2
Page 36

Other Expense : Other expense including payroll and related benefits increased $4.3 million in cost of sales and operating expenses. The primary cause of the increase in other expense is due to increases in overall payroll wages and employee benefits, including medical costs and current year acquisitions in the Restaurant Service Segment.
Purchases of Finished Product for Resale : The $1.1 million increase in cost of sales is from purchasing more finished product from third party suppliers for resale in order to meet customer demand.
Product Transfers : Because more BFT was downgraded for failure to meet customer specifications and subsequently sold by the Restaurant Services Segment as YG in Fiscal 2008 compared to Fiscal 2007, the cost of sales was increased by $8.7 million year over year.
Selling, General and Administrative Expenses. Selling, general and administrative expenses were $59.8 million during Fiscal 2008, a $1.8 million increase (3.1%) from $58.0 million during Fiscal 2007. The Company increased its provision for bad debt based on general credit conditions and delinquent accounts receivable. The increase in selling, general and administrative expenses is primarily due to the following (in millions of dollars):
Depreciation and Amortization. Depreciation and amortization charges increased $1.2 million (5.2%) to $24.4 million during Fiscal 2008 as compared to $23.2 million during Fiscal 2007. The increase in depreciation and amortization is primarily due to an overall increase in capital expenditures. Goodwill Impairment. The Company recorded a goodwill impairment charge of $15.9 million in the fourth quarter of Fiscal 2008 as a result of its annual impairment test. This impairment charge relates to the loss of certain large raw material suppliers in the fourth quarter of Fiscal 2008. Interest Expense. Interest expense was $3.0 million during Fiscal 2008 compared to $5.0 million during Fiscal 2007, a decrease of $2.0 million (40.0%), primarily due to a decrease in outstanding balance related to the Company’s debt. Other Income/Expense. Other income was $0.3 million in Fiscal 2008, a $0.9 million increase from other expense of $0.6 million in Fiscal 2007. The increase in other income is primarily due to more cash included in interest bearing accounts and decreases in other non-operating expenses.
Income Taxes. The Company recorded income tax expense of $35.4 million for Fiscal 2008, compared to income tax expense of $29.5 million recorded in Fiscal 2007, an increase of $5.9 million, primarily due to increased pre-tax earnings of the Company in Fiscal 2008. The effective tax rate for Fiscal 2008 and Fiscal 2007 is 39.3%. The difference from the federal statutory rate of 35% in Fiscal 2008 and Fiscal 2007 is primarily due to state taxes. FINANCING, LIQUIDITY, AND CAPITAL RESOURCES
The Company has a $175 million credit agreement (the “Credit Agreement”) that became effective April 7, 2006. The principal components of the Credit Agreement consist of the following:
Rendering Restaurant
Services Corporate Total Increase in other expenses $ 0.1 $ 0.6 $ 1.3 $ 2.0 Payroll and related benefits expense 0.6 0.5 0.5 1.6 Increase in bad debt expense 0.6 0.6 (0.1 ) 1.1 Decrease in legal expense – – (1.7 ) (1.7 ) Decrease in legal settlements – – (1.2 ) (1.2 ) $ 1.3 $ 1.7 $ (1.2 ) $ 1.8
• The Credit Agreement provides for a total of $175.0 million in financing facilities, consisting of a $50.0 million term loan facility and a $125.0 million revolving credit facility, which includes a $35.0 million letter of credit sub-facility.
Page 37

The Company’s Credit Agreement consists of the following elements at January 2, 2010 (in thousands):
• The $125.0 million revolving credit facility has a term that matures on April 7, 2013.
• As of January 2, 2010, the Company has borrowed all $50.0 million under the term loan facility, which provides for scheduled quarterly amortization payments of $1.25 million over a six-year term ending with a balloon payment of $22.5 million on April 7, 2012. The Company has reduced the term loan facility by quarterly payments totaling $17.5 million, for an aggregate of $32.5 million principal outstanding under the term loan facility at January 2, 2010.
• Alternative base rate loans under the Credit Agreement bear interest at a rate per annum equal to the greatest of (a) the prime rate (b) the federal funds effective rate (as defined in the Credit Agreement) plus ½ of 1% and (c) the adjusted LIBOR for a one month interest period plus 1%, plus in each case, a margin determined by reference to a pricing grid under the Credit Agreement and adjusted according to the Company’s adjusted leverage ratio. Eurodollar loans bear interest at a rate per annum based on the then-applicable LIBOR multiplied by the statutory reserve rate plus a margin determined by reference to a pricing grid and adjusted according to the Company’s adjusted leverage ratio.
• On October 8, 2008, the Company entered into an amendment (the “2008 Amendment”) with its lenders under its Credit Agreement. The 2008 Amendment increases the Company’s flexibility to make investments in third parties. Pursuant to the 2008 Amendment, the Company can make investments in third parties provided that (i) no default under the Credit Agreement exists or would result at the time such investment is committed to be made, (ii) certain specified defaults do not exist or would result at the time such investment is actually made, and (iii) after giving pro forma effect to such investment, the leverage ratio (as determined in accordance with the terms of the Credit Agreement) is less than 2.00 to 1.00 for the most recent four fiscal quarter period then ended. In addition, the 2008 Amendment increases the amount of intercompany investments permitted among the Company and any of its subsidiaries that are not parties to the Credit Agreement from $2.0 million to $10.0 million.
• On September 30, 2009, the Company, entered into an amendment (the “2009 Amendment” ) with its lenders under the Credit Agreement. The 2009 Amendment (i) extends the maturity date of the revolving facility from April 7, 2011 to April 7, 2013, (ii) revises the pricing schedule with respect to letter of credit fees and interest rates payable by the Company and amends certain definitions in connection therewith, (iii) permits the issuance of new unsecured indebtedness and amends and adds certain definitions in connection therewith, and (iv) amends certain provisions with respect to the defaulting lender concept in the Credit Agreement. Pursuant to the 2009 Amendment, the Company can issue new unsecured indebtedness provided that (i) no default under the Credit Agreement exists or would result from the incurrence of such new unsecured indebtedness, (ii) the amount of such new unsecured indebtedness does not exceed $150 million at any time outstanding, and (iii) after giving pro forma effect to such incurrence of new unsecured indebtedness, the Company is in compliance with the fixed charge coverage ratio and the leverage ratio (as determined in accordance with the terms of the Credit Agreement).
• The Credit Agreement contains restrictive covenants that are customary for similar credit arrangements and requires the maintenance of certain minimum financial ratios. The Credit Agreement also requires the Company to make certain mandatory prepayments of outstanding indebtedness using the net cash proceeds received from certain dispositions of property, casualty or condemnation, any sale or issuance of equity interests in a public offering or in a private placement, unpermitted additional indebtedness incurred by the Company and excess cash flow under certain circumstances.
Credit Agreement: Term Loan $ 32,500
Revolving Credit Facility: Maximum availability $ 125,000 Borrowings outstanding – Letters of credit issued 15,852
Availability $ 109,148
Page 38

The obligations under the Credit Agreement are guaranteed by Darling National LLC, a Delaware limited liability company that is a
wholly-owned subsidiary of Darling (“Darling National”), and are secured by substantially all of the property of the Company, including a pledge of all equity interests in Darling National. As of January 2, 2010, the Company was in compliance with all of the financial covenants and believes it was in compliance with all of the other covenants contained in the Credit Agreement.
The classification of long-term debt in the Company’s January 2, 2010 consolidated balance sheet is based on the contractual repayment terms of the debt issued under the Credit Agreement.
On January 2, 2010, the Company had working capital of $75.1 million and its working capital ratio was 2.05 to 1 compared to working capital of $67.4 million and a working capital ratio of 1.95 to 1 on January 3, 2009. The increase in working capital is primarily due to the increase in cash and cash equivalents. At January 2, 2010, the Company had unrestricted cash of $68.2 million and funds available under the revolving credit facility of $109.1 million, compared to unrestricted cash of $50.8 million and funds available under the revolving credit facility of $108.6 million at January 3, 2009. The Company diversifies its cash investments by limiting the amounts located at any one financial institution and invests primarily in government-backed securities.
Net cash provided by operating activities was $79.2 million and $92.0 million for the fiscal years ended January 2, 2010 and January 3, 2009, respectively, a decrease of $12.8 million due to a decrease in net income of approximately $12.8 million. Cash used by investing activities was $55.7 million during Fiscal 2009, compared to $52.4 million in Fiscal 2008, an increase of $3.3 million, primarily due to an increase in acquisition activity of approximately $18.1 million, which was offset by a decrease in capital expenditures of approximately $7.4 million and a decrease in route and other intangible activity of approximately $6.6 million. Net cash used by financing activities was $6.1 million in the year ended January 2, 2010 an increase of cash used of $1.0 million as compared to $5.1 million at January 3, 2009, principally due to less excess tax benefits from stock-based compensation in 2009, which was partially offset by lower term debt repayments in 2009.
Capital expenditures of $23.6 million were made during Fiscal 2009 as compared to $31.0 million in Fiscal 2008, a decrease of $7.4 million (23.9%). The decrease is due primarily to a reduction in spending on a major modernization project started in Fiscal 2008 and completed in Fiscal 2009 at the Turlock California plant that was identified over normal maintenance and compliance capital expenditures and an overall decrease in capital expenditures in Fiscal 2009 as compared to Fiscal 2008. Additionally, the Company spent approximately $1.5 million related to the Final BSE Rule in Fiscal 2009. Capital expenditures related to compliance with environmental regulations were $1.6 million in Fiscal 2009, $1.1 million in Fiscal 2008 and $1.8 million in Fiscal 2007.
Based upon the underlying terms of the Credit Agreement, approximately $5.0 million in current debt, which is included in current liabilities on the Company’s balance sheet at January 2, 2010, will be due during the next twelve months, which includes scheduled quarterly installment payments of $1.25 million.
Based upon the annual actuarial estimate, current accruals, and claims paid during Fiscal 2009, the Company has accrued approximately $4.5 million it expects will become due during the next twelve months in order to meet obligations related to the Company’s self insurance reserves and accrued insurance obligations, which are included in current accrued expenses at January 2, 2010. The self insurance reserve is composed of estimated liability for claims arising for workers’ compensation and for auto liability and general liability claims. The self insurance reserve liability is determined annually, based upon a third party actuarial estimate. The actuarial estimate may vary from year to year, due to changes in costs of health care, the pending number of claims and other factors beyond the control of management of the Company. No assurance can be given that the Company’s funding obligations under its self insurance reserve will not increase in the future.
Based upon current actuarial estimates, the Company expects to make payments of approximately $1.0 million in order to meet minimum pension funding requirements during fiscal 2010. The minimum pension funding requirements are determined annually, based upon a third party actuarial estimate. The actuarial estimate may vary from year to year, due to fluctuations in return on investments or other factors beyond the control of management of the Company or the administrator of the Company’s pension funds. No assurance can be given that the minimum pension funding requirements will not increase in the future. Additionally, the Company has made required and tax deductible discretionary contributions to its pension plans in Fiscal 2009 and Fiscal 2008 of approximately $14.9 million and $6.5 million, respectively.
Page 39

The Pension Protection Act of 2006 (“PPA”) was signed into law in August 2006 and went into effect in January 2008. The stated goal
of the PPA is to improve the funding of pension plans. Plans in an under-funded status will be required to increase employer contributions to improve the funding level within PPA timelines. The impact of recent declines in the world equity and other financial markets have had and could continue to have a material negative impact on pension plan assets and the status of required funding under the PPA. The Company participates in several multi-employer pension plans that provide defined benefits to certain employees covered by labor contracts. These plans are not administered by the Company and contributions are determined in accordance with provisions of negotiated labor contracts. Current information with respect to the Company’s proportionate share of the over- and under-funded status of all actuarially computed value of vested benefits over these pension plans’ net assets is not available as the Company relies on third parties outside its control to provide such information. The Company knows that three of these multi-employer plans were under-funded as of the latest available information, some of which is over a year old. The Company has no ability to compel the plan trustees to provide more current information. In June 2009, the Company received a notice of a mass withdrawal termination and a notice of initial withdrawal liability from one of these underfunded plans. The Company had anticipated this event and as a result had accrued approximately $3.2 million as of January 3, 2009 based on the most recent information that is probable and estimable for this plan. The plan has given a notice of redetermination liability in December 2009 and as a result the Company’s accrued liability at January 2, 2010 has not increased from the original amount as this remains the Company’s best estimate of the liability based on the most recent information that is probable and estimable for the plan. Another of the underfunded multi-employer plans in which the Company participates has given notification of “Critical Status” under the PPA; however, as of January 2, 2010, the Company has not received any further information regarding this Critical Status plan. While the Company has no ability to calculate a possible current liability for under-funded multi-employer plans that could terminate or could require additional funding under the PPA, the amounts could be material.
The Company has the ability to burn alternative fuels, including its fats and greases, at a majority of its plants as a way to help manage the Company’s exposure to high natural gas prices. Beginning October 1, 2006, the federal government effected a program which provides federal tax credits under certain circumstances for commercial use of alternative fuels in lieu of fossil-based fuels. Beginning in the fourth quarter of 2006, the Company filed documentation with the IRS to recover these Alternative Fuel Mixture Credits as a result of its use of fats and greases to fuel boilers at its plants. The Company has received approval from the IRS to apply for these credits. However, the federal regulations relating to the Alternative Fuel Mixture Credits are complex and further clarification is needed by the Company prior to recognition of certain tax credits received. As of January 2, 2010, the Company has $0.7 million of received credits included in current liabilities on the balance sheet as deferred income while the Company pursues further clarification. As of January 2, 2010, this alternative federal tax credit program has expired and has not been extended or reinstituted as of February 24, 2010. Even though bipartisan support for such an extension has been expressed in the U.S. Senate, the Company cannot guarantee that the Alternative Fuel Mixture Credits will be included in any tax credit extender package that may be passed by the U.S. Congress. The Company will, therefore continue to evaluate the option of burning alternative fuels at its plants in future periods depending on the price relationship between alternative fuels and natural gas.
In September 2009, the Company announced that it has joined with a subsidiary of Valero Energy Corporation (“Valero”) to take initial steps towards the formation of a joint venture to build a facility capable of producing over 10,000 barrels per day or 135 million gallons per year of renewable diesel on a site adjacent to Valero’s St. Charles refinery near Norco, Louisiana (the “Joint Venture Project”). The proposed facility is expected to convert grease, primarily animal fats and used cooking oil supplied by the Company, and potentially other feedstocks that become economically and commercially viable into renewable diesel. The Company and Valero have applied for and are jointly seeking a loan guarantee for the proposed Joint Venture Project from the U.S. Department of Energy (the “DOE”) under the Energy Policy Act of 2005 (together with the regulations promulgated thereunder, the “Energy Act”), which makes $8.5 billion of debt financing guarantees available for projects that employ innovative energy efficiency, renewable energy and advanced transmission and distribution technologies (the “DOE Loan Program”). On November 3, 2009, the DOE notified the Company and Valero that it had completed its review of the initial application for the Joint Venture Project and approved the project for further evaluation under the DOE Loan Program. In addition, the DOE informed the Company that the Joint Venture Project may constitute a “1705 Eligible Project” (as defined in the Energy Act), which designation would entitle the joint venture entity to have certain of its loan costs paid for under the DOE loan program. Accordingly, the Company and Valero submitted to the DOE the more detailed Part II submission required to continue in the application process for inclusion of the Joint Venture Project in the DOE Loan Program. The Company and Valero are splitting the costs and expenses related to the Joint Venture Project and the preparation and filing of the application under the DOE Loan Program, which as of the date of this Report have not been significant in amount. The Company and Valero have not yet entered into a joint venture operating agreement with respect to the Joint Venture Project; however, once the joint venture operating agreement has been entered into, certain of the costs and expenses associated with the Joint Venture Project could be incurred in the form of capital contributions to the joint venture entity. The ultimate cost of the Joint Venture Project to the Company cannot be determined until, among other things, further detailed engineering reports and studies have been completed and the amount of funding, if any, approved under the DOE Loan Program is known. It is currently contemplated that the Company and Valero would move forward with the more detailed engineering reports and studies for the Joint Venture Project only if the DOE notifies them following its review of the Part II submission that the Joint Venture Project has been approved for the next phase of the loan approval process, which could occur as early as the first quarter of fiscal 2010. Completion of the Joint Venture Project is contingent, among other things, on (i) the DOE’s approval of the loan application for inclusion in the DOE Loan Program at a sufficient funding level for the parties to agree to proceed with the Joint Venture Project, (ii) the total cost estimate for the Joint Venture Project and (iii) the final approval of the Company’s Board of Directors. Furthermore, even if the Joint Venture Project is accepted in the DOE Loan Program, there is no assurance that the parties will be able to negotiate a loan agreement on acceptable terms. Accordingly, the Company can provide no assurance that the Joint Venture Project will be completed.
Page 40
The Company’s management believes that cash flows from operating activities consistent with the level generated in Fiscal 2009,
unrestricted cash and funds available under the Credit Agreement will be sufficient to meet the Company’s working capital needs and maintenance and compliance-related capital expenditures, scheduled debt and interest payments, income tax obligations, continued funding of the Joint Venture Project and other contemplated needs through the next twelve months. Numerous factors could have adverse consequences to the Company that cannot be estimated at this time, such as: reductions in raw material volumes available to the Company due to weak margins in the meat production industry as a result of higher feed costs or other factors, reduced volume from food service establishments, reduced demand for animal feed, or otherwise; a further reduction in finished product prices; changes to worldwide government policies relating to renewable fuels and greenhouse gas emissions that adversely effect programs like RFS2 and tax credits for biofuels both in the U.S. and abroad; possible product recall resulting from developments relating to the discovery of unauthorized adulterations to food additives; the occurrence of Bird Flu in the U.S.; any additional occurrence of BSE in the U.S. or elsewhere; unanticipated costs and/or reductions in raw material volumes related to the Company’s implementation of and compliance with the Final BSE Rule, including capital expenditures to comply with the Final BSE Rule; unforeseen new U.S. or foreign regulations affecting the rendering industry (including new or modified animal feed, 2009 H1N1 flu, Bird Flu or BSE regulations); increased contributions to the Company’s multi-employer and employer-sponsored defined benefit pension plans as required by the PPA; bad debt write-offs; loss of or failure to obtain necessary permits and registrations; and/or unfavorable export markets. These factors, coupled with volatile prices for natural gas and diesel fuel, general performance of the U.S. economy and declining consumer confidence including the inability of consumers and companies to obtain credit due to the current lack of liquidity in the financial markets, among others, could negatively impact the Company’s results of operations in fiscal 2010 and thereafter. The Company cannot provide assurance that the cash flows from operating activities generated in Fiscal 2009 are indicative of the future cash flows from operating activities that will be generated by the Company’s operations. The Company reviews the appropriate use of unrestricted cash periodically. Except for the potential contributions to the Joint Venture Project, no decision has been made as to non-ordinary course cash usages at this time, potential usages could include: opportunistic capital expenditures and/or acquisitions; investments relating to the Company’s developing a comprehensive renewable energy strategy, including, without limitation, potential investments in additional renewable diesel and/or biodiesel projects; investments in response to governmental regulations relating to BSE or other regulations; unexpected funding required by the PPA requirements; and paying dividends or repurchasing stock, subject to limitations under the Credit Agreement, as well as suitable cash conservation to withstand adverse commodity cycles.
The current economic environment in the Company’s markets has the potential to adversely impact its liquidity in a variety of ways, including through reduced raw materials availability, reduced finished product prices, reduced sales, potential inventory buildup, increased bad debt reserves and/or higher operating costs.
Page 41

The principal products that the Company sells are commodities, the prices of which are based on established commodity markets and
are subject to volatile changes. Any decline in these prices has the potential to adversely impact the Company’s liquidity. Any of a continued decline in raw material availability, a further decline in commodities prices, increases in energy prices and the impact of the PPA has the potential to adversely impact the Company’s liquidity. A decline in commodities prices, a rise in energy prices, a slowdown in the U.S. or international economy, or other factors, could cause the Company to fail to meet management’s expectations or could cause liquidity concerns. CONTRACTUAL OBLIGATIONS AND OTHER COMMERCIAL COMMIT MENTS
The following table summarizes the Company’s expected material contractual payment obligations, including both on- and off-balance sheet arrangements at January 2, 2010 (in thousands):
The Company’s off-balance sheet contractual obligations and commercial commitments as of January 2, 2010 relate to operating lease obligations, letters of credit, forward purchase agreements, and employment agreements. The Company has excluded these items from the balance sheet in accordance with accounting principles generally accepted in the U.S. The following table summarizes the Company’s other commercial commitments, including both on- and off-balance sheet arrangements at January 2, 2010 (in thousands):
Total
Less than 1 Year
1 – 3 Years
3 – 5 Years
More than 5 Years
Contractual obligations(a):
Long-term debt obligations (b)
$ 32,500 $ 5,000 $27,500 $ – $ –
Operating lease obligations (c)
43,561 10,520 15,322 6,732 10,987
Estimated interest payable (d)
3,197 1,303 1,779 115 –
Purchase commitments (e)
6,886 6,886 – – –
Derivative obligations (f) 2,476 1,487 989 – –Pension funding obligation (g)
1,029 1,029 – – –
Other obligations 48 9 19 20 – Total $ 89,697 $ 26,234 $ 45,609 $ 6,867 $ 10,987
(a) The above table does not reflect uncertain tax positions of approximately $0.1 million because the timing of the cash settlement cannot be reasonably estimated.
(b) See Note 9 to the consolidated financial statements.
(c) See Note 8 to the consolidated financial statements.
(d) Interest payable was calculated using the current rate for term debt and current rates on other liabilities.
(e) Purchase commitments were determined based on specified contracts for natural gas, diesel fuel and finish product purchases.
(f) Represents liabilities for interest rate swap contracts and inventory swap contracts that were valued at January 2, 2010. The ultimate settlement amounts of these swap contracts are unknown because they are subject to continuing market risk until the derivatives are settled.
(g) Pension funding requirements are determined annually based upon a third party actuarial estimate. The Company expects to make approximately $1.0 million in required contributions to its pension plan in fiscal 2010. The Company is not able to estimate pension funding requirements beyond the next twelve months. The accrued pension benefit liability was approximately $19.1 million at the end of Fiscal 2009. The Company knows that one of the multi-employer pension plans that has not terminated to which it contributes and which is not administered by the Company was under-funded as of the latest available information, and while the Company has no ability to calculate a possible current liability for the under-funded multi-employer plan to which the Company contributes, the amounts could be material.
Other commercial commitments: Standby letters of credit $ 15,852 Total other commercial commitments: $ 15,852

Page 42
OFF BALANCE SHEET OBLIGATIONS
Based upon the underlying purchase agreements, the Company has commitments to purchase $6.9 million of commodity products, consisting of approximately $1.8 million of finished products and approximately $5.1 million of natural gas and diesel fuel, during the next twelve months, which are not included in liabilities on the Company’s balance sheet at January 2, 2010. These purchase agreements are entered into in the normal course of the Company’s business and are not subject to derivative accounting. The commitments will be recorded on the balance sheet of the Company when delivery of these commodities occurs and ownership passes to the Company during fiscal 2010, in accordance with accounting principles generally accepted in the U.S.
Based upon underlying lease agreements, the Company expects to pay approximately $10.5 million in operating lease obligations during fiscal 2010 which are not included in liabilities on the Company’s balance sheet at January 2, 2010. These lease obligations are included in cost of sales or selling, general and administrative expense on the Company’s Statement of Operations as the underlying lease obligation comes due, in accordance with accounting principles generally accepted in the U.S. CRITICAL ACCOUNTING POLICIES The Company follows certain significant accounting policies when preparing its consolidated financial statements. A complete summary of these policies is included in Note 1 to the Consolidated Financial Statements. Certain of the policies require management to make significant and subjective estimates or assumptions that may deviate from actual results. In particular, management makes estimates regarding valuation of inventories, estimates of useful life of long-lived assets related to depreciation and amortization expense, estimates regarding fair value of the Company’s reporting units and future cash flows with respect to assessing potential impairment of both long-lived assets and goodwill, self-insurance, environmental and litigation reserves, pension liability, estimates of income tax expense, and estimates of expense related to stock options granted. Each of these estimates is discussed in greater detail in the following discussion. Inventories The Company’s inventories are valued at the lower of cost or market. Finished product manufacturing cost is calculated using the first-in, first-out (FIFO) method, based upon the Company’s raw material costs, collection and factory production operating expenses, and depreciation expense on collection and factory assets. Market values of inventory are estimated at each plant location, based upon either: 1) the backlog of unfilled sales orders at the balance sheet date; or 2) unsold inventory, calculated using regional finished product prices quoted in the Jacobsen index at the balance sheet date. Estimates of market value, based upon the backlog of unfilled sales orders or upon the Jacobsen index, assume that the inventory held by the Company at the balance sheet date will be sold at the estimated market finished product sales price, subsequent to the balance sheet date. Actual sales prices received on future sales of inventory held at the end of a period may vary from either the backlog unfilled sales order price or the Jacobsen index quotation at the balance sheet date. These variances could cause actual sales prices realized on future sales of inventory to be different than the estimate of market value of inventory at the end of the period. Inventories were approximately $19.1 million and $22.2 million at January 2, 2010 and January 3, 2009, respectively. Long-Lived Assets, Depreciation and Amortization Expense and Valuation The Company’s property, plant and equipment are recorded at cost when acquired. Depreciation expense is computed on property, plant and equipment based upon a straight line method over the estimated useful life of the assets, which is based upon a standard classification of the asset group. Buildings and improvements are depreciated over a useful life of 15 to 30 years, machinery and equipment are depreciated over a useful life of 3 to 10 years and vehicles are depreciated over a life of 2 to 6 years. These useful life estimates have been developed based upon the Company’s historical experience of asset life utility, and whether the asset is new or used when placed in service. The actual life and utility of the asset may vary from this estimated life. Useful lives of the assets may be modified from time to time when the future utility or life of the asset is deemed to change from that originally estimated when the asset was placed in service. Depreciation expense was approximately $21.4 million, $19.3 million and $18.3 million in fiscal years ending January 2, 2010, January 3, 2009 and December 29, 2007, respectively.
Page 43
The Company’s intangible assets, including permits, routes, non-compete agreements and royalty and consulting agreements are recorded at fair value when acquired. Amortization expense is computed on these intangible assets based upon a straight line method over the estimated useful life of the assets, which is based upon a standard classification of the asset group. Collection routes are amortized over a useful life of 8 to 20 years; non-compete agreements are amortized over a useful life of 4 to 7 years; royalty and consulting agreements are amortized over the term of the agreement; and permits are amortized over a useful life of 20 years. The actual economic life and utility of the asset may vary from this estimated life. Useful lives of the assets may be modified from time to time when the future utility or life of the asset is deemed to change from that originally estimated when the asset was placed in service. Intangible asset amortization expense was approximately $3.8 million, $5.2 million and $4.9 million in fiscal years ending January 2, 2010, January 3, 2009 and December 29, 2007, respectively.
The Company reviews the carrying value of long-lived assets for impairment when events or changes in circumstances indicate that the carrying amount of an asset, or related asset group, may not be recoverable from estimated future undiscounted cash flows. Recoverability of assets to be held and used is measured by a comparison of the carrying amount of an asset or asset group to estimated undiscounted future cash flows expected to be generated by the asset or asset group. If the carrying amount of the asset exceeds its estimated future cash flows, an impairment charge is recognized by the amount by which the carrying amount of the asset exceeds the fair value of the asset. During the fourth quarter of Fiscal 2008, due to lower commodity markets and the loss of certain large raw material suppliers, the Company performed testing of all its long-lived assets for impairment based on future undiscounted cash flows and has determined during this testing process that no impairment exists for its long-lived assets. In Fiscal 2009, no triggering event occurred requiring that the Company perform testing of all of its long-lived assets for impairment. The net book value of property, plant and equipment was approximately $152.0 million and $143.3 million at January 2, 2010 and January 3, 2009, respectively. The net book value of intangible assets was approximately $40.3 million and $36.0 million at January 2, 2010 and January 3, 2009, respectively. Goodwill Valuation The Company reviews the carrying value of goodwill on a regular basis, including at the end of each fiscal year, for indications of impairment at each reporting unit that has recorded goodwill as an asset. Impairment is indicated whenever the carrying value of a reporting unit exceeds the estimated fair value of a reporting unit. For purposes of evaluating impairment of goodwill, the Company estimates fair value of a reporting unit, based upon future discounted net cash flows. In calculating these estimates, actual historical operating results and anticipated future economic factors, such as future business volume, future finished product prices, and future operating costs and expenses are evaluated and estimated as a component of the calculation of future discounted cash flows for each reporting unit with recorded goodwill. The estimates of fair value of these reporting units and of future discounted net cash flows from operation of these reporting units could change if actual volumes, prices, costs or expenses vary from these estimates. Based on the Company’s annual impairment testing at the end of the fourth quarter of Fiscal 2008, it was determined that goodwill was impaired due to lower commodity markets and the loss of certain large raw material suppliers in the fourth quarter of Fiscal 2008, which resulted in the Company recording an impairment charge of approximately $15.9 million based on future discounted net cash flows. In addition, a future reduction of earnings in the reporting units with recorded goodwill could result in future impairment charges because the estimate of fair value would be negatively impacted by a reduction of earnings at those reporting units. Based on the Company’s annual impairment testing at the end of the fourth quarter of Fiscal 2009, the fair values of the Company’s reporting units containing goodwill exceeded the related carrying value. Goodwill was approximately $79.1 million and $61.1 million at January 2, 2010 and January 3, 2009, respectively.
Page 44

Self Insurance, Environmental and Legal Reserves The Company’s workers compensation, auto and general liability policies contain significant deductibles or self insured retentions. The Company estimates and accrues for its expected ultimate claim costs related to accidents occurring during each fiscal year and carries this accrual as a reserve until these claims are paid by the Company. In developing estimates for self insured losses, the Company utilizes its staff, a third party actuary and outside counsel as sources of information and judgment as to the expected undiscounted future costs of the claims. The Company accrues reserves related to environmental and litigation matters based on estimated undiscounted future costs. With respect to the Company’s self insurance, environmental and litigation reserves, estimates of reserve liability could change if future events are different than those included in the estimates of the actuary, consultants and management of the Company. The reserve for self insurance, environmental and litigation contingencies included in accrued expenses and other non-current liabilities for which there are no potential insurance recoveries was approximately $15.6 million and $17.3 million at January 2, 2010 and January 3, 2009, respectively. Pension Liability The Company provides retirement benefits to employees under separate final-pay noncontributory pension plans for salaried and hourly employees (excluding those employees covered by a union-sponsored plan), who meet service and age requirements. Benefits are based principally on length of service and earnings patterns during the five years preceding retirement. Pension expense and pension liability recorded by the Company is based upon an annual actuarial estimate provided by a third party administrator. Factors included in estimates of current year pension expense and pension liability at the balance sheet date include estimated future service period of employees, estimated future pay of employees, estimated future retirement ages of employees, and the projected time period of pension benefit payments. Two of the most significant assumptions used to calculate future pension obligations are the discount rate applied to pension liability and the expected rate of return on pension plan assets. These assumptions and estimates are subject to the risk of change over time, and each factor has inherent uncertainties which neither the actuary nor the Company is able to control or to predict with certainty. See Note 13 of Notes to Consolidated Financial Statements for summaries of pension plans. The discount rate applied to the Company’s pension liability is the interest rate used to calculate the present value of the pension benefit obligation. The weighted average discount rate was 5.90% and 6.10% at January 2, 2010 and January 3, 2009, respectively. The net periodic benefit cost for fiscal 2010 would increase by approximately $0.8 million if the discount rate was 0.5% lower at 5.40%. The net periodic benefit cost for fiscal 2010 would decrease by approximately $0.7 million if the discount rate was 0.5% higher at 6.40%. The expected rate of return on the Company’s pension plan assets is the interest rate used to calculate future returns on investment of the plan assets. The expected return on plan assets is a long-term assumption whose accuracy can only be assessed over a long period of time. The weighted average expected return on pension plan assets was 8.10% for Fiscal 2009 and Fiscal 2008, respectively. During Fiscal 2009, the Company’s actual return on pension plan assets was a gain of $12.8 million or approximately 21% of pension plan assets as compared to Fiscal 2008 where the Company’s actual return on pension plan assets was a loss of $22.9 million or approximately 28% of pension plan assets. The Company has recorded a pension liability of approximately $19.1 million and $36.3 million at January 2, 2010 and January 3, 2009, respectively. The Company’s net pension cost was approximately $6.3 million, $0.4 million and $3.0 million for the fiscal years ending January 2, 2010, January 3, 2009 and December 29, 2007, respectively. The projected net periodic pension expense for fiscal 2010 is expected to decrease by approximately $2.4 million as compared to Fiscal 2009.
Page 45
Income Taxes
In calculating net income, the Company includes estimates in the calculation of income tax expense, the resulting tax liability and in future realization of deferred tax assets that arise from temporary differences between financial statement presentation and tax recognition of revenue and expense. The Company’s deferred tax assets include a net operating loss carry-forward which is limited to approximately $0.7 million per year in future utilization due to the change in control resulting from the May 2002 recapitalization of the Company. Valuation allowances for deferred tax assets are recorded when it is more likely than not that deferred tax assets will not be realized. Based upon the Company’s evaluation of these matters, a portion of the Company’s net operating loss carry-forwards will expire unused. The valuation allowance established to provide a reserve against these deferred tax assets was approximately $0.2 million at January 2, 2010 and January 3, 2009, respectively. Stock Option Expense
The calculation of expense of stock options issued utilizes the Black-Scholes mathematical model which estimates the fair value of the option award to the holder and the compensation expense to the Company, based upon estimates of volatility, risk-free rates of return at the date of issue and projected vesting of the option grants. The Company recorded compensation expense related to stock options expense for the year ended January 2, 2010, January 3, 2009 and December 29, 2007 of approximately $0.1 million, $0.2 million and $0.4 million, respectively. NEW ACCOUNTING PRONOUNCEMENTS
In December 2007, the FASB issued revised guidance under ASC Topic 805, Business Combinations (“ASC 805”) . The new provisions of ASC 805 apply to all transactions and other events in which one entity obtains control over one or more other businesses. ASC 805 requires an acquirer, upon initially obtaining control of another entity, to recognize the assets, liabilities and any non-controlling interest in the acquiree at fair value as of the acquisition date. Contingent consideration is required to be recognized and measured at fair value on the date of acquisition rather than at a later date when the amount of that consideration may be determinable beyond a reasonable doubt. This fair value approach replaces the cost-allocation process required under the pre-codification SFAS 141 whereby the cost of an acquisition was allocated to the individual assets acquired and liabilities assumed based on their estimated fair value. ASC 805 requires acquirers to expense acquisition related costs as incurred rather than allocating these costs to assets acquired and liabilities assumed, as was done under the pre-codification SFAS 141. The new provisions of ASC 805 were adopted by the Company on January 4, 2009. The effect of this standard depends on acquisition activity and its relative size to the Company. During fiscal 2009 the Company did have acquisition activity as discussed in Note 2 Acquisitions and Dispositions. The adoption of ASC 805 did not have a material impact on the determination or reporting of the Company’s financial results for the period ended January 2, 2010.
In December 2007, the FASB issued guidance under ASC Topic 810, Consolidation (“ASC 810”). These new provisions of ASC 810 establishes new standards that will govern the accounting for and reporting of (1) noncontrolling interests in partially owned consolidated subsidiaries and (2) the loss of control of subsidiaries. ASC 810 was adopted by the Company on January 4, 2009 on a prospective basis. The adoption of these new provisions of ASC 810 did not have an impact to the consolidated financial statements of the Company.
In March 2008, the FASB issued guidance under ASC Topic 815, Derivatives and Hedging ("ASC 815"). These new provisions of ASC 815 are intended to improve transparency in financial reporting by requiring enhanced disclosures of an entity’s derivative instruments and hedging activities and their effects on the entity’s financial position, financial performance, and cash flows. These new provisions apply to all derivative instruments within the scope of ASC 815 as well as related hedged items, bifurcated derivatives, and nonderivative instruments that are designated and qualify as hedging instruments. The fair value of derivative instruments and their gains and losses will need to be presented in tabular format in order to present a more complete picture of the effects of using derivative instruments. The Company adopted these new provisions of ASC 815 effective January 4, 2009. The adoption of this new guidance did not have a material effect to the consolidated financial statements of the Company.
Page 46

In April 2008, the FASB issued guidance under ASC Topic 350, Intangibles-Goodwill and Other (“ASC 350”). The new provisions of
ASC 350 amend the factors that should be considered in developing renewal or extension assumptions used to determine the useful life of a recognized intangible asset. ASC 350 was adopted on January 4, 2009. The adoption of ASC 350 did not have a material effect to the consolidated financial statements of the Company.
In December 2008, the FASB issued guidance under ASC Topic 715, Compensation – Retirement Benefits (“ASC 715”) to provide guidance on an employer’s disclosures about plan assets of a defined benefit pension or other postretirement plan on investment policies and strategies, major categories of plan assets, inputs and valuation techniques used to measure the fair value of plan assets and significant concentrations of risk within plan assets. The disclosures about plan assets required by ASC 715 are effective for fiscal years ending after December 15, 2009, with earlier application permitted. Upon initial application, the provisions of ASC 715 are not required for earlier periods that are presented for comparative purposes. The adoption of these new provisions of ASC 715 did not have a material effect to the consolidated financial statement of the Company.
In April 2009, the FASB issued guidance under ASC Topic 805, Business Combinations . This new guidance amends and clarifies ASC 805 to address application on initial recognition and measurement, subsequent measurement and accounting and disclosure of assets and liabilities arising from contingencies in a business combination. The Company’s adoption of this new guidance did not have a material impact on the determination or reporting of the Company’s financial results for the period ended January 2, 2010.
In April 2009, the FASB issued guidance under ASC Topic 825, Financial Instruments (“ASC 825”). ASC 825 requires disclosures about fair value of financial instruments for interim reporting periods as well as in annual financial statements. ASC 825 is effective for interim reporting periods ending after June 15, 2009. The Company’s adoption of ASC 825 did not have a material impact on the consolidated financial statements of the Company.
In May 2009, the FASB issued ASC Topic 855, Subsequent Events (“ASC 855”) effective for interim or annual periods ending after June 15, 2009. The objective of ASC 855 is to establish general standards of accounting for and disclosures of events that occur after the balance sheet date but before financial statements are issued or are available to be issued. ASC 855 also requires entities to disclose the date through which subsequent events were evaluated as well as the rationale for why that date was selected. The adoption of ASC 855 did not have a material effect to the consolidated financial statements of the Company.
In June 2009, the FASB issued ASU 2009-01, Topic 105, Generally Accepted Accounting Policies (“ASC 105”). ASC 105 established the ASC as the source of authoritative U.S. generally accepted accounting principles (“U.S. GAAP”) recognized by the FASB to be applied by nongovernmental entities in the preparation of financial statements in conformity of U.S. GAAP. ASC does not change current U.S. GAAP, but is intended to simplify user access to all authoritative U.S. GAAP by providing all the authoritative literature related to a particular topic in one place. ASC is effective for interim and annual periods ending after September 15, 2009. The adoption of ASC 105 has changed how the Company references various elements of U.S GAAP when preparing the Company’s financial statement disclosures, but did not have an impact on the consolidated financial statements of the Company.
In December 2009, the FASB issued ASU 2009-17 which codifies SFAS No. 167, Amendments to FASB Interpretation 46(R) issued in June 2009. ASU 2009-17 changes how a company determines when an entity that is insufficiently capitalized or is not controlled through voting (or similar rights) should be consolidated. ASU 2009-17 requires additional disclosures about a company’s involvement with variable interest entities and any significant changes in risk exposure due to that involvement. The Company is required to adopt ASU 2009-17 on January 3, 2010 and is currently evaluating the impact of adopting this new standard. FORWARD LOOKING STATEMENTS This Annual Report on Form 10-K includes “forward-looking” statements that involve risks and uncertainties. The words “believe,”“anticipate,” “expect,” “estimate,” “intend,” and similar expressions identify forward-looking statements. All statements other than statements of historical facts included in the Annual Report on Form 10-K, including, without limitation, the statements under the sections entitled “Business,” “Management’s Discussion and Analysis of Financial Condition and Results of Operations” and “Legal Proceedings” and located elsewhere herein regarding industry prospects and the Company’s financial position are forward-looking statements. Actual results could differ materially from those discussed in the forward-looking statements as a result of certain factors, including many that are beyond the control of the Company. Although the Company believes that the expectations reflected in these forward-looking statements are reasonable, it can give no assurance that these expectations will prove to be correct.
Page 47
In addition to those factors discussed under the heading “Risk Factors” in Item 1A of this report and elsewhere in this report, and in the
Company’s other public filings with the SEC, important factors that could cause actual results to differ materially from the Company’s expectations include: the Company’s continued ability to obtain sources of supply for its rendering operations; general economic conditions in the American, European and Asian markets; a decline in consumer confidence; prices in the competing commodity markets which are volatile and are beyond the Company’s control; energy prices; changes to worldwide government policies relating to renewable fuels and greenhouse gas emissions; the implementation of the Final BSE Feed Rule; BSE and its impact on finished product prices, export markets, energy prices and government regulations, which are still evolving and are beyond the Company’s control; the occurrence of Bird Flu in the U.S.; possible product recall resulting from developments relating to the discovery of unauthorized adulterations (such as melamine) to food additives; and increased contributions to the Company’s multi-employer defined benefit pension plans as required by the PPA. Among other things, future profitability may be affected by the Company’s ability to grow its business, which faces competition from companies that may have substantially greater resources than the Company. The Company cautions readers that all forward-looking statements speak only as of the date made, and the Company undertakes no obligation to update any forward-looking statements, whether as a result of changes in circumstances, new events or otherwise. ITEM 7A. QUANTITATIVE AND QUALITATIVE DISCLOSURES ABOUT MARKET RISK
Market risks affecting the Company are exposures to changes in prices of the finished products the Company sells, interest rates on debt, availability of raw material supply and the price of natural gas and diesel fuel used in the Company’s plants. Raw materials available to the Company are impacted by seasonal factors, including holidays, when raw material volume declines; warm weather, which can adversely affect the quality of raw material processed and finished products produced; and cold weather, which can impact the collection of raw material. Predominantly all of the Company’s finished products are commodities that are generally sold at prices prevailing at the time of sale.
The Company makes limited use of derivative instruments to manage cash flow risks related to interest expense, natural gas usage, diesel fuel usage and inventory. Interest rate swaps are entered into with the intent of managing overall borrowing costs by reducing the potential impact of increases in interest rates on floating-rate long-term debt. Natural gas swaps and collars are entered into with the intent of managing the overall cost of natural gas usage by reducing the potential impact of seasonal weather demands on natural gas that increases natural gas prices. Heating oil swaps are entered into with the intent of managing the overall cost of diesel fuel usage by reducing the potential impact of seasonal weather demands on diesel fuel that increases diesel fuel prices. Inventory swaps are entered into with the intent of managing seasonally high concentrations of protein, BFT and YG inventories by reducing the potential impact of decreasing prices. The interest rate swaps and the natural gas swaps are subject to the requirements of ASC 815. Some of the Company’s natural gas and diesel fuel instruments are not subject to the requirements of ASC 815, because some of the natural gas and diesel fuel instruments qualify as normal purchases as defined in the ASC 815. The Company does not use derivative instruments for trading purposes.
On May 19, 2006, the Company entered into two interest rate swap agreements that are considered cash flow hedges according to ASC 815. Under the terms of these swap agreements, beginning June 30, 2006, the cash flows from the Company’s $50.0 million floating-rate term loan facility under the Credit Agreement have been exchanged for fixed rate contracts that bear interest, payable quarterly. The first swap agreement for $25.0 million matures April 7, 2012 and bears interest at 5.42%, which does not include the borrowing spread per the Credit Agreement, with amortizing payments that mirror the term loan facility. The second swap agreement for $25.0 million matures April 7, 2012 and bears interest at 5.415%, which does not include the borrowing spread per the Credit Agreement, with amortizing payments that mirror the term loan facility. The Company’s receive rate on each swap agreement is based on three-month LIBOR. At January 2, 2010, the fair value of these interest swap agreements was $2.5 million and is included in non-current liabilities on the balance sheet, with an offset recorded to accumulated other comprehensive income for the effective portion and other expense for the ineffective portion of the interest rate swap .
Page 48

On November 13, 2009, the Company entered into natural gas swap contracts that are considered cash flow hedges according to ASC 815. Under the terms of the natural gas swap contracts the Company fixed the expected purchase cost of 480,000 mmbtu’s of natural gas representing a portion of its plants expected usage for the months of January 2010 through March 2010 at a fixed rate of $4.84 per mmbtu. At January 2, 2010, the fair value of these natural gas swap contracts was $0.2 million and is included in other current assets on the balance sheet, with an offset recorded to accumulated other comprehensive income for the effective portion and other expense for the ineffective portion.
Additionally, the Company had heating oil swaps and inventory swaps that are marked to market because they did not qualify for hedge accounting at January 2, 2010. The heating oil swaps had a fair value of approximately $0.1 million and are included in other current assets at January 2, 2010. The inventory swaps did not have a material effect on the Company’s consolidated financial statements at January 2, 2010.
As of January 2, 2010, the Company had forward purchase agreements in place for purchases of approximately $5.1 million of natural gas and diesel fuel in fiscal 2010. As of January 2, 2010, the Company had forward purchase agreements in place for purchases of approximately $1.8 million of finished product in fiscal 2010. Interest Rate Sensitivity
The Company’s obligations subject to fixed or variable interest rates include (in thousands, except interest rates):
The Company has $32.5 million in variable rate debt, which is made up of the Company’s term debt whose interest risk is hedged by interest rate swaps discussed above and represents the balance outstanding at January 2, 2010 under the Credit Agreement. The Company estimates that if the debt was not hedged under the interest rate swap a 1% increase in interest rates would increase the Company’s interest expense by approximately $0.3 million in fiscal 2009.
Total
Less than 1 Year
1 – 3 Years
3 – 5 Years
More than 5 Years
Long-term debt: Fixed rate $ 48 $ 9 $ 19 $ 20 $ – Average interest rate
5.75% 5.75% 5.75% 5.75% –
Variable rate 32,500 5,000 27,500 – – Average interest rate
2.81% 2.81% 2.81% 2.81% –
Total $ 32,548 $ 5,009 $ 27,519 $ 20 $ –
Page 49

ITEM 8. FINANCIAL STATEMENTS AND SUPPLEMENTARY D ATA
INDEX TO CONSOLIDATED FINANCIAL STATEMENTS
All other schedules are omitted since the required information is not present or is not present in amounts sufficient to require submission of the schedule, or because the information required is included in the consolidated financial statements and notes thereto.
Page Report of Independent Registered Public Accounting Firm on Consolidated Financial Statements 51
Report of Independent Registered Public Accounting Firm on Internal Control Over Financial Reporting 52
Consolidated Balance Sheets - January 2, 2010 and January 3, 2009 53 Consolidated Statements of Operations - Three years ended January 2, 2010 54 Consolidated Statements of Stockholders’ Equity and Comprehensive Income(Loss) - Three years ended January 2, 2010 55 Consolidated Statements of Cash Flows - Three years ended January 2, 2010 57 Notes to Consolidated Financial Statements 58 Financial Statement Schedule: II - Valuation and Qualifying Accounts - Three years ended January 2, 2010 91
Page 50

DARLING INTERNATIONAL INC. AND SUBSIDIARIES
Report of Independent Registered Public Accounting Firm The Board of Directors and Stockholders Darling International Inc.: We have audited the consolidated financial statements of Darling International Inc. and subsidiaries as listed in the accompanying index. In connection with our audits of the consolidated financial statements, we also have audited the financial statement schedule as listed in the accompanying index. These consolidated financial statements and financial statement schedule are the responsibility of the Company’s management. Our responsibility is to express an opinion on these consolidated financial statements and financial statement schedule based on our audits. We conducted our audits in accordance with the standards of the Public Company Accounting Oversight Board (United States). Those standards require that we plan and perform the audit to obtain reasonable assurance about whether the financial statements are free of material misstatement. An audit includes examining, on a test basis, evidence supporting the amounts and disclosures in the financial statements. An audit also includes assessing the accounting principles used and significant estimates made by management, as well as evaluating the overall financial statement presentation. We believe that our audits provide a reasonable basis for our opinion. In our opinion, the consolidated financial statements referred to above present fairly, in all material respects, the financial position of Darling International Inc. and subsidiaries as of January 2, 2010 and January 3, 2009, and the results of their operations and their cash flows for each of the years in the three-year period ended January 2, 2010, in conformity with U.S. generally accepted accounting principles. Also in our opinion, the related financial statement schedule, when considered in relation to the basic consolidated financial statements taken as a whole, presents fairly, in all material respects, the information set forth therein. We also have audited, in accordance with the standards of the Public Company Accounting Oversight Board (United States), Darling International Inc.’s internal control over financial reporting as of January 2, 2010, based on criteria established in Internal Control – Integrated Framework issued by the Committee of Sponsoring Organizations of the Treadway Commission (COSO), and our report dated March 3, 2010 expressed an unqualified opinion on the effectiveness of the Company’s internal control over financial reporting.
(signed) KPMG LLP Dallas, Texas March 3, 2010
Page 51

DARLING INTERNATIONAL INC. AND SUBSIDIARIES
Report of Independent Registered Public Accounting Firm
The Board of Directors and Stockholders Darling International Inc.: We have audited Darling International Inc.’s internal control over financial reporting as of January 2, 2010, based on criteria established in Internal Control – Integrated Framework issued by the Committee of Sponsoring Organizations of the Treadway Commission (COSO). Darling International Inc.’s management is responsible for maintaining effective internal control over financial reporting and for its assessment of the effectiveness of internal control over financial reporting, included in the accompanying Management’s Annual Report on Internal Control over Financial Reporting . Our responsibility is to express an opinion on the Company’s internal control over financial reporting based on our audit. We conducted our audit in accordance with the standards of the Public Company Accounting Oversight Board (United States). Those standards require that we plan and perform the audit to obtain reasonable assurance about whether effective internal control over financial reporting was maintained in all material respects. Our audit included obtaining an understanding of internal control over financial reporting, assessing the risk that a material weakness exists, and testing and evaluating the design and operating effectiveness of internal control based on the assessed risk. Our audit also included performing such other procedures as we considered necessary in the circumstances. We believe that our audit provides a reasonable basis for our opinion. A company’s internal control over financial reporting is a process designed to provide reasonable assurance regarding the reliability of financial reporting and the preparation of financial statements for external purposes in accordance with generally accepted accounting principles. A company’s internal control over financial reporting includes those policies and procedures that (1) pertain to the maintenance of records that, in reasonable detail, accurately and fairly reflect the transactions and dispositions of the assets of the company; (2) provide reasonable assurance that transactions are recorded as necessary to permit preparation of financial statements in accordance with generally accepted accounting principles, and that receipts and expenditures of the company are being made only in accordance with authorizations of management and directors of the company; and (3) provide reasonable assurance regarding prevention or timely detection of unauthorized acquisition, use, or disposition of the company’s assets that could have a material effect on the financial statements. Because of its inherent limitations, internal control over financial reporting may not prevent or detect misstatements. Also, projections of any evaluation of effectiveness to future periods are subject to the risk that controls may become inadequate because of changes in conditions, or that the degree of compliance with the policies or procedures may deteriorate. In our opinion, Darling International Inc. maintained, in all material respects, effective internal control over financial reporting as of January 2, 2010, based on criteria established in Internal Control – Integrated Framework issued by the Committee of Sponsoring Organizations of the Treadway Commission (COSO). We also have audited, in accordance with the standards of the Public Company Accounting Oversight Board (United States), the consolidated financial statements of Darling International Inc. and subsidiaries as listed in the accompanying index, and our report dated March 3, 2010 expressed an unqualified opinion on those consolidated financial statements.
(signed) KPMG LLP Dallas, Texas March 3, 2010
Page 52
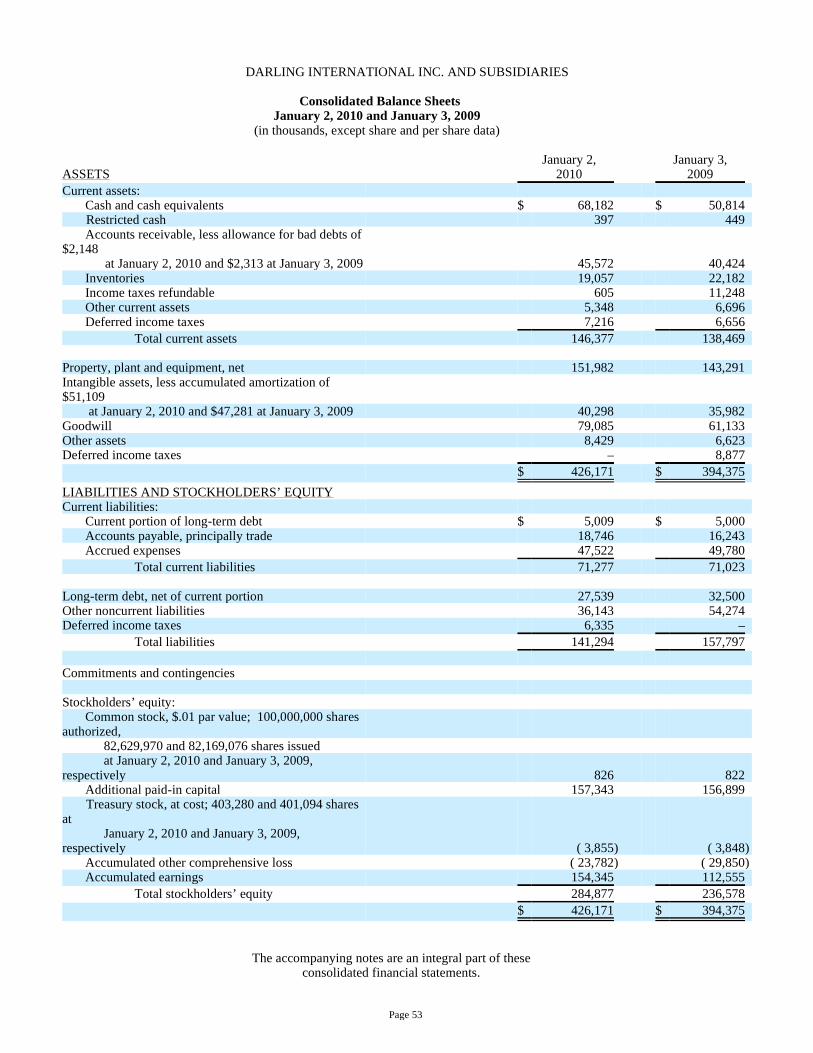
DARLING INTERNATIONAL INC. AND SUBSIDIARIES
Consolidated Balance Sheets January 2, 2010 and January 3, 2009
(in thousands, except share and per share data)
The accompanying notes are an integral part of these consolidated financial statements.
ASSETS
January 2, 2010
January 3, 2009
Current assets: Cash and cash equivalents $ 68,182 $ 50,814
Restricted cash 397 449 Accounts receivable, less allowance for bad debts of $2,148 at January 2, 2010 and $2,313 at January 3, 2009 45,572 40,424 Inventories 19,057 22,182 Income taxes refundable 605 11,248 Other current assets 5,348 6,696 Deferred income taxes 7,216 6,656 Total current assets 146,377 138,469 Property, plant and equipment, net 151,982 143,291 Intangible assets, less accumulated amortization of $51,109 at January 2, 2010 and $47,281 at January 3, 2009 40,298 35,982 Goodwill 79,085 61,133 Other assets 8,429 6,623 Deferred income taxes – 8,877 $ 426,171 $ 394,375
LIABILITIES AND STOCKHOLDERS’ EQUITY Current liabilities: Current portion of long-term debt $ 5,009 $ 5,000 Accounts payable, principally trade 18,746 16,243 Accrued expenses 47,522 49,780 Total current liabilities 71,277 71,023 Long-term debt, net of current portion 27,539 32,500 Other noncurrent liabilities 36,143 54,274 Deferred income taxes 6,335 – Total liabilities 141,294 157,797 Commitments and contingencies Stockholders’ equity: Common stock, $.01 par value; 100,000,000 shares authorized,
82,629,970 and 82,169,076 shares issued at January 2, 2010 and January 3, 2009,
respectively 826 822 Additional paid-in capital 157,343 156,899
Treasury stock, at cost; 403,280 and 401,094 shares at
January 2, 2010 and January 3, 2009, respectively ( 3,855 ) ( 3,848 ) Accumulated other comprehensive loss ( 23,782 ) ( 29,850 ) Accumulated earnings 154,345 112,555 Total stockholders’ equity 284,877 236,578 $ 426,171 $ 394,375
Page 53


DARLING INTERNATIONAL INC. AND SUBSIDIARIES
Consolidated Statements of Operations
Three years ended January 2, 2010 (in thousands, except per share data)
The accompanying notes are an integral part of these consolidated financial statements.
January 2,
2010 January 3,
2009 December 29,
2007 Net sales $ 597,806 $ 807,492 $ 645,313 Costs and expenses: Cost of sales and operating expenses 440,111 614,708 483,453 Selling, general and administrative expenses 61,530 59,761 57,999 Depreciation and amortization 25,226 24,433 23,214 Goodwill impairment – 15,914 –
Total costs and expenses 526,867 714,816 564,666 Operating income 70,939 92,676 80,647
Other income/(expense): Interest expense ( 3,105 ) ( 3,018 ) ( 5,045 ) Other, net (955 ) 258 ( 570 )
Total other income/(expense) ( 4,060 ) ( 2,760 ) ( 5,615 ) Income from operations before income taxes 66,879 89,916 75,032 Income taxes 25,089 35,354 29,499 Net income $ 41,790 $ 54,562 $ 45,533
Net income per share:
Basic $ 0.51 $ 0.67 $ 0.56
Diluted $ 0.51 $ 0.66 $ 0.56
Page 54

DARLING INTERNATIONAL INC. AND SUBSIDIARIES
Consolidated Statements of Stockholders’ Equity and Comprehensive Income(Loss)
Three years ended January 2, 2010 (in thousands, except share data)
Common Stock
Number of Outstanding
Shares
$.01 par Value
Additional Paid-In Capital
Treasury
Stock
Accumulated Other
Compre- hensive Loss
Retained Earnings
Total Stockholders’
Equity Balances at December 30, 2006 80,854,453 $ 809 $ 150,045 $ (172 ) $ (11,733 ) $ 12,376 $ 151,325
Net income – – – – – 45,533 45,533 Unrecognized net actuarial loss of defined benefit plans: Pension liability adjustments, net of tax – – – – 3,870 – 3,870 Interest rate swap derivative adjustment, net of tax – – – – (735 ) – (735 ) Total comprehensive income – – – – – – 48,668 Adjustment for uncertain tax position adoption – – – – – 141 141 Stock-based compensation – – 365 – – – 365 Tax benefits associated with stock-based compensation – – 1,223 – – – 1,223 Treasury stock (161,366 ) – – (1,375 ) – – (1,375 ) Issuance of common stock 669,013 6 631 – – – 637 Balances at December 29, 2007 81,362,100 $ 815 $ 152,264 $ (1,547 ) $ (8,598 ) $ 58,050 $ 200,984
Net income – – – – – 54,562 54,562 Unrecognized net actuarial loss of defined benefit plans: Pension liability adjustments, net of tax – – – – (20,386 ) – (20,386 ) Interest rate swap derivative adjustment, net of tax – – – – (937 ) – (937 ) Total comprehensive income – – – – – – 33,239 Adjustment effect of actuarially determined pension liabilities measurement adoption, net of tax – – – – 71 (57 ) 14 Issuance of non-vested stock 50,558 1 702 – – – 703 Stock-based compensation – – (127 ) – – – (127 ) Tax benefits associated with stock-based compensation – – 2,308 – – – 2,308 Treasury stock (218,728 ) – – (2,301 ) – – (2,301 ) Issuance of common stock 574,052 6 1,752 – – – 1,758 Balances at January 3, 2009 81,767,982 $ 822 $ 156,899 $ (3,848 ) $ (29,850 ) $ 112,555 $ 236,578
Page 55

DARLING INTERNATIONAL INC. AND SUBSIDIARIES
Consolidated Statements of Stockholders’ Equity and Comprehensive Income(Loss) (Continued)
Three years ended January 2, 2010 (in thousands, except share data)
The accompanying notes are an integral part of these consolidated financial statements.
Common Stock
Number of Outstanding
Shares
$.01 par Value
Additional Paid-In Capital
Treasury
Stock
Accumulated Other
Compre- hensive Loss
Retained Earnings
Total Stockholders
Equity Net income – – – – – 41,790 41,790 Unrecognized net actuarial loss of defined benefit plans: Pension liability adjustments, net of tax – – – – 5,229 – 5,229 Interest rate swap derivative adjustment, net of tax – – – – 702 – 702 Natural gas swap derivative adjustment, net of tax – – – – 137 – 137 Total comprehensive income – – – – – – 47,858 Issuance of non-vested stock 307,558 3 901 – – – 904 Stock-based compensation – – (720 ) – – – (720 ) Tax benefits associated with stock-based compensation – – (39 ) – – – (39 ) Treasury stock (2,186 ) – – (7 ) – – (7 ) Issuance of common stock 153,336 1 302 – – – 303 Balances at January 2, 2010 82,226,690 $ 826 $ 157,343 $ (3,855 ) $ (23,782 ) $ 154,345 $ 284,877
Page 56

DARLING INTERNATIONAL INC. AND SUBSIDIARIES
Consolidated Statements of Cash Flows
Three years ended January 2, 2010 (in thousands)
The accompanying notes are an integral part of these consolidated financial statements.
January 2,
2010 January 3,
2009 December 29,
2007 Cash flows from operating activities: Net income $ 41,790 $ 54,562 $ 45,533 Adjustments to reconcile net income to net cash provided by operating activities: Depreciation and amortization 25,226 24,433 23,214 Deferred income taxes 14,652 ( 12,428 ) 5,616 Gain on sale of assets ( 294 ) ( 141 ) ( 5 ) Increase/(decrease) in long-term pension liability ( 11,974 ) 6,784 ( 5,664 ) Stock-based compensation expense 768 800 1,235 Goodwill impairment – 15,914 – Changes in operating assets and liabilities, net of effects from acquisitions: Restricted cash 52 ( 16 ) 47 Accounts receivable ( 5,148 ) 18,977 ( 17,020 )
Income taxes refundable 10,643 ( 11,248 ) – Inventories and prepaid expenses 4,286 ( 398 ) ( 7,728 ) Accounts payable and accrued expenses ( 369 ) ( 6,884 ) 18,916 Other ( 446 ) 1,595 1,563 Net cash provided by operating activities 79,186 91,950 65,707 Cash flows from investing activities: Capital expenditures ( 23,638 ) ( 31,006 ) ( 15,552 ) Acquisitions ( 33,987 ) ( 15,876 ) – Gross proceeds from sale of property, plant and equipment and other assets 1,913 1,101 217 Payments related to routes and other intangibles – ( 6,609 ) (262 ) Net cash used in investing activities ( 55,712 ) ( 52,390 ) ( 15,597 ) Cash flows from financing activities: Proceeds from long-term debt 48 – 42,500 Payments on long-term debt ( 5,000 ) ( 6,250 ) ( 81,754 ) Contract payments ( 72 ) ( 176 ) ( 167 ) Deferred loan costs ( 946 ) ( 67 ) – Issuance of common stock 11 303 517 Minimum withholding taxes paid on stock awards ( 108 ) ( 1,199 ) ( 1,375 ) Excess tax benefits from stock-based compensation ( 39 ) 2,308 1,223 Net cash used in financing activities ( 6,106 ) ( 5,081 ) ( 39,056 ) Net increase in cash and cash equivalents 17,368 34,479 11,054 Cash and cash equivalents at beginning of year 50,814 16,335 5,281 Cash and cash equivalents at end of year $ 68,182 $ 50,814 $ 16,335
Supplemental disclosure of cash flow information: Cash paid during the year for: Interest $ 2,687 $ 3,016 $ 5,151
Income taxes, net of refunds $ 2,244 $ 44,246 $ 26,307
Page 57


DARLING INTERNATIONAL INC. AND SUBSIDIARIES
Notes to Consolidated Financial Statements
NOTE 1.
GENERAL
(a) NATURE OF OPERATIONS
Darling International Inc., a Delaware corporation (the “Company”), is a recycler of food and animal by-products and provides grease trap services to food service establishments. Darling collects and recycles animal by-products and used cooking oil from food service establishments. Darling processes raw materials at 45 facilities located throughout the United States into finished products such as protein (primarily meat and bone meal, “MBM”), tallow (primarily bleachable fancy tallow, “BFT”), yellow grease (“YG”) and hides. The Company sells these products nationally and internationally, primarily to producers of oleo-chemicals, soaps, pet foods, leather goods, livestock feed and bio-fuels for use as ingredients in their products or for further processing. The Company’s operations are currently organized into two segments: Rendering and Restaurant Services. For additional information on the Company’s segments, see Note 18.
(b) SUMMARY OF SIGNIFICANT ACCOUNTING POLICIES In June 2009, the Financial Accounting Standards Board (“FASB”) issued a standard that establishes the FASB Accounting Standard’s Codification ™ (“ASC”) and amended the hierarchy of generally accepted accounting principles (“GAAP”) such that the ASC became the single source of authoritative nongovernmental U.S. GAAP. All accounting standard references to GAAP included within the consolidated financial statements are in accordance with the FASB standards codification as adopted effective October 3, 2009.
(1) Basis of Presentation The consolidated financial statements include the accounts of the Company and its subsidiaries. All significant intercompany balances and transactions have been eliminated in consolidation.
(2) Fiscal Year The Company has a 52/53 week fiscal year ending on the Saturday nearest December 31. Fiscal years for the consolidated financial statements included herein are for the 52 weeks ended January 2, 2010, the 53 weeks ended January 3, 2009, and the 52 weeks ended December 29, 2007.
(3) Cash and Cash Equivalents The Company considers all short-term highly liquid instruments, with an original maturity of three months or less, to be cash equivalents.
(4) Accounts Receivable and Allowance for Doubtful Accounts The Company maintains allowances for doubtful accounts for estimated losses resulting from customers’ non-payment of trade accounts receivable owed to the Company. These trade receivables arise in the ordinary course of business from sales of raw material, finished product or services to the Company’s customers. The estimate of allowance for doubtful accounts is based upon the Company’s bad debt experience, prevailing market conditions, and aging of trade accounts receivable, among other factors. If the financial condition of the Company’s customers deteriorates, resulting in the customers’ inability to pay the Company’s receivables as they come due, additional allowances for doubtful accounts may be required.
(5) Inventories Inventories are stated at the lower of cost or market. Cost is determined using the first-in, first-out (FIFO) method.
Page 58
DARLING INTERNATIONAL INC.
Notes to Consolidated Financial Statements (continued)
(6) Long Lived Assets Property, Plant and Equipment Property, plant and equipment are recorded at cost. Depreciation is computed by the straight-line method over the estimated useful lives of assets: 1) Buildings and improvements, 15 to 30 years; 2) Machinery and equipment, 3 to 10 years; and 3) Vehicles, 2 to 6 years. Maintenance and repairs are charged to expense as incurred and expenditures for major renewals and improvements are capitalized.
Intangible Assets Intangible assets subject to amortization consist of: 1) collection routes which are made up of groups of suppliers of raw materials in similar geographic areas from which the Company derives collection fees and a dependable source of raw materials for processing into finished products; 2) permits that represent licensing of operating plants that have been acquired, giving those plants the ability to operate; 3) non-compete agreements that represent contractual arrangements with former competitors whose businesses were acquired; and 4) royalty and consulting agreements. Amortization expense is calculated using the straight-line method over the estimated useful lives of the assets ranging from: 8-20 years for collection routes; 20 years for permits; and 4-7 years for non-compete covenants. Royalty and consulting agreements are amortized over the term of the agreement.
(7) Impairment of Long-Lived Assets and Long-Lived Assets to Be Disposed of The Company follows FASB ASC Topic 360, Property, Plant, and Equipment for impairment of long-lived assets and long-lived assets to be disposed of. The Company reviews the carrying value of long-lived assets for impairment when events or changes in circumstances indicate that the carrying amount of an asset, or related asset group, may not be recoverable from estimated future undiscounted cash flows. Recoverability of assets to be held and used is measured by a comparison of the carrying amount of an asset or asset group to estimated undiscounted future cash flows expected to be generated by the asset or asset group. If the carrying amount of the asset exceeds its estimated future cash flows, an impairment charge is recognized by the amount by which the carrying amount of the asset exceeds the fair value of the asset. During the fourth quarter of fiscal 2008, due to lower commodity markets and the loss of certain large raw material suppliers, the Company performed testing of all its long-lived assets for impairment based on future undiscounted cash flows and concluded that its long-lived assets were not impaired. In fiscal 2009 no triggering event occurred requiring that the Company perform testing of all of it’s long-lived assets for impairment.
(8) Goodwill Goodwill is tested for impairment annually or more frequently if events or changes in circumstances indicate that the asset might be impaired. FASB ASC Topic 350, Intangibles-Goodwill and Other (“ASC 350”) requires a two-step process for testing impairment. First, the fair value of each reporting unit is compared to its carrying value to determine whether an indication of impairment exists. If impairment is indicated, then the fair value of the reporting unit’s goodwill is determined by allocating the unit’s fair value of its assets and liabilities (including any unrecognized intangible assets) as if the reporting unit had been acquired in a business combination. The amount of impairment for goodwill is measured as the excess of its carrying value over its implied fair value. In fiscal 2008, the fair value of the Company’s reporting units containing goodwill did not exceed the related carrying values; consequently, the Company recorded an impairment of approximately $15.9 million for the year ended January 3, 2009. In Fiscal 2009, the fair values of the Company’s reporting units containing goodwill exceeded the related carrying value. Goodwill was approximately $79.1 million and $61.1 million at January 2, 2010 and January 3, 2009, respectively. See Note 6 for further information on the Company’s goodwill.
Page 59

DARLING INTERNATIONAL INC.
Notes to Consolidated Financial Statements (continued)
(9) Environmental Expenditures Environmental expenditures incurred to mitigate or prevent environmental impacts that have yet to occur and that otherwise may result from future operations are capitalized. Expenditures that relate to an existing condition caused by past operations and that do not contribute to current or future revenues are expensed or charged against established environmental reserves. Reserves are established when environmental impacts have been identified which are probable to require mitigation and/or remediation and the costs are reasonably estimable.
(10) Income Taxes The Company accounts for income taxes using the asset and liability method. Under the asset and liability method, deferred tax assets and liabilities are recognized for the future tax consequences attributable to differences between the financial statement carrying amounts of existing assets and liabilities and their respective tax bases. Deferred tax assets and liabilities are measured using enacted tax rates expected to apply to taxable income in the years in which those temporary differences are expected to be recovered or settled. The effect on deferred tax assets and liabilities of a change in tax rates is recognized in income in the period that includes the enactment date. FASB ASC Topic 740, Income Taxes (“ASC 740”) requires the Company to periodically assess whether it is more likely than not that it will generate sufficient taxable income to realize its deferred income tax assets. In making this determination, the Company considers all available positive and negative evidence and makes certain assumptions. The Company considers, among other things, its deferred tax liabilities, the overall business environment, its historical earnings and losses, current industry trends and its outlook for future years. Although the Company is unable to carryback any of its net operating losses, based upon recent favorable operating results and future projections, certain net operating losses can be carried forward and utilized and other deferred tax assets will be realized.
(11) Earnings per Share On January 4, 2009, the Company adopted the provisions of FASB ASC Topic 260, Earnings Per Share (“ASC 260”), which addresses determinations as to whether instruments granted in share-based payment transactions are participating securities prior to vesting and, therefore, need to be included in the earnings allocation in computing earnings per share under the two-class method. Non-vested and restricted share awards granted to the Company’s employees and non-employee directors contain non-forfeitable dividend rights and, therefore, are considered participating securities in accordance with ASC 260. The Company has prepared the current period earnings per share computations and retrospectively revised the Company’s comparative prior period computations to include in basic and diluted earnings per share non-vested and restricted share awards considered participating securities. The adoption of the new guidance in ASC 260 increased the number of common shares included in basic and diluted earnings per share, but had no impact on reported earnings per share. Basic income per common share is computed by dividing net income by the weighted average number of common shares including non-vested and restricted shares outstanding during the period. Diluted income per common share is computed by dividing net income by the weighted average number of common shares outstanding during the period increased by dilutive common equivalent shares determined using the treasury stock method.
Page 60

Net Income per Common Share (in thousands)
For fiscal 2009, 2008 and 2007, respectively, 32,000, 24,000 and 5,187 outstanding stock options were excluded from diluted income per common share as the effect was antidilutive.
DARLING INTERNATIONAL INC.
Notes to Consolidated Financial Statements (continued)
January
2,
January 3,
December 29,
2010 2009 2007
Income Shares Per- Share
Income
Shares
Per- Share
Income Shares
Per- Share
Basic: Net income $41,790 82,142 $0.51 $54,562 81,685 $0.67 $45,533 81,091 $0.56 Diluted: Effect of dilutive securities
Add: Option shares in the money and dilutive effect of restricted stock
– 778 – – 969 – – 1,473 –
Less: Pro-forma treasury shares
– (445) – – (408) – – (648) –
Diluted: Net income $41,790 82,475 $0.51 $54,562 82,246 $0.66 $45,533 81,916 $0.56
(12) Stock Based Compensation FASB ASC Topic 718, Compensation-Stock Compensation (“ASC 718”) requires all entities to recognize compensation expense in an amount equal to the fair value of the share-based payments (e.g., stock options and non-vested and restricted stock) granted to employees or by incurring liabilities to an employee or other supplier (a) in amounts based, at least in part, on the price of the entity’s shares or other equity instruments, or (b) that require or may require settlement by issuing the entity’s equity shares or other equity instruments. Total stock-based compensation recognized under ASC 718 in the statements of operations for the years ended January 2, 2010, January 3, 2009 and December 29, 2007 was approximately $1.2 million, $1.1 million and $1.4 million, respectively, which is included in selling, general and administrative costs, and the related income tax benefit recognized was approximately $0.5 million, $0.3 million and $0.4 million, respectively. See Note 12 for further information on the Company’s stock-based compensation plans. ASC 718 requires the benefits of tax deductions in excess of recognized compensation cost are reported as a financing cash flow. For the year ended January 2, 2010 the Company recognized less than $0.1 million of such tax expenses, which were recorded as a decrease in financing cash flows. For the year ended January 3, 2009 and December 29, 2007, the Company recognized $2.3 million and $1.2 million, respectively in such tax deductions, which were recorded as an increase in financing cash flows and a reduction in operating cash flows.
(13) Use of Estimates The preparation of the consolidated financial statements in conformity with U.S. generally accepted accounting principles requires management to make estimates and assumptions that affect the reported amounts of assets and liabilities and disclosure of contingent assets and liabilities at the date of the consolidated financial statements and the reported amounts of revenues and expenses during the reporting period. Actual results could differ from those estimates.
Page 61

DARLING INTERNATIONAL INC.
Notes to Consolidated Financial Statements (continued)
If it is at least reasonably possible that the estimate of the effect on the financial statements of a condition, situation, or set of circumstances that exist at the date of the financial statements will change in the near term due to one or more future confirming events and the effect of the change would be material to the financial statements, the Company will disclose the nature of the uncertainty and include an indication that it is at least reasonably possible that a change in the estimate will occur in the near term. If the estimate involves certain loss contingencies covered by FASB ASC Topic 450, Contingencies , the disclosure will also include an estimate of the probable loss or range of loss or state that an estimate cannot be made.
(14) Financial Instruments The carrying amount of cash and cash equivalents, accounts receivable, accounts payable and accrued expenses approximates fair value due to the short maturity of these instruments. Based on rates the Company believes it would pay for debt of the same remaining maturity the Company’s outstanding term loan described in Note 9 has a fair value of approximately $30.2 million and $33.2 million compared to a carrying amount of $32.5 million and $37.5 million at January 2, 2010 and January 3, 2009, respectively. The fair value was determined using a level three input under the fair value hierarchy. The carrying amount for the Company’s other debt is not deemed to be significantly different than the amount recorded and all other financial instruments have been recorded at fair value as disclosed in Note 15.
(15) Derivative Instruments The Company makes limited use of derivative instruments to manage cash flow risks related to interest expense, natural gas usage, diesel fuel usage and inventory. Interest rate swaps are entered into with the intent of managing overall borrowing costs by reducing the potential impact of increases in interest rates on floating-rate long-term debt. Natural gas swaps and collars are entered into with the intent of managing the overall cost of natural gas usage by reducing the potential impact of seasonal weather demands on natural gas that increases natural gas prices. Heating oil swaps are entered into with the intent of managing the overall cost of diesel fuel usage by reducing the potential impact of seasonal weather demands on diesel fuel that increases diesel fuel prices. Inventory swaps are entered into with the intent of managing seasonally high concentrations of MBM, BFT and YG inventories by reducing the potential impact of decreasing prices. The Company does not use derivative instruments for trading purposes. At January 2, 2010, the Company had natural gas swaps and two interest rate swaps outstanding that qualified and were designated for hedge accounting as well as heating oil swaps and inventory swaps that did not qualify and were not designated for hedge accounting. Under FASB ASC Topic 815, Derivatives and Hedging (“ASC 815”), entities are required to report all derivative instruments in the statement of financial position at fair value. The accounting for changes in the fair value (i.e., gains or losses) of a derivative instrument depends on whether it has been designated and qualifies as part of a hedging relationship and, if so, on the reason for holding the instrument. If certain conditions are met, entities may elect to designate a derivative instrument as a hedge of exposures to changes in fair value, cash flows or foreign currencies. If the hedged exposure is a cash flow exposure, the effective portion of the gain or loss on the derivative instrument is reported initially as a component of other comprehensive income (outside of earnings) and is subsequently reclassified into earnings when the forecasted transaction affects earnings. Any amounts excluded from the assessment of hedge effectiveness as well as the ineffective portion of the gain or loss is reported in earnings immediately. If the derivative instrument is not designated as a hedge, the gain or loss is recognized in earnings in the period of change.
(16) Comprehensive Income The Company follows the provisions FASB ASC Topic 220, Comprehensive Income (“ASC 220”). ASC 220 establishes standards for reporting and presentation of comprehensive income and its components. In accordance with ASC 220, the Company has presented the components of comprehensive income in its consolidated statements of stockholders’ equity and comprehensive income(loss).
Page 62

On December 31, 2009, the Company acquired certain rendering, grease collection and trap servicing business assets from Sanimax USA Inc. for approximately $19 million. The purchase was accounted for as an asset purchase pursuant to the terms of the asset purchase agreement between the Company and Sanimax USA Inc. and affiliated companies (the “Sanimax Transaction”). The assets acquired in the Sanimax Transaction will increase the Company’s national footprint and better serve the Company’s customers within the rendering segment.
Effective December 31, 2009, the Company began including the operations of the Sanimax Transaction into the Company’s consolidated financial statements. The Company paid approximately $19 million in cash for assets and assumed liabilities consisting of property, plant and equipment of $4.7 million, intangible assets of $4.8 million, goodwill of $9.6 million and accrued liabilities of $0.1 million on the closing date. The goodwill from the Sanimax Transaction was assigned to the rendering segment and is expected to be deductible for tax purposes and the identifiable intangibles have a weighted average life of eight years.
On February 23, 2009, the Company acquired substantially all of the assets of Boca Industries, Inc., a grease trap services business headquartered in Smyrna, Georgia (the “Boca Transaction”) for approximately $12.5 million. The purchase was accounted for as an asset purchase pursuant to the terms of the asset purchase agreement between the Company and Boca Transport, Inc. and Donald E. Lenci. The assets acquired in the Boca Transaction will increase the Company’s capabilities to grow revenues and continue the Company’s strategy of broadening its restaurant services segment.
Effective February 23, 2009, the Company began including the operations of the Boca Transaction into the Company’s consolidated financial statements. The Company paid approximately $12.5 million in cash for assets consisting of property, plant and equipment of $3.3 million, intangible assets of $3.3 million, goodwill of $5.8 million and other of $0.1 million on the closing date. The goodwill from the Boca Transaction was assigned to the restaurant services segment and is expected to be deductible for tax purposes and the identifiable intangibles have a weighted average life of nine years.
The Company notes these acquisitions are not considered related businesses, therefore are not required to be treated as a single business combination. Pro forma results of operations have not been presented because the effect of each acquisition individually is not deemed material to revenues and net income of the Company for any fiscal period presented.
DARLING INTERNATIONAL INC.
Notes to Consolidated Financial Statements (continued)
(17) Revenue Recognition The Company recognizes revenue on sales when products are shipped and the customer takes ownership and assumes risk of loss. Certain customers may be required to prepay prior to shipment in order to maintain payment protection against certain foreign and domestic sales. These amounts are recorded as unearned revenue and recognized when the products have shipped and the customer takes ownership and assumes risk of loss. The Company has formula arrangements with certain suppliers whereby the charge or credit for raw materials is tied to published finished product commodity prices after deducting a fixed processing fee incorporated into the formula and is recorded as a cost of sale by line of business. The Company recognizes revenue related to grease trap servicing in the month the trap service occurs.
(18) Reclassification Certain prior year amounts have been reclassified to conform to the current year presentation.
(19) Subsequent Events The Company has evaluated subsequent events from the end of the most recent fiscal year through the date the consolidated financial statements were issued.
NOTE 2.
ACQUISITIONS AND DISPOSITIONS
Page 63

On August 25, 2008, Darling completed the acquisition of substantially all of the assets of API Recycling’s used cooking oil collection business (the “API Transaction”). API Recycling is a division of American Proteins, Inc. The purchase was accounted for as an asset purchase pursuant to the terms of the asset purchase agreement between the Company and American Proteins, Inc. The assets acquired in the API Transaction will increase the Company’s capabilities to grow revenues and continue the Company’s strategy of broadening its restaurant services segment.
Effective August 25, 2008, the Company began including the operations of the API Transaction into the Company’s consolidated financial statements. Pro forma results of operations have not been presented because the effect of the acquisition is not deemed material to revenues and net income of the Company for fiscal 2008. The Company paid cash of $15.9 million and recorded a receivable of approximately $1.5 million for a net purchase price for the API Transaction of approximately $14.4 million, which consists of property, plant and equipment of $3.4 million, intangible assets of $5.5 million, goodwill of $5.2 million and other of $0.3 million. The receivable was recorded as a reduction of goodwill due to certain raw material volumes during the 91 days following the closing date not being achieved per the asset purchase agreement. The $1.5 million receivable is recorded as a long term other asset on the balance sheet at January 3, 2009. In addition, the Company could be required to pay additional consideration, which the Company does not expect to be material, if certain average market prices are achieved over the next three anniversaries of the closing of the API Transaction less, on a pro rata basis, the long-term receivable of $1.5 million. During the third quarter of fiscal 2009, the Company recorded additional consideration of $2.5 million recorded as goodwill less approximately $0.5 million representing a reduction of the long term receivable. The additional consideration was paid in the fourth quarter of fiscal 2009.
The $7.7 million of goodwill from the API Transaction was assigned to the restaurant services segment and is expected to be deductible for tax purposes. Identifiable intangibles in the API Transaction include $5.5 million in routes with a weighted average useful life of nine years.
On September 11, 2009, the Company sold its Little Rock, Arkansas grease/trap plant to a third party for cash and other consideration of approximately $1.6 million. Effective September 11, 2009, the consolidated financial statements do not include the operations of the Little Rock plant. The disclosure of the Little Rock plant as discontinued operations and the pro forma presentation of the Little Rock plant have not been made because the Company has determined that the historical revenues and net income are not material to the Company for fiscal 2009 and 2008.
A summary of inventories follows (in thousands):
DARLING INTERNATIONAL INC.
Notes to Consolidated Financial Statements (continued)
NOTE 3.
INVENTORIES
January 2,
2010 January 3,
2009 Finished product $ 16,211 $ 19,380 Supplies and other 2,846 2,802
$ 19,057 $ 22,182
Page 64

A summary of property, plant and equipment follows (in thousands):
The gross carrying amount of intangible assets subject to amortization include (in thousands):
Gross intangible routes and non-compete agreements increased in fiscal 2009 by approximately $8.1 million consisting of approximately $4.8 million from the Sanimax Transaction and $3.3 million from the Boca Transaction as discussed in Note 2. Amortization expense for the three years ended January 2, 2010, January 3, 2009 and December 29, 2007, was approximately $3.8 million, $5.2 million and $4.9 million, respectively. Amortization expense for the next five fiscal years is estimated to be $4.3 million, $4.1 million, $4.0 million, $3.8 million and $3.8 million.
DARLING INTERNATIONAL INC.
Notes to Consolidated Financial Statements (continued)
NOTE 4.
PROPERTY, PLANT AND EQUIPMENT
January 2,
2010 January 3,
2009 Land $ 18,386 $ 17,826 Buildings and improvements 52,059 48,623 Machinery and equipment 244,962 217,450 Vehicles 56,221 54,656 Construction in process 3,919 16,042
375,547 354,597 Accumulated depreciation (223,565 ) (211,306 )
$ 151,982 $ 143,291
NOTE 5.
INTANGIBLE ASSETS
January 2, 2010
January 3, 2009
Intangible Assets: Routes $ 68,028 $ 60,009 Permits 20,500 20,500 Non-compete agreements 2,491 2,366 Royalty and consulting agreements 388 388
91,407 83,263 Accumulated Amortization:
Routes (44,731 ) (42,037 ) Permits (3,725 ) (2,700 ) Non-compete agreements (2,329 ) (2,240 ) Royalty and consulting agreements (324 ) (304 )
(51,109 ) ( 47,281 ) Intangible assets, less accumulated amortization $ 40,298 $ 35,982
Bage 65

Changes in the carrying amount of goodwill (in thousands):
Certain of the Company’s rendering facilities are highly dependent on one or few suppliers. It is reasonably possible that certain of those suppliers could cease their operations or choose a competitor’s services which could have a significant impact on these facilities.
Based on the Company’s annual impairment testing at the end of the fourth quarter of fiscal 2008 it was determined that goodwill was impaired due to lower commodity markets and the loss of certain large raw material suppliers in the fourth quarter of fiscal 2008, which resulted in the Company recording an impairment charge of approximately $15.9 million based on future discounted net cash flows.
The process of evaluating goodwill for impairment involves the determination of the fair value of the Company’s reporting units. In step one, the Company determined based on the discounted cash flows that one of the Company’s reporting unit’s carrying value exceeded its fair value in fiscal 2008. In step two the Company is required to compute the implied fair value of the reporting unit’s goodwill and compare it against the actual carrying amount of goodwill for that reporting unit. This was determined in the same manner that goodwill recognized in a business combination is determined. That is the fair value of the reporting unit was allocated to all of the individual assets and liabilities of the reporting unit including any intangible assets, as if the reporting unit had been acquired in a business combination and the fair value of the reporting unit determined in the first step was the price paid to acquire the reporting unit.
In fiscal 2009, the fair values of the Company’s reporting units containing goodwill exceeded the related carrying value.
Accrued expenses consist of the following (in thousands):
DARLING INTERNATIONAL INC.
Notes to Consolidated Financial Statements (continued)
NOTE 6.
GOODWILL
Rendering Restaurant Services Total
Balance at January 3, 2009 Goodwill $ 55,930 $ 21,117 $ 77,047 Accumulated impairment losses (13,864 ) (2,050 ) (15,914 )
42,066 19,067 61,133 Goodwill acquired during year 9,627 8,325 17,952 Impairment losses – – –
Balance at January 2, 2010
Goodwill 65,557 29,442 94,999 Accumulated impairment losses (13,864 ) (2,050 ) (15,914 )
$ 51,693 $ 27,392 $ 79,085
NOTE 7.
ACCRUED EXPENSES
January 2,
2010 January 3,
2009 Compensation and benefits $ 17,159 $ 18,838 Utilities and sewage 3,781 5,293 Accrued income, ad valorem, and franchise taxes 3,233 1,120 Reserve for self insurance, litigation, environmental and tax matters (Note 17) 5,087 5,513 Medical claims liability 4,230 4,982 Other accrued expense 14,032 14,034
$ 47,522 $ 49,780
Page 66

Rent expense for the fiscal years ended January 2, 2010, January 3, 2009 and December 29, 2007 was $9.4 million, $8.6 million and $7.8 million, respectively.
The Company has a $175 million credit agreement (the “Credit Agreement”) effective April 7, 2006. The Credit Agreement provides for a total of $175.0 million in financing facilities, consisting of a $50.0 million term loan facility and a $125.0 million revolver facility, which includes a $35.0 million letter of credit sub-facility. As of January 2, 2010, the Company has borrowed all $50.0 million under the term loan facility, which provides for quarterly scheduled amortization payments of $1.25 million over a six-year term ending April 7, 2012; at that point, the remaining balance of $22.5 million will be payable in full. The revolving credit facility has a seven-year term ending April 7, 2013. The proceeds of the revolving credit facility may be used for: (i) the payment of fees and expenses payable in connection with the Credit Agreement, acquisitions and the repayment of indebtedness; (ii) financing the working capital needs of the Company; and (iii) other general corporate purposes.
The Credit Agreement allows for borrowings at per annum rates based on the following loan types. Alternate base rate loans under the Credit Agreement will bear interest at a rate per annum based on the greater of (a) the prime rate, (b) the federal funds effective rate (as defined in the Credit Agreement) plus 1/2 of 1% and (c) the adjusted London Inter-Bank Offer Rate (“LIBOR”) for a one month interest period plus 1% plus, in each case, a margin determined by reference to a pricing grid and adjusted according to the Company’s adjusted leverage ratio. Eurodollar loans will bear interest at a rate per annum based on the then applicable LIBOR rate multiplied by the statutory reserve rate plus a margin determined by reference to a pricing grid and adjusted according to the Company’s adjusted leverage ratio. At January 2, 2010 under the Credit Agreement, the interest rate for the $32.5 million of the term loan that was outstanding was based on LIBOR plus a margin of 2.5% per annum for a total of 2.8125% per annum. At January 2, 2010 there were no outstanding borrowings under the Company’s revolving facility.
DARLING INTERNATIONAL INC.
Notes to Consolidated Financial Statements (continued)
NOTE 8.
LEASES
The Company leases six plants and storage locations, three office locations and a portion of its transportation equipment under operating leases. Leases are noncancellable and expire at various times through the year 2028. Minimum rental commitments under noncancellable leases as of January 2, 2010, are as follows (in thousands):
Period Ending Fiscal
Operating Leases
2010 $ 10,520 2011 9,093 2012 6,229 2013 4,295 2014 2,437 Thereafter 10,987
Total $ 43,561
NOTE 9.
DEBT
Credit Agreement
Page 67

On October 8, 2008, the Company entered into an amendment (the “2008 Amendment”) with its lenders under its Credit Agreement. The 2008 Amendment increases the Company’s flexibility to make investments in third parties. Pursuant to the 2008 Amendment, the Company can make investments in third parties provided that (i) no default under the Credit Agreement exists or would result at the time such investment is committed to be made, (ii) certain specified defaults do not exist or would result at the time such investment is actually made, and (iii) after giving pro forma effect to such investment, the leverage ratio (as determined in accordance with the terms of the Credit Agreement) is less than 2.00 to 1.00 for the most recent four fiscal quarter period then ended. In addition, the 2008 Amendment increases the amount of intercompany investments permitted among the Company and any of its subsidiaries that are not parties to the Credit Agreement from $2.0 million to $10.0 million.
On September 30, 2009, the Company, entered into an amendment (the “2009 Amendment”) with its lenders under the Credit Agreement. The 2009 Amendment (i) extends the maturity date of the revolving facility from April 7, 2011 to April 7, 2013, (ii) revises the pricing schedule with respect to letter of credit fees and interest rates payable by the Company and amends certain definitions in connection therewith, (iii) permits the issuance of new unsecured indebtedness and amends and adds certain definitions in connection therewith, and (iv) amends certain provisions with respect to the defaulting lender concept in the Credit Agreement. Pursuant to the 2009 Amendment, the Company can issue new unsecured indebtedness provided that (i) no default under the Credit Agreement exists or would result from the incurrence of such new unsecured indebtedness, (ii) the amount of such new unsecured indebtedness does not exceed $150 million at any time outstanding, and (iii) after giving pro forma effect to such incurrence of new unsecured indebtedness, the Company is in compliance with the fixed charge coverage ratio and the leverage ratio (as determined in accordance with the terms of the Credit Agreement).
The Credit Agreement contains certain restrictive covenants that are customary for similar credit arrangements and requires the maintenance of certain minimum financial ratios. The Credit Agreement also requires the Company to make certain mandatory prepayments of outstanding indebtedness using the net cash proceeds received from certain dispositions of property, casualty or condemnation, any sale or issuance of equity interests in a public offering or in a private placement, unpermitted additional indebtedness incurred by the Company, and excess cash flow under certain circumstances.
The Credit Agreement consisted of the following elements at January 2, 2010 and January 3, 2009, respectively (in thousands):
The obligations under the Credit Agreement are guaranteed by Darling National LLC, a Delaware limited liability company that is a wholly-owned subsidiary of Darling (“Darling National”), and are secured by substantially all of the property of the Company, including a pledge of all equity interests in Darling National. As of January 2, 2010, the Company was in compliance with all the financial covenants and believes it was in compliance with all of the other covenants contained in the Credit Agreement.
DARLING INTERNATIONAL INC.
Notes to Consolidated Financial Statements (continued)
January 2,
2010 January 3,
2009 Credit Agreement:
Term Loan $ 32,500 $ 37,500
Revolving Credit Facility: Maximum availability $ 125,000 $ 125,000 Borrowings outstanding – – Letters of credit issued 15,852 16,424 Availability $ 109,148 $ 108,576
Page 68

Debt consists of the following (in thousands):
Maturities of long-term debt at January 2, 2010 follow (in thousands):
As of January 2, 2010, current maturities of debt of $5.0 million will be due during fiscal 2010, which include scheduled term loan principal payments of $1.25 million due each quarter.
DARLING INTERNATIONAL INC.
Notes to Consolidated Financial Statements (continued)
January 2,
2010 January 3,
2009 Credit Agreement: Revolving Credit Facility $ – $ – Term Loan 32,500 37,500 Other Notes 48 –
32,548 37,500 Less Current Maturities 5,009 5,000
$ 27,539 $ 32,500
Contractual
Debt Payment 2010 $ 5,009 2011 5,009 2012 22,510 2013 10 2014 10
$ 32,548
NOTE 10. OTHER NONCURRENT LIABILITIES
Other noncurrent liabilities consist of the following (in thousands):
January 2,
2010 January 3,
2009 Accrued pension liability (Note 13) $ 19,060 $ 36,263 Reserve for self insurance, litigation, environmental and tax matters (Note 17) 14,610 14,418 Other 2,473 3,593
$ 36,143 $ 54,274
NOTE 11. INCOME TAXES
The FASB issued guidance under ASC 740, which prescribes accounting for and disclosure of uncertain tax positions (“UTP”). ASC 740 requires application of a more likely than not threshold to the recognition and de-recognition of UTP. ASC 740 permits recognition of the amount of tax benefit that has a greater than 50 percent likelihood of being realized upon settlement. A change in judgment related to the expected ultimate resolution of UTP is recognized in earnings in the quarter of change. Effective December 31, 2006 the Company adopted these provisions of ASC 740 resulting in a reduction in the Company’s existing reserves for uncertain state and federal income tax positions of approximately $0.1 million. This reduction was recorded as a cumulative effect adjustment to retained earnings. At the adoption date of December 31, 2006, the Company had $0.7 million of gross unrecognized tax benefits. If the Company recognized such tax benefits, the net impact on the Company’s effective tax rate would be $0.6 million, which includes the effect of the reversal of the $0.1 million deferred tax asset. At January 2, 2010 and January 3, 2009, the Company had $0.1 million and $0.5 million, respectively of gross unrecognized tax benefits; if recognized, the net impact on the Company’s effective tax rate would be less than $0.1 million and $0.4 million, respectively, which includes the effect of the reversal of $0.1 million in deferred tax asset. The Company recognizes accrued interest and penalties, as appropriate, related to unrecognized tax benefits as a component of income tax expense.

Page 69

The following table shows a reconciliation of the change in the unrecognized tax benefit balance for federal, state and foreign taxes (in thousands).
The Company’s major taxing jurisdictions include the U.S. (federal and state). The Company is no longer subject to federal examinations on years prior to fiscal 2005. The number of years open for state tax audits varies, depending on the tax jurisdiction, but is generally from three to five years. Currently, one state examination is in progress. The Company does not anticipate that any state or federal audits will have a significant impact on the Company’s results of operations or financial position. In addition, the Company does not reasonably expect any significant changes to the estimated amount of liability associated with the Company’s unrecognized tax positions in fiscal 2010.
Income tax expense/(benefit) attributable to income from continuing operations before income taxes consists of the following (in thousands):
Income tax expense for the years ended January 2, 2010, January 3, 2009 and December 29, 2007, differed from the amount computed by applying the statutory U.S. federal income tax rate to income from continuing operations before income taxes as a result of the following (in thousands):
DARLING INTERNATIONAL INC.
Notes to Consolidated Financial Statements (continued)
January 2, January 3, 2010 2009
Balance beginning of year $ 465 $ 543 Additions for tax positions related to prior years 17 35 Settlements (47 ) (8 ) Lapses in statutes of limitations (303 ) (105 ) Balance end of year $ 132 $ 465
January 2,
2010 January 3,
2009
December 29,
2007 Current:
Federal $ 11,741 $ 29,193 $ 22,418 State 2,702 5,152 3,301
Deferred: Federal and State 10,646 1,009 3,780
$ 25,089 $ 35,354 $ 29,499
Page 70

The tax effects of temporary differences that give rise to significant portions of the deferred tax assets and deferred tax liabilities at January 2, 2010 and January 3, 2009 are presented below (in thousands):
At January 2, 2010, the Company had net operating loss carryforwards for federal income tax purposes of approximately $5.4 million expiring through 2020. The availability of the net operating loss carryforwards to reduce future taxable income is subject to various limitations. As a result of the change in ownership which occurred pursuant to the May 2002 recapitalization, utilization of the net operating loss carryforwards is limited to approximately $0.7 million per year for the remaining life of the net operating losses.
The net change in the total valuation allowance was a decrease of less than $0.1 million for the year ended January 2, 2010 due to the expiration of net operating loss carryforwards. The Company has assessed that it is more likely than not that it will generate sufficient taxable income in future periods to realize its deferred income tax assets.
DARLING INTERNATIONAL INC.
Notes to Consolidated Financial Statements (continued)
January 2,
2010 January 3,
2009
December 29,
2007 Computed “expected” tax expense $ 23,408 $ 31,471 $ 26,261 State income taxes 2,491 3,436 2,827 Section 199 deduction (744 ) (1,257 ) (832 ) Non-deductible employee compensation 201 993 500 Tax credits (441 ) (128 ) (49 ) Reversal of reserve for taxes (212 ) (19 ) (51 ) Other, net 386 858 843
$ 25,089 $ 35,354 $ 29,499
January 2,
2010 January 3,
2009 Deferred tax assets:
Net operating loss carryforwards $ 2,196 $ 2,529 Loss contingency reserves 7,330 7,877 Employee benefits 3,070 2,484 Pension liability 14,088 17,396 Intangible assets amortization, including taxable
goodwill 552 1,684 Other 4,290 3,471
Total gross deferred tax assets 31,526 35,441 Less valuation allowance (175 ) (220 ) Net deferred tax assets 31,351 35,221
Deferred tax liabilities: Intangible assets amortization, including taxable
goodwill – – Property, plant and equipment depreciation (21,788 ) (15,459 ) Other (8,682 ) (4,229 )
Total gross deferred tax liabilities (30,470 ) (19,688 ) $ 881 $ 15,533
Page 71

On May 11, 2005, the shareholders approved the 2004 Plan. The 2004 Plan replaced both the 1994 Employee Flexible Stock Option Plan and the Non-Employee Directors Stock Option Plan and thus broadens the array of equity alternatives available to the Company. Under the 2004 Plan, the Company is allowed to grant stock options, stock appreciation rights, non-vested and restricted stock (including performance stock), restricted stock units (including performance units), other stock-based awards, non-employee director awards, dividend equivalents and cash-based awards. There are up to 6,074,969 common shares available under the 2004 Plan which may be granted to any participant in any plan year as defined in the 2004 Plan. Some of those shares are subject to outstanding awards as detailed in the tables below. To the extent these outstanding awards are forfeited or expire without exercise, the shares will be returned to and available for future grants under the 2004 Plan. The 2004 Plan’s purpose is to attract, retain and motivate employees, directors and third party service providers of the Company and to encourage them to have a financial interest in the Company. The 2004 Plan is administered by the Compensation Committee (the “Committee”) of the Board of Directors. The Committee has the authority to select plan participants, grant awards, and determine the terms and conditions of such awards as defined in the 2004 Plan. The Company’s stock options granted under the 2004 Plan generally terminate 10 years after date of grant. At January 2, 2010, the number of equity awards available for issuance under the 2004 Plan was 2,906,738.
The following is a summary of stock-based compensation granted during the years ended January 2, 2010, January 3, 2009 and December 29, 2007.
Nonqualified Stock Options . On May 8, 2007, the Company granted 8,000 nonqualified stock options in the aggregate to two non-employee directors following their initial election to the board by the stockholders. The exercise price for the May 8, 2007 stock options was $8.03 per share (fair market value at grant date). On February 27, 2008, the Company granted 20,000 nonqualified stock options in the aggregate to the non-employee directors. The exercise price for February 27, 2008 stock options was $13.55 per share (fair market value at grant date). On May 6, 2008 following a new director’s initial election to the board by the stockholders, the Company granted 4,000 nonqualified stock options to the most recent non-employee director. The exercise price for the May 6, 2008 stock options was $16.20 per share (fair market value at grant date). On March 10, 2009, the Company granted 24,000 nonqualified stock options in the aggregate to the non-employee directors. The exercise price for March 10, 2009 stock options was $2.94 per share (fair market value at grant date). All of the non-employee director stock options vest 25 percent six months after the grant date and 25 percent on each of the first three anniversary dates thereafter.
Incentive Stock Options . For fiscal 2009, 2008 and 2007 the Company did not issue any incentive stock options.
A summary of stock option activity as of January 2, 2010 and changes during the year ended is presented below.
DARLING INTERNATIONAL INC.
Notes to Consolidated Financial Statements (continued)
NOTE 12. STOCKHOLDERS’ EQUITY AND STOCK-BASED COMPENSATION
Number of shares
Weighted-avg. exercise price
per share
Weighted-avg. remaining
contractual life Options outstanding at January 3, 2009 796,205 3.74
Granted 24,000 2.94 Exercised (10,000) 1.12 Forfeited – N/A Expired – N/A
Options outstanding at January 2, 2010 810,205 3.75 4.9 years
Options exercisable at January 2, 2010 778,205 3.60 4.8 years
Page 72

The expected lives for options granted during fiscal 2009, 2008 and 2007 were computed using the simplified method as prescribed by Staff Accounting Bulletin No. 107.
At January 2, 2010, $2.3 million of total future equity-based compensation expense (determined using the Black-Scholes option pricing model) related to outstanding non-vested options and stock awards is expected to be recognized over a weighted average period of 1.7 years.
For the year ended January 2, 2010 the amount of cash received from the exercise of options and the related tax benefits were insignificant. For the year ended January 3, 2009 and December 29, 2007, the amount of cash received from the exercise of options was approximately $0.3 million and $0.5 million, respectively and the related tax benefits were approximately $2.3 million and $1.2 million, respectively. The total intrinsic value of options exercised for the years ended January 2, 2010, January 3, 2009 and December 29, 2007 was approximately $0.1 million, $6.4 million and $2.5 million, respectively. The fair value of shares vested for the years ended January 2, 2010, January 3, 2009 and December 29, 2007 was approximately $0.7 million, $0.6 million and $0.6 million, respectively. At January 2, 2010, the aggregate intrinsic value of options outstanding was approximately $3.9 million and the aggregate intrinsic value of options exercisable was approximately $3.8 million.
Non-Vested Stock Awards . On March 3, 2008, the Company’s board of directors granted 67,411 shares of stock under the Company’s long term incentive awards. At the grant date 16,853 shares vested immediately and the remaining stock awards vest over the next three anniversary dates of the grant in equal installments. On March 10, 2009, the Company’s board of directors granted 410,076 shares of stock, 366,326 shares were under the Company’s long term incentive awards and 43,750 shares were granted as a one-time issuance to other employees not part of the Company’s long term incentive award program. At the March 10, 2009 grant date 102,518 shares vested immediately and the remaining stock awards vest over the next three anniversary dates of the grants in equal installments.
A summary of the Company’s non-vested stock awards as of January 2, 2010, and changes during the year ended is as follows:
DARLING INTERNATIONAL INC.
Notes to Consolidated Financial Statements (continued)
The fair value of each stock option grant under the Company’s stock option plan was estimated on the date of grant using the Black Scholes option-pricing model with the following weighted average assumptions and results for fiscal 2009, 2008 and 2007.
Weighted Average 2009 2008 2007 Expected dividend yield 0.0% 0.0% 0.0% Risk-free interest rate 2.31% 3.24% 4.57% Expected term 5.80 years 5.80 years 5.75 years Expected volatility 58.4% 42.0% 52.1% Fair value of options granted $1.76 $6.23 $4.30
Non-Vested
Shares
Weighted Average Grant Date Fair Value
Stock awards outstanding January 3, 2009 50,558 $ 13.90 Shares granted 410,076 2.94 Shares vested (119,373 ) 4.49 Shares forfeited – –
Stock awards outstanding January 2, 2010 341,261 $ 4.02
Page 73

Restricted Stock Awards. On March 9, 2006, the Company's Board of Directors approved a Non-Employee Director Restricted Stock Award Plan (as subsequently amended, the "Director Restricted Stock Plan") pursuant to and in accordance with the 2004 Plan in order to attract and retain highly qualified persons to serve as non-employee directors and to more closely align such directors' interests with the interests of the stockholders of the Company by providing a portion of their compensation in the form of Company common stock.
Under the Director Restricted Stock Plan, $20,000 in restricted Company common stock (the "Restricted Stock") will be awarded to each non-employee director on the fourth business day after the Company releases its earnings for its prior completed fiscal year (the "Date of Award"). The amount of restricted stock to be issued will be calculated using the closing price of the Company’s common stock on the third business day after the Company releases its earnings. The Restricted Stock will be subject to a right of repurchase at $0.01 per share upon termination of the holder as a member of the Company's board of directors for cause and will not be transferable. These restrictions will lapse with respect to 100% of the Restricted Stock upon the earliest to occur of (i) ten years after the Date of Award, (ii) a Change of Control (as defined in the 2004 Plan), and (iii) termination of the non-employee director's service with the Company, other than for "cause" (as defined in the Director Restricted Stock Plan). On March 10, 2009, the Company issued 40,818 shares of restricted stock in the aggregate to its non-employee directors under the Director Restricted Stock Plan. On March 3, 2008 and March 11, 2008, the Company issued 7,190 and 1,509 shares of restricted stock in the aggregate to its non-employee directors under the Director Restricted Stock Plan. On March 20, 2007, the Company issued 20,232 shares of restricted stock in the aggregate to its non-employee directors under the Director Restricted Stock Plan.
A summary of the Company’s directors’ restricted stock awards as of January 2, 2010, and changes during the year ended is as follows:
Long-Term Incentive Opportunity Awards . The Committee has adopted a Long-Term Incentive Plan (the “LTIP”) for the Company’s key employees, as a subplan under the terms of the 2004 Plan. The principal purpose of the LTIP is to encourage the Company’s executives to enhance the value of the Company and, hence, the price of the Company’s stock and the stockholders’return. In addition, the LTIP is designed to create retention incentives for the individual and to provide an opportunity for increased equity ownership by executives. The Committee awarded dollar value performance based restricted stock and stock option opportunities under the LTIP for fiscal 2009 to certain of the Company’s officers, including the Chief Executive Officer and the Executive Vice Presidents of Finance and Administration, Operations, Commodities, Legal, and Sales and Services (the “2009 Restricted Stock and Option Awards”). The restricted stock and stock options underlying the 2009 Restricted Stock and Option Awards are issued only if a predetermined financial objective is met by the Company. The Company met the financial objective for fiscal 2009. Accordingly, in accordance with the terms of the 2009 Restricted Stock and Option Awards, it is anticipated that the restricted stock representing 75% of the award and stock options representing 25% of the award will be granted and issued to the executives on the fourth business day after the Company releases its annual financial results for fiscal 2009. The amount of restricted stock to be issued will be calculated using the closing price of the Company’s common stock on the third business day after the Company releases its annual financial results for fiscal 2009. The stock options will have an exercise price equal to the fair market value of the Company’s common stock on the third business day after the Company releases its annual financial results. These awards vest in four equal installments, with the first installment vesting immediately upon the grant date and the remaining three installments vesting on the next three anniversary dates of the grant. The award is treated as a liability until the grant date when the number of shares and options to be issued is known, and then it becomes equity-classified. At January 2, 2010 and January 3, 2009 the Company recorded a liability of approximately $1.8 million and $1.1 million on the balance sheet for the long-term incentive opportunities.
DARLING INTERNATIONAL INC.
Notes to Consolidated Financial Statements (continued)
Restricted
Shares
Weighted Average Grant Date Fair Value
Stock awards outstanding January 3, 2009 38,714 $ 7.23 Restricted shares granted 40,818 2.94 Restricted shares where the restriction lapsed – N/A Restricted shares forfeited – N/A
Stock awards outstanding January 2, 2010 79,532 $ 5.03
Page 74

The Company has retirement and pension plans covering substantially all of its employees. Most retirement benefits are provided by the Company under separate final-pay noncontributory and contributory defined benefit and defined contribution plans for all salaried and hourly employees (excluding those covered by union-sponsored plans) who meet service and age requirements. Defined benefits are based principally on length of service and earnings patterns during the five years preceding retirement.
Effective January 1, 2008, the Darling National LLC Pension Retirement Plan was merged into the Darling International Inc. Hourly Employees’ Retirement Plan, which plan was then amended and restated. Employees from both plans are entitled to their accrued benefit as of December 31, 2007 under their prior plan design, plus benefit accruals after January 1, 2008 using the new benefit of $20 for each year of service with no cap on service years with no effect on accumulated benefits. Previously, these hourly employees had been accruing $20-$30 per year of service, depending on location of employment.
Also effective January 1, 2008, the Darling International Inc. Salaried Employees’ Retirement Plan, a defined benefit plan, was amended. Effective January 1, 2008, all of the Company’s eligible salaried employees participate in this plan, including all former Darling National salaried employees who did not have a defined benefit plan prior to January 1, 2008. All eligible salaried employees are entitled to their accrued benefit as of December 31, 2007, which accrued benefit is an amount equal to 1.8% times years of service (up to 25 years) times final average pay plus 0.5% for each additional service year beyond 25 years, with a total service year cap of 40 years with no effect on accumulated benefits. Effective January 1, 2008, for service years earned going forward, the benefit accrual will be 0.25% times years of service times final average pay.
Also effective January 1, 2008, the Darling National LLC Retirement Savings Plan was amended and restated to, among other things, update the plan for the Economic Growth and Tax Relief Reconciliation Act and change the name of the plan to the Darling International Inc. Hourly 401(k) Savings Plan. Effective January 1, 2008, all of the Company’s hourly employees are eligible to participate in this plan, which allows for elective deferrals, an employer match equal to 100% of the first $10 per pay period deferred by a participant, with a maximum of $520 per year, and an employer contribution equal to $520 per year. Previously, certain of the Company’s hourly employees were only given the opportunity to make deferrals. The $520 employer contribution will be a new contribution for all participating hourly employees. This plan accepted the transfer of assets and liabilities of the hourly employees that had account balances in the Darling International Inc. 401(k) Savings Plan which existed prior to January 1, 2008. The Company’s matching portion to the Darling International Inc. Hourly 401(k) Savings plan for fiscal 2009 and 2008 was approximately $0.7 million and $0.6 million, respectively.
Effective January 1, 2008, the Darling International Inc. 401(k) Savings Plan, a defined contribution plan, was amended and restated and became the Darling International Inc. Salaried 401(k) Savings Plan and now includes all eligible salaried employees. This plan received the assets and liabilities of participating salaried employees under the Darling National LLC Retirement Savings Plan. Effective January 1, 2008, the Darling International Inc. Salaried 401(k) Savings Plan includes an employer contribution based on age (ranging from 2-5% of compensation per year), and will continue to allow for employee deferrals. Previously, only the Darling National employees received an employer match, which was equal to 100% of the first $10 per pay period deferred by a participant, with a maximum of $520 per year. The Company’s matching portion to the Darling International Inc. Salaried 401(k) Savings Plan for fiscal 2009 and 2008 was approximately $1.5 million and $1.4 million, respectively. The Company’s match in fiscal 2007 for the previous Darling National plan was approximately $0.2 million.
DARLING INTERNATIONAL INC.
Notes to Consolidated Financial Statements (continued)
NOTE 13. EMPLOYEE BENEFIT PLANS
Page 75

FASB ASC Topic 715, Compensation – Retirement Benefits (“ASC 715”) requires that the Company recognize the over-funded or under-funded status of the Company’s defined benefit post-retirement plans as an asset or liability in the Company’s balance sheet, with changes in the funded status recognized through comprehensive income in the year in which they occur. In addition, ASC 715 requires that companies using a measurement date other than the fiscal year end change to a fiscal year end measurement date effective for years ending after December 15, 2008. The Company adopted the measurement date provision in 2008 the impact of which was not material.
The following table sets forth the plans’ funded status and amounts recognized in the Company’s consolidated balance sheets based on the measurement date (January 2, 2010 and January 3, 2009) (in thousands):
DARLING INTERNATIONAL INC.
Notes to Consolidated Financial Statements (continued)
January 2,
2010 January 3,
2009 Change in projected benefit obligation:
Projected benefit obligation at beginning of period $ 96,539 $ 90,742 Service cost 984 1,328 Interest cost 5,767 6,773 Actuarial loss 3,768 2,529 Benefits paid (3,914 ) (4,990 ) Other 15 157
Projected benefit obligation at end of period 103,159 96,539 Change in plan assets:
Fair value of plan assets at beginning of period 60,276 81,578 Actual return on plan assets 12,812 (22,857 ) Employer contribution 14,925 6,545 Benefits paid (3,914 ) (4,990 )
Fair value of plan assets at end of period 84,099 60,276 Funded status (19,060 ) (36,263 ) Post-measurement date contributions – –
Net amount recognized $ (19,060 ) $ (36,263 )
Amounts recognized in the consolidated balance sheets consist of:
Non-current liability $ (19,060 ) $ (36,263 ) Net amount recognized $ (19,060 ) $ (36,263 )
Amounts recognized in accumulated other comprehensive loss consist of:
Net actuarial loss $ 35,866 $ 44,277 Prior service cost 375 503
Net amount recognized (a) $ 36,241 $ 44,780
(a) Amounts do not include deferred taxes of $13.7 million and $17.0 million at January 2, 2010 and January 3, 2009, respectively.
Page 76

Net pension cost includes the following components (in thousands):
Amounts recognized in accumulated other comprehensive income (loss) for the year ended (in thousands):
The estimated amount that will be amortized from accumulated other comprehensive loss into net periodic pension cost in fiscal 2010 is as follows (in thousands):
Weighted average assumptions used to determine benefit obligations were:
DARLING INTERNATIONAL INC.
Notes to Consolidated Financial Statements (continued)
January 2, 2010
January 3, 2009
Projected benefit obligation $ 103,159
$ 96,539
Accumulated benefit obligation 96,082 90,143 Fair value of plan assets 84,099 60,276
January 2,
2010
January 3,
2009
December 29,
2007 Service cost $ 984 $ 1,067 $ 2,328 Interest cost 5,767 5,442 5,011 Expected return on plan assets (4,811 ) (6,603 ) (5,636 ) Net amortization and deferral 4,321 472 1,269 Net pension cost $ 6,261 $ 378 $ 2,972
2009 2008 Actuarial gains recognized: Reclassification adjustments $ 2,558 $ 213 Actuarial (loss)/gain recognized during the period 2,592 (20,578 ) Measurement date adoption adjustment – 52 Prior service (cost) credit recognized: Reclassification adjustments 88 75 Prior service cost arising during the period (9 ) (96 ) Measurement date adoption adjustment – 19
$ 5,229 $ (20,315 )
2010 Net actuarial loss $ 3,131 Prior service cost 111
$ 3,242
January 2, 2010
January 3, 2009
December 29, 2007
Discount rate 5.90% 6.10% 6.00% Rate of compensation increase 4.08% 4.08% 4.10%
Page 77

Weighted average assumptions used to determine net periodic benefit cost for the employee benefit pension plans were:
Consideration was made to the long-term time horizon for the plans’ benefit obligations as well as the related asset class mix in determining the expected long-term rate of return. Historical returns are also considered, over the long-term time horizon, in determining the expected return. Considering the overall asset mix of approximately 60% equity and 40% fixed income, several years in the last ten years (except for 2008) having strong double digit returns as well as several years of single digit losses, the Company believes it is reasonable to expect a long-term rate of return of 8.10% for the plans’ investments as a whole.
Plan Assets
The Company’s pension plan weighted-average asset allocations at January 2, 2010 and January 3, 2009, by asset category, are as follows:
The investment objectives have been established in conjunction with a comprehensive review of the current and projected financial requirements. The primary investment objectives are: 1) to have the ability to pay all benefit and expense obligations when due; 2) to maximize investment returns within reasonable and prudent levels of risk in order to minimize contributions; and 3) to maintain flexibility in determining the future level of contributions.
Investment results are the most critical element in achieving funding objectives, while reliance on contributions is a secondary element.
The investment guidelines are based upon an investment horizon of greater than ten years; therefore, interim fluctuations are viewed with this perspective. The strategic asset allocation is based on this long-term perspective. However, because the participants’ average age is somewhat older than the typical average plan age, consideration is given to retaining some short-term liquidity. Analysis of the cash flow projections of the plans indicates that benefit payments will continue to exceed contributions. The results of a thorough asset-liability study completed during 2008 reinforced the appropriateness of the Company’s target asset allocation ranges described herein.
Based upon the plans’ time horizon, risk tolerances, performance expectations, asset class constraints and asset-liability study results, target asset allocation ranges are as follows:
DARLING INTERNATIONAL INC.
Notes to Consolidated Financial Statements (continued)
January 2, 2010
January 3, 2009
December 29,
2007 Discount rate 6.10% 6.00% 5.75% Rate of increase in future compensation levels 4.08% 4.10% 4.08% Expected long-term rate of return on assets 8.10% 8.10% 8.25%
Plan Assets at
Asset Category January 2,
2010 January 3,
2009 Equity Securities 61.1% 55.6% Debt Securities 38.9% 44.2% Other – % 0.2 % Total 100.0 % 100.0 %
Fixed Income 35% - 45% Domestic Equities 45% - 55% International Equities 7% - 13%
Page 78

The fixed income asset allocation may be invested in corporate and government bonds denominated in U.S. dollars, private and publicly traded mortgages, private placement debt, and cash equivalents. The average maturity of the asset class will not exceed ten years. The portfolio is expected to be well diversified.
The domestic equity allocation is invested in stocks traded on one of the U.S. stock exchanges. Securities convertible into such stocks, convertible bonds and preferred stock, may also be purchased. The majority of the domestic equities are invested in large, mid, and small cap index accounts that are well diversified. These index accounts utilize the Standard & Poor’s (“S&P”) 500, S&P 400 and S&P 600, respectively. By definition, small cap investments carry greater risk, but also are expected to create greater returns over time. The plans target approximately 7.5% of the total asset mix to small cap. American Depository Receipts (“ADR’s”) may not account for more than 3% of the holdings. Small company stocks may not exceed 15% of the plans’assets. Small company definitions fluctuate with market levels, but generally will be considered companies with market capitalizations less than $1.5 billion. The portfolio will be diversified in terms of individual company securities and industries. No individual equity or individual fixed income instrument comprises more than 1.5% of the defined benefit plans’ total assets (excluding U.S. government issues).
The international equity allocation is invested in companies whose stock is traded outside the U.S. and/or companies that conduct the major portion of their business outside of the U.S. The portfolio may invest in ADR’s. The emerging market portion of the international equity investment is held below 20% due to greater volatility in the asset class. The portfolio is expected to be diversified in terms of companies, industries and countries.
All investment objectives are expected to be achieved over a market cycle anticipated to be a period of five to seven years. Reallocations are performed at a minimum of twice a year to retain target asset allocation ranges.
The following table presents fair value measurements for the Company’s defined benefit plans’ assets as of January 2, 2010 categorized using the fair value hierarchy under ASC 820 (in thousands):
The defined benefit plans’ assets are 100% comprised of purchased units of pooled separate accounts (“PSA”). The net assets values of the PSA’s are not publicly-quoted in an active market. The net assets value of each PSA is based on the market value of the underlying investments.
Contributions
The Company's funding policy for employee benefit pension plans is to contribute annually not less than the minimum amount required nor more than the maximum amount that can be deducted for federal income tax purposes. Contributions are intended to provide not only for benefits attributed to service to date but also for those expected to be earned in the future.
DARLING INTERNATIONAL INC.
Notes to Consolidated Financial Statements (continued)
Quoted Prices in Significant Other Significant
Fair Value Active Markets
for Observable Unobservable January 2, Identical Assets Inputs Inputs (In thousands of dollars) 2010 (Level 1) (Level 2) (Level 3) Fixed Maturities: Long-term bonds $ 29,879 $ — $ 29,879 $ — U.S. Government bonds 2,193 — 2,193 — Equity Securities: Common stocks 50,527 — 50,527 — Other equity interests 1,500 — 1,500 — $ 84,099 $ — $ 84,099 $ —
Page 79

Based on current actuarial estimates, the Company expects to make payments of approximately $1.0 million to meet funding requirements for its pension plans in fiscal 2010.
Estimated Future Benefit Payments
The following benefit payments, which reflect expected future service, as appropriate, are expected to be paid (in thousands):
The Company participates in several multi-employer pension plans which provide defined benefits to certain employees covered by labor contracts. These plans are not administered by the Company and contributions are determined in accordance with provisions of negotiated labor contracts. Current information with respect to the Company's proportionate share of the over-and under-funded status of all actuarially computed value of vested benefits over these pension plans’ net assets is not available. The Company’s portion of contributions to these plans amounted to $2.8 million, $2.8 million and $2.6 million for the years ended January 2, 2010, January 3, 2009 and December 29, 2007, respectively.
The Company participates in several multi-employer pension plans which provide defined benefits to certain employees covered by labor contracts. One multi-employer plan in which the Company participates gave notification of a mass withdrawal termination for the plan year ended June 30, 2007. In April 2008 the Company made a lump sum settlement payment to this multi-employer plan for approximately $1.4 million, which included a release for any future liability. In June 2009, the Company received a notice of a mass withdrawal termination and a notice of initial withdrawal liability from another multi-employer plan in which it participates. The Company had anticipated this event and as a result had accrued approximately $3.2 million as of January 3, 2009 based on the most recent information that was probable and estimable for this plan. The plan has given a notice of redetermination liability in December 2009 and as a result, the Company’s accrued liability at January 2, 2010 has not increased from the original amount as this remains the Company’s best estimate of the liability based on the most recent information that is probable and estimable for the plan. Another of the underfunded multi-employer plans in which the Company participates has given notification of “Critical Status” under the federal Pension Protection Act (the “PPA”); however, as of January 2, 2010, the Company has not received any further information regarding this Critical Status plan. While the Company has no ability to calculate a possible current liability for under-funded multi-employer plans that could terminate or could require additional funding under the PPA, the amounts could be material.
The Company’s operations are exposed to market risks relating to commodity prices that affect the Company’s cost of raw materials, finished product prices and energy costs and the risk of changes in interest rates.
The Company makes limited use of derivative instruments to manage cash flow risks related to interest expense, natural gas usage and inventory. Interest rate swaps are entered into with the intent of managing overall borrowing costs by reducing the potential impact of increases in interest rates on floating-rate long-term debt. Natural gas swaps and collars are entered into with the intent of managing the overall cost of natural gas usage by reducing the potential impact of seasonal weather demands on natural gas that increases natural gas prices. Heating oil swaps are entered into with the intent of managing the overall cost of diesel fuel usage by reducing the potential impact of seasonal weather demands on diesel fuel that increases diesel fuel prices. Inventory swaps are entered into with the intent of managing seasonally high concentrations of MBM, BFT and YG inventories by reducing the potential impact of decreasing prices. The Company does not use derivative instruments for trading purposes. At January 2, 2010, the Company had natural gas swaps and two interest rate swaps outstanding that qualified and were designated for hedge accounting as well as heating oil swaps and inventory swaps that did not qualify and were not designated for hedge accounting.
DARLING INTERNATIONAL INC.
Notes to Consolidated Financial Statements (continued)
Year Ending Pension Benefits 2010 $ 4,340 2011 4,470 2012 4,590 2013 4,730 2014 5,210 Years 2015 – 2019 31,040
NOTE 14. DERIVATIVES
Page 80

In accordance with ASC 815 entities are required to report all derivative instruments in the statement of financial position at fair value. The accounting for changes in the fair value (i.e., gains or losses) of a derivative instrument depends on whether it has been designated and qualifies as part of a hedging relationship and, if so, on the reason for holding the instrument. If certain conditions are met, entities may elect to designate a derivative instrument as a hedge of exposures to changes in fair value, cash flows or foreign currencies. If the hedged exposure is a cash flow exposure, the effective portion of the gain or loss on the derivative instrument is reported initially as a component of other comprehensive income (outside of earnings) and is subsequently reclassified into earnings when the forecasted transaction affects earnings. Any amounts excluded from the assessment of hedge effectiveness as well as the ineffective portion of the gain or loss are reported in earnings immediately. If the derivative instrument is not designated as a hedge, the gain or loss is recognized in earnings in the period of change.
Cash Flow Hedges
On May 19, 2006, the Company entered into two interest rate swap agreements that are considered cash flow hedges according to ASC 815. Under the terms of these swap agreements, beginning June 30, 2006, the cash flows from the Company’s $50.0 million floating-rate term loan facility under the Credit Agreement have been exchanged for fixed-rate contracts that bear interest, payable quarterly. The first swap agreement for $25.0 million matures April 7, 2012 and bears interest at 5.42%, which does not include the borrowing spread per the Credit Agreement, with amortizing payments that mirror the term loan facility. The second swap agreement for $25.0 million matures April 7, 2012 and bears interest at 5.415%, which does not include the borrowing spread per the Credit Agreement, with amortizing payments that mirror the term loan facility. The Company’s receive rate on each swap agreement is based on three-month LIBOR.
On May 15, 2009, the Company entered into natural gas swap contracts that were considered cash flow hedges according to ASC 815. Under the terms of the natural gas swap contracts the Company fixed the expected purchase cost of 400,000 mmbtu’s of natural gas representing a portion of its plants expected usage for the months of July 2009 through October 2009 at a fixed rate of $4.5248 per mmbtu. As of January 2, 2010 these cash flow hedges have expired and settled according to the contracts.
On November 13, 2009, the Company entered into natural gas swap contracts that are considered cash flow hedges according to ASC 815. Under the terms of the natural gas swap contracts the Company fixed the expected purchase cost of 480,000 mmbtu’s of natural gas representing a portion of its plants expected usage for the months of January 2010 through March 2010 at a fixed rate of $4.84 per mmbtu.
The Company estimates the amount that will be reclassified from accumulated other comprehensive loss at January 2, 2010 into earnings over the next 12 months will be approximately $1.3 million. No gains or losses have been reclassified into earnings as a result of the discontinuance of cash flow hedges.
DARLING INTERNATIONAL INC.
Notes to Consolidated Financial Statements (continued)
Page 81

The following table presents the fair value of the Company’s derivative instruments under ASC 815 as of January 2, 2010 and January 3, 2009 (in thousands):
The effect of the Company’s derivative instruments on the consolidated statement of operations for the fiscal years ended January 2, 2010 and January 3, 2009 are as follows (in thousands):
DARLING INTERNATIONAL INC.
Notes to Consolidated Financial Statements (continued)
Derivatives Designated Balance Sheet Asset Derivatives Fair Value as Hedges Location January 2, 2010 January 3, 2009
Natural gas swaps Other current assets $ 228 $ –
Total derivatives designated as hedges $ 228 $ –
Derivatives not Designated as
Hedges Heating oil swaps Other current assets $ 84 $ – Total derivatives not designated as hedges $ 84 $ –
Total asset derivatives $ 312 $ –
Derivatives Designated Balance Sheet Liability Derivatives Fair Value as Hedges Location January 2, 2010 January 3, 2009
Interest rate swaps Other noncurrent liabilities $ 2,473 $ 3,593
Total derivatives designated as hedges $ 2,473 $ 3,593
Derivatives not Designated as
Hedges Inventory swaps Accrued Expenses $ 3 $ –
Total derivates not designated as hedges $ 3 $ –
Total liability derivatives $ 2,476 $ 3,593
Derivatives Designated as
Cash Flow Hedges
Gain or (Loss) Recognized in OCI
on Derivatives (Effective Portion) (a)
Gain or (Loss)
Reclassified From Accumulated OCI
into Income (Effective Portion) (b)
Gain or (Loss) Recognized in Income
On Derivatives (Ineffective Portion and Amount Excluded from
Effectiveness Testing) (c) 2009 2008 2009 2008 2009 2008 Interest rate swaps $ (2,251) $ (3,398) $ (1,629) $ (777) $ (27) $ (195) Natural gas swaps 223 – (409) – 5 –
Total $ (2,028) $ (3,398) $ (2,038) $ (777) $ (22) $ (195)
Page 82


At January 2, 2010, the Company had forward purchase agreements in place for purchases of approximately $5.1 million of natural gas and diesel fuel. These forward purchase agreements have no net settlement provisions and the Company intends to take physical delivery. Accordingly, the forward purchase agreements are not subject to the requirements of ASC 815 because they qualify as normal purchases as defined in the standard.
In accordance with FASB ASC Topic 820, Fair Value Measurements and Disclosures (“ASC 820”) , which defines fair value, establishes a framework for measuring fair value, and expands disclosures about fair value measurements including guidance related to nonrecurring measurements of nonfinancial assets and liabilities.
The following table presents the Company’s financial instruments that are measured at fair value on a recurring basis as of January 2, 2010 and are categorized using the fair value hierarchy under ASC 820. The fair value hierarchy has three levels based on the reliability of the inputs used to determine the fair value.
Derivative assets consist of the Company’s natural gas swap and heating oil swap contracts, which represents the difference between the observable market rates of commonly quoted intervals for similar assets and liabilities in active markets and the fixed swap rate considering the instruments term, notional amount and credit risk.
Derivative liabilities mostly consist of the Company’s interest rate swap contracts, which represent the present value of yield curves observable at commonly quoted intervals for similar assets and liabilities in active markets considering the instrument’s term, notional amount, discount rate and credit risk.
DARLING INTERNATIONAL INC.
Notes to Consolidated Financial Statements (continued)
(a) Amount recognized in accumulated OCI (effective portion) is reported as accumulated other comprehensive loss of approximately $2.0 million and approximately $3.4 million recorded net of taxes of approximately $0.8 million and approximately $1.3 million for the year ended January 2, 2010 and January 3, 2009, respectively.
(b) Gains and (losses) reclassified from accumulated OCI into income (effective portion) for interest rate swaps and natural gas swaps is included in interest expense and cost of sales, respectively, in the Company’s consolidated statements of operations.
(c) Gains and (losses) recognized in income on derivatives (ineffective portion) for interest rate swaps and natural gas swaps is included in other, net in the Company’s consolidated statements of operations.
NOTE 15. FAIR VALUE MEASUREMENT
Fair Value Measurements at January 2, 2010 Using Quoted Prices in Significant Other Significant Active Markets for Observable Unobservable Identical Assets Inputs Inputs (In thousands of dollars) Total (Level 1) (Level 2) (Level 3) Derivative assets $ 312 $ — $ 312 $ — Derivative liabilities (2,476) — (2,476) —
Total $(2,164) $ — $(2,164) $ —
Page 83
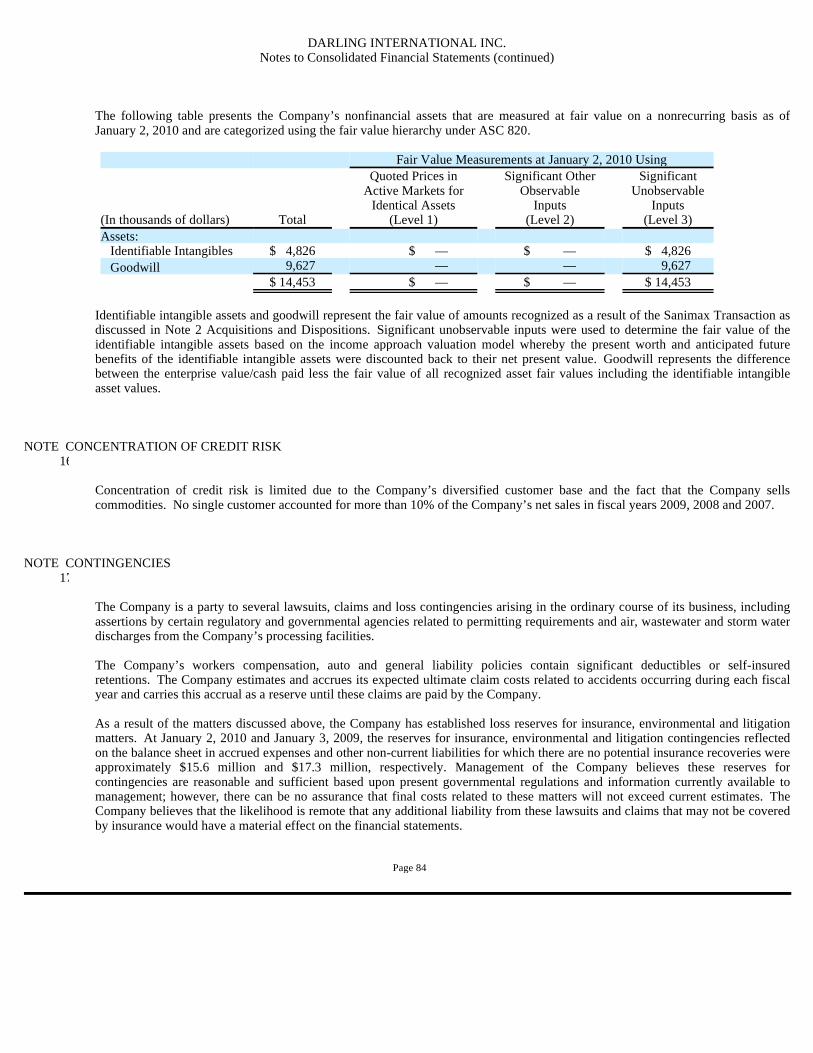
The following table presents the Company’s nonfinancial assets that are measured at fair value on a nonrecurring basis as of January 2, 2010 and are categorized using the fair value hierarchy under ASC 820.
Identifiable intangible assets and goodwill represent the fair value of amounts recognized as a result of the Sanimax Transaction as discussed in Note 2 Acquisitions and Dispositions. Significant unobservable inputs were used to determine the fair value of the identifiable intangible assets based on the income approach valuation model whereby the present worth and anticipated future benefits of the identifiable intangible assets were discounted back to their net present value. Goodwill represents the difference between the enterprise value/cash paid less the fair value of all recognized asset fair values including the identifiable intangible asset values.
Concentration of credit risk is limited due to the Company’s diversified customer base and the fact that the Company sells commodities. No single customer accounted for more than 10% of the Company’s net sales in fiscal years 2009, 2008 and 2007.
The Company is a party to several lawsuits, claims and loss contingencies arising in the ordinary course of its business, including assertions by certain regulatory and governmental agencies related to permitting requirements and air, wastewater and storm water discharges from the Company’s processing facilities.
The Company’s workers compensation, auto and general liability policies contain significant deductibles or self-insured retentions. The Company estimates and accrues its expected ultimate claim costs related to accidents occurring during each fiscal year and carries this accrual as a reserve until these claims are paid by the Company.
As a result of the matters discussed above, the Company has established loss reserves for insurance, environmental and litigation matters. At January 2, 2010 and January 3, 2009, the reserves for insurance, environmental and litigation contingencies reflected on the balance sheet in accrued expenses and other non-current liabilities for which there are no potential insurance recoveries were approximately $15.6 million and $17.3 million, respectively. Management of the Company believes these reserves for contingencies are reasonable and sufficient based upon present governmental regulations and information currently available to management; however, there can be no assurance that final costs related to these matters will not exceed current estimates. The Company believes that the likelihood is remote that any additional liability from these lawsuits and claims that may not be covered by insurance would have a material effect on the financial statements.
DARLING INTERNATIONAL INC.
Notes to Consolidated Financial Statements (continued)
Fair Value Measurements at January 2, 2010 Using Quoted Prices in Significant Other Significant Active Markets for Observable Unobservable Identical Assets Inputs Inputs (In thousands of dollars) Total (Level 1) (Level 2) (Level 3) Assets: Identifiable Intangibles $ 4,826 $ — $ — $ 4,826 Goodwill 9,627 — — 9,627
$ 14,453 $ — $ — $ 14,453
NOTE 16. CONCENTRATION OF CREDIT RISK
NOTE 17. CONTINGENCIES
Page 84
Lower Passaic River Area . The Company has been named as a third party defendant in a lawsuit pending in the Superior Court of New Jersey, Essex County, styled New Jersey Department of Environmental Protection, The Commissioner of the New Jersey Department of Environmental Protection Agency and the Administrator of the New Jersey Spill Compensation Fund, as Plaintiffs, vs. Occidental Chemical Corporation, Tierra Solutions, Inc., Maxus Energy Corporation, Repsol YPF, S.A., YPF, S.A., YPF Holdings, Inc., and CLH Holdings, as Defendants (Docket No. L-009868-05) (the “Tierra/Maxus Litigation”). In the Tierra/Maxus Litigation, which was filed on December 13, 2005, the plaintiffs seek to recover from the defendants past and future cleanup and removal costs, as well as unspecified economic damages, punitive damages, penalties and a variety of other forms of relief, purportedly arising from the alleged discharges into the Passaic River of a particular type of dioxin and other unspecified hazardous substances. The damages being sought by the plaintiffs from the defendants are likely to be substantial. On February 4, 2009, two of the defendants, Tierra Solutions, Inc. (“Tierra”) and Maxus Energy Corporation (“Maxus”), filed a third party complaint against over 300 entities, including the Company, seeking to recover all or a proportionate share of cleanup and removal costs, damages or other loss or harm, if any, for which Tierra or Maxus may be held liable in the Tierra/Maxus Litigation. Tierra and Maxus allege that Standard Tallow Company, an entity that the Company acquired in 1996, contributed to the discharge of the hazardous substances that are the subject of this case while operating a former plant site located in Newark, New Jersey. The Company is investigating these allegations, has entered into a joint defense agreement with many of the other third-party defendants and intends to defend itself vigorously. Additionally, in December 2009, the Company, along with numerous other entities, received notice from the United States Environmental Protection Agency (EPA) that the Company (as successor-in-interest to Standard Tallow Company) is considered a potentially responsible party with respect to alleged contamination in the lower Passaic River area which is part of the Diamond Alkali Superfund Site located in Newark, New Jersey. In the letter, EPA requested that the Company join a group of other parties in funding a remedial investigation and feasibility study at the site. As of the date of this report, the Company has not agreed to participate in the funding group. The Company’s ultimate liability for investigatory costs, remedial costs and/or natural resource damages in connection with the lower Passaic River area cannot be determined at this time; however, as of the date of this report, there is nothing that leads the Company to believe that these matters will have a material effect on the Company’s financial position or results of operation.
In July 2007, a judgment was entered in a litigation matter involving a contract dispute in which the Company was a party. The judgment required the Company to convey an unused parcel of property recorded on the books for approximately $500,000 to the counterparty for that amount. In December 2007, a judgment was entered in the matter awarding the counterparty approximately $2.6 million in attorneys’ fees and costs. The Company filed appeals of both judgments. The Company settled this matter during the first quarter of fiscal 2008. Pursuant to the terms of the settlement, the Company transferred the property to the counterparty for a purchase price of $500,000, paid the counterparty approximately $2.2 million towards attorneys’ fees and costs and agreed to dismiss its pending appeals with prejudice. In addition, the parties exchanged mutual releases. The Company recorded a charge of $2.2 million for the attorneys’ fees and costs in the fourth quarter of 2007, which is included in selling, general and administrative expenses.
In June 2006, the Company was awarded damages of approximately $7.4 million as a result of a service provider’s failure to provide steam under a service agreement to one of the Company’s plants. At the time the damages were awarded, collectibility of such damages was uncertain; however on October 12, 2006, the Company entered into an agreement to sell its rights to such damages to a third party for $2.2 million in cash. The agreement was made subject to certain conditions which were satisfied on March 1, 2007. On March 8, 2007, the Company received $2.2 million and transferred its damage award to the third party. The Company recorded a gain with the receipt of the $2.2 million in proceeds in the first quarter of 2007.
DARLING INTERNATIONAL INC.
Notes to Consolidated Financial Statements (continued)
Page 85

The Company sells its products domestically and internationally and operates within two industry segments: Rendering and Restaurant Services. The measure of segment profit (loss) includes all revenues, operating expenses (excluding certain amortization of intangibles), and selling, general and administrative expenses incurred at all operating locations and excludes general corporate expenses.
Included in corporate activities are general corporate expenses and the amortization of intangibles. Assets of corporate activities include cash, unallocated prepaid expenses, deferred tax assets, prepaid pension, and miscellaneous other assets.
Rendering Rendering consists of the collection and processing of animal by-products, including hides, from butcher shops, grocery stores, food service industry and meat and poultry processors, converting these principally into useable oils and proteins utilized by the agricultural, leather and oleo-chemical industries. These finished products are MBM and BFT.
Restaurant Services Restaurant Services consists of the collection of used cooking oils from food service establishments and recycling them into similar products such as high-energy animal feed ingredients and industrial oils. This finished product is YG. Restaurant Services also provides grease trap servicing. Included in restaurant services is the National Service Center (“NSC”). The NSC schedules services such as fat and bone and used cooking oil collection as well as trap cleaning for contracted customers using the Company’s resources or third party providers.
Business Segment Net Revenues (in thousands):
Included in corporate activities are general corporate expenses and the amortization of intangibles related to “Fresh Start Reporting.”
DARLING INTERNATIONAL INC.
Notes to Consolidated Financial Statements (continued)
NOTE 18. BUSINESS SEGMENTS
Year Ended January 2,
2010 January 3,
2009 December 29,
2007 Rendering:
Trade $ 458,573 $ 585,108 $ 464,468 Intersegment 16,216 50,832 42,095
474,789 635,940 506,563 Restaurant Services:
Trade 139,233 222,384 180,845 Intersegment 13,126 10,118 5,311
152,359 232,502 186,156
Eliminations (29,342 ) (60,950 ) (47,406 ) Total $ 597,806 $ 807,492 $ 645,313
Page 86

Business Segment Profit/(Loss ) (in thousands):
Certain assets are not attributable to a single operating segment but instead relate to multiple operating segments operating out of individual locations. These assets are utilized by both the Rendering and Restaurant Services business segments and are identified in the category Combined Rendering/Restaurant Services. Depreciation of Combined Rendering/Restaurant Services assets is allocated based upon an estimate of the percentage of corresponding activity attributed to each segment. Additionally, although intangible assets are allocated to operating segments, the amortization related to the adoption of “Fresh Start Reporting”in 1993 is not considered in the measure of operating segment profit/(loss) and is included in Corporate Activities.
As discussed in Note 17, the Company received proceeds of $2.2 million during the first quarter of fiscal 2007 as a result of a service provider’s failure to provide steam under a service agreement to one of the Company’s plants. The Company recorded approximately $1.2 million of the proceeds as a reduction of cost of sales in the Company’s rendering segment and approximately $1.0 million as a reduction of selling and general and administrative costs in the corporate segment.
Business Segment Assets (in thousands):
Business Segment Property, Plant and Equipment (in thousands):
DARLING INTERNATIONAL INC.
Notes to Consolidated Financial Statements (continued)
Year Ended
January 2,
2010 January 3,
2009
December 29,
2007 Rendering $ 94,446 $ 101,439 $ 85,654 Restaurant services 15,251 29,896 34,953 Corporate activities (64,802 ) (73,755 ) (70,029 ) Interest expense (3,105 ) (3,018 ) (5,045 ) Net income $ 41,790 $ 54,562 $ 45,533
January 2,
2010 January 3,
2009 Rendering $ 171,005 $ 158,190 Restaurant Services 65,184 47,386 Combined Rendering/Restaurant Services 100,173 96,317 Corporate Activities 89,809 92,482 Total $ 426,171 $ 394,375
January 2,
2010 January 3,
2009
December 29,
2007 Depreciation and amortization:
Rendering $ 16,648 $ 14,270 $ 13,509 Restaurant Services 5,284 4,310 3,881 Corporate Activities 3,294 5,853 5,824 Total $ 25,226 $ 24,433 $ 23,214
Capital expenditures: Rendering $ 5,071 $ 11,723 $ 2,880 Restaurant Services 1,211 610 538 Combined Rendering/Restaurant Services 13,384 15,776 10,609
Corporate Activities 3,972 2,897 1,525 Total (a) $ 23,638 $ 31,006 $ 15,552
(a) Excludes the capital assets acquired as part of the acquisition of assets related to the Sanimax Transaction and Boca Transaction in fiscal 2009 of approximately $8.0 million and the API Transaction in fiscal 2008 of approximately $3.4 million.
Page 87

The Company has no material foreign operations, but exports a portion of its products to customers in various foreign countries.
Geographic Area Net Trade Revenues (in thousands):
The Company attributes revenues from external customers to individual foreign countries based on the destination of the Company’s shipments. For fiscal 2009, 2008 and 2007, no individual foreign country comprised more than 5% of the Company’s consolidated revenue.
DARLING INTERNATIONAL INC.
Notes to Consolidated Financial Statements (continued)
January 2,
2010 January 3,
2009
December 29,
2007 Domestic $ 526,975 $ 675,257 $ 473,694 Foreign 70,831 132,235 171,619 Total $ 597,806 $ 807,492 $ 645,313
NOTE 19. QUARTERLY FINANCIAL DATA (UNAUDITED AND IN THOUSANDS EXCEPT PER SHARE AMOUNTS):
Year Ended January 2, 2010
First
Quarter Second
Quarter Third
Quarter Fourth
Quarter Net sales $ 133,000 $ 155,298 $ 159,936 $ 149,572 Operating income 8,763 20,276 25,396 16,504 Income from operations before income taxes 7,868 19,274 24,819 14,918 Net income 4,810 11,699 16,073 9,208 Basic earnings per share 0.06 0.14 0.20 0.11 Diluted earnings per share 0.06 0.14 0.19 0.11
Year Ended January 3, 2009
First
Quarter Second
Quarter Third
Quarter
Fourth Quarter
(a) Net sales $ 201,956 $ 220,858 $ 236,227 $ 148,451 Operating income/(loss) 35,167 39,735 37,312 (19,538 ) Income/(loss) from operations before income taxes 34,489 39,093 36,695 (20,361 ) Net income/(loss) 21,461 24,079 22,994 (13,972 ) Basic earnings per share 0.26 0.30 0.28 (0.17 ) Diluted earnings per share 0.26 0.29 0.28 (0.17 )
(a) Included in operating loss in the fourth quarter of fiscal 2008 is a charge for goodwill impairment of approximately $15.9 million and an estimated accrued liability of approximately $3.2 million related to a multi-employer pension plan where the Company is seeking a mass withdrawal termination. In addition, the fourth quarter of fiscal 2008 includes an additional week of operations that did not have a material impact on results.
Page 88

In December 2007, the FASB issued revised guidance under ASC Topic 805, Business Combinations (“ASC 805”) . The new provisions of ASC 805 applies to all transactions and other events in which one entity obtains control over one or more other businesses. ASC 805 requires an acquirer, upon initially obtaining control of another entity, to recognize the assets, liabilities and any non-controlling interest in the acquiree at fair value as of the acquisition date. Contingent consideration is required to be recognized and measured at fair value on the date of acquisition rather than at a later date when the amount of that consideration may be determinable beyond a reasonable doubt. This fair value approach replaces the cost-allocation process required under the pre-codification SFAS 141 whereby the cost of an acquisition was allocated to the individual assets acquired and liabilities assumed based on their estimated fair value. ASC 805 requires acquirers to expense acquisition related costs as incurred rather than allocating these costs to assets acquired and liabilities assumed, as was done under the pre-codification SFAS 141. The new provisions of ASC 805 were adopted by the Company on January 4, 2009. The effect of this standard depends on acquisition activity and its relative size to the Company. During fiscal 2009 the Company did have acquisition activity as discussed in Note 2 Acquisitions and Dispositions. The adoption of ASC 805 did not have a material impact on the determination or reporting of the Company’s financial results for the period ended January 2, 2010.
In December 2007, the FASB issued guidance under ASC Topic 810, Consolidation (“ASC 810”). These new provisions of ASC 810 establishes new standards that will govern the accounting for and reporting of (1) noncontrolling interests in partially owned consolidated subsidiaries and (2) the loss of control of subsidiaries. ASC 810 was adopted by the Company on January 4, 2009 on a prospective basis. The adoption of these new provisions of ASC 810 did not have an impact to the consolidated financial statements of the Company.
In March 2008, the FASB issued guidance under ASC Topic 815, Derivatives and Hedging . These new provisions of ASC 815 are intended to improve transparency in financial reporting by requiring enhanced disclosures of an entity’ s derivative instruments and hedging activities and their effects on the entity’ s financial position, financial performance, and cash flows. These new provisions apply to all derivative instruments within the scope of ASC 815 as well as related hedged items, bifurcated derivatives, and nonderivative instruments that are designated and qualify as hedging instruments. The fair value of derivative instruments and their gains and losses will need to be presented in tabular format in order to present a more complete picture of the effects of using derivative instruments. The Company adopted these new provisions of ASC 815 effective January 4, 2009. The adoption of this new guidance did not have a material effect to the consolidated financial statements of the Company.
In April 2008, the FASB issued guidance under ASC Topic 350, Intangibles-Goodwill and Other . The new provisions of ASC 350 amend the factors that should be considered in developing renewal or extension assumptions used to determine the useful life of a recognized intangible asset. ASC 350 was adopted on January 4, 2009. The adoption of ASC 350 did not have a material effect to the consolidated financial statements of the Company.
In December 2008, the FASB issued guidance under ASC Topic 715, Compensation – Retirement Benefits to provide guidance on an employer’s disclosures about plan assets of a defined benefit pension or other postretirement plan on investment policies and strategies, major categories of plan assets, inputs and valuation techniques used to measure the fair value of plan assets and significant concentrations of risk within plan assets. The disclosures about plan assets required by ASC 715 are effective for fiscal years ending after December 15, 2009, with earlier application permitted. Upon initial application, the provisions of ASC 715 are not required for earlier periods that are presented for comparative purposes. The adoption of these new provisions of ASC 715 did not have a material effect to the consolidated financial statement of the Company.
DARLING INTERNATIONAL INC.
Notes to Consolidated Financial Statements (continued)
NOTE 20. NEW ACCOUNTING PRONOUNCEMENTS
Page 89

In April 2009, the FASB issued guidance under ASC Topic 805, Business Combinations . This new guidance amends and clarifies ASC 805 to address application on initial recognition and measurement, subsequent measurement and accounting and disclosure of assets and liabilities arising from contingencies in a business combination. The Company’s adoption of this new guidance did not have a material impact on the determination or reporting of the Company’s financial results for the period ended January 2, 2010.
In April 2009, the FASB issued guidance under ASC Topic 825, Financial Instruments (“ASC 825”). ASC 825 requires disclosures about fair value of financial instruments for interim reporting periods as well as in annual financial statements. ASC 825 is effective for interim reporting periods ending after June 15, 2009. The Company’s adoption of ASC 825 did not have a material impact on the consolidated financial statements of the Company.
In May 2009, the FASB issued ASC Topic 855, Subsequent Events (“ASC 855”) effective for interim or annual periods ending after June 15, 2009. The objective of ASC 855 is to establish general standards of accounting for and disclosures of events that occur after the balance sheet date but before financial statements are issued or are available to be issued. ASC 855 also requires entities to disclose the date through which subsequent events were evaluated as well as the rationale for why that date was selected. The adoption of ASC 855 did not have a material effect to the consolidated financial statements of the Company.
In June 2009, the FASB issued ASU 2009-01, Topic 105, Generally Accepted Accounting Policies (“ASC 105”). ASC 105 established the ASC as the source of authoritative U.S. generally accepted accounting principles (“U.S. GAAP”) recognized by the FASB to be applied by nongovernmental entities in the preparation of financial statements in conformity of U.S. GAAP. ASC does not change current U.S. GAAP, but is intended to simplify user access to all authoritative U.S. GAAP by providing all the authoritative literature related to a particular topic in one place. ASC is effective for interim and annual periods ending after September 15, 2009. The adoption of ASC 105 has changed how the Company references various elements of U.S GAAP when preparing the Company’s financial statement disclosures, but did not have an impact on the consolidated financial statements of the Company.
In December 2009, the FASB issued ASU 2009-17 which codifies SFAS No. 167, Amendments to FASB Interpretation 46(R) issued in June 2009. ASU 2009-17 changes how a company determines when an entity that is insufficiently capitalized or is not controlled through voting (or similar rights) should be consolidated. ASU 2009-17 requires additional disclosures about a company’s involvement with variable interest entities and any significant changes in risk exposure due to that involvement. The Company is required to adopt ASU 2009-17 on January 3, 2010 and is currently evaluating the impact of adopting this new standard.
DARLING INTERNATIONAL INC.
Notes to Consolidated Financial Statements (continued)
Page 90

SCHEDULE II
Valuation and Qualifying Accounts (In thousands)
DARLING INTERNATIONAL INC.
Notes to Consolidated Financial Statements (continued)
Additions Charged to:
Description Balance at
Beginning of Period
Costs and Expenses
Other
Deductions (a)
Balance at End of Period
Reserve for bad debts:
Year ended January 2, 2010 $ 2,313 $ 488 $ – $ 653 $ 2,148
Year ended January 3, 2009 $ 1,466 $ 1,506 $ – $ 659 $ 2,313
Year ended December 29, 2007 $ 1,639 $ 407 $ – $ 580 $ 1,466
Deferred tax valuation allowance:
Year ended January 2, 2010 $ 220 $ – $ – $ 45 $ 175
Year ended January 3, 2009 $ 4,793 $ – $ – $ 4,573 $ 220
Year ended December 29, 2007 $ 9,416 $ – $ – $ 4,623 $ 4,793
(a) Deductions consist of write-offs of uncollectible accounts receivable and reductions of the deferred tax valuation allowance.
Page 91

PART II
None.
Evaluation of Disclosure Controls and Procedures .
As required by Exchange Act Rule 13a-15(b), the Company’s management, including the Chief Executive Officer and Chief Financial Officer, conducted an evaluation, as of the end of the period covered by this report, of the effectiveness of the design and operation of the Company’s disclosure controls and procedures. As defined in Exchange Act Rules 13a-15(e) and 15d-15(e) under the Exchange Act, disclosure controls and procedures are controls and other procedures of the Company that are designed to ensure that information required to be disclosed by the Company in the reports it files or submits under the Exchange Act is recorded, processed, summarized and reported, within the time periods specified in the SEC’s rules and forms. Disclosure controls and procedures include, without limitation, controls and procedures designed to ensure that information required to be disclosed by the Company in the reports it files or submits under the Exchange Act is accumulated and communicated to the Company’s management, including the Chief Executive Officer and Chief Financial Officer, as appropriate to allow timely decisions regarding required disclosure.
Based on management’s evaluation, the Chief Executive Officer and Chief Financial Officer concluded that the Company’s disclosure controls and procedures were effective as of the end of the period covered by this report. Internal Control over Financial Reporting .
(a) Management’s Annual Report on Internal Control over Financial Reporting. Management of the Company is responsible for establishing and maintaining adequate internal control over financial reporting as defined in Rules 13a-15(f) and 15d-15(f) promulgated under the Exchange Act. Those rules define internal control over financial reporting as a process designed to provide reasonable assurance regarding the reliability of financial reporting and the preparation of financial statements for external purposes in accordance with generally accepted accounting principles and includes those policies and procedures that:
Because of its inherent limitations, internal control over financial reporting may not prevent or detect misstatements. Projections of any
evaluation of effectiveness to future periods are subject to the risk that controls may become inadequate because of changes in conditions, or that the degree of compliance with the policies or procedures may deteriorate.
The Company’s management assessed the effectiveness of the Company’s internal control over financial reporting as of January 2 , 2010. In making this assessment, the Company’s management used the criteria established in Internal Control-Integrated Framework issued by the Committee of Sponsoring Organizations of the Treadway Commission (COSO).
ITEM 9.
CHANGES IN AND DISAGREEMENTS WITH ACCOUNTANTS ON A CCOUNTING AND FINANCIAL DISCLOSURE
ITEM 9A.
CONTROLS AND PROCEDURES
• Pertain to the maintenance of records that, in reasonable detail, accurately and fairly reflect the transactions and dispositions of the assets of the Company;
• Provide reasonable assurance that transactions are recorded as necessary to permit preparation of financial statements in accordance with generally accepted accounting principles, and that receipts and expenditures of the Company are being made only in accordance with authorizations of management and directors of the Company; and
• Provide reasonable assurance regarding prevention or timely detection of unauthorized acquisition, use or disposition of the Company’s assets that could have a material effect on the financial statements.
Page 92

Based on their assessment, management has concluded that the Company’s internal control over financial reporting was effective at the reasonable assurance level as of January 2, 2010.
KPMG LLP, the registered public accounting firm that audited the Company’s financial statements, has issued an audit report on management’s assessment of the Company’s internal control over financial reporting, which report is included herein.
(b) Attestation Report of the Registered Public Accounting Firm. The attestation report called for by Item 308(b) of Regulation S-K is incorporated herein by reference to Report of Independent Registered Public Accounting Firm on Internal Control Over Financial Reporting, included in Part II, Item 8, “Financial Statements and Supplementary Data” of this report.
(c) Changes in Internal Control over Financial Reporting . As required by Exchange Act Rule 13a-15(d), the Company’s management, including the Chief Executive Officer and Chief Financial Officer, also conducted an evaluation of the Company’s internal control over financial reporting to determine whether any change occurred during the last fiscal quarter of the period covered by this report that has materially affected, or is reasonably likely to materially affect, the Company’s internal control over financial reporting. Based on that evaluation, there has been no change in the Company’s internal control over financial reporting during the last fiscal quarter of the period covered by this report that has materially affected, or is reasonably likely to materially affect, the Company’s internal control over financial reporting.
None.
ITEM 9B.
OTHER INFORMATION
Page 93

PART III
The information required by this Item with respect to Items 401, 405 and 407 of Regulation S-K will appear in the sections entitled “Election of Directors,” “Executive Officers and Directors,” “Section 16(a) Beneficial Ownership Reporting Compliance” and “Corporate Governance-Committees of the Board-Audit Committee” included in the Company’s definitive Proxy Statement relating to the 2010 Annual Meeting of Stockholders, which information is incorporated herein by reference.
The Company has adopted the Darling International Inc. Code of Business Conduct (“Code of Business Conduct”), which is applicable to all of the Company’s employees, including its senior financial officers, the Chief Executive Officer, Chief Financial Officer, Controller, Treasurer and General Counsel. The Company has not granted any waivers to the Code of Business Conduct to date. A copy of the Company’s Code of Business Conduct has been posted on the “Investor” portion of our web site, at www.darlingii.com . Shareholders may request a free copy of our Code of Business Conduct from:
Brad Phillips Darling International Inc. 251 O’Connor Ridge Blvd, Suite 300 Irving, Texas 75038 Phone: 972-717-0300 Fax: 972-717-1588 Email: [email protected]
The information required by this Item will appear in the sections entitled “Executive Compensation,” “Compensation Committee
Report” and “Corporate Governance-Compensation Committee Interlocks and Insider Participation” included in the Company’s definitive Proxy Statement relating to the 2010 Annual Meeting of Stockholders, which information is incorporated herein by reference.
The information required by this Item with respect to Item 201(d) of Regulation S-K appears in Item 5 of this report.
The information required by this Item with respect to Item 403 of Regulation S-K will appear in the section entitled “Security
Ownership of Certain Beneficial Owners and Management” included in the Company’s definitive Proxy Statement relating to the 2010 Annual Meeting of Stockholders, which information is incorporated herein by reference.
The information required by this Item will appear in the sections entitled “Transactions with Related Persons, Promoters and Certain
Control Persons” and “Corporate Goverance-Independent Directors” included in the Company’s definitive Proxy Statement relating to the 2010 Annual Meeting of Stockholders, which information is incorporated herein by reference.
The information required by this Item will appear in the section entitled “Independent Auditors” included in the Company’s definitive Proxy Statement relating to the 2010 Annual Meeting of Stockholders, which information is incorporated herein by reference.
ITEM 10.
DIRECTORS, EXECUTIVE OFFICERS AND CORPORATE GOVERN ANCE
ITEM 11.
EXECUTIVE COMPENSATION
ITEM 12.
SECURITY OWNERSHIP OF CERTAIN BENEFICIAL OWNERS AN D MANAGEMENT AND RELATED STOCKHOLDER MATTERS
ITEM 13.
CERTAIN RELATIONSHIPS AND RELATED TRANSACTIONS, AN D DIRECTOR INDEPENDENCE
ITEM 14.
PRINCIPAL ACCOUNTING FEES AND SERVICES

Page 94

PART IV
All other schedules are omitted since the required information is not present or is not present in amounts sufficient to require submission of the schedule, or because the information required is included in the consolidated financial statements and notes thereto.
ITEM 15.
EXHIBITS, FINANCIAL STATEMENT SCHEDULES
Page
(a) Documents filed as part of this report:
(1) The following consolidated financial statements are included in Item 8. Report of Independent Registered Public Accounting Firm on Consolidated Financial Statements 51 Report of Independent Registered Public Accounting Firm on Internal Control Over Financial
Reporting 52
Consolidated Balance Sheets January 2, 2010 and January 3, 2009 53 Consolidated Statements of Operations- Three years ended January 2, 2010 54 Consolidated Statements of Stockholders’ Equity and Comprehensive Income(Loss) - Three years ended January 2, 2010 55 Consolidated Statements of Cash Flows - Three years ended January 2, 2010 57 Notes to Consolidated Financial Statements 58 (2) The following financial statement schedule is included in Item 8. Schedule II – Valuation and Qualifying Accounts Three years ended January 2, 2010 91
Page 95

(3)
Exhibits.
Exhibit No. Document
3.1 Restated Certificate of Incorporation of the Company, as amended (filed as Exhibit 3.1 to the Company’s Registration Statement on Form S-1 filed May 23, 2002 and incorporated herein by reference).
3.2 Amended and Restated Bylaws of the Company (filed as Exhibit 3.1 to the Company’s Current Report on Form 8-K
filed December 12, 2008 and incorporated herein by reference).
4.1 Specimen Common Stock Certificate (filed as Exhibit 4.1 to the Company’s Registration Statement on Form S-1 filed May 27, 1994 and incorporated herein by reference).
4.2 Certificate of Designation, Preference and Rights of Series A Preferred Stock (filed as Exhibit 4.2 to the Company’s
Registration Statement on Form S-1 filed May 23, 2002 and incorporated herein by reference).
10.1 Recapitalization Agreement, dated as of March 15, 2002, among Darling International Inc., each of the banks or other lending institutions which is a signatory thereto or any successor or assignee thereof, and Credit Lyonnais New York Branch, individually as a bank and as agent (filed as Annex C to the Company’s Definitive Proxy Statement filed on April 29, 2002, and incorporated herein by reference).
10.2 First Amendment to Recapitalization Agreement, dated as of April 1, 2002, among Darling International Inc., each of
the banks party to the Recapitalization Agreement, and Credit Lyonnais New York Branch, individually as a bank and as agent (filed as Annex D to the Company’s Definitive Proxy Statement filed on April 29, 2002, and incorporated herein by reference).
10.3 Second Amendment to Recapitalization Agreement, dated as of April 29, 2002, among Darling International Inc., each
of the banks party to the Recapitalization Agreement, and Credit Lyonnais New York Branch, individually as a bank and as agent (filed as Exhibit 10.3 to the Company’s Registration Statement on Form S-1 filed on May 23, 2002, and incorporated herein by reference).
10.4 Registration Rights Agreement, dated as of December 29, 1993, between Darling International Inc., and the signatory
holders identified therein (filed as Exhibit 10.3 to the Company’s Registration Statement on Form S-1 filed on May 27, 1994, and incorporated herein by reference).
10.5 Registration Rights Agreement, dated as of May 10, 2002, between Darling International Inc., and the holders
identified therein (filed as Exhibit 10.6 to the Company’s Registration Statement on Form S-1 filed on May 23, 2002, and incorporated herein by reference).
10.6 * Form of Indemnification Agreement (filed as Exhibit 10.7 to the Company’s Registration Statement on Form S-1 filed
on May 27, 1994, and incorporated herein by reference).
10.7 Credit Agreement, dated as of April 7, 2006, among Darling International Inc., various lending institutions party thereto and JPMorgan Chase Bank, N.A. (filed as Exhibit 10.1 to the Company’s Current Report on Form 8-K filed April 13, 2006 and incorporated herein by reference).
10.8 Second Amendment to Credit Agreement dated as of October 8, 2008, by and among Darling International Inc., as
borrower, various lending institutions party thereto and JPMorgan Chase Bank, N.A. (filed as Exhibit 10.1 to the Company’s Current Report on Form 8-K filed October 10, 2008 and incorporated herein by reference).
10.9 Third Amendment to Credit Agreement, dated as of September 30, 2009, by and among Darling International Inc., as
borrower, various lending institutions party thereto and JPMorgan Chase Bank, N.A. (filed as Exhibit 10.1 to the Company’s Current Report on Form 8-K filed October 2, 2009 and incorporated herein by reference).
Page 96

10.10 First Amendment to Note Purchase Agreement, dated as of April 7, 2006, among Darling International Inc. and the
securities purchasers party thereto (filed as Exhibit 10.2 to the Company’s Current Report on Form 8-K filed April 13, 2006 and incorporated herein by reference).
10.11 Leases, dated July 1, 1996, between the Company and the City and County of San Francisco (filed pursuant to
temporary hardship exemption under cover of Form SE).
10.12 Lease, dated November 24, 2003, between Darling International Inc. and the Port of Tacoma (filed as Exhibit 10.3 to the Company’s Annual Report on Form 10-K filed March 29, 2004, and incorporated herein by reference).
10.13 * 1994 Employee Flexible Stock Option Plan (filed as Exhibit 2 to the Company’s Revised Definitive Proxy Statement
filed on April 20, 2001, and incorporated herein by reference).
10.14 * Non-Employee Directors Stock Option Plan (filed as Exhibit 10.13 to the Company’s Registration Statement on Form S-1/A filed on June 5, 2002, and incorporated herein by reference).
10.15 * Darling International Inc. 2004 Omnibus Incentive Plan (filed as Exhibit 10.1 to the Company’s Current Report on
Form 8-K filed May 11, 2005, and incorporated herein by reference).
10.16* Amendment to Darling International Inc. 2004 Omnibus Incentive Plan (filed as Exhibit 10.1 to the Company’s Current Report on Form 8-K filed January 22, 2007 and incorporated herein by reference).
10.17 * Darling International Inc. Compensation Committee Long-Term Incentive Program Policy Statement (filed as Exhibit
10.1 to the Company’s Current Report on Form 8-K filed June 22, 2005, and incorporated herein by reference).
10.18 * Darling International Inc. Compensation Committee Executive Compensation Program Policy Statement adopted January 15, 2009 (filed as Exhibit 10.3 to the Company’s Current Report on Form 8-K filed January 21, 2009 and incorporated herein by reference).
10.19 * Darling International Inc. Compensation Committee Amended and Restated Executive Compensation Program Policy
Statement adopted January 8, 2010 (filed as Exhibit 10.1 to the Company’s Current Report on Form 8-K filed January 14, 2010 and incorporated herein by reference).
10.20* Integration Success Incentive Award Plan (filed as Exhibit 10.1 to the Company’s Current Report on Form 8-K filed
March 15, 2006 and incorporated herein by reference).
10.21* Non-Employee Director Restricted Stock Award Plan (filed as Exhibit 10.2 to the Company’s Current Report on Form 8-K filed March 15, 2006 and incorporated herein by reference).
10.22* Amendment No. 1 to Non-Employee Director Restricted Stock Award Plan, effective as of January 15, 2009 (filed as
Exhibit 10.4 to the Company’s Current Report on Form 8-K filed January 21, 2009 and incorporated herein by reference).
10.23* Notice of Amendment to Grants and Awards, dated as of October 10, 2006 (filed as Exhibit 10.1 to the Company’s
Current Report on Form 8-K filed October 10, 2006 and incorporated herein by reference).
10.24 * Amended and Restated Employment Agreement, dated as of January 1, 2009, between Darling International Inc. and Randall C. Stuewe (filed as Exhibit 10.1 to the Company’s Current Report on Form 8-K filed January 21, 2009, and incorporated herein by reference).
Page 97

10.25 * Form of Senior Executive Termination Benefits Agreement (filed as Exhibit 10.1 to the Company’s Current Report on
Form 8-K filed November 29, 2007 and incorporated herein by reference).
10.26 * Form of Addendum to Senior Executive Termination Benefits Agreement (filed as Exhibit 10.2 to the Company’s Current Report on Form 8-K filed December 12, 2008 and incorporated herein by reference).
10.27 * Amended and Restated Senior Executive Termination Benefits Agreement dated, as of January 15, 2009, between
Darling International Inc. and John O. Muse (filed as Exhibit 10.2 to the Company’s Current Report on Form 8-K filed January 21, 2009 and incorporated herein by reference).
10.28 * First Addendum to Amended and Restated Senior Executive Termination Benefits Agreement dated as of December 8,
2009 by and between Darling International Inc. and John O. Muse (filed as Exhibit 10.4 to the Company’s Current Report on Form 8-K filed December 14, 2009 and incorporated herein by reference).
10.29 * Separation and Consulting Agreement dated October 26, 2009, between Darling International Inc. and Mark A. Myers
(filed as Exhibit 10.1 to the Company’s Current Report on Form 8-K filed October 29, 2009 and incorporated herein by reference).
10.30* Form of Indemnification Agreement between Darling International Inc. and its directors and executive officers (filed
as Exhibit 10.1 to the Company’s Current Report on Form 8-K filed February 25, 2008, and incorporated herein by reference).
14 Darling International Inc. Code of Business Conduct applicable to all employees, including senior executive officers
(filed as Exhibit 14 to the Company’s Current Report on Form 8-K filed February 25, 2008, and incorporated herein by reference).
21 Subsidiaries of the Registrant (filed as Exhibit 21.1 to the Company’s Registration Statement on Form S-4 filed on
February 2, 2006, and incorporated herein by reference).
23 Consent of KPMG LLP (filed herewith).
31.1 Certification pursuant to Rule 13a-14(a) or Rule 15d-14(a) of the Securities Exchange Act of 1934, of Randall C. Stuewe, the Chief Executive Officer of the Company (filed herewith).
31.2 Certification pursuant to Rule 13a-14(a) or Rule 15d-14(a) of the Securities Exchange Act of 1934, of John O. Muse,
the Chief Financial Officer of the Company (filed herewith).
32 Written Statement of Chief Executive Officer and Chief Financial Officer furnished pursuant to Section 906 of the Sarbanes-Oxley Act of 2002 (18 U.S.C. Section 1350) (filed herewith).
The Exhibits are available upon request from the Company.
* Management contract or compensatory plan or arrangement.
Page 98

SIGNATURES
Pursuant to the requirements of Section 13 or 15(d) of the Securities Act of 1934, the Registrant has duly caused this report to be signed on its behalf by the undersigned, thereunto duly authorized.
DARLING INTERNATIONAL INC.
Pursuant to the requirements of the Securities Exchange Act of 1934, this report has been signed below by the following persons on behalf of the registrant and in the capacities and on the dates indicated.
By: /s/ Randall C. Stuewe Randall C. Stuewe
Chairman of the Board and
Chief Executive Officer
Date: March 3 , 2010
SIGNATURE TITLE DATE
/ s / Randall C. Stuewe Chairman of the Board and March 3 , 2010 Randall C. Stuewe Chief Executive Officer
(Principal Executive Officer)
/ s / John O. Muse Executive Vice President - March 3 , 2010
John O. Muse Finance and Administration (Principal Financial and Accounting Officer)
/ s / O. Thomas Albrecht Director March 3 , 2010
O. Thomas Albrecht
/ s / C. Dean Carlson
Director March 3 , 2010
C, Dean Carlson
/ s / Marlyn Jorgensen Director March 3 , 2010
Marlyn Jorgensen
/ s / Charles Macaluso Director March 3 , 2010
Charles Macaluso
/ s / John D. March Director March 3 , 2010
John D. March
/ s / Michael Urbut Director March 3 , 2010

Michael Urbut
Page 99

INDEX TO EXHIBITS
3.1 Restated Certificate of Incorporation of the Company, as amended (filed as Exhibit 3.1 to the Company’s Registration Statement on Form S-1 filed May 23, 2002 and incorporated herein by reference).
3.2 Amended and Restated Bylaws of the Company (filed as Exhibit 3.1 to the Company’s Current Report on Form 8-K filed
December 12, 2008 and incorporated herein by reference).
4.1 Specimen Common Stock Certificate (filed as Exhibit 4.1 to the Company’s Registration Statement on Form S-1 filed May 27, 1994 and incorporated herein by reference).
4.2 Certificate of Designation, Preference and Rights of Series A Preferred Stock (filed as Exhibit 4.2 to the Company’s
Registration Statement on Form S-1 filed May 23, 2002 and incorporated herein by reference).
10.1 Recapitalization Agreement, dated as of March 15, 2002, among Darling International Inc., each of the banks or other lending institutions which is a signatory thereto or any successor or assignee thereof, and Credit Lyonnais New York Branch, individually as a bank and as agent (filed as Annex C to the Company’s Definitive Proxy Statement filed on April 29, 2002, and incorporated herein by reference).
10.2 First Amendment to Recapitalization Agreement, dated as of April 1, 2002, among Darling International Inc., each of the banks
party to the Recapitalization Agreement, and Credit Lyonnais New York Branch, individually as a bank and as agent (filed as Annex D to the Company’s Definitive Proxy Statement filed on April 29, 2002, and incorporated herein by reference).
10.3 Second Amendment to Recapitalization Agreement, dated as of April 29, 2002, among Darling International Inc., each of the
banks party to the Recapitalization Agreement, and Credit Lyonnais New York Branch, individually as a bank and as agent (filed as Exhibit 10.3 to the Company’s Registration Statement on Form S-1 filed on May 23, 2002, and incorporated herein by reference).
10.4 Registration Rights Agreement, dated as of December 29, 1993, between Darling International Inc., and the signatory holders
identified therein (filed as Exhibit 10.3 to the Company’s Registration Statement on Form S-1 filed on May 27, 1994, and incorporated herein by reference).
10.5 Registration Rights Agreement, dated as of May 10, 2002, between Darling International Inc., and the holders identified therein
(filed as Exhibit 10.6 to the Company’s Registration Statement on Form S-1 filed on May 23, 2002, and incorporated herein by reference).
10.6 * Form of Indemnification Agreement (filed as Exhibit 10.7 to the Company’s Registration Statement on Form S-1 filed on May
27, 1994, and incorporated herein by reference).
10.7 Credit Agreement, dated as of April 7, 2006, among Darling International Inc., various lending institutions party thereto and JPMorgan Chase Bank, N.A. (filed as Exhibit 10.1 to the Company’s Current Report on Form 8-K filed April 13, 2006 and incorporated herein by reference).
10.8 Second Amendment to Credit Agreement dated as of October 8, 2008, by and among Darling International Inc., as borrower,
various lending institutions party thereto and JPMorgan Chase Bank, N.A. (filed as Exhibit 10.1 to the Company’s Current Report on Form 8-K filed October 10, 2008 and incorporated herein by reference).
10.9 Third Amendment to Credit Agreement, dated as of September 30, 2009, by and among Darling International Inc., as borrower,
various lending institutions party thereto and JPMorgan Chase Bank, N.A. (filed as Exhibit 10.1 to the Company’s Current Report on Form 8-K filed October 2, 2009 and incorporated herein by reference).
10.10 First Amendment to Note Purchase Agreement, dated as of April 7, 2006, among Darling International Inc. and the securities
purchasers party thereto (filed as Exhibit 10.2 to the Company’s Current Report on Form 8-K filed April 13, 2006 and incorporated herein by reference).
Page 100

10.11 Leases, dated July 1, 1996, between the Company and the City and County of San Francisco (filed pursuant to temporary
hardship exemption under cover of Form SE).
10.12 Lease, dated November 24, 2003, between Darling International Inc. and the Port of Tacoma (filed as Exhibit 10.3 to the Company’s Annual Report on Form 10-K filed March 29, 2004, and incorporated herein by reference).
10.13 * 1994 Employee Flexible Stock Option Plan (filed as Exhibit 2 to the Company’s Revised Definitive Proxy Statement filed on
April 20, 2001, and incorporated herein by reference).
10.14 * Non-Employee Directors Stock Option Plan (filed as Exhibit 10.13 to the Company’s Registration Statement on Form S-1/A filed on June 5, 2002, and incorporated herein by reference).
10.15 * Darling International Inc. 2004 Omnibus Incentive Plan (filed as Exhibit 10.1 to the Company’s Current Report on Form 8-K
filed May 11, 2005, and incorporated herein by reference).
10.16 * Amendment to Darling International Inc. 2004 Omnibus Incentive Plan (filed as Exhibit 10.1 to the Company’s Current Report on Form 8-K filed January 22, 2007 and incorporated herein by reference).
10.17 * Darling International Inc. Compensation Committee Long-Term Incentive Program Policy Statement (filed as Exhibit 10.1 to
the Company’s Current Report on Form 8-K filed June 22, 2005, and incorporated herein by reference).
10.18 * Darling International Inc. Compensation Committee Executive Compensation Program Policy Statement adopted January 15, 2009 (filed as Exhibit 10.3 to the Company’s Current Report on Form 8-K filed January 21, 2009 and incorporated herein by reference).
10.19 * Darling International Inc. Compensation Committee Amended and Restated Executive Compensation Program Policy
Statement adopted January 8, 2010 (filed as Exhibit 10.1 to the Company’s Current Report on Form 8-K filed January 14, 2010 and incorporated herein by reference).
10.20 * Integration Success Incentive Award Plan (filed as Exhibit 10.1 to the Company’s Current Report on Form 8-K filed March 15,
2006 and incorporated herein by reference).
10.21 * Non-Employee Director Restricted Stock Award Plan (filed as Exhibit 10.2 to the Company’s Current Report on Form 8-K filed March 15, 2006 and incorporated herein by reference).
10.22 * Amendment No. 1 to Non-Employee Director Restricted Stock Award Plan, effective as of January 15, 2009 (filed as Exhibit
10.4 to the Company’s Current Report on Form 8-K filed January 21, 2009 and incorporated herein by reference).
10.23 * Notice of Amendment to Grants and Awards, dated as of October 10, 2006 (filed as Exhibit 10.1 to the Company’s Current Report on Form 8-K filed October 10, 2006 and incorporated herein by reference).
10.24 * Amended and Restated Employment Agreement, dated as of January 1, 2009, between Darling International Inc. and Randall
C. Stuewe (filed as Exhibit 10.1 to the Company’s Current Report on Form 8-K filed January 21, 2009, and incorporated herein by reference).
10.25 * Form of Senior Executive Termination Benefits Agreement (filed as Exhibit 10.1 to the Company’s Current Report on Form 8-
K filed November 29, 2007 and incorporated herein by reference).
10.26 * Form of Addendum to Senior Executive Termination Benefits Agreement (filed as Exhibit 10.2 to the Company’s Current Report on Form 8-K filed December 12, 2008 and incorporated herein by reference).
Page 101

10.27 * Amended and Restated Senior Executive Termination Benefits Agreement dated, as of January 15, 2009, between Darling
International Inc. and John O. Muse(filed as Exhibit 10.2 to the Company’s Current Report on Form 8-K filed January 21, 2009 and incorporated herein by reference).
10.28 * First Addendum to Amended and Restated Senior Executive Termination Benefits Agreement dated as of December 8, 2009 by
and between Darling International Inc. and John O. Muse (filed as Exhibit 10.4 to the Company’s Current Report on Form 8-K filed December 14, 2009 and incorporated herein by reference).
10.29 * Separation and Consulting Agreement dated October 26, 2009, between Darling International Inc. and Mark A. Myers (filed as
Exhibit 10.1 to the Company’s Current Report on Form 8-K filed October 29, 2009 and incorporated herein by reference).
10.30 * Form of Indemnification Agreement between Darling International Inc. and its directors and executive officers (filed as Exhibit 10.1 to the Company’s Current Report on Form 8-K filed February 25, 2008, and incorporated herein by reference).
14 Darling International Inc. Code of Business Conduct applicable to all employees, including senior executive officers (filed as Exhibit 14 to the Company’s Current Report on Form 8-K filed February 25, 2008, and incorporated herein by reference).
21 Subsidiaries of the Registrant (filed as Exhibit 21.1 to the Company’s Registration Statement on Form S-4 filed on February 2,
2006, and incorporated herein by reference).
23 Consent of KPMG LLP (filed herewith).
31.1 Certification pursuant to Rule 13a-14(a) or Rule 15d-14(a) of the Securities Exchange Act of 1934, of Randall C. Stuewe, the Chief Executive Officer of the Company (filed herewith).
31.2 Certification pursuant to Rule 13a-14(a) or Rule 15d-14(a) of the Securities Exchange Act of 1934, of John O. Muse, the Chief
Financial Officer of the Company (filed herewith).
32 Written Statement of Chief Executive Officer and Chief Financial Officer furnished pursuant to Section 906 of the Sarbanes-Oxley Act of 2002 (18 U.S.C. Section 1350) (filed herewith).
* Management contract or compensatory plan or arrangement.
Page 102


EXHIBIT 23
Consent of Independent Registered Public Accounting Firm
The Board of Directors Darling International Inc.: We consent to the incorporation by reference in the registration statements on Form S-4 (No. 333-131484) and Form S-8 (Nos. 333-125875, 33-99868 and 33-99866) of Darling International Inc. of our reports dated March 3, 2010, with respect to the consolidated balance sheets of Darling International Inc. as of January 2, 2010 and January 3, 2009, and the related consolidated statements of operations, stockholders’ equity and comprehensive income (loss) and cash flows for each of the years in the three-year period ended January 2, 2010, and the related financial statement schedule, and the effectiveness of internal control over financial reporting as of January 2, 2010, which reports appear in the January 2, 2010 annual report on Form 10-K of Darling International Inc.
(signed) KPMG LLP Dallas, Texas March 3, 2010


EXHIBIT 31.1
CERTIFICATION I, Randall C. Stuewe, certify that:
1. I have reviewed this annual report on Form 10-K of Darling International Inc.;
2. Based on my knowledge, this report does not contain any untrue statement of a material fact or omit to state a material fact necessary to make the statements made, in light of the circumstances under which such statements were made, not misleading with respect to the period covered by this report;
3. Based on my knowledge, the financial statements, and other financial information included in this report, fairly present in all material respects the financial condition, results of operations and cash flows of the registrant as of, and for, the periods presented in this report;
4. The registrant's other certifying officer(s) and I are responsible for establishing and maintaining disclosure controls and procedures (as defined in Exchange Act Rules 13a-15(e) and 15d-15(e)) and internal control over financial reporting (as defined in Exchange Act Rules 13a-15(f) and 15d-15(f)) for the registrant and have:
(a) Designed such disclosure controls and procedures, or caused such disclosure controls and procedures to be designed under our supervision, to ensure that material information relating to the registrant, including its consolidated subsidiaries, is made known to us by others within those entities, particularly during the period in which this report is being prepared;
(b) Designed such internal control over financial reporting, or caused such internal control over financial reporting to be designed under our supervision, to provide reasonable assurance regarding the reliability of financial reporting and the preparation of financial statements for external purposes in accordance with generally accepted accounting principles;
(c) Evaluated the effectiveness of the registrant's disclosure controls and procedures and presented in this report our conclusions about the effectiveness of the disclosure controls and procedures, as of the end of the period covered by this report based on such evaluation; and
(d) Disclosed in this report any change in the registrant's internal control over financial reporting that occurred during the registrant's most recent fiscal quarter (the registrant's fourth fiscal quarter in the case of an annual report) that has materially affected, or is reasonably likely to materially affect, the registrant's internal control over financial reporting; and
5. The registrant's other certifying officer(s) and I have disclosed, based on our most recent evaluation of internal control over financial reporting, to the registrant's auditors and the audit committee of the registrant's board of directors (or persons performing the equivalent functions):
(a) All significant deficiencies and material weaknesses in the design or operation of internal control over financial reporting
which are reasonably likely to adversely affect the registrant's ability to record, process, summarize and report financial information; and
(b) Any fraud, whether or not material, that involves management or other employees who have a significant role in the registrant's internal control over financial reporting.
Date: March 3, 2010 /s/ Randall C. Stuewe Randall C. Stuewe Chief Executive Officer


EXHIBIT 31.2
CERTIFICATION
I, John O. Muse, certify that:
1. I have reviewed this annual report on Form 10-K of Darling International Inc.;
2. Based on my knowledge, this report does not contain any untrue statement of a material fact or omit to state a material fact necessary to make the statements made, in light of the circumstances under which such statements were made, not misleading with respect to the period covered by this report;
3. Based on my knowledge, the financial statements, and other financial information included in this report, fairly present in all material respects the financial condition, results of operations and cash flows of the registrant as of, and for, the periods presented in this report;
4. The registrant's other certifying officer(s) and I are responsible for establishing and maintaining disclosure controls and procedures (as defined in Exchange Act Rules 13a-15(e) and 15d-15(e)) and internal control over financial reporting (as defined in Exchange Act Rules 13a-15(f) and 15d-15(f)) for the registrant and have:
(a) Designed such disclosure controls and procedures, or caused such disclosure controls and procedures to be designed under our supervision, to ensure that material information relating to the registrant, including its consolidated subsidiaries, is made known to us by others within those entities, particularly during the period in which this report is being prepared;
(b) Designed such internal control over financial reporting, or caused such internal control over financial reporting to be designed under our supervision, to provide reasonable assurance regarding the reliability of financial reporting and the preparation of financial statements for external purposes in accordance with generally accepted accounting principles;
(c) Evaluated the effectiveness of the registrant's disclosure controls and procedures and presented in this report our conclusions about the effectiveness of the disclosure controls and procedures, as of the end of the period covered by this report based on such evaluation; and
(d) Disclosed in this report any change in the registrant's internal control over financial reporting that occurred during the registrant's most recent fiscal quarter (the registrant's fourth fiscal quarter in the case of an annual report) that has materially affected, or is reasonably likely to materially affect, the registrant's internal control over financial reporting; and
5. The registrant's other certifying officer(s) and I have disclosed, based on our most recent evaluation of internal control over financial reporting, to the registrant's auditors and the audit committee of the registrant's board of directors (or persons performing the equivalent functions):
(a) All significant deficiencies and material weaknesses in the design or operation of internal control over financial reporting
which are reasonably likely to adversely affect the registrant's ability to record, process, summarize and report financial information; and
(b) Any fraud, whether or not material, that involves management or other employees who have a significant role in the registrant's internal control over financial reporting.
Date: March 3, 2010 /s/ John O. Muse
John O. Muse Chief Financial Officer


EXHIBIT 32
CERTIFICATION PURSUANT TO
18 U.S.C. SECTION 1350,
AS ADOPTED PURSUANT TO
SECTION 906 OF THE SARBANES-OXLEY ACT OF 2002 In connection with the Annual Report of Darling International Inc. (the “Company”) on Form 10-K for the period ending January 2, 2010 as filed with the Securities and Exchange Commission on the date hereof (the “Report”), the undersigned, Randall C. Stuewe, Chief Executive Officer of the Company and John O. Muse, Chief Financial Officer of the Company, each hereby certifies, pursuant to 18 U.S.C. §1350, as adopted pursuant to §906 of the Sarbanes-Oxley Act of 2002 (the “Act”), that: 1. The Report fully complies with the requirements of Section 13(a) or 15(d) of the Securities Exchange Act of 1934; and 2. The information contained in the Report fairly presents, in all material respects, the financial condition and results of operations of the Company. This certification is being furnished solely for purposes of compliance with the Act.
/s/ Randall C. Stuewe /s/ John O. Muse Randall C. Stuewe John O. Muse Chief Executive Officer Chief Financial Officer Date: March 3, 2010 Date: March 3, 2010


![Pfizer Inc. 2006 Financial Report - AnnualReports.co.uk€¦ · Pfizer Inc. 2006 Financial Report [This Page Intentionally Left Blank] Introduction Our Financial Review is provided](https://static.fdocuments.net/doc/165x107/5fc1aa9f3f796629567527cb/pfizer-inc-2006-financial-report-pfizer-inc-2006-financial-report-this-page.jpg)

