
Darker shades of red are population growth; darker shades ... · Darker shades of red are...
26
1
Transcript of Darker shades of red are population growth; darker shades ... · Darker shades of red are...

1
2
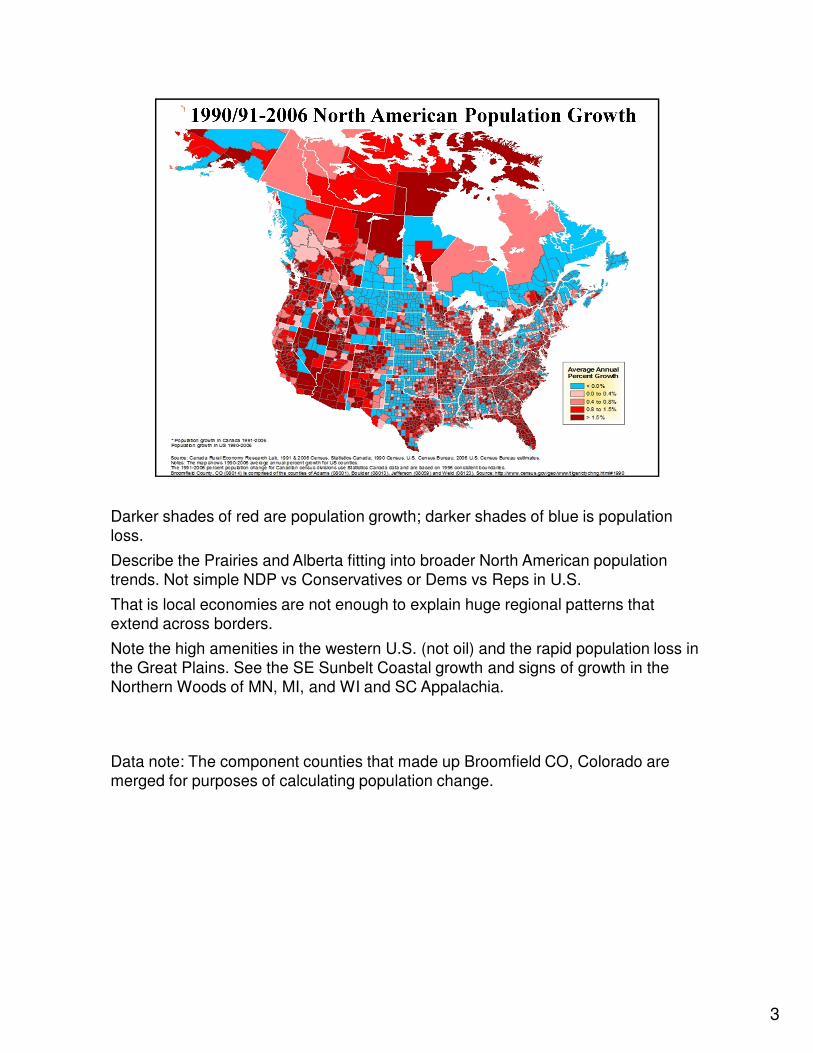
Darker shades of red are population growth; darker shades of blue is population
loss.
Describe the Prairies and Alberta fitting into broader North American population
trends. Not simple NDP vs Conservatives or Dems vs Reps in U.S.
That is local economies are not enough to explain huge regional patterns that
extend across borders.
Note the high amenities in the western U.S. (not oil) and the rapid population loss in
the Great Plains. See the SE Sunbelt Coastal growth and signs of growth in the
Northern Woods of MN, MI, and WI and SC Appalachia.
Data note: The component counties that made up Broomfield CO, Colorado are
merged for purposes of calculating population change.
3
Partridge, Mark D. and Dan S. Rickman. “The Waxing and Waning of U.S. Regional Economies: The Chicken-Egg of Jobs Versus People.” Journal of Regional Economies: The Chicken-Egg of Jobs Versus People.” Journal of Urban Economics 53 (January 2003): 76-97.
Deller, S.C., T. Tsung-Hsiu, D.W. Marcouiller, and D.B.K. English. 2001. The Role of Amenities and Quality of Life in Rural Economic Growth. American Journal of Agricultural Economics. 83(2): 352-365.
Kim, Kwang-Koo, D.W. Marcouiller, and S.C. Deller. 2005. Natural Amenities and Rural Development: Understanding Spatial and Distributional Attributes. Growth and Change. 36: 273-297.
Florida, Richard. 2004. The Rise of the Creative Class: And How It's
Transforming Work, Leisure, Community and Everyday Life. Basic: New York.
Glaeser, Edward L, J. Kolko and A. Saiz A. 2001. Consumer City. Journal of
Economic Geography 1: 27-50.
Adamson, Dwight, David Clark and Mark D. Partridge, 2004. “Do Urban Agglomeration Economies and Amenities Have a Skill Bias?” Journal of Regional Science 44(2): 201-224.
Ferguson, Mark, Kamar Ali, M. Rose Olfert, Mark D. Partridge. “Voting with their Feet: Jobs Versus Amenities.” Growth and Change 38 (Winter 2007, 1): 77-110.
4
Graves, P.E. and P.D. Linneman. 1979. Household Migration: Theoretical and
Empirical Results. Journal of Urban Economics. 6(3): 383-404.
Roback, J. 1982. Wages, Rents, and the Quality of Life. The Journal of Political
Economy. 90(6): 1257-1278.
5

Gabriel, SA; Joe P. Mattey; William Washer. “Compensating Differentials and Evolution in the Quality of Life among U.S. States.” Regional Science and Evolution in the Quality of Life among U.S. States.” Regional Science and Urban Economics. 2003 (33): 619-649.
6
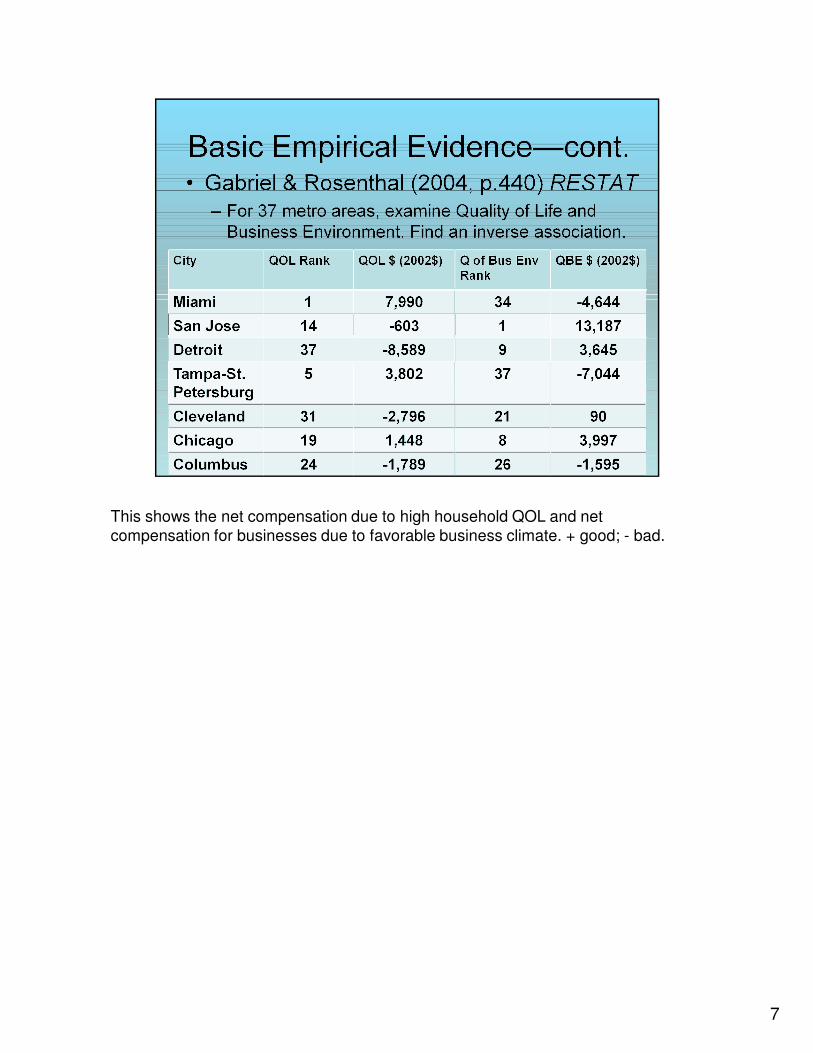
This shows the net compensation due to high household QOL and net
compensation for businesses due to favorable business climate. + good; - bad.
7
Schmidt, Lucie and Paul N. Courant. 2006. “Sometimes Close is Good Enough: The Value of Nearby Environmental Amenities.” Journal of Regional Enough: The Value of Nearby Environmental Amenities.” Journal of Regional Science. (46): 931-951.
8
Rappaport, Jordan. 2007. “Moving to Nice Weather.” Regional Science and
Urban Economics. (37), pp. 375-398.Urban Economics. (37), pp. 375-398.
McGranahan, David. 1999. “Natural Amenities Drive Rural Population Change.” ERS, USDA, Washington, DC, AER 781.
McGranahan, David. 2007. “Landscape Influence on Recent Rural Migration in the U.S.” Landscape and Urban Planning (85): 228-240.
9
Ferguson, Mark, Kamar Ali, M. Rose Olfert, Mark D. Partridge. “Voting with their Feet: Jobs Versus Amenities.” Growth and Change 38 (Winter 2007, 1): their Feet: Jobs Versus Amenities.” Growth and Change 38 (Winter 2007, 1): 77-110.
Cheshire, Paul and Stefano Magrini. (2006). “Population Growth in European Cities: Weather Matters — But only Nationally.” Regional Studies. (40), 23-37.
10
11
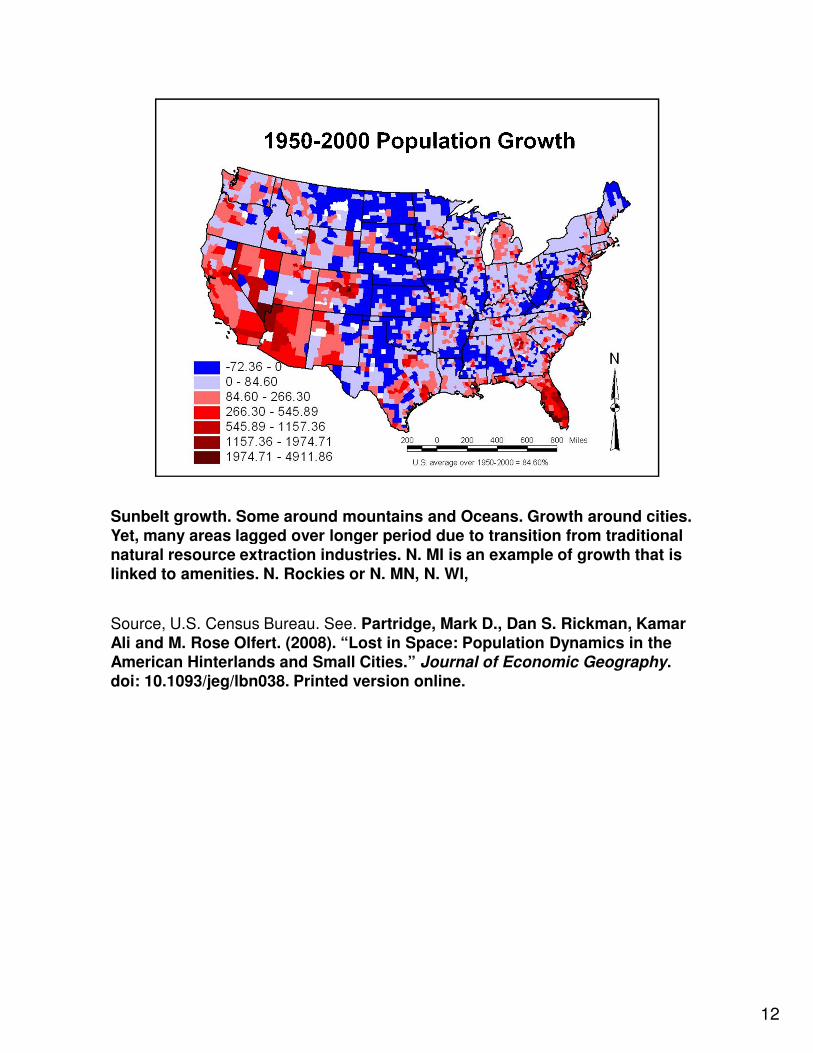
Sunbelt growth. Some around mountains and Oceans. Growth around cities. Yet, many areas lagged over longer period due to transition from traditional Yet, many areas lagged over longer period due to transition from traditional natural resource extraction industries. N. MI is an example of growth that is linked to amenities. N. Rockies or N. MN, N. WI,
Source, U.S. Census Bureau. See. Partridge, Mark D., Dan S. Rickman, Kamar Ali and M. Rose Olfert. (2008). “Lost in Space: Population Dynamics in the American Hinterlands and Small Cities.” Journal of Economic Geography. doi: 10.1093/jeg/lbn038. Printed version online.
12
For the underlying regression model: See Partridge, Mark D., Dan S. Rickman, Kamar Ali and M. Rose Olfert. (2008). “Lost in Space: Population Dynamics in Kamar Ali and M. Rose Olfert. (2008). “Lost in Space: Population Dynamics in the American Hinterlands and Small Cities.” Journal of Economic Geography. doi: 10.1093/jeg/lbn038. Printed version online.
13
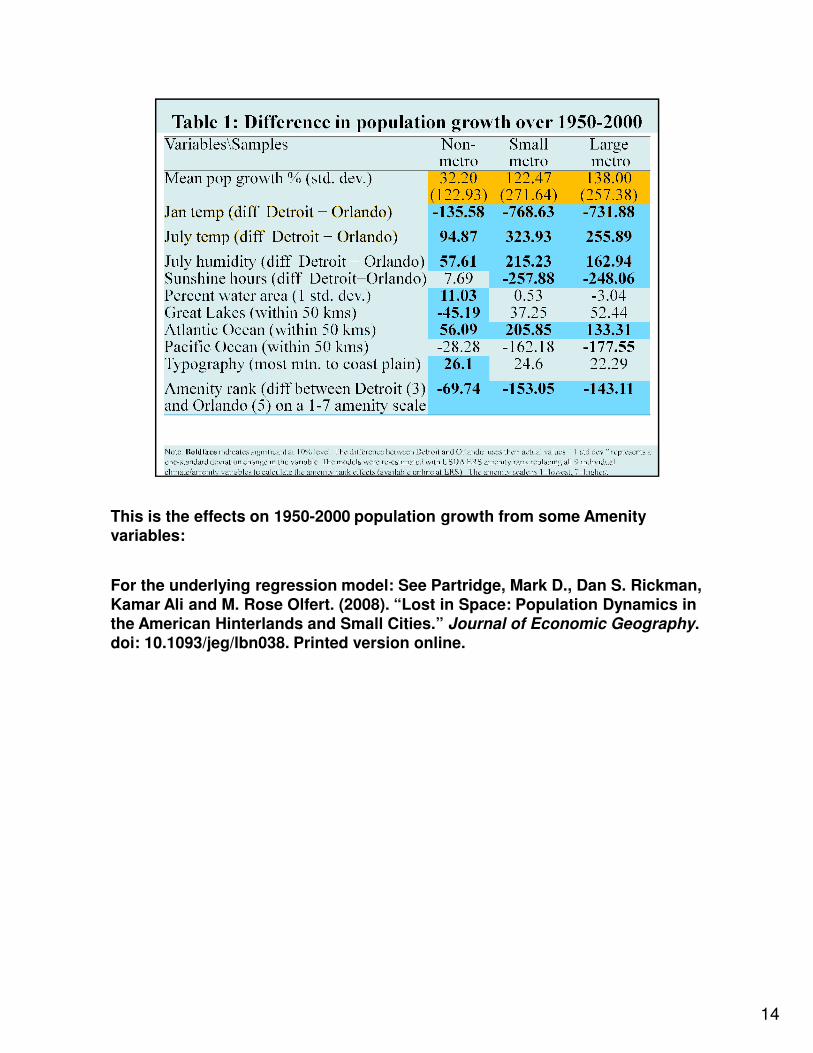
This is the effects on 1950-2000 population growth from some Amenity variables:variables:
For the underlying regression model: See Partridge, Mark D., Dan S. Rickman, Kamar Ali and M. Rose Olfert. (2008). “Lost in Space: Population Dynamics in the American Hinterlands and Small Cities.” Journal of Economic Geography. doi: 10.1093/jeg/lbn038. Printed version online.
14
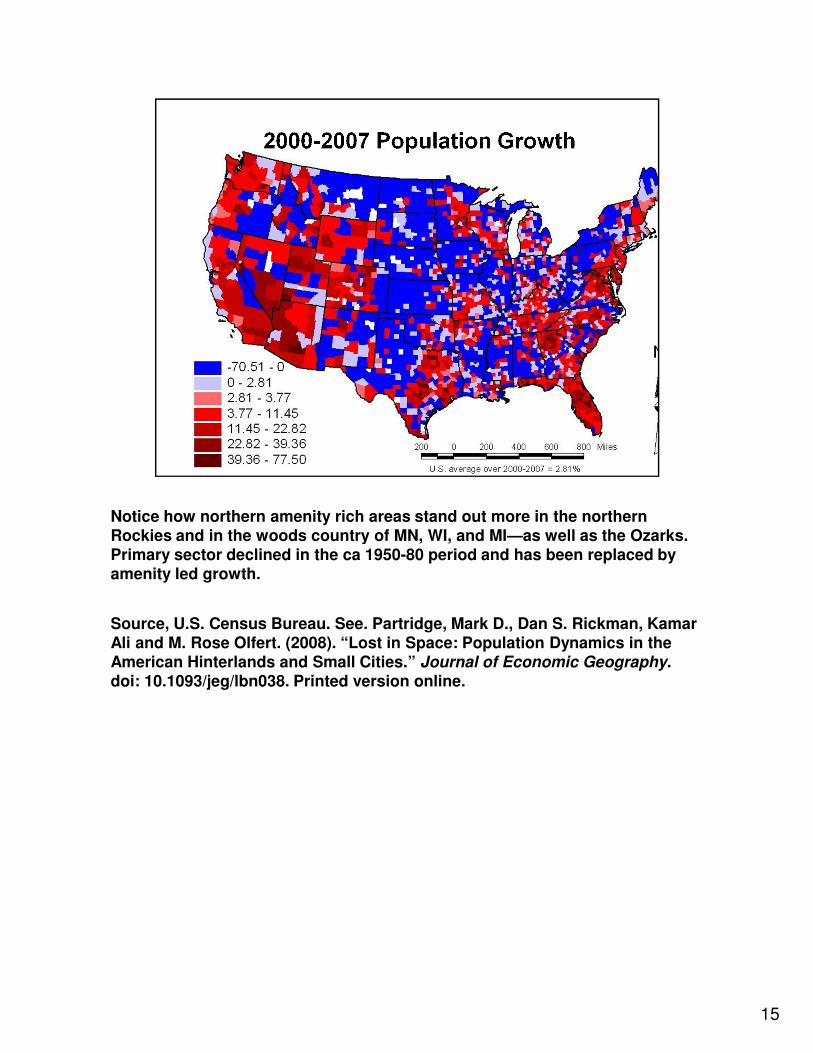
Notice how northern amenity rich areas stand out more in the northern Rockies and in the woods country of MN, WI, and MI—as well as the Ozarks. Rockies and in the woods country of MN, WI, and MI—as well as the Ozarks. Primary sector declined in the ca 1950-80 period and has been replaced by amenity led growth.
Source, U.S. Census Bureau. See. Partridge, Mark D., Dan S. Rickman, Kamar Ali and M. Rose Olfert. (2008). “Lost in Space: Population Dynamics in the American Hinterlands and Small Cities.” Journal of Economic Geography. doi: 10.1093/jeg/lbn038. Printed version online.
15
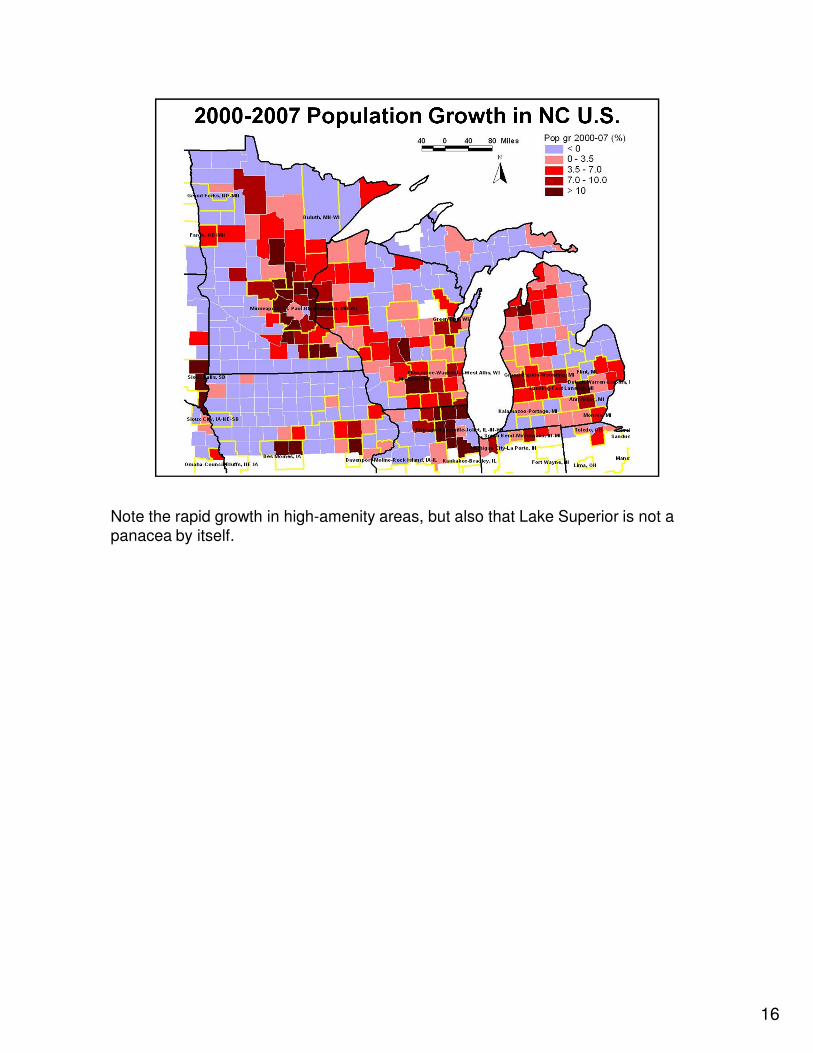
Note the rapid growth in high-amenity areas, but also that Lake Superior is not a
panacea by itself.
16
Partridge, Mark D., Dan S. Rickman, Kamar Ali and M. Rose Olfert. “The Geographic Diversity of U.S. Nonmetropolitan Growth Dynamics: A Geographic Diversity of U.S. Nonmetropolitan Growth Dynamics: A Geographically Weighted Regression Approach.” Land Economics, 84 (May 2008,2): 241-266.
17
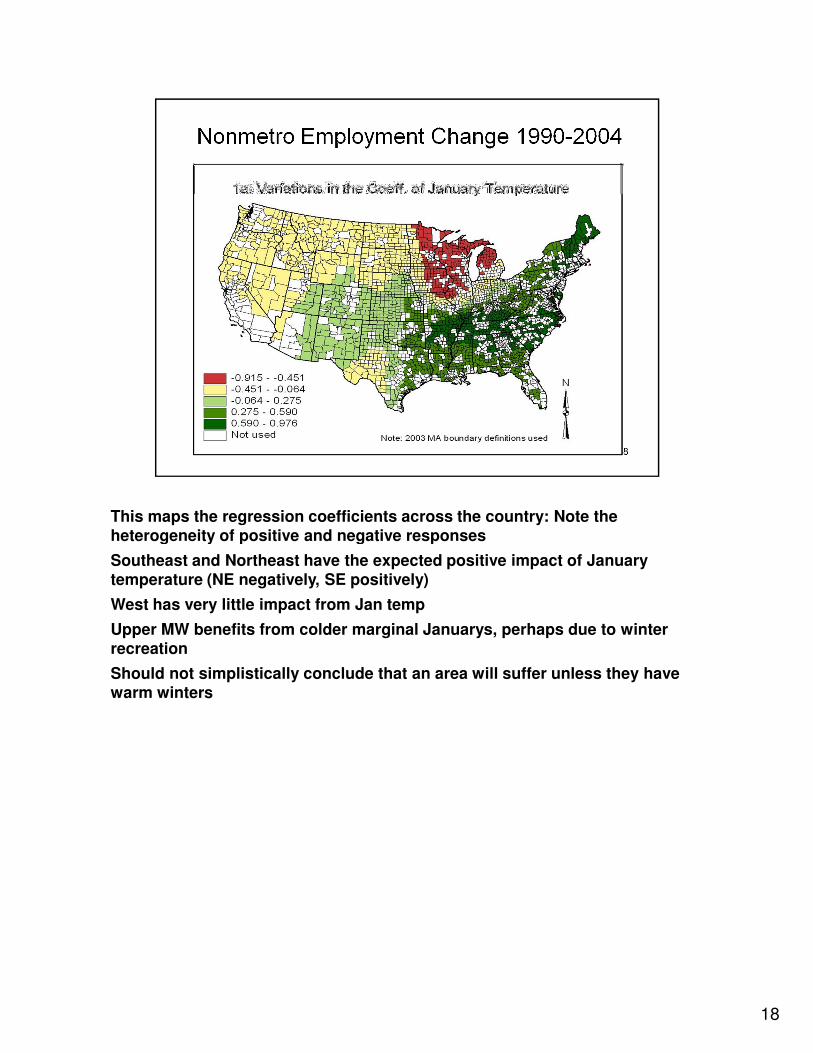
This maps the regression coefficients across the country: Note the heterogeneity of positive and negative responsesheterogeneity of positive and negative responses
Southeast and Northeast have the expected positive impact of January temperature (NE negatively, SE positively)
West has very little impact from Jan temp
Upper MW benefits from colder marginal Januarys, perhaps due to winter recreation
Should not simplistically conclude that an area will suffer unless they have warm winters
18
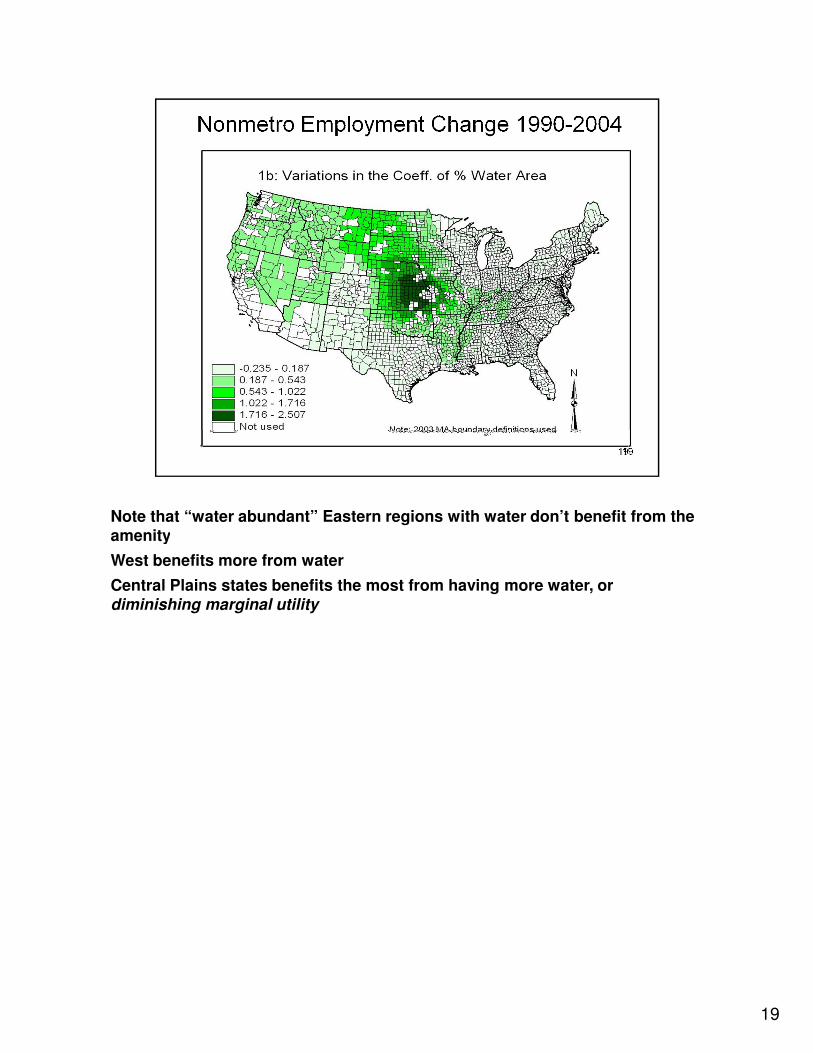
Note that “water abundant” Eastern regions with water don’t benefit from the amenityamenity
West benefits more from water
Central Plains states benefits the most from having more water, or diminishing marginal utility
19
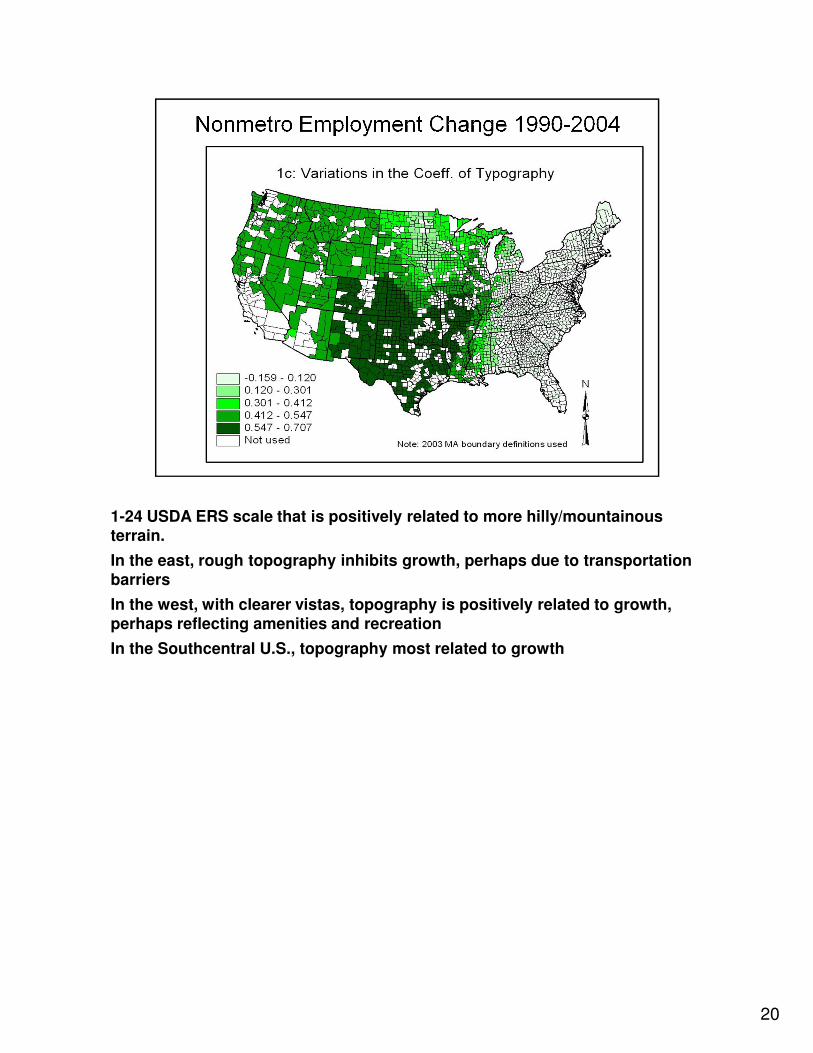
1-24 USDA ERS scale that is positively related to more hilly/mountainous terrain.terrain.
In the east, rough topography inhibits growth, perhaps due to transportation barriers
In the west, with clearer vistas, topography is positively related to growth, perhaps reflecting amenities and recreation
In the Southcentral U.S., topography most related to growth
20
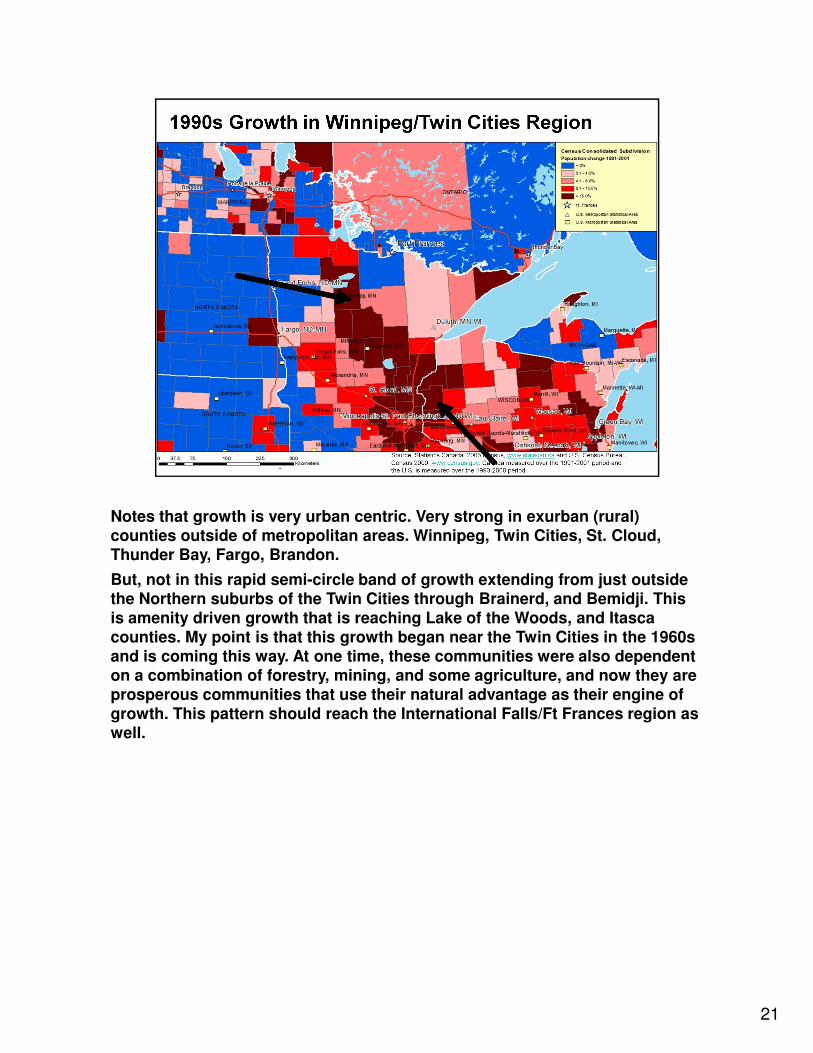
Notes that growth is very urban centric. Very strong in exurban (rural) counties outside of metropolitan areas. Winnipeg, Twin Cities, St. Cloud, counties outside of metropolitan areas. Winnipeg, Twin Cities, St. Cloud, Thunder Bay, Fargo, Brandon.
But, not in this rapid semi-circle band of growth extending from just outside the Northern suburbs of the Twin Cities through Brainerd, and Bemidji. This is amenity driven growth that is reaching Lake of the Woods, and Itasca counties. My point is that this growth began near the Twin Cities in the 1960s and is coming this way. At one time, these communities were also dependent on a combination of forestry, mining, and some agriculture, and now they are prosperous communities that use their natural advantage as their engine of growth. This pattern should reach the International Falls/Ft Frances region as well.
21
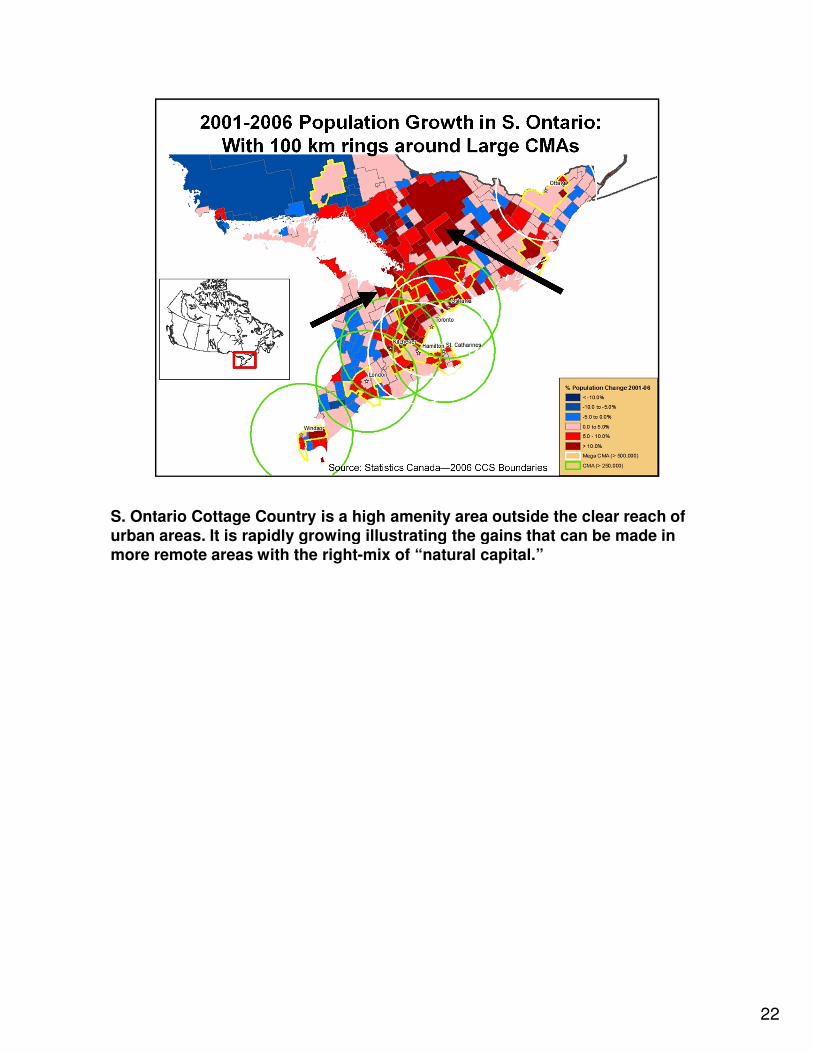
S. Ontario Cottage Country is a high amenity area outside the clear reach of urban areas. It is rapidly growing illustrating the gains that can be made in urban areas. It is rapidly growing illustrating the gains that can be made in more remote areas with the right-mix of “natural capital.”
22
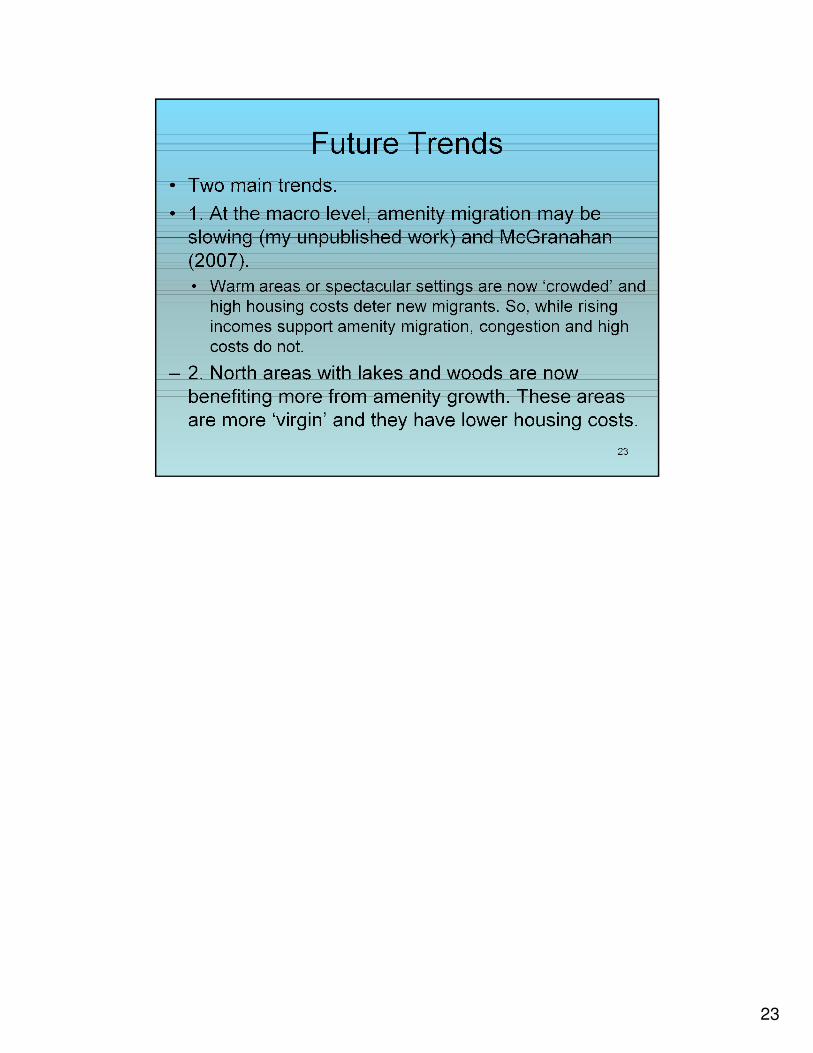
23
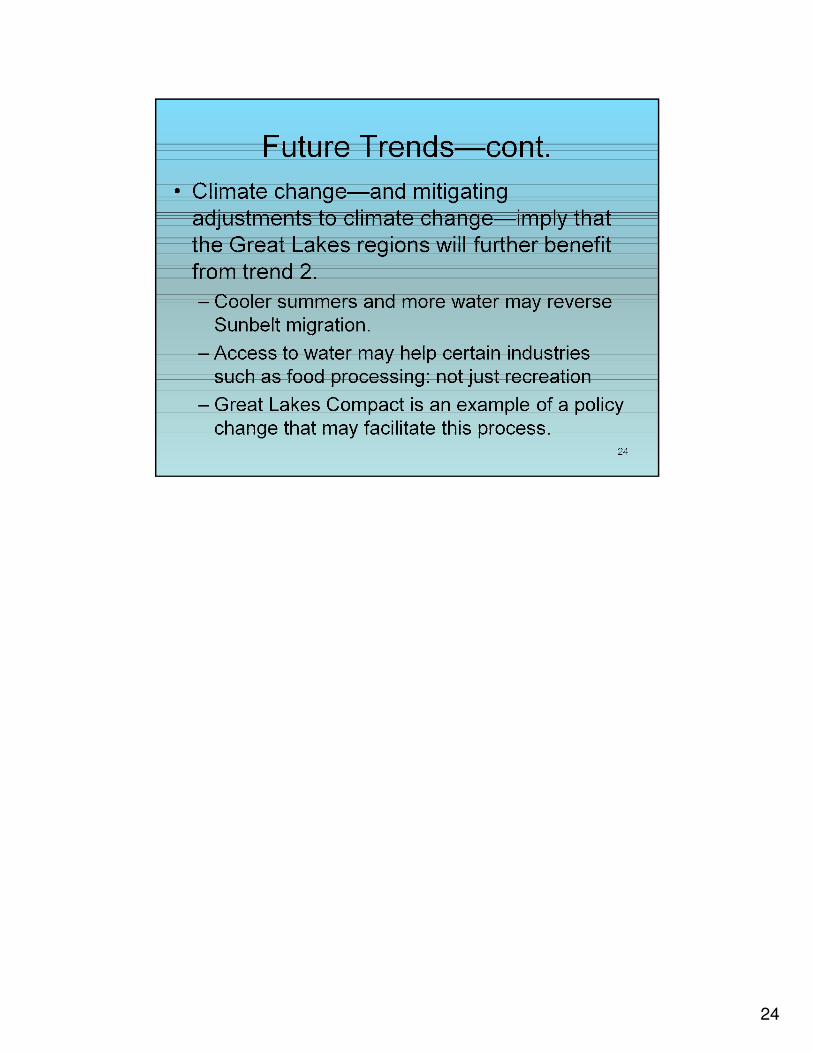
24
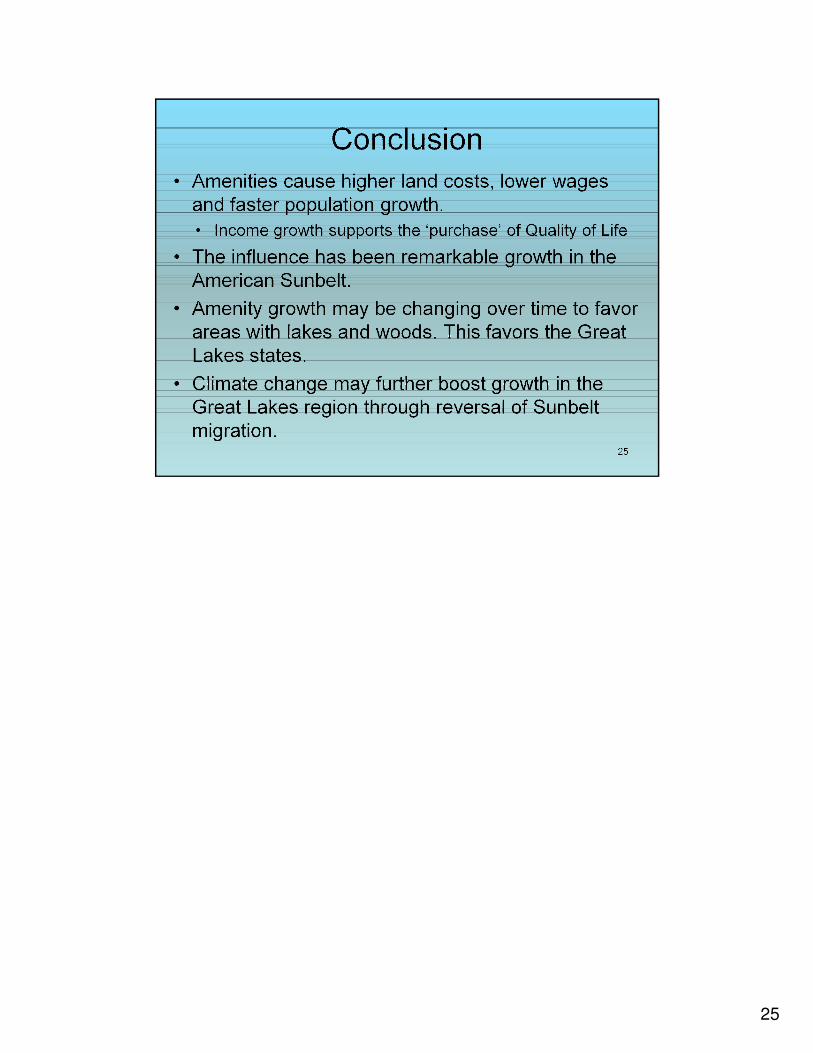
25

26


![arXiv:1808.07413v3 [cs.CV] 9 Oct 2019different shades of red while the dominant color of the ground becomes much darker and texture details get lost. Unlike recent image synthesis](https://static.fdocuments.net/doc/165x107/5fd2138c5ae4756ef02ef101/arxiv180807413v3-cscv-9-oct-2019-different-shades-of-red-while-the-dominant.jpg)

