Danske Hypotek AB investor presentation Hypotek AB –investor presentation March 2017 1 Danske...
46
Danske Hypotek AB – investor presentation March 2017
Transcript of Danske Hypotek AB investor presentation Hypotek AB –investor presentation March 2017 1 Danske...

Danske Hypotek AB – investor presentation
March 2017

11
Danske Hypotek Q1 2017
Agenda
Danske Bank Group
Danske Hypotek – Structure and roadmap
Danske Hypotek – Availability of assets for future Cover pool
1
3
4
5 Danske Hypotek - Funding
Appendix6
2 Danske Bank - Personal Banking SE

Danske Bank Group

33
Danske Hypotek Q1 2017
Overview: Danske Bank has a strong Nordic franchise
1 .Excluding agricultural centres in Denmark * Total lending before loan impairment charges. Lending by country excludes Corporates & Institutions and Wealth Management, however most of these are Nordic clients.
Danske Bank lending breakdown*
For divestment
Non-core (Ireland & Conduits)
Personal banking activities in Estonia
Facts
3.4 million customers
272 branches1
15 countries
19,303 full-time employees
Business Units (% of total lending)
Personal Banking (43%)
Business Banking (39%)
Corporates & Institutions (12%)
Wealth Management (4%)
Northern Ireland (3%)
Northern
Ireland
Denmark
Norway Sweden
Finland
Baltics
3%
51%
10% 12%
8%

44
Danske Hypotek Q1 2017
Executive summary: A satisfactory financial result for 2016
Low economic growth – full year of negative
interest rates
Costs below 2015 level; loan loss ratio of zero
driven by improved credit quality
Volume growth and stronger client activity
benefited NII and trading income
Customer satisfaction improved further,
bringing us to a satisfactory position in most
markets
• Net profit of DKK 19.9 bn, up 12% from 2015*
• ROE of 13.1%
• Strong capital position, with a CET1 capital
ratio of 16.3%
• Dividend of DKK 9.0 proposed and further
DKK 10 bn share buy-back programme
• Net profit for 2017 is expectedto be in the
range of DKK 17-19 bn
17.711.6
19.913.1
ROE (%)Net profit (DKK bn)
20162015*
Financial results, 2016
* Before goodwill impairment charges in 2015.

55
Danske Hypotek Q1 2017
Overview: Danske Bank Group Covered Bond Universe
• Realkredit Danmark, which has been a Covered Bond issuer since 1851
• Based on Danish legislation
• Specialized Mortgage Bank
• Fully-owned subsidiary in Danske Bank Group
• Primarily loans from Denmark
• Follows the “Specific Balance Principle”= matched funding
• Funding via daily tap issues in DKK through the Danish Market
• AAA/AA+ rating
• Danske Bank PLC, which has been a Covered Bond issuer since 2005
• Sampo Pankki changed name to Danske Bank Plc on 15 November 2012
• Based on Finnish Legislation
• Fully-owned subsidiary in the Danske Bank Group – we are looking into the possibilities of merging the subsidiary and our Finnish branch into a single branch
• Issued directly on the balance sheet
• Only residential loans from Finland
• Funding through benchmarks in EUR, € 10 bn Medium Term Note and Covered Bond programme
• Aaa programme rating
• Danske Hypotek AB,
which is to be a Covered Bond issuer from 2017
• Based on Swedish legislation
• Fully-owned subsidiary in Danske Bank Group
• Only loans from Sweden
• Funding via frequent tap issues in SEK through the Swedish Market, potentially supplemented by EUR benchmarks
• Expected AAA rating from S&P
• Danske Bank A/S,
which has been a Covered Bond issuer since 2007
• Cover-Pools D, I and C
• Based on Danish legislation
• Loans from the Group’s banking activities in Denmark, Norway and Sweden
• Issued directly on the balance sheet
• Multiple Cover Pool set-up
• Follows the “General Balance Principle”
• Multi currency benchmarks and PP, € 30 bn Global Covered Bond programmeme
• AAA/AAA programme rating

Danske Bank – Personal Banking SE- strategy in Sweden

Danske Hypotek Q1 2017
Personal Banking SE
March 2017

88
Danske Hypotek Q1 2017
Strategy - balanced organic growth
Customer
satisfaction
Profitability
Controlled
risks
Strengthening our position
in the Swedish marketas the
Modern ChallengerPartnerships
Online Sales
Cross BU collaboration

99
Danske Hypotek Q1 2017
Market response 2016
1. Danske Bank 8,1 (8,0)
1. Handelsbanken 8,1 (7,9)
3. SEB 7,7 (7,7)
4. Swedbank 7,2 (7,3)
5. Nordea 7,1 (7,2)
All competitors 7,6 (7,6)
Peer competitors 7,4 (7,5)
S W E D I S H Q U A LI T Y I N D E X 2 0 1 6 ( S K I )B A N K O F T H E Y E A R 2 0 1 6

1010
Danske Hypotek Q1 2017
Launch 5 April
14 of 14 member unions signed
Market planning together with largest member unions
Preparing for 4 scenarios
Strategic partnerships
7 447 new customers of 11 854 total Saco customers
> 90 % onboarding online
Main new customer groups:- Civil engineers 33 %- Medical practioners 19 %- Legal & Economists 13 %- Civil economists 7 %

1111
Danske Hypotek Q1 2017
TCO members - well educated, urban customers with good incomes
Unemployment, %
Repayment type Professional classes
Distribution of monthly income, SEK ‘000
• Stronger credit quality
• Lower LTV ratio
• Lower risk of unemployment
• Higher income
• Lower exposure in rural low growth areas
Sweden
SACO
TCO
6.2%
2.9%
2.4%
10%17%
40%33%
Officials, secondary education
Management position
Senior officials
Officials, post secondary education
19%20%
35%
21%
6%
23%19%
36%
19%
3%
<20 40-5020-30 30-40 >50
Danske Bank (FSA data sample 2016)
TCO (members with mortgages)

1212
Danske Hypotek Q1 2017
Business volumes 2016
20
30
40
50
60
70
80
90
Jan-16
Feb-16
Mar-16
Apr-16
Maj-16
Jun-16
Jul-16
Aug-16
Sep-16
Oct-16
Nov-16
Dec-16
L E N D I N G V O L U M E ( B n S E K )
0%
1%
2%
3%
4%
5%
6%
7%
8%
9%
10%
Jan-16
Feb-16
Mar-16
Apr-16
Maj-16
Jun-16
Jul-16
Aug-16
Sept-16
Okt-16
Nov-16
Dec-16
Market Share Share of Market Growth
S H A R E O F M A R K E T & M A R K E T G R O W T H

Danske Hypotek AB - Structure and roadmap

1414
Danske Hypotek Q1 2017
Purpose and Structure
• Ensure stable funding for our customers through the cycle• Long term funding solution for continued growth of Swedish retail mortgage business• Market communication; strong commitment to the Swedish Market
Danske Bank Group has a strong commitment to the Swedish mortgage market
Existing cover pools
Cover pool in Danske Hypotek
New originatedloans
Asset release
Danske BankSwedish
mortgage lending
Origination
Principal andinterest
New lending
Swedish mortgage lending
“Danske Hypotek AB”
Parent LoanSale ofmortgages
CoveredBonds
Bondproceeds
Principal andinterest
EMTCNCovered Programme
SEKCovered Programme
Danske Hypotek - Structure Transfer capacity of eligible assets into Danske Hypotek
100
2017 2018 2019 20212020
SEK bn

1515
Danske Hypotek Q1 2017
Governance modelFunding, Hedging, Liquidity and Capitalisation
• Danske Hypotek will primarily fund itself in the Swedish Covered Benchmark market
• EMTCN programme to be viewed as a complement mainly for private placement purposes
• Danske Hypotek’s primary interim source of liquidity will be through a parent loan
Funding
• Danske Hypotek will meet SFSA liquidity requirements• Danske Hypotek will ensure compliance with current and
future capital requirements as stated in e.g. CRR/CRD IV as well as specific Swedish regulation and guidelines on capital requirements
Liquidity and capitalisation
Governance model
• Danske Bank A/S will be Danske Hypotek’s primary swap counterpart
• ISDA with unilateral CSA to be established• On the liability side, all cash flows from issued bonds will be
swapped to 3m Stibor based flows• On the asset side, all cash flows from the mortgages will be
swapped to 3m Stibor based flows
Hedging
Governance model
Key capabilities and resources within Danske
Bank Group
SLA-
management
/ Outsourcing
III
Steering
documentation
II
Dedicated
organisation
I

1616
Danske Hypotek Q1 2017
Asset
transfer
AAA - Rating
Confirmation
First issue
of bonds
Investor
Roadshow
Capital
injection
Receipt of
SFSA
approvals
(2nd Quarter)
Roadmap towards first issuance
Remaining steps
• Final stages of SFSA processes
• Finalizing internal processes and systems
• Finalizing documentation
• Rating process well under way
We are optimistic to issue during 2nd
Quarter

Danske Hypotek - Availability of assets for future Cover pool

18
Financial results for Q1 2013Danske Hypotek Q1 2017
Availability of assets for future Cover pool- Overview
Characteristics Eligible assets in phase one Eligible assets in phase two Final Cover Pool
Collateral type – 100 pctSwedish residentialmortgages*
100pct residential mortgages to private individuals (retail)
100pct residential mortgages to owners of Multi-Family Properties
76pct retail, 24pct Multi-Family.
Pool notional SEK 87.6bn (EUR 9.2bn equivalent)
SEK 27.4bn (EUR 2.9bn equivalent)
SEK 114.9bn (EUR 12.0bn equivalent)
Number of Loans 89,156 2,137 91,293
Number of Borrowers 43,238 1,294 44,532
Number of Properties 45,377 2,327 47,704
Average Loan Size SEK 0.98m (EUR 102,000 equivalent)
SEK 12.82m (EUR 1.3m equivalent)
SEK 1.3m (EUR 131,000 equivalent)
Property Type 32% Tenant Owner Rights, 63% Single Family Housing , 5% Holiday Housing
25% Cooperative Housing, 75% Rental Housing
76% Retail, 6% Cooperative Housing, 18% Rental Housing
WA LTV (Indexed) 53.04% 58.37% 54.31%
WA Seasoning 3.85 years 1.24 years 3.23 years
WA Remaining Term 42.32 years 3.51 years 33.10 years
Pool type Dynamic Dynamic Dynamic
Rate type 85% Floating rate, 15% Fixed rate 100pct Floating rate 89% Floating rate, 11% Fixed rate
Geographical location 100% Sweden 100% Sweden 100% Sweden
Pool Cut Date 28-02-2017 28-02-2017 28-02-2017
Personal Banking loans Business Banking loans Total loan book
*Excluding any potential substitution collateral (AAA rated securities)
The relevant assets currently available on the Danske Bank balance sheet is shown below. The actual portfolio and the timing of the transfer to Danske Hypotek will be determined close to the actual relevant transfer dates. Key input factors, in transfer decisions, will be the demand from the Swedish investors and the development in the Swedish loan book

19
Financial results for Q1 2013Danske Hypotek Q1 2017
Distribution of property type*, %
Maturity in years*, %
*Pool cut date is 28-02-2017
Up to 50 years legal maturity for Swedish Personal Banking loans.
79 % has more than 40 years to maturity.
WA remaining terms is 42 years.
WA seasoning is 3.8 years.
Total amount of eligible assets on the existing loan book is SEK 115bn.
Total sum of loans in phase 1 is SEK 88 bn. In total 89.000 loans (Bolån) backed by residential property.
At a later stage, phase 2 is expectedto add about SEK 27 bn.
These figures do not include growth in Personal Banking or Business Banking.
Key Points
Key Points
63%
5%
32%Holiday Housing
Single Family Housing
Tenant Owner Rights
79
10533
<10 20-30 30-4010-20 40-50
Availability of assets for future Cover pool(Phase one only - Personal Banking loans)

20
Financial results for Q1 2013Danske Hypotek Q1 2017
Loan size in SEK m*, %
Average loans size is SEK 982.000 (EUR 102,000 equivalent)
71 % of the loans are below SEK 2 m.
Average LTV is 53 % and 79 % of loan volume is below 70 % LTV
Relatively high proportion of Interest Only loans for Swedish mortgages.
Share of IO on new lending YTD (Feb) 50,8%.
Distribution of repayment type* Key Points
Key Points
*Pool cut date is 28-02-2017
30%
70%
Amortizing
Interest Only
1
5
24
34
27
10
0.5-1 2-51-2 5-100-0.5 10-50
Availability of assets for future Cover pool(Phase one only - Personal Banking loans)

21
Financial results for Q1 2013Danske Hypotek Q1 2017
Stress test scenarios show how the LTV rises and eligible assets diminishes when house prises are stressed downwards.
Moderate effects At 20 pct. fall in house prices only 8
pct. of the original eligible assets becomes non-eligible.
At a 40 pct. fall in house prices 20 pct. of the original eligible assets becomes non-eligible.
LTV stress test*, SEK bn Key Points
* Effect of simulated market value declines. Pool cut date is 28-02-2017
90
80
20
30
40
50
70
60
0
10
-40%-5% -25%0% -10% -15% -20% -30% -35%
Eligible volume
Non-eligible volume
House price changes
The cover pool management will be based on the existing routines, capabilities and infrastructure within Danske Bank Group
Dedicated team of 4 FTE’s responsible for managing the Group’s existing cover pools
Utilizing existing routines with Group IT ensuring consistent and reliable:
risk monitoring reporting
Dedicated cover pool management team
Availability of assets for future Cover pool(Phase one only - Personal Banking loans)

Danske Hypotek – Funding

2323
Danske Hypotek Q1 2017
Danske Hypotek’s approach to the Swedish benchmark market
Our tools:
• Marker maker agreements with all major participants
• Repo facility that allows market makers to cover short positions – as a lender of last resort
• Expected to be eligible for index inclusion , OMRX, (and eventually SHB index)
• The ability to tap the bonds when we see demand
• The ability to buy-back when the bonds are approaching maturity
Our targets:
• Build a liquid Swedish benchmark curve
• Establish two benchmark bonds during 2017, subject to receipt of license and to demand
• Continue to build curve during the coming years. This will take priority over private placements in other formats and currencies
• All benchmarks bonds to be LCR level 1 at issuance
• Approach the market in a consistent, transparent and predictable manner
Our ambition is to be a benchmark issuer and we intend to act like the well established
Swedish issuers
Long term commitment to the Swedish market

2424
Danske Hypotek Q1 2017
Upcoming benchmark bond issue
Danske Hypotek ABIssuer
Swedish Covered BondFormat
Expected AAA (S&P)Rat ing
SEK BenchmarkSize
(3 year to 5 year)Maturit y
x%, FIXED, ANNUAL, 360/360Coupon
xxxIssue price
None (Hard bullet)Amort izat ion
Euroclear Sweden AB (former VPC)Clearing
1,000,000 SEK or multiples thereofDenominat ions
NASDAQ Stockholm ABList ing
Danske Bank, Handelsbanken, SEB, Nordea, SwedbankDealers/Market
makers
SEXXXXXXXXXXISIN
xxxReuters/Bloomberg
2525
Danske Hypotek Q1 2017
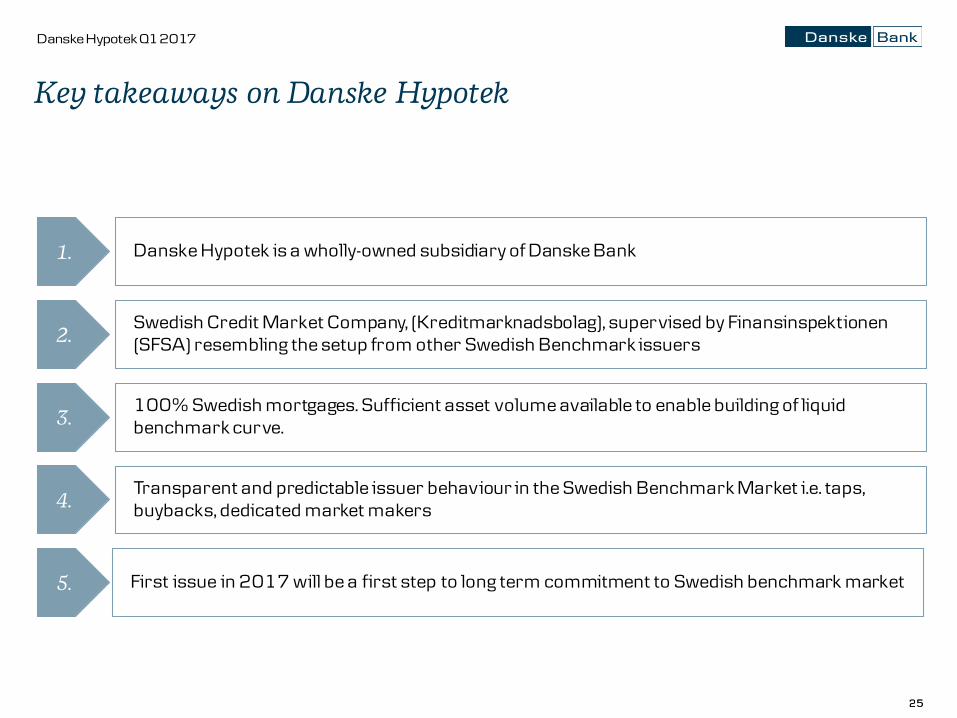
Key takeaways on Danske Hypotek
Danske Hypotek is a wholly-owned subsidiary of Danske Bank1.
3.
4.
100% Swedish mortgages. Sufficient asset volume available to enable building of liquid benchmark curve.
Transparent and predictable issuer behaviour in the Swedish Benchmark Market i.e. taps, buybacks, dedicated market makers
5. First issue in 2017 will be a first step to long term commitment to Swedish benchmark market
2.Swedish Credit Market Company, (Kreditmarknadsbolag), supervised by Finansinspektionen(SFSA) resembling the setup from other Swedish Benchmark issuers

Appendix

2727
Danske Hypotek Q1 2017
Appendix
Danske Bank Group
Danske Bank SE – Underwriting Criteria Mortgage lending
Danske Hypotek – Contacts
28
38
43
Nordic macro 40

Danske Bank Group

2929
Danske Hypotek Q1 2017
Key points, 2016 vs 2015
Net profit: DKK 19.9 bn, up 12% from 2015*
Income statement and key figures (DKK m)
• Return on equity of 13.1%
• Total income up 5%, reflecting higher NII, trading income and other income
• Income benefited from divesting properties, VISA Europe and Danmarks Skibskredit
• Expenses down 3%; cost/income ratio of 47.2%
• Lending volume up 5%
Key points, Q4 2016 vs Q3 2016
• NII up 5% driven by repricing in Denmark & higher lending volumes
• Fee income up 18% owing to performance fees of DKK 483 m and shadow account of DKK 279 m
• Expenses up 11% due to seasonality and severance pay
• Net reversal despite further oil-related collective charges
• CET1 capital ratio at 16.3% and REA of DKK 815 bn
2016 2015 Index Q4 2016 Q3 2016 Index
Net interest income 22,028 21,402 103 5,790 5,492 105
Net fee income 14,183 15,018 94 4,032 3,414 118
Net trading income 8,607 6,848 126 2,323 2,549 91
Other income 3,140 2,343 134 757 589 128
Total income 47,959 45,611 105 12,902 12,044 107
Expenses 22,642 23,237 97 6,056 5,471 111
Goodwill impairment charges - 4,601 - - - -
Profit before loan impairment charges 25,317 17,773 142 6,847 6,573 104
Loan impairment charges -3 57 - -160 264 -
Profit before tax, core 25,320 17,716 143 7,007 6,309 111
Profit before tax, Non-core 37 46 80 32 -42 -
Profit before tax 25,357 17,762 143 7,039 6,267 112
Tax 5,500 4,639 119 1,449 1,362 106
Net profit 19,858 13,123 151 5,590 4,905 114
Net profit before goodwill impairments 19,858 17,724 112 5,590 4,905 114
Return on avg. shareholders' equity (%) 13.1 11.6 14.5 12.9
Cost/income ratio (%)* 47.2 50.9 46.9 45.4
Common equity tier 1 capital ratio (%) 16.3 16.1 16.3 15.8
EPS (DKK) 20.2 12.8 158 5.8 5.0 116
Lending (DKK bn) 1,689 1,609 105 1,689 1,675 101
Deposits and RD funding (DKK bn) 1,631 1,568 104 1,631 1,644 99
- of which deposits (DKK bn) 859 817 105 859 872 99
Risk exposure amount (DKK bn) 815 834 98 815 814 100
* Before goodwill impairment charges in 2015.

3030
Danske Hypotek Q1 2017
* Incl. Non-core **The loan loss ratio is defined as annualised quarterly impairment charges as a percentage of loans and guarantees.
Impairments: Loan loss ratio of zero bp in core activities in 2016
Group impairments,* 2012 to 2016 (DKK bn/bp) Impairment drivers, Q4 2016 vs Q3 2016
Loan loss ratio,** annualised (bp)Impairments (DKK m)
• Improved credit quality and reversals at all business units except for C&I resulted in a net reversal of DKK 0.2 bn
• At Personal Banking, credit quality improved as property prices increased & customers refinanced to amortising loans
• Net reversals at Business Banking largely driven by commercial property customers. Lower new impairments to the agriculture sector due to improved output prices
• Increased collateral values drove net reversals in WealthManagement and Northern Ireland
• Higher impairments at C&I due to a collective charge of DKK DKK 450 m towards oil-related exposure-10
0
10
20
30
40
50
60
7018
12
6
0
-62016
-0.2
2015
-0.1
2014
3.7
2013
5.4
2012
12.5
Loan loss ratio* (rhs)Impairments
2016 2015 Q4 2016 Q3 2016
Personal Banking -477 390 -188 -110
Business Banking -235 191 -181 -31
C&I 1,071 65 282 468
Wealth Management -137 -29 -55 -8
Northern Ireland -234 -561 -22 -60
Other activities 9 1 3 5
Total core -3 57 -160 264
Non-core -165 -118 -67 -17
Group -168 -61 -227 247
2016 2015 Q4 2016 Q3 2016
Personal Banking -7 6 -10 -6
Business Banking -4 3 -11 -2
C&I 27 1 27 42
Wealth Management -20 -4 -30 -4
Northern Ireland -47 -121 -20 -54
Other activities 24 1 137 78
Total core 0 0 -3 5
Non-core -69 -38 -136 -33
Group -1 0 -5 5

3131
Danske Hypotek Q1 2017
Credit exposure: Preliminary signs of improvement in agriculture; further collective charges against oil-related exposure
Agriculture exposure (2.5 % of Group net exposure) Oil-related exposure (0.9 % of Group net exposure)
Agriculture by segment, Q4 2016 (DKK m)
• Net exposure of DKK 24 bn* related to offshore, oil majors and oil service providers
• The vast majority of the oil-related exposure is managed by specialist teams for customer relationship and credit management in C&I
• In Q4, we booked further collective impairment charges of DKK 450 m against direct oil exposure; total collective charges now stand at DKK 1.1 bn
• In addition, collective charges against second-round effects stand at DKK 0.2 bn
Oil-related exposure, Q4 2016 (DKK m)
• Market conditions showed positive signs in the second half of 2016, as pig prices remained stable while milk prices increased from a very low level
• No impairments charges were booked in Q4
• Total collective impairment charges amount to DKK 0.9 bncovering 1.4% of gross credit exposure
• RD represents 69% of total gross exposure and 14% of total accumulated impairment charges.
Gross credit exposure
Acc. Individual
impairment
charges
Net credit
exposure
C&I 23,136 268 22,868
Oil majors 5,479 - 5,479
Oil service 8,721 27 8,694
Offshore 8,936 241 8,695
Business Banking 913 14 899
Oil majors 2 - 2
Oil service 803 14 789
Offshore 108 - 108
Others 4 0 4
Total before collective impairments 24,054 282 23,772
Collective impairment charges 1,128
Total gross exposure 25,182
Gross
credit
exposure
Portionfrom RD
Acc.
Individual
impairment
charges
Net
credit
exposure NPL coverage ratio
Business Banking 55,448 43,090 2,928 52,520 95%
Growing of crops, cereals, etc. 18,240 15,001 356 17,884 98%
Dairy 9,027 6,969 1,014 8,013 91%
Pig breeding 12,991 10,421 1,345 11,646 98%
Mixed operations etc. 15,190 10,698 213 14,977 89%
Northern Ireland 4,845 - 65 4,780 89%
C&I 5,177 2,411 - 5,177 100%
Others 216 14 1 216 -
Total before collective impairments 65,686 45,514 2,994 62,692 94%
Collective impairment charges 920 250
Total gross exposure 66,606
* The oil-related net credit exposure of DKK 24 bn is part of the energy & utilities industry (DKK 15 bn) and shipping (DKK 9 bn) industry.
3232
Danske Hypotek Q1 2017
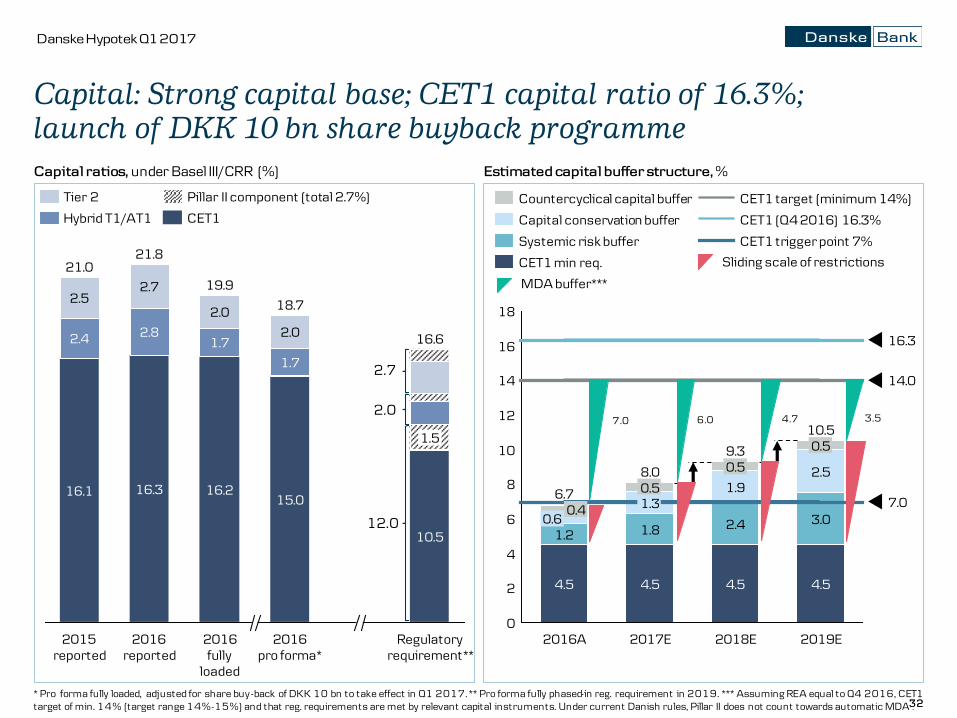
Capital: Strong capital base; CET1 capital ratio of 16.3%; launch of DKK 10 bn share buyback programme
Capital ratios, under Basel III/CRR (%) Estimated capital buffer structure, %
1.7
2.0
2016 reported
21.8
16.3
2.8
2.7
2015 reported
21.0
16.1
2.4
2.5
Regulatoryrequirement**
16.6
10.5
1.5
2016pro forma*
18.7
15.0
1.7
2.0
2016fully
loaded
19.9
16.2
CET1
Pillar II component (total 2.7%)
Hybrid T1/AT1
Tier 2
* Pro forma fully loaded, adjusted for share buy-back of DKK 10 bn to take effect in Q1 2017. ** Pro forma fully phased-in reg. requirement in 2019. *** Assuming REA equal to Q4 2016, CET1 target of min. 14% (target range 14%-15%) and that reg. requirements are met by relevant capital instruments. Under current Danish rules, Pillar II does not count towards automatic MDA .
18
16
14
12
10
8
6
4
2
0
8.0
4.5
7.0
14.0
16.3
10.5
9.3
1.8
1.30.5
2016A
6.7
4.5
1.2
2019E
0.4
4.5
3.0
2.5
0.5
0.6
4.5
2.4
1.9
0.5
2017E 2018E
CET1 trigger point 7%
CET1 (Q4 2016) 16.3%
CET1 target (minimum 14%)
CET1 min req.
Systemic risk buffer
Capital conservation buffer
Countercyclical capital buffer
7.0 6.0 4.7 3.5
Sliding scale of restrictions
MDA buffer***
2.7
2.0
12.0

3333
Danske Hypotek Q1 2017
Regulatory themes - MREL
Own funds and senior unsecured* (% of REA) MREL requirements in Denmark (preliminary)
• Danske Bank as a D-SIFI will be subject to MREL requirements.
• Danske Bank welcomes the review of the BRRD and the proposal to harmonise the TLAC standard and MREL.
• We expect an MREL requirement from the Danish FSA before the end of 2017.
• The final outcome is yet to be determined.
Volume:
• The Danish FSA has signaled willingness to discuss transitional arrangements with the industry. Details are yet to be disclosed.
• FSA’s preliminary calibration of MREL in line with the current EBA guidelines (not accounting for the proposed changes to the BRRD), i.e.,
• Loss absorption amount = total capital req. + CBR
• Recapitalisation amount = loss absorption amount
Type of instrument:
• Subordination is expected in some form as part of the eligibility requirements for MREL and the FSA has said that it wishes to conform with any emerging European standard.
With appropriate transitional arrangements, our relatively short senior maturity profile leaves ample flexibility to refinance into a new eligible instrument.
Senior maturity profile* (DKK bn)
Q4 2016
19.9
4.5
37.4
13.0Own funds
Senior <1Y
Senior >1Y
34
20242021
2
8
20232017 20222019
37
0
24
2026
16
2020
21
0
2018 2025
0
* Includes structured notes.

3434
Danske Hypotek Q1 2017
Funding structure and sources: Danish mortgage system is fully pass-through
Issued RD bondsRD mortgages
Covered bonds
Bank mortgages
DepositsBank loans
Senior debt
Funding
1,929
771
154
859
144
Loans
1,689
771
338
580
10
2
13
9
55
-3
5
9
EquitySubord. debt
Covered bonds
Senior unsecured
DepositsRepos, net
CD & CP
Deposits credit inst.
Q4 2016Q3 2016
Short-term funding Long-term funding
Loan portfolio and long-term funding, Q4 2016 (DKK bn) Funding sources (%)

3535
Danske Hypotek Q1 2017
* Spread over 3M EURIBOR.
Funding and liquidity: DKK 85 bn of long-term funding issued in 2016; LCR-compliant at 158% at attractive spreads
158
137136
124125
100
Q3 2016Q2 2016 Q4 2016Q1 2016Q4 2015
26
35 3734
1621
114 6
2020: DKK 65 bn
263bp
57bp
27bp
2
478bp
2019: DKK 55 bn
250bp
34bp
57bp
2018: DKK 71 bn
201bp
40bp
41bp
Additional Tier 1Tier 2SeniorCov. bonds
7064
39
85
2017E20162015
70-90
20142013
CompletedFunding plan
17
30
19
37 33
123
63
Redeemed 2016 DKK: 63 bn
96bp93bp
New2016: DKK 85 bn
495
48bp
26bp50bp
1
Redemptions 2017: DKK 66 bn
65bp
100bp
82bp
Additional Tier 1Tier 2SeniorCov. bonds
Maturing funding,* 2018–2020 (DKK bn and bp)
Changes in funding,* 2016 (DKK bn and bp) Long-term funding ex RD (DKK bn)
Liquidity coverage ratio (%)

3636
Danske Hypotek Q1 2017
Danske Bank: The four cover pools - Overview
Residential Residential Combined Residential
Characteristics Cover Pool D Cover Pool I Cover Pool C Danske Bank plc
Pool notional DKK 36.3bn (EUR 5.09bn equivalent)
DKK 118.0bn (EUR15.8bn equivalent)
DKK 55.6bn (EUR 7.5bn equivalent)
DKK 42.8bn (EUR 5.76n equivalent)
Number of Loans 64,489 114,882 6,198 84,352
Substitution collateral 0 0 0 0
Average Loan Size DKK 0.6m (EUR 76,000 equivalent)
DKK 1.0m (EUR 138,000 equivalent)
DKK 9.0m (EUR 1.2m equivalent)
DKK 0.51m (EUR 68.000 equivalent)
Property Type 100% owner-occupied 84% owner-occupied, 16% housing cooperatives
9.0% Agriculture, Forestry, Horticulture, 15% Industrial, 4% Cooperative Housing, 24% Rental Housing, 43% Retail, 5% Other
100 % owner-occupied
WA LTV (Indexed) 55.3% 54.2% 54.8% 52,4%
Loan seasoning 15 % (<5y), 85 % (>5y) 69 % (<5y), 31 % (>5y) 94 % (<5y), 6 % (>5y) 47 % (<5y), 53 (>5y)
Repayment type 85 % (Bullet), 15 % (Amortising) 49 % (Bullet), 51 % (Amortising) 33 % (Bullet), 67 (Amortising) 100 % (Amortising)
Rate type Floating rate Fixed (18% ), Floating (82%) Floating rate Fixed (10%), Floating (90%)
Geographical location 100% Denmark 36% Sweden, 64% Norway 75% Sweden, 25% Norway 100 % Finland
Issuance Notional DKK 31.7bn (EUR 4.3bn equivalent)
DKK 104.9bn (EUR 14.1bn equivalent)
DKK 43.5bn (EUR 5.9bn equivalent)
DKK 37.3bn (EUR 5bn equivalent)
OC at cut-off date 13.9% (2% committed) 12.70% (2% committed) 28.0% (2% committed) 13% (2% committed)
Cut-off date 31 December 2016 31 December 2016 31 December 2016 31 December 2016
Rating
(S&P/Fitch/Moody’s)
AAA/AAA/- AAA/AAA/- AAA/AAA/- - /- /Aaa

3737
Danske Hypotek Q1 2017
Danske Bank’s credit ratings
Moody’s (Pos) S&P (Stable) Fitch (Stable)
Aaa AAA AAA
Aa1 AA+ AA+
Aa2 AA AA
Aa3 AA- AA-
A1 A+ A+
A2 A A
A3 A- A-
Baa1 BBB+ BBB+
Baa2 BBB BBB
Baa3 BBB- BBB-
Ba1 BB+ BB+
Ba2 BB BB
… … …
Ca D D
Senior unsecured
Tier 2
Additional Tier 1
Inv
es
tm
en
t g
ra
de
Sp
ec
ula
tiv
e g
ra
de
S&P Global upgrades SACP rat ing
• On July 8 2016, S&P raised Danske Bank’s SACP (Stand-Alone Credit Profile) rating from a- to a as a result of Danske Bank’s improved capitalisation.
Moody’s upgrades Danske Bank’s deposit rat ing – outlook
changes to posit ive
• On 12 October 2016, Moody’s upgraded Danske Bank's long-term deposit rating to A1 from A2 and affirmed all other ratings. Moody’s also changed the outlook to positive from stable on Danske Bank’s ratings.
• The positive outlook reflects Danske Bank’s improvements in financial metrics to date and the expectation of a continuation of the positive trend.
Rat ing af f irmed by Fitch
• On August 22 2016, Fitch affirmed Danske Bank’s rating with a stable outlook. The asset quality and profitability score were raised from ‘a-’ to ‘a’.
Danske Bank’s long-term instrument rat ings and outlook*
* Outlook refers to the senior unsecured ratings of Danske Bank A/S. Capital centre T of RD is rated AA+ by Fitch, capital centre S is rated AAA.
Covered bonds Danske Bank A/S
Covered bonds Danske Bank Plc
Covered bonds RD

Danske Bank SE – Underwriting Criteria Mortgage lending

Danske Hypotek Q1 2017
Personal Banking Business Banking
• Track record, debt and income checked via Credit Information Agency (UC)
• Individual scoring of all customers before decision
• Household budget in every case
• Stress test on household budget with increased interest rate
• Key ratios and other requirements essential part of decision
• Assessment if purchase prices are fair values
• Focus on existing good corporate property clients
• Individual valuation of all financed properties
• We apply moderate LTV levels combined with strong focus on cash flow and business risk characteristics
• Focus on properties in large cities and regional cities, where we have access to local market knowledge through our branches
Solid
underwriting
criteria
Danske Bank SE – Underwriting Criteria Mortgage lending

Nordic macro

4141
Danske Hypotek Q1 2017
Interest rates, leading (%)
Nordic macro economy
135
120
105
90201620142012201020082006
FinlandNorwaySwedenDenmark
6
4
2
0
-2
201620142012201020082006
6
5
4
3
2
1
0
-1201620142012201020082006
10
8
6
4
2
0201620142012201020082006
Real GDP, constant prices (index 2005 = 100) Inflation (%)
Unemployment (%)

4242
Danske Hypotek Q1 2017
Apartment prices (index 2005 = 100)
Nordic housing markets
Property prices (index 2005 = 100) House prices/nom. GDP (index 2005 = 100)
Apartment prices/nom. GDP (index 2005 = 100)
2006 2014 201685
90
95
100
105
110
115
120
125
130
2008 2010 2012
210
180
150
120
90
20162014201220102006 20082016
120
160
200
240
280
320
20142012201020082006
Denmark Sweden Norway Finland
100
120
140
160
180
200
2006 2008 2010 2012 2014 2016

Danske Hypotek – Contacts

44
Financial results for Q1 2013Danske Hypotek Q1 2017
Per TunestamManaging Director, Danske HypotekDirect: +46 752-48 28 82Mobile: +46 708 74 48 41E-mail: [email protected]
Tomas RengerChief Funding ManagerDirect: +46 752-48 28 81Mobile: +46 708 34 72 64E-mail: [email protected]
Claus Ingar Jensen Head of IR Direct: +45 45 12 84 83Mobile: +45 25 42 43 70 E-mail: [email protected]
John BäckmanChief IR OfficerDirect: +45 45 14 07 92 Mobile: +45 30 51 46 85E-mail: [email protected]
Contacts
Christoffer MøllenbachHead of Group TreasuryDirect: +45 45 14 63 60Mobile: +45 21 55 10 52E-mail: [email protected]
Bent CallisenFirst Vice President, Group TreasuryDirect: +45 45 12 84 08Mobile: +45 30 10 23 05E-mail: [email protected]
Nicolaj VerdelinChief Funding Manager, Group TreasuryDirect: +45 45 12 85 14Mobile: +45 23 72 99 14E-mail: [email protected]
Thomas Halkjær JørgensenChief Portfolio Manager, Group TreasuryDirect: +45 45 12 83 94Mobile: +45 25 42 53 03E-mail: [email protected]

4545
Danske Hypotek Q1 2017
Disclaimer
Important Not ice
This presentation does not constitute or form part of and should not be construed as, an offer to sell or issue or the solici tation of an offer to buy or acquire securities of Danske Bank A/S in any jurisdiction, including the United States, or an inducement to enter into investment activity. No part of this presentation, nor the fact of its distribution, should form the basis of, or be relied on in connection with, any contract or commitment or investment decision whatsoever. The securities referred to herein have not been, and will not be, registered under the Securities Act of 1933, as amended (“Securities Act”), and may not be offeredor sold in the United States absent registration or an applicable exemption from the registration requirements of the Securities Act.
This presentation contains forward-looking statements that reflect management’s current views with respect to certain future events and potential financial performance. Although Danske Bank believes that the expectations reflected in such forward-looking statements are reasonable, no assurance can be given that such expectations will prove to have been correct. Accordingly, results could differ materially from those set out in the forward-looking statements as a result of various factorsmany of which are beyond Danske Bank’s control.
This presentation does not imply that Danske Bank has undertaken to revise these forward-looking statements, beyond what is required by applicable law or applicable stock exchange regulations if and when circumstances arise that will lead to changescompared to the date when these statements were provided.