
Danish Ship Finance - SHIPPING MARKET REVIEW · 2018-05-25 · create value beyond the vessel. The...
72
SHIPPING MARKET REVIEW MAY 2018
Transcript of Danish Ship Finance - SHIPPING MARKET REVIEW · 2018-05-25 · create value beyond the vessel. The...

SHIPPING MARKET REVIEW
MAY 2018
Shipping Market Review – May 2018 2
DISCLAIMERShipping Market Review – May 2018
The persons named as the authors of this report hereby certify that: (i) all of the
views expressed in the research report accurately reflect the personal views of
the authors on the subjects; and (ii) no part of their compensation was, is, or will
be, directly or indirectly, related to the specific recommendations or views
expressed in the research report. This report has been prepared by Danish Ship
Finance A/S (“DSF”).
This report is provided to you for information purposes only. Whilst every effort
has been taken to make the information contained herein as reliable as possible,
DSF does not represent the information as accurate or complete, and it should
not be relied upon as such. Any opinions expressed reflect DSF’s judgment at the
time this report was prepared and are subject to change without notice. DSF will
not be responsible for the consequences of reliance upon any opinion or
statement contained in this report. This report is based on information obtained
from sources which DSF believes to be reliable, but DSF does not represent or
warrant such information’s accuracy, completeness, timeliness, merchantability
or fitness for a particular purpose. The information in this report is not intended to
predict actual results, and actual results may differ substantially from forecasts
and estimates provided in this report. This report may not be reproduced, in
whole or in part, without the prior written permission of DSF. To Non-Danish
residents: The contents hereof are intended for the use of non-private customers
and may not be issued or passed on to any person and/or institution without the
prior written consent of DSF. Additional information regarding this publication will
be furnished upon request.

Shipping Market Review – May 2018 3
HEAD OF RESEARCH
Christopher Rex, [email protected]
ANALYTICAL TEAM
Ninna Møller Kristensen
Jonas Munch Stenbjerg
Sara Møller Jensen
Caspar Wergeland

Shipping Market Review – May 2018 4
TABLE OF CONTENTSShipping Market Review – May 2018
PERSPECTIVES AND KEY TAKEAWAYS, 5
GENERAL REVIEW AND OUTLOOK, 7
SHIPBUILDING, 15
CONTAINER, 21
DRY BULK, 27
GLOBAL OIL MARKETS, 33
OFFSHORE SUPPORT VESSELS, 36
SUBSEA VESSELS, 42
CRUDE TANKER, 48
PRODUCT TANKER, 54
LPG TANKER, 60
LNG TANKER, 66

Shipping Market Review – May 2018 5
PERSPECTIVES AND KEY TAKEAWAYSHow do we unlock the next level of value in the shipping industry
This report reviews key developments in the shipping marketand the main shipping segments up until May 2018 andindicates possible future market directions. Please read thedisclaimer at the beginning of this report carefully.
In this edition of our Shipping Market Review, we take a closer look athow digitalisation may impact the long-term outlook for the shippingindustry. We highlight some global perspectives that provide a basisfor determining the outlook. We present digitalisation as anopportunity for future value creation. We certainly believe itrepresents an opportunity, but one that is not exclusively open toshipowners. Various players from within the current industry as wellas players from other industries are already acting to capitalise on thispotential.
In the early years, companies that digitalised were at the vanguard ofthe industry. Today, digitalisation has permeated every level of thecompetitive landscape in most industries. Digital technologies are notonly reshaping customers’ expectations but are also redefiningboundaries across industries, the role of assets and the types ofcompetitor. The shipping industry cannot avoid being impacted by thedigitalisation of the global economy: as traditional industry borders fallaway, the future of shipping stands to be greatly influenced by thecreation of platforms and ecosystems.
We examine the emergence of new ecosystems and the implications ofthese for the shipping industry. To succeed in these new ecosystems,most shipping companies will have to reassess their traditional rolesand business models. Today, most shipowners make money by tradingtheir vessels while waiting to capitalise on the next upswing insecondhand prices. Digitalisation is likely to introduce a high degree oftransparency – if freight rates and secondhand prices become lessvolatile as a result, serious consideration will have to be given to howvalue can be created in the shipping industry.
We will all need to learn how the ecosystems will shift value pools andchange the nature of risk. We do not have all the answers. Theindustry needs to embrace this evolving landscape so that it can take
the first steps towards creating new revenue sources. We argue thatshipping companies will need to begin to create value beyond thevessel. The first step could be to turn shipping data into an asset thatcan be monetised.
The lesson learned from other industries is clear: players that fail tocreate value from the data they generate can easily becomemarginalised. But harnessing value from the data will not be enough.Companies that lack strong customer connections run the risk ofdisintermediation and perhaps of becoming “back offices” with limitedheadroom to create or retain profit. For the shipping companies tooccupy attractive roles in their ecosystem, they need to offercustomers seamless journeys that eliminate the typical pain points bycapturing business from other industries.
The shipping industry handles close to 90% of global trade. Thisshould give shipowners a good opportunity to leverage on their corecompetences and tap into the unexplored value pool available to thosewho understand this interconnected ecosystem of the global economy.
In this report, we present four steps towards additional value creationin a digital shipping industry but urge our readers to remember thatseveral other players are chasing the same business opportunities.The digital winners may not all be found among today’s shipowners.
Perspectives and key takeaways |

GENERAL REVIEW AND OUTLOOK
SHIPPING MARKET REVIEW – MAY 2018
Shipping Market Review – May 2018 7
SHIPPING MARKETS AT A GLANCEThe shipping industry is on the verge of a paradigm shift
The shipping industry is a service industry that serves the globaleconomy. The global economy is undergoing a period oftransformative change. Many of the dynamics that are working tomove the tectonic plates of global demand are still in their infancy, butit seems clear that they are recalibrating the relationship betweenglobal economic growth and seaborne trade.
The global economy is becoming less seaborne trade-intensive perdollar growth, since the combined effects of ageing global consumersand emerging technologies (i.e. the fourth industrial revolution) areshifting the global economy towards services. Please see previouseditions of this report for an extensive discussion of these topics.
Few investments in ships have delivered a risk-adjusted return oninvested capital over the past decade. New vessels have beenordered, since most investors seemed to believe that the industry wasat a cyclical low and on the brink of a recovery. Today, most shipsegments are burdened by surplus capacity, with more vessels onorder, low freight rates and low secondhand prices.
Dry Bulk (among a few other (sub)segments) seems to finally berecovering some of the lost territory. We are concerned, though, thatmuch of the current demand picture simply reflects the short-termimpact of political measures to stimulate domestic economic growthand job creation. We see a risk that demand volumes will shrink whenthe stimulus programmes are scaled back and interest rates startrising again. Clearly, that would result in unprecedented overcapacityissues within the larger ship segments.
Take Chinese Dry Bulk demand as an example. To us, it is beyondquestion that the Chinese economy is transitioning towards a moresustainable growth model. This is likely to involve a smallercontribution to GDP from, for example, the domestic constructionsector. Nonetheless, domestic stimuli (including the Belt and RoadInitiative) continue to ensure that growth in iron ore import volumescontributes to Dry Bulk demand volumes. However, that does notmean the shipping industry needs more Capesize vessels in the longterm. When the stimulus programme comes to an end, construction
activity will begin to reflect the economy’s underlying demand, whichcould reduce current import volumes significantly.
We argue that a structural change to the underlying demandlandscape has been taking place, disguised as cyclicality. The marketoutlook for most of the ship segments is bleak, since the overcapacityseems likely to persist. The new environmental regulations that areabout to come into force offer a glimmer of hope if they cause manyolder vessels to be scrapped.
The introduction of platforms for cargo booking and cargomanagement is set to challenge the medium-term outlook. Thedigitalisation of the cargo booking will lead to greater transparency onprices and performance, and competition will ramp up. This shouldsignificantly reduce freight rate volatility over time, which is likely tospill over into less volatile pricing of secondhand vessels. We areessentially discussing the likely erosion of central parts of mostshipowners’ business models. In this scenario, it will be imperative tocreate value beyond the vessel.
The best shipping companies of the future will be the one thatREINVENT THEIR OPERATING MODELS or at least introduce additionallayers of revenue on top of their existing operations. This is all aboutdigitalising the shipping industry and turning data into an asset thatcan be monetised.
Initially, digitalisation will work to harness the cost-saving potentialand use advanced analytics to discover and quantify tradingopportunities. Later stages will work to create value beyond thevessels. On the following pages, we present a four step roadmap forthe digitalisation journey.
General Review and Outlook |

Shipping Market Review – May 2018 8
The digital transformation of the shipping industry does notnecessarily mean a sea change for every company in every part of theindustry at the same time, although all ship segments are expected tobe affected by digitalisation at some point. Not all cargo types areequally obvious candidates for trading on a digital platform. The morestandardised cargo types are set to be digitalised first. As tradingplatforms demonstrate their potential to cargo owners, more volumeswill be included, thereby facilitating broader digital adoption evenamong the more traditional parts of the industry. It will be a gradualprocess, but even niche markets are likely to be impacted by theseemerging trends, since a digital platform will provide a benchmark forall cargo owners even before the lion’s share of a cargo type ishandled digitally.
Digitalisation will result in greater transparency on prices andperformance, and competition will ramp up. Freight rate volatilitycould be reduced over time, which is likely to spill over into lessvolatile pricing of secondhand vessels.
The oil and gas industry is already seeing a digital transition amongthe top-tier owners of Offshore Support Vessels and Subsea Vessels.The larger Dry Bulk carriers are also starting to undergo a degree ofdigitalisation, as some mining companies have launched digitalplatforms on which shippers compete to win the cargo.
In the Container industry, we are starting to see internal pressurebuilding up, as the industry forerunners aim to integrate the entiresupply chain from origin to destination (from trucks to warehouses,ports, vessels and end users) rather than from port to port. Butmaybe more importantly, we are also seeing that the more digitalplayers have plans to integrate larger parts of their ecosystem bystarting to offer additional services such as trade financing.
The lesson learned from other industries seems clear: players that failto create value from the data they generate could easily becomemarginalised. The digital shipping companies will develop new sourcesof revenue and harvest cost savings from their operating data. This isimportant to bear in mind when we analyse the forces at play inoversupplied markets.
The borders of industries are changing: for example, access to capitalcould become as important as the vessels, if it enables cross-selling ofhigher-margin products such as trade financing. In this scenario, rivalswill no longer be competing head-to-head. Digital shipping companiesthat can cross-sell additional services by leveraging on their corecompetences will earn more per unit moved than traditional shippingcompanies.
The elephant in the room is clearly OWNERSHIP OF THE DATA. In veryfew other industries that have undergone digitalisation have assetowners managed to create value from the data they generate. TakeUber as an example. Uber drivers benefit from algorithms by securingthe next low-priced ride, but they benefit little from the additionalvalue that is generated through the combined data from all Uberdrivers contained in these algorithms. Shipowners could likewise find itdifficult to monetise their data if players outside the industry end updeveloping the algorithms of the future.
DIGITALISATION WILL LEAD TO GREATER TRANSPARENCYAnd reduce volatility in freight rates and secondhand prices
Source: Danish Ship Finance
DIGITAL ADAPTATION IN THE INDUSTRY
IMPACT
ADAPTATION
CONTAINERLARGE DRY BULK
LNG CARRIERS
CAR CARRIERS
OIL TANKERS
LPG CARRIERS
SMALL DRY BULK
General Review and Outlook |

Shipping Market Review – May 2018 9
THE INDUSTRY NEEDS TO TAP INTO VALUE BEYOND THE VESSELAnd turn shipping data into an asset that can be monetised
PERFORMANCE MANAGEMENT
CAPACITY OPTIMIZATION
VALUE BEYOND THE VESSEL
REINVENTING THE OPERATING MODEL
THE ROAD TO A NEW DIGITAL INDUSTRY ARCHITECTURE
PERFORMANCE MANAGEMENT
Performance management is about COST SAVINGSand about improving the PERFORMANCE of thevessel. Connectivity and artificial intelligence isoptimizing the decision making and allows alternativestrategies to be evaluated across owners.
CAPACITY OPTIMIZATION
Capacity optimization is the CRYSTAL BALL that allows the industry toadjust supply according to demand. This is about POSITIONING but itis likewise about INVESTMENT DECISIONS in future tonnage. Volatilityin freight rates and secondhand prices will decline. The return oninvested capital from operating the vessels is likely to declineaccordingly.
VALUE BEYOND THE VESSEL
The shipping industry represents the best LEADINGINDICATOR FOR THE GLOBAL ECONOMY. Cargoflows presented in an industry specific context enableregional or local campaigns to be optimised. This isabout multi-sided platforms where the value of thedata can be harvested multiple times by selling theinformation to multiple parties in various industries.
UNLOCKING VALUE by delivering a distinct customer experience wherejourneys and processes have been simplified and streamlined. This isdone by adopting multiple levers in sequence and potentially redefiningthe borders of industries.
REINVENTING THE OPERATING MODEL
General Review and Outlook |
Shipping Market Review – May 2018 10
PERFORMANCE MANAGEMENTChanging the nature of risk and creating new markets
The first step towards value creation in a digital shipping industry isabout PERFORMANCE MANAGEMENT. At this stage, it is essentiallyabout cost savings. It is about transforming the analogue industry,which comprises multiple disjointed systems, into a smart digitalecosystem. This will be done step-by-step by harnessing the power ofdata collected through the internet of things. It is about tapping intoinnovative technologies to improve operational performance.
The aim is to use all available information (e.g. bridge and enginedata, navigation, meteorology data, oceanographic data,hydrodynamic performance, traffic planning, port information, etc.) tooptimise the operation of the vessel. Artificial intelligence andmachine-learning techniques will be applied to optimise, augment andde-risk vessel operation.
Smart performance management systems are still in their infancy inlarge parts of the shipping industry, as few vessels have many sensorsand vessel connectivity is still relatively weak. The next generation ofships will be super-connected assets, with all systems monitored andintegrated into unified cloud-based platforms for managing operationsin real time across the full breadth of the maritime ecosystem.
Still, a large part of the current fleet could be upgraded to higherdigital standards. We have useful examples from other industries. Inthe rail industry, ageing locomotives are being given extreme digitalmakeovers to enable significant improvements in their operationalperformance. Cloud-based services are handling vast quantities ofdata (e.g. speed, wheel slip, engine health, rail quality and windeffect), helping the mature assets stay competitive for longer byoptimising operation, saving fuel, reducing emissions, predictingpotential problems and recommending when best to performmaintenance to limit downtime. The refurbished locomotives aremodernised to a degree that allows owners to get the most out oftheir existing assets. These findings are applicable to other industries,including the shipping industry.
With the digital revolution blurring the boundaries between physicalproducts and services, we see a future where the vessels are
connected, contextually aware and even comprehending.
In time, performance management systems will be able to undertakethe tasks of a RELIABLE RATING SYSTEM. The systems will develop aprofound understanding of the operating universe of each individualship by applying artificial intelligence and machine-learningtechniques. This will allow the systems to calculate expected futurebunker consumption and engine emissions while also providingaccurate risk assessments for any potential causalities, cargo damageor delays.
These systems may begin to rate individual vessels’ performanceacross owners, engines, systems, original equipment manufacturers,suppliers and ultimately operating models. It could even becomepossible to identify the most competitive vessel under variousoperating models.
In a world with relatively stable or at least relatively predictablefreight rates, it is easy to imagine the creation of a feedback loop thatdefines a vessel’s future earnings potential and hence its secondhandvalue potential in various scenarios.
General Review and Outlook |

Shipping Market Review – May 2018 11
CAPACITY OPTIMISATIONDiscovering and quantifying trading opportunities
The second step towards value creation in the digital shipping industryis about CAPACITY OPTIMISATION. Cloud-based software will combineand interpret data from the broader shipping industry and otherrelevant sources to build insights that help shipowners manage theircapital and operating expenditure better. By applying artificialintelligence to satellite, AIS and other geospatial data sources,algorithms will seek to DISCOVER AND QUANTIFY TRADING
OPPORTUNITIES for the shipping industry.
The aim is to provide transparency for the global movement of goodsand to understand the evolving context of production andconsumption while considering the changes that stem fromdemographic shifts, supply chain issues and catastrophic events.
By monitoring, tracking and measuring cargo volumes across theworld, we can begin to understand how trading patterns and parcelsizes relate to each another. These insights will lead to a greater levelof confidence in decision-making. For shipowners, this will initially beabout vessel positioning but could quickly turn into a broader quest forvalue creation.
Technological innovation tends to occur exponentially and ruthlessly;whenever a new technology takes over, an old one becomes obsolete.Investors building these “crystal balls” run the risk of planning andbuilding infrastructure that is outdated even before it is operational.But these bespoke intelligence solutions could turn out to be thesuperchargers that enable individual shipowners to outperform themarket in the age of trading platforms. We expect the tradingplatforms to form the core digital infrastructure of the digital shippingindustry. Still, owners will need digital solutions that help themnavigate and optimise their everyday operations, even if they are notground-breaking superchargers.
These new technologies can introduce transparency to a degree thatreduce the core elements of many shipowners’ current businessmodels: volatility and asset play. This makes it imperative to createvalue beyond the vessel.
General Review and Outlook |
Shipping Market Review – May 2018 12
VALUE BEYOND THE VESSELThe role of the digital shipping companies
We believe that the next generation of ships will be super-connectedvessels designed to harness the value of a digital shipping industry.The data pool that is generated by moving cargo from A to B andoperating the vessels is likely to be the indispensable ingredient thatenables an enhanced value proposition. We call it VALUE BEYOND THE
VESSEL. This is the third step towards value creation in the digitalshipping industry. Shipping data will become a currency of the digitalecosystem, especially when it is combined with multiple sources fromoutside the industry in real time.
To illustrate our argument, let us look at the trends shaping the retailsector. We all know how traditional retailers are struggling to competewith digital players such as Amazon. These players’ entry has alreadychanged the retail landscape.
The digital players view transactions as part of a consumer’s journeythrough time, and not simply as one-off purchases. They aim to buildmultidimensional archetypes by collecting as much information aboutconsumers as possible. They manage to extract value from theaccumulation of transactions made from day to day, month to month,year to year, and ultimately the way those interact over a lifetime.Income and wealth certainly have predictive value for futurepurchases, but behaviour matters even more. The choice to eat morehealthily, for example, correlates to a likelihood of higher consumptionof physical fitness gear and services, and also to a more attractiveprofile for health and life insurers (which should result in moreaffordable insurance cover). The growing ability of data and analyticsto transform disparate pieces of information about a consumer’simmediate desires and behaviour into insight about the consumer’sbroader needs is unlocking significant value. That requiresinnumerable data points to be captured and then turned, withinmilliseconds, into predictive, actionable opportunities for both sellersand buyers. Advances in big data analytics, processing power andartificial intelligence are making such connections possible.
Imagine how this could look for the shipping industry which handlesclose to 90% of global trade. The seaborne movements of cargo
represents the best leading indicator for the global economy, in realtime.
Shipowners could play multiple roles in a new ecosystem. They could,for example, act as gateways, integrating global trade data across aseries of services to leverage network effects.
Today, we build upon the relationships between economic growth andseaborne trade volumes. We look at the journey from raw material toend-user product, the energy it takes to produce it and the finalexport on a containership, in isolated siloes. We consider most ofthese cargo movements as one-offs, even though many areinterlinked and to a certain extent in sequence, since they all reflectindividual parts of the global economy’s supply chain.
A vast pool of untapped potential is waiting to be unlocked if we canstart to view the supply chains of the global economy as integratedsystems that can be optimised further.
First movers will have the opportunity to transition from stakeholdersto orchestrators. Shipowners that manage to digitalise and leverageon their core competences could be well-positioned to tap into theunexplored value pool available to those who understand thisinterconnected ecosystem of the global economy.
General Review and Outlook |

Shipping Market Review – May 2018 13
REINVENTING THE OPERATING MODELStaying relevant for customers
The fourth step addresses how additional value can be created byreinventing the operating models. We have briefly touched upon thistopic but let us elaborate further.
In a digital industry, players from various parts of the ecosystem willsimultaneously coexist, actively partner and aggressively move tocapture market share from each another. We expect industry bordersto become less clear and the role of assets and the types ofcompetitor to change. For traditional shipping companies to succeed indigital marketplaces, they will have to stretch themselves beyond theircore capabilities. Competition will ramp up and established players willbe faced with more challengers from different directions.
The shipping industry is a service industry and needs to have agreater focus on its end-user customers. Some industries areforerunners in the digital transition. For example, the automotiveindustry has for a long time considered personal mobility, whichencompasses vehicle purchase and maintenance management,ridesharing, carpooling, traffic management, vehicle connectivity andmuch more. The individual pieces of the mobility puzzle are starting tobecome familiar, but it is their cumulative impact that truly shows thedegree to which industry borders are blurring. We expect a similardevelopment in the shipping industry to emerge within the nextdecade.
Shipping companies that lack strong customer connections run therisk of disintermediation and perhaps of becoming “back offices” withlimited headroom to create or retain economic surplus. For theshipping companies to occupy attractive roles in their ecosystem, theyneed to create seamless customer journeys.
Take Google’s launch of initiatives such as Chrome and Gmail orAlibaba’s introduction of enterprises such as Alipay and the financialplatform Yu’E Bao. These new ventures were not launched justbecause they wanted to extract additional sources of revenue fromtheir large customer bases (although they did succeed in doing so).They acted to help ensure that they would keep — and expand —those huge customer bases by growing their portfolios of products in
order to increase customer retention.
We are seeing similar initiatives among the forerunners in the newshipping ecosystem. We are seeing players from the class societieslaunching platforms for digital innovation and industry collaboration.We are beginning to see digital classification of ships. And we areseeing some of the major shipowners working to launch tradingplatforms that are powered by blockchain technology. Others areworking to cross-sell additional services to the customers who own thecargo they are transporting from A to B. One player has joined forceswith a technology company to take the next step in autonomousshipping by offering a complete value chain for autonomous ships,from design and development, to control systems, logistics servicesand vessel operations. These initiatives are examples of howestablished players in the shipping industry are working to reinventtheir operating models and create seamless customer journeys thatsolve customers’ pain points by capturing business from otherindustries.
Multiple players ranging from shipowners, engine manufacturers,equipment manufacturers and third parties from outside the industryor the peripheries of the shipping industry’s current ecosystem areworking to capture a central part of the future value. New businessmodels are being developed to facilitate this transition. Some playersare offering new products with a “pay-as-you-save” approach, whileothers are offering a more radical and potentially game-changingalternative to the existing industry architecture (e.g. ship-as-a-service). This is all very intriguing, but there is a challenge. When afew but successful digital forerunners (not necessarily shipowners)have established themselves in the marketplace, they will have left alarge number of the remaining players behind with few optionsavailable to catch up. This could spark a gradual but momentouschange to the competitive landscape.
We invite all customers to contact us to continue the discussionabout how these changes may impact their operations.
General Review and Outlook |

THE SHIPBUILDING MARKET
MAY 2018
Shipping Market Review – May 2018 15
OU
TLO
OK
SU
MM
AR
Y
POSITIVE
NEUTRAL
NEGATIVE
THE SHIPBUILDING MARKETPerspectives and key takeaways
New ordering increased markedly during 2017 compared with the lowlevels observed in 2016. Nevertheless, the Shipbuilding industry is stillin a difficult situation, as the orderbook for the majority of yards iscontinuing to decline and many are struggling to turn a profit.
Even though the industry has come a long way in terms of scalingdown capacity and becoming more consolidated, it has further to gobefore it reaches a more balanced level. Yard utilisation is still low at alittle more than 70%, and given the size of the orderbook, this willonly worsen in the coming years if ordering does not start to increase.
However, we expect ordering to remain subdued in the coming years.Overcapacity still prevails in many of the major shipping markets andseveral factors are complicating the decision to invest in new ships.Environmental regulations, fuel type considerations and new standardsfor digital ships are increasing the risk of ordering a new ship withcapabilities that will quickly become outdated.
As we have stated in previous editions of this report, we expect thenext wave of newbuilding orders to be sparked by the introduction ofnew standards for digital ships, which could end up intensifying theconsolidation process. Not all yards are equipped to build the nextgeneration of ships, and shipyards benefiting from government supportcould be the winners in this respect. Shipbuilding is in many countriesperceived as a strategically important industry, and governments,
Despite increased ordering, the globalorderbook is still trending downwards andthe majority of shipyards are struggling tostay in business. The consolidation processhas come a long way, but there is stillsome way to go. We expect furtherreductions in both active yard capacity andthe number of active yards. Still,newbuilding prices have started toincrease, which could continue in thecoming years as ordering becomesconcentrated at fewer yards.
especially those in China and South Korea, have made it clear thatthey will provide their domestic industries with the resources requiredto stay competitive.
In early 2018, the South Korean government announced an aidinitiative to support its ailing shipping and shipbuilding industries. Thisplan promises to support South Korean shipyards in building 200 shipsin the period up to 2020 by guaranteeing funds that cover 15-40% ofthe newbuilding costs. In many ways, this initiative summarises theproblems facing the Shipbuilding market today. Strong state interestsare preventing market forces from rebalancing the market and areprolonging the pain for both the shipping and Shipbuilding industriesby keeping both in a state of overcapacity.
Competition in the industry has also been intensified by the fact thatChina’s state-owned yards have started to claim larger market sharesacross a broader range of vessel types. The Chinese governmentwants its state-owned shipbuilders to become more dominant in thehigh-end segments, for example Cruise, which is strongly challengingthe niche market enjoyed by European shipyards until now.
Some yards could see improved profit margins this year, but there willnot be a broad-based recovery. Close to half of active newbuildingyards have not received any new orders during the last 18 months andmany will run out of orders this year. We expect large parts of theindustry to continue to struggle to secure enough orders to stay inbusiness.
Nevertheless, newbuilding prices could continue to edge up slightly asbuilding material costs increase and contracting becomes concentratedat fewer yards. We expect the difficult market conditions and theconsolidation of the industry to continue in the next couple of years.
The Shipbuilding market |

Shipping Market Review – May 2018 16
Apart from a short-lived increase towards the end of 2017, the globalorderbook has continued to shrink. By April 2018, it had dropped 7%year-on-year to just under 77 million cgt and just over 3,000 ships,the lowest level since 2004. The orderbook is split between 460 yards,150 of them second-tier yards1 scheduled to deliver their last ordersbefore the end of 2018. Japan’s orderbook experienced the biggestdrop, declining 20% year-on-year, followed by South Korea which sawits orderbook decline by 9%. China managed to keep its orderbookconstant, while Europe’s grew by 8%.
The declining orderbook continues to put pressure on global ordercover which has come down to 1.7 years from 1.9 years at the startof 2017. First-tier yards – those that have received new orders in thelast 18 months – have average order cover of 1.8 years and second-tier yards 1.3 years. South Korea and China have experienced amarginal improvement in their average order cover, due to a
combination of higher contracting towards the end of 2017 and adecline in the countries’ active yard capacity. Japan’s order cover hascontinued its decline, which has lasted more than two years. Europe’sorder cover has also experienced a slight decline, but it remainsaround three years, significantly above any of the other shipbuildingregions, due to the large increase in Cruise ordering.
The average newbuilding price has continued its upward trend andhas risen 5% since April 2017. The largest price increase has occurredin the Bulk segment, followed by the Container and Tanker segments.Gas Carrier prices have continued to decline. The higher prices havebeen driven by stronger demand, fewer yards attracting orders and asignificant increase in raw material prices, which has challenged yardprofitability.
THE SHIPBUILDING MARKETThe orderbook and newbuilding prices
Source: Clarksons, Danish Ship Finance
SHIPBUILDING ORDERBOOK - STOCK AND FLOWS (MILLION CGT) DEVELOPMENT IN THE NEWBUILDING PRICE AND ORDER COVERS
30
40
80
0
-80
-40
90
60
120
150
2013 2015 2017 2018201620142012
EuropeChina RoWJapanSouth KoreaOrderbook
2016
0
2018 201920172012 201520142013
200
100
0
4
3
2
1
150
50
China Japan Newbuilding priceEuropeSouth Korea
Orderbook >><< Contracting
<< Deliveries
Newbuilding price (index) >><< Order cover (years)
The Shipbuilding market |
1 Shipyards that have not received any new orders in the last 18 months

Shipping Market Review – May 2018 17
THE SHIPBUILDING MARKETContracting and yard capacity
The decline in the orderbook has occurred despite an uptick incontracting activity. New orders amounting to 26 million cgt wereplaced in 2017 and another 6 million cgt in the first quarter of 2018,the majority for Tankers and Bulk vessels. Contracts are still beingplaced at fewer and fewer yards. Around 210 different yards attractednew orders in 2017, and 55% of total contracting was placed at 15different yards spread across China, South Korea, Europe and one inVietnam. No Japanese yard managed to attract enough orders to placeit in the top 15.
Aside from Europe, which in 2017 and the first quarter of 2018attracted new orders equal to 118% of its annual active capacity,China was the best-performing shipbuilding nation. China attractednew orders equal to 74% of its annual active capacity. Japanese yardshad a difficult year and only attracted new orders amounting to 24%of its annual active capacity, and a growing share of Japanese yard
capacity has less than one year of order cover left.
The higher contracting activity has not been sufficient to remove theovercapacity from the industry, and global active yard capacity in2018 is estimated to have declined by around 3% from the 2017 levelto 45 million cgt, and the number of active yards has dropped from580 to 490 yards. While active second-tier yard capacity contracted byaround 30%, active first-tier capacity actually expanded by 6%,primarily due to an increase in Chinese first-tier capacity of 13%.Hence, the two-tier structure is becoming more pronounced, and thefirst–tier yards are now accountable for 82% of active capacity, upfrom 76% at the end of the third quarter of 2017. The number ofsecond-tier yards is dropping fast and has in 2018 been reduced by140 to only 230 yards. The group of first-tier yards, on the otherhand, has grown by 20 yards in the same period and now accounts forjust over half the number of active yards.
Source: Clarksons, Danish Ship Finance
FIRST AND SECOND-TIER YARD CAPACITY ACTIVE YARD CAPACITY IN 2018 (MILLION CGT)CONTRACTING - 2017 AND Q1 2018 (MILLION CGT)
0
16
12
8
4
JapanSouth Korea
67%
China
74% 24% 118%
RoW
54%
Europe
OffshoreContainer
Bulk Gas TankerOthers ex. Cruise
Cruise
24%
China
100%
76%
RoW
70%
Global capacity
30%
Europe
77%
Japan
75%82%
18%25% 23%
South Korea
First-tier capacitySecond-tier capacity
100%
75%
50%
25%
0%
24
0
18
6
12
1-2
40
270
150
20
2-30-1 3+
Japan RoWEuropeSouth KoreaChina
- No. of yardsShare of annual active capacity
The Shipbuilding market |

Shipping Market Review – May 2018 18
The outlook is still difficult for large parts of the Shipbuilding industry.Even though contracting has increased, it is still not enough to utiliseactive global yard capacity or to increase profit margins meaningfully.40% of the orderbook is scheduled to be delivered before the end of2018, and assuming 80% of orders scheduled for delivery in theremainder of 2018 are actually delivered, global yard utilisation willend up at around 73%, the same level as in 2017. Applying the sameassumption to the orderbook for 2019 would push yard utilisationdown towards 50%. Hence, there is still significant overcapacity in theindustry relative to the current orderbook, and if no new orders areplaced or no existing orders are postponed, our estimates suggestthat global yard capacity will be reduced by an additional 5% in 2019and the number of active yards halved.
The South Korean yard industry is especially vulnerable if contractingdoes not pick up. Even if all South Korean orders scheduled to be
delivered in 2018 are delivered on schedule, yard utilisation will dropto 68% in 2018 and 54% in 2019 – by far the lowest of all the majorshipbuilding markets. The Chinese orderbook is currently capable ofutilising 94% of its domestic active capacity in 2018 and 70% in 2019.This might explain why the South Korean government has found itnecessary to launch its controversial aid initiative.
New ordering and postponement of orders will ensure that the numberof yards and yard utilisation do not drop that low, but we expect thatmore excess capacity will have to be cut before the industry reachesan optimal size. The 150 second-tier yards scheduled to deliver theirlast orders before the end of 2018 are obvious candidates for closure,as are the 60 first-tier yards also scheduled to empty their orderbooksthis year.
THE SHIPBUILDING MARKETThe market outlook
Source: Clarksons, Danish Ship Finance
ORDERBOOK BY DELIVERY YEAR (MILLION CGT) DEVELOPMENT IN ACTIVE YARD CAPACITY (MILLION CGT)
15
45
30
0
60
2020
18%
33%
2018 (Q2-4)
3%
2019 2022
5%
40%
2021
RoWChina JapanSouth Korea Europe
Share of orderbook
40
20
80
60
0
Second-tier capacityFirst-tier capacity
770
480
580
690
240
1,180
900
980970
1,0501,080
1,140
880
1,190
OrderbookDeliveriesNo. of yards
2006 2007 2008 2009 2010 2011 2012 2013 2014 2015 2016 2017 2018 2019
The Shipbuilding market |
Shipping Market Review – May 2018 19
The Shipbuilding industry in China has experienced a rapiddevelopment over the last 15 years. Many new shipyardspopped up around the time of the financial crisis, focusing onbuilding cheap and simple vessel types, primarily Bulk vessels.Many of these yards have already exited the industry again anda more consolidated and increasingly state-sponsored industryhas emerged, with ambitions to build more complex vesseltypes in the future.
The severe overcapacity in many of the major shipping markets hastaken its toll on the Shipbuilding industry, and competition hasincreased among shipyards. To make matters worse, China has begunto challenge the status quo by establishing itself as a builder of morecomplex vessel types, a role previously reserved for Europe, Japanand South Korea. In 2015, the Chinese government launched its“Made in China 2025” plan, aimed at upgrading its domesticindustries, including Shipbuilding. By 2025, Chinese yards should bemarket leaders in building high-tech ships and maritime equipment,and a larger share of components should be produced domestically.Given the oversupply of yard capacity and the relatively low demandfor new vessels, this is expected to intensify competition among themajor Shipbuilding nations.
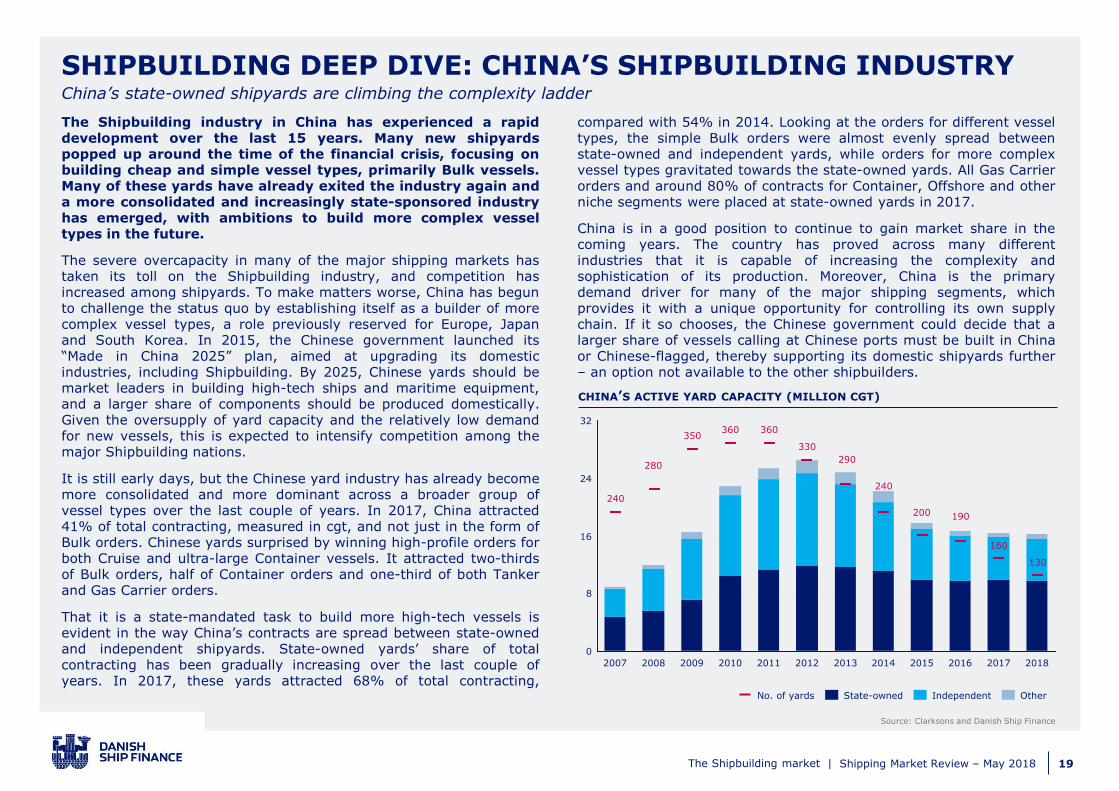
It is still early days, but the Chinese yard industry has already becomemore consolidated and more dominant across a broader group ofvessel types over the last couple of years. In 2017, China attracted41% of total contracting, measured in cgt, and not just in the form ofBulk orders. Chinese yards surprised by winning high-profile orders forboth Cruise and ultra-large Container vessels. It attracted two-thirdsof Bulk orders, half of Container orders and one-third of both Tankerand Gas Carrier orders.
That it is a state-mandated task to build more high-tech vessels isevident in the way China’s contracts are spread between state-ownedand independent shipyards. State-owned yards’ share of totalcontracting has been gradually increasing over the last couple ofyears. In 2017, these yards attracted 68% of total contracting,
compared with 54% in 2014. Looking at the orders for different vesseltypes, the simple Bulk orders were almost evenly spread betweenstate-owned and independent yards, while orders for more complexvessel types gravitated towards the state-owned yards. All Gas Carrierorders and around 80% of contracts for Container, Offshore and otherniche segments were placed at state-owned yards in 2017.
China is in a good position to continue to gain market share in thecoming years. The country has proved across many differentindustries that it is capable of increasing the complexity andsophistication of its production. Moreover, China is the primarydemand driver for many of the major shipping segments, whichprovides it with a unique opportunity for controlling its own supplychain. If it so chooses, the Chinese government could decide that alarger share of vessels calling at Chinese ports must be built in Chinaor Chinese-flagged, thereby supporting its domestic shipyards further– an option not available to the other shipbuilders.
SHIPBUILDING DEEP DIVE: CHINA’S SHIPBUILDING INDUSTRYChina’s state-owned shipyards are climbing the complexity ladder
Source: Clarksons and Danish Ship Finance
CHINA’S ACTIVE YARD CAPACITY (MILLION CGT)
24
0
32
16
8
290
201220112010 2013
330
360
2007
200
2009
350
240
190
20182016
130
2014 2015 2017
160
240
2008
280
360
Independent OtherState-ownedNo. of yards
The Shipbuilding market |

THE CONTAINER MARKET
SHIPPING MARKET REVIEW – MAY 2018

Shipping Market Review – May 2018 21
OU
TLO
OK
SU
MM
AR
Y
POSITIVE
NEUTRAL
NEGATIVE
THE CONTAINER MARKETPerspectives and key takeaways
For a long time, many liner operators have pursued a strategy of costleadership, which has resulted in larger and more efficient ships beingordered. This has spiralled the industry into severe overcapacity,creating pressure on freight rates. The intense focus on costs hascaused the industry to lose sight of its core value proposition.
Despite massive overcapacity, primarily among the bigger vessel sizes,some liner operators are still focusing on building larger vessels andcutting marginal costs. More new orders for Ultra Large Containervessels were placed in 2017. Some of these were replacement ordersfor older, smaller and less efficient vessels, while others were placedby liners which deemed it necessary in order to stay competitive. Weare no experts in liner economics, but we find it difficult to understandthese investment decisions. Two critical assumptions must have beenmade for the calculation of marginal costs to make economic sense:first, that the vessels would have high utilisation, and second, thattrade patterns would remain unchanged. Both assumptions are highlyuncertain, in our view, and these orders may end up prolonging thelow freight rate environment for all market players.
However, there are examples of liner operators that have begun toreassess how value is created in the Container industry. Their focus isshifting from lowering the cost per teu moved to addressing customerpain points, partly by digitalising several aspects of their operations.
Relatively strong demand growth has liftedbox rates and secondhand prices.However, the short-term outlook isclouded by a large inflow of new vesselswhich are likely to add to the currentovercapacity among the larger vessels.Liner companies are struggling not tobecome price takers in an oversuppliedmarket. Some have begun to pioneer adigital transition which may require areinvention of their operating model.
WHERE WE ARE IN THE FREIGHT RATE CYCLE
Some of the big liner operators are building integrated solutions fortheir customers, no longer only moving containers from port to portbut from origin to destination. Some are even trying to establishthemselves as a one-stop shop, handling all customers’ needs relatedto shipping a product from A to B, from trade financing and insuranceto transportation.
This is an ambitious strategy that is challenging the traditional mindsetof many liner operators by blurring the borders of the industry, therole of assets and the types of competitor. However, if they succeed, ithas the potential to increase the liner operators’ revenue per teumoved and make them less dependent on box rates.
The consequences for tonnage providers are uncertain. They havesuffered the most from the growing oversupply, as liner operatorshave been able to establish alliances to optimise the use of ownedcapacity. Even though timecharter rates saw a significant increase in2017, they are still low and we are not convinced that they willcontinue to rise. While it is true that the liner operators’ new businessmodels could become more asset-light, we expect that the tonnageproviders of tomorrow will have to be larger and more flexible with thenecessary financial strength to function as reliable counterparts for theliner operators.
Source: Danish Ship Finance
Tonnage providers
Liner operators
The Container market |

Shipping Market Review – May 2018 22
After a difficult year in 2016, box rates found a higher and morestable level in 2017, owing to a strong rebound in demand and thesupply discipline exercised by liner operators last year. Although thefourth quarter saw rates fall back as this discipline faltered, whichcontinued into the first quarter of 2018, the average box rate out ofChina still ended up at index 820 in 2017 and index 810 in the firstquarter of 2018, up from index 713 in 2016. The average index valueover the last 15 years has been 1,000, and thus average box rates arestill low in a historical context.
Timecharter rates experienced a significant increase towards theend of the first quarter of 2017, when liner alliances started toreshuffle their fleets, and they have since continued to trend upwards.By April 2018, the average timecharter rate was up 33% year-on-year. The largest increase was for Feeder vessels of around 1,700 teu,for which the 1-year timecharter rate rose by 58%.
By April 2018, the average Container newbuilding price hadincreased by 12% compared with the start of 2017. This was primarilydriven by the Feeder segment, which saw prices grow by more than15% in the period. Newbuilding prices for vessels over 15,000 teuexperienced a small decline.
The secondhand market was very active in 2017 and the averagesecondhand price went up by 69% in the period from the start of2017 to April 2018, indicating that the market regained some of itsoptimism. The better sentiment was cemented by strong salesactivity, which increased markedly in 2017 and reached the highestlevel ever recorded, both in terms of teu and number of vessels sold.310 vessels with a combined capacity of 1.1 million teu changedhands during the year, the majority of vessels below 6,000 teu. Salesactivity slowed down in the first quarter of 2018, with 65 vesselsamounting to 0.13 million teu reported to have been sold.
THE CONTAINER MARKETFreight rates and ship prices
Source: Clarksons, Danish Ship Finance
AVERAGE BOX RATE OUT OF CHINA (INDEX) SECONDHAND PRICES – 5 YEARS (USD MILLION)
2018201720162014 201520132012 2019
1,200
400
0
1,600
800
201120102009
-11%
CCFI
120
90
2019
0
201820172016201520142013
60
30
2012201120102009
15
48
15
92
3,400 teu 13,000 teu8,800 teu1,700 teu
The Container market |

Shipping Market Review – May 2018 23
THE CONTAINER MARKETSupply-side development
The Container fleet ended up growing by close to 4% in 2017, as thedelivery performance increased and scrapping declined. The fleet ofvessels over 8,000 teu grew by 11%, while the fleet of vessels below8,000 teu declined by 3%. The effective fleet growth was higher,however, because the share of vessels lying idle declined significantlyfrom 7% at the start of 2017 to around 2% at the end of the year.The fleet grew another 1.5% in the first quarter of 2018.
Fewer orders were postponed in 2017, bringing the deliveryperformance to 75%. Deliveries reached 1.2 million teu in 2017 and0.35 million teu in the first quarter of 2018, while scrapping droppedto 0.42 million teu and 0.02 million teu, respectively. The OldPanamax segment once again accounted for the majority of thevessels scrapped, followed by the Feeder segment.
The lower scrapping activity led to an increase in the averagescrapping age, which went up from 18.5 years in 2016 to 21 years in
2017. The average scrapping age 3,000-5,999 teu vessels, however,continued to decline, dropping to 16 years in 2017. Hence, theaverage scrapping age is still well below 25 years and secondhandprices of older vessels in the smaller segments are still being affectedby shorter economic lifetimes.
Contracting activity also increased, especially in the second half of2017 and into the first quarter of 2018. New orders amounted to 0.74million teu in 2017 and 0.24 million teu in Q1 2018. Measured byvessel size, these were primarily for ships larger than 15,000 teu,while Feeder vessels accounted for the highest number of vesselsordered. However, this was not enough to stop the orderbook fromdeclining and the orderbook-to-fleet ratio for the Container fleetdropped to 13% in April 2018, from 16% at the beginning of 2017.Tonnage providers’ share of the orderbook has declined significantlyover the last two years, and is now one-third of the total orderbook.
Source: Clarksons, Danish Ship Finance
FLEET DEVELOPMENT (MILLION TEU) ORDERBOOK BY OWNER TYPE (THOUSAND TEU)AGE DISTRIBUTION OF FLEET (MILLION TEU)
2
6
8
0
4
15-20 25+ Orderbook
13%
4%
1%
20-25
9%
0-5
31%
10-155-10
23%
33%
Percentage of fleet
8-11,999 teu+15,000 teu FeederOld Panamax12-14,999 teu 3-5,999 teu6-7,999 teu
-1
1
0
3
2
2013
5%
6%
2017
1%
20192015 2020
8%
4%
2018
7%
2014
4%
2016
3%
Annual fleet growth Deliveries
Scrapping
2013 20152012 2016201420112010
0
1,600
3,200
2,400
800
201920182017
Orderbook - Charter owners Orderbook - Operators
The Container market |

Shipping Market Review – May 2018 24
PositiveNegative ✓
The short to medium-term outlook for the Container industry willcontinue to be characterised by oversupply and will be contingent onthe delivery schedule of the orderbook.
The orderbook is front-loaded and many orders for large vessels arescheduled to be delivered in the first half of 2018, which is expectedto put downward pressure on freight rates. The outlook for 2018 hasimproved over the last three months, however, as the delivery datesfor a significant share of orders have been postponed. At the end of2017, nominal fleet growth for 2018 was scheduled to reach 8%. ByApril 2018, this had been reduced to 6%.
Nevertheless, many vessels are still due to be delivered over the nexttwo years and more vessels are expected to come off-hire as chartercontracts run out. Some of the new vessels being delivered areexpected to be replacements for older and less efficient vessels.Combined with the implementation of the IMO 2020 regulation, this
could keep scrapping activity relatively strong in the coming years.However, it does not change the fact that the vessels on order aresignificantly larger, on average, than those they are likely to replace.
Stronger global economic growth is expected to keep demand growthat around 4-5% per year in the next couple of years, even thoughsome of the effects driving demand in 2017, such as restocking, arenot expected to be repeated.
Hence, despite the large orderbook, the oversupply could begin todecline from 2019 onwards, provided that contracting stays relativelymuted. This will support box rates and potentially also graduallyimprove the outlook for the tonnage providers, although the newdigital initiatives being introduced by liner operators could slowly startto change the structure of the industry and create demand for a newtype of tonnage provider.
THE CONTAINER MARKETThe market outlook
The global economy has strengthened and growth is expected to remain robust, creating the foundations for strong Container demand.
As interest rates begin to rise, consumer demand could be affected negatively by a reduction in disposable income, which could dampen Container demand growth.
Protectionism has increased around the world, and the globalisation process is slowlydecelerating. With time, this could shorten supply chains and lower Container demand.
Robotics and 3D printing minimise the role of labour in the production process, enabling production closer to end-markets, shortening supply chains and reducing Container lifts.
More regionalised production could strengthen short-sea volumes and support demand for Feeder vessels.
Global economic growth
Interest rate increases
Protectionism
Regionalisation of production, part 1
Regionalisation of production, part 2
FORCES AT WORK IMPACTING THE DEMAND OUTLOOK
✓
✓
The Container market |

Shipping Market Review – May 2018 25
CONTAINER MARKET DEEP DIVE: IS THE GAME CHANGING?The digital transformation of the liner business
Consolidation and network optimisation have been the mainthemes in the Container industry during the last couple ofyears. Liner operators have merged and established alliances inorder to increase utilisation in an oversupplied market. This islikely to continue in the coming years, but emerging digitalbusiness models may begin to change the industry dynamics.
Many of the liner operators are struggling not to become low-costproviders of commoditised Container services. To avoid this, leadingliner operators have changed their approach, from being cost leadersto becoming digital forerunners in the Container industry. Thesedigitalisation efforts have the potential to create cost savings and,combined with advanced analytics, to discover and quantify tradingopportunities, optimise capacity utilisation and possibly createopportunities for generating value beyond the vessel.
There has been a lot of interest around this the last couple of years –and it is not only liner operators chasing these opportunities. We arealso seeing players from outside the shipping industry, from freightforwarders to digital players and start-ups, racing to obtain their shareof these value creators.
It will not be an easy transition and they all need to overcome thesame barriers: few of the core activities of a liner company arecurrently digitalised. Some activities are in the process of beingdigitalised, such as box tracking, empty container repositioning,document management, network design and dynamic pricing, butmore work needs to be done.
The goal is to identify the pain points of the current operations and toleverage on the inherent capabilities of the Container industry. Thiscould be done by adopting an ecosystem approach rather than thetraditional industry perspective. For liner operators, this would requirea significant change in how they define their role in the economy.Currently, many liner operators act primarily as a utility, transportinggoods from port to port. Many have a passive and limited relationshipwith end-user customers and are at risk of becoming “back offices”with limited scope to create value.
We believe that the digital forerunners will gradually reinvent theiroperating models in order to develop an edge in this highlycompetitive market. In a world of digital ecosystems, where theborders of industries are less clearly defined, the role of assets is lessimportant and the types of competitor have changed, digitalisation isexpected to create opportunities for further cost reductions, strongercustomer relationships and eventually additional revenue streams. Intime, these additional sources of revenue may actually become thekey drivers of value, since low freight rates create little, if any, valuefor asset owners.
Take trade financing as an example. If a liner operator decides to offertrade financing to all its customers, thereby leveraging on a strongcapital market access, it may actually generate higher revenues perunit moved than its competitors.
In the competitive Container market, we believe it will be mission-critical for players to defend their position while simultaneouslypursuing opportunities across other sectors before others get there.Within a decade, companies could define their business models not byhow they play against traditional industry peers but by how effectivethey are in competing within rapidly emerging ecosystems comprisinga variety of businesses from dimensionally different sectors.
In this scenario, consolidation and owning the largest vessels with thelowest cost per teu moved become less important. If the role of assetsstarts to diminish in terms of revenue generation, it might lead lineroperators to pursue a more asset-light business model. However, thatdoes not change the fact that the industry still needs the ships. Thequestion is, though, who will own them. Many of the traditionaltonnage providers have suffered huge losses over the last ten years,and few have the scale or the financial resources to transition into adigital future as reliable counterparts for the liner operators. This maycall for an updated business model, where the ships (and the datathey generate) are offered as a service.
The Container market |

THE DRY BULK MARKET
SHIPPING MARKET REVIEW – MAY 2018

Shipping Market Review – May 2018 27
OU
TLO
OK
SU
MM
AR
Y
POSITIVE
NEUTRAL
NEGATIVE
THE DRY BULK MARKETPerspectives and key takeaways
The Dry Bulk market is still being influenced by an oversupply ofvessels, but the surplus is shrinking, as demand has rebounded andthe orderbook is at one of the lowest levels in 12 years.
A broad global economic upswing, cemented by stronger industrialproduction, supported the Dry Bulk market in 2017. Relatively highfleet growth of 3% was more than offset by an increase in distance-adjusted demand of 5%, driven by growth across most commoditygroups but primarily iron ore and steam coal volumes.
In April 2018, the Baltic Dry Index (BDI) reached index 1,350, stillbelow the long-term median index value of 1,600 but markedly abovethe all-time low from early 2016 of index 300.
Stronger market sentiment was accompanied by increasing interest inbuying new vessels. Dry Bulk investors placed more than 300 neworders in 2017, up from around 60 in 2016, even though the gapbetween newbuilding prices and secondhand prices remainedsubstantial. The increased ordering activity does not necessarily meanthat the general market regained its confidence, though. A closer lookat the orders placed in 2017 and Q1 2018 shows that 36% were fromChinese, South Korean or Japanese owners at domestic shipyards.Hence, some of the orders might reflect an attempt to support thecountries' struggling shipbuilding industries rather than growingdemand among shipowners for new vessels.
The relatively small orderbook combinedwith healthy demand expectations for thenext few years could ensure that the DryBulk market continues to strengthen in theshort term. However, we have notchanged our view on the unsustainablenature of the Dry Bulk demand drivers.Significant changes in China’s demandcould happen any time in the next threeyears, potentially reducing Dry Bulkvolumes.
WHERE WE ARE IN THE FREIGHT RATE CYCLE
The flat development in secondhand prices of younger vessels over thelast 12 months might indicate that Dry Bulk investors have becomeapprehensive about the future market, and that they are unwilling todrive prices up until the market upswing has taken root more solidly.Older vessels, on the other hand, have experienced bigger priceincreases, driven by higher scrap prices and lower scrapping activity,which has reversed the declining trend in the vessels’ economiclifetimes.
It seems as though the freight market is moving in the right directionand could continue to do so in the coming years, not least becausemarket players have begun to apply more caution to their futuremarket expectations. It goes without saying that stable Chinesedemand is a prerequisite for this improvement to be sustained. We stillbelieve the reform agenda in China could make a dent in Dry Bulkvolumes at some point, but the timing is difficult to determine. In ourview, this could happen any time within the next one to three years,and given the oversupply still present in the market, it limits howmuch higher the current cycle can go. Thus, we do not necessarilyexpect freight rates to rise much further from the current levels –especially not in the larger segments.
Source: Danish Ship Finance
Panamax
HandymaxHandysize
Capesize
The Dry Bulk market |

Shipping Market Review – May 2018 28
Spot rates experienced a relatively strong start to 2018 despite theseasonal first-quarter lull in activity. The BDI bottomed at index 1,125in February 2018, compared to index 759 in February 2017. By theend of April, the BDI was at index 1,350. Strong Chinese demand forcoal and iron ore, supplemented by a general strengthening of globaleconomic activity, has supported freight rates. Timecharter rateshave continued to gradually improve, and by April, all segmentsexcept Capesize were close to the peak levels from 2014.
Newbuilding prices started to rise during 2017 as ordering activityand prices of input materials increased. By April 2018, the averagenewbuilding price was up by 10% compared with at the start of 2017.Secondhand prices have remained relatively stable since the secondquarter of 2017. Nevertheless, by April 2018, the average secondhandprice was up by 13% year-on-year, led by increases in the prices ofolder vessels, which were supported by higher scrap prices and anincrease in vessels’ economic lifetimes. The average price of a five-
year-old Dry Bulk vessels increased 8% during the period.
The relatively low secondhand prices have kept sales activity strong,and around 580 vessels changed hands during 2017, 170 of them inthe Handymax segment. One-third of sales occurred in the firstquarter of 2017, when secondhand prices experienced rapid increases.As prices started to plateau, sales activity slowed down somewhat.Activity continued at a healthy pace in the first quarter of 2018, with110 vessels changing hands. The active secondhand market couldsuggest that Dry Bulk investors have regained confidence in themarket and believe the market has passed the bottom. However, theflat development in secondhand prices of younger vessels indicatesthat investors remain unsure how high the market will go in thecoming years.
THE DRY BULK MARKETFreight rates and ship prices
1-YEAR TIMECHARTER RATE (USD PER DAY) SECONDHAND PRICES – 5 YEARS (USD MILLION)
0
24,000
16,000
8,000
201920182017
32,000
201620152013 2014
+194%
11,375
18,000
14,07513,063
45
2014
30
2013 2017
60
2016
15
0
2015 20192018
19
+36%
34
1816
Panamax HandymaxCapesize Handysize
The Dry Bulk market |
Source: Clarksons, Danish Ship Finance

Shipping Market Review – May 2018 29
THE DRY BULK MARKETSupply-side development
Contracting increased in 2017 as market sentiment strengthened,with Capesize, Panamax and Handymax vessels in particular attractinginterest. Contracting for the year reached 37.3 million dwt, splitbetween 325 vessels, which was significantly more than the volumescontracted in 2015 and 2016. In the first quarter of 2018, another 7.4million dwt was contracted, primarily Capesize vessels.
Deliveries dropped to 38 million dwt in 2017, the lowest level since2008, reflecting a markedly lower orderbook. Fewer orders werepostponed or cancelled, and 67% of orders scheduled for delivery in2017 were actually delivered, compared to 53% in 2016. Demolitionactivity stayed subdued, and hence even though fewer new vesselswere delivered, the Dry Bulk fleet still grew by 3%. Only 14 milliondwt, or 220 vessels, were scrapped during 2017 and activity waned aswe approached the end of the year. This supported an increase in theaverage scrapping age, which grew by 1.5 years from around 23 years
in 2016 to 24.5 years in 2017. The only segment in which the averagescrapping age continued to decline was the Handymax segment, whichsaw a drop of around one year to 21.5 years in 2017, despite fewervessels being scrapped.
The fleet renewal potential, reflecting the relationship between theorderbook and the number of scrapping candidates in the fleet, hasimproved in the Handysize and Handymax segments over the lastyear, making them more resistant should demand growth be disruptedat some point in the coming years. The increased contracting activityin the Panamax and Capesize segments has, however, caused thefleet renewal potential in these segments to deteriorate, and there aretoo many ships on order compared to the number of natural scrappingcandidates in the fleets. The Capesize segment is especially vulnerablewith an orderbook-to-fleet ratio of 15% and 2.6 ships on order forevery ship in the fleet older than 20 years.
FLEET DEVELOPMENT (MILLION DWT) FLEET RENEWAL POTENTIAL (DWT)AGE DISTRIBUTION OF FLEET (MILLION DWT)
0
300
200
400
100
10%
2%
Orderbook25+15-20
7%
13%
43%
0-5 10-155-10 20-25
5%
31%
Percentage of fleet
80
40
0
-40
2%
3%
20162014 2020
2%
20152013
4%
6%
4%
2017 2019
3%
1%
2018
Annual fleet growth Deliveries
Scrapping
Orderbook / total fleet
Ord
erb
ook /
fle
et
>20 y
rs
0.8
3.2
2.4
1.6
0% 6%3% 15%
0.0
12%9%
Capesize
Handymax
Handysize
Panamax
The Dry Bulk market |
Source: Clarksons, Danish Ship Finance
HandysizeCapesize HandymaxPanamax Orderbook

Shipping Market Review – May 2018 30
PositiveNegative ✓
The conditions for a continued improvement in Dry Bulk marketfundamentals are in place, and we are cautiously optimistic about theshort-term outlook (one to three years). Even though the orderbook-to-fleet ratio has increased by a couple of percentage points duringthe last 12 months, it is still relatively low at 10%. Consequently, weexpect annual fleet growth to stay below 2% during the next threeyears after taking into account scrapping, postponements andcancellations of orders. Meanwhile, consensus is for nominal demandto grow by around 3% annually in the same period, creating thefoundations for the overcapacity in the market to be reduced evenfurther.
There are, however, some warnings signs that the demand outlookcould change, potentially even reducing seaborne trade volumes. Inthe short term, the joker for Dry Bulk demand is China, which, withina relatively short space of time, could change the market dynamics,
bringing freight rates under pressure, for example if the countrychooses to reimpose restrictions on coal imports or lowerinfrastructure investments. Our primary concern in this regard is thefact that Dry Bulk contracting activity has accelerated primarily in thelarger ship segments, which are most vulnerable to changes in China’sdemand pattern. We have to remember that around 75% of globalseaborne iron ore demand stems from China.
There are most likely rational explanations for most of the ordering wesaw in 2017 and at the start of 2018, but in our view, the uncertaintyover the demand outlook, new environmental regulations and thefuture requirements for ships makes it a very risky time to order newvessels. Fortunately, the way the market has developed over the last12 months suggests that investors have become more cautious intheir assessment of the market outlook.
THE DRY BULK MARKETThe market outlook
The attempt to cut industrial overcapacity while strengthening domestic industries could lower import demand from China’s heavy industries (i.e. iron ore, coal and minor bulk demand).
China’s plan to support infrastructure development along the ”new Silk Road” couldcounterbalance some of the effects of lower domestic infrastructure development.
The growing focus on lowering carbon emissions could create resistance to burning coal and lower seaborne demand.
Increasing use of batteries for vehicles and energy storage could create stronger demand for various metals (lithium, copper, etc.), which would support minor bulk demand.
If an increasing share of materials is recycled, reused or remanufactured, demand for rawmaterials will decline, affecting Dry Bulk demand negatively.
China’s reform agenda
The Belt and Road Initiative
The clean energy transition
Electrification of the global economy
Circular economic principles
FORCES AT WORK IMPACTING THE DEMAND OUTLOOK
✓
✓
The Dry Bulk market |
Shipping Market Review – May 2018 31
After three years of falling demand, seaborne steam coal tradereturned to growth in 2017, sparking market optimism and alarge increase in Panamax ordering. The main reasons for thiswere the return of Chinese imports and South Korea’s growingdemand. Despite this rebound and a number of optimisticforecasts, our stance on future seaborne steam coal demandhas not changed and we still see substantial downside risk.
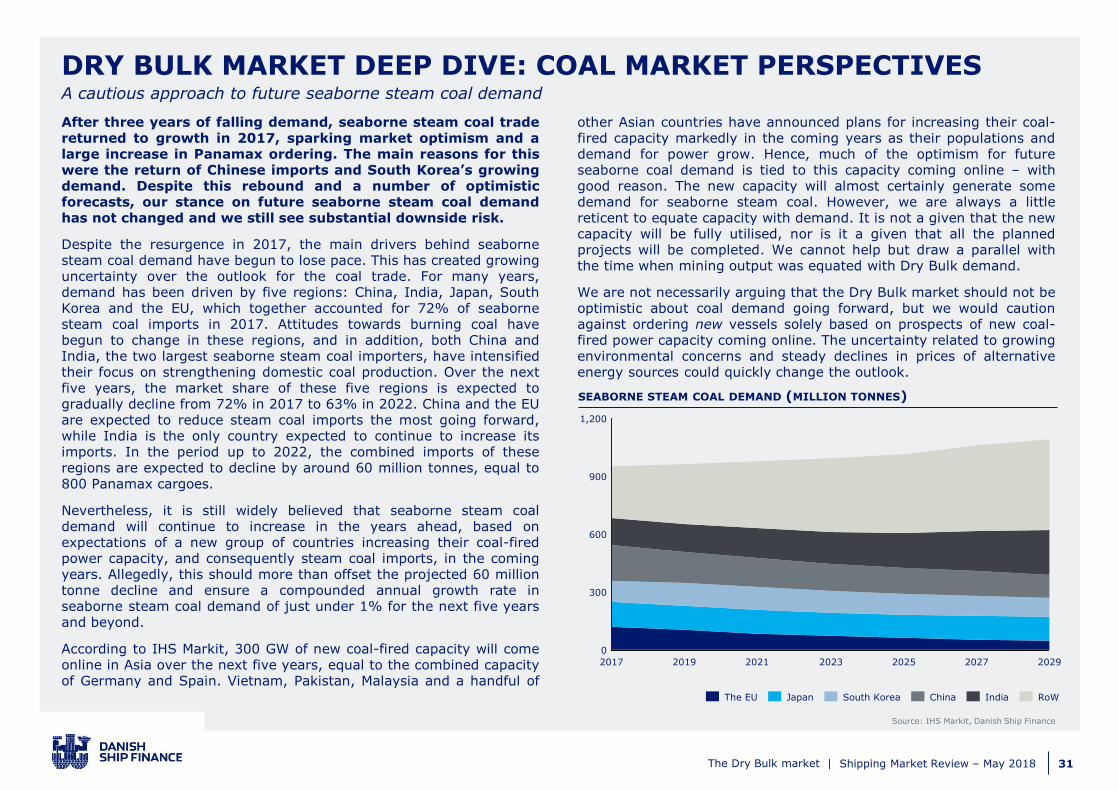
Despite the resurgence in 2017, the main drivers behind seabornesteam coal demand have begun to lose pace. This has created growinguncertainty over the outlook for the coal trade. For many years,demand has been driven by five regions: China, India, Japan, SouthKorea and the EU, which together accounted for 72% of seabornesteam coal imports in 2017. Attitudes towards burning coal havebegun to change in these regions, and in addition, both China andIndia, the two largest seaborne steam coal importers, have intensifiedtheir focus on strengthening domestic coal production. Over the nextfive years, the market share of these five regions is expected togradually decline from 72% in 2017 to 63% in 2022. China and the EUare expected to reduce steam coal imports the most going forward,while India is the only country expected to continue to increase itsimports. In the period up to 2022, the combined imports of theseregions are expected to decline by around 60 million tonnes, equal to800 Panamax cargoes.
Nevertheless, it is still widely believed that seaborne steam coaldemand will continue to increase in the years ahead, based onexpectations of a new group of countries increasing their coal-firedpower capacity, and consequently steam coal imports, in the comingyears. Allegedly, this should more than offset the projected 60 milliontonne decline and ensure a compounded annual growth rate inseaborne steam coal demand of just under 1% for the next five yearsand beyond.
According to IHS Markit, 300 GW of new coal-fired capacity will comeonline in Asia over the next five years, equal to the combined capacityof Germany and Spain. Vietnam, Pakistan, Malaysia and a handful of
other Asian countries have announced plans for increasing their coal-fired capacity markedly in the coming years as their populations anddemand for power grow. Hence, much of the optimism for futureseaborne coal demand is tied to this capacity coming online – withgood reason. The new capacity will almost certainly generate somedemand for seaborne steam coal. However, we are always a littlereticent to equate capacity with demand. It is not a given that the newcapacity will be fully utilised, nor is it a given that all the plannedprojects will be completed. We cannot help but draw a parallel withthe time when mining output was equated with Dry Bulk demand.
We are not necessarily arguing that the Dry Bulk market should not beoptimistic about coal demand going forward, but we would cautionagainst ordering new vessels solely based on prospects of new coal-fired power capacity coming online. The uncertainty related to growingenvironmental concerns and steady declines in prices of alternativeenergy sources could quickly change the outlook.
DRY BULK MARKET DEEP DIVE: COAL MARKET PERSPECTIVESA cautious approach to future seaborne steam coal demand
Source: IHS Markit, Danish Ship Finance
SEABORNE STEAM COAL DEMAND (MILLION TONNES)
300
1,200
900
600
0
202920192017 2025 202720232021
The EU China RoWIndiaSouth KoreaJapan
The Dry Bulk market |

GLOBAL OIL MARKETS
SHIPPING MARKET REVIEW – MAY 2018

Shipping Market Review – May 2018 33
The global oil market seems to be in balance. The current OPECproduction cut, coupled with geopolitical scuffles, has caused oil pricesto increase. Higher oil prices could trigger production increases butmay also hurt the surprisingly strong oil demand.
OPEC and ten producers outside the oil cartel, including Russia, havebeen holding back production by 1.8 million barrels per day. Theproduction cut is working to stabilise oil prices but is at the same timebenefiting the unconventional US oil production.
Global oil production is expected to increase by 2 million barrels perday up to 2020. A total of 14 million barrels per day will be added tothe global oil supply while existing production will deplete byapproximately 12 million barrels per day.
The conventional onshore oil industry produces roughly 60% of theworld’s oil. Production is declining, though. By 2020, conventional
onshore oil production is expected to be 0.54 million barrels per daylower than the current level. Still, OPEC is expected to have sparecapacity of approximately 2.7 million barrels per day in 2020.
The unconventional oil industry, which currently produces some 8.5%of the world’s oil, is expected to deliver 100% - 2 million barrels perday (excluding condensate and NGLs) - of the growth in global oilsupply up to 2020. This is primarily a US shale story.
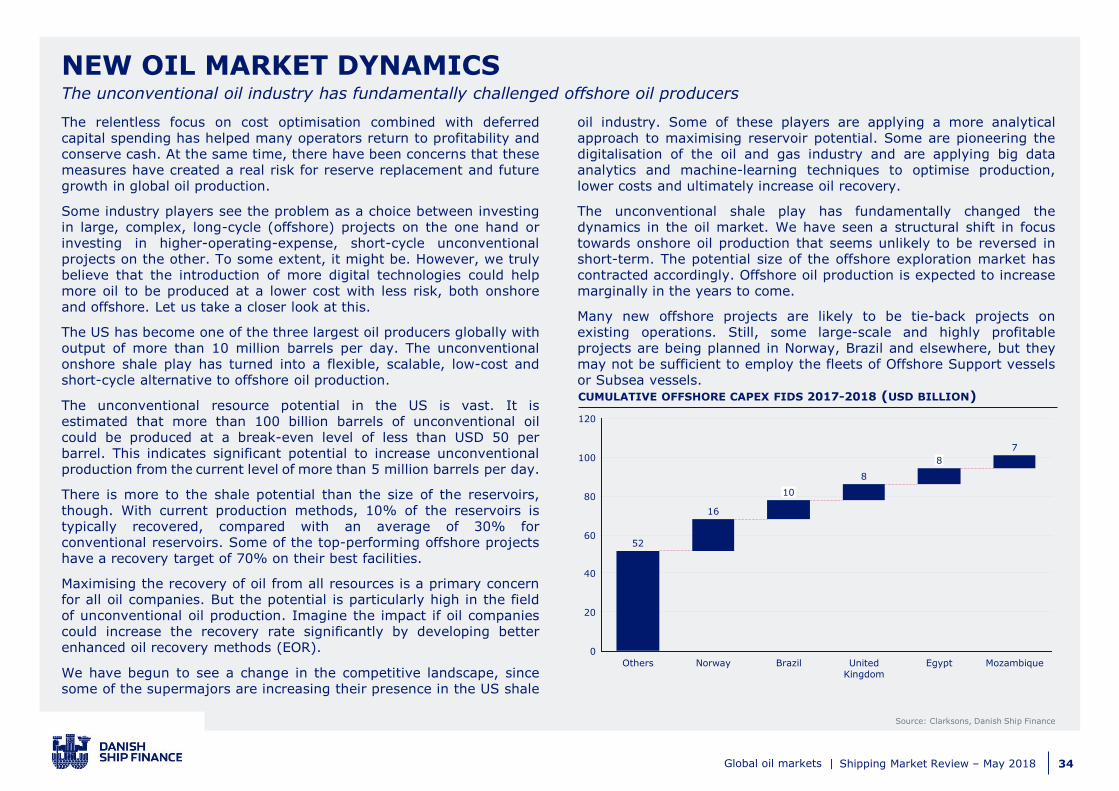
The offshore sector, which currently accounts for about one-third ofglobal oil supply, is expected to deliver 20% - 450,000 barrels per day- of the increase in global oil supply up to 2020. This is primarily aBrazilian story.
GLOBAL OIL MARKETSOil supply is running ahead of demand
GLOBAL BASE OIL PRODUCTION (MILLION BARRELS PER DAY) OPEC CRUDE SPARE PRODUCTION CAPACITY (MILLION BARRELS PER DAY)
100
80
60
40
20
0
2020 crude oil production
14
80
2018-2020 new production
2018-2020 depletion
12
2018 crude oil production
78 2
1
0
5
4
3
2020
2.72.9
2018 20192015
1.7
2.7
2016
2.1
2.4
2017
Source: IHS Markit, Danish Ship Finance
Global oil markets |
Shipping Market Review – May 2018 34
The relentless focus on cost optimisation combined with deferredcapital spending has helped many operators return to profitability andconserve cash. At the same time, there have been concerns that thesemeasures have created a real risk for reserve replacement and futuregrowth in global oil production.
Some industry players see the problem as a choice between investingin large, complex, long-cycle (offshore) projects on the one hand orinvesting in higher-operating-expense, short-cycle unconventionalprojects on the other. To some extent, it might be. However, we trulybelieve that the introduction of more digital technologies could helpmore oil to be produced at a lower cost with less risk, both onshoreand offshore. Let us take a closer look at this.
The US has become one of the three largest oil producers globally withoutput of more than 10 million barrels per day. The unconventionalonshore shale play has turned into a flexible, scalable, low-cost andshort-cycle alternative to offshore oil production.
The unconventional resource potential in the US is vast. It isestimated that more than 100 billion barrels of unconventional oilcould be produced at a break-even level of less than USD 50 perbarrel. This indicates significant potential to increase unconventionalproduction from the current level of more than 5 million barrels per day.
There is more to the shale potential than the size of the reservoirs,though. With current production methods, 10% of the reservoirs istypically recovered, compared with an average of 30% forconventional reservoirs. Some of the top-performing offshore projectshave a recovery target of 70% on their best facilities.
Maximising the recovery of oil from all resources is a primary concernfor all oil companies. But the potential is particularly high in the fieldof unconventional oil production. Imagine the impact if oil companiescould increase the recovery rate significantly by developing betterenhanced oil recovery methods (EOR).
We have begun to see a change in the competitive landscape, sincesome of the supermajors are increasing their presence in the US shale
oil industry. Some of these players are applying a more analyticalapproach to maximising reservoir potential. Some are pioneering thedigitalisation of the oil and gas industry and are applying big dataanalytics and machine-learning techniques to optimise production,lower costs and ultimately increase oil recovery.
The unconventional shale play has fundamentally changed thedynamics in the oil market. We have seen a structural shift in focustowards onshore oil production that seems unlikely to be reversed inshort-term. The potential size of the offshore exploration market hascontracted accordingly. Offshore oil production is expected to increasemarginally in the years to come.
Many new offshore projects are likely to be tie-back projects onexisting operations. Still, some large-scale and highly profitableprojects are being planned in Norway, Brazil and elsewhere, but theymay not be sufficient to employ the fleets of Offshore Support vesselsor Subsea vessels.
NEW OIL MARKET DYNAMICSThe unconventional oil industry has fundamentally challenged offshore oil producers
Source: Clarksons, Danish Ship Finance
CUMULATIVE OFFSHORE CAPEX FIDS 2017-2018 (USD BILLION)
20
0
100
80
120
60
40
MozambiqueNorway
8
8
10
United Kingdom
EgyptBrazil
16
Others
7
52
Global oil markets |

THE OSV MARKET
SHIPPING MARKET REVIEW – MAY 2018

Shipping Market Review – May 2018 36
OU
TLO
OK
SU
MM
AR
Y
POSITIVE
NEUTRAL
NEGATIVE
THE OFFSHORE SUPPORT VESSEL MARKETPerspectives and key takeaways
The strong production growth in the unconventional oil industry haslowered investors appetite for new offshore investments. The activeoffshore market has been scaled back accordingly. Many vessels areunemployed and seem unlikely to return to service.
Today, offshore operators are working to upgrade the alreadyadvanced market to the highest standards available. Operations arerapidly being digitalised to improve the already high oil recovery ratesfurther and to reduce costs.
This process is creating a two-tier market, and sub-standard vesselsare expected to leave the market. But even the largest high-standardvessels remain subject to oversupply and approximately one out offour vessels is currently laid up (one out of three in the overall OSVfleet). Charter rates are low for obvious reasons but has increasedmarginally in the past six months.
A large part of the advanced tonnage needs to be upgraded to a higherdigital standard during the next few years. Owners that are unable toupgrade their vessels may find it increasingly difficult to secureemployment for them.
Secondhand prices have remained weak, but newer more advancedtonnage is less exposed as owners are unwilling to sell their bestassets. The bid-ask spread is large and prices are therefore relatively
The market for Offshore Support Vessels isoversupplied since the strong productiongrowth in the unconventional oil industryhas lowered investors appetite for offshoreinvestments. Many vessels will need to exitthe market. We could be past the bottomof the cycle, but the overcapacity remainslarge. Any market recovery will thereforebe slow and will most likely not occurwithin the next year or two.
WHERE WE ARE IN THE FREIGHT RATE CYCLE
untested.
Demolition activity has increased significantly and 2018 could end upbeing a year of record-high scrapping activity. Scrapping of PSVvessels have increased, with 36 vessels scrapped since November. Inthe AHTS sector smaller vessels continue to be heavily exposed tooversupply.
We could be past the bottom of the cycle, but the overcapacityremains large. Any recovery in charter rates will therefore be slow andwill most likely not occur within the next year or two.
Still the very short-term market outlook for the second and thirdquarter of 2018 looks relatively promising. The rig fleet for theNorwegian Continental Shelf is virtually sold out for the summer whichindicate that demand for very larger AHTS vessels (20,000 bhp+)should be good. Should Russian Arctic activities materialise it couldend up utilising large parts of the North Sea fleet over the summer.
Source: Danish Ship Finance
OSV
The OSV market |

Shipping Market Review – May 2018 37
Charter rates continue to be challenged but are improving slightly.For long-term charters, there have been PSV fixtures at NOK 125,000per day, approximately NOK 75,000 per day above OPEX. The spotmarket has seen periodic spikes, but these have not been substantialenough to have a significant impact on earnings. Since our last report,several US-based OSV companies have exited Chapter 11proceedings. Most of these companies are now back in operation butwith significantly lower debt levels, enabling them to compete withconsiderably lower break-even rates.
Secondhand prices continue to be under pressure, although marketliquidity has increased marginally. The increased transaction activityhas predominantly been from players trying to enter the market at alow point for short-term profits. We are beginning to see a cleardifference between high-end tonnage and less advanced vessels. MostNorth Sea owners are selling non-core vessels for often negligible
values. In general, vessels older than ten years – representing one-third of the fleet – are at risk of substantial value reduction.Shipowners only seem willing to upgrade younger vessels that arecandidates for long-term contracts. While this is completely logical inoversupplied markets, it jeopardises the values of all vessels that havenot been upgraded.
Newbuilding prices for OSV vessels are relatively untested but areunlikely to reflect their current earnings potential. For large AHTSvessels (12,000 bhp+), no newbuilding orders at all have been placedsince 2016. In the PSV segment, only one Brazilian-built PSV and twomedium-sized PSVs for the Indian market have been ordered for acombined USD 24 million.
THE OFFSHORE SUPPORT VESSEL MARKETFreight rates and ship prices
Source: Clarksons, Danish Ship Finance
TIMECHARTER RATES OSV VESSELS – GLOBAL INDICATOR (USD PER DAY) SECONDHAND PRICES LARGE OSV VESSELS – 5 YEARS (USD MILLION)
16,000
40,000
8,000
0
48,000
32,000
20192018201720142013 20162015
24,00026,065
21,025
+16%
8,385
11,445
PSV 4,000 dwtAHTS 200t BPAHTS 240t BP PSV 3,200 dwt
2016
30
45
0
105
90
2015
15
75
2013 2014 2017 2018 2019
60
-27%
11
1518
45
The OSV market |
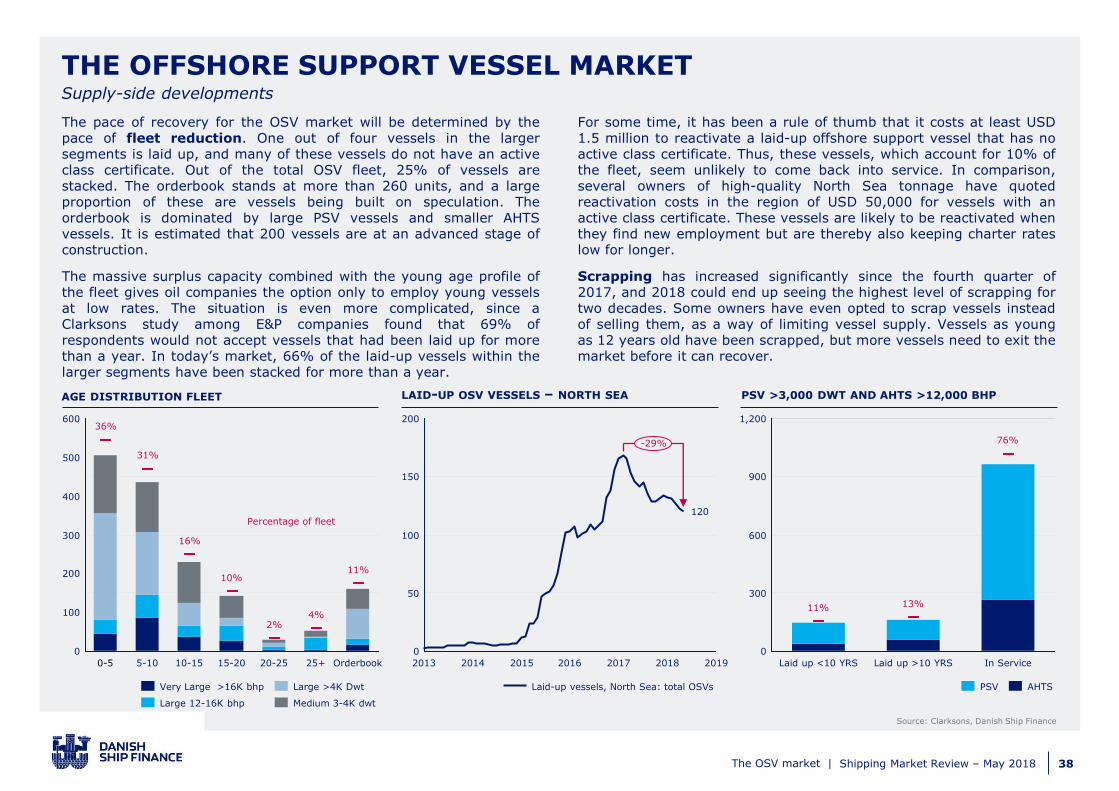
Shipping Market Review – May 2018 38
THE OFFSHORE SUPPORT VESSEL MARKETSupply-side developments
The pace of recovery for the OSV market will be determined by thepace of fleet reduction. One out of four vessels in the largersegments is laid up, and many of these vessels do not have an activeclass certificate. Out of the total OSV fleet, 25% of vessels arestacked. The orderbook stands at more than 260 units, and a largeproportion of these are vessels being built on speculation. Theorderbook is dominated by large PSV vessels and smaller AHTSvessels. It is estimated that 200 vessels are at an advanced stage ofconstruction.
The massive surplus capacity combined with the young age profile ofthe fleet gives oil companies the option only to employ young vesselsat low rates. The situation is even more complicated, since aClarksons study among E&P companies found that 69% ofrespondents would not accept vessels that had been laid up for morethan a year. In today’s market, 66% of the laid-up vessels within thelarger segments have been stacked for more than a year.
For some time, it has been a rule of thumb that it costs at least USD1.5 million to reactivate a laid-up offshore support vessel that has noactive class certificate. Thus, these vessels, which account for 10% ofthe fleet, seem unlikely to come back into service. In comparison,several owners of high-quality North Sea tonnage have quotedreactivation costs in the region of USD 50,000 for vessels with anactive class certificate. These vessels are likely to be reactivated whenthey find new employment but are thereby also keeping charter rateslow for longer.
Scrapping has increased significantly since the fourth quarter of2017, and 2018 could end up seeing the highest level of scrapping fortwo decades. Some owners have even opted to scrap vessels insteadof selling them, as a way of limiting vessel supply. Vessels as youngas 12 years old have been scrapped, but more vessels need to exit themarket before it can recover.
Source: Clarksons, Danish Ship Finance
LAID-UP OSV VESSELS – NORTH SEA PSV >3,000 DWT AND AHTS >12,000 BHPAGE DISTRIBUTION FLEET
0
15%
5%
35%
300 20%
40%600
200
100
30%
0%
25%
10%
500
400
31%
0-5
36%
Orderbook
10%
10-15
16%
20-25
2%
15-20
4%
25+
11%
5-10
Large 12-16K bhp
Very Large >16K bhp
Medium 3-4K dwt
Large >4K Dwt
Percentage of fleet
1,200
900
600
0
300
76%
13%
Laid up <10 YRS Laid up >10 YRS In Service
11%
PSV AHTS
200
50
2014 2017
0
201620152013
150
100
2018 2019
-29%
120
Laid-up vessels, North Sea: total OSVs
The OSV market |

Shipping Market Review – May 2018 39
PositiveNegative ✓
The outlook for offshore support vessels needs to be seen from thebroader perspective of E&P spending. For offshore E&P spending togrow, the break-even rates of an offshore project must be competitivewith, for example, that for a shale oil field. Competition from onshoreproduction has led to the active offshore market being significantlyscaled back and has reduced the need for support vessels. Many ofthe new offshore developments are (subsea) tie-back activities oractivities that are aimed at improving the enhanced oil recovery (EOR)of existing facilities. These projects require fewer support vessels perbarrel produced than new projects.
Innovation has flourished in the offshore oil and gas industry over thelast three years, and virtually every part of the supply chain has beenupgraded and digitalised. The vessels of tomorrow likewise need to beupgraded and many owners may need to find alternative employmentfor some of their vessels. The offshore wind industry is able to providealternative employment for several types of offshore support vessels.Subsea vessels were the first to enter this market, but with day ratesrarely exceeding USD 20,000 per day, they do not cover the capitalcosts of these expensive vessels. As the subsea market is slowlyrecovering, it is expected that some PSV vessels will be retrofitted andmigrate over to the offshore wind industry.
Despite the massive oversupply of vessels, there is light at the end of
the tunnel. Offshore project sanctioning has increased, drilling activityis expected to pick up in the short term, and the fleet is expected toslowly shrink. We do not expect charter rates to grow rapidly any timesoon, however, and we see major downside risk to the value of oldervessels. For OSV owners with younger modern vessels, it isparamount to keep the vessels employed and they can only hope thatenough vessels will be scrapped in order to arrive at more acceptablerates.
THE OFFSHORE SUPPORT VESSEL MARKETThe market outlook
The capacity and future growth of the unconventional oil industry will impact how much spending is directed towards offshore E&P. The competitiveness of deepwater projects will
be tested in the coming years.
Brazil’s estimated 90 billion barrels of pre-salt resources could be fast-tracked as foreign companies are allowed to gain operatorship in the country.
Digitalisation will change how shipowners operate, and likely reduce the total number of vessels in the industry. Players investing in digitalisation now will likely be the winners of
tomorrow.
The unconventional oil industry
Brazil pre-salt fields
Digitalisation
FORCES AT WORK IMPACTING THE DEMAND OUTLOOK
✓
✓
The OSV market |

Shipping Market Review – May 2018 40
OSV MARKET DEEP DIVEThe OSV industry will become greener and more digitalised
After three years of very challenging market conditions, the oiland gas industry has undergone a turnaround process.Innovation has also flourished in the OSV industry. The OSVfleet of the future will likely be more digitalised andenvironmentally friendly. Those shipowners looking for acompetitive advantage likely need a digital strategy that puttheir vessels in pole position when bidding for contracts.
Over the last three years, oil companies have invested significantresources in digital systems that can provide real-time data, fromdrilling performance to inventory levels, and they now expect thesame capabilities in the OSV value chain. Some of the larger OSVowners are investing substantially in converting their younger vesselsto so-called “smart vessels”, which communicate with the logisticsnetwork. As these vessels better integrate with their operations, theywill likely be preferred by oil majors.
New technologies are also being developed. Remote-controlled vesselshave been tested successfully in the North Sea with the control roombased in California. One oil company increased the utilisation of itsvessels by 22% by applying machine learning and big data analytics toits OSV operations. The development of the first autonomous OSVvessel, while currently only at an early stage, sends a strong signal tothe industry. On the Norwegian continental shelf, vessel operators andoil companies are making joint efforts to cut emissions from logisticsoperations. This involves operating battery- and LNG-powered vessels.Battery packs replace the “spinning reserve” that is used when GPSand satellites keep the vessel in position, and also absorb thevariations in power when a vessel is sailing. Dual engines makeoperations safer and more efficient, which is of importance to oilcompanies. Fuel consumption has been cut by 28% for vessels indynamic positioning mode, and by 16-17% during sailing. Somevessel owners are aiming to cut fuel consumption by 50% by 2020.Every dollar saved on fuel consumption is shared between vesselowners and oil companies in order to align their incentives. We haveseen this model in other parts of the offshore value chain and it maybecome the new norm.
It seems likely that only those shipowners willing to invest in newtechnologies will gain a competitive advantage over time. OSV vesselsare among the more standardised asset classes in the offshoreindustry. Entry barriers have been low, which has meant there are alarge number of vessel owners. We expect the consolidation processto continue in the years to come, since the digital transition of theindustry requires new competences and supplementary skillsets.
The OSV market |
THE SUBSEA VESSEL MARKET
SHIPPING MARKET REVIEW – MAY 2018

Shipping Market Review – May 2018 42
OU
TLO
OK
SU
MM
AR
Y
POSITIVE
NEUTRAL
NEGATIVE
THE SUBSEA VESSEL MARKET Perspectives and key takeaways
The success of the unconventional onshore shale play in turning intoa flexible and scalable, low-cost and short-cycle alternative to offshoreoil production took the offshore oil industry by surprise.
Today, the offshore oil industry is attempting to reinvent itself bypioneering the digitalisation of the oil and gas industry. It aims tooptimise recovery rates, optimise lifetime performance, lower costsand reduce risk.
The introduction of digital twin technology is an important element inthe efforts to increase productivity and cut costs. Digital twin is atechnology used by NASA, Formula 1 racing and many others, and actsas a virtual real-time version of the installation. Instead of makingdrawings that become outdated, sensors make it easy to update themodel in real time.
A digital twin allows the operator to maintain an up-to-date overviewof each individual field. Most players see enormous potential inpowering digital twins with artificial intelligence and machine-learningtechniques. The aim is to lower costs and improve productivity byupgrading more parts of the operation to a higher digital standard.One day, this technology may enable operations to be remote-controlled or even outright automated.
One player has developed subsea robots which may revolutionise the
The Subsea vessel market is still upagainst tough conditions but seems tohave passed the bottom. Offshore projectsanctioning increased in 2017 and isexpected to continue recovering. Short-cycle projects, often tie-backs, continue tobe in favour. The largest companies seembest-positioned to upgrade their operationsand gain market share. Future demand islikely to require fewer vessels per project,which may result in older vessels exitingthe market prematurely.
WHERE WE ARE IN THE FREIGHT RATE CYCLE
maintenance of equipment on the seabed, enabling this work to becarried out remotely. In this case, the subsea robot is intended toreplace submarine vessels and can arrive at locations faster whenproblems arise. It aims to identify and resolve several problems morequickly while improving safety and costs.
The entire supply chain is being reworked. The largest companies inthe Subsea sector are partnering with technology players, oilcompanies and other third parties that can help them enhance theircapabilities. The old operating model is being upgraded. The Subseaindustry is working to develop projects that are leaner, moretechnologically advanced and more competitive.
This development is likely to mean fewer subsea vessels are requiredper project, but over time it could increase the competitiveness ofoffshore oil production and therefore lead to more projects receivingfinal investment decisions.
Today, the larger and more advanced operators seem best-positioned,but tonnage providers may also benefit, since we expect additionalSubsea activity in the years to come.
Source: Danish Ship Finance
Subsea Vessels
The Subsea Vessel market |

Shipping Market Review – May 2018 43
Charter rates in the Subsea industry remain low, as surplus capacitycontinues to weigh on the market. Activity has picked up but primarilyfor the largest players. Charter rates are often embedded in largercontracts for Engineering, Procurement, Construction and Installation,which makes the price development less transparent. Still, charterrates for construction vessels have increased approximately 8% toUSD 37,000 per day since November 2017. We have also seen severallarge Subsea construction contracts, particularly on the NorwegianContinental Shelf (NCS). The Offshore wind industry has offeredalternative employment for some Subsea vessels, but with day ratesrarely exceeding USD 20,000 per day, this kind of work is not veryattractive.
Secondhand prices are hard to assess, as there are few high-endassets for sale. Those sales that have been registered have been atvery low prices compared with the cost of building a new vessel,
although the newbuilding price remains untested. Most sales havebeen encouraged by banks as parts of restructurings. Shipowners withadvanced newer tonnage are reluctant to sell vessels, as they seethem as enablers for technically advanced projects. Some ownershave bought vessels partly to ensure that competitors do not entertheir sector. These are typically cable vessels for longer tie-backprojects. Demand for these vessels is expected to grow in the longerterm due to the increased number of tie-back projects. There hasbeen some interest from new industrial players looking to enter themarket at a low point. This could alter the competitive landscape,similar to the development seen in the OSV industry, since newplayers, with young but “cheap” vessels, can pressure margins forlonger. Still, counter-cyclical investments could prove very profitablein a few years’ time.
THE SUBSEA VESSEL MARKET Freight rates and ship prices
Source: Clarksons, Danish Ship Finance
SUBSEA VESSELS CHARTER DAY RATES (USD PER DAY) SUBSEA TREE AWARDS AND INSTALLATIONS
45,000
20182014 201720152013 2016 2019
15,000
60,000
30,000
0
+9%
37,000
Subsea charter day rates MSV, c. 120m LOA, 250t swl crane
600
150
450
300
0
2017
+42%
2018201620152013 2014
Subsea tree awards Subsea tree installations
The Subsea Vessel market |

Shipping Market Review – May 2018 44
THE SUBSEA VESSEL MARKETSupply-side developments
The Subsea vessel industry is highly diversified, so the degree ofoversupply depends on the vessel segment. Also, it is less common tolay up vessels, and currently only 7% of the fleet (54 vessels) are laidup. Excluding vessels that are 25 years or older, this number comesdown to 3.5%.
There are currently 58 Subsea vessels in the orderbook. Most ofthese are multi-functional support vessels to be built at Chinese yards.It appears that few of these apparent orders have actual ownerswaiting to take delivery of the vessels. Most of the orders were placedin 2014 or earlier, and we believe that very few of these vessels willactually be delivered.
Scrapping has increased, but still only four vessels have beenscrapped over the past six months. Subsea vessels have limited scrapvalue due to their limited quantities of steel. It has primarily been the
larger players that have begun to scrap vessels in their non-corefleets. Scrapping volumes are far too low to impact the supply anddemand balance. One out of four vessels is older than 25 years old,and large numbers of these vessels need to be scrapped in the comingyears for the balance to be restored.
Contracting is very low with only two units ordered since November.Most notable was the newbuilding contract for one large pipe-layingvessel in late 2017.
Source: Clarksons, IHS Markit, Danish Ship Finance
STATUS OF SUBSEA FLEET SUBSEA PRODUCTION SPENDING (USD BILLION)AGE DISTRIBUTION OF SUBSEA VESSELS
100
0
250
200
150
50
25+
26%
3%
15-20
9%8%
20-25 Orderbook
23%
9%
10-150-5
24%
5-10
In serviceLaid up Percentage of fleet
60%
50%
10%
0%
70%
40%
90%
30%
20%
100%
80%600
200
400
800
0
93%
7%
In Service Orderbook
8%
Laid Up
Percentage of fleetCable layers
Diving support vessels
Well stimulation
Multi-functional supportHeavy-lift
3
0
12
15
9
6
2018 20192013 2015 20172016 20202014
+39%
Subsea production systems spending
The Subsea Vessel market |

Shipping Market Review – May 2018 45
PositiveNegative ✓
We expect the largest Subsea operators to leverage their technologicalcapabilities and increase their market shares in the coming years. Theindustry is in the early stages of adopting new technologies which areraising the barriers to operate. We are uncertain whether smallervessel owners, many with debt-laden balance sheets, will have muchopportunity to participate at the higher end of the market.
The biggest driver for Subsea vessels in the medium term is subseatree installations. A subsea tree monitors and controls the productionof a subsea well. In 2017, awards for subsea trees increased by 42%.Many of these awards were for projects that were sanctioned at theend of 2017 on the Norwegian Continental Shelf. This is a positivemarket development, but it will take some time before these awardslead to more employment for Subsea vessels.
Even though the industry is pushing forwards with new initiatives, the
next few years will be difficult. The Subsea market continues to bedependent on offshore E&P spending which appear unlikely to increaseenough to stop the ongoing consolidation process. Much of theexpected future activity relates to tie-backs which are Subsea service-intensive but may employ fewer ships than a complete new productionfacility. We expect the fleet to remain oversupplied in the comingyears and the largest operators to secure the lion’s share of futureemployment. Still, postponed IMR services may provide someemployment for the smaller owners.
The Subsea market seems to have passed the bottom, but a truemarket recovery may not be seen for another two to three years.Many ships will need to exit the market before rates and secondhandprices recover significantly.
THE SUBSEA VESSEL MARKETThe market outlook
In the short-term the oil price have little effect on Subsea vessel demand. In the longer-term this dynamic changes. If oil companies believe oil prices will remain high they are more
inclined to sanction offshore projects.
Tie-back projects create employment only for the short term, in contrast to conventional platform projects, but are nonetheless employing some vessels.
Offshore wind projects are employing some Subsea vessels but at low charter rates. Conventional infrastructure projects could also contribute to utilisation in the future.
Digitalisation of the supply chain is expected to increase the competitiveness of offshore oil projects, enabling more subsea installations in the years to come.
Decommissioning of oil and gas fields could increase demand for Subsea vessels. The Gulf of Mexico and North West Europe account for 80% of visible demand going forward.
The price of oil
Tie-back projects
Alternative employment
E&P spending
Decommissioning
FORCES AT WORK IMPACTING THE DEMAND OUTLOOK
✓
✓
✓
✓
✓
The Subsea Vessel market |
Shipping Market Review – May 2018 46
SUBSEA MARKET DEEP DIVE: UNLOCKING ADDITIONAL VALUESmaller oil discoveries could reinvent the Subsea industry
The key to increased long-term demand in the Subsea industryis the ability to challenge onshore investments on profitability,payback and quality. A leaner, faster and more innovation-ledindustry could succeed in this in the years to come.
In the UK, there are more than 3.4 billion barrels of oil situated insmaller oil fields that are currently deemed not economical to develop.A recent study by Wood Mackenzie and the Oil & Gas TechnologyCentre suggests that 400 million barrels of oil equivalents could beunlocked by applying new Subsea technology on the UK ContinentalShelf’s smaller oil fields. This initiative, which is called the “Tie-Back ofthe Future”, aims to halve the costs required and time taken todevelop marginal oil fields. There are 27 billion barrels of oil in smallerfields globally, so the potential is large.
This could be the start of a market where oil companies still engage inlarge projects but also have a sizeable portfolio of smaller projectsthat they execute swiftly and efficiently. If smaller pools were tobecome profitable, it would also allow smaller oil companies to enterthe sector. For smaller companies, exploration for oil is considered ahigh-risk activity. It is capital-intensive with a low probability ofsuccess. If smaller companies get lower-risk returns, this could lead tomore capital directed offshore, and an increased number of finalinvestment decisions (FIDs).
At the current rate of exploration, it would take 14 years and 500wells to find the equivalent amounts of oil that already is situated insmaller identified fields in the UK. Despite fewer mega-projectssanctioned, it is still possible that the Subsea market could return toits previous highs but with a larger share of smaller projects in theportfolio.
The Subsea industry will be instrumental in developing new solutionsto enhance the attractiveness of offshore projects. As we discuss inthe OSV section, digitalisation of the industry is ramping up rapidly.The largest Subsea companies undertake complex operations, whichpotentially indicates even larger upside for them when adoptingadvanced technologies. In 2014, a joint programme was launched by
three of the largest oil majors in the world and one technologycompany. Their goal is to create a “Subsea factory” by 2020, aproduction unit enabling oil and gas processing plants to be situatedon the seabed regardless of the distance from shore, water depth andtemperature. This would eliminate the need for floating structures,and operations would be remotely controlled. The aim is to create areliable, economical “factory” that would only need maintenance everycouple of years. Significant resources are being invested in this:development is complex and involves everything from subsea watertreatment systems to the Internet of Things (IoT). In theory, such a“factory” could make production platforms obsolete, and with noproduction platforms, the offshore market would change dramatically.Much of the value chain we see today would be obsolete, but Subseacompanies and their vessels would be in high demand.
This will clearly not happen overnight, but it may signal a futuredirection for the industry.
The Subsea Vessel market |

THE CRUDE TANKER MARKET
SHIPPING MARKET REVIEW – MAY 2018

Shipping Market Review – May 2018 48
OU
TLO
OK
SU
MM
AR
Y
POSITIVE
NEUTRAL
NEGATIVE
THE CRUDE TANKER MARKETPerspectives and key takeaways
The Crude Tanker market has continued to deteriorate over the pastyear and remains heavily affected by oversupply. Despite robustdemand, high fleet growth for the third consecutive year has causedthe surplus to expand further. A very welcome strong increase indemolition activity was a bright spot in the second half of 2017.
Last year, a strengthening of the global economy and low oil pricesstimulated oil consumption, supporting Crude Tanker demand whichgrew by 4%. In particular, Chinese crude oil imports and US crude oilexports showed strong growth.
Thus, even though demand was robust, yet another year of strongsupply growth (+6%) meant that freight rates stayed at low levels in2017. By February 2018, spot rates had declined to their lowest levelin five years, and average timecharter rates were down 59% from theirmost recent peak in December 2015.
In terms of market sentiment in 2017 and the first quarter of 2018,Crude Tanker owners seemed to follow different paths. Low freightrates and rising scrap prices encouraged many owners to exchangeequity for cash and send ageing tonnage to the scrapyard. Others,however, seemed to be afraid of missing out on newbuilding pricesbottoming out. Of the 36 known owners who placed orders at theshipyards, only nine of them also sent vessels for demolition duringthe period.
Low freight rates are weighing down theoversupplied Crude Tanker market. Manyolder vessels are expected to be scrappedover the next two years and freight ratesmay improve by the end of the period.Travelling distances will remain a keydemand driver, yet demand growth isexpected to slow in 2018 and supply islikely to outpace tonne-mile demand.Strong demolition activity will lower theaverage age of vessels scrapped and couldstructurally reduce secondhand prices.
WHERE WE ARE IN THE FREIGHT RATE CYCLE
Crude Tanker investors seem to be starting to align their efforts,though. This year, owners have been more reluctant to place orders,and at the same time have been increasingly willing to scrap vessels.If this trend becomes entrenched in the market in 2018 and 2019,freight rates could begin to improve by the end of the period.
This is a double-edged sword, however, as intensified demolition hasdrastically reduced the average age of vessels scrapped in just threeyears from 24 years in 2016 to 18 years in the first quarter of 2018.We have addressed the risk of structurally reduced secondhand pricesas a consequence of declining economic lifetimes of vessels in pastreports. We maintain our stance and argue that what currently looklike cheap newbuilds are at risk of turning into depreciating assetsunlikely to yield the expected return on invested capital. The risk isbiggest for VLCCs which have the largest orderbook and the youngestfleet. If demolition remains high, the average scrapping age willcontinue to decrease in the coming years and could soon approach 15years.
To sum up, the short-term outlook for freight rates is strengtheningwith more vessels being scrapped, but the same driver is weakeningthe outlook for secondhand prices.
Source: Danish Ship Finance
Suezmax
VLCCAframax
The Crude Tanker market |

Shipping Market Review – May 2018 49
Spot rates tumbled going into the new year, as the seasonal fourth-quarter uptick did not materialise despite robust demand and highdemolition activity. In February 2018, average spot rates had comedown to a five-year low, with the VLCC segment the most subdued atUSD 5,700 per day compared to USD 27,900 per day at the samepoint last year. Timecharter rates in all segments were similarlyweak but steady from the first quarter of 2017 onwards, until VLCCsresumed a downward trajectory, approaching the lows of 2013 by theend of 2017.
Newbuilding prices increased slightly during 2017 but not enough todeter owners from continuing to place orders. By March 2018, theaverage newbuilding price was up 4% compared with at the start of2017 but is expected to be capped by low utilisation at shipyards.Secondhand prices has for 5-year old vessels has improvedmarginally (4%) since a reduction in the economic lifetime and lower
timecharter income was counterbalanced by an strong increase in thescrap price. Prices of older vessels are lagging behind.
The low secondhand prices and increasing demand for moderntonnage meant that sales activity was fairly strong in 2017, and 78vessels changed hands, 41 of them VLCCs. Sales activity slowed downsomewhat in the first quarter of 2018, with only 13 vessels changinghands, none of them Suezmaxes.
The modest price development despite healthy activity in thesecondhand market in 2017 compared to 2016 indicates that CrudeTanker owners are not overly confident that the tide will turn in thecoming years. Any improvement in the market is still pending.
THE CRUDE TANKER MARKETFreight rates and ship prices
Source: Clarksons, Danish Ship Finance
1-YEAR TIMECHARTER RATE (USD PER DAY) SECONDHAND PRICES – 5 YEARS (USD MILLION)
20152014 20162013
45,000
15,000
0
201920182017
30,000
60,000
19,59415,500
13,344
-34%
AframaxVLCC Suezmax
2018
0
2019
25
100
75
50
201520142013 20172016
32
64
44
+7%
The Crude Tanker market |

Shipping Market Review – May 2018 50
THE CRUDE TANKER MARKETSupply-side development
Contracting grew significantly in 2017 as owners regained theirappetite for newbuild vessels despite the low freight rates, withinterest in VLCC newbuilds particularly strong. Contracting reached 24million dwt in 2017, corresponding to 109 vessels, of which 54 wereVLCCs. In the first quarter of 2018, contracting has lost some pacewith 4.4 million dwt or 17 vessels, 13 of them VLCCs.
Deliveries surged to 31.6 million dwt in 2017, the highest level since2011, reflecting intense contracting activity in 2015. A considerabledecline in postponements and cancellations also helped, as 83% oforders scheduled for delivery in 2017 materialised, compared to 71%in 2016. A hefty increase in demolition activity was not enough tobalance net fleet growth with demand. The Crude Tanker fleet grewstrongly for the third year in a row in 2017. Demolition reached 9.8million dwt, or 63 vessels, in 2017, around 80% of vessels werescrapped in the second half of the year. Demolition remains very highin 2018, with 7.2 million dwt, or 35 vessels, scrapped in the first
quarter of 2018, the majority VLCCs. Few older vessels available forscrapping has brought the average age of vessels scrapped down to18 years in 2018, from 21 years in 2017 and 23 years in 2016. Thehigh scrap prices have made it increasingly uneconomical to upgradeolder vessels to comply with new regulations. Instead, many ownersare opting to exchange equity for cash in the demolition market.
The fleet renewal potential, reflecting the relationship between theorderbook and the number of available scrapping candidates, hasdeteriorated for Aframaxes and VLCCs due to the simultaneousincrease in contracting and demolition activity. VLCC owners inparticular appear to be participating in an increasingly high-stakesgame that could end up being very expensive. With an orderbook-to-fleet ratio of 14% and 4.9 vessels on order for every vessel in the fleetolder than 20 years, the VLCC segment is very vulnerable if demandfails to employ the fleet.
Source: Clarksons, Danish Ship Finance
FLEET DEVELOPMENT (MILLION DWT) FLEET RENEWAL POTENTIAL (DWT)AGE DISTRIBUTION OF FLEET (MILLION DWT)
90
60
120
150
0
30
23%
Orderbook25+
0%
13%
35%
5-100-5
23%
20-25
3%
15-20
15%
10-15
Percentage of fleet
-15
0
30
45
15
2013 2014
2%
1%
3%
1%
5%
2018
6%
7%
5%
2015 2016 202020192017
Suezmax OrderbookAframaxVLCC
Deliveries
Scrapping
12%8%0% 4%
4
2
0
6
16%
Ord
erb
ook /
fle
et
>20 y
rs
Aframax
Suezmax
VLCC
Orderbook / total fleet
The Crude Tanker market |
Annual fleet growth

Shipping Market Review – May 2018 51
PositiveNegative ✓
Indications of an imminent improvement in market fundamentals arestill difficult to spot, and we remain fairly cautious about the short-term outlook for the Crude Tanker market (one to three years). Afterthree years of high fleet growth, the market is severely oversupplied.Many owners seem to expect that older vessels will be scrapped,whereafter market balance should be restored. But the orderbookremains high and fleet growth is expected to outpace demand in 2018and 2019. Crude Tanker demand growth is expected to slow to justover 2% in 2018 and decelerate further in the coming years.Consequently, the conditions necessary for the oversupply in theCrude Tanker market to be reduced do not appear to be present yet.
The short-term demand outlook, however, is highly susceptible to thedevelopment of some key events: most importantly, how much US oilexports grow, when and to what degree OPEC and its peers let the oilflow again, and to what extent Chinese demand will be affected if the
deceleration in stocking activity continues. Our primary concern is thatowners might be tempted to step up Crude Tanker contracting. Thiscould happen if, for example, US oil exports overshoot expectations inthe short term, with the result that freight rates improve. In ourassessment, rising contracting activity is working to postpone recoveryfor the Crude Tanker market at the expense of older vessels. Furthercontracting could leave the market even more vulnerable than today,considering the accompanying downside scenarios in which averagetravelling distances are likely to shorten again when OPEC and itspeers abandon the output cut and if Chinese import demand growthslows substantially as a consequence of a return to “normal” stockingactivity.
THE CRUDE TANKER MARKETThe market outlook
A continued increase in US oil exports to growth markets east of Suez could create stronger demand for large Crude Tankers, which would support tonne-mile demand.
Global oil stocks have been filling since 2014 and have strengthened Crude Tanker demand, but reduced stocking activity could negatively impact future demand growth.
Rapid advances in fuel efficiency and a continued increase in electric vehicle uptake could displace a significant amount of oil demand and reduce seaborne demand.
Substitution of fuel oil, gas oil and crude oil with natural gas and renewable energy sources in the power generation sector is likely to affect Crude Tanker demand negatively.
Growth in manufacturing and industry and rising living standards in emerging markets could mitigate the impact of decreasing oil demand in OECD countries on seaborne demand.
US oil exports
Reduced global oil stocking activity
Fuel efficiency gains and electric vehicle penetration
The clean energy transition
Economic growth in emerging markets
FORCES AT WORK IMPACTING THE DEMAND OUTLOOK
✓
✓
The Crude Tanker market |

Shipping Market Review – May 2018 52
CRUDE TANKER MARKET DEEP DIVE: US CRUDE EXPORTSDownside risks to the expected Crude Tanker market recovery
Confident Crude Tanker investors have high expectations forfuture freight rates and asset prices, believing that increaseddemolition and further US crude export growth will continue tosupport Crude Tanker tonne-mile demand. But downside risksare lurking and could curb growth in US crude exports.
In spite of the current oversupply and low earnings, investor interestin the Crude Tanker market remains strong. We acknowledge thatmany older vessels are likely to leave the fleet in the coming years,but we see at least three challenges that need to be overcome beforethe rapid US export growth that seems to be widely expected canmaterialise.
First, infrastructure bottlenecks in the US are likely to be the mainchallenge for further US crude export growth in the short term.Exports can only grow if infrastructure can keep up. A shortage oftruck drivers and pipeline utilisation inching closer to maximumtakeaway capacity as oil output increases are already concerns.Natural gas takeaway capacity could also be a limiting factor for crudeproduction. Additionally, when the crude oil does reach the Gulf,almost all ports are too shallow to load vessels any larger thanAframax-sized. This necessitates reverse lightering, which reduces thecost competitiveness of US crude as the chain of logistics becomesmore complicated. New pipeline capacity is being constructed and portdeepening and expansion projects are underway, but it will take yearsto obtain approval and raise funding for these, and for construction tofinish. Until infrastructure can be adjusted, US crude export growthappears to have an upper limit.
The second potential barrier for US export volumes is the refiningindustry. Most new complex refineries in the Middle East and Asia aredesigned to process heavier crude grades. The light shale oil might notbe what the refineries demand and would likely need to be blendedwith heavier crude grades to meet the designs of most of the worldsrefineries. The heavier grades needed for blending are not growing atthe same pace as shale oil and may not be available in sufficientamounts. In terms of demand, shale oil yields more light distillates
than middle distillates, and although LPG and naphtha are feedstocksfor the fast-growing petrochemical industry, in the transport sector,which is still by far the largest end-consumer of oil, it is diesel and jetfuel demand that is projected to increase most.
The third potential barrier for US export volumes is the dependence onChinese imports. US oil exports to China showed the strongest growthof any in 2017, and the associated tonne-mile demand increasesupported the Crude Tanker market in the wake of production cutsfrom OPEC and peers. But the US-China oil trade did not exist just afew years ago, and if OPEC increases production or the incipient tradewar is allowed to develop, the ultimate consequence for the CrudeTanker market could be that this trade disappears again. In today’schallenging geopolitical environment, we need to consider whetherChina will be willing to rely on US crude exports to satisfy itsincremental demand growth. Moreover, the newly expanded pipelinecapacity from Russia to China reduces China’s reliance on seaborneimports. Even if the trade war does not escalate further, growth inChinese crude oil imports is expected to slow substantially from 2018due to reduced stockbuilding activity and the country’s generaltransition away from being an oil-intensive economy. This could limitfurther growth in Chinese crude imports from the US and curb tonne-mile demand growth.
In short, US crude oil exports may end up utilising the growing CrudeTanker fleet, but the outlook is far less certain than many seem tobelieve. And even if US exports do utilise the fleet, the upswing couldturn out to be short-lived if OPEC decides to increase production withthe result that many long-haul barrels from the US are exchanged forshorter-haul barrels from the Middle East, lowering tonne-miledemand growth and Crude Tanker fleet utilisation.
The Crude Tanker market |

THE PRODUCT TANKER MARKET
SHIPPING MARKET REVIEW – MAY 2018
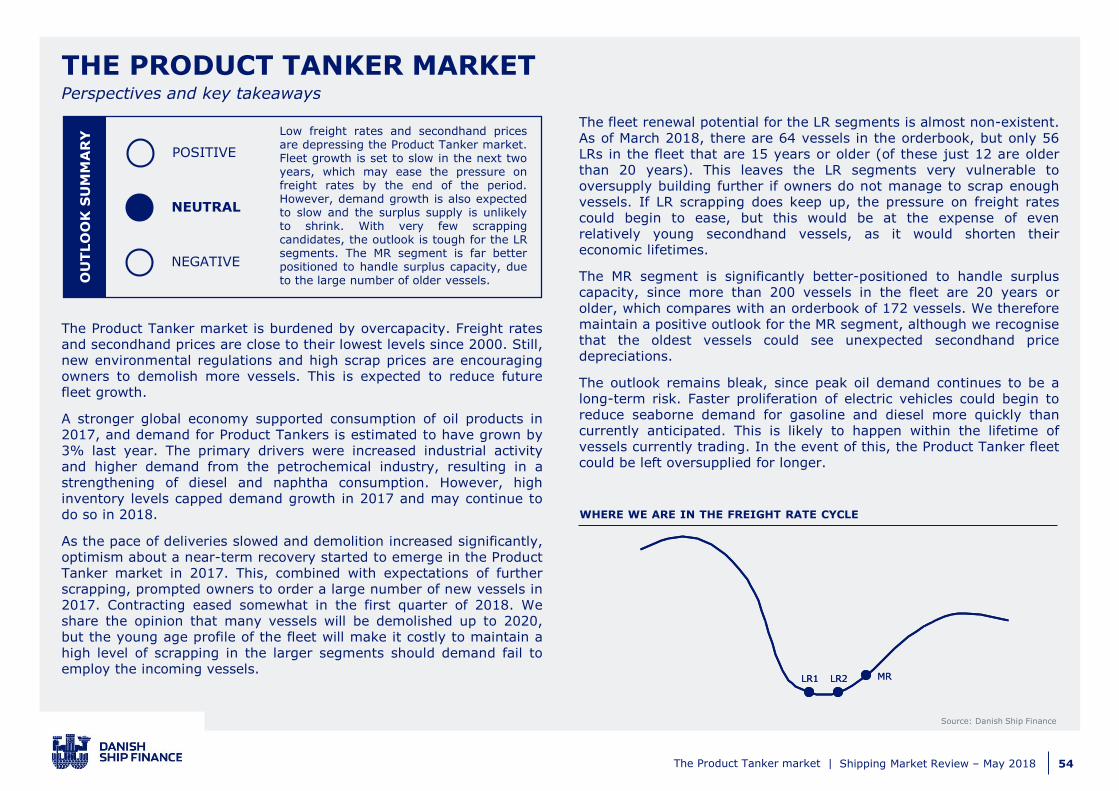
Shipping Market Review – May 2018 54
OU
TLO
OK
SU
MM
AR
Y
POSITIVE
NEUTRAL
NEGATIVE
Perspectives and key takeaways
The Product Tanker market is burdened by overcapacity. Freight ratesand secondhand prices are close to their lowest levels since 2000. Still,new environmental regulations and high scrap prices are encouragingowners to demolish more vessels. This is expected to reduce futurefleet growth.
A stronger global economy supported consumption of oil products in2017, and demand for Product Tankers is estimated to have grown by3% last year. The primary drivers were increased industrial activityand higher demand from the petrochemical industry, resulting in astrengthening of diesel and naphtha consumption. However, highinventory levels capped demand growth in 2017 and may continue todo so in 2018.
As the pace of deliveries slowed and demolition increased significantly,optimism about a near-term recovery started to emerge in the ProductTanker market in 2017. This, combined with expectations of furtherscrapping, prompted owners to order a large number of new vessels in2017. Contracting eased somewhat in the first quarter of 2018. Weshare the opinion that many vessels will be demolished up to 2020,but the young age profile of the fleet will make it costly to maintain ahigh level of scrapping in the larger segments should demand fail toemploy the incoming vessels.
Low freight rates and secondhand pricesare depressing the Product Tanker market.Fleet growth is set to slow in the next twoyears, which may ease the pressure onfreight rates by the end of the period.However, demand growth is also expectedto slow and the surplus supply is unlikelyto shrink. With very few scrappingcandidates, the outlook is tough for the LRsegments. The MR segment is far betterpositioned to handle surplus capacity, dueto the large number of older vessels.
WHERE WE ARE IN THE FREIGHT RATE CYCLE
The fleet renewal potential for the LR segments is almost non-existent.As of March 2018, there are 64 vessels in the orderbook, but only 56LRs in the fleet that are 15 years or older (of these just 12 are olderthan 20 years). This leaves the LR segments very vulnerable tooversupply building further if owners do not manage to scrap enoughvessels. If LR scrapping does keep up, the pressure on freight ratescould begin to ease, but this would be at the expense of evenrelatively young secondhand vessels, as it would shorten theireconomic lifetimes.
The MR segment is significantly better-positioned to handle surpluscapacity, since more than 200 vessels in the fleet are 20 years orolder, which compares with an orderbook of 172 vessels. We thereforemaintain a positive outlook for the MR segment, although we recognisethat the oldest vessels could see unexpected secondhand pricedepreciations.
The outlook remains bleak, since peak oil demand continues to be along-term risk. Faster proliferation of electric vehicles could begin toreduce seaborne demand for gasoline and diesel more quickly thancurrently anticipated. This is likely to happen within the lifetime ofvessels currently trading. In the event of this, the Product Tanker fleetcould be left oversupplied for longer.
Source: Danish Ship Finance
THE PRODUCT TANKER MARKET
MRLR2LR1 LR2LR1 MR
The Product Tanker market |

Shipping Market Review – May 2018 55
Spot rates are low, which reflects the fact that the market is stillstruggling to cope with excess capacity. The average Product Tankerspot rate ended 2017 as it started, at approximately USD 11,700 perday. Stronger intra-regional trade, driven by US Gulf exports to LatinAmerica and a surplus of Chinese oil products boosting trade withinAsia, supported MR spot rates which proved more resilient than LRrates. Strong product demand was increasingly supplied frominventories, as demand outgrew refinery runs, which removedpotential seaborne arbitrage trades. Timecharter rates remain low,especially for LR1 tankers. MRs remain most robust with the 1-yeartimecharter rate at USD 13,300 per day in March 2018, 6% higherthan at the same time last year.
Secondhand prices remain low but have increased steadily since thebeginning of 2017 and continued the positive trend during the firstthree months of 2018. The price of a five-year-old LR has improved byapproximately USD 1.25 million which is almost the same as the
increase in its scrap value over the period. That is to say, the increasedoes not reflect higher market expectations for future earnings. MRprices have risen almost USD 4.5 million in the same period. Thatcorresponds to five times the increase in the scrap price and doestherefore reflect an increase in the market’s future earningsexpectations. Newbuilding prices remain low but have also beenimpacted by higher steel prices, and on average prices increased by3.5% in the first quarter of 2018.
The low, but slowly increasing, secondhand prices attracted investorswho were eager not to miss the bottom of the market. This meantsales activity was relatively strong in 2017 with 5.5 million dwtchanging hands compared with 3 million dwt in 2016. Investors’enthusiasm seemed to wane in the first quarter of 2018, as salesactivity decreased almost 60% compared with the first quarter of2017.
THE PRODUCT TANKER MARKETFreight rates and ship prices
Source: Clarksons, Danish Ship Finance
1-YEAR TIMECHARTER RATE (USD PER DAY) SECONDHAND PRICES – 5 YEARS (USD MILLION)
2014 20152013 2016
21,000
14,000
0
201920182017
7,000
35,000
28,000
12,625
+6%
13,28114,656
201520142013
0
2018 201920172016
60
30
15
45
+5%
29
27
34
MRLR1LR2
The Product Tanker market |

Shipping Market Review – May 2018 56
THE PRODUCT TANKER MARKETSupply-side development
Firming market sentiment caused contracting to more thanquadruple in 2017 from its low 2016 level. It seems that many shipowners ordered new vessels based on the presumption that assetprices bottomed out last year. Shipowners ordered 7.6 million dwt or122 new vessels in 2017. On a positive note, the orderbook is at itslowest level since 2013. In the first quarter of 2018, owners appearedto take a more cautious approach to ordering, as only 0.5 million dwtor 13 vessels were ordered, 11 of them MR vessels.
Deliveries declined by 15% in 2017 to 8.1 million dwt compared with9.5 million dwt in 2016. Thus, the trend of continuously increasingdeliveries since 2013 came to a halt. A sharp decline in MR deliverieswas the reason for this, since deliveries increased in both LRsegments. On the other hand, demolitions soared and grew by 140%in 2017 to 1.9 million dwt demolished from the record-low 0.8 milliondwt in 2016. The majority of scrapped vessels were MRs, as thissegment had the largest amount of natural scrapping candidates
available. Scrapping of LR vessels finally began after three years withvery modest activity, and nine LRs were scrapped in 2017. Thisresulted in net fleet growth of 4%. The first quarter of 2018 saw 1.8million dwt of deliveries and 0.8 million dwt of demolitions.
The fleet renewal potential, reflecting the relationship between theorderbook and the number of available scrapping candidates, indicatesthat the Product Tanker market is increasingly divided. Even thoughthe MR orderbook-to-fleet ratio has increased over the past year, MRsremain the most robust segment, with a fleet largely capable ofabsorbing the orderbook should demand falter. The LR segments havevery few older vessels, which leave them very vulnerable shoulddemand fail to employ the newbuilds once they are delivered. Theextremely young LR1 fleet is the best example of this imbalance, withjust one vessel over 20 years in the fleet but 22 vessels in theorderbook.
Source: Clarksons, Danish Ship Finance
FLEET DEVELOPMENT (MILLION DWT) FLEET RENEWAL POTENTIAL (DWT)AGE DISTRIBUTION OF FLEET (MILLION DWT)
60
30
45
0
15
Orderbook
3%
10-15
34%
25+
9%8%
15-200-5
25%
2%
20-25
28%
5-10
Percentage of fleet
6
12
9
3
-3
0
2019
4%4%
1%
2017 2018
4%
6%
2016 2020
3%
2013 2014
4%
6%
2015
LR2 OrderbookFleet growth LR1 MR
Annual fleet growthDeliveries
Scrapping
14
0
21
12%0%
7
28
3% 9% 15%6%
Ord
erb
ook /
fle
et
>20 y
rs
LR1
MR
LR2
Orderbook / total fleet
The Product Tanker market |

Shipping Market Review – May 2018 57
PositiveNegative ✓
Market fundamentals remain out of balance, despite stronger thanexpected demand growth and rapid drawdowns of oil inventories in2017 sparking optimism in the Product Tanker market. Fleet growth isset to decline to around 3% in 2018, since there will be fewerdeliveries and more vessels are expected to be demolished ahead ofnew environmental regulations coming into force. Besides, higherscrap prices are strengthening the economic arguments for scrappingvessels. However, demand for seaborne petroleum products isexpected to fall short of fleet growth in the most likely scrappingscenarios, meaning that the surplus is unlikely to shrink significantly inthe foreseeable future. While MR demand is likely to be shelteredsomewhat by the regional refinery imbalances in Asia and theAmericas, a strong influx of LR vessels over the next two years meansthat fleet growth will continue to outpace demand growth.
From 2020, the global shift in marine fuel specifications could open upfor new long-haul trade routes that support demand for Product
Tankers. Currently demand for bunker fuel makes up 4% of total oilproducts demand. Because of their coatings, Product Tankers are theobvious choice of vessel to be used to transport the new marine fuel,and thus will likely be utilised to distribute most of the new marinefuel to make it available in bunker ports across the world.
With respect to long-term demand, we maintain our stance that globalgrowth in seaborne petroleum products will be substantially slower inthe future than it has been in the past up until an eventual peak. Inthe developed world, oil demand has already begun to decline. In thedeveloping world, gradual improvements in fuel efficiency andincreasing ownership of electric vehicles, along with a generaltransition towards cleaner, alternative fuels, will curb future demandgrowth. While the developing world is a long way behind thedeveloped world in terms of vehicle ownership, technology is likely tomake its growth path substantially faster and increasingly less fossilfuel intensive.
THE PRODUCT TANKER MARKETThe market outlook
The Product Tanker market may begin to see tonne-mile demand shrink, since additional demand is expected to be close to the new refinery capacity additions east of Suez.
Low-sulphur fuel will be transported to various bunkering ports by Product Tankers, which could create new trading routes and increase demand.
Seaborne demand is positively impacted if the petrochemical sector continues to increase its demand for naphtha as a feedstock, as currently expected.
Rapid advances in fuel efficiency and a continued increase in electric vehicle uptake could displace a significant amount of oil demand and reduce seaborne demand.
Substitution of fuel oil, gas oil and crude oil with natural gas and renewable energy sources in the power generation sector is likely to affect demand negatively.
Refinery capacity growth east of Suez
IMO 2020 low-sulphur fuel regulation
Growing demand for petrochemicals
Fuel efficiency gains andelectric vehicle penetration
The clean energy transition
FORCES AT WORK IMPACTING THE DEMAND OUTLOOK
✓
✓
The Product Tanker market |
Shipping Market Review – May 2018 58
PRODUCT TANKER MARKET DEEP DIVE: ELECTRIC VEHICLESThe enhanced value proposition of electric vehicles and its likely effect on speeding up proliferation of these
In 2017, electric vehicles accounted for only 0.2% of the globalfleet of passenger vehicles. Although growth is strong, thestarting point was close to zero, and not until the middle of thenext decade are electric vehicles expected to displacesignificant amounts of gasoline demand. However, advances inbattery storage and grid-connection technologies are rapidlyimproving the value proposition of electric vehicles, both forfleet operators and consumers, and as this value propositionbecomes clearer, the uptake of electric vehicles couldaccelerate, we argue.
Today, the global light-duty vehicle fleet accounts for 30% of oilconsumption, and it has accounted for nearly 40% of oil demandgrowth since 2000. Estimates suggest that up to the middle of thenext decade, fuel efficiency improvements will be the main factorcurbing oil demand growth, until adoption of electric vehicles reachesa level high enough to affect oil demand significantly. We argue,however, that a significantly enhanced value proposition could rapidlyspeed up the proliferation of electric vehicles. The largest barrier towidespread adoption of electric vehicles for many consumers remainsthe higher purchase cost (range seems no longer an issue), and theabsence of a clear-cut value proposition in light of that higher cost.But that is changing fast, and could help bring electric vehicles intothe mainstream more swiftly.
Broadly speaking, the differences between electric vehicles andinternal combustion engine cars are high versus low fixed costs(acquisition cost), and low versus high variable costs (fuel cost).Regarding the first point, estimates suggest that by 2020, electricvehicles could reach cost parity with internal combustion enginevehicles. On the second point, intelligent vehicle-to-grid chargingsolutions that could make charging costs even lower are being broughtto market.
Intelligent vehicle-to-grid connection and charging is not a futuristicidea. In the UK, a private utility company, in collaboration with anautomaker, has launched an intelligent vehicle-to-grid chargingproduct. The solution allows customers to charge their electric vehicles
when electricity prices are low and the source is most likely to berenewable, and to discharge (sell) energy to the grid when prices arehigh, through intelligent algorithms that delay charging times to whenit is most attractive from a price perspective. By allowing the batteriesof their electric vehicles to be utilised as energy storage, customersultimately are being offered the opportunity to eliminate large parts oftheir fuel costs or even eradicate them completely. In terms ofvehicles’ lifetime costs, this option drastically increases theattractiveness of electric vehicles, and identifies a clear advantageover internal combustion engine vehicles. This might be somethingthat for many vehicle owners, who have only considered the higherinitial price of electric vehicles, has not been apparent before.
Imagine the push towards large-scale adoption of electric vehicles,maybe first in the developed world, if utility companies in othercountries begin to offer similar solutions. We argue that intelligentgrids and smart charging solutions could significantly speed up electricvehicle adoption, and lead to a more rapid turnover of the globalpassenger car fleet. For transport fuels and Product Tanker demand,an enhanced value proposition that speeds up proliferation of electricvehicles represents a potentially severe threat. The Product Tankerfleet could end up being oversupplied for longer unless other pocketsof demand materialises.
The Product Tanker market |
THE LPG MARKET
SHIPPING MARKET REVIEW – MAY 2018

Shipping Market Review – May 2018 60
OU
TLO
OK
SU
MM
AR
Y
POSITIVE
NEUTRAL
NEGATIVE
THE LPG TANKER MARKETPerspectives and key takeaways
The LPG market is struggling with a massive oversupply of vesselsand decelerating demand growth. In 2017, the fleet expanded by 9%,while demand only grew by 3%, down from 13% in 2016.
The combination of high fleet growth and declining demand growth hasbrought the LPG market to a cyclical low. There has been little roomfor freight rate improvements and the average timecharter rate in2017 for the SGC, MGC and VLGC segments were close to or at all-time low levels. However, the coastal carrier and ethylene carriersegments, both LPG niche markets, have seen a more positivedevelopment. In the ethylene segment, relatively strong demand haskept rates relatively stable and in the coastal carrier segment, freightrates remain high due to low fleet growth and increasing coastal trade.
In the VLGC and MGC segments, which represent around 80% ofseaborne trade volumes, conditions remain very challenging. Long-haul trade is still unable to employ the growing number of VLGCs, andthe large vessels are therefore competing against the smaller MGCs onshorter routes. The MGC segment is already under pressure fromaccelerated fleet growth and we expect that it will remain challengeduntil long-haul trade volumes reach sufficient levels to absorb theoversupply of VLGC vessels.
Despite the poor market fundamentals, the general interpretation of
The LPG market is at a cyclical low, withfreight rates, newbuilding prices and se-condhand prices close to all-time lowlevels. Market fundamentals could deterio-rate further in 2018, as US export growthmight slow. Fleet utilisation could seesome support from increasing demolitionof older vessels but this will not be enoughto counterbalance lower growth in USexports. In 2019, market fundamentalscould improve marginally as US exportsresume growth.
WHERE WE ARE IN THE FREIGHT RATE CYCLE
the LPG market seems to be that it has passed the bottom and isheading for a recovery. A recovery is expected to be propelled by aslowdown in deliveries, rising demolition activity (spurred by the IMO2020 fuel regulations), and longer travel distances as a result ofincreased exports from the US to Asia.
These expectations of an impending market recovery, combined withcyclical low newbuild and secondhand prices, have sparked increasedactivity in both markets. Undoubtedly, some shipowners arepositioning themselves for the next upswing in freight rates.
We are sceptical of the argument that the market may be past thebottom, and remain unconvinced that a freight rate recovery isimminent. Demand growth could drop below 3% in 2018 if US exportgrowth slows. Further, we expect changes in the underlying demandlandscape to curb LPG demand growth at around 4% per year from2019 to 2023. Although deliveries are slowing, they are doing so froma high level and we expect them to outpace demand growth up to2020. We believe it will take longer than expected for the vesseloversupply to be reduced, even if demolition activity increases and USexports continue to power longer travel distances from 2019 onwards.
Source: Danish Ship Finance
Coastal carriers
Ethylene carriers
SGCVLGC
MGC
The LPG Tanker market |

Shipping Market Review – May 2018 61
In the VLGC, MGC and SGC segments, timecharter rates remainclose to or at all-time low levels. The VLGC timecharter rate bottomedout in October 2016 at around USD 16,000 per day after droppingmore than 70% over a 12-month period. From October 2016 to March2018, the VLGC rate increased by USD 300 per day (2%) to aroundUSD 16,200 per day. In the same period, the MGC timecharter ratedeclined almost continuously and is currently at an all-time low of USD13,500 per day. SGC (semi-ref) timecharter rates have improved toaround USD 14,500 per day after reaching an all-time low of aroundUSD 11,500 per day in October 2017. In the coastal carrier (VSGC<5,000 cbm) segment, the timecharter rate remains high due to lowfleet growth and increasing coastal trade. In the ethylene carriersegment, a subsegment of MGC and SGC, growth in demand forpetrochemical gases has kept freight rates from declining to near all-time low levels despite high fleet growth. VLGC, MGC and SGCtimecharter rates could improve marginally in 2018 and 2019,
powered by longer travel distances and increasing demolition activity.
Secondhand and newbuilding prices are at a cyclical low.Secondhand prices for VLGCs, MGCs and SGCs declined by an averageof 10% in 2017 in the wake of the deteriorating market fundamentals,and could stay at the current low levels or even decline further iffreight rates only improve marginally in 2018 and 2019. Newbuildingprices dropped by around 3% on average in 2017.
Sales activity increased in 2017. A total of 38 vessels changed hands– five VLGCs, five MGCs, 13 SGCs and 15 VSGCs – up from 24 vesselsin 2016. The increased activity did not support prices, which couldsuggest that investors are not yet willing to price in the expectedupswing.
THE LPG TANKER MARKETFreight rates and ship prices
Source: Clarksons, Drewry, Danish Ship Finance
1-YEAR TIMECHARTER (USD PER DAY) SECONDHAND PRICES – 5 YEARS (USD MILLION)
2016
40,000
0
20192018
20,000
20172013 20152014
80,000
60,000
+287
VLGC 65k+ cbm MGC 20-25k cbm SGC 5-20k cbm
80
20182017
100
60
40
20
201620142013 2015
-5
-4
The LPG Tanker market |

Shipping Market Review – May 2018 62
THE LPG TANKER MARKETSupply-side developments
From 2014 to 2016, contracting plummeted from 105 vessels to justeight. In 2017, contracting started to increase, and a total of 21vessels were ordered: 12 VLGCs, four MGCs and five SGCs. The trendcontinued during the first three months of 2018, with a total of 11vessels ordered compared to just three in the same period in 2017.The increase might seem insignificant, but the upward trend isbecoming a real threat to a market recovery, as it lifts future fleetgrowth above the expected annual increase in demand of around 4%per year up to 2020. We can only speculate about the reasons for theincrease in contracting. It might be that some owners are trying toanticipate an increase in demolition activity sparked by the IMO 2020fuel regulation. Currently, only a third of owners with vessels in theorderbook also have vessels older than 20 years.
Deliveries declined to 9% of the fleet in 2017 and will come down to4% in 2018, only to rise to 6% in 2019 based on the increasing
number of contracts. We believe that expected deliveries for 2020could increase to at least 6% during 2018 if contracting continues atthe current pace.
Driven by high scrap prices and the poor market fundamentals,demolition increased sharply during the first three months of 2018,as ten vessels exited the fleet compared to 23 and 20 vessels in thewhole of 2016 and 2017, respectively. Over the next two years, theIMO 2020 fuel regulation (IMO 2020) is expected to provideshipowners with an added incentive to scrap older vessels. IMO 2020will necessitate additional investments, possibly reducing the futureprofit of older vessels to the point where scrapping is a moreeconomical alternative. However, the fleet renewal potential figurebelow shows that only the SCG and VSGC segments will be able toabsorb the current orderbook without vessels younger than 25 yearsbeing scrapped.
Source: Clarksons, Danish Ship Finance
FLEET DEVELOPMENT (MILLION CBM) FLEET RENEWAL POTENTIAL (CBM)AGE DISTRIBUTION OF FLEET (MILLION CBM)
12
8
0
16
4
Orderbook
11%
30+10-15 25-30
6%
15-20 20-25
21%
6%
0-5
7%
13%
2%
5-10
45%
Percentage of fleet
6
4
2
0
-2
2020201620152013 2017
6%5%
3%
7%
18%
4%
2019
9%
17%
2014 2018
SGCMGC OrderbookLGCVLGC
Annual fleet growthDeliveries
Scrapping
0% 12%9% 15%3%
0
6%
1
2
VSGC
Ethylene
SGC
VLGC
MGC
Orderbook / total fleet
Ord
erb
ook /
fle
et
>25 y
rs
The LPG Tanker market |

Shipping Market Review – May 2018 63
PositiveNegative ✓
Conditions in the LPG market are expected to remain challenging in2018 and 2019. We identify additional downside risk in the freight ratemarket. In the first quarter of 2018 US LPG volumes available forexport were limited due to higher domestic LPG demand, which iscreating uncertainty of total US export in 2018. Moreover, the currentoversupply of vessels and the fact that fleet growth could outpacedemand even more strongly in 2018 and 2019 may lower fleetutilisation further. Two factors that support freight rates during thisperiod are increasing demolition activity sparked by the IMO 2020 fuelregulation and growth in travelling distances driven by long-haul USexports bound for Asia from 2019 onwards.
From 2020 onwards, we expect demand to grow at an annual averagerate of around 4%. Although this is significantly slower than in pastyears, the LPG market could still start to recover. However, ifcontracting activity continues at the current pace, fleet growth couldoutstrip demand in 2020 and demolition activity would have to
increase to absorb excess capacity. We argue that the expectedrecovery in freight rates may be slower and weaker than generallyseems to be expected currently.
There are factors that could push LPG demand growth higher than 4%in the medium to long term. Growing demand for plastic, particularlyin Asia, could initiate a new wave of newbuild petrochemical capacity,some of which will be fuelled by LPG. Moreover, the environmentalpush in many emerging economies could spark higher LPG demand ashouseholds seek to replace dirty-burning fuels. The unmet potential issizeable, but it requires local governments both to invest heavily ininfrastructure and to subsidise LPG prices to incentivise people toswitch fuel types. If this added demand emerges, it would support theLPG market. However, it is difficult to predict the likelihood and timingof this, and downside risk related to plastic recycling and theemergence of solar-powered cooking stoves persists, which could keepdemand growth at around 4%.
THE LPG TANKER MARKETThe market outlook
The IMO 2020 fuel regulations could potentially increase demolition of older vessels to the point where supply growth dips below demand growth.
A slowdown in newbuild PDH plants in the petrochemical sector and increased competition from natural gas in the industrial and household sector are causing demand growth to
decelerate.
Demand for plastic products is expected to double by 2050. In order to meet demand, petrochemical capacity needs to be expanded massively.
Applying circular economy principles to the plastics industry could reduce the growth rate of new plastic production.
There is a need to replace dirty-burning fuels like wood and charcoal in the household sector in large parts of the world.
IMO 2020 fuel regulations
Changing demand landscape
Growing demand for plastic
Circular economy
Household sector demand
FORCES AT WORK IMPACTING THE DEMAND OUTLOOK
✓
✓
✓
The LPG Tanker market |

Shipping Market Review – May 2018 64
New market dynamics for seaborne LPG demand are emerging.Key LPG market drivers like Chinese propane dehydrogenationplants, the Indian household sector and US exports are movinginto a more mature phase, and growth rates in the seaborneLPG market are decelerating.
The strategy to lower propylene imports by taking advantage of cheapand abundant propane feedstock has been behind the expansion inChinese propane dehydrogenation capacity (PDH plants). Powered bythe massive growth in PDH plant capacity, China has become theworld’s largest LPG importer. PDH plants in China consume more than5 million tonnes of LPG per year, accounting for about a quarter ofChinese LPG imports. However, Chinese propylene production hascaught up with demand and for now PDH capacity is set to expand ata slower rate. In India, demand growth is also expected to slow. Indiahas doubled its imports of LPG over the last four years and hasbecome the world’s second-largest importer. The government’smassive investments in LPG infrastructure have raised LPG coverageto almost 80% of the population and subsidised prices have stimulatedmassive demand growth. However, as Indian LPG coverage increases,the untapped demand potential shrinks. Moreover the remaining 20%of the Indian population without access to LPG is generally very poorand not expected to generate massive new demand growth.
The explosive growth in US LPG exports, which has boosted distance-adjusted LPG demand, has begun to slow as production moves into amore mature phase. From 2012 to 2016, US LPG exports alonegenerated an annual average increase in global seaborne LPG demandof 7%. From 2018 to 2023, US LPG exports are only expected to liftglobal seaborne LPG demand by an annual average of around 2%.Growth could potentially fall lower than this and approach 0% in 2018.US domestic LPG demand has increased significantly in the firstquarter of 2018 due to new petrochemical capacity coming online andstrong heating requirements. US exports have not only supportedseaborne demand by increasing travelling distances, they have alsoboosted arbitrage trade. When US LPG exports accelerated around2012, the low price of US LPG created very profitable arbitrageopportunities in the higher-priced global market, which supported
seaborne demand and boosted freight rates. However, as globaldemand for US LPG increased, the price gap narrowed towardsshipping costs. Going forward, the price gap is expected to remainrelatively close to shipping costs and arbitrage opportunities are likelyto be limited. But should extreme changes in US gas prices or globaloil prices occur, it would stimulate arbitrage and increase freight rates.
These new market dynamics dampen the demand outlookconsiderably. Seaborne demand grew at double-digit rates between2014 and 2016 but only increased by 3% in 2017. We expectseaborne demand to grow by another 3% in 2018 but to average 4%annually up to 2023. If owners do not adjust to a much lower demandoutlook, freight rates could stay low for longer. We are already seeingincreased activity in the newbuilding market, indicating that somemarket players believe the market has reached the bottom. If thistrend gains pace, it may prolong the low freight rate environmentbeyond 2019.
LPG MARKET DEEP DIVE: MARKET DYNAMICS ARE CHANGINGChanges in the underlying demand landscape are affecting growth in seaborne LPG trade
Source: Clarksons, Drewry, Danish Ship Finance
LPG IMPORTS BY SOURCE (MILLION TONNES)
0
120
90
60
30
2023
4%
2021
4%3%
13%
2013 2019
4%
2017
11%
4%
201820162015 20222020
4%
3%
4%
2014
10%
Annual growth AfricaThe Middle East OthersUS
The LPG Tanker market |

THE LNG MARKET
SHIPPING MARKET REVIEW – MAY 2018

Shipping Market Review – May 2018 66
OU
TLO
OK
SU
MM
AR
Y
POSITIVE
NEUTRAL
NEGATIVE
THE LNG TANKER MARKETPerspectives and key takeaways
The LNG market continues to recover from its cyclical low. Marketfundamentals are being supported by strong demand, lower thanexpected fleet growth and longer travelling distances.
In 2017, demand increased by around 10%, reaching roughly 295million tonnes. The fleet only grew by 6%, whereas around 9% wasexpected, and vessel utilisation was further supported by longertravelling distances on the back of long-haul US exports. This powereda recovery in the freight rate market, with spot rates rising around60% to around USD 78,000 per day and timecharter rates up byaround 30% to around USD 40,000 per day in 2017.
The freight market is becoming more spot-oriented: more cargocontracts are being traded with shorter maturities, smaller volumesand destination flexibility. Buyers are becoming more price-sensitive,especially in the less mature markets. This translates into more spottrades and shorter timecharter contracts in the vessel market. Spottrade accounted for around 25% of all trade volumes in 2017, up fromaround 20% in 2014. In the same period, the average length of atimecharter contract declined from around 12 years to around seven.This development increases the investment risk, as vessel earningsbecome more exposed to freight rate volatility.
We maintain a positive market outlook for the next two years. Demand
Market fundamentals continue to improvein the LNG market. The spot rate and thetimecharter rate increased throughout2017. The market recovery is expected tocontinue up to 2020, supported by strongdemand and increasing travellingdistances. However, the supply anddemand balance will remain sensitive todelays in LNG export facilities and iscontingent on the delivery rate of newbuildvessels being lower than expected.
WHERE WE ARE IN THE FREIGHT RATE CYCLE
will be driven by the expansion of export facilities in the US, Australiaand Russia. US exports to Asia are increasing travelling distances,which is supporting vessel utilisation beyond growth in cargo volumes.However, the orderbook remains high at 25% of the fleet and isheavily front-loaded. For freight rates to recover further, severaldeliveries will need to be postponed.
The medium-term outlook is weakening, though, as expansion of LNGexport facilities is set to slow after 2020, and growth in cargo volumeswill decline unless new export facilities are built. This could cause thebalance between supply and demand to deteriorate on the vessel sideby the early 2020s. For seaborne LNG demand to continue to growbeyond the early 2020s, final investment decisions need to be securedfor several new export facilities within the next few years.
Our long-term outlook for seaborne LNG is burdened by the prospectof deregulation in global energy markets. LNG projects have longrepayment periods, corresponding to investors’ preference for long-term volume contracts. However, importers are now starting to seekshort-term contracts to stay competitive in downstream markets, sincethe deregulation of energy markets is enabling customers to take amore individual and flexible approach to their energy supply, includingrenewable energy.
Source: Danish Ship Finance
LNG
The LNG Tanker market |

Shipping Market Review – May 2018 67
The freight rate market continued its recovery throughout 2017. Spotrates increased by around USD 23,000 per day (60%) on average andthe timecharter rate rose by around USD 10,000 per day (30%) toaround USD 40,000 per day. Spot rates peaked at the end of the yearwith demand growing at an average monthly rate of 9% in Novemberand December. In the first quarter of 2018, rates came down sharplyas nominal fleet growth hit a record high of almost 3 million cbm (4%fleet growth). In mid-April, spot rates were USD 25,000 per day for an140,000 cbm steam turbine (ST) vessel and USD 42,000 per day for amore modern 160,000 cbm tri-fuel diesel electric (TFDE) vessel. Weexpect that freight rates will recover some of the recent lost ground,but the orderbook will continue to cap the upside potential.
The newbuild price for a 174,000 cbm vessel has declined 10% since2016. In this period, the orderbook has come down from 155 vesselsto 105. The current newbuild price is USD 180 million. Newbuild prices
are expected to increase if contracting continues its current upwardtrend.
Sales activity increased in 2017: a total of eight vessels changedhands in the secondhand market compared with only four in 2016.Secondhand prices series are not available, as the market is illiquidwith few vessels being sold. Half of the vessels sold in 2017 wereyounger than 15 years, while the other half were 35-plus years. Theolder vessels were in lay-up prior to being sold and have remained so.Sales activity in the LNG market is typically low and 2017 salesrepresent the fourth-largest number of vessels traded in thesecondhand market in the last ten years.
THE LNG TANKER MARKETFreight rates and ship prices
Source: Clarksons, Danish Ship Finance
FREIGHT RATES (USD PER DAY) NEWBUILDING PRICES (USD MILLION)
160,000
120,000
80,000
0
20162014 2018 20192013
40,000
20172015
+30,850
NB price 174k cbmSpot 140k cbm STTC 160k cbm Spot 160k cbm TFDE
2016
210
20182014
195
225
2017
165
20152013
180
2019
-19
The LNG Tanker market |

Shipping Market Review – May 2018 68
THE LNG TANKER MARKETSupply-side development
The LNG segment is a niche market. The LNG fleet (>40,000 cbm)contains 480 vessels and the orderbook holds 105 vessels. As vessels’earnings have started to increase, investors are showing renewedinterest in the LNG market and contracting has starting to recover.In 2017, 13 vessels were ordered after the steep drop from 64 vesselsin 2014 to just eight in 2016. In the first quarter of 2018, 17 vessels(2.9 million cbm) were ordered.
One of the main drivers of the current market recovery has beendelays in deliveries. In 2017, more than 50 vessels were expected toenter the fleet, but only 28 vessels ended up being delivered. Thiskept fleet growth at 6% and supported higher fleet utilisation. Asorders were postponed into 2018, expected fleet growth ballooned toa record high of 15%. Even though nominal fleet growth reached arecord high of almost 3 million cbm in the first three months of 2018,only 17 vessels out of an expected 35 actually entered the fleet. We
believe this trend will continue throughout the year and expect to seea fair share of 2018 deliveries being postponed to 2019. Based on thecurrent orderbook and assuming that half of annual deliveries arepostponed year after year (see the righthand chart below, whichshows the fleet development with a delivery ratio of 50%), the fleet isexpected to grow at annual average rate of 7% over the next threeyears.
Demolition in the LNG market has historically been very low. Themaximum number of vessels scrapped in a single year is five, in 2013.In 2017, two vessels with a combined capacity of around 250,000 cbmwere demolished and a single vessel with a capacity of 120,000 cbmhas so far been scrapped in 2018. We expect demolition to remainlimited as rising freight rates reduce the incentive to scrap oldervessels.
Source: Clarksons, Danish Ship Finance
FLEET DEVELOPMENT (MILLION CBM) FLEET DEVELOPMENT - DELIVERY RATIO AT 50%AGE DISTRIBUTION OF FLEET (MILLION CBM)
32
24
16
8
0
33%
Orderbook
1%
25-30
5%
5-10
30%
15-20
4%
30+20-25
21%
10-15
24%
6%
0-5
12
4
8
0
-4
9%
20142013
4%
2017
7%
2016 2020
4%
2019
6%
15%
6%
20182015
8%
Orderbook>140k cbm 100-140k cbm <100k cbm
Annual fleet growthDeliveries
Scrapping
12
8
4
0
-4
2013
9%
4%
2014
6%6%
9%
20182017 2020
5%
20192015
7%
2016
8%
The LNG Tanker market |
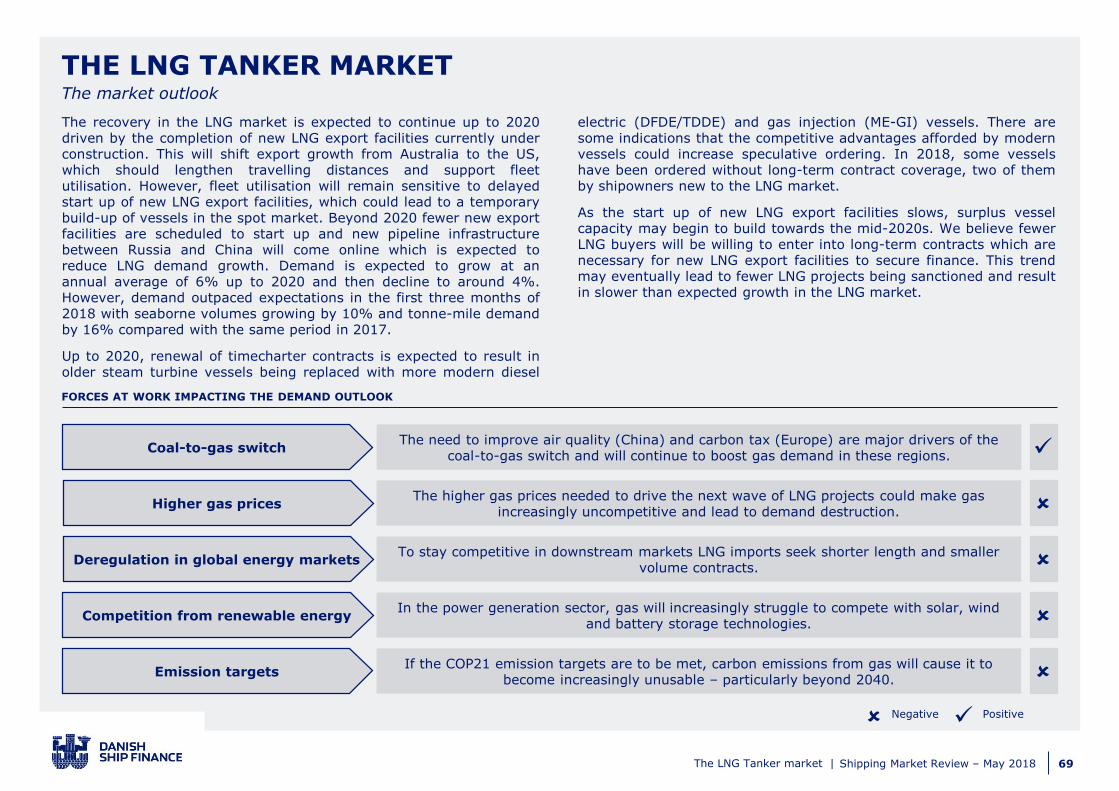
Shipping Market Review – May 2018 69
PositiveNegative ✓
The recovery in the LNG market is expected to continue up to 2020driven by the completion of new LNG export facilities currently underconstruction. This will shift export growth from Australia to the US,which should lengthen travelling distances and support fleetutilisation. However, fleet utilisation will remain sensitive to delayedstart up of new LNG export facilities, which could lead to a temporarybuild-up of vessels in the spot market. Beyond 2020 fewer new exportfacilities are scheduled to start up and new pipeline infrastructurebetween Russia and China will come online which is expected toreduce LNG demand growth. Demand is expected to grow at anannual average of 6% up to 2020 and then decline to around 4%.However, demand outpaced expectations in the first three months of2018 with seaborne volumes growing by 10% and tonne-mile demandby 16% compared with the same period in 2017.
Up to 2020, renewal of timecharter contracts is expected to result inolder steam turbine vessels being replaced with more modern diesel
electric (DFDE/TDDE) and gas injection (ME-GI) vessels. There aresome indications that the competitive advantages afforded by modernvessels could increase speculative ordering. In 2018, some vesselshave been ordered without long-term contract coverage, two of themby shipowners new to the LNG market.
As the start up of new LNG export facilities slows, surplus vesselcapacity may begin to build towards the mid-2020s. We believe fewerLNG buyers will be willing to enter into long-term contracts which arenecessary for new LNG export facilities to secure finance. This trendmay eventually lead to fewer LNG projects being sanctioned and resultin slower than expected growth in the LNG market.
THE LNG TANKER MARKETThe market outlook
The need to improve air quality (China) and carbon tax (Europe) are major drivers of the coal-to-gas switch and will continue to boost gas demand in these regions.
The higher gas prices needed to drive the next wave of LNG projects could make gas increasingly uncompetitive and lead to demand destruction.
To stay competitive in downstream markets LNG imports seek shorter length and smaller volume contracts.
In the power generation sector, gas will increasingly struggle to compete with solar, wind and battery storage technologies.
If the COP21 emission targets are to be met, carbon emissions from gas will cause it to become increasingly unusable – particularly beyond 2040.
Coal-to-gas switch
Higher gas prices
Deregulation in global energy markets
Competition from renewable energy
Emission targets
FORCES AT WORK IMPACTING THE DEMAND OUTLOOK
✓
The LNG Tanker market |
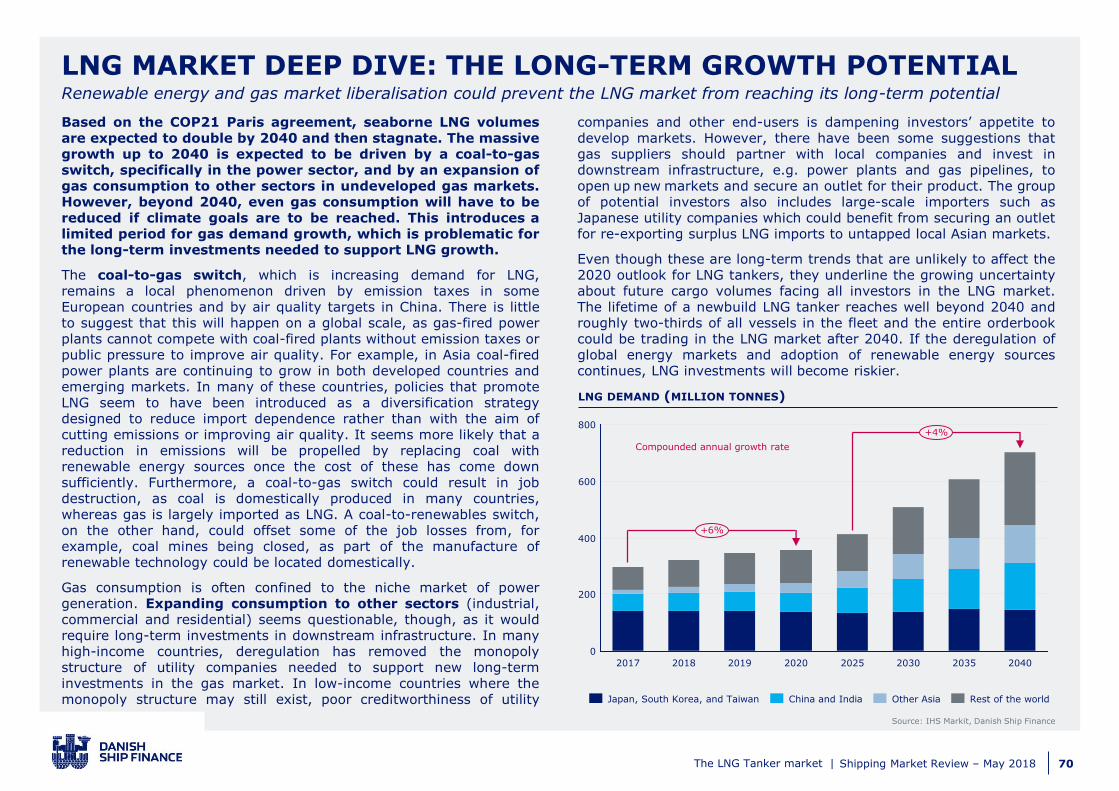
Shipping Market Review – May 2018 70
Based on the COP21 Paris agreement, seaborne LNG volumesare expected to double by 2040 and then stagnate. The massivegrowth up to 2040 is expected to be driven by a coal-to-gasswitch, specifically in the power sector, and by an expansion ofgas consumption to other sectors in undeveloped gas markets.However, beyond 2040, even gas consumption will have to bereduced if climate goals are to be reached. This introduces alimited period for gas demand growth, which is problematic forthe long-term investments needed to support LNG growth.
The coal-to-gas switch, which is increasing demand for LNG,remains a local phenomenon driven by emission taxes in someEuropean countries and by air quality targets in China. There is littleto suggest that this will happen on a global scale, as gas-fired powerplants cannot compete with coal-fired plants without emission taxes orpublic pressure to improve air quality. For example, in Asia coal-firedpower plants are continuing to grow in both developed countries andemerging markets. In many of these countries, policies that promoteLNG seem to have been introduced as a diversification strategydesigned to reduce import dependence rather than with the aim ofcutting emissions or improving air quality. It seems more likely that areduction in emissions will be propelled by replacing coal withrenewable energy sources once the cost of these has come downsufficiently. Furthermore, a coal-to-gas switch could result in jobdestruction, as coal is domestically produced in many countries,whereas gas is largely imported as LNG. A coal-to-renewables switch,on the other hand, could offset some of the job losses from, forexample, coal mines being closed, as part of the manufacture ofrenewable technology could be located domestically.
Gas consumption is often confined to the niche market of powergeneration. Expanding consumption to other sectors (industrial,commercial and residential) seems questionable, though, as it wouldrequire long-term investments in downstream infrastructure. In manyhigh-income countries, deregulation has removed the monopolystructure of utility companies needed to support new long-terminvestments in the gas market. In low-income countries where themonopoly structure may still exist, poor creditworthiness of utility
companies and other end-users is dampening investors’ appetite todevelop markets. However, there have been some suggestions thatgas suppliers should partner with local companies and invest indownstream infrastructure, e.g. power plants and gas pipelines, toopen up new markets and secure an outlet for their product. The groupof potential investors also includes large-scale importers such asJapanese utility companies which could benefit from securing an outletfor re-exporting surplus LNG imports to untapped local Asian markets.
Even though these are long-term trends that are unlikely to affect the2020 outlook for LNG tankers, they underline the growing uncertaintyabout future cargo volumes facing all investors in the LNG market.The lifetime of a newbuild LNG tanker reaches well beyond 2040 androughly two-thirds of all vessels in the fleet and the entire orderbookcould be trading in the LNG market after 2040. If the deregulation ofglobal energy markets and adoption of renewable energy sourcescontinues, LNG investments will become riskier.
LNG MARKET DEEP DIVE: THE LONG-TERM GROWTH POTENTIALRenewable energy and gas market liberalisation could prevent the LNG market from reaching its long-term potential
Source: IHS Markit, Danish Ship Finance
LNG DEMAND (MILLION TONNES)
600
400
0
200
800
2025 2040
+6%
2035202020182017 2019 2030
+4%
China and India Rest of the worldOther AsiaJapan, South Korea, and Taiwan
Compounded annual growth rate
The LNG Tanker market |

THIS PAGE IS INTENTIONALLY LEFT BLANK

FOR FURTHER INFORMATION
PLEASE VISIT WWW.SHIPFINANCE.DK