Danish Offshore Wind Key Environmental Issues - Tethys · tive eff ects from multiple off shore...
144
dong energy vattenfall danish energy authority danish forest and nature agency Key Environmental Issues danish offshore wind
Transcript of Danish Offshore Wind Key Environmental Issues - Tethys · tive eff ects from multiple off shore...

dong energyvattenfall
danish energy authoritydanish forest and nature agency
Key Environmental Issuesdanish offshore wind
dong energy
vattenfall
danish energy authority
danish forest and nature agency
Key Environmental Issuesdanish offshore wind

Danish Off shore Wind– Key Environmental Issues
Published by DONG Energy, Vattenfall, Th e Danish Energy Authority
and Th e Danish Forest and Nature Agency
November 2006
Danish Forest and Nature Agency
Copy editor:
Operate A/S
Advisors:
The Environmental Group consisting of:
Jette Kjær, Vattenfall
Jesper Kyed Larsen, Vattenfall
Charlotte Boesen, DONG Energy
Henriette Hassing Corlin, DONG Energy
Steff en Andersen , DONG Energy
Steff en Nielsen, Th e Danish Energy Authority
Anne Grethe Ragborg, Th e Danish Forest and Nature Agency
Karen M. Christensen, Th e Danish Forest and Nature Agency
Future activities suggested by the authors in this publication does not
necessarily refl ect the policy recommendations of the publishers.
Language review:
Textwise
Layout:
Operate A/S
Printed by:
Prinfo Holbæk-Hedehusene
1st edition, 2000 copies
Th e publication can be ordered from the Danish Energy Authority’s
Internet bookstore http://ens.netboghandel.dk
Th e Background reports of the environmental monitoring programme
can be downloaded from www.ens.dk/off shorewind
ISBN: 87-7844-625-2
ISBNwww: 87-7844-626-0
Photo credits:
Cover
Wind Turbine: Nysted Off shore Wind Farm
Cod: Jens Christensen
Grey Seal: Svend Tougaard
Hermit Crab: Maks Klaustrup
Common Eider: Daniel Bergmann
Horns Rev Off shore Wind Farm: Christian B. Hvidt
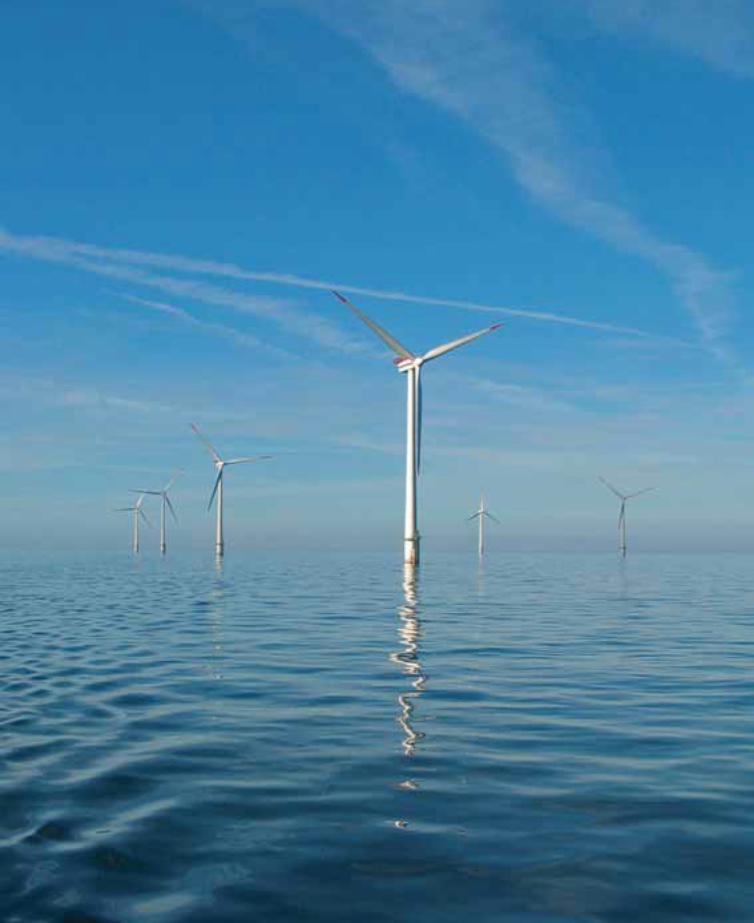
Following page
Horns Rev Off shore Wind Farm: Christian B. Hvidt
Chapter 1 opening page
Nysted Off shore Wind Farm: Christian B. Hvidt
Chapter 2 opening page
Nysted Off shore Wind Farm: Nysted Off shore Wind Farm
Chapter 3 opening page
Nysted Off shore Wind Farm: Nysted Off shore Wind Farm
Chapter 4 opening page
Common mussels: Maks Klaustrup
Chapter 5 opening page
Fishing by Nysted Off shore Wind Farm: Christian B. Hvidt
Chapter 6 opening page
Harbour porpoise: Jonas Teilmann
Chapter 7 opening page
Cormorants at fundament: Nysted Off shore Wind Farm
Chapter 8 opening page
Nysted Off shore Wind Farm: Christian B. Hvidt
Chapter 9 opening page
Nysted Off shore Wind Farm: Nysted Off shore Wind Farm
preface
the power source for the future
Our future energy supply faces numerous challenges and
has become subject to unstable international conditions.
To meet these challenges off shore wind has a key role to
play. Off shore windpower can contribute signifi cantly to
achieving the EU goals of a 21 per cent share of renewable
electricity by 2010, halting global warming and reducing
our dependence on coal, oil and gas.
We have come a long way since the 1980s, when most
electricity production was based on coal and when the
acidifi cation of forests and lakes by acid rain was the pre-
dominant theme in the environmental debate. Today wind
power provides 20% of Danish electricity consumption.
Within a few years, the wind power industry has grown
to become a signifi cant industrial sector providing huge
benefi ts for exports and employment. We are now talking
about windpower generation plants rather than single
turbines, and the Danish wind power industry is at the
leading edge in an ever more competitive global market.
In the energy strategy for 2025 the Government expects
to see a signifi cant increase in the use of renewable energy
in the years to come. Th e market-based expansion of this
sector will be brought about through incentive schemes
and investment in physical infrastructure as well as re-
search-, development- and demonstration. With higher
oil prices and high CO2 allowance prices we expect that
a signifi cant proportion of the renewable energy expan-
sion will be delivered by large, off shore wind farms. At
sea, wind resources are better and suitable sites are more
readily available to enable these large projects to operate
in harmony with the surrounding environment.
We are therefore very pleased that the Danish environ-
mental monitoring programme on large scale off shore wind
power has received a positive evaluation by the International
Advisory Panel of Experts on Marine Ecology.
To sustain public acceptance and provide continued
protection to vulnerable coastal and marine habitats,
it is important to build upon the positive experience
gained so far with the use of marine spatial planning
instruments.
Off shore Wind farms impact on their natural sur-
roundings and it is essential to ensure that conditions
in unique marine areas are not detrimentally aff ected.
Spatial planning when identifying potential locations
for off shore wind farms – taking into account grid
connection routes and other areas of interests – must
ensure that future off shore wind farms are established
in suitable areas in such a way that substantial adverse
environmental impacts can be avoided or diminished.
One of the challenges we face is to assess the cumula-

tive eff ects from multiple off shore wind farms to arrive
at optimal site selection.
Th us a committee on future off shore wind farms is
currently updating the Danish action plan from 1997 to
use the experience and learning gained to date in order
to identify appropriate locations and at the same time to
minimise visual disturbances and the eff ects on animal
species such as marine birds and mammals.
Th is publication describes the Danish experiences
with off shore wind power and discusses the challenges
of environmental issues that Denmark has had to address
in relation to the two large-scale demonstration off shore
wind farms Horns Rev and Nysted since 1999.
reader’s guide
The fi rst three chapters contain an executive summary
(chapter 1), an introduction to the Danish experiences with
offshore wind farms and the environmental monitoring
programme (chapter 2) and a description of the confi gura-
tion and construction of Horns Rev Offshore Wind Farm
and Nysted Offshore Wind Farm (chapter 3).
The following chapters deal with the key research
fi ndings of the environmental monitoring programme on
benthic communities (chapter 4), fi sh (chapter 5), marine
mammals (chapter 6), birds (chapter 7) and people’s
perceptions of offshore wind farms (chapter 8). Each of
these chapters contains an introduction to key issues, a
description of the research methods, a description of the
results and a discussion of the results.
The book closes with a description of the Danish energy
policy, the planning process and the public consultation
process related to the establishment of offshore wind
farms (chapter 9).
At the end of chapter 1 and 4-8 the International
Advisory Panel of Experts on Marine Ecology (IAPEME)
presents its viewpoints on the results of the environmental
monitoring programme.
Flemming Hansenminister for transport and energy
Connie Hedegaardminister for the environment

preface 04
1: executive summary 08
protecting nature while utilising its power
Good experiences 09
The environmental monitoring 09
Horns Rev and Nysted 11
Benthic fauna: Change in diversity and biomass 12
Fish: Few effects on fi sh communities 13
Marine mammals: Affected by piledriving 14
Birds: Avoidance and displacement 14
Socioeconomic effects: Positive attitudes 16
Policy and planning 16
General IAPEME viewpoints 18
2: introduction 20
towards a common sustainable energy future
Offshore in respect of nature 21
Variable ecosystems 21
Strong international commitments 23
The technological development 25
Positive lessons learned 26
Horns Rev and Nysted wind farms 27
Ambitious environmental programme 28
3: horns rev and nysted 32
152 wind turbines at sea – 325 mw capacity
Confi guration of a wind farm 33
Horns Rev Offshore Wind Farm 35
Nysted Offshore Wind Farm 38
Environmental issues 43
contents

4: infauna, epifauna and vegetation 44
change in diversity and higher biomass
Introduction: Wind farms as new habitats 45
Methods: Seabed and hard bottom sampling 46
Results: Change in benthic communities 46
Discussion: Indirect effects on benthic fauna 61
IAPEME viewpoints 62
5: fi sh 64
few effects on the fi sh communities so far
Introduction: New habitat and sediment 65
Methods: Fish abundance and distribution 66
Results: Similar effects at the two farms 69
Discussion: No effect on fi sh yet 76
IAPEME viewpoints 78
6: marine mammals 80
seals and porpoises react differently
Introduction: Studies of seals and porpoises 81
Methods: New methods developed 82
Results: Pile driving gave reactions 84
Discussion: No simple conclusion 90
IAPEME viewpoints 92
7: birds 94
avoidance responses and displacement
Introduction: Hazards to birds at sea 95
Methods: Radars, surveys and infra-red video 98
Results: Most birds show avoidance responses 102
Discussion: Need for large scale assessment 109
IAPEME viewpoints 111
8: socioeconomic effects 112
positive attitudes in local communities
Introduction: Attitudes and preferences 113
Methods: Sociology and economics 113
Results: A generally positive attitude 116
Discussion: First study to address distance 122
IAPEME viewpoints 123
9: planning 124
policy, planning, participation and permission
Policy background 125
Approval of offshore wind power 128
Transmission grids 130
references 134
index 140
8 executive summary
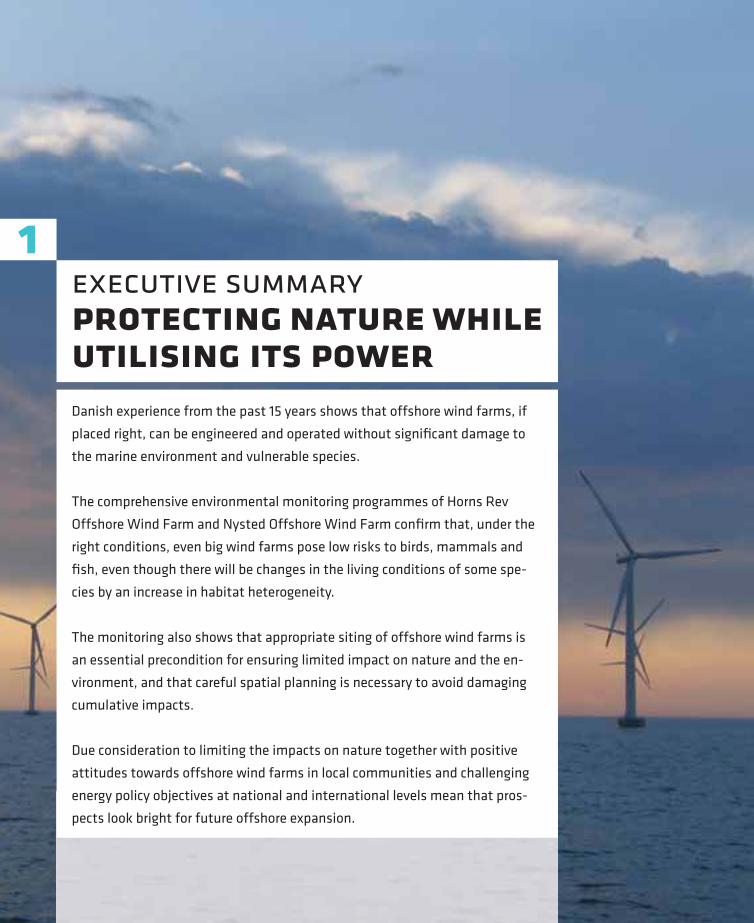
Danish experience from the past 15 years shows that offshore wind farms, if
placed right, can be engineered and operated without signifi cant damage to
the marine environment and vulnerable species.
The comprehensive environmental monitoring programmes of Horns Rev
Offshore Wind Farm and Nysted Offshore Wind Farm confi rm that, under the
right conditions, even big wind farms pose low risks to birds, mammals and
fi sh, even though there will be changes in the living conditions of some spe-
cies by an increase in habitat heterogeneity.
The monitoring also shows that appropriate siting of offshore wind farms is
an essential precondition for ensuring limited impact on nature and the en-
vironment, and that careful spatial planning is necessary to avoid damaging
cumulative impacts.
Due consideration to limiting the impacts on nature together with positive
attitudes towards offshore wind farms in local communities and challenging
energy policy objectives at national and international levels mean that pros-
pects look bright for future offshore expansion.
1executive summaryprotecting nature while utilising its power
good experiences
At present wind energy is the most prominent form
of renewable energy being developed, with signifi cant
growth envisaged for the coming years. So far Danish
experience from off shore wind projects has led the way
towards a promising energy future. Know-how from the
past 15 years demonstrates how off shore wind power is
possible to engineer. Th e framework for expansion of
off shore wind farms in an environmentally sustainable
manner now seems to be in place.
Th e European Union has committed itself to reach
a 21% share of renewable electricity by the year 2010.
To achieve this objective there is an important role for
wind power, and in densely populated countries with
extensive coastline like Denmark off shore wind power
has a key part to play.
While off shore wind farms produce many benefi ts
and the prospects for future expansion are promising,
the technology also faces a number of challenges in
terms of technological performance, competition for
space with other marine users, compatibility with the
European grid infrastructure and effi cient integration in
the energy system, as well as being fully competitive in
the liberalised European electricity market.
Furthermore, all off shore wind farm projects im-
pact on their natural surroundings and may only be
carried out on the basis of an assessment of the envi-
ronmental consequences (an Environmental Impact
Assessment, EIA). Th e establishment of the two large
demonstration wind farms at Horns Rev and Nysted
was not only planned on the basis of extensive EIAs,
it was also followed up by an ambitious environmental
monitoring programme from 2000 to 2006. Th is book
deals with the results of this programme.
the environmental monitoring
Th e environmental monitoring programme was estab-
lished in order to chart the environmental conditions
before, during and aft er the construction of the Horns
Rev Off shore Wind Farm and the Nysted Off shore Wind
Farm. Th e work has been co-ordinated by the Environ-
executive summary 9
contentsGood experiences
The environmental monitoring
Horns Rev and Nysted
Benthic fauna: Change in diversity and biomass
Fish: Few effects on fi sh communities
Marine mammals: Affected by piledriving
Birds: Avoidance and displacement
Socioeconomic effects: Positive attitudes
Policy and planning
General IAPEME viewpoints
<
<
<
<
<
<
<
<
<
<
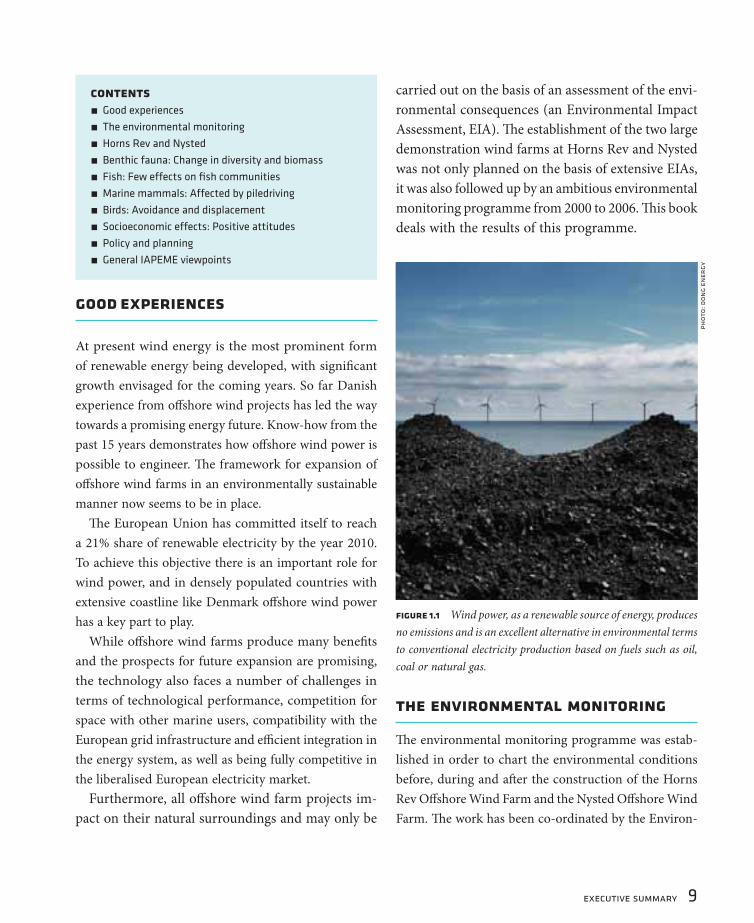
fi gure 1.1 Wind power, as a renewable source of energy, produces
no emissions and is an excellent alternative in environmental terms
to conventional electricity production based on fuels such as oil,
coal or natural gas.
pho
to: d
on
g en
ergy
10 executive summary
mental Group consisting of the Danish Forest and Nature
Agency, the Danish Energy Authority, Vattenfall and
DONG Energy and fi nanced by electricity consumers
as a public service obligation with a budget of DKK 84
million (approx EUR 11 million).
Th e results of the studies have been assessed by the
International Advisory Panel of Experts on Marine Ecology
(IAPEME) and the Environmental Group has also been
in continuous dialogue with a “Green Group” consisting
of representatives from the World Wide Fund for Nature
(WWF), the Danish Society for Conservation of Nature,
the Danish Outdoor Council, Greenpeace, the Danish
Ornithological Society and the Danish Organisation for
Renewable Energy.
environmental monitoring programmeThe projects in the environmental monitoring programme
adhere – where possible – to the “Before After Control Impact
design” (BACI). BACI is a schematic method used to trace
environmental effects from substantial man-made changes
to the environment. The aim of the method is to estimate
the state of the environment before and after any change
and in particular to compare changes at reference sites (or
control sites) with the actual area of impact.
The studies and analyses have dealt with:
Benthic fauna and fl ora, with particular focus on the
consequences of the introduction of a hard-bottom
habitat, which is the turbine foundation and scour pro-
tection, this also included a survey of the in-fauna com-
munity in the wind farms.
The distribution of fi sh around the wind turbines and
the scour protection, and the effect of electromagnetic
fi elds on fi sh.
Studies of the numbers and distribution of feeding and
resting birds, performed by aerial surveys, and of the
food choice of scoters.
Migrating birds, including study of the risks of collision
between birds and wind turbines.
The behaviour of marine mammals – porpoises and seals
– and their reaction to wind farms.
The impact of electromagnetic fi elds on fi sh.
Sociological and environmental-economic studies.
Coastal morphology.
<
<
<
<
<
<
<
<
Vattenfall was established in Denmark in 2006. The company took
over parts of the Danish power companies Elsam and ENERGI E2
and presently supplies approx 25% of the Danish power produc-
tion. As part of this process, Vattenfall took over the operation
of the Horns Rev Offshore Wind Farm, with an ownership share
of 60%, DONG Energy holds the remaining 40%.
In March 2006, the European Commission approved the
merger of the Danish power companies DONG, Elsam, ENERGI
E2 and Nesa as well as the electricity sections of Frederiksberg
Forsyning and Københavns Energi. This means that from the
autumn of 2006 80% of the Nysted Offshore Wind Farm is
owned by DONG Energy with E.ON Sweden holding the remaining
20%. DONG Energy operates the wind farm. Before the merger,
Energi E2 owned 50%, DONG 30% and E.ON Sweden 20%, and
Energi E2 operated the wind farm.
vattenfall and dong energy
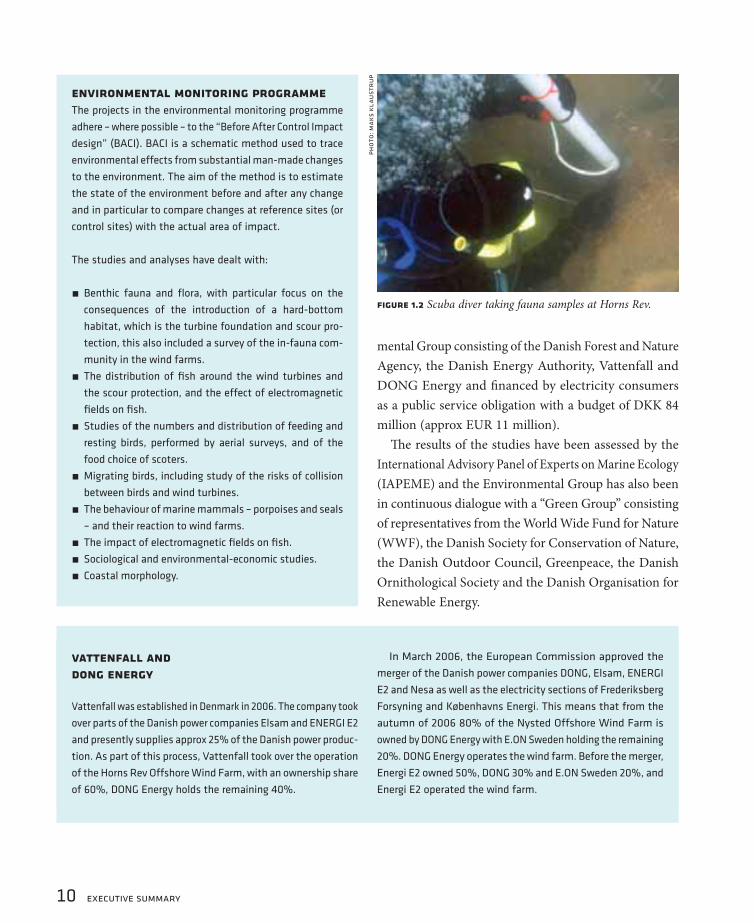
fi gure 1.2 Scuba diver taking fauna samples at Horns Rev.
pho
to: m
ak
s k
lau
str
up
executive summary 11
horns rev and nysted
Th e construction of both the Horns Rev Off shore Wind
Farm and the Nysted Off shore Wind Farm is a result
of a governmental requirement to the utilities. In 1999,
the Danish Energy Authority gave the green light to
undertake preliminary surveys at the two sites. In the
summer of 2000, the EIA for both sites was submitted
to the authorities, and in 2001, the application to build
both wind farms was approved by the authorities.
horns rev offshore wind farm
During the summer of 2002, Elsam constructed the Horns
Rev Off shore Wind Farm sited 14–20 km off the coast
in the North Sea, west of Blåvands Huk. Th e wind farm
consists of 80 turbines totalling 160 MW, equivalent to
the electricity consumption in just over 150,000 Danish
households.
nysted offshore wind farm
Th e Nysted Off shore Wind Farm was constructed by Energi
E2, DONG and E.ON Sweden in the period 2002–03 and
consists of a total of 72 wind turbines placed in 8 rows of
9 turbines each, approx 10 km off shore. Th e 72 turbines
have a total installed capacity of 165.5 MW.
environmental issues
Environmental management systems were established for
both wind farms, including procedures for the handling of
waste, noise and contingency plans in case of environmental
accidents like oil spills. Requests were also made for both
wind farms that in connection with short-term noisy activi-
ties, actions should be taken to scare off marine mammals
likely to be aff ected by the noise. It was also specifi ed that
all transport to and from the wind farms should only take
place in a special transportation corridor, and that access
to the nature protection areas was forbidden without prior
approval by the owner’s environment coordinator.
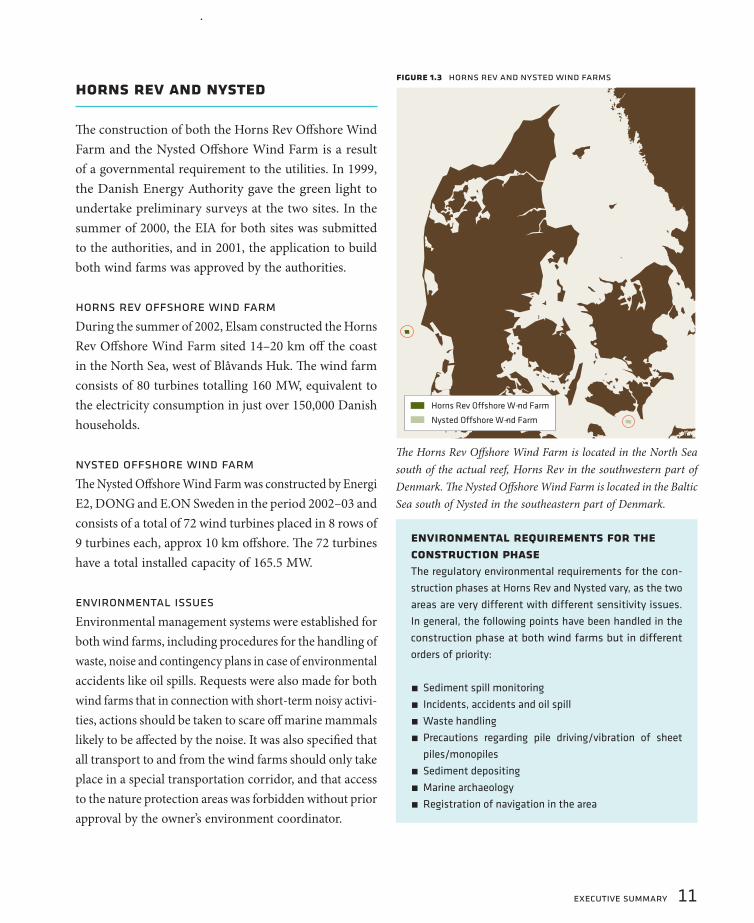
Th e Horns Rev Off shore Wind Farm is located in the North Sea
south of the actual reef, Horns Rev in the southwestern part of
Denmark. Th e Nysted Off shore Wind Farm is located in the Baltic
Sea south of Nysted in the southeastern part of Denmark.
environmental requirements for the construction phaseThe regulatory environmental requirements for the con-
struction phases at Horns Rev and Nysted vary, as the two
areas are very different with different sensitivity issues.
In general, the following points have been handled in the
construction phase at both wind farms but in different
orders of priority:
Sediment spill monitoring
Incidents, accidents and oil spill
Waste handling
Precautions regarding pile driving/vibration of sheet
piles/monopiles
Sediment depositing
Marine archaeology
Registration of navigation in the area
<
<
<
<
<
<
<
12 executive summary
Aft er the establishment of the two wind farms, the
environmental monitoring programme focused on the
eff ects on infauna, epifauna and vegetation, fi sh, marine
mammals, birds and people’s attitudes and preferences
in local areas and nationally. Th e results of the studies
are summarised below.
benthic faunachange in diversity and biomass
A total of six surveys of the seabed’s infauna and veg-
etation community were performed at Horns Rev and
Nysted during the pre- and post-construction phases.
Sampling of benthic communities at turbine foundations
was performed at six turbine sites at Horns Rev and at
eight turbine sites at Nysted. Both types of surveys in-
cluded collection of species, photo-sampling and video
recordings.
Th e main eff ect from establishing the Horns Rev
and Nysted wind farms was the introduction of hard
bottom structures onto seabeds that almost exclusively
consisted of sandy sediments. Th is has increased habitat
heterogeneity and changed the benthic communities at
the turbine sites from typical infauna communities to
hard bottom communities. Abundance and biomass of
the benthic communities increased at the position of the
turbines compared to the native infauna communities. A
consequence of the change in community structure was
a local increase in biomass by 50 to 150 times, most of
this as available food for fi sh and seabirds.
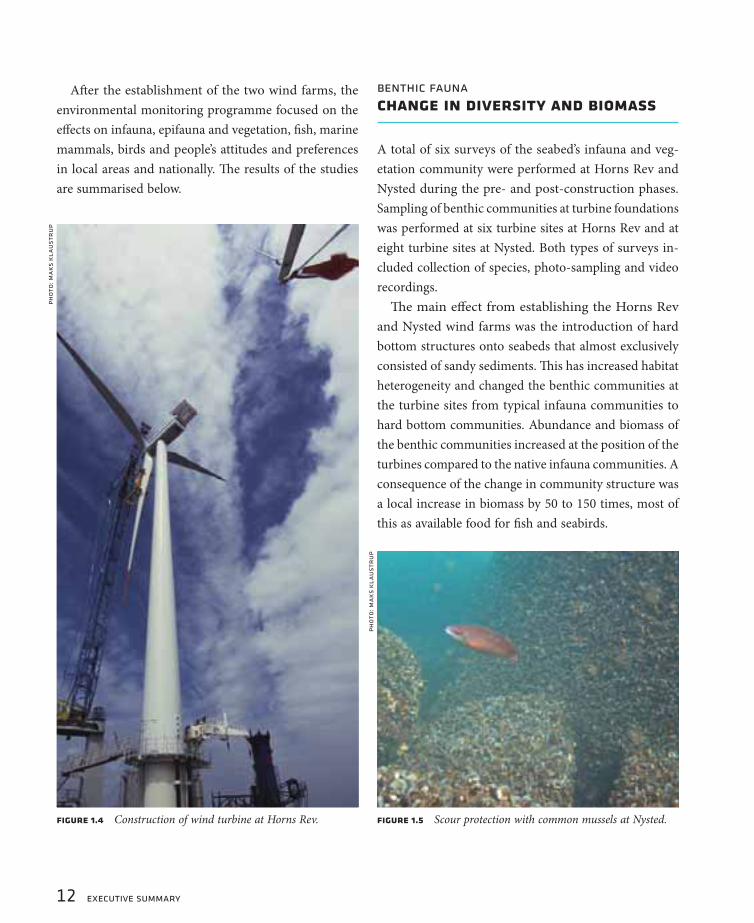
fi gure 1.4 Construction of wind turbine at Horns Rev.
pho
to: m
ak
s k
lau
str
up
fi gure 1.5 Scour protection with common mussels at Nysted.
pho
to: m
ak
s k
lau
str
up

executive summary 13
Th ere were only negligible or no impacts detected
from the changes in the hydrodynamic regimes on the
native benthic communities, seabed sediment structure
or established epifouling communities. Similarities in the
establishment, succession and distribution of epifoul-
ing communities were found between Horns Rev and
Nysted off shore wind farms. Th e diff erences in species
composition were mainly attributable to diff erences in
salinity between the two sites.
fi shfew effects on fi sh communities
Th e spatial and temporal distribution of fi sh at the Nysted
Off shore Wind Farm and Horns Rev Off shore Wind Farm
has been monitored by use of advanced hydroacoustic
equipment with the aim of detecting any eff ects of the
artifi cial reefs.
Data failed to provide signifi cant statistical proof of
the expectation of attracting fi sh to the artifi cial reef. At
Horns Rev, one important reason for this could be that
the studies and investigations were made during the
early stages of colonisation of the turbine foundations
that constitute the artifi cial reefs. Th e colonisation of the
foundations will probably progress over the coming years,
which may lead to higher diversity and biomass of species.
At Nysted, however, the colonisation of the epibenthic
community may be well developed, but the monoculture
of common mussel may not be attractive to fi sh
Investigations into the eff ects on fi sh and fi sh behaviour
from electromagnetic fi elds were only made at Nysted. For
this purpose, a specially designed setup and fi shing gear
were developed and applied to the area along the cable
route connecting the wind farm with the shore.
Data have documented some eff ects from the cable
route on fi sh behaviour indicating avoidance of the cable
as well as attraction, depending on species. However, the
observed phenomena were not signifi cantly correlated with
the assumed strength of the electromagnetic fi elds.
At Horns Rev, sandeel (Ammodytidae spp.) is one of the
most abundant group of fi sh. Due to a known strong correla-
tion between the distribution of sandeel and the composi-
tion of the sediments, the distribution of both sandeel and
sediment composition was surveyed. Th e studies showed
that the wind farm is unlikely to have a negative eff ect on
the sandeel or any eff ect on sediment composition.
fi gure 1.6 Catch of cod at Nysted.
pho
to: c
hr
isti
an
b. h
vidt
14 executive summary
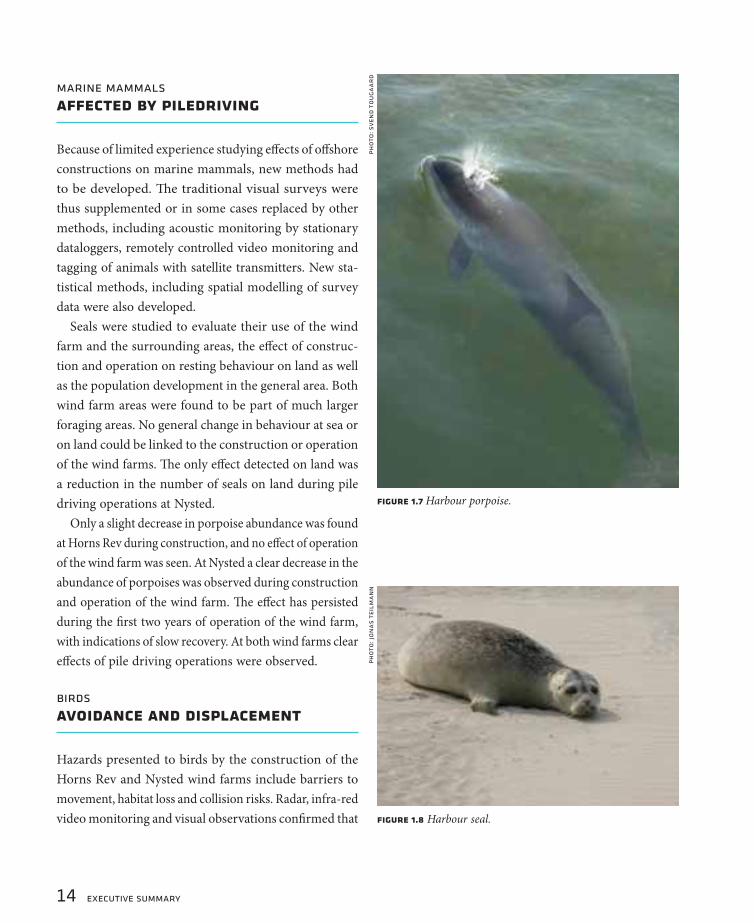
marine mammalsaffected by piledriving
Because of limited experience studying eff ects of off shore
constructions on marine mammals, new methods had
to be developed. Th e traditional visual surveys were
thus supplemented or in some cases replaced by other
methods, including acoustic monitoring by stationary
dataloggers, remotely controlled video monitoring and
tagging of animals with satellite transmitters. New sta-
tistical methods, including spatial modelling of survey
data were also developed.
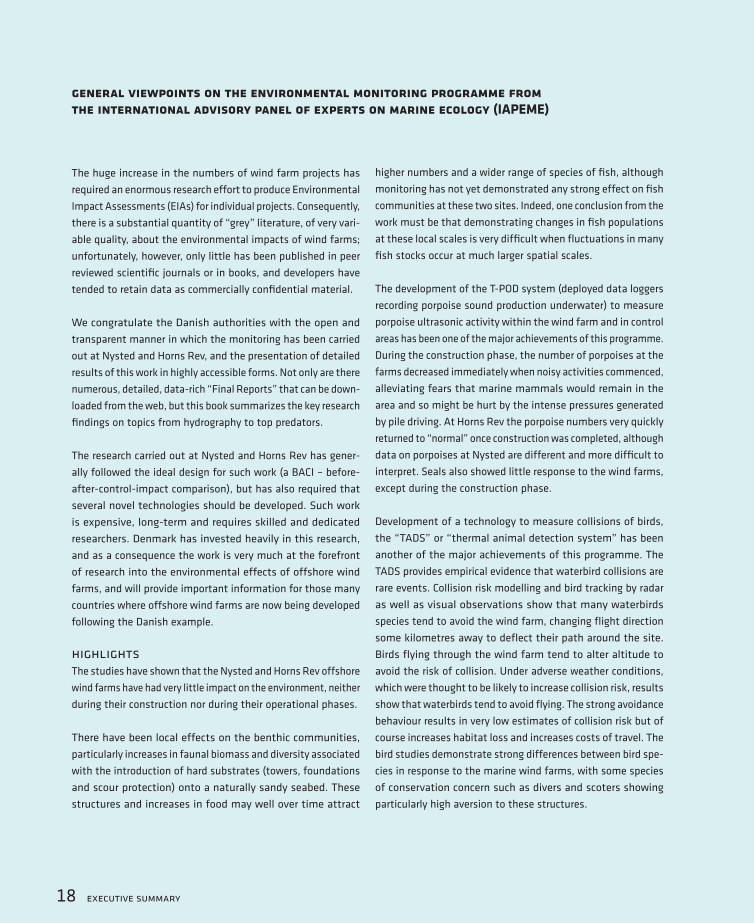
Seals were studied to evaluate their use of the wind
farm and the surrounding areas, the eff ect of construc-
tion and operation on resting behaviour on land as well
as the population development in the general area. Both
wind farm areas were found to be part of much larger
foraging areas. No general change in behaviour at sea or
on land could be linked to the construction or operation
of the wind farms. Th e only eff ect detected on land was
a reduction in the number of seals on land during pile
driving operations at Nysted.
Only a slight decrease in porpoise abundance was found
at Horns Rev during construction, and no eff ect of operation
of the wind farm was seen. At Nysted a clear decrease in the
abundance of porpoises was observed during construction
and operation of the wind farm. Th e eff ect has persisted
during the fi rst two years of operation of the wind farm,
with indications of slow recovery. At both wind farms clear
eff ects of pile driving operations were observed.
birds avoidance and displacement
Hazards presented to birds by the construction of the
Horns Rev and Nysted wind farms include barriers to
movement, habitat loss and collision risks. Radar, infra-red
video monitoring and visual observations confi rmed that
fi gure 1.7 Harbour porpoise.
fi gure 1.8 Harbour seal.
pho
to: s
ven
d t
ou
gaa
rd
ph
oto
: jo
na
s te
ilm
an
n

executive summary 15
most of the more numerous species showed avoidance
responses to both wind farms, although responses were
highly species specifi c. Birds tended to avoid the vicinity
of the turbines and there was considerable movement
along the periphery of both wind farms.
Slightly extended migration distances are unlikely to
have consequences for any species. Neither of the wind
farms lies close to nesting areas to aff ect reproduction.
Post-construction studies showed almost complete ab-
sence of divers and scoters within the Horns Rev Off shore
Wind Farm and signifi cant reductions in long-tailed duck
densities within the Nysted Off shore Wind Farm. Other
species showed no signifi cant change or occurred in too
few numbers to permit statistical analysis.
Although such bird displacement represents eff ective
habitat loss, it is important to assess the loss in terms
of the proportion of potential habitat aff ected relative
to the areas which remain available outside the wind
farms. For most of the species studied, that propor-
tion is relatively small and therefore of little biological
consequence. However, the cumulative impacts of many
other such wind farms may constitute a more signifi cant
eff ect in the future.
Of 235,000 common eiders passing Nysted each au-
tumn, predicted modelled collision rates were 0.02% (45
birds). Th e low fi gure was confi rmed by the fact that no
collisions were observed by infra-red monitoring. Whilst
unlikely to have major eff ects on the overall populations
involved, assessing the cumulative eff ects of these and
other developments remains a future challenge.
fi gure 1.9 Common scoter is one of the numerically important birds at Horns Rev.
pho
to: d
an
iel
ber
gma
nn

16 executive summary
socioeconomic effects positive attitudes
A sociological and environmental economics study conducted
in 2003/2004 revealed that both the local and national
populations were, in general, positively inclined towards
the Horns Rev and Nysted off shore wind farms. However,
it was also clear that attitudes in the two local areas dif-
fered, whilst attitudes also diff ered between the local and
national populations. Overall, inhabitants of the Nysted
area were more critical towards off shore wind farms than
inhabitants from the Horns Rev sample and the national
sample. In terms of the preferences and willingness to pay
for the future location of wind farms, the results showed
a clear picture; people are willing to pay for future wind
farms to be located at distances from the shore where
their visual impact is signifi cantly reduced.
However, the results also indicated that individual
preferences varied depending on experience with visual
intrusion from off shore wind farms. While the overall
willingness to pay to have the wind farms moved com-
pletely out of sight was limited, the respondents in the
Nysted area had a higher willingness to pay for this than
those from the Horns Rev area.
Th e sociological study was based on in-depth interviews
to expose the attitudes towards the two local wind farms
and was supplemented by an analysis of the local media
coverage of the wind farms. Th e environmental economics
study used a quantitative questionnaire based on the Choice
Experiment method to elicit the preferences for diff erent
location strategies and included a Horns Rev, Nysted and
national sample. Th is made it possible to compare the local
fi ndings with general national attitudes and preferences.
policy and planning
Th e right to exploit wind energy within the Danish wa-
ters belongs to the Danish State. Permission to conduct
preliminary studies and to exploit wind energy at sea is
only granted by the Danish Energy Authority, either aft er
fi gure 1.10 Nysted Off shore Wind Farm.photo: nysted offshore wind farm

executive summary 17
applications have been requested in connection with a call
for tenders or aft er an application has been made public and
other interested parties have been given the opportunity
to apply. Concessions for the establishment of two new
off shore wind farms have already been awarded.
As a follow up to the Energy Strategy 2025, the Dan-
ish Government has decided that the Action Plan on
Off shore Wind Power from 1997 is to be updated. Th e
objective with the updating is to carry out a new assess-
ment of where future expansion of off shore wind power
can take place. A committee has been set up dedicated
to assessing the possibilities of future off shore expansion,
and during 2006 this committee is supporting the Danish
Energy Authority in draft ing a new plan for siting of the
next generation of off shore wind farms in the period from
2010 to 2025. Th is process builds on the experience from
the Horns Rev and Nysted wind farms and the results of
the environmental monitoring programme.
fi gure 1.11 Horns Rev Off shore Wind Farm.
pho
to: v
atte
nfa
ll
18 executive summary
The huge increase in the numbers of wind farm projects has
required an enormous research effort to produce Environmental
Impact Assessments (EIAs) for individual projects. Consequently,
there is a substantial quantity of “grey” literature, of very vari-
able quality, about the environmental impacts of wind farms;
unfortunately, however, only little has been published in peer
reviewed scientifi c journals or in books, and developers have
tended to retain data as commercially confi dential material.
We congratulate the Danish authorities with the open and
transparent manner in which the monitoring has been carried
out at Nysted and Horns Rev, and the presentation of detailed
results of this work in highly accessible forms. Not only are there
numerous, detailed, data-rich “Final Reports” that can be down-
loaded from the web, but this book summarizes the key research
fi ndings on topics from hydrography to top predators.
The research carried out at Nysted and Horns Rev has gener-
ally followed the ideal design for such work (a BACI – before-
after-control-impact comparison), but has also required that
several novel technologies should be developed. Such work
is expensive, long-term and requires skilled and dedicated
researchers. Denmark has invested heavily in this research,
and as a consequence the work is very much at the forefront
of research into the environmental effects of offshore wind
farms, and will provide important information for those many
countries where offshore wind farms are now being developed
following the Danish example.
highlightsThe studies have shown that the Nysted and Horns Rev offshore
wind farms have had very little impact on the environment, neither
during their construction nor during their operational phases.
There have been local effects on the benthic communities,
particularly increases in faunal biomass and diversity associated
with the introduction of hard substrates (towers, foundations
and scour protection) onto a naturally sandy seabed. These
structures and increases in food may well over time attract
higher numbers and a wider range of species of fi sh, although
monitoring has not yet demonstrated any strong effect on fi sh
communities at these two sites. Indeed, one conclusion from the
work must be that demonstrating changes in fi sh populations
at these local scales is very diffi cult when fl uctuations in many
fi sh stocks occur at much larger spatial scales.
The development of the T-POD system (deployed data loggers
recording porpoise sound production underwater) to measure
porpoise ultrasonic activity within the wind farm and in control
areas has been one of the major achievements of this programme.
During the construction phase, the number of porpoises at the
farms decreased immediately when noisy activities commenced,
alleviating fears that marine mammals would remain in the
area and so might be hurt by the intense pressures generated
by pile driving. At Horns Rev the porpoise numbers very quickly
returned to “normal” once construction was completed, although
data on porpoises at Nysted are different and more diffi cult to
interpret. Seals also showed little response to the wind farms,
except during the construction phase.
Development of a technology to measure collisions of birds,
the “TADS” or “thermal animal detection system” has been
another of the major achievements of this programme. The
TADS provides empirical evidence that waterbird collisions are
rare events. Collision risk modelling and bird tracking by radar
as well as visual observations show that many waterbirds
species tend to avoid the wind farm, changing fl ight direction
some kilometres away to defl ect their path around the site.
Birds fl ying through the wind farm tend to alter altitude to
avoid the risk of collision. Under adverse weather conditions,
which were thought to be likely to increase collision risk, results
show that waterbirds tend to avoid fl ying. The strong avoidance
behaviour results in very low estimates of collision risk but of
course increases habitat loss and increases costs of travel. The
bird studies demonstrate strong differences between bird spe-
cies in response to the marine wind farms, with some species
of conservation concern such as divers and scoters showing
particularly high aversion to these structures.
general viewpoints on the environmental monitoring programme from the international advisory panel of experts on marine ecology (IAPEME)

executive summary 19
The technological tools developed in the Nysted and Horns Rev
studies, especially for the study of behavioural responses of
marine mammals and birds, will be very useful for researchers
working on new offshore wind farms in other locations. These
technologies can readily be transferred to estuarine or open sea
sites and applied for study of a wide range of focal species.
The broad results from Nysted and Horns Rev also seem likely to
apply more generally to other offshore wind farms, although it is
important to appreciate that some differences have been found
between Nysted and Horns Rev, and that responses are likely to
vary among species and in relation to other environmental fac-
tors. It would not be sensible to generalise about impacts from
a baseline of only the two studies we have available so far.
further research needsThere is clearly a need to study a number of other offshore wind
farms to compare results with those reported in this monitoring
programme. A larger number of studies will be required if broad
generalisations are to be made with confi dence. And there are
also a number of questions that arise from the results obtained
at Nysted and Horns Rev:
Does the opportunity that hard structures introduced on the
seabed present for species such as crabs and cod result in
these predators increasing and impacting the communities
of the surrounding sandy substrate?
Do fi sh increase at marine wind farms over a longer time
scale than the studies reported here, or do their commu-
nities and numbers respond more to large scale processes
than to local changes at the scale of individual wind farms?
Can experiments be designed to test more critically the
question of whether fi sh movements are affected by the
electromagnetic fi eld generated by cables carrying the elec-
tricity ashore?
What characterizes important habitats for marine mammals
and how tolerant are they of disturbance in such areas?
Do some waterbirds species accommodate to marine wind
farms and learn not to show such strong avoidance behaviour?
<
<
<
<
<
Do marine mammals and waterbirds learn to forage within
offshore wind farms if food abundances in these sites in-
crease above normal levels?
Even if the impact of a single wind farm on birds is appar-
ently trivial at population level, can a paradigm be devel-
oped to assess cumulative impacts on bird populations of
numerous offshore wind farms along their fl ight lines?
Current plans to extend the wind farms of Horns Rev and
Nysted provide an ideal opportunity to determine the long-term
impact of habitat loss thus testing rigorously the aversion to
these structures shown by some species of marine birds as
documented in the original studies.
<
<
iapemeIn 2000 the Danish Energy Authority appointed fi ve
international experts to the International Advisory Panel
of Experts on Marine Ecology (IAPEME). The task of the
panel has been to comment on the environmental moni-
toring programme before, during and after establishment
of the wind farms and assess the methods used in the
programme. The panel have also made statements on
the observed impacts of the wind farms on birds, mam-
mals, fi sh and benthos ecosystems.
The panel members are:
Professor Robert W. Furness, (chairman),
university of glasgow, united kingdom
Professor Rudi H. Drent,
university of groningen, the netherlands
Professor Klaus Lucke / Professor Ursula Siebert,
university of kiel, germany
Professor Antony Jensen,
university of southampton, united kingdom
Assistant Professor Peter Grønkjær,
university of aarhus, denmark
application of fi ndings at nysted and horns rev to other marine wind farms
20 introduction
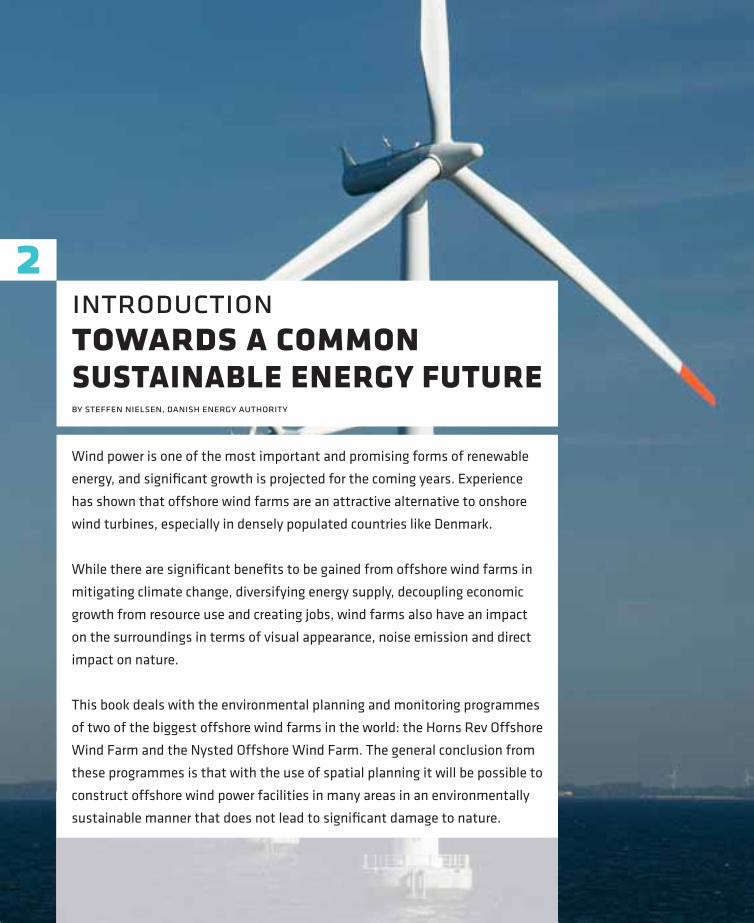
Wind power is one of the most important and promising forms of renewable
energy, and signifi cant growth is projected for the coming years. Experience
has shown that offshore wind farms are an attractive alternative to onshore
wind turbines, especially in densely populated countries like Denmark.
While there are signifi cant benefi ts to be gained from offshore wind farms in
mitigating climate change, diversifying energy supply, decoupling economic
growth from resource use and creating jobs, wind farms also have an impact
on the surroundings in terms of visual appearance, noise emission and direct
impact on nature.
This book deals with the environmental planning and monitoring programmes
of two of the biggest offshore wind farms in the world: the Horns Rev Offshore
Wind Farm and the Nysted Offshore Wind Farm. The general conclusion from
these programmes is that with the use of spatial planning it will be possible to
construct offshore wind power facilities in many areas in an environmentally
sustainable manner that does not lead to signifi cant damage to nature.
introductiontowards a common sustainable energy future
2
by steffen nielsen, danish energy authority

offshore in respect of nature
Th e possibilities of utilizing shallow waters for off shore tur-
bines in Denmark were evaluated a number of years ago.
So far Danish know-how from the past 15 years dem-
onstrates how off shore wind power is possible to engineer.
Likewise the framework for spatial planning of future
large-scale projects in an environmentally sustainable
manner seems now to be in place.
While expansion with off shore wind farms is an attrac-
tive energy alternative, activities at sea should take place
according to an ecological approach and thereby respect
the vulnerability of the marine environment.
variable ecosystems
Of Denmark’s total area at sea of about 105,000 km2, 43,000
km2 have a depth of less than 30 m. Th e Danish waters
are in a zone of transition between the Baltic Sea, which
comprises the world’s largest bodies of brackish water,
and the saltwater of the North Sea. Th e living conditions
of plants and animals are thus much diff erentiated, eg by
the fact that the salinity of the water can vary consider-
ably over short distances.
Th us the sea around Denmark consists of highly vari-
able ecosystems. Th e seabed, for instance, is the habitat
of a number of ecologically precious plant and animal
communities that range from requiring brackish water
of almost freshwater properties to communities requir-
ing water with a high salinity. Th is variation is further
augmented by the great variation in the structure and
dynamics of the seabed as well as the currents and the
physical and chemical aspects of the sea.
vulnerable species
Th e biodiversity of the Danish waters is vulnerable since
many of the organisms in the sea live at or near the limit
of the natural environmental factors that they can with-
introduction 21
fi gure 2.1 depth and wind speed in danish waters
contentsOffshore in respect of nature
Variable ecosystems
Strong international commitments
The technological development
Positive lessons learned
Horns Rev and Nysted wind farms
Ambitious environmental programme
<
<
<
<
<
<
<
wind speed (m/s) at 100 m above ground level

22 introduction
benthic fl ora and faunaEspecially the shallow waters are highly productive and form the
basis of a “food chain” for an extremely rich assemblage of marine
species. Algae comprise the predominant group of marine plants,
including the large perennial algae which grow on rocks, hard, solid
substrates and other materials on the seabed, and the microscopic
algae that live as plankton in the free bodies of water. In shallow
waters, eelgrass grows in silt or sand and forms the basis of various
biological communities. Traditionally, the native fauna composition
of Horns Rev has been associated with the sandy environment
with a very variable and heterogeneous benthic fauna. The benthic
fauna of Nysted is very homogeneous and the species found are
typical indicators of brackish water.
mammalsOnly three species of breeding marine mammals are found in the
Danish waters, ie the harbour porpoise, the harbour seal and the
grey seal. Various large whales, however, such as the sperm whale
and killer whale, are regularly observed in Danish waters.
fl ora and fauna in danish waters
pho
to: m
ak
s k
lau
str
up
fi shIt is diffi cult to estimate the number of species of marine fi sh
found in the Danish waters. Some are only rare guests and some
are found in both freshwater and saltwater. However, it is esti-
mated that up to 190 species can be found in the Danish waters
of which approx. 106 species are native to saltwater and brackish
water, including commercial species such as cod, herring, plaice
and fl ounder. Of these native species only four are living solely in
the pelagic environment whereas the rest is considered benthic
– dependent on the seabed habitats.
birdsThe Danish waters are of essential international signifi cance as
a winter refuge for several species of marine birds. Most of the
marine species that appear in the Danish waters are migratory
birds that spend the summer in the northern and northeastern
parts of Europe. Many hundred thousand marine birds gather
around Denmark, especially in the winter and some of them
benefi t from the large plant growths, benthic fauna and mussel
beds in the shallow waters. Other birds spend most of their time
on the open sea where they live on small fi sh, crustaceans, etc.
The marine birds that are found in large numbers mainly count
divers, grebes, cormorants, swans, ducks, gulls and terns. As
regards some species, such as the brent goose from Svalbard,
most of the population spends the winter in Denmark. Of other
species, such as the common scoter and red throated diver, a large
proportion of the northwestern European population spends the
winter in Danish waters.
pho
to: s
ven
d t
ou
gaa
rd
pho
to: g
reg
do
wn
ing
pho
to: c
hr
isti
an
b. h
vidt

introduction 23
stand. Th e eff ects of man’s activities can thus become a
factor which will be critical to the preservation of the
biodiversity, especial ly at the local level.
Pursuant to the Bird Protection and Habitat Directives
areas comprising a total of 13,000 km2 have been desig-
nated in the Danish waters. Th ese areas contribute to the
coherent ecological network of the NATURA 2000 sites
in Europe. Th e aim of the designation is to promote the
maintenance or restoration of the natural habitat types
and species concerned at a favourable conservation status
in their natural environment.
strong international commitments
Th e governments in the European Union have agreed to
European commitments in relation to the development of
renewable energy resources. Th e EU member states have
committed themselves to reach a 21% share of renewable
electricity by 2010. To achieve this objective wind power
will play an important role, and for several member states
off shore wind power has a key part to play.
Although the long-term perspectives for off shore wind
power are promising, the technology faces a number of
challenges in terms of technological performance, compe-
tition for space with other users of the sea, compatibility
with the European grid infrastructure and secure integra-
tion in the energy system, as well as full competitiveness
in the liberalised European electricity market.
Th ere is a huge potential for increasing the size and number
of off shore wind farms, especially in the North Sea.
Since 2001, the British government has been inviting
tender in two rounds encouraging interested develop-
ers to bid for potential projects in three strategic areas
– in the northern part of the Irish Sea, ie the British
west coast, in an area off the mouth of the Th ames and
an area off the northeastern coast. So far under round
one, four wind farms with a total of 300 MW have been
installed, while another project of 90 MW is under con-
struction. Yet another 582 MW has been approved and
is in the preconstruction phase. As of the second half of
fi gure 2.2 international nature protection areas in danish waters

24 introduction
2006 more than 3800 MW capacity has been applied for
under round two.
Sweden has installed approx 21 MW divided onto four
diff erent projects. In addition, a 120 MW wind farm is
under construction while approvals have been granted
for more than 800 MW.
Ireland has installed one off shore wind farm of 25 MW and
there are preinvestigation approvals for several projects.
Th e Netherlands will commission the country’s fi rst
108 MW off shore wind farm by the end of 2006, and one
more project for 120 MW has been approved.
Germany also has ambitious off shore plans, and so far
15 pilot phases for off shore wind farms in the North Sea
and in the Baltic Sea with nearly 5000 MW have been
approved – though most grid connections within the 12
nautical miles zone are still pending.
Other European countries with off shore wind turbine
plans count Spain, Belgium and France, and work is also
performed on projects in the USA and Canada.
several years of research
Several member states have been conducting research
into off shore wind energy for several years already. Th e
environmental results acquired were summarised in the
project “Concerted action for Off -shore wind energy
Deployment (COD)” fi nalised in 2005. Other collections
and databases with information on environmental aspects
of off shore wind energy are eg the Oslo-Paris Convention
(OSPAR) and the EU Communication & Information
Resource Center Administrator (CIRCA).
Attention should also be given to the policy paper
“Copenhagen Strategy 2005 on European Off shore Wind
Power Deployment” that calls on the EU to launch an
action plan that will address barriers aff ecting the market,
the grid and the environment. As for the environment,
the paper recommends, among others, the establishment
and use of marine spatial planning instruments to reach
the optimal site selection. Furthermore, the Copenhagen
Strategy recognised the importance of more effi cient
consenting procedures which build on past experience
and are in proportion to the scale of the project and the
impact perceived. It also stressed the need to ensure as-
sessments of a good quality, especially when dealing with
sensitive areas, and to further develop methodologies for
such assessments. Th e participants also recommended a
continuation of a COD-like structure, in co-ordination with
similar work done in OSPAR, in order to improve database
transparency and allow for a higher degree of multilateral
co-operation within environmental research.
pho
to: e
ur
ope
an
co
mm
isio
n
fi gure 2.3 EU member states have committed themselves to reach
a 21% share of renewable electricity by 2010.

introduction 25
the technological development
When the fi rst energy crisis struck in the mid 1970s,
exploitation of renewable energy as a replacement for
fossil fuels to produce energy became very attractive.
Ambitious wind power development programmes were
therefore launched in several countries. In the USA, Japan,
Germany and Sweden in particular, the aeronautical and
turbine industries were encouraged by means of public
research and development grants to come up with eff ec-
tive wind turbines in the MW range.
Denmark, on the other hand, adopted a double-edged
development strategy. At the end of the 1970s the utilities
focused on developing MW wind turbines. Simultane-
ously, in the beginning of the 1980s, support given to
investments and advantageous feed-in tariff s for electric-
ity produced by wind turbines led to the creation of a
bottom-up market for small wind turbines.
A gradually growing demand in the domestic market
made it possible for a number of relatively small com-
panies – some of which originated from manufacturers
producing agricultural tools and various types of ma-
chinery – to develop an industrial serial production. As
wind turbines got increasingly larger the development
drew on the technological competence acquired through
the Danish Energy Research Programme. Th e synergy
between the top-down and bottom-up approaches is an
essential background to explain the Danish success with
the development of wind turbines.
Since the industrial production of the fi rst modern wind
turbines there has been a tremendous growth in the
technological development and turnover. As a result of
up-scaling and technological advances today’s Danish wind
international research projectsA German-Danish Co-operation on Environmental Research
for Offshore Wind Energy Deployment has been established
in order to intensify co-operation in research on the im-
pact of offshore wind power on the marine environment,
to strengthen the transfer of know-how and exchange of
information between the parties and to carry out joint
research projects in relation to the associated monitoring
of offshore wind farms.
The co-operation has so far comprised information
exchange on national developments and various studies
undertaken within the Horns Rev and Nysted wind farm
areas, eg temperature measurements in sediments near
cables, bird studies with focus on collision risks and studies
of offshore wind farm effects on harbour porpoise. All data
obtained from the joint research projects are shared among
the parties, including raw data.
An ad hoc group has been set up by the European Com-
mission (jointly by DG ENV and DG TREN) to assist the Com-
mission services in producing a guidance document to help
ensure – and clarify – that wind energy development projects
are compatible with the nature conservation requirements
of the EU and other relevant international nature legislation
applicable in Europe. The development of guidelines must
also be seen in the context of clear commitments and targets
to increase the contribution of renewable energy sources
to the overall energy consumption in the EU as part of the
strategy to combat climate change.
fi gure 2.4 Vindeby, west of Lolland, was the world’s fi rst off shore
wind farm. Its 11 wind turbines of 450 kW each provided Danish
utilities with invaluable experience.
pho
to: j
an
ko
fod
win
ther
/sea
s

26 introduction
turbines produce about 100 times as much electricity as
wind turbines from 1980.
Th e most recent wind turbines have been given a
higher and higher design which has meant that, for
visual reasons and in consideration of any neighbours
onshore, it has become attractive for the wind power
industry to give a high priority to off shore location of
the wind turbines. Th is development has become possible
because the higher installation and operating costs for
off shore wind farms are, to a determining extent, off set
by increased production.
positive lessons learned
Th e possibilities of utilizing shallow waters for off shore
turbines in Denmark were evaluated a number of years
ago. Th e Danish government has supported several
studies investigating the possibilities and the regulatory
conditions for off shore wind power installations. In ad-
dition to selecting the sites for small pilot projects and
large scale demonstration farms all interests in Danish
waters have also been mapped and reported twice, in
1987 and in 1995.
Since 1991, eight wind farms have been established
off shore. Th e fi rst three off shore wind farms, at Vindeby
in 1991, Tunø Knob in 1995 and Middelgrunden in 2000,
were pilot projects. Furthermore, the Danish Energy Au-
thority has approved three nearshore projects at Rønland
(2003), Frederikshavn (2003) and Samsø (2003). In each
of the above mentioned projects, a series of specifi c re-
quirements were made regarding the regulatory approvals
in order to protect the marine environment.
large-scale demonstration programme
Meanwhile in 1997, a working group with representatives
from the Danish Energy Authority, the Danish Forest
and Nature Agency and the power utilities published
an action plan outlining the conditions for large-scale
expansion of wind power. Th e action plan underlined
the need to concentrate wind power expansion in a few,
relatively large areas at a distance of 7–40 km from the
coast. On this basis, in 1998 the government obliged
with the utilities to carry out a large-scale demonstra-
tion programme.
Th e objective of the programme was to investigate
fi nancial, technical and environmental issues to ac-
celerate off shore development and to open up selected
areas for future wind farms. Th e early establishment of
name of wind farm year of commissioning turbine capacity total capacity estimated annual production
Vindeby, Falster 1991 11 450 kW units 5 MW approx 10 GWh
Tunø Knob, Odder 1995 10 500 kW units 5 MW approx 15 GWh
Middelgrunden, Copenhagen 2001 20 2 MW units 40 MW approx 95 GWh
Horns Rev 1 2002 80 2 MW units 160 MW approx 600 GWh
Samsø 2003 10 2.3 MW units 23 MW approx 80 GWh
Rønland, Harboøre 20034 2 MW units4 2.3 MW units
17 MW approx 70 GWh
Frederikshavn 20032 2.3 MW units1 3 MW units
8 MW approx 20 GWh
Nysted Offshore Wind Farm 2003 72 2.3 MW units 165 MW approx 600 GWh
fi gure 2.5 existing danish offshore wind farms – status as of autumn 2006
introduction 27
a clear overview of restrictions and interests in the Dan-
ish waters proved wise. Besides government authorities
also local authorities were involved in the process. Th is
resulted in a framework for the formal part of the ap-
proval procedure.
horns rev and nysted wind farms
Th e development of off shore wind farms at both Horns
Rev and Nysted is a result of a governmental obligation
to the utilities. In 1999, the Danish Energy Authority gave
the green light to undertake preliminary surveys at the
two sites. In the summer of 2000, Environmental Impact
Assessments (EIAs) for both sites were submitted to the
authorities and issued for public hearing. In 2002, the
application to build both wind farms was approved by
the authorities, under subject to certain conditions.
horns rev
In the summer months of 2002, Elsam constructed the
Horns Rev Off shore Wind Farm located 14–20 km off
the coast in the North Sea, west of Blåvands Huk. Th e
Horns Rev Off shore Wind Farm consists of a total of
80 turbines totalling 160 MW. Th e production from the
turbines is estimated to be equivalent to the electricity
consumption of just over 150,000 Danish households.
Elsam was responsible for the actual wind farm – installing
and maintaining the turbines, the turbine foundations,
the farm internal cabling, the accompanying remote
control unit and auxiliary installations. In July 2006
Vattenfall took over 60% of the wind farm thus assuming
the responsibility for operation and maintenance and all
obligations. Energinet.dk is in charge of the installations
designed to transmit the power ashore, ie the off shore
transformer substation, the submarine cable leading
to shore and the onshore cable leading to the general
transmission grid.
nysted
Th e Nysted Off shore Wind Farm commissioned 2002–03
consists of a total of 72 wind turbines standing in 8 rows
of 9 turbines each, approx 10 km off the shore. Th e 72
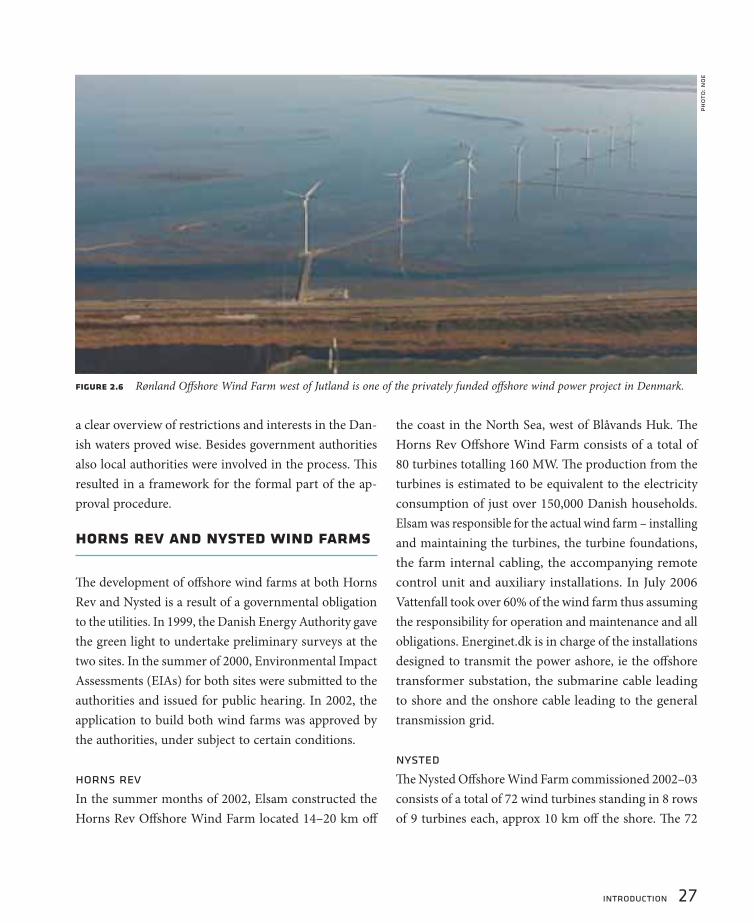
fi gure 2.6 Rønland Off shore Wind Farm west of Jutland is one of the privately funded off shore wind power project in Denmark.
pho
to: n
oe

28 introduction
turbines have a total installed capacity of approx 165.6 MW
and generate suffi cient electricity to supply equivalent to
145,000 single family houses with renewable energy. Th e
farm is owned by a joint venture, where DONG Energy
holds 80% and E.ON Sweden 20%. DONG Energy operates
Nysted Off shore Wind Farm. SEAS Transmission is the
owner of the grid connection, ie the off shore substation
and the cabling from the substation and onshore.
ambitious environmental programme
Between 1999 and 2001, as part of the Environmental
Impact Assessments (EIAs) and as the basis for the Horns
Rev and Nysted environmental monitoring programmes,
baseline studies were undertaken in order to establish
a reference for later analyses to be able to compare the
existing environmental conditions to the introduction
of a wind farm.
Th e environmental monitoring programme was launched
following completion of the EIA. Th us the environmental
studies carried out in the period 2000–2006 were obliga-
tory as part of the consent to the utilities for wind farm
construction at the two sites.
before after control impact – baci
Where possible, the projects in the demonstration pro-
gramme apply the BACI approach (BACI: “Before Aft er
Control Impact”). BACI is a schematic method used to
trace environmental eff ects from substantial man-made
changes to the environment. Th e aim of the method is to
estimate the state of the environment before and aft er any
changes and in particular to control changes at reference
sites (or control sites) with the actual area of impact.
Th e monitoring programme is divided into three stages
focus of the environmental studies The studies and analyses in the demonstration programme
have dealt with:
Benthic fauna and fl ora, with particular focus on the
consequences of the introduction of a hard-bottom hab-
itat; ie the turbine foundations and the scour protection.
Also including a survey of the infauna community in the
wind farms.
The distribution of fi sh around the wind turbines and
the scour protection.
Studies of the numbers and the distribution of feeding
and resting birds, performed by aerial surveys, and on
the food choice of scoters.
Migrating birds, including study of the risks of collision
between birds and wind turbines.
Marine mammals – porpoise and seal – behaviour and
reaction to wind farms.
The impact of electromagnetic fi elds on fi sh.
Sociological and environmental economic studies.
Coastal morphology.
<
<
<
<
<
<
<
<
aims of the environmental monitoring programmeThe monitoring programme was set up in order to chart the
environmental conditions before, during and after the two
farms were set up. The aim was to clarify:
The risk of experiencing signifi cant negative effects on
the environment.
The ecological fragility of the specifi c areas.
The usefulness of the areas to investigate specifi c ef-
fects.
The relevance of the effects in relation to decision-mak-
ing regarding further development within the specifi c
areas and the overall development of future offshore
wind farms.
The importance of the different effects in relation to the
demand for action and the economic framework for the
programme.
<
<
<
<
<
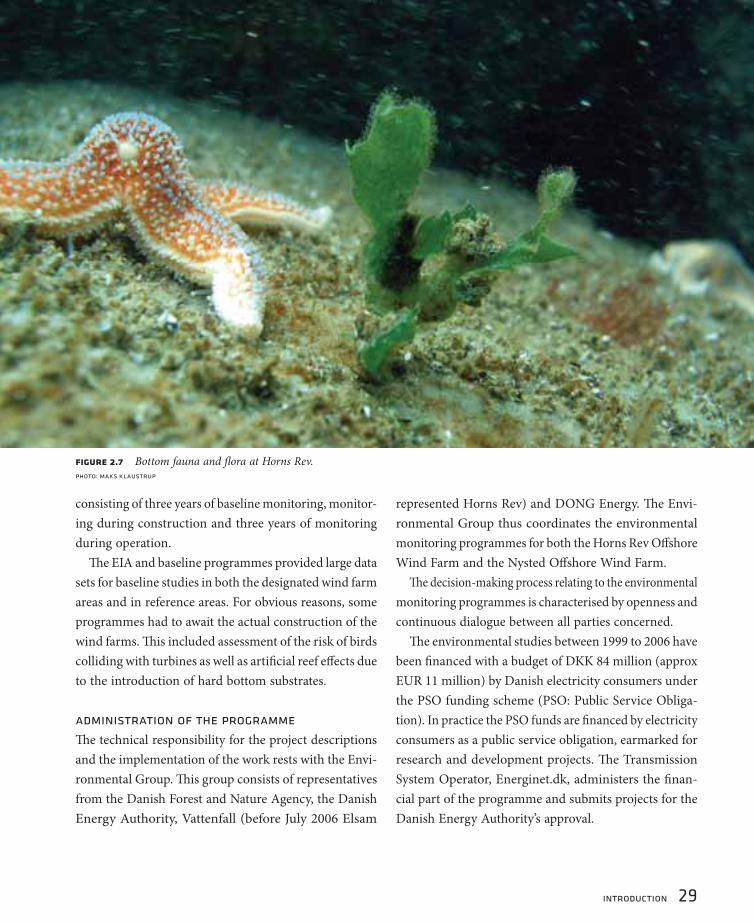
introduction 29
consisting of three years of baseline monitoring, monitor-
ing during construction and three years of monitoring
during operation.
Th e EIA and baseline programmes provided large data
sets for baseline studies in both the designated wind farm
areas and in reference areas. For obvious reasons, some
programmes had to await the actual construction of the
wind farms. Th is included assessment of the risk of birds
colliding with turbines as well as artifi cial reef eff ects due
to the introduction of hard bottom substrates.
administration of the programme
Th e technical responsibility for the project descriptions
and the implementation of the work rests with the Envi-
ronmental Group. Th is group consists of representatives
from the Danish Forest and Nature Agency, the Danish
Energy Authority, Vattenfall (before July 2006 Elsam
represented Horns Rev) and DONG Energy. Th e Envi-
ronmental Group thus coordinates the environmental
monitoring programmes for both the Horns Rev Off shore
Wind Farm and the Nysted Off shore Wind Farm.
Th e decision-making process relating to the environmental
monitoring programmes is characterised by openness and
continuous dialogue between all parties concerned.
Th e environmental studies between 1999 to 2006 have
been fi nanced with a budget of DKK 84 million (approx
EUR 11 million) by Danish electricity consumers under
the PSO funding scheme (PSO: Public Service Obliga-
tion). In practice the PSO funds are fi nanced by electricity
consumers as a public service obligation, earmarked for
research and development projects. Th e Transmission
System Operator, Energinet.dk, administers the fi nan-
cial part of the programme and submits projects for the
Danish Energy Authority’s approval.
fi gure 2.7 Bottom fauna and fl ora at Horns Rev.photo: maks klaustrup

30 introduction
Th e work of the Environmental Group and the results
of the studies are assessed by an international panel of
independent experts, IAPEME (International Advisory
Panel of Experts on Marine Ecology), consisting of experts
with unique competence within the individual branches
of the entire monitoring programme. Th ese experts have
evaluated the progress of the environmental monitoring
programmes approximately once a year and made recom-
mendations for future monitoring. On the basis of the
recommendations of the expert panel, the Environmental
Group has set the priorities of future programmes.
To ensure that relevant stakeholders could infl uence
the debate regarding the environmental monitoring of
the Horns Rev Off shore Wind Farm and the Nysted Off -
shore Wind Farm, a number of organisations particularly
committed to environmental issues have been off ered
the opportunity to participate in a “Green Group” which
meets with the Environmental Group approximately once
1999 2000 2001 2002 2003 2004 2005 2006
Visualisation and socioeconomic investigations
Hydrography and coastal morphology
Benthic fauna and fl ora along 132 kV cable
Benthic fauna and fl ora in the farm area
Fish in the farm area
Electromagnetic fi elds and possible effect on fi sh
Monitoring of harbour porpoises
Monitoring of seals
Monitoring of birds
Development of new habitats
fi gure 2.9 programmes carried out at nysted offshore wind farm
fi gure 2.8 programmes carried out at horns rev offshore wind farm
1999 2000 2001 2002 2003 2004 2005 2006
Visualisation and socioeconomic investigations
Hydrography
Benthic fauna and fl ora in the farm area
Fish in the farm area
Fish, sand eel
Monitoring of harbour porpoises
Monitoring of seals
Monitoring of birds
Development of new habitats

introduction 31
a year. Th e Green Group consists of representatives from
the World Wide Fund for Nature (WWF), the Danish
Society for Nature Conservation, the Danish Outdoor
Council, Greenpeace, the Danish Ornithological Society
and the Danish Organisation for Renewable Energy.
Status reports are published annually, including IA-
PEME assessments and recommendations. All reports
are publicly available and can be found at the Danish
Energy Authority’s website: www.ens.dk.
fi gure 2.10 Cormorants on the foundations of Nysted Off shore Wind Farm.
pho
to: n
yste
d o
ffsh
or
e w
ind
fa
rm
32 introduction
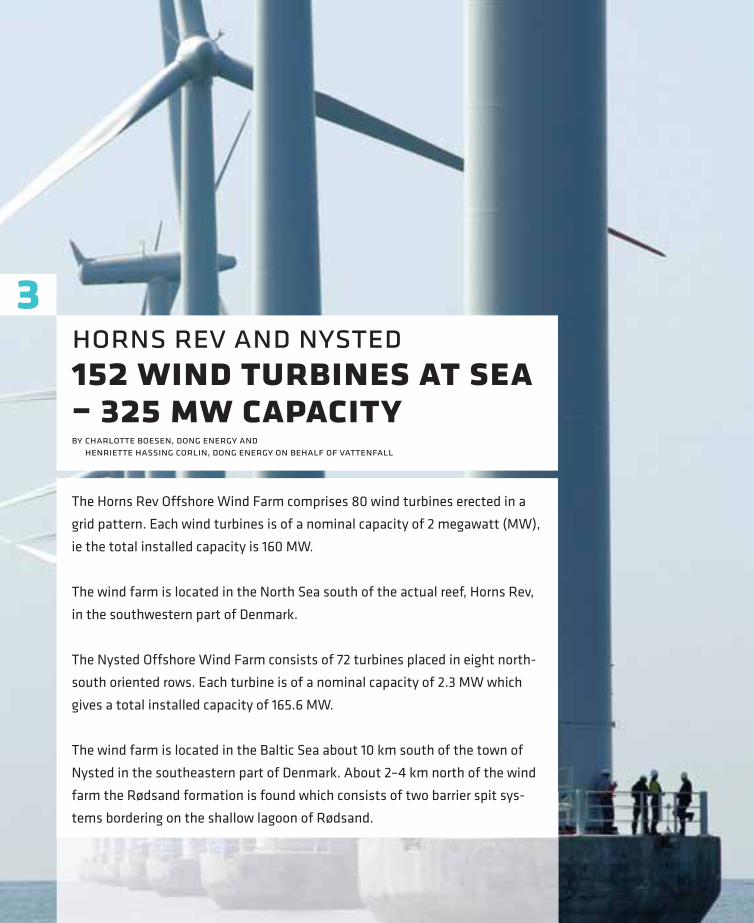
The Horns Rev Offshore Wind Farm comprises 80 wind turbines erected in a
grid pattern. Each wind turbines is of a nominal capacity of 2 megawatt (MW),
ie the total installed capacity is 160 MW.
The wind farm is located in the North Sea south of the actual reef, Horns Rev,
in the southwestern part of Denmark.
The Nysted Offshore Wind Farm consists of 72 turbines placed in eight north-
south oriented rows. Each turbine is of a nominal capacity of 2.3 MW which
gives a total installed capacity of 165.6 MW.
The wind farm is located in the Baltic Sea about 10 km south of the town of
Nysted in the southeastern part of Denmark. About 2–4 km north of the wind
farm the Rødsand formation is found which consists of two barrier spit sys-
tems bordering on the shallow lagoon of Rødsand.
horns rev and nysted152 wind turbines at sea – 325 mw capacity
3
by charlotte boesen, dong energy and henriette hassing corlin, dong energy on behalf of vattenfall

confi guration of a wind farm
An off shore wind farm consists of the same components
as an onshore wind farm; however, the sometimes harsh
environment at sea calls for other demands to the design
and construction methods than onshore. Th e construc-
tion, operation and maintenance of an off shore wind
farm depend greatly on the weather conditions which
– when unfavourable – will result in limited access to the
turbines. Consequently, these activities become more time
consuming and costly. Th e turbine technology and the
actual construction of off shore wind farms are undergoing
rapid progress as wind farms are planned to be erected
in deeper waters and even further off the coast.
Th is chapter provides a brief presentation of the present
technologies and methods used with the focus on the
solutions employed at the Horns Rev Off shore Wind Farm
and Nysted Off shore Wind Farm. Th is covers a description
of the basic components of an off shore wind farm; the
turbines, foundations, submarine cables and substation,
including the primary environmental impacts from the
various parts. Also the various environmental issues dealt
with during the construction are discussed. Th e two wind
farms, Horns Rev and Nysted, are described in terms of
the specifi c areas and wind farm layouts.
wind turbines of 2-2.3 mw
Basically a wind turbine consists of a turbine tower, which
carries the nacelle, and the turbine rotor, consisting of
rotor blades and hub. Th e turbine tower of off shore tur-
bines is usually a tubular steel tower which is conical, ie
the diameter increases downwards towards the base of
the turbine. Th is gives the tower a conical shape which
increases the strength of the tower. Th e nacelle contains
the key components of the wind turbine, eg the electrical
generator, gearbox, mechanical brakes, control systems etc.
To capture the wind, most modern wind turbines have
three rotor blades usually placed upwind of the tower and
the nacelle. On the outside the nacelle is usually equipped
with anemometers and a wind wane to measure the wind
speed and direction, as well as aviation lights.
At present the size range of off shore turbines in Den-
mark is approx 2–2.3 MW, with a tip height of approx
110 m, but the development within turbine technology
is moving towards bigger turbines, which is ideal for
off shore sites.
In terms of possible environmental impacts, an off shore
wind turbine itself primarily constitutes a visual impact
and is a source of noise. Furthermore, the turbines can
present a barrier to the movement of migrating or feeding
birds and marine mammals, and fi nally if birds do not
show avoidance behaviours towards the turbines, there’s
a potential risk of collisions.
Th e visual impact is obvious due to the sheer size of
the turbines although also equipment, such as aviation
lights, contributes to the visual appearance of the turbines
at night. Turbines higher than 100 m must be equipped
with aviation lights, oft en on all turbines in a wind farm
for the safety of the air traffi c. Off shore turbines must also
be equipped with navigation markings for the safety of
the ship traffi c. Th e Danish Civil Aviation Administration,
which is responsible for air traffi c marking, issued new
marking requirements for both wind turbines with a total
height between 100 m and 150 m and for wind turbines
over 150 m in 2005. Th ese new marking requirements are
expected to reduce the overall negative visual impact.
Th e noise from the wind turbines originates from the
rotating rotor blades and the mechanical units in the
nacelle. Th e noise above water is rarely an environmental
issue in connection with off shore wind farms since the
contentsConfi guration of a wind farm
Horns Rev Offshore Wind Farm
Nysted Offshore Wind Farm
Environmental issues
<
<
<
<
horns rev and nysted 33

turbines are situated far from land and residential areas.
Th e airborne noise from the rotating blades is refl ected
by the water surface and therefore does not contribute
considerably to the underwater noise level. Th e underwater
sound from the turbines mainly comes from the mechanical
units, eg generator, gearbox, transformer cooling system
etc, and the sound is transmitted through the tower to
the water in the form of vibrations. Measurements car-
ried out at the Utgrunden and Horns Rev off shore wind
farms demonstrate that the turbines radiate sound at a
few dominating frequencies from 30 Hz up to 800 Hz.
Th e noise is therefore mainly of low frequencies.
foundations create new habitats
Th e current off shore wind power technologies are based
on foundation types most suitable for shallow water.
Th ese foundations are either concrete gravity caisson
foundations, which is the fi rst type of foundation ever
used for an off shore wind turbine, or steel monopiles
driven into the seabed, which can be used at greater
depths. Th e choice of foundation also depends on the
type of sediment in the proposed area. In waters with
greater depths, tripod and quadropod foundations, of
the kind used for small off shore oil and gas recovery
installations, could presumably be used for future turbine
foundation solutions.
Th e seabed around the base of the foundations will
oft en be protected against erosion or scouring by placing
rocks and boulders around the foundation. Th e foundation
and the scour protection will constitute a new substratum
on the seabed, and mussels and algae will oft en colonise
these new habitats.
One of the main environmental impacts from the
foundation itself is therefore considered to be the intro-
duction of new habitats and the development of related
vegetation and fauna, which again can serve as a food
resource for eg birds and fi sh.
Th e short-term eff ects of installing monopile foundations
are seen during the pile driving process as a result of the
hydraulic off shore hammer used as this activity generates
loud underwater noises. Th e noisy activity will have an
eff ect on animals present in the area, and particular focus
is paid to marine mammals. As mentioned in chapter 6,
mitigation measures are taken to minimise this eff ect on
both seals and harbour porpoises.
cable connection and substation
Th e power generated by the wind farm is collected in
submarine cables buried in the seabed. Th e cables between
the turbines are linked to a transformer substation. Th e
power is transmitted to shore by an export cable connected
to the public power transmission system. Th e submarine
cables are typically three-phase alternating current (AC)
cables protected by an outer steel armouring.
fi gure 3.1 the time schedule for horns rev offshore wind farm
Th e time schedule is presented including the Environmental Impact Assessment (EIA), approval, construction, operation (the lower line)
and the environmental monitoring phases (the upper line). Th e transformer platform was erected in October 2001 prior to the rest of
the construction work. Th e wind farm has been operating successfully since December 2002.
34 horns rev and nysted

Th e function of the substation is to transform or con-
vert the energy generated by the off shore wind farm from
low voltage (eg 33 kV) to high voltage (eg 132 kV) thus
reducing grid losses. At most wind farms the substation
will be placed off shore due to the long distance to the
shore, but for nearshore wind farms (5 km from the shore
or less) it can be placed onshore.
Th e environmental impacts of the submarine cables in
the construction phase include the risk of sediment spill
from the seabed work, also during the operation phase
issues such as electromagnetic fi elds and the eff ect on
fi sh are considered.
Th e presence of submarine cables also constitutes an
eff ect on the fi shing industry as a Danish Executive Order
on cabling provides for a 200 m protective zone around
submarine cables against bottom-trawl fi shing and raw
materials extraction. Th ese activities are therefore in
general not possible within a wind farm area and along
the cables from a wind farm to the shore. Th is might
indirectly have a positive eff ect on the fi sh inside an off -
shore wind farm area since fi shing activities are reduced
here to a certain extent.
In Nysted Off shore Wind Farm, the wind farm area
is open to sailing and fi shing with net and line, whereas
bottom-trawling methods are prohibited. In the Horns
Rev area only fi shing with line is allowed.
horns rev offshore wind farm
total capacity is 160 mw
Th e Horns Rev Off shore Wind Farm comprises 80 wind
turbines erected in a grid pattern. Each wind turbine
is of a nominal capacity of 2.0 MW which gives a total
installed capacity of 160 MW. Th e distance between the
individual wind turbines and the rows is 560 m.
Figure 3.2 shows the location of the off shore wind
farm and shore-connecting cable.
Th e off shore wind farm is located south of the actual
reef, Horns Rev. Th e distance from the northeasternmost
wind turbine to Blåvands Huk is approx 14 km. Th e export
cable from the wind farm is approx 19 km long, the inner
4 km runs through a designated area. Th e actual wind
farm is located outside protected or designated areas.
Th e water depth in the wind farm area is between 6.5
fi gure 3.2 map of the wind farm area
Map of the wind farm area, showing the position of the 80 wind turbines, the transformer substation, the meteorology masts and the
150 kV cable to shore.
horns rev and nysted 35

m and 13.5 m (at mean sea level, MSL). In the entire
wind farm area the seabed consists of sand.
Th e wind farm covers an area of approx 20 km2, and a
200 m wide exclusion zone is established around the wind
farm resulting in an overall area of approx 24 km2.
hydrography – low water
Horns Rev is situated west of Denmark’s westernmost
point, Blåvands Huk. Horns Rev consists of two parts,
outer Horns Rev and inner Horns Rev. Th ese two parts are
separated by the gulf Slugen. Th e water level at both parts
of Horns Rev is low, approx 1–5 m. Geomorphologically
speaking Horns Rev is a terminal moraine.
Th e North Sea has a complex tidal system, primarily
controlled by tidal waves from the Atlantic Ocean. Th e
average tide size at Horns Rev is approx 1.2 m.
Furthermore, the hydrography in the Horns Rev area
is generally controlled by the wind and current regime in
the North Sea and infl owing freshwater from the Elbe and
other large rivers in Germany. Depending on the infl ow of
freshwater, the salinity varies between 30‰ and 34‰.
Th e average wave height is approx 1–1.5 m, and, ac-
cording to the statistics, wave heights above 6 m are
observed once a year.
Th e combination of low water levels, large and small
seabed shapes (sand waves, sand banks, mega-ripples, etc)
and the strong wave and tidal currents create a highly
dynamic area in terms of morphology with very high
natural concentrations of suspended sand in the water
column. Th us the upper layers of the sand on and around
the reef are constantly re-bedded.
meteorology masts collect data
Adjacent to the wind farm area is a meteorology mast
that has been collecting various data such as wind speed
and direction since 1999.
Furthermore, two meteorology masts were erected
in 2003, in connection with the wind farm. Th e masts
supply information for the operation of the farm and
ensure the gathering of knowledge about the impact of
the wind farm on the wind speed and turbulence outside
the wind farm.
Within the wind farm a measuring device has been
installed to monitor wave heights and wave periods.
Th is is used to assess the possibility to access the wind
turbines by boat.
80 wind turbines
Th e Horns Rev Off shore Wind Farm consists of 80
identical Vestas V80-2 MW wind turbines, with a hub
height of 70 m and a total height to the blade tip of 110
m above mean sea level. Th e rotor diameter is 80 m. Th e
main dimensions of the 80 wind turbines are shown in
Figure 3.3 below.
Th e wind turbines can be accessed by boat and by heli-
copter. Access directly to the wind turbines by helicopter
takes place in what is known as a “hoist operation”. For
this purpose there is a 4×4 m platform on top of each
wind turbine. Th e wind turbines are painted in a pale
marine grey colour.
Th e standard V80-2 MW wind turbine has been
customised to suit the off shore environment on the fol-
lowing points:
Surface coating
Navigational lighting (yellow beacons)
Heli-hoist platform on nacelle roof
Emergency accommodation equipment
(sleeping bags, water and instant food)
Communication system, including VHF radio
Special maintenance equipment, eg add-on crane
for heavy lift s and “sky climber” for blade inspection
and repair
Higher rotor speed due to less strict noise constraints
•
•
•
•
•
•
•
36 horns rev and nysted

foundations – monopile concept
Th e foundations at Horns Rev is based on the monopile
concept. Th e joint between turbine and foundation is placed
9 m above mean sea level where there is an access platform.
For the design of the foundation, see to Figure 3.4.
Th e monopile foundation consists of two main com-
ponents; the pile which is a steel pipe rammed into the
seabed. Th e other component is the transition piece which
is also a steel pipe but with a slightly larger diameter
than the pile.
For the Horns Rev project, the monopile diameter is
4 m. Th e pile is driven down to a depth of up to approx
25 m. Th e advantage of the monopile concept is among
other things that pile driving is a fast process, approx
20–90 minutes a pile.
At Horns Rev, scour protection was found necessary
around the foundations. Th e scour protection consists
of two diff erent sizes of stones placed in two layers in
an approx 10 m wide band around the foundation. Th e
foundations and scour protections cover an area of ap-
prox 50,000 m2, corresponding to 0.2% of the wind farm
area. Th e foundations increase the overall surface area
by up to 10,000 m2.
cable connection – 36 kv grid
Th e wind turbines are interconnected in a 36 kV cable grid
organised in north-south-bound rows. In the northeastern
corner of the wind farm a substation connects the 36 kV
cables and transforms the generated energy to 150 kV.
Th e total length of the 36 kV cable is about 50 km. Th e
150 kV cable is connected to a transmission station at
Hvidbjerg Strand, which is about 19 km from the wind
farm. All cables are embedded 1 m in the seabed.
aviation and navigational lighting
All wind turbines positioned along the outer edges of
the wind farm are equipped with two medium inten-
sity synchronised fl ashing red beacons fl ashing with a
fi gure 3.4 design of monopile foundation
fi gure 3.3 wind turbine dimensions
horns rev and nysted 37

four steps of turbine installation1 Installation of the two bottom tower sections
2 Installation of the top tower section
3 Installation of nacelle, complete with hub, spinner
and two blades
4 Installation of the last blade
frequency of 20–60 fl ashes a minute. Th e lights have a
variable eff ective intensity of up to 2000 candela ± 25%.
When visibility in the area exceeds 5 km, the intensity is
automatically reduced to 200 candela. Th e visibility and
intensity settings are remote controlled. All other wind
turbines, ie the 48 turbines in the central part of the wind
farm, are each equipped with two low intensity red lights
with an intensity of 10 candela as a minimum.
Regarding navigational lighting, the corners and outer
turbines are marked with either one or two beacons. All
beacons will fl ash synchronously and will be of an eff ec-
tive light power of approx 5 nautical miles. Th e beacons
have automatic control so that they are only in operation
when it is dark.
construction of the wind farm
All fully built foundations and wind turbine components were
shipped from the Port of Esbjerg to the wind farm area.
Th e fi rst step of the establishment of the foundations
was the installation of the bottom layer scour protec-
tion, the fi lter layer, consisting of stones with a diameter
of 30–200 mm. Th en the monopiles arrived and were
driven down through the fi lter layer. Ten monopiles
at a time were transported to the wind farm area on a
special-purpose jack-up vessel. Six transition pieces at
a time, including premounted equipment such as boat
landing and platform etc, were loaded onto a jack-up
vessel and transported to the wind farm where they
were mounted on the monopiles. Th e transition piece
and the monopile were cast together. Th e fi nal step was
installation of the armour rock layer, which is also part
of the scour protection.
Th e erection of the wind turbines was carried out
from two special-purpose vessels, each provided with
four hydraulically controlled jack-up legs and a lat-
tice-mast mobile crane. Two complete wind turbines
at a time were loaded onto each vessel and shipped
to the wind farm.
Th e actual installation of the four turbine parts took
between one and seven days depending on the weather
conditions. Under optimal conditions it is possible to erect
one turbine a day with the vessels mentioned above.
nysted offshore wind farm
total capacity is 165.6 mw
Th e wind farm consists of 72 turbines placed in 8 north-south
oriented rows standing 850 m apart, see Figure 3.6. Each
row consists of 9 turbines with an internal distance of 480 m.
Each turbine is of a nominal capacity of 2.3 MW and
hence the total installed capacity is 165.6 MW.
Th e Nysted Off shore Wind Farm at Rødsand is located
approx 10 km south of the town of Nysted and 13 km west
of the town of Gedser. About 2–4 km north of the wind farm
lies the Rødsand formation which consists of two barrier
spit systems bordering on the shallow lagoon of Rødsand.
Close by lies Rødsand game reserve and Hyllekrog game
reserve. Th e area north of the wind farm holds another
two game reserves: Nysted Nor and Frejlev Vig.
Th e entire area north of the wind farm has been des-
ignated a Ramsar Site and an EU Bird Protection Area
(SPA) to protect the requirements of specifi ed wild birds
and regularly occurring migratory birds and as a EU
Habitat Area (SAC) to maintain and restore the marine
habitats and wild fauna and fl ora.
Th e wind farm is located on a gently sloping seabed
consisting of glacial deposits covered by thin layers of
sand. Th e water depth in the wind farm area is between
6 m and 9.5 m.
38 horns rev and nysted

Th e wind farm covers an area of approx 24 km2, in
addition a 200 m wide exclusion zone is established
around the wind farm resulting in an overall area of
approx 28 km2.
hydrography – exchange of water masses
Th e main currents in the Rødsand area are primarily ruled
by the exchange of water between the Kattegat and the
Baltic Sea fl owing through the Great Belt, the Little Belt
and Øresund, and by density and wave generating cur-
rents. Th e tidal currents in this area are insignifi cant.
In general, the water in the area is well mixed and
not infl uenced by oxygen depletion. Th e salinity varies
depending on the origin of the water masses exchanged
horizontally between the Baltic Sea and the Kattegat, and
vertically between the heavy salty bilge water from the
deep areas of the Femern Belt and the more fresh surface
water in the lagoon. Th us the salinity of the area generally
varies between approx 9‰ and 13‰.
In terms of hydrography the area can be divided into
fi gure 3.5 the time schedule for nysted offshore wind farm
Th e time schedule is presented including the EIA, approval, construction, operation (the lower line) and the environmental monitoring
phases (the upper line). Th e wind farm has been operating successfully since December 2003.
horns rev and nysted 39
Map of the wind farm area, showing the position of the 72 wind turbines, the transformer substation, the meteorology masts and the
132 kV cable to shore.
fi gure 3.6 map of the nysted wind farm area

the Rødsand lagoon with shallow water depths and domi-
nating wave infl uence and the area outside the lagoon
where the water depth quickly increases proportionally
to the infl uence of the main current systems.
Th e Rødsand formation, which consists of two barrier
spit systems (one going eastwards from Hyllekrog and
another going westwards from Gedser Rev), is undoubt-
edly the most signifi cant coastal morphological element in
the area. Most of the water exchanged between Rødsand
lagoon/Guldborg Sund and the Femern Belt passes through
the gulf Østre Mærker, breaking the Rødsand formation
immediately west of the barrier spit at Gedser.
Th e seabed in the area mainly consists of hard glacial
moraine clay which locally is superposed by Holocene
layers with a thickness of typically a few metres. Th ese
sediments can be found as fi lling of mud, organic silt
and sand probably settled in meltwater channels eroded
into the moraine clay. However, locally even very large
deviations from this overall pattern may occur.
Th e wave heights in the area are fairly low as a con-
sequence of the relatively short, free beats in this part
of the Baltic Sea. Th e combination of the fairly sparse
presence of mobile sediments and the limited wave
energy are grounds for a general limit to the sediment
transportation in the area.
fi ve meteorology masts
In the period 1997 to 2005 a meteorology mast in the
wind farm area has been collected information on wind
speed and direction.
Furthermore, four meteorology masts were erected in
2003, in connection with the wind farm. Th e masts supply
information about the operation of the farm and ensure
the gathering of knowledge concerning the impact of the
wind farm on the wind speed and turbulence upstream
and downstream the wind farm.
pho
to: n
yste
d o
ffsh
or
e w
ind
fa
rm
fi gure 3.7 Photos of the turbine foundations before they were positioned on the seabed.
40 horns rev and nysted

72 wind turbines
Th e Nysted Off shore Wind Farm consists of 72 identical
Bonus 2.3 MW wind turbines, with a hub height of 69 m and
a rotor diameter of 82.4 m. Th e total height is 110 m.
Th e wind turbines have been given a marine grey colour
that blends in well and are equipped with warning lights
for avoidance by sea and air traffi c. Th e wind turbines
can be accessed by boat.
gravity foundations
Th e turbine foundations are gravity foundations, of con-
crete with specially designed protection measures against
ice (Figure 3.8). Erosion around the bottom plate of the
foundations is prevented by a scour protection consisting
of stone. Th e foundations take up an area of about 45,000
m2, corresponding to 0.2% of the total area of the wind
farm. Th e foundations cause an increase of the overall
surface area of up to 56,000 m2.
Th e foundation consists of a cylindrical shaft with a
diameter of 4.2 m and a 3 m high and 16 m wide hexagonal
basement divided into six chambers. Th e six chambers are
fi lled with gravel and stones. Th e upper part of the shaft
is conical and reaches a diameter of 8 m at the surface
of the sea. Th e transformer substation is placed on a
platform similar to the wind turbine foundations.
Th e outer diameter of the scour protections is about
25 m.
Th e base of the foundations is placed from 0 m to 5
m below the natural seabed. Th e surface of the stone fi ll
in the basement chambers is in most cases 4.5 m to 7.5
m below the surface of the sea and up to almost 10 m
below the surface at a few turbines.
cable connection – 33 kv grid
Th e turbines are interconnected with a 33 kV marine
cable grid, which is embedded at a depth of 1 m. Th e
total length of the 33 kV marine cable is about 48 km.
Th e marine cable continues from the northernmost
turbines to a 33/132 kV transformer substation 200 m
north of these turbines.
A 132 kV marine cable burried 1 m into the seabed
leads from the transformer substation in the wind farm
to Vantore Strandhuse east of Nysted. Th e total length
of the 132 kV cable connection to the shore is about 10
km. All the cables in the Nysted Off shore Wind Farm are
three-phase AC (alternating current) cables.
aviation and navigational lighting
All wind turbines positioned along the outer edges of the
wind farm, in total 30 turbines, are equipped with two
medium intensity synchronised fl ashing red beacons.
Th e lights have a variable eff ective intensity of up to 2000
candela. When visibility in the area exceeds 5 km, the
intensity is automatically reduced to 200 candela. Th e
visibility and intensity settings can be remote controlled.
All other wind turbines, ie the 42 turbines in the central
part of the wind farm, are each equipped with two low
intensity red lights with an intensity of 10 candela as a
minimum. Th ese lights are not fl ashing.
Th e settings of the aviation lights will be adjusted in
2006 according to the new requirements from the Danish
Civil Aviation Administration. Th e objective is to reduce
the visible impression seen from the shore at night.
fi gure 3.8 design of the gravitation foundation
horns rev and nysted 41
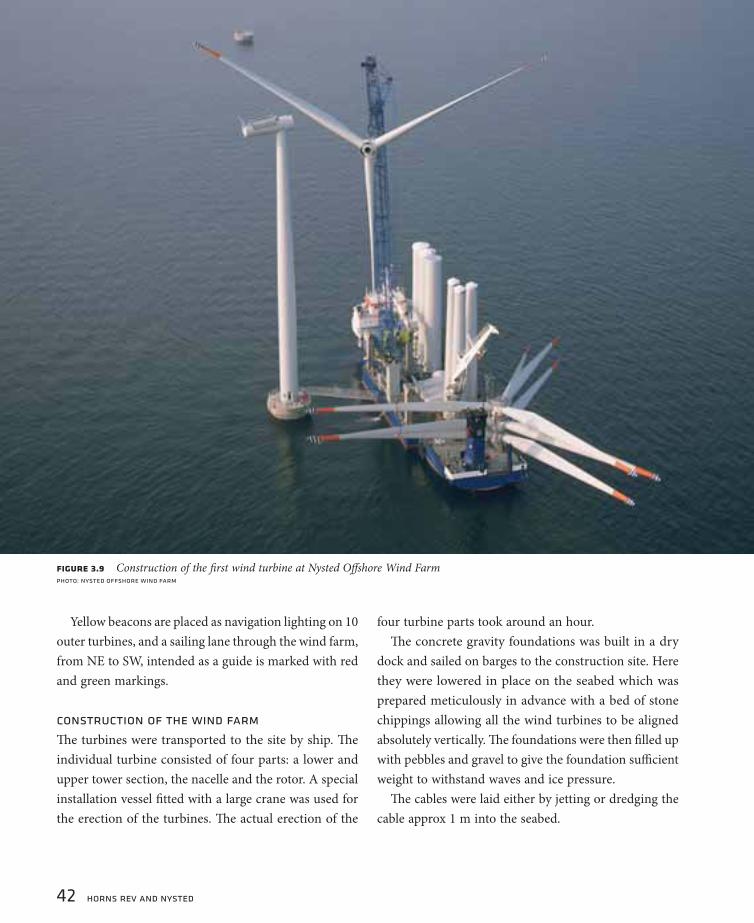
Yellow beacons are placed as navigation lighting on 10
outer turbines, and a sailing lane through the wind farm,
from NE to SW, intended as a guide is marked with red
and green markings.
construction of the wind farm
Th e turbines were transported to the site by ship. Th e
individual turbine consisted of four parts: a lower and
upper tower section, the nacelle and the rotor. A special
installation vessel fi tted with a large crane was used for
the erection of the turbines. Th e actual erection of the
four turbine parts took around an hour.
Th e concrete gravity foundations was built in a dry
dock and sailed on barges to the construction site. Here
they were lowered in place on the seabed which was
prepared meticulously in advance with a bed of stone
chippings allowing all the wind turbines to be aligned
absolutely vertically. Th e foundations were then fi lled up
with pebbles and gravel to give the foundation suffi cient
weight to withstand waves and ice pressure.
Th e cables were laid either by jetting or dredging the
cable approx 1 m into the seabed.
photo: nysted offshore wind farm
fi gure 3.9 Construction of the fi rst wind turbine at Nysted Off shore Wind Farm
42 horns rev and nysted

environmental issues
Th e overall mapping of the environmental conditions of
the two projects is described in the respective Environ-
mental Impact Statements. Th e overall environmental
conditions constituted the basis for regulatory require-
ments as specifi ed in the approval of the projects.
To ensure that environmental demands and terms were
an integral part of the projects these were incorporated
into the requirement specifi cations to the suppliers.
Environmental management systems were established
for both wind farms. Th ese systems included procedures
and instructions for all personnel on the sites about the
handling of environmental issues, such as waste handling,
noise measurement, procedures for scaring off marine
mammals, contingency plans in case of environmental
accidents such as oil spill, etc.
Th e regulatory requirements for the construction phase
at Horns Rev and Nysted, respectively, varied considerably
since the two areas diff er to a great extent and feature
diff erent sensitivity issues. Generally, the following points
were addressed during the construction phase at both
wind farms but in varying orders of priority:
Sediment spill monitoring
Incidents, accidents and oil spill
Waste handling
Precautions regarding pile driving/vibration of sheet
piles/monopiles
Sediment depositing
Marine archaeology
Registration of navigation in the area
Aft er the construction phase, the total amount of sediment
spill and removed amounts of sediment have been recorded,
and it was concluded that the regulatory requirements were
respected. Also the amount and types of waste generated
during the construction period were registered and the
•
•
•
•
•
•
•
locations of interesting marine archaeological objects found
during the construction period were recorded.
Of the above listed items the conditions for the driv-
ing of sheet piles and monopiles as well as registration of
navigation in the area are described further as these two
factors infl uence eg the disturbance of marine mammals
during the construction period.
It was required of both wind farms that in connection
with momentary noisy activities and similar, actions should
be taken to scare off marine mammals potentially harmed
by the construction noise. Pile driving was used for the
establishment of the monopiles at Horns Rev, piling of
sheet piles at a foundation and for erection of meteorol-
ogy masts at the Nysted Off shore Wind Farm – all of
these are activities which cause momentary noise. Th e
requirement for measures warning off marine mammals
beforehand was met by the application of soft -start/ramp-
up, acoustic deterrent devices, so-called pingers, and seal
scarers. Th e application of these devices was registered
and monitored.
Th e Nysted Off shore Wind Farm is situated approx 2
km from a nature reserve and 4 km from Rødsand seal
sanctuary. Th is has called for special consideration in
connection with the construction work, including limita-
tion and control of navigation in the area.
According to specifi c instructions to all persons involved
at the construction site, all transport to and from the
wind farm was to take place in a special transportation
corridor only, and that access to the nature reserve was
forbidden without prior special approval by the Owner’s
environmental coordinator.
To ensure compliance with the demands and for safety
reasons all navigation to and from the wind farm was
registered and reported. Th us the navigation to and from
the wind farm has been controlled, and the impact of
navigation on the sensitive areas, the nature reserve and the
seal sanctuary, has been limited as much as possible.
horns rev and nysted 43

44 infauna, epifauna and vegetation
The main effect from establishing the wind farms was the introduction of
hard bottom structures onto seabeds that almost exclusively consisted of
sandy sediments. This has increased habitat heterogeneity and changed the
benthic communities at the turbine sites from typical infauna communities to
hard bottom communities. Abundance and biomass of the benthic communi-
ties increased at the wind farm sites compared to the native infauna com-
munities. A consequence from the change in community structure was a local
increase in biomass at the wind turbine sites by 50 to 150 times, most of this
as available food for fi sh and seabirds.
There were only negligible or no impacts detected from the changes in the
hydrodynamic regimes on the native benthic communities, seabed sediment
structure or established epifouling communities. Similarities in the estab-
lishment, succession and distribution of epifouling communities were found
between the Horns Rev and Nysted Offshore Wind Farms. The differences in
species composition were mainly attributable to differences in salinity be-
tween the two sites.
infauna, epifauna and vegetationchange in diversity and higher biomass
4
by simon leonhard, orbicon and jørgen birklund, dhi water and environment
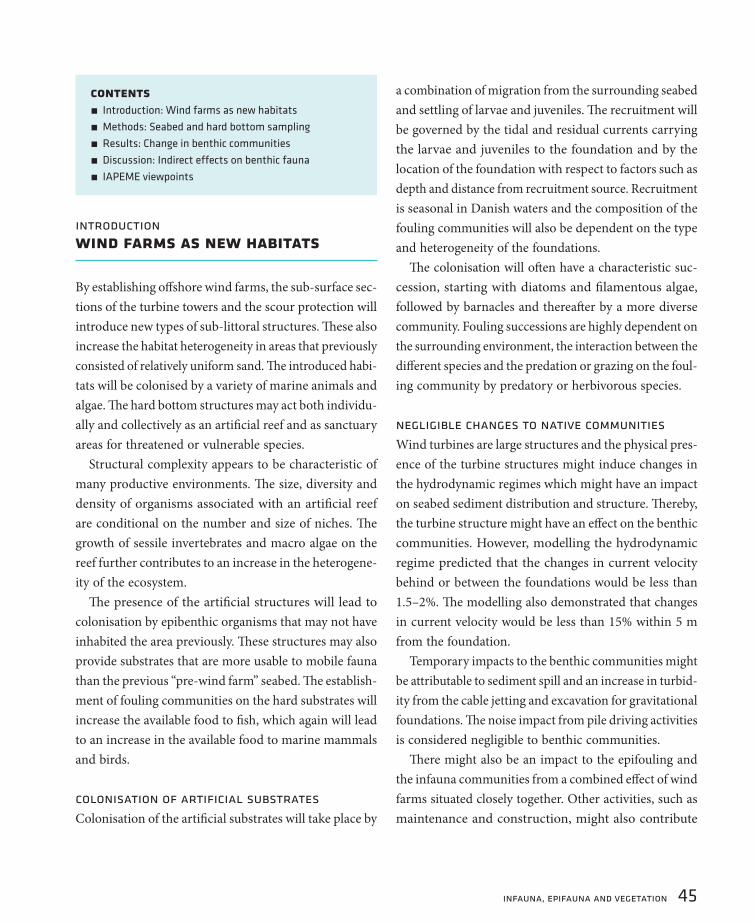
infauna, epifauna and vegetation 45
introduction wind farms as new habitats
By establishing off shore wind farms, the sub-surface sec-
tions of the turbine towers and the scour protection will
introduce new types of sub-littoral structures. Th ese also
increase the habitat heterogeneity in areas that previously
consisted of relatively uniform sand. Th e introduced habi-
tats will be colonised by a variety of marine animals and
algae. Th e hard bottom structures may act both individu-
ally and collectively as an artifi cial reef and as sanctuary
areas for threatened or vulnerable species.
Structural complexity appears to be characteristic of
many productive environments. Th e size, diversity and
density of organisms associated with an artifi cial reef
are conditional on the number and size of niches. Th e
growth of sessile invertebrates and macro algae on the
reef further contributes to an increase in the heterogene-
ity of the ecosystem.
Th e presence of the artifi cial structures will lead to
colonisation by epibenthic organisms that may not have
inhabited the area previously. Th ese structures may also
provide substrates that are more usable to mobile fauna
than the previous “pre-wind farm” seabed. Th e establish-
ment of fouling communities on the hard substrates will
increase the available food to fi sh, which again will lead
to an increase in the available food to marine mammals
and birds.
colonisation of artifi cial substrates
Colonisation of the artifi cial substrates will take place by
a combination of migration from the surrounding seabed
and settling of larvae and juveniles. Th e recruitment will
be governed by the tidal and residual currents carrying
the larvae and juveniles to the foundation and by the
location of the foundation with respect to factors such as
depth and distance from recruitment source. Recruitment
is seasonal in Danish waters and the composition of the
fouling communities will also be dependent on the type
and heterogeneity of the foundations.
Th e colonisation will oft en have a characteristic suc-
cession, starting with diatoms and fi lamentous algae,
followed by barnacles and thereaft er by a more diverse
community. Fouling successions are highly dependent on
the surrounding environment, the interaction between the
diff erent species and the predation or grazing on the foul-
ing community by predatory or herbivorous species.
negligible changes to native communities
Wind turbines are large structures and the physical pres-
ence of the turbine structures might induce changes in
the hydrodynamic regimes which might have an impact
on seabed sediment distribution and structure. Th ereby,
the turbine structure might have an eff ect on the benthic
communities. However, modelling the hydrodynamic
regime predicted that the changes in current velocity
behind or between the foundations would be less than
1.5–2%. Th e modelling also demonstrated that changes
in current velocity would be less than 15% within 5 m
from the foundation.
Temporary impacts to the benthic communities might
be attributable to sediment spill and an increase in turbid-
ity from the cable jetting and excavation for gravitational
foundations. Th e noise impact from pile driving activities
is considered negligible to benthic communities.
Th ere might also be an impact to the epifouling and
the infauna communities from a combined eff ect of wind
farms situated closely together. Other activities, such as
maintenance and construction, might also contribute
contentsIntroduction: Wind farms as new habitats
Methods: Seabed and hard bottom sampling
Results: Change in benthic communities
Discussion: Indirect effects on benthic fauna
IAPEME viewpoints
<
<
<
<
<

46 infauna, epifauna and vegetation
to the impact. Eff ects attributable to ban of trawling
activities and changes in foraging behaviour of birds are
considered the most important.
Th e objective of the studies at Horns Rev and Nysted
was to monitor the development in the native benthic
communities and the development in the fouling com-
munities on the hard bottom structures introduced to
assess the impact of off shore wind farms, if any.
methodsseabed and hard bottom sampling
Th ere were diff erences in the methodology approaches
between the two wind farm sites because two diff erent
operators and two diff erent consultants performed the
surveys. A total of six infaunal and vegetation community
surveys were performed at the Horns Rev and Nysted
off shore wind farms during the pre-construction and
post-construction phases (Figure 4.1).
Quantitative samples of infauna and sediment were
taken using a Van Veen grab and SCUBA diver oper-
ated hand cores and then analysed. Th e species were
identifi ed, counted and the biomass of the species was
determined.
Common mussels (Mytilus edulis) were sampled at
mussel bed sites by SCUBA divers. Th e seabed character
and coverage of benthic communities were mapped and
assessed using a photo-sampler methodology. Th e photo-
sampler consisted of a conventional camera, a video
camera and a fl ash light mounted on a steel frame, the
sampler could cover a seabed area of 1–2 m2.
selection of sampling sites
Sampling of benthic communities at turbine foundations
and scour protection was performed at six turbine sites
at Horns Rev and at eight turbine sites at Nysted from
2003 to 2005. Sampling was performed at both wind
farms during the autumn with additional sampling being
performed at Horns Rev during the spring of each year.
Th e sites were selected according to diff erences in depth
regimes and turbine site locations.
SCUBA divers collected replicate quantitative samples of
fouling organisms at individual stations placed at diff erent
depths and exposure regimes at the turbine foundations
and scour protections (Figure 4.2).
At Horns Rev, a visual determination was performed
of the fouling communities along transects. A semi-
quantitative assessment was carried out for the frequency
of each group of organism as well as an evaluation of
the coverage of species and substrate. Certain groups
of organisms were collected for species identifi cation in
the laboratory.
Underwater video recordings and photographs were
also taken along transects for documentation purposes
at each wind farm site. At Nysted, photographs using a
frame mounted digital camera were taken at diff erent
length and depth intervals on the foundations for an
assessment of the coverage of common mussels, barna-
cles and macro algae. Sediment and fauna samples were
analysed in the laboratory.
resultschange in benthic communities
Th e main eff ect of the establishment of the Horns Rev and
Nysted wind farms was the introduction of the turbine
foundations and the scour protection onto seabeds that
previously consisted of relatively uniform sand. Th ese
hard bottom structures have increased habitat heteroge-
neity and changed the benthic communities from typical
fauna communities with most aquatic animals living in
the seabed to hard bottom communities with increased
abundance and biomass.
heterogeneous native fauna at horns rev
No vegetation was found at Horns Rev and therefore

infauna, epifauna and vegetation 47
fi gure 4.2 hard bottom substrate sampling from 2003 to 2005
fi gure 4.1 seabed sampling from 1999 to 2005
Sampling locations at Nysted.Sampling locations at Horns Rev 1999-2005.
Wind turbines
Stations (1999, 2001, 2003-2005)
campaign year
horns rev nysted
wind farm area reference areas wind farm area reference areas
spring autumn spring autumn spring autumn spring autumn
EIA screening 1999
Baseline 2001
Monitoring 2003
Monitoring 2004
Monitoring 2005
Core samples Photo sampling Van Veen/mussels
Surveys and methodology used for infauna and vegetation at Horns Rev and Nysted.
NB3
NB2
3B
W
SB3
NB1
1B
W
SB1
SB2
1B
E
2B
W
NB4
NB5
4B
W
5B
W
SB4
SB5
2B
E3
BE
4B
E
5B
E
N NB3
NB2
SB3
NB1
SB1
SB2
1B
E
2B
E
3B
E
3B
W
1B
W
2B
W
0 1 2 3 4 5 m
Sample
Photo
SF05SF15SF25SF35
SF45
Sampling locations at the turbine sites at Horns Rev. Sampling locations at the turbine sites at Nysted.
nnessw
braun-blanquet transect quantitative samples 0.04 m2
0-16 m
mean sea level

48 infauna, epifauna and vegetation
the native fauna composition at Horns Rev was closely
associated with the sandy environment. Th e benthos
community was similar in species composition with the
communities in medium-coarse sand described for other
shallow coastal waters of the North Sea. Th e community
can be described as the Ophelia borealis community or the
Goniadella-Spisula community named aft er the dominant
and characteristic species. However, the fauna was very
variable, heterogeneous and only slightly comparable in
abundance and biomass with the fauna at other sandbanks.
Th e fauna in adjoining deeper areas was dominated by
the Venus community.
In the sandbank community, characteristic species
found included the bristle worm Goniadella bobretzkii
and Ophelia borealis and the bivalve Spisula solida (thick
trough shell) (Figure 4.3). Th e two last mentioned species
were important contributors to the biomass of the com-
munity mainly due to their relatively large sizes (Figure
4.4). Indicators of environmental changes could be identi-
fi ed using dominance relations of diff erent species.
fi gure 4.4 biomass of the most dominant species found in the horn rev wind farm area from the 1999 and 2001 baseline surveys
biomass, wet weight g/m21999 2001
spring spring autumn
species group mean relative % mean relative % mean relative %
Spisula solida Bivalve 15.413 7.3 42.109 64.7 231.883 77.4
Ophelia borealis Bristle worm 27.560 13.0 6.505 10.0 7.405 2.5
Goodallia triangularis Bivalve 0.904 0.4 0.400 0.6 0.542 0.2
Goniadella bobretzkii Bristle worm 0.245 0.1 0.075 0.1 0.184 0.1
Pisione remota Bristle worm 0.174 0.1 0.025 0.0 0.035 0.0
Orbinia sertulata Bristle worm 1.415 4.9 2.788 4.3 0.000 0.0
fi gure 4.3 abundance of the most dominant species found in the horns rev wind farm area from the 1999 and 2001 baseline surveys
abundance, number/m21999 2001
spring spring autumn
species group mean relative % mean relative % mean relative %
Pisione remota Bristle worm 142 20.3 176 2.7 411 22.0
Goodallia triangularis Bivalve 262 37.5 154 3.4 203 11.0
Goniadella bobretzkii Bristle worm 114 16.3 129 5.1 190 10.0
Ophelia borealis Bristle worm 29 4.1 47 13.8 72 4.0
Spisula solida Bivalve 2 0.3 32 16.4 36 2.0
Orbinia sertulata Bristle worm 12 1.7 25 18.8 0 0.0
indicators of environmental changesBristle worms: Ophelia borealis, Goniadella bobretzkii, Pisione remota, Orbinia sertulata. Mussels: Goodallia triangularis, Spisula solida.

infauna, epifauna and vegetation 49
Due to natural variations in populations with respect
to reproduction and body mass increase, considerable
and signifi cant diff erences were found in temporal and
spatial distribution of the indicator species and other
species in the community (Figure 4.5).
As at other sandbanks, the sediment at Horns Rev
was characterised by a low organic content. Th e benthic
community at Horns Rev was generally characterised
by a lower degree of diversity, abundance and biomass
compared to adjacent areas where the bottom conditions
were more stable and the sediment had a higher content
of fi ne sand and organic material. In comparison, the
number of bivalves that are important food items for
diving ducks, such as the common scoter (Melanitta ni-
gra), was far lower in the Horns Rev area than in nearby
areas of the North Sea characterised by the bivalve Venus
community.
Mobile epifauna was oft en found on the seabed around
Horns Rev. Th e brown shrimp (Crangon crangon), which
goodallia triangularis, 1999Individuals/m2
0200400
10001400
Wind turbines
fi gure 4.5 distribution pattern of some of the most abundant species in the wind farm area at horns rev, 1999
ophelia borealis, 1999Individuals/m2
050100
150250
Wind turbines
goniadella bobretzkii, 1999Individuals/m2
050100
200370
Wind turbines
characteristic mobile epifauna elementsThe hermit crab (Pagurus bernhardus), the common shore crab
(Carcinus maenas), the swimming crab (Liocarcinus pusillus,
L. holsatus and L. depurator), the common whelk (Buccinum
undatum), the brown shrimp (Crangon crangon), the common
starfi sh (Asterias rubens), the Alder’s necklace shell (Polinices
polianus) and the edible crab (Cancer pagurus).

was oft en observed in the wind farm area, is an important
prey species for both sea birds and fi sh.
homogeneous native fauna at nysted
At Nysted, the benthic infauna community was characterised
as a shallow water bivalve Macoma community, named aft er
the Baltic tellin (Macoma balthica). Some of the species
found were typical indicators of brackish water.
Th e common mussel (Mytilus edulis) was scattered on
the seabed surface, especially where stones were present,
in high percentages (up to 80%) and large numbers and
were mainly found in the southern part of the wind farm
area (Figure 4.6).Th e bottom fauna was very homogeneous,
however, subgroups of the Macoma community existed,
which was mainly applicable to sites where common
mussel biotopes were found (Figure 4.8). Th e crustacean
Gammarus was oft en associated with the common mus-
sel beds. Th e most important factor infl uencing species
distribution and abundance was the organic content of
the sediment, the similarity in abundance was about 50%
between most stations.
Common mussels were found locally in large numbers,
up to 1,500 ind./m2, constituting more than 35% of the total
biomass. Two or three generations were found but the mussel
population was dominated by newly settled juveniles.
Attached algae communities were rare at Nysted but
were dominated entirely by the annual fi lamentous brown
algae Pilayella/Ectocarpus. Th e distribution of the algae
was closely related to areas with suitable substrates and
occurred in areas where stones and common mussels
were observed (Figures 4.9 and 4.10). Th e coverage of
algae was less than 5%.
differences in salinity and vegetation
Although scattered stones were found at Nysted and the
reworking and redistribution of sediment were considered
50 infauna, epifauna and vegetation
brackish water speciesThe bristle worm (Fabricia stellata) and (Streblospio shrubsoli)
and the crustacean (Cyathura carinata).
species characteristic of the macoma communityThe cockle (Cerastoderma glaucum), the sand gaper (Mya
arenaria), the ragworm (Nereis (Hediste) diversicolor), the bristle
worm (Pygospio elegans), the mud snail (Hydrobia sp.).
fi gure 4.7 Common mussels with growth of hydrozoans at Nysted.
pho
to: m
ak
s k
lau
str
up
fi gure 4.6 coverage of common mussels at nysted in 1999

fi gure 4.9 distribution of benthic communities at nysted 1999
fi gure 4.10 coverage of macro algae along transects at nysted 1999
infauna, epifauna and vegetation 51
to be considerably higher at Horns Rev due the higher
waves and stronger currents than at Nysted, the seabed
at the two wind farm sites consisted mainly of medium
to coarse sand. Th e diff erences found in species compo-
sition and benthic communities were therefore mainly
attributable to diff erences in salinity and vegetation cover
between the two sites.
At Nysted, the benthic community was dominated by
shallow water species characteristic of the inner Danish
waters and brackish water species not recorded at Horns
Rev. In general, very few species were commonly found
at both Nysted and Horns Rev. Th e common mussel and
the mud snail (Hydrobia spp.) that dominated at Nysted
were only found in small numbers at Horns Rev. Th ey
were found only as newly settled specimens and juveniles
and were presumably limited in growth and controlled
by the common starfi sh (Asterias rubens), which is a key
predator not found at Nysted.
different epifouling communities
Th e epifouling community at Horns Rev was character-
ised by high species richness. Th e hard substrates were
colonized mainly by species not previously recorded in
the sandy seabed community, thereby increasing the spe-
fi gure 4.8 mean abundance (ind./m2) of species contributing with 75% of the similarity in the three subgroups of the macoma community found at nysted in the 1999 baseline survey
species group fauna group i fauna group ii fauna group iii
Hydrobia sp. Snail 3,790 3,390 2,330
Pygospio elegans Bristle worm 720 1,270 1,190
Nereis diversicolor Bristle worm 50 125 95
Mya arenaria Bivalve 70 27 28
Macoma balthica Bivalve 30 30 35
Mytilus edulis Bivalve 31 415 5

fi gure 4.11 development in infauna and epifauna communities
52 infauna, epifauna and vegetation
cies richness in the area (Figure 4.11). At Nysted where
more heterogeneous seabed structures were found, the
colonizing communities were mainly composed of species
previously recorded in the benthic mussel bed and algae
communities. Almost a monoculture of common mussels
had developed on the turbine structures at Nysted and
the species richness at Nysted was far less pronounced
than at Horns Rev. Th e diff erences in the characteristics
of the epifouling community were mainly attributable to
the diff erences in salinity between the two sites.
No exact comparisons with a hard bottom reference
site were made at Horns Rev. Similarities in the epifouling
communities were, however, found between the Horns
Rev communities and the communities found in studies
from other areas in the North Sea where hard bottom
substrates were deployed. As in these studies, a continuous
development in the succession of the epifouling com-
munity was also found at Horns Rev. It was assessed that
stability and maturity of the epifouling communities will
not be reached within 5–6 years aft er deployment of the
hard bottom substrates. At Nysted, the species richness
on the hard substrates deployed was comparable to the
species richness at a nearby natural stone reef within
three years aft er deployment.
Although most species in the epifouling communities
were found both on the vertical and the horizontal artifi cial
structures, diff erences were found in community structure
between diff erent substrate types – shaft s, monopiles and
stones. Th e diff erences were attributable to diff erences
in abundance and biomass of the most abundant and
most important species. At Nysted, the dominance of the
common mussel, the barnacle (Balanus improvisus) and
the associated species of crustaceans (Gammarus spp.,
Corophium insidiosum and Microdeutopus gryllotalpa)
contributed to the diff erences between substrate types.
At Horns Rev, these diff erences were mainly attributable
to diff erences in dominance and biomass of the crusta-
ceans (Jassa marmorata and Caprella linearis (C. mutica))
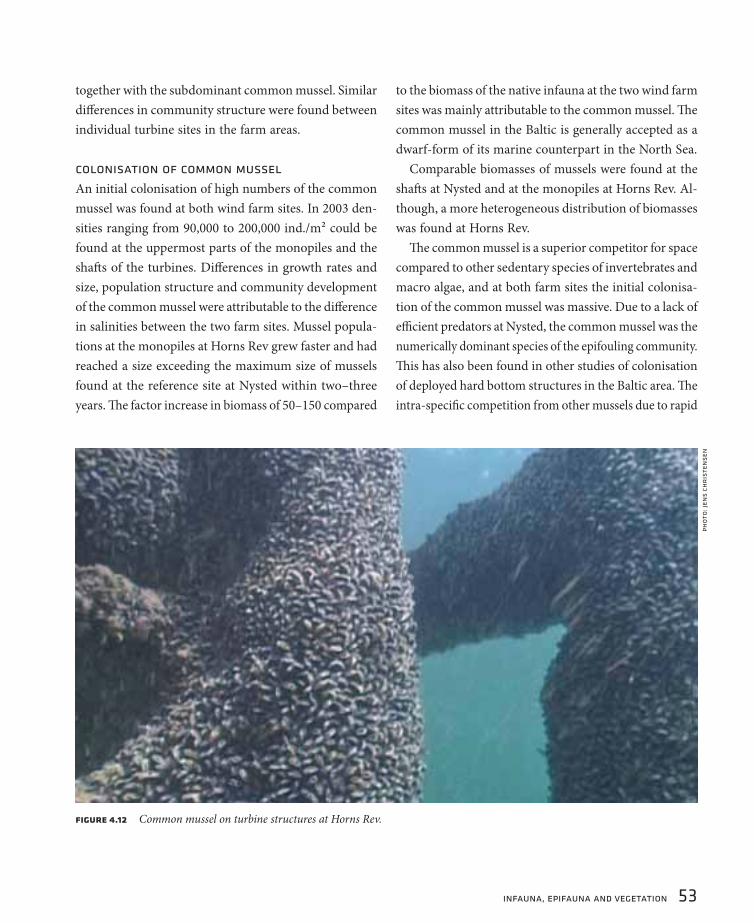
infauna, epifauna and vegetation 53
together with the subdominant common mussel. Similar
diff erences in community structure were found between
individual turbine sites in the farm areas.
colonisation of common mussel
An initial colonisation of high numbers of the common
mussel was found at both wind farm sites. In 2003 den-
sities ranging from 90,000 to 200,000 ind./m2 could be
found at the uppermost parts of the monopiles and the
shaft s of the turbines. Diff erences in growth rates and
size, population structure and community development
of the common mussel were attributable to the diff erence
in salinities between the two farm sites. Mussel popula-
tions at the monopiles at Horns Rev grew faster and had
reached a size exceeding the maximum size of mussels
found at the reference site at Nysted within two–three
years. Th e factor increase in biomass of 50–150 compared
to the biomass of the native infauna at the two wind farm
sites was mainly attributable to the common mussel. Th e
common mussel in the Baltic is generally accepted as a
dwarf-form of its marine counterpart in the North Sea.
Comparable biomasses of mussels were found at the
shaft s at Nysted and at the monopiles at Horns Rev. Al-
though, a more heterogeneous distribution of biomasses
was found at Horns Rev.
Th e common mussel is a superior competitor for space
compared to other sedentary species of invertebrates and
macro algae, and at both farm sites the initial colonisa-
tion of the common mussel was massive. Due to a lack of
effi cient predators at Nysted, the common mussel was the
numerically dominant species of the epifouling community.
Th is has also been found in other studies of colonisation
of deployed hard bottom structures in the Baltic area. Th e
intra-specifi c competition from other mussels due to rapid
fi gure 4.12 Common mussel on turbine structures at Horns Rev.
pho
to: j
ens
chr
iste
nse
n
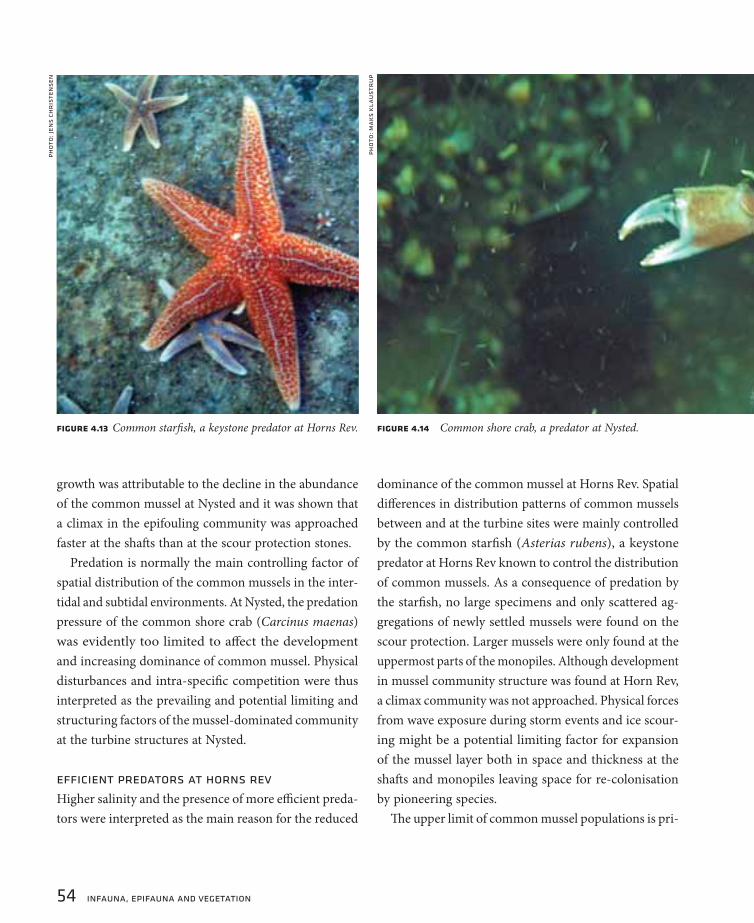
54 infauna, epifauna and vegetation
growth was attributable to the decline in the abundance
of the common mussel at Nysted and it was shown that
a climax in the epifouling community was approached
faster at the shaft s than at the scour protection stones.
Predation is normally the main controlling factor of
spatial distribution of the common mussels in the inter-
tidal and subtidal environments. At Nysted, the predation
pressure of the common shore crab (Carcinus maenas)
was evidently too limited to aff ect the development
and increasing dominance of common mussel. Physical
disturbances and intra-specifi c competition were thus
interpreted as the prevailing and potential limiting and
structuring factors of the mussel-dominated community
at the turbine structures at Nysted.
effi cient predators at horns rev
Higher salinity and the presence of more effi cient preda-
tors were interpreted as the main reason for the reduced
dominance of the common mussel at Horns Rev. Spatial
diff erences in distribution patterns of common mussels
between and at the turbine sites were mainly controlled
by the common starfi sh (Asterias rubens), a keystone
predator at Horns Rev known to control the distribution
of common mussels. As a consequence of predation by
the starfi sh, no large specimens and only scattered ag-
gregations of newly settled mussels were found on the
scour protection. Larger mussels were only found at the
uppermost parts of the monopiles. Although development
in mussel community structure was found at Horn Rev,
a climax community was not approached. Physical forces
from wave exposure during storm events and ice scour-
ing might be a potential limiting factor for expansion
of the mussel layer both in space and thickness at the
shaft s and monopiles leaving space for re-colonisation
by pioneering species.
Th e upper limit of common mussel populations is pri-
pho
to: j
ens
chr
iste
nse
n
fi gure 4.13 Common starfi sh, a keystone predator at Horns Rev. fi gure 4.14 Common shore crab, a predator at Nysted.
pho
to: m
ak
s k
lau
str
up
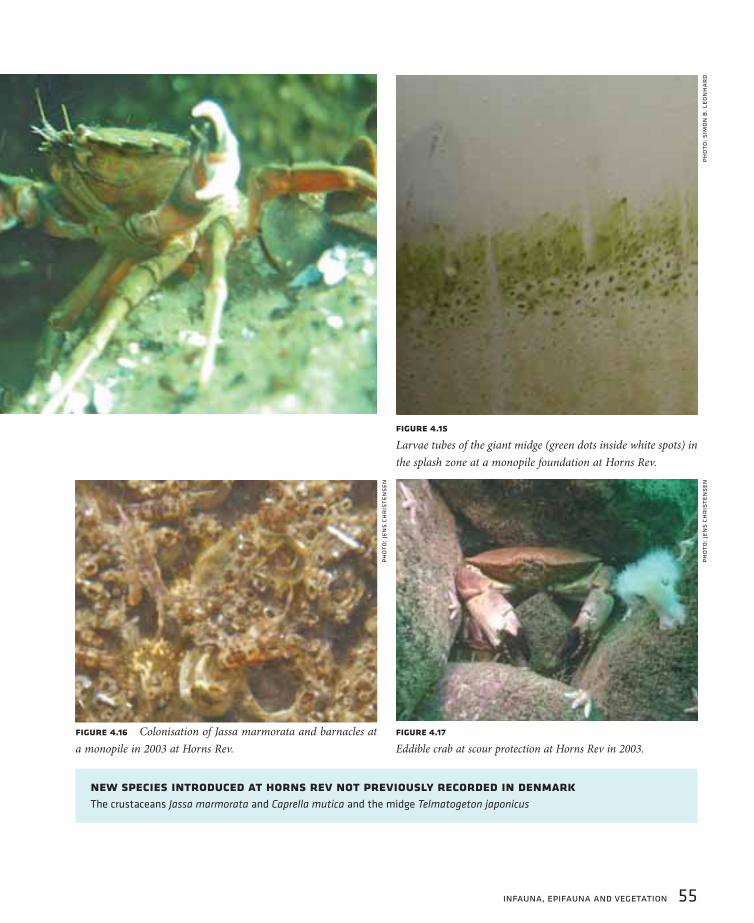
infauna, epifauna and vegetation 55
fi gure 4.15
Larvae tubes of the giant midge (green dots inside white spots) in
the splash zone at a monopile foundation at Horns Rev.
pho
to: s
imo
n b
. leo
nh
ar
d
new species introduced at horns rev not previously recorded in denmark The crustaceans Jassa marmorata and Caprella mutica and the midge Telmatogeton japonicus
fi gure 4.16 Colonisation of Jassa marmorata and barnacles at
a monopile in 2003 at Horns Rev.
pho
to: j
ens
chr
iste
nse
n
fi gure 4.17
Eddible crab at scour protection at Horns Rev in 2003.
pho
to: j
ens
chr
iste
nse
n
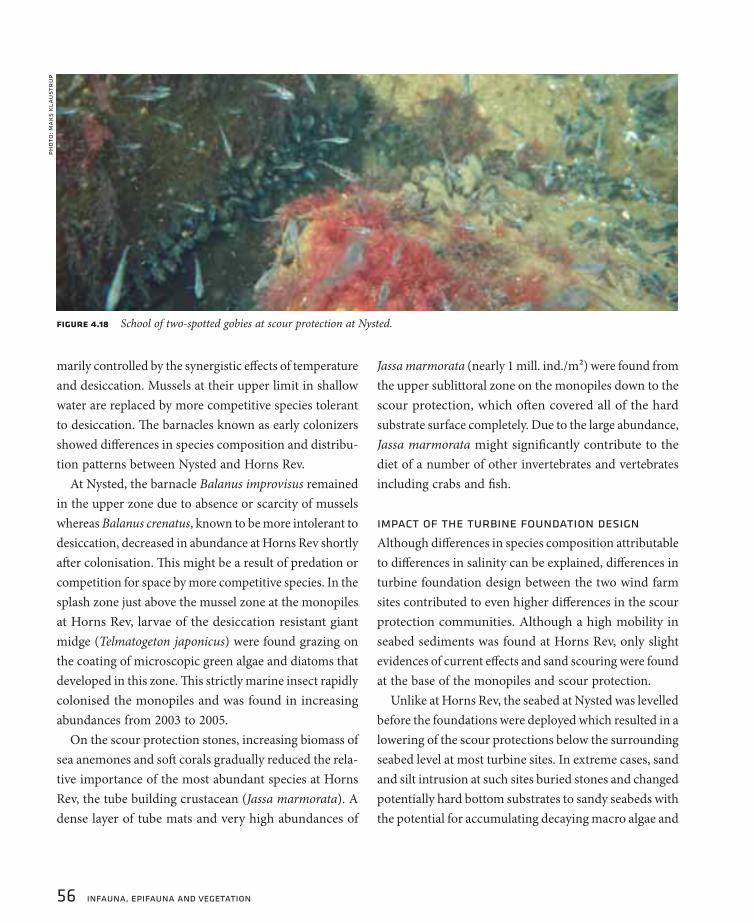
56 infauna, epifauna and vegetation
marily controlled by the synergistic eff ects of temperature
and desiccation. Mussels at their upper limit in shallow
water are replaced by more competitive species tolerant
to desiccation. Th e barnacles known as early colonizers
showed diff erences in species composition and distribu-
tion patterns between Nysted and Horns Rev.
At Nysted, the barnacle Balanus improvisus remained
in the upper zone due to absence or scarcity of mussels
whereas Balanus crenatus, known to be more intolerant to
desiccation, decreased in abundance at Horns Rev shortly
aft er colonisation. Th is might be a result of predation or
competition for space by more competitive species. In the
splash zone just above the mussel zone at the monopiles
at Horns Rev, larvae of the desiccation resistant giant
midge (Telmatogeton japonicus) were found grazing on
the coating of microscopic green algae and diatoms that
developed in this zone. Th is strictly marine insect rapidly
colonised the monopiles and was found in increasing
abundances from 2003 to 2005.
On the scour protection stones, increasing biomass of
sea anemones and soft corals gradually reduced the rela-
tive importance of the most abundant species at Horns
Rev, the tube building crustacean (Jassa marmorata). A
dense layer of tube mats and very high abundances of
Jassa marmorata (nearly 1 mill. ind./m2) were found from
the upper sublittoral zone on the monopiles down to the
scour protection, which oft en covered all of the hard
substrate surface completely. Due to the large abundance,
Jassa marmorata might signifi cantly contribute to the
diet of a number of other invertebrates and vertebrates
including crabs and fi sh.
impact of the turbine foundation design
Although diff erences in species composition attributable
to diff erences in salinity can be explained, diff erences in
turbine foundation design between the two wind farm
sites contributed to even higher diff erences in the scour
protection communities. Although a high mobility in
seabed sediments was found at Horns Rev, only slight
evidences of current eff ects and sand scouring were found
at the base of the monopiles and scour protection.
Unlike at Horns Rev, the seabed at Nysted was levelled
before the foundations were deployed which resulted in a
lowering of the scour protections below the surrounding
seabed level at most turbine sites. In extreme cases, sand
and silt intrusion at such sites buried stones and changed
potentially hard bottom substrates to sandy seabeds with
the potential for accumulating decaying macro algae and
fi gure 4.18 School of two-spotted gobies at scour protection at Nysted.
pho
to: m
ak
s k
lau
str
up

infauna, epifauna and vegetation 57
so developing anoxic conditions.
Th e combined eff ects of smothering, sand intrusion and
sand scouring have most likely contributed to the lower
recruitment success of mussels on the scour protection
below surrounding seabed levels at Nysted. However,
the sedimentation of inorganic and organic matter was
benefi cial for settling of the tube building crustacean
Corophium insidiosum.
Artifi cially deployed hard bottom substrates are
generally considered benefi cial to the reproduction and
growth of some native mobile species, such as crabs by
providing shelter and nursery grounds. Th is eff ect was
only demonstrated at Horns Rev. Eggs and juveniles of
diff erent species of crab, bristle worm and sea slug were
found at the turbine foundations during the survey period.
Th e edible crab (Cancer pagurus) colonized the deployed
hard substrates as adults and juveniles. A rapid growth
of juveniles was found from 2003 to 2005.
At both wind farm sites, fi sh were oft en found swim-
ming around the artifi cial reef structures apparently
searching for food and shelter.
development in algae communities
On the deployed hard substrates, a succession in the de-
velopment and distribution of attached algae was found.
In the upper part of the monopiles at Horns Rev, a cover
of algae was found shift ing from an initial colonisation of
fi lamentous green algae to a more diverse and permanent
vegetation of green, brown and red algae. Some of the
same species were also found colonizing the foundations at
Nysted. Compared to Nysted, the macro algae community
at Horns Rev was still attracting new species and increasing
in depth distribution in 2005. Th e 2005 macro algae com-
munity at Nysted had decreased in species diversity and
biomass at both shaft s and scour protection since initial
colonisation. Competition for space from common mus-
sels was considered the most important factor controlling
the distribution of macroalgae at Nysted.
fi gure 4.21 Development in the number of species of macroalgae
on shaft s and stones of the turbines at Nysted and at a natural
stone reef close to the wind farm.
fi gure 4.20 Th e red algae Polysiphonia fi brillosa found at
foundations at Horns Rev and Nysted.
fi gure 4.19 Cod at Horns Rev.
pho
to: j
ens
chr
iste
nse
nph
oto
: jen
s ch
ris
ten
sen

58 infauna, epifauna and vegetation
possible sanctuary area
Th e wind farm area at Horns Rev and the hard bottom
structures introduced there might function as a sanctu-
ary for species included on the Red List for threatened
or vulnerable Wadden Sea species. Special attention
should be given to the ross worm (Sabellaria spinulosa)
and the white weed (Sertularia cupressina). Th ese species
and the native oyster (Ostrea edulis) that was also found
around the turbine sites at Horns Rev, are regarded as
threatened or red listed species in the Wadden Sea area
as a result of habitat loss.
An increase in the abundance of the bristle worm
(Marenzelleria viridis) was found since it appeared in
the infauna at Nysted in 2001. Th is introduction was
not attributable to the establishment of the wind farm as
this species was found in abundant numbers elsewhere
in the region.
negligible effects on seabed
Results from other studies on the eff ect of changes in
hydrodynamic regimes due to deployment of artifi cial
reefs in the North Sea have only shown small eff ects
on the infauna community very close to the reef. At
Horns Rev, a general increase in sediment coarseness
and changes in infaunal community structure was found
from the pre-construction to the post-construction situ-
ation. Th e changes were not attributable to the presence
of the wind farm because parallel changes were found
at the reference sites.
Th e density of the most abundant bivalves and bristle
worms was higher in the wind farm area than in the
reference area. However, changes in the abundance and
biomass of the character and dominant species, including
the bristle worm (Ophelia borealis), were not statistically
signifi cant. Th e diff erences were mainly attributable to
fi gure 4.22 Th e white weed, a threatened species in the Wadden Sea, overgrown by Jassa marmorata.
pho
to: j
ens
chr
iste
nse
n

infauna, epifauna and vegetation 59
natural variations in spatial and temporal distribution
and changes in sediment characteristics.
decline of some species
At Horns Rev, the most dramatic change in the benthic
infauna community structure was the decline in abun-
dance and biomass of the bristle worms (Pisione remota
and Goniadella bobretzkii) from 2001 to 2004 and the
decline in biomass of the bivalve thick trough shell
(Spisula solida). In 2005, diff erences were found in the
distribution patterns of the American razor shell (Ensis
americanus) and another bivalve (Th racia phaseolina)
between the wind farm area and a reference area. In the
wind farm area, the American razor shell was observed
in lower numbers than in the reference area whereas
diff erent observations were made for the bivalve Th racia
phaseolina. Th ose observations showed diff erences in
abundance and biomass relations between the wind farm
area and the reference area. Th is bivalve, although not
found in very high numbers, seems to have increased in
the wind farm area from 1999 to 2005 without a similar
increase in the reference area.
A tendency was found towards an increase in sediment
coarseness with increasing distance from the turbine
foundations at Horns Rev but no signifi cant distance-re-
lated eff ects on the benthic infauna community structure
was detectable.
no signifi cant changes in biomass
At Nysted, the spatial variation and the temporal changes
in sediment coarseness were generally insignifi cant. But
average sediment coarseness was consistently lower in
the wind farm area than at the reference transects. Th e
organic content of the sediment in the wind farm area
increased signifi cantly from 2001 to 2005 and exceeded
the level at the reference site in 2005. However, the dif-
ferences were not attributable to the establishment of
the wind farm.
A relationship was not found between sediment coarse-
ness and the distance of the sampling stations from the
cables between the turbines. Th e organic content was
highest at the furthest distance from the cables between
the turbines. Similar trends in sediment parameters were
apparent in 1999 and in 2001 indicating that there was
no impact from diff erent hydrodynamic regimes related
to the presence of the foundations.
Increased sedimentation of organic matter and/or de-
creased consumption on the seabed and turnover in the
sediment could increase the accumulation of organic matter
on the seabed sediment. Th is would have increased the
abundance of deposit feeding benthic species. However,
the abundance of deposit feeders had declined rapidly
since 2001 in conjunction with an increase in organic
matter in the sediment but a possible causal relationship
is uncertain.
fi gure 4.23 Th e American razor shell, an important food item
for the common scooter at Horns Rev.
pho
to: m
ak
s k
lau
str
up

60 infauna, epifauna and vegetation
Most of the characteristic shallow water species at
Nysted declined between 1999 and 2005, including the
formerly predominant species of the bristle worm (Py-
gospio elegans) and the mudsnail (Hydrobia sp.). Only the
newly introduced species Marenzelleria viridis increased
in numbers. Th e overall distribution of common mussels
remained unchanged compared with 1999 but the coverage
and biomass of mussels was reduced from 1999 to 2005
in the wind farm area. Th e changes in average biomass
were not signifi cant along the reference transects. An
increase in the condition of the common mussels from
1999 to 2005 was most likely attributable to the decline
in percentage cover of other species and reduction for
food competition.
Th e causes of the decline in abundance and biomass of
the benthic fauna and the coverage of common mussels
in the wind farm area and along the reference transects
were not obvious. Th e shallow water community at
Nysted was not aff ected by imported oxygen defi ciency
from adjacent deeper waters or by decaying macro algae.
Th e coverage of macro algae, mainly the dominating
detached fi lamentous brown algae, increased in the wind
farm and reference areas from 1999 to 2005. However,
the changes in coverage and distribution of macro algae
were attributable to the combined eff ects of natural
variations and weather induced changes in the transport
and accumulation of macro algae. Th e changes were not
attributable to changes in hydrodynamic regimes as an
eff ect from the establishment of the wind farm.
no signifi cant effect on epifouling communities
Only insignifi cant diff erences were found in the epifouling
communities at diff erent directions and exposures of the
turbine foundations. Th is indicates that there was only a
negligible impact from the diff erences in current regimes
and exposures on the community structure.
On the scour protections at Horns Rev, no statistically
signifi cant diff erences were found in fouling community
structure between the leeward and current side of the
monopiles. However, a statistically signifi cant diff er-
ence was found between the two sides in the zone near
the bottom of the monopiles. Th is indicates an impact
fi gure 4.24 Barnacles growing on common mussels fi ltering the water for plankton with their cirri.
pho
to: m
ak
s k
lau
str
up
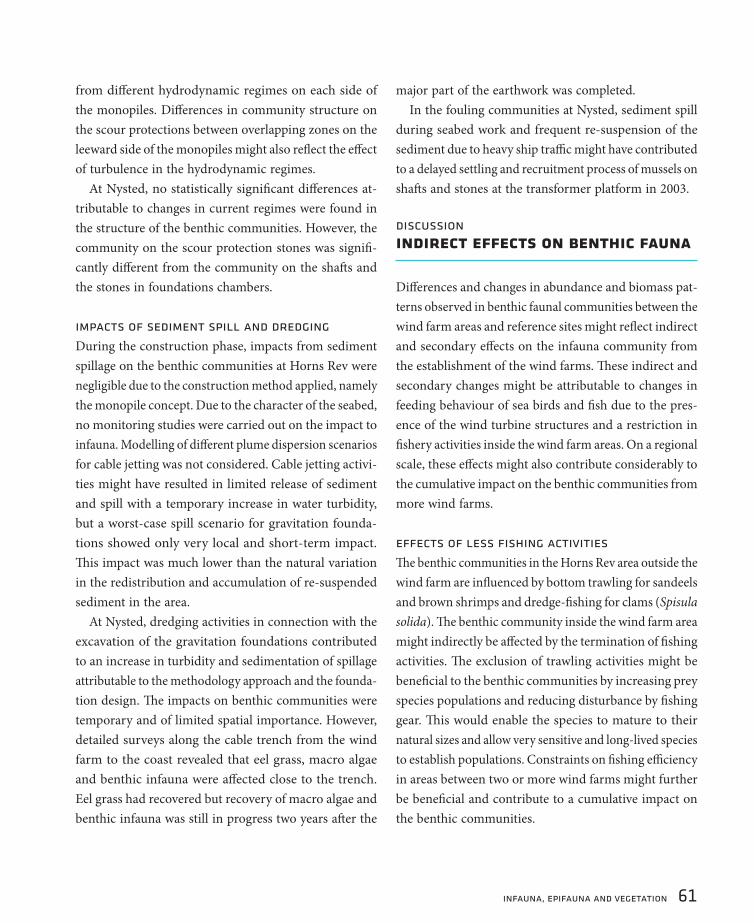
infauna, epifauna and vegetation 61
from diff erent hydrodynamic regimes on each side of
the monopiles. Diff erences in community structure on
the scour protections between overlapping zones on the
leeward side of the monopiles might also refl ect the eff ect
of turbulence in the hydrodynamic regimes.
At Nysted, no statistically signifi cant diff erences at-
tributable to changes in current regimes were found in
the structure of the benthic communities. However, the
community on the scour protection stones was signifi -
cantly diff erent from the community on the shaft s and
the stones in foundations chambers.
impacts of sediment spill and dredging
During the construction phase, impacts from sediment
spillage on the benthic communities at Horns Rev were
negligible due to the construction method applied, namely
the monopile concept. Due to the character of the seabed,
no monitoring studies were carried out on the impact to
infauna. Modelling of diff erent plume dispersion scenarios
for cable jetting was not considered. Cable jetting activi-
ties might have resulted in limited release of sediment
and spill with a temporary increase in water turbidity,
but a worst-case spill scenario for gravitation founda-
tions showed only very local and short-term impact.
Th is impact was much lower than the natural variation
in the redistribution and accumulation of re-suspended
sediment in the area.
At Nysted, dredging activities in connection with the
excavation of the gravitation foundations contributed
to an increase in turbidity and sedimentation of spillage
attributable to the methodology approach and the founda-
tion design. Th e impacts on benthic communities were
temporary and of limited spatial importance. However,
detailed surveys along the cable trench from the wind
farm to the coast revealed that eel grass, macro algae
and benthic infauna were aff ected close to the trench.
Eel grass had recovered but recovery of macro algae and
benthic infauna was still in progress two years aft er the
major part of the earthwork was completed.
In the fouling communities at Nysted, sediment spill
during seabed work and frequent re-suspension of the
sediment due to heavy ship traffi c might have contributed
to a delayed settling and recruitment process of mussels on
shaft s and stones at the transformer platform in 2003.
discussionindirect effects on benthic fauna
Diff erences and changes in abundance and biomass pat-
terns observed in benthic faunal communities between the
wind farm areas and reference sites might refl ect indirect
and secondary eff ects on the infauna community from
the establishment of the wind farms. Th ese indirect and
secondary changes might be attributable to changes in
feeding behaviour of sea birds and fi sh due to the pres-
ence of the wind turbine structures and a restriction in
fi shery activities inside the wind farm areas. On a regional
scale, these eff ects might also contribute considerably to
the cumulative impact on the benthic communities from
more wind farms.
effects of less fi shing activities
Th e benthic communities in the Horns Rev area outside the
wind farm are infl uenced by bottom trawling for sandeels
and brown shrimps and dredge-fi shing for clams (Spisula
solida). Th e benthic community inside the wind farm area
might indirectly be aff ected by the termination of fi shing
activities. Th e exclusion of trawling activities might be
benefi cial to the benthic communities by increasing prey
species populations and reducing disturbance by fi shing
gear. Th is would enable the species to mature to their
natural sizes and allow very sensitive and long-lived species
to establish populations. Constraints on fi shing effi ciency
in areas between two or more wind farms might further
be benefi cial and contribute to a cumulative impact on
the benthic communities.
62 infauna, epifauna and vegetation
The “artifi cial reef effect” was a prominent feature of the initial
discussions relating to the environmental impact of scour pro-
tection around wind turbines. The information from the Horns
Rev and Nysted wind farms allows the ongoing discussion of
the ecological pros and cons of deploying scour protection to
be based on data rather than suppositions. The use of industry
standard methodology (photo and video transects, Van Veen
grabs, diver hand cores, analytical software such as PRIMER)
allows comparisons with previous and future work on soft and
hard substrates.
epibenthos Epibenthic community structures at Nysted and Horns Rev
wind farms differ in community composition. However, both
sites showed, as hypothesised in the EIA, that the new, hard
substrate (provided by the scour protection, gravity foundations
and the steel tower) was colonised rapidly by both marine plants
and animals. The differences in community structure between
the wind farms refl ect environmental differences between the
areas, in this case most notably the salinity regimes as well
as the supply of larvae and mobile adults. This colonisation
recorded refl ects the position found on most artifi cial reefs that
colonisation of hard surfaces is rapid and community structure
develops with time. Initial species composition refl ects the
season of deployment and the availability of species able to
colonise, be they adults, juveniles or planktonic larvae, and so
neither community can be considered as “typical” of all wind
farms in either the North Sea or the Baltic Sea but representa-
tive of what is likely to happen under similar circumstances.
What is obvious from these data is that both wind farms are
still developing their epibiotic communities, and data collected
in 2005 cannot be taken to describe the fi nal biological com-
munities. There is a need for long-term monitoring of both
wind farms to provide an appreciation of how the communi-
ties will develop and contribute to the ecology of the area, so
providing a long-term dataset against which other wind farm
developments can be judged. Asterias rubens as a predator of
the Horns Rev Mytilus community is likely to have played a key
role in preventing a “mussel monoculture” from developing
by opening up space for other epibiota to settle, so increas-
ing species diversity. This predator was absent from Nysted,
presumably because of the low salinity, so allowing a Mytilus
community to dominate.
In the case of Horns Rev, there is a particular need to understand
the role of the scour protection in the ecology of the wind farm
area. Whilst sedentary epifauna will be restricted to the hard
surfaces, some mobile species, eg cryptic fi sh species such as
gobies and blennies and invertebrates such as crabs, will move
out onto the sandy areas between the scour protection to forage,
possibly creating a feeding halo around each turbine. As wind
farm numbers in the North Sea increase, so may the volume of
scour protection, providing new habitats for these species.
It is also possible that the absence of trawling and dredging
within a wind farm will promote increases in the abundance
of the infauna. At Horns Rev this will always be infl uenced
by the inherent mobility of the sandy sediment. In the case
of exploited species, such as Spisula, densities may increase
both as a result of a reduction in harvesting by humans and an
IAPEME viewpoints

infauna, epifauna and vegetation 63
apparent reduction of predators such as the scoter entering the
wind farm. The latter may change in time should these ducks
become acclimatised to conditions around the wind farm.
The presence of commercial species such as cod and the ed-
ible crab Cancer pagurus at Horns Rev also gives rise to the
question of how future wind farm expansions might infl uence
the population of such commercially valuable mobile species
through deposition of scour protection. Research into residence
periods, shelter and food requirements for such species around
wind farms would be the start of establishing the ecological
links between the scour protection communities and potentially
exploitable species leading to an assessment of how signifi cant
turbine scour protection could be to commercial species.
Speculation about crab and cod populations requires novel
research in the future. However, the scientifi c effort that
focused on the scour protection at Horns Rev has already
provided dividends for science in identifying new species in
Danish waters (Telematogenton japonicus, Jassa marmorata
and Caprella mutica). In addition, researchers identifi ed species
on the Wadden Sea “red list” (Sabellaria spinulosa, Serularia
cupressina and Ostrea edulis) utilising the scour protection
habitat thus indicating the value of detailed study into the
marine biota colonising newly deployed habitats.
The fragility and temporary nature of shallow water epibenthic
communities in exposed locations must also be recognised.
Whilst the Horns Rev epibiota appears to have been developing
each year since deployment, a severe storm in 1999 removed all
fouling from a meteorological mast in the area. It is possible
that a future storm might do the same to the biota on the
scour protection, potentially reversing a substantial proportion
of the community development.
infaunaInfaunal data also show the strong infl uence of environmental
factors on the sediment communities. The two wind farms
differ in their biological composition, with the lower salinity
sediments at Nysted supporting a Macoma community whilst
the higher energy and salinity environment at Horn Rev revealed
a Goniadella-Spisula community. The presence of internation-
ally recognised infaunal communities will help when comparing
the Danish data with potential new wind farm sites. Data col-
lected show that whilst some changes in infaunal biology and
sediment characteristics have taken place these do not seem
to be focused within either wind farm area. A heterogeneous
distribution within the sediment seems to be the norm at both
sites and natural variability is to be expected, especially in the
high energy environment of Horns Rev. Changes in the hydro-
graphic character of the sites post wind farm deployment seem
to be minimal, suggesting the spacing of the wind turbines is
suffi cient to minimise disruption to water fl ows.

64 fi sh
5fi shfew effects on the fi sh communities so farby maks klaustrup, orbicon
Overall, the studies have so far found few effects on the fi sh fauna that could
be attributed to the establishment and operation of the wind farms.
Fish abundance and diversity were not higher inside the wind farms than in
the areas outside the wind farms. At Horns Rev, one important reason for
this could be that the studies and investigations were made during the early
stages of colonisation of the turbine foundations that constitute the artifi cial
reefs. At Nysted, the effect was presumably weak because the benthic com-
munity consisted of a monoculture of large common mussels that are only
moderately attractive to fi sh.
Investigations into the effects on fi sh and fi sh behaviour from electromagnetic
fi elds were made at Nysted. Data have documented some effects from the
cable route on fi sh behaviour indicating avoidance of the cable as well as at-
traction, depending on the species. However, only fl ounder showed correlation
between the phenomena observed and the assumed strength of the electro-
magnetic fi elds.
fi sh 65
introduction
new habitat and sediment
Off shore wind farms may infl uence the fi sh fauna and the
fi sh communities during four diff erent stages of a wind
farm’s existence: pre-construction, construction, operation
and decommissioning. In connection with the establish-
ment of the off shore wind farms at both Nysted and Horns
Rev, a number of surveys and investigations were carried
out to document and assess the possible eff ects from the
wind farms on the fi sh fauna community. Th e main ef-
fects associated with pre-construction surveys (seismic
investigations) and the construction of the wind farm
only took place during short transition phases and were
not expected to have long-term eff ects on fi sh. However,
two elements have long-term eff ects: the establishment
of turbine foundations, which create new hard substrate
habitats, and the transmission of the electric power to
the shore, which generates a weak electromagnetic fi eld
along the cable that may be sensed by several species of
fi sh. Th is chapter focuses on these two eff ects.
increasing habitat diversity
Fish communities refl ect the habitats they live in and a
change of habitat is expected to be refl ected in the fi sh
community. Th e establishment of an off shore wind farm
in areas where the seabed is made up of sand leads to a
loss of natural habitats by the introduction of foundations
and the rocks and stones that serve as scour protection.
Th is was the case at Nysted and Horns Rev.
Th e attraction of fi sh to the scour protection is spe-
cies specifi c and may take place for a number of reasons.
Resident fi sh species are expected to be attracted to the
scour protections and turbine foundations (artifi cial reefs)
because they off er shelter against predators and strong
water currents. In addition to this, some fi sh may visit
the artifi cial reefs to feed, while others may use the reefs
as spawning and nursery areas for juvenile fi sh. Further,
the reefs may function as important sanctuaries for some
species due to restrictions in commercial fi shing within
the wind farm areas.
Th e turbine foundations are typically constructed over
a short period of time with the biological colonisation
known to begin shortly aft er the construction. However,
full development of the reef community is area specifi c and
typically takes several years since not all species colonise
the new habitats simultaneously and some species continue
their growth. Th us, in most areas the full eff ect of the new
habitat can be expected only aft er several years.
change of water currents and sediment
Th e introduction of artifi cial physical structures on the
seabed invariably infl uences the direction and strength
of the water currents, and these changes in the fl ow of
water may change the composition of the sediments by
moving sand and clay to new locations. Th is can have
a large impact on fi sh, such as sandeel and fl atfi sh that
bury themselves in the sediment and rely on very specifi c
sediment conditions (ie grain sizes) in order to do this.
new electromagnetic fi eld
Th e power from the off shore wind farms is transported
to the shore through power cables surrounded by weak
electromagnetic fi elds. As electromagnetic fi elds are sensed
by some fi sh species, the power cables may infl uence the
behaviour and migration of the fi sh fauna in areas traversed
by the cables. In the extreme case the cable could act as a
barrier to the migration of fi sh, especially for species that use
the Earth’s magnetic fi eld for navigation and orientation.
contentsIntroduction: New habitat and sediment
Methods: Fish abundance and distribution
Results: Similar effects at the two farms
Discussion: No effect on fi sh yet
IAPEME viewpoints
<
<
<
<
<
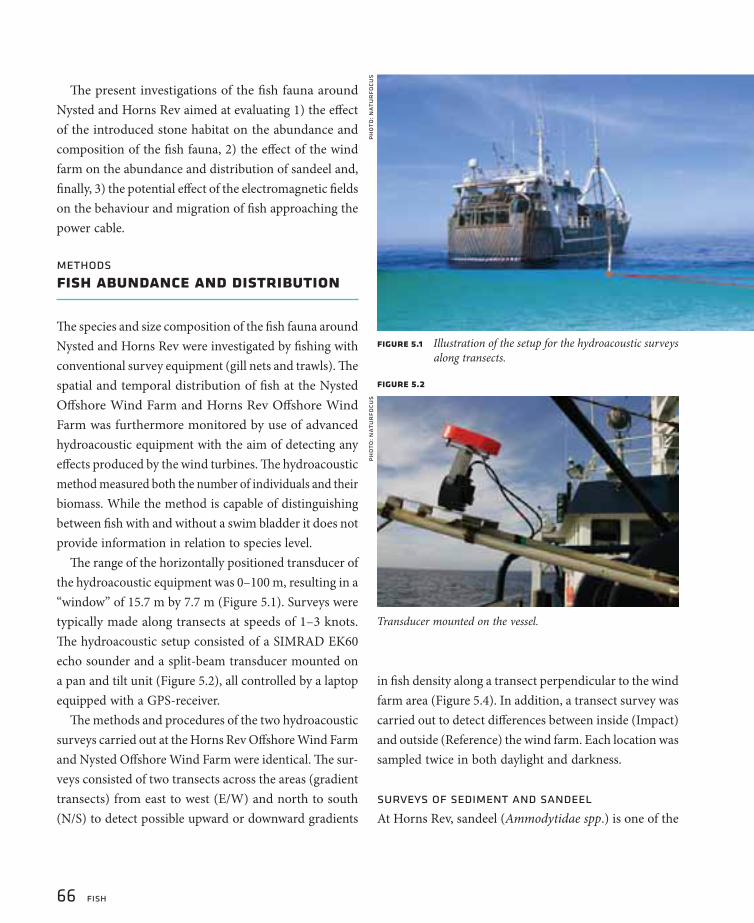
66 fi sh
Th e present investigations of the fi sh fauna around
Nysted and Horns Rev aimed at evaluating 1) the eff ect
of the introduced stone habitat on the abundance and
composition of the fi sh fauna, 2) the eff ect of the wind
farm on the abundance and distribution of sandeel and,
fi nally, 3) the potential eff ect of the electromagnetic fi elds
on the behaviour and migration of fi sh approaching the
power cable.
methodsfi sh abundance and distribution
Th e species and size composition of the fi sh fauna around
Nysted and Horns Rev were investigated by fi shing with
conventional survey equipment (gill nets and trawls). Th e
spatial and temporal distribution of fi sh at the Nysted
Off shore Wind Farm and Horns Rev Off shore Wind
Farm was furthermore monitored by use of advanced
hydroacoustic equipment with the aim of detecting any
eff ects produced by the wind turbines. Th e hydroacoustic
method measured both the number of individuals and their
biomass. While the method is capable of distinguishing
between fi sh with and without a swim bladder it does not
provide information in relation to species level.
Th e range of the horizontally positioned transducer of
the hydroacoustic equipment was 0–100 m, resulting in a
“window” of 15.7 m by 7.7 m (Figure 5.1). Surveys were
typically made along transects at speeds of 1–3 knots.
Th e hydroacoustic setup consisted of a SIMRAD EK60
echo sounder and a split-beam transducer mounted on
a pan and tilt unit (Figure 5.2), all controlled by a laptop
equipped with a GPS-receiver.
Th e methods and procedures of the two hydroacoustic
surveys carried out at the Horns Rev Off shore Wind Farm
and Nysted Off shore Wind Farm were identical. Th e sur-
veys consisted of two transects across the areas (gradient
transects) from east to west (E/W) and north to south
(N/S) to detect possible upward or downward gradients
in fi sh density along a transect perpendicular to the wind
farm area (Figure 5.4). In addition, a transect survey was
carried out to detect diff erences between inside (Impact)
and outside (Reference) the wind farm. Each location was
sampled twice in both daylight and darkness.
surveys of sediment and sandeel
At Horns Rev, sandeel (Ammodytidae spp.) is one of the
pho
to: n
atu
rfo
cus
Transducer mounted on the vessel.
fi gure 5.1 Illustration of the setup for the hydroacoustic surveys
along transects.
fi gure 5.2ph
oto
: nat
ur
focu
s

fi sh 67
most abundant groups of fi sh. Due to a known strong
correlation between the distribution of sandeel and the
composition of the sediments, the distribution of both
sandeel and sediment composition was surveyed. A
modifi ed scallop dredge was used to sample sandeels.
Five replicates were made at each location. Each haul
lasted for 10 min. and covered an area between 815 and
1,111 m. At each haul location, three replicates of sedi-
ment samples were taken with a Van Veen grab (0.2 m).
Th e sediment was dried and sieved through a standard
Wentworth series to obtain information about grain size
distribution.
fi sh behaviour at the power cable
Surveys and an assessment of the eff ect on fi sh by elec-
tromagnetic fi elds were exclusively carried out at Nysted.
fi gure 5.4 nysted offshore wind farm and horns rev offshore wind farm
Maps of the Nysted Off shore Wind Farm (left ) and the Horns Rev Off shore Wind Farm (right) showing layout of transects in the wind
farm areas and the areas outside the wind farm.
fi gure 5.3 Sandeel at the scour protection.
pho
to: m
ak
s k
lau
str
up
Turbines
Hydroacoustic survey transects
Benthic and pelagic biological survey nets
Pelagic trawl
TurbinesTransformer stationCable routeHydroacoustic survey transectsBenthic and pelagic biological survey netsPelagic trawlAquadopp sensor
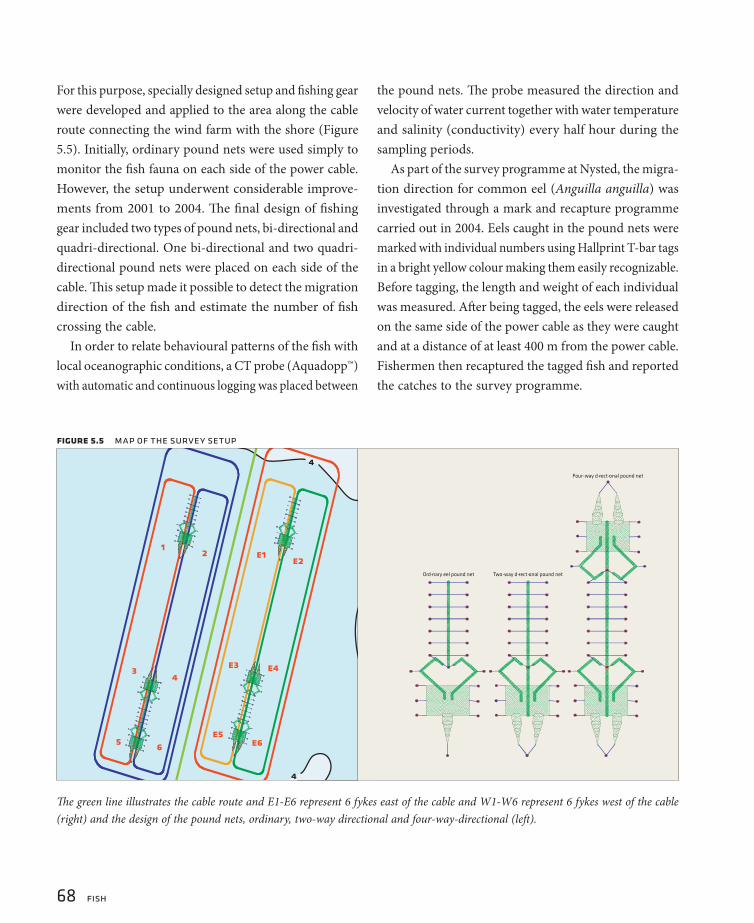
68 fi sh
For this purpose, specially designed setup and fi shing gear
were developed and applied to the area along the cable
route connecting the wind farm with the shore (Figure
5.5). Initially, ordinary pound nets were used simply to
monitor the fi sh fauna on each side of the power cable.
However, the setup underwent considerable improve-
ments from 2001 to 2004. Th e fi nal design of fi shing
gear included two types of pound nets, bi-directional and
quadri-directional. One bi-directional and two quadri-
directional pound nets were placed on each side of the
cable. Th is setup made it possible to detect the migration
direction of the fi sh and estimate the number of fi sh
crossing the cable.
In order to relate behavioural patterns of the fi sh with
local oceanographic conditions, a CT probe (Aquadopp™)
with automatic and continuous logging was placed between
the pound nets. Th e probe measured the direction and
velocity of water current together with water temperature
and salinity (conductivity) every half hour during the
sampling periods.
As part of the survey programme at Nysted, the migra-
tion direction for common eel (Anguilla anguilla) was
investigated through a mark and recapture programme
carried out in 2004. Eels caught in the pound nets were
marked with individual numbers using Hallprint T-bar tags
in a bright yellow colour making them easily recognizable.
Before tagging, the length and weight of each individual
was measured. Aft er being tagged, the eels were released
on the same side of the power cable as they were caught
and at a distance of at least 400 m from the power cable.
Fishermen then recaptured the tagged fi sh and reported
the catches to the survey programme.
fi gure 5.5 map of the survey setup
Th e green line illustrates the cable route and E1-E6 represent 6 fykes east of the cable and W1-W6 represent 6 fykes west of the cable
(right) and the design of the pound nets, ordinary, two-way directional and four-way-directional (left ).

fi sh 69
resultssimilar effects at the two farms
Th e species composition, distribution and abundance of
fi sh diff ered between the two wind farm sites. Th e dif-
ferences were to a large extent attributable to a number
of physical and biological factors. Generally, the fi sh
communities at Nysted and Horns Rev diff er primarily
due to diff erences in salinity. Due to the position in the
Baltic Sea, the water found at Nysted is more brackish
(lower salinity) than the water found at Horns Rev, which
is positioned in the North Sea.
horns rev – an area in the north sea
At least 42 fi sh species are known to inhabit the ICES
squares that cover the area around Horns Rev. Th e fi sh
fauna where the wind farm is situated (sandy habitat only)
is probably less rich in species. A total of 18 species were
caught prior to the establishment of the wind farm. Th e
fi sh fauna at Horns Rev consists mainly of species adapted
to strong currents, but other species may occasionally be
found in the area (Figure 5.6).
Most of the fi sh caught during the survey in 2002 were
benthic fi sh with a high affi nity for a sandy bottom. Th e
most abundant group of fi sh at Horns Rev was sandeel
(Ammodytidae spp.). Th is group was represented by three
species, ie lesser sandeel (Ammodytes marinus), small san-
deel (Ammodytes tobianus) and great sandeel (Hyperoplus
lanceolatus) with the last one being the most abundant
species. Catches of sandeel in 2002, prior to the construc-
tion of the wind farm at Horns Rev, are listed in Figure
5.6 together with the other most abundant species.
Sandeel is one of the fi sh families that is most
important to the fi shing industry in the North Sea.
Sandeel has a diel cycle, feeding in the pelagic dur-
ing the day and remaining buried in the sand during
the night. Besides light intensity, other physical and
biological parameters have been found to infl uence
the distribution of sandeels. The sandeel is found to
inhabit turbulent and exposed sandy areas, such as
the edges of sandbanks with strong tidal currents.
However, the most important factor to the distribution
and abundance is the texture (grain size distribution)
of the sediment. The distribution of sandeel is corre-
lated with a narrow range of sediment grain sizes, the
preferred grain size being between 0.25 mm and 1.2
mm. Sandeels avoid both gravel (courser sediments)
and silt/clay (fi ner sediments).
Mean numbers of individuals of species caught at Horns in 2002,
before the establishment of Horns Rev Off shore Wind Farm.
fi gure 5.6 mean numbers of individuals of species at horns rev
species mean number of fi sh
ind/km²
Scaldfi sh 461
Dragonet 2,777
Herring 512
European anchovy 103
Sandeel spp. 19,800
Atlantic cod 215
American plaice 1,208
Dab 2,306
Whiting 835
Short-spined sea scorpion 100
African armoured searobin 467
Butterfi sh 120
Plaice 3,682
Sand goby 6,057
Sprat 835
Broad-nosed pipefi sh 120

70 fi sh
nysted – an area in the baltic sea
Th e fi sh fauna at Nysted along the cable route comprises
a total of 43 species. Th e most abundant species caught
was Baltic herring (Clupea harengus), Atlantic cod (Gadus
morhua), short-spined sea scorpion (Myoxocephalus
scorpius), fl ounder (Platichthys fl esus), common eel and
eelpout (Zoarces viviparus). Th e ten most abundant species
are listed in Figure 5.7. Furthermore, the catches showed
large temporal variations; common eel showed a special
pattern with most of the eels being caught around new
moon, all years.
In the expected wind farm area, 24 species were caught
during the baseline survey in 2001. Sandeels and cod-
like fi sh were found to be the two most abundant groups
(Figure 5.8).
attraction of fi sh species to new habitats
During the fi shery associated with the hydroacoustic sur-
vey at Horns Rev, 21 species were caught with sand goby
(Pomatoschistus minutus), sandeel, plaice (Pleuronectes
platessa) and dab (Limanda limanda) being the most
numerous (Figure 5.10). At Nysted, 16 species, dominated
by small sandeel, atlantic cod, short-spined sea scorpion
and fl ounder, were caught (Figure 5.12).
At both Horns Rev Off shore Wind Farm and Nysted
Off shore Wind Farm, the fi shing indicated that the spe-
cies compositions were similar inside and outside the
wind farm areas.
fi gure 5.8 the ten most abundant species at nysted in 2001 baseline survey
species2001
number
Atlantic cod 758
Great sandeel 642
Whiting 428
Small sandeel 423
Eelpout 133
Fifteen-spined stickleback 118
Sand goby 99
Brisling 82
Short-spined sea scorpion 60
Baltic herring 32
Th e ten most abundant species caught at Nysted
before the establishment of the wind farm
Th e ten most abundant species caught at Nysted along the cable route before the establishment of the wind farm (2001-2002) and aft er
establishment of the wind farm (2003-2004)
fi gure 5.7 the ten most abundant species at nysted along the cable route
species
2001 2002 2003 2004
number number number number
Baltic herring 2815 342 4459 2180
Atlantic cod 2108 308 4772 1115
Flounder 1005 1289 1342 1363
Short-spined sea scorpion 1171 496 1078 1232
Common eel 678 77 391 231
Eelpout 67 517 293 154
Brisling 11 602 292 119
Black goby 24 73 580 120
Hornfi sh 148 52 365 64
Whiting 6 2 368 19
Total 8033 3758 13940 6597

fi sh 71
fi sh abundance in wind farm areas
A total of 12,099 and 18,388 fi sh were registered during
the hydroacoustic surveys at the Horns Rev Off shore Wind
Farm and Nysted Off shore Wind Farm, respectively. Overall,
a similar pattern in data of fi sh density inside and outside
fi gure 5.11 the fish fauna at nysted offshore wind farm
speciesinside the wind farm outside the wind farm
number number
Herring 1 3
Sprat 2 1
Whiting 2 1
Atlantic cod 7 2
Small sandeel 0 10
Great sandeel 0 2
Sand goby 1 0
Rock gunnel 1 0
Eelpout 1 0
Short-spined sea scorpion 6 0
Longspined bullhead 3 0
Hooknose 4 0
Turbot 0 2
Dab 0 2
Flounder 2 4
Common sole 1 0
fi gure 5.10 the fish fauna at horns rev offshore wind farm
speciesinside the wind farm outside the wind farm
number number
Snake pipefi sh 1 0
Lesser pipefi sh 0 1
Saithe 1 0
Whiting 1 0
Atlantic cod 10 0
Atlantic horse mackerel 9 10
Striped mullet 6 1
Goldsinny wrasse 2 0
Corkwing wrasse 1 0
Lesser sandeel 6 111
Small sandeel 0 11
Great sandeel 5 8
Sand goby 295 57
Dragonet 2 4
Tub gurnard 1 0
Short-spined sea scorpion
1 0
Brill 1 0
Scaldfi sh 6 12
Dab 24 11
European piaice 56 8
Solenette 1 0
pho
to: c
hr
isti
an
b. h
vidt
fi gure 5.09 Catch from Nysted.
Th e number of fi sh caught in biological sample nets and trawl in
association to the acoustic survey.
Th e number of fi sh caught in biological sample nets and trawl in
association to the acoustic survey.

72 fi sh
the wind farms was observed at both wind farms.
Th e overall distribution of fi sh from the transect
surveys showed no clear patterns of variation between
night and day in neither density nor biomass within
any of the two wind farm areas (Figure 5.12–5.13). At
Nysted, biomasses were statistically diff erent between
the individual transects, with transect Impact 1 having
the lowest and transect Reference 1 having the highest
value (Figure 5.13). In general, fi sh densities were higher
during the second sampling period showing a temporal
variation in both areas.
Th e density of fi sh at the Nysted Off shore Wind Farm
was found to have a patchy spatial distribution pattern,
especially inside the wind farm area. Hence, the distance
to the nearest neighbour (distance between two fi sh)
outside the wind farm was higher during darkness than
during daytime revealing that the fi sh were more aggre-
gated during daytime. Th e opposite spatial distribution
Mean fi sh density (ind./1,000 m3) at Horns Rev Off shore Wind Farm during daylight (day) and darkness (night) along two
transects in the wind farm area and in the reference area.
Mean fi sh density in CPUE (ind./1,000 m3) at Nysted Off shore Wind Farm during daylight (day) and darkness (night)
transecting the impact and reference areas at each sample.
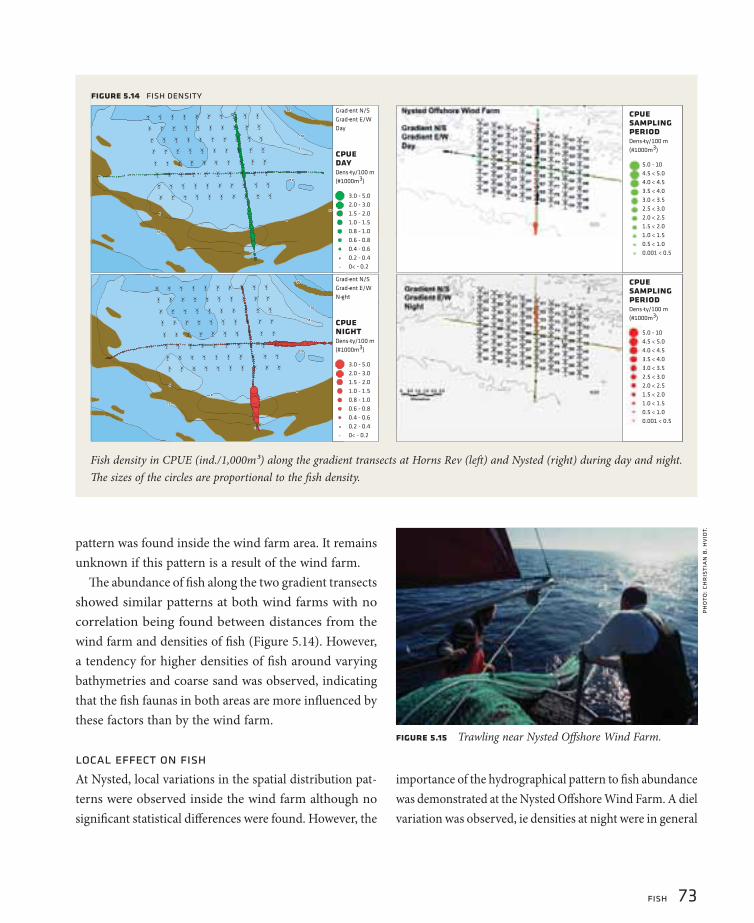
fi sh 73
pattern was found inside the wind farm area. It remains
unknown if this pattern is a result of the wind farm.
Th e abundance of fi sh along the two gradient transects
showed similar patterns at both wind farms with no
correlation being found between distances from the
wind farm and densities of fi sh (Figure 5.14). However,
a tendency for higher densities of fi sh around varying
bathymetries and coarse sand was observed, indicating
that the fi sh faunas in both areas are more infl uenced by
these factors than by the wind farm.
local effect on fi sh
At Nysted, local variations in the spatial distribution pat-
terns were observed inside the wind farm although no
signifi cant statistical diff erences were found. However, the
importance of the hydrographical pattern to fi sh abundance
was demonstrated at the Nysted Off shore Wind Farm. A diel
variation was observed, ie densities at night were in general
101010101010101010
101010101010101010
666666666
202020202020202020
666666666
666666666
101010101010101010
666666666
101010101010101010
101010101010101010
101010101010101010
101010101010101010
666666666
202020202020202020
666666666
666666666
101010101010101010
666666666
101010101010101010
101010101010101010
Fish density in CPUE (ind./1,000m3) along the gradient transects at Horns Rev (left ) and Nysted (right) during day and night.
Th e sizes of the circles are proportional to the fi sh density.
fi gure 5.15 Trawling near Nysted Off shore Wind Farm.
pho
to: c
hr
isti
an
b. h
vidt
.

74 fi sh
10 times the amount found during daytime. Furthermore,
fi sh densities in the northern part of the wind farm were
higher than in the southern part (Figure 5.16).
Th is distribution pattern was found to coincide with
an observed east to west oriented current, dividing the
wind farm area with a clear boundary. One third of the
transect is situated to the south with a high current velocity
and the remaining two thirds of the transect is situated
to the north with less current velocity. Hence, patterns
suggest that natural factors, such as the current regime,
may over-shadow any eff ect from the wind farm.
sandeel not adversely affected
A total of 1,517 individuals of sandeel were caught at
the Horns Rev Off shore Wind Farm, ie 540 individuals
in 2002 and 977 individuals in 2004. Th e majority (59%)
of the sandeels caught were great sandeels. Th e density
of sandeels increased by approx 300% from 2002 to 2004
within the wind farm area and decreased by 20% in the
control area during the same period (Figure 5.17).
Th e increase in sandeels inside the wind farm areas
was mainly caused by a large increase in specimens that
were less than 8 cm in length. Furthermore, the density
changes do not indicate that the construction of the wind
farm had any eff ect on the sediment composition as no
increase in clay/silt and fi ne sand form 2002 to 2004 was
observed. Hence, it is unlikely that the wind farm has a
negative eff ect on the sandeel.
no proven electromagnetic effect
Th e investigations made at Nysted to detect any eff ects
from the electromagnetic fi elds on migration and behaviour
fi gure 5.16 map of fish density
Map of fi sh density based on CPUE values from the hydroacoustic data from the second sampling period in the wind farm area. An
east-westward current boundary was visually observed between turbines B5 and B6. Please note the tenfold diff erence in legend values
between day and night.
fi gure 5.18 the catches of sandeels
year speciesinside the wind farm area
outside the wind farm area
2002 Lesser sandeel 2.5 3.3
Small sandeel 1.1 1.6
Great sandeel 5.6 5.1
Sandeel ssp. 0.4 0.2
2004 Lesser sandeel 0.6 0.3
Small sandeel 11.1 0.8
Great sandeel 18.6 7.1
Sandeel ssp. 0.0 0.1

fi sh 75
of fi sh were characterised by high complexity and many
diffi culties, both in the sampling phase and in the analysis
phase. As a consequence, analysis including baseline data
was not possible and the analysis includes only data from
2003 and 2004. As part of the data analysis, a conceptual
model was formulated as depicted in Figure 5.19. Th e
model represents an open system with bi-directional
migration across and along the cable route.
Two eff ect measures were defi ned and subsequently used
for the statistical test of possible eff ects on fi sh behaviour
from the cable, here referred to as Eff ect1 and Eff ect2.
Both measures were calculated from the catches in the
inward and outward facing fykes on each side of the cable.
Eff ect1 measures possible asymmetries in the catches
across the cable route indicating an east-west/west-east
migration, depicting a hindrance or blocking eff ect from
the cable route. Eff ect2 measures the possible import or
export of fi sh along either side of the cable route and
also indicates eff ects on fi sh behaviour.
Sandeel is a short-living species that is strongly infl u-
enced by recruitment. The variation in recruitment is
expected to be strongly dependent on environmental
factors. Thus, the variation in sandeel abundance at
Horns Rev is most likely a consequence of environmen-
tal factors infl uencing the recruitment. The dynamic
abundance of sandeel at Horns Rev is expected to be
controlled by several other factors such as predation
by birds, piscivore fi sh, marine mammals, human
impact and hydrographical parameters. Ecosystem
modelling of the mortality dynamics reveals that
predation by fi sh, especially by mackerel, whiting
and haddock, exceeds the mortality induced by both
industrial fi shing and wildlife. At the Horns Rev
Offshore Wind Farm, the main impact on sandeels
is expected to be from piscivorious species, such as
whiting and cod, since the foundations are suitable
to attract these species.
pho
to: m
ak
s k
lau
str
up
Conceptual model: open system with export, bidirectional move-
ments. Numbers shown indicate a hypothetical distribution.
fi gure 5.18 Short-spined sea scorpion eating a sandeel.

76 fi sh
On the basis of the combined data from 2003 and
2004, signifi cant impacts were found for Eff ect1 for four
species: baltic herring, common eel, atlantic cod and
fl ounder. Th ese results suggest that migration of some
species across the cable route may be impaired. On the
other hand, the results do not suggest that the migration is
completely blocked. Regarding Eff ect2, signifi cant results
were only obtained in two cases. Th e fi rst case indicates
that some of the common eels react by leaving the area
along the cable route when analysing the combined data.
In the second case, the 2003 data indicate that Atlantic
cod accumulate close to the cable route.
Th e electromagnetic fi eld around the cable was not
measured. However, assuming that the power produc-
tion at the wind farm is proportional to the strength of
the electromagnetic fi elds, possible correlations between
Eff ect1 and Eff ect2 and the power production were
examined. A signifi cant correlation was found only for
fl ounder. Flounder primarily crossed the cable when the
strength of the electromagnetic fi elds was estimated to
be low, ie during calm periods.
Altogether, the investigations along the cable route at
Nysted show some eff ects from the cable route on fi sh
behaviour. However, the analyses of data have only to a
very limited extend proven a correlation between these
impacts and the strength of the electromagnetic fi elds.
One alternative explanation may be that fi sh reacted to
the physical conditions along the cable route if the seabed
was not fully re-established.
migration direction for common eel
In the mark-recapture study, 231 common eels were
marked and 18 were recaptured. Of the recaptured eels,
13 (72%) migrated in a westerly direction and the remain-
ing 5 (28%) migrated eastward. Th e results showed that
7 (39%) of the recaptured eels probably had passed the
power cable during their migration. Furthermore, more
than 50% of the eels probably changed direction aft er
being captured (Figure 5.20).
In the literature, migration of eel from the Baltic Sea is
predominantly believed to take place through Øresund.
However, the results from the mark-recapture programme at
Nysted strongly indicate that eels west of Øresund migrate
through the Great Belt, ie the prevailing migration direction
at Nysted is westward (Figure 5.20). Hence, there is no
reason to assume any infl uence on the overall migration
direction on common eel from the wind farm.
discussionno effects on fi sh yet
Possible eff ects from the Horns Rev Off shore Wind Farm
and Nysted Off shore Wind Farm on the fi sh fauna were
0 50 km
N
Possible migration routes out of the Baltic Sea of 18 recaptured
common eels tagged at Nysted.
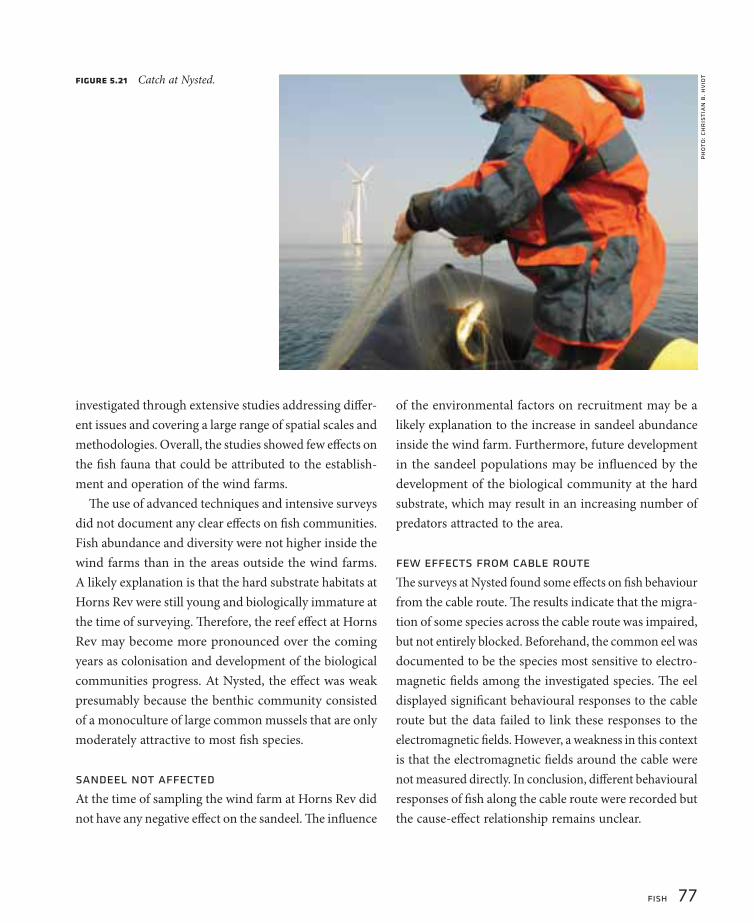
fi sh 77
investigated through extensive studies addressing diff er-
ent issues and covering a large range of spatial scales and
methodologies. Overall, the studies showed few eff ects on
the fi sh fauna that could be attributed to the establish-
ment and operation of the wind farms.
Th e use of advanced techniques and intensive surveys
did not document any clear eff ects on fi sh communities.
Fish abundance and diversity were not higher inside the
wind farms than in the areas outside the wind farms.
A likely explanation is that the hard substrate habitats at
Horns Rev were still young and biologically immature at
the time of surveying. Th erefore, the reef eff ect at Horns
Rev may become more pronounced over the coming
years as colonisation and development of the biological
communities progress. At Nysted, the eff ect was weak
presumably because the benthic community consisted
of a monoculture of large common mussels that are only
moderately attractive to most fi sh species.
sandeel not affected
At the time of sampling the wind farm at Horns Rev did
not have any negative eff ect on the sandeel. Th e infl uence
of the environmental factors on recruitment may be a
likely explanation to the increase in sandeel abundance
inside the wind farm. Furthermore, future development
in the sandeel populations may be infl uenced by the
development of the biological community at the hard
substrate, which may result in an increasing number of
predators attracted to the area.
few effects from cable route
Th e surveys at Nysted found some eff ects on fi sh behaviour
from the cable route. Th e results indicate that the migra-
tion of some species across the cable route was impaired,
but not entirely blocked. Beforehand, the common eel was
documented to be the species most sensitive to electro-
magnetic fi elds among the investigated species. Th e eel
displayed signifi cant behavioural responses to the cable
route but the data failed to link these responses to the
electromagnetic fi elds. However, a weakness in this context
is that the electromagnetic fi elds around the cable were
not measured directly. In conclusion, diff erent behavioural
responses of fi sh along the cable route were recorded but
the cause-eff ect relationship remains unclear.
pho
to: c
hr
isti
an
b. h
vidtfi gure 5.21 Catch at Nysted.

78 fi sh
The present studies represent a fi rst assessment of the impact
of large offshore wind farms on fi sh populations, and a sub-
stantial amount of new data on fi sh abundance, distribution
and behaviour around offshore wind farms has been collected.
These data form a good basis for evaluation of the short-term
effects of establishing and operating offshore wind farms on
local fi sh communities.
new habitats and the abundance of fi shThe introduction of new complex structures, such as wind
turbine foundations and scour protection, in sandy coastal
areas generates new habitats and may attract fi sh and other
fauna that are relying on these habitats for shelter, food or
reproduction (Grossman et al 1997, Powers et al. 2003). Fur-
thermore, the areas within and immediately around the wind
farm effectively constitute a marine protected area in which
fi shing is restricted and other activities, such as gravel extrac-
tion, are banned. Consequently, a more diverse fi sh fauna in the
wind farm area, compared to the surrounding sand habitats, is
often anticipated. Unfortunately, the abundance and behaviour
of fi sh populations is notoriously diffi cult to monitor, yet in
order to assess the impact of offshore wind farms on the fi sh
community, knowledge of changes in both abundance and
behaviour is essential.
The investigations at Horns Rev and Nysted have not docu-
mented major changes in the fi sh fauna with regard to overall
abundance or species composition following the construction
and operation of the wind farms. However, it is important
to note that the surveys were carried out shortly after the
introduction of the new habitats. It is therefore likely that the
epifauna and the fi sh fauna will continue to develop, and it will
be necessary to monitor the development of the fi sh fauna at
later stages in order to determine the long-term effect on it.
Sandeels are common in most shallow bare sand habitats and
an important food source for larger fi sh, marine mammals and
birds (Greenstreet et al. 2006). Concern has been expressed
that offshore wind farms may adversely affect the sandeel
habitats due to the changes to the sediment structure. The
current studies do not suggest that this is the case. In short,
the documented short-term effects on the fi sh abundance
and composition in the wind farm area are few and not easily
separated from larger scale changes in the fi sh communities.
While this conclusion applies to both the North Sea and the
Baltic Sea studies, the colonisation of the new habitats may
be more rapid and more pronounced in other areas where
natural reef structures in the vicinity of the wind farm area
may enhance the supply of fi sh.
The studies have been conducted using a wide range of method-
ologies. The use of hydroacoustic surveys yields a cost-effective
way of assessing the abundance of small pelagic fi shes. However,
the fi sh species most likely to benefi t from the introduction
of the new habitats are demersal or benthic; hence, there is
a continued need to monitor the abundance and behaviour of
these species using other technologies, including direct obser-
IAPEME viewpoints

fi sh 79
vations, video, tagging and fi shing. Furthermore, knowledge
of the habitat and resource use of individual fi sh within the
wind farm and the extent to which they stay in this area for a
longer period time may further enhance our understanding of
the importance of these artifi cial habitats (Relini et al. 2002,
Einbinder et al. 2006). These studies could be conducted using
acoustic tagging of relevant fi sh species.
electromagnetic fi elds and the movement of fi sh across submarine cablesMany fi sh species are able to sense electromagnetic fi elds
(Kalmijn 2000), such as the one originating from submarine
power cables, and both attraction and avoidance reaction to
the electromagnetic fi elds have been observed in laboratory
experiments. There has therefore been a concern that the
power cables connecting offshore wind farms to the land could
infl uence the movements of fi sh in the wind farm area, and in
the worst case act as a barrier to for instance seasonal migra-
tions. This topic has been investigated using directional fyke
nets and tagging of migrating eel at the cable route at Nysted.
While these studies suggest in a few cases that the movement
patterns may be infl uenced by the electromagnetic fi eld from
the cable, alternative explanations to these patterns exist
and the studies cannot be viewed as conclusive. One problem
has been that the directional fyke nets had to be deployed at
a rather large distance from the cable, and there is no fi rm
evidence that the fi sh caught in the fyke net facing the cable
has actually crossed the cable. Similarly, the migration routes
of recaptured eels may not have led them across the cable
route. Hence, there is a need for supplementary studies and
new methodology should be considered in order to verify the
movements across the cable and clarify the potential impact of
the electromagnetic fi elds surrounding the submarine cables.
For some fi sh species the best approach may be to attach
acoustic tags to the fi sh and directly record their movement
and behaviour as they approach the cable route. Another ap-
proach could be to use large enclosures (eg 100 m by 5 m) that
traverse the cable. In these enclosures, several individually
marked specimens of the species in focus could be released at
specifi c locations and the distribution of the individuals within
the enclosure recorded after a specifi ed time. Both approaches
will allow fi rm conclusions regarding the propensity of the
fi sh to cross the cable and thereby show whether or not the
electromagnetic fi elds from the cable infl uence the movements
of fi sh in the wind farm area.
Despite the new knowledge of the effects of offshore wind
farms on fi sh communities at local level obtained within the
current programme, it will be diffi cult to extrapolate the impact
to regional or population scale. However, the relatively small
area expected to be occupied by offshore wind farms compared
to the area covered by most marine fi sh populations does not
suggest that the wind farms will signifi cantly alter the popula-
tion dynamics of fi sh on a larger scale.

80 mammals: seals and harbour porpoises
Seals were studied to evaluate their use of the wind farms and the surround-
ing areas, the effect of construction and operation on resting behaviour and
the population development in the area. Both wind farm areas were found to
be part of much larger foraging areas used by the seals. No general change in
behaviour at sea or on land could be linked to the construction or operation
of the wind farms. The only effect detected on land was a reduction in the
number of seals on land during pile driving operations at Nysted.
Only a slight decrease in porpoise abundance was found at Horns Rev during
construction and no effect of the operation of the wind farm was seen. A clear
decrease in the abundance of porpoises was found at Nysted during the con-
struction and operation of the wind farm. The effect has persisted after two
years of operation of the wind farm, with indications of a slow recovery. At
both sites porpoises inside the wind farm and up to 15 km from the wind farm
reacted to pile driving operations.
6marine mammalsseals and porpoises react differentlyby jonas teilmann, jakob tougaard, jacob carstensen, rune dietz, national environmental research institute, roskilde and svend tougaard, fi sheries and maritime museum, esbjerg
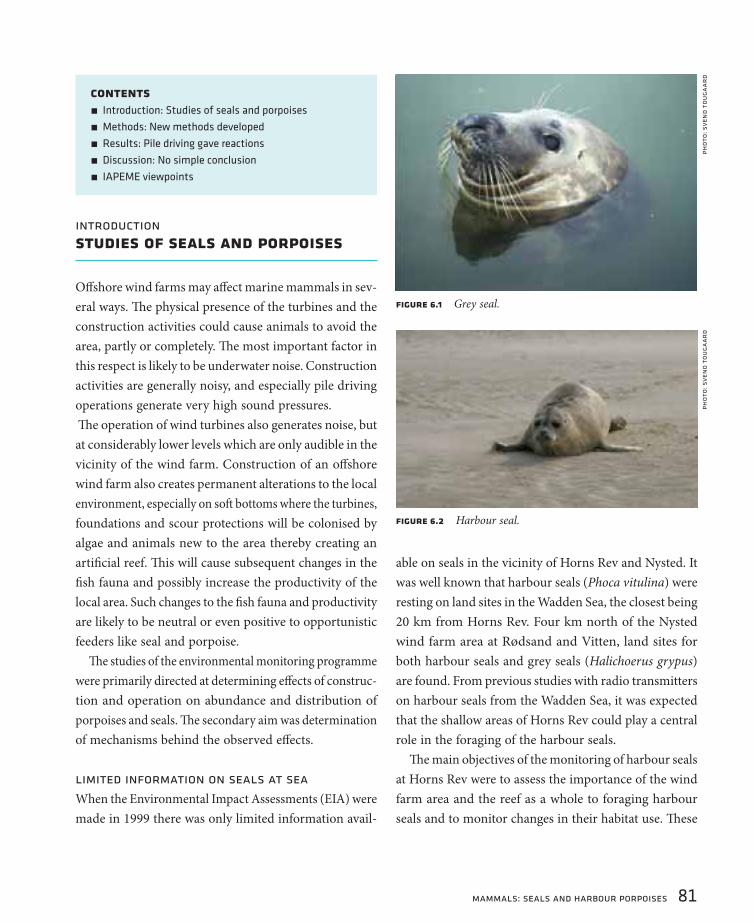
mammals: seals and harbour porpoises 81
introductionstudies of seals and porpoises
Off shore wind farms may aff ect marine mammals in sev-
eral ways. Th e physical presence of the turbines and the
construction activities could cause animals to avoid the
area, partly or completely. Th e most important factor in
this respect is likely to be underwater noise. Construction
activities are generally noisy, and especially pile driving
operations generate very high sound pressures.
Th e operation of wind turbines also generates noise, but
at considerably lower levels which are only audible in the
vicinity of the wind farm. Construction of an off shore
wind farm also creates permanent alterations to the local
environment, especially on soft bottoms where the turbines,
foundations and scour protections will be colonised by
algae and animals new to the area thereby creating an
artifi cial reef. Th is will cause subsequent changes in the
fi sh fauna and possibly increase the productivity of the
local area. Such changes to the fi sh fauna and productivity
are likely to be neutral or even positive to opportunistic
feeders like seal and porpoise.
Th e studies of the environmental monitoring programme
were primarily directed at determining eff ects of construc-
tion and operation on abundance and distribution of
porpoises and seals. Th e secondary aim was determination
of mechanisms behind the observed eff ects.
limited information on seals at sea
When the Environmental Impact Assessments (EIA) were
made in 1999 there was only limited information avail-
able on seals in the vicinity of Horns Rev and Nysted. It
was well known that harbour seals (Phoca vitulina) were
resting on land sites in the Wadden Sea, the closest being
20 km from Horns Rev. Four km north of the Nysted
wind farm area at Rødsand and Vitten, land sites for
both harbour seals and grey seals (Halichoerus grypus)
are found. From previous studies with radio transmitters
on harbour seals from the Wadden Sea, it was expected
that the shallow areas of Horns Rev could play a central
role in the foraging of the harbour seals.
Th e main objectives of the monitoring of harbour seals
at Horns Rev were to assess the importance of the wind
farm area and the reef as a whole to foraging harbour
seals and to monitor changes in their habitat use. Th ese
contentsIntroduction: Studies of seals and porpoises
Methods: New methods developed
Results: Pile driving gave reactions
Discussion: No simple conclusion
IAPEME viewpoints
<
<
<
<
<
fi gure 6.1 Grey seal.
pho
to: s
ven
d t
ou
gaa
rd
fi gure 6.2 Harbour seal.
pho
to: s
ven
d t
ou
gaa
rd

82 mammals: seals and harbour porpoises
objectives were also part of the program at Nysted, with
the important additional question of whether construc-
tion and operation of the wind farm infl uenced the
haul out behaviour of harbour seals and grey seals on
the important and nearby resting site in the Rødsand
seal sanctuary.
Interpretation of results from both studies is infl u-
enced by the general increase in the Danish harbour seal
population in recent years. Since 1976, when hunting
was abolished, the population has increased by about
10% annually, only temporarily disrupted by outbreaks
of phocine distemper virus disease in 1988 and 2002. Th e
last outbreak was in 2002, the year before construction
of the Nysted Off shore Wind Farm.
porpoises present in both wind farm areas
From ship and aircraft surveys it was known that harbour
porpoises (Phocoena phocoena) were present in the two
wind farm areas at the time of the EIAs. Movements of
individual animals tagged with satellite transmitters were
also available from the Western Baltic region. Th ese data
show that porpoises move over large distances and only
occasionally stay within the same area for longer periods.
It was also found that porpoises in the two wind farm
areas have no contact with each other and are part of two
separate populations. From the surveys it was clear that
the eastern part of the North Sea, and thus also Horns
Rev, was home to a large number of porpoises, whereas
densities in the Western Baltic and thus the area around
Nysted were lower.
methodsnew methods developed
Dedicated marine mammal surveys from ship and
aircraft in the Horns Rev and Nysted areas started in
1999 in connection with the EIAs (aerial surveys were
primarily directed at birds). Marine mammals, however,
are diffi cult to study at sea and thus also in off shore wind
farms. Because of limited experience studying eff ects of
off shore constructions on marine mammals, new methods
had to be developed. Th e traditional visual surveys were
thus supplemented or in some cases replaced by other
methods, including acoustic monitoring by stationary
dataloggers, remotely controlled video monitoring and
tagging of animals with satellite transmitters. New statistical
fi gure 6.3 Two habour porpoises.
pho
to: j
on
as
teil
ma
nn

mammals: seals and harbour porpoises 83
methods, including spatial modelling of survey data, were
also developed. A detailed description of these methods
can be found in the fi nal reports of the environmental
impact studies from both wind farm sites.
Th e close vicinity of the Rødsand seal sanctuary to the
wind farm and the fact that Rødsand is the only known
breeding site for the grey seal in Denmark made Nysted
a key site for the study of seals on land. Studies of move-
ments and foraging behaviour by satellite telemetry were
conducted at both sites.
Th e high density of porpoises at Horns Rev made it
possible to conduct visual ship surveys to determine
changes in spatial distribution of animals. Th e sounds
produced by porpoises were continuously monitored at
both sites by automatic detection systems.
census techniques for seals
Seals are rarely observed in high numbers in visual surveys
in the open sea. Th erefore, to study the seals’ use of the
wind farm area and surrounding sea individual seals were
tagged with satellite transmitters. At Rødsand, close to
Nysted, fi ve harbour seals and six grey seals were tagged
before the construction started and at Rømø, 50 km from
Horns Rev, 21 harbour seals were tagged before, during
and aft er the construction of the wind farm.
To monitor the behaviour of the seals on land visual
observations were made from a bird observation tower
during the baseline study. During construction and op-
eration this was done by a remotely controlled camera
system (Figure 6.4). In addition, to determine if seals
were leaving the Nysted/Rødsand area due to construc-
tion and operation of the wind farm, seals at Rødsand
and the alternative resting sites within the region were
counted from an airplane on monthly surveys.
visual and acoustic studies of porpoises
Changes in the spatial distribution of porpoises were
studied at Horns Rev by visual surveys primarily from ship
Th e Rødsand seal santuary with the seal haulout site, bird tower and camera tower indicated. To the right a close up of the camera tower.
fi gure 6.4 rødsand seal sanctuary
Bird observation tower
Seal haulout site
Camera tower
Wind generator
Solar panels
Antenna
Camera 1
Antenna
Battery box
Camera 2
pho
tos:
jon
as
teil
ma
nn

84 mammals: seals and harbour porpoises
conducted before and during the construction and during
normal operation of the wind farm. Porpoise abundance in
the wind farm relative to one or more reference areas was
studied at both sites by passive acoustic monitoring.
Th irty surveys of 1–3 days duration were conducted
between 1999 and 2006 covering the wind farm and the
rest of Horns Rev. Surveys were only carried out in light
winds to make observation of porpoises possible. Data
on porpoise observations, salinity, temperature, depth
and tide were collected and used in the development of a
spatial model of the distribution of porpoises on individual
surveys. Th is way maps of porpoise density covering
the entire survey area could be made. From the density
maps a comparison of the relative density of porpoises
inside the wind farm could be compared to three zones
progressively more distant from the wind farm.
Porpoises produce high frequency echolocation click
sounds almost continually to orient and catch fi sh. Th ese
sounds were recorded by dataloggers (T-PODs) moored
using anchors and buoys (Figure 6.5) both inside the wind
farm areas and in one or more reference areas outside.
Th ese T-PODs record echolocation sounds made by
porpoises in a radius of 100–1200 m. Six T-PODs were
deployed at Horns Rev and six T-PODs at Nysted. Two
at Horns Rev and three at Nysted were placed inside
the wind farm area and the rest were deployed 5–15 km
away from the wind farm to serve as undisturbed or at
least less disturbed references (Figure 6.6).
results
pile driving gave reactions
seals only affected during pile driving
Monthly aerial seal surveys were conducted from March
2002 to October 2005 in the Nysted region. Furthermore,
aerial surveys from late August in the period 1990–2000
were included in the analysis as part of the baseline data.
Th e Rødsand seal sanctuary and fi ve other seal haulout
fi gure 6.5 Deployment of acoustic datalogger (T-POD) outside
the Horns Rev Wind Farm.
pho
to: e
lsa
m a
/s.
fi gure 6.6 map of study areas
Wind turbinesMeteorological mast Transformer stationCable routeEU Special Protection AreaMilitary Restriction and Danger Areas
Depth Value
0.0 m-33.1 m
Transformer stationMeteorological mastWind turbinesCable routeSand bar
Depth Value
High: -0.108839Low: -42.734100
Maps of Horns Rev (top) and Nysted (bottom), with positions of
the T-POD stations indicated with red diamonds.

mammals: seals and harbour porpoises 85
sites in the south-western Baltic area are believed to be
home to a harbour seal population with limited exchange
with other harbour seal populations.
Harbour seal counts were dominated by the general
increase in the Danish population. In 2002, the year
before the construction of Nysted Off shore Wind Farm,
a seal epidemic killed about 20% of the harbour seals in
the south-western part of the Baltic Sea. Th e population
has recovered well from this and continues to increase
(Figure 6.7).
Th ere was no statistically signifi cant change in the
importance of the Rødsand seal sanctuary to grey seals
and harbour seals, compared to the fi ve other main
seal localities in the south-western Baltic (Vitten, Avnø,
Bøgestrømmen, Saltholm and Falsterbo). Th e relative
number of seals on land at Rødsand decreased slightly
(but not statistically signifi cant) during construction in
2003 and increased again during operation of the wind
farm in 2004 and 2005 (see Figure 6.7).
Th ere was no change in the number of disturbances to
the seals on Rødsand (seals fl eeing into the water) between
baseline, construction and operating periods, indicating
that the increase in boat traffi c due to the wind farm
construction and operation did not disturb the seals on
land and did not cause them to fl ee into the water more
oft en than before construction was initiated.
Th e construction of the Nysted Wind Farm only 4 km
away from the seal sanctuary had no overall measurable
eff ect on the presence of seals on land. Th e only clear link
to construction activities was during sheet piling opera-
tions that were carried out at a single foundation located
approximately 10 km southwest of the seal sanctuary. Th is
activity comprised piling of several individual sheet piles
and took place intermittently throughout three months. A
signifi cant decrease in the number of seals on land during
pile driving was seen. Th is eff ect was less pronounced
during the moulting period in August when the seals are
strongly attached to land, whereas the strongest eff ect was
observed in November, when the seals show less affi nity
to being on land. During the pile drivings the seals may
have stayed in the local area around the sand bank, or
could have left Rødsand entirely in favour of other sites
further away from Rødsand.
Observations from the bird tower in June–August 2001
(baseline) and video observations during June–August 2004
(operation) showed a signifi cant increase in the number
of both harbour seals and grey seals on land at Rødsand.
Th is increase is consistent with the general increase in
the Danish seal population as a whole. However, there
were also signifi cant changes in the distribution across the
In the top fi gure the mean number of seals counted at Rødsand during
aerial surveys in August 1990–2005 is shown (the arrow indicates the
time of the seal epidemic). In the bottom fi gure the proportion of seals
at Rødsand relative to the other fi ve localities in the southwestern part
af the Baltic Sea (Avnø, Bøgestrømmen, Saltholm, Vitten and Fal-
sterbo) is given. Th e black lines show the 95% confi dence limits.
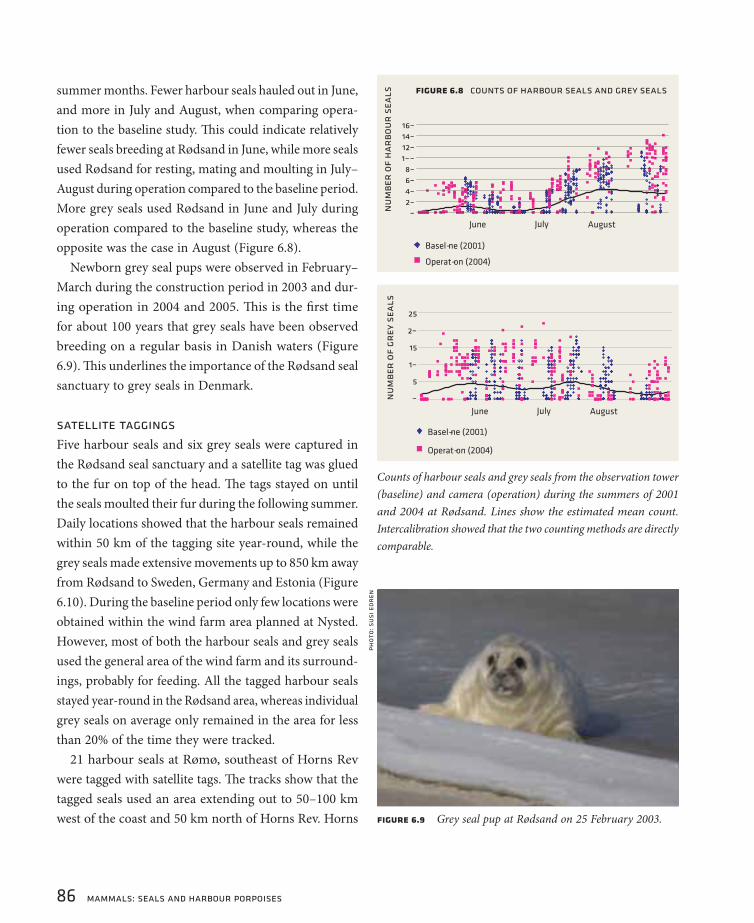
86 mammals: seals and harbour porpoises
summer months. Fewer harbour seals hauled out in June,
and more in July and August, when comparing opera-
tion to the baseline study. Th is could indicate relatively
fewer seals breeding at Rødsand in June, while more seals
used Rødsand for resting, mating and moulting in July–
August during operation compared to the baseline period.
More grey seals used Rødsand in June and July during
operation compared to the baseline study, whereas the
opposite was the case in August (Figure 6.8).
Newborn grey seal pups were observed in February–
March during the construction period in 2003 and dur-
ing operation in 2004 and 2005. Th is is the fi rst time
for about 100 years that grey seals have been observed
breeding on a regular basis in Danish waters (Figure
6.9). Th is underlines the importance of the Rødsand seal
sanctuary to grey seals in Denmark.
satellite taggings
Five harbour seals and six grey seals were captured in
the Rødsand seal sanctuary and a satellite tag was glued
to the fur on top of the head. Th e tags stayed on until
the seals moulted their fur during the following summer.
Daily locations showed that the harbour seals remained
within 50 km of the tagging site year-round, while the
grey seals made extensive movements up to 850 km away
from Rødsand to Sweden, Germany and Estonia (Figure
6.10). During the baseline period only few locations were
obtained within the wind farm area planned at Nysted.
However, most of both the harbour seals and grey seals
used the general area of the wind farm and its surround-
ings, probably for feeding. All the tagged harbour seals
stayed year-round in the Rødsand area, whereas individual
grey seals on average only remained in the area for less
than 20% of the time they were tracked.
21 harbour seals at Rømø, southeast of Horns Rev
were tagged with satellite tags. Th e tracks show that the
tagged seals used an area extending out to 50–100 km
west of the coast and 50 km north of Horns Rev. Horns
Counts of harbour seals and grey seals from the observation tower
(baseline) and camera (operation) during the summers of 2001
and 2004 at Rødsand. Lines show the estimated mean count.
Intercalibration showed that the two counting methods are directly
comparable.
fi gure 6.9 Grey seal pup at Rødsand on 25 February 2003.
pho
to: s
usi
ed
ren

mammals: seals and harbour porpoises 87
Rev and the wind farm area thus lie in the middle of a
large area of great importance to the seals for foraging.
No particular areas within this region appeared to be
signifi cantly more important to the seals than the rest of
the area and Horns Rev thus cannot be said to be neither
more nor less important than the surrounding waters.
Compared to the harbour seals from Rødsand/Nysted
the seals from Rømø used a much larger area, whereas
the grey seals used an even larger area (Figure 6.10).
Construction was anticipated to cause a signifi cant
disturbance to the seals in the local area of the construc-
tion site. Th e time spent in the wind farm area during
this period, however, shows no sign of a deterring eff ect
of the construction at the scale of the satellite position-
ing (Figure 6.12). No eff ects of the wind farm could be
observed aft er it was put into normal operation. However,
due to limitations in the accuracy and limited number
of locations received, only a very strong eff ect from the
fi gure 6.10 map of tracks from harbour and grey seals
Map of tracks from harbour seals tagged at Rømø (blue lines), har-
bour seals tagged at Rødsand (black lines) and grey seals tagged at
Rødsand (red lines). Wind farms are indicated by red squares.
fi gure 6.11
Harbour seal with satellite transmitter glued to the top of the head.
pho
to: s
ven
d t
ou
gaa
rd
0 20 40
kilometers
0 20 40
kilometers
0 20 40
kilometers
fi gure 6.12 time spent by the tagged seals in 10x10 km squares
Time spent by the tagged seals in 10x10 km squares, separated
into baseline, construction and operating periods around Horns
Rev. Each square is colour coded according to the average time
(in minutes) spent per seal per day in the square. Th e wind farm
is indicated with a red square.

88 mammals: seals and harbour porpoises
wind farm would have been measurable. From the ship
surveys, conducted mainly to count porpoises, seals were
also observed. Th e survey data supports the satellite
tracking data that Horns Rev is important to the seals
and that they were seen inside the wind farm before,
during and aft er construction, with the exception that
no seals were observed inside the wind farm in surveys
which took place on days with pile drivings.
porpoises throughout the area
Th e ship surveys at Horns Rev showed that porpoises were
found throughout the survey area, both before, during
and aft er construction of the wind farm. Th e porpoises
tended to concentrate on the reef and only few animals
were observed in the deeper areas south of the reef. During
construction few porpoises were observed in the wind
farm. Th ere was a substantial variation in the number
of animals counted per survey, with a general pattern of
few animals in the winter and the most stable presence
of animals during the summer. Spatial modelling of the
distribution of porpoises on individual surveys was used
to calculate average densities of animals and compare the
densities in the wind farm with surrounding reference
areas (Figure 6.13).
Th is analysis showed a signifi cant change in the distri-
bution of porpoises from baseline to construction, from
even density across areas to a situation with a gradient
in density from low inside the wind farm to high in the
surroundings. Th e average density decreased from baseline
to construction and semi-operation (period following
construction with intensive maintenance and service
operation) and increased again during operation, but this
change was only signifi cant for the wind farm area during
construction. Th ere was thus a general but small eff ect of
the construction of the wind farm on the distribution of
porpoises (away from the wind farm). During operation
the distribution returned to the baseline situation.
acoustic monitoring successful
Th e acoustic monitoring started before construction
in July 2001 at Horns Rev and in November 2001 at
Nysted, and data were collected until December 2005
in both areas.
Wind turbinesMeteorological mast Transformer stationCable routeEU Special Protection AreaMilitary Restriction and Danger Areas
Depth Value
0.0 m-33.1 m
Estimated mean density of porpoises in the Horns Rev wind
farm area and three reference areas, modelled from visual
observations of animals in ship surveys. Black lines show the
95% confi dence intervals. Th ere was a signifi cantly diff erent
distribution during construction, with a signifi cantly lower
density inside the wind farm area. Th e map shows the wind
farm area and the three concentric reference areas.
fi gure 6.13 mean density of porpoises and reference areas
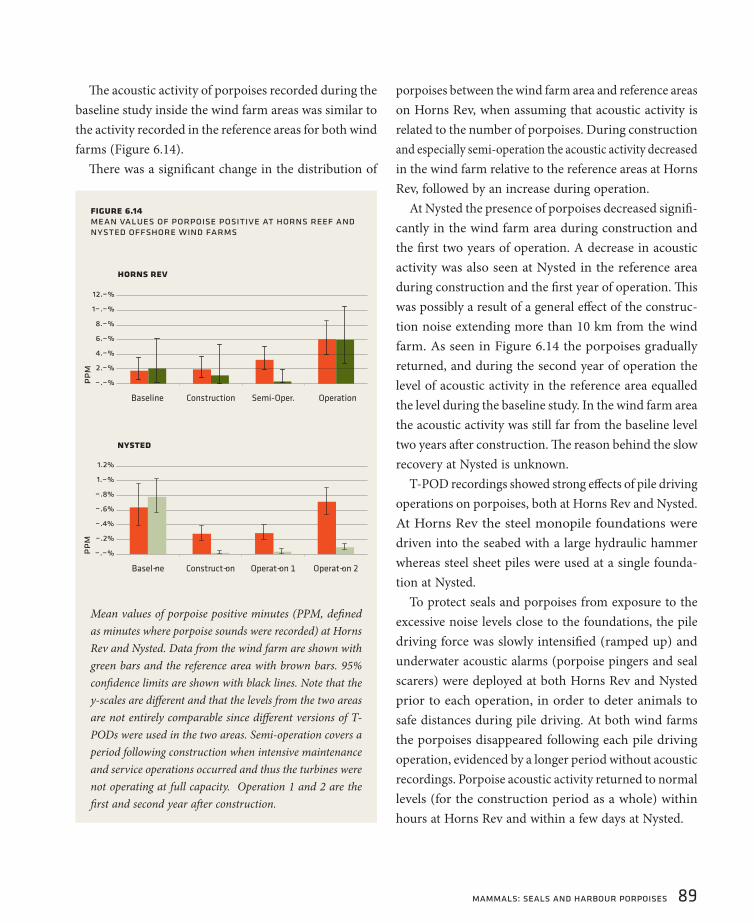
mammals: seals and harbour porpoises 89
Th e acoustic activity of porpoises recorded during the
baseline study inside the wind farm areas was similar to
the activity recorded in the reference areas for both wind
farms (Figure 6.14).
Th ere was a signifi cant change in the distribution of
porpoises between the wind farm area and reference areas
on Horns Rev, when assuming that acoustic activity is
related to the number of porpoises. During construction
and especially semi-operation the acoustic activity decreased
in the wind farm relative to the reference areas at Horns
Rev, followed by an increase during operation.
At Nysted the presence of porpoises decreased signifi -
cantly in the wind farm area during construction and
the fi rst two years of operation. A decrease in acoustic
activity was also seen at Nysted in the reference area
during construction and the fi rst year of operation. Th is
was possibly a result of a general eff ect of the construc-
tion noise extending more than 10 km from the wind
farm. As seen in Figure 6.14 the porpoises gradually
returned, and during the second year of operation the
level of acoustic activity in the reference area equalled
the level during the baseline study. In the wind farm area
the acoustic activity was still far from the baseline level
two years aft er construction. Th e reason behind the slow
recovery at Nysted is unknown.
T-POD recordings showed strong eff ects of pile driving
operations on porpoises, both at Horns Rev and Nysted.
At Horns Rev the steel monopile foundations were
driven into the seabed with a large hydraulic hammer
whereas steel sheet piles were used at a single founda-
tion at Nysted.
To protect seals and porpoises from exposure to the
excessive noise levels close to the foundations, the pile
driving force was slowly intensifi ed (ramped up) and
underwater acoustic alarms (porpoise pingers and seal
scarers) were deployed at both Horns Rev and Nysted
prior to each operation, in order to deter animals to
safe distances during pile driving. At both wind farms
the porpoises disappeared following each pile driving
operation, evidenced by a longer period without acoustic
recordings. Porpoise acoustic activity returned to normal
levels (for the construction period as a whole) within
hours at Horns Rev and within a few days at Nysted.
fi gure 6.14 mean values of porpoise positive at horns reef and nysted offshore wind farms
Mean values of porpoise positive minutes (PPM, defi ned
as minutes where porpoise sounds were recorded) at Horns
Rev and Nysted. Data from the wind farm are shown with
green bars and the reference area with brown bars. 95%
confi dence limits are shown with black lines. Note that the
y-scales are diff erent and that the levels from the two areas
are not entirely comparable since diff erent versions of T-
PODs were used in the two areas. Semi-operation covers a
period following construction when intensive maintenance
and service operations occurred and thus the turbines were
not operating at full capacity. Operation 1 and 2 are the
fi rst and second year aft er construction.
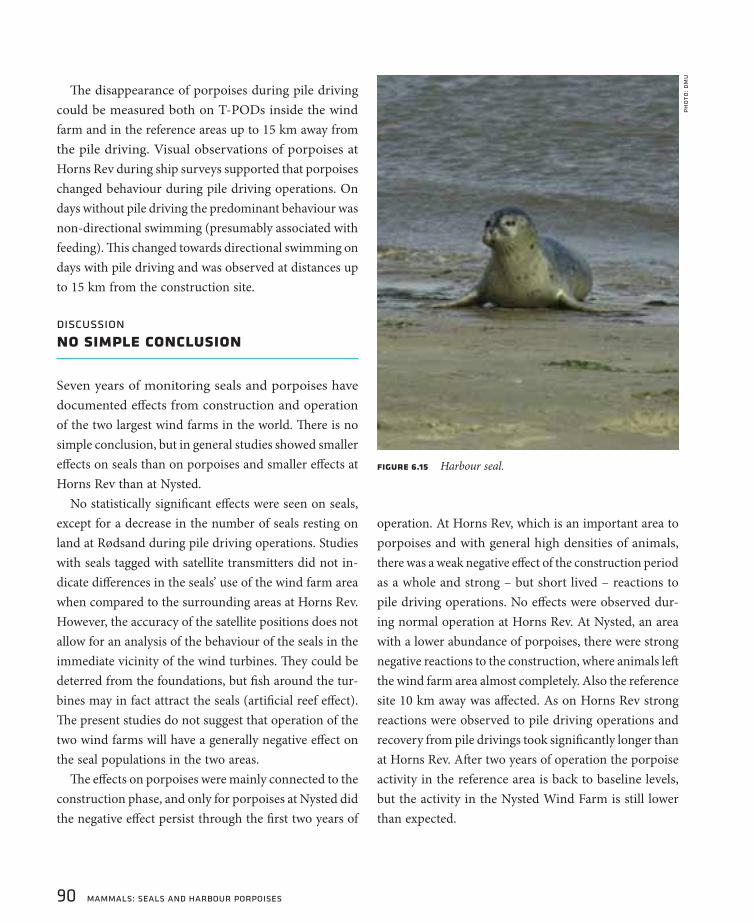
90 mammals: seals and harbour porpoises
Th e disappearance of porpoises during pile driving
could be measured both on T-PODs inside the wind
farm and in the reference areas up to 15 km away from
the pile driving. Visual observations of porpoises at
Horns Rev during ship surveys supported that porpoises
changed behaviour during pile driving operations. On
days without pile driving the predominant behaviour was
non-directional swimming (presumably associated with
feeding). Th is changed towards directional swimming on
days with pile driving and was observed at distances up
to 15 km from the construction site.
discussionno simple conclusion
Seven years of monitoring seals and porpoises have
documented eff ects from construction and operation
of the two largest wind farms in the world. Th ere is no
simple conclusion, but in general studies showed smaller
eff ects on seals than on porpoises and smaller eff ects at
Horns Rev than at Nysted.
No statistically signifi cant eff ects were seen on seals,
except for a decrease in the number of seals resting on
land at Rødsand during pile driving operations. Studies
with seals tagged with satellite transmitters did not in-
dicate diff erences in the seals’ use of the wind farm area
when compared to the surrounding areas at Horns Rev.
However, the accuracy of the satellite positions does not
allow for an analysis of the behaviour of the seals in the
immediate vicinity of the wind turbines. Th ey could be
deterred from the foundations, but fi sh around the tur-
bines may in fact attract the seals (artifi cial reef eff ect).
Th e present studies do not suggest that operation of the
two wind farms will have a generally negative eff ect on
the seal populations in the two areas.
Th e eff ects on porpoises were mainly connected to the
construction phase, and only for porpoises at Nysted did
the negative eff ect persist through the fi rst two years of
operation. At Horns Rev, which is an important area to
porpoises and with general high densities of animals,
there was a weak negative eff ect of the construction period
as a whole and strong – but short lived – reactions to
pile driving operations. No eff ects were observed dur-
ing normal operation at Horns Rev. At Nysted, an area
with a lower abundance of porpoises, there were strong
negative reactions to the construction, where animals left
the wind farm area almost completely. Also the reference
site 10 km away was aff ected. As on Horns Rev strong
reactions were observed to pile driving operations and
recovery from pile drivings took signifi cantly longer than
at Horns Rev. Aft er two years of operation the porpoise
activity in the reference area is back to baseline levels,
but the activity in the Nysted Wind Farm is still lower
than expected.
pho
to: d
mu
fi gure 6.15 Harbour seal.
mammals: seals and harbour porpoises 91
different situations at the two sites
Whereas the disturbance during construction was an-
ticipated in the impact assessment, the slow recovery at
Nysted was unexpected. Th e eff ect of constructing and
operating the two wind farms on the porpoise popula-
tions in the two areas has not been assessed. In general,
however, one can say that at Horns Rev a large number
of animals was aff ected but for a limited period of time
(construction period), and even more animals were
aff ected for an even shorter period of time during pile
driving operations when the eff ects extended beyond the
outer edges of the study area.
At Nysted the situation is reversed. Although a compara-
tively low number of animals was aff ected the population
of porpoises in the western part of the Baltic Sea is also
smaller. Th erefore the relative impact on the population
was higher at Nysted, both because the response to the
wind farm was stronger and because the duration of the
disturbance has been considerably longer than at Horns
Rev, as it extends into the operating period. Although eff ects
of the wind farms on the population levels are unlikely
to be very large it is not possible to estimate these.
sources of disturbance not determined
From the outset the monitoring programmes were de-
signed to show whether the animals avoided the wind
farm areas and whether the occurrence in the surround-
ing area was aff ected by the construction and operation
of the wind farms. Conclusions on what specifi c factors
like noise, turbine presence, boat traffi c or change in
prey availability are responsible for the observed eff ects
are thus weak, as the studies were not designed to detect
these. Th e only exception is pile driving operations, where
signifi cant reactions were found for porpoises and to a
lesser degree for seals.
However, the negative eff ect on porpoises is probably
due to the generally high level of disturbance from the
construction activities, involving considerable boat traffi c,
with associated underwater noise, as well as disturbance
to the seabed with resuspension of sediment etc. Second-
ary eff ects where prey species of fi sh were deterred by
the construction activities are also possible. Th ere are
no clear indications of the cause of the slow recovery at
Nysted. Whether the diff erence in construction meth-
ods between the two wind farms (pile driving at Horns
Rev and gravitation foundations at Nysted) aff ected the
porpoises diff erently is also unknown.
different response to the two wind farms
We may speculate that the more pronounced response at
Nysted may be because the area is of lesser importance
to the porpoises than Horns Rev and that porpoises at
Nysted thus are less motivated to remain in the area when
disturbed. In other words, the porpoises at Horns Rev
may be more inclined to ignore the disturbance, because
the area is of great importance, whereas the porpoises
around Nysted are not particularly interested in the area
and will simply avoid it if disturbed, without any more
severe consequences than the need to swim around the
area. Another possibility is that the Nysted area is rela-
tively sheltered, whereas Horns Rev is very exposed, with
higher background noise. Th is means that the turbine
noise from the wind farm at Nysted will be higher above
the background noise than at Horns Rev and therefore
the porpoises will be able to hear the turbines at greater
distances at Nysted.
In general, it can be concluded that the construction
of the wind farms had a measurable eff ect on porpoises,
whereas the eff ects on seals were marginal. For porpoises
there were diff erences in the magnitude of the response
between the two wind farms, diff erences that are largely
unexplained. With the exception of porpoises at Nysted
which still two years aft er end of construction have not
returned completely to the wind farm area, no indica-
tions of long term eff ects on the number of animals
were found.

92 mammals: seals and harbour porpoises
important steps in understanding the behaviour of marine mammalsMarine mammals such as harbour and grey seals or the
harbour porpoise are diffi cult to study. Their predominantly
submerged lifestyle makes it hard to assess any impacts of
human activities on these species on a large scale and even
more so on a small scale, as within the two wind farm sites in
Danish waters. Nevertheless, the Danish studies on the effects
of the wind farms on these species yielded comprehensive and
valuable results.
Construction and operation of wind turbines create noises of
varying intensities and durations, and marine mammals rely
heavily on acoustic cues from their environment. So strong concern
existed about the potential effect wind turbines might have on
these animals. The effects discussed ranged from behavioural
changes to habitat loss and even to physical injury due to pile
driving. Within the Danish monitoring programme a focus was
put on the potential changes in abundance and habitat use
of seals and porpoises. Information on these parameters and
their sensitivity to disturbances was very limited when the
environmental impact studies started and few methods existed
to study these issues. Therefore the Danish scientists had to
improve the existing techniques to gather and to analyse the
data and also to develop new ones to answer the questions
raised. The combination of established methods, such as line
transect surveys at Horns Rev, and new methods, such as video
monitoring at Rødsand, and the combination of satellite tags
and data loggers on seals or the use of stationary acoustic data
loggers (T-PODs) at both sites revealed important information
on the effects of the wind farm related activities on the marine
mammals both on land and at sea. Technical improvements
of the devices used had to go along with a continuous devel-
opment of new analytical methods for the resulting data. In
close cooperation with the developers and research groups in
Europe, the Danish scientists evolved their methods to a leading
standard on an international level.
factors affecting numbers and activitiesThe abundance of marine mammals and their habitat use is
of course also infl uenced by a large number of factors that are
unrelated to wind turbines. As an example a drastic reduction
in the size of the seal population was monitored in 2002 due
to an epidemic caused by the Phocine Distemper Virus (PDV),
while the numbers steadily increased over the following years.
Even though external factors like this have the potential to mask
effects of wind farms, the aerial surveys conducted at Nysted
and other haul-out sites allowed the conclusion that there is
IAPEME viewpoints

mammals: seals and harbour porpoises 93
no measurable effect of this particular wind farm. While the
declarative strength of the tracking data from satellite tags at
Horns Rev is limited these results nevertheless indicate that
there was no strong effect on the seal behaviour with regard
to the wind farm. Due to the complexity of cause-effect rela-
tionships between all natural and anthropogenic parameters
with regard to marine mammals it is impossible at present to
identify any effects of the wind farms at a population level.
Nevertheless, the Danish studies revealed some clear effects
on the harbour porpoises on a smaller scale which could be
related to construction activities. A clear avoidance reaction
was monitored during the construction at Horns Rev even at
considerable distances. Equally important might be the fact
that this effect was of short duration at Horns Rev as the
habitat use returned to a normal level soon after construction
and remains at this level during the ongoing operation of the
wind turbines. However, it remains unclear whether the animals
returning to the Horns Rev site were the same individuals, or
animals which had not been exposed to construction sounds.
A signifi cant reduction in habitat use is still persistent at
Nysted as a consequence of the construction activities even
after two years of operation. The detected differences between
reactions at Horns Rev and Nysted highlight the problem of a
generic application of such results for other sites. With the
exception of the ramming activities at Nysted the reactions
by seals were not as pronounced as those of porpoises. The
underlying mechanism infl uencing the detected differences
at the different sites and between species is not understood
and merits further research.
future studiesA focus in future research should be put on the telemetry of
harbour porpoises as this might shed some light on the indi-
vidual reactions of porpoises to acoustic disturbances. Another
relevant issue is the behaviour of both harbour and grey seals
at the wind farm sites. This issue might be addressed by the
combined use of satellite tags and activity dataloggers. Even
though the rapid technical development in these devices
might soon provide some substantial improvements, this
technique should be used at its current stage of technological
development to address these important questions. Finally,
the understanding of parameters defi ning a critical habitat for
marine mammals, and the cumulative effect that numerous
wind farms might have may be the most important research
issues to solve in order to understand and assess effects of
offshore wind farms on mammals.
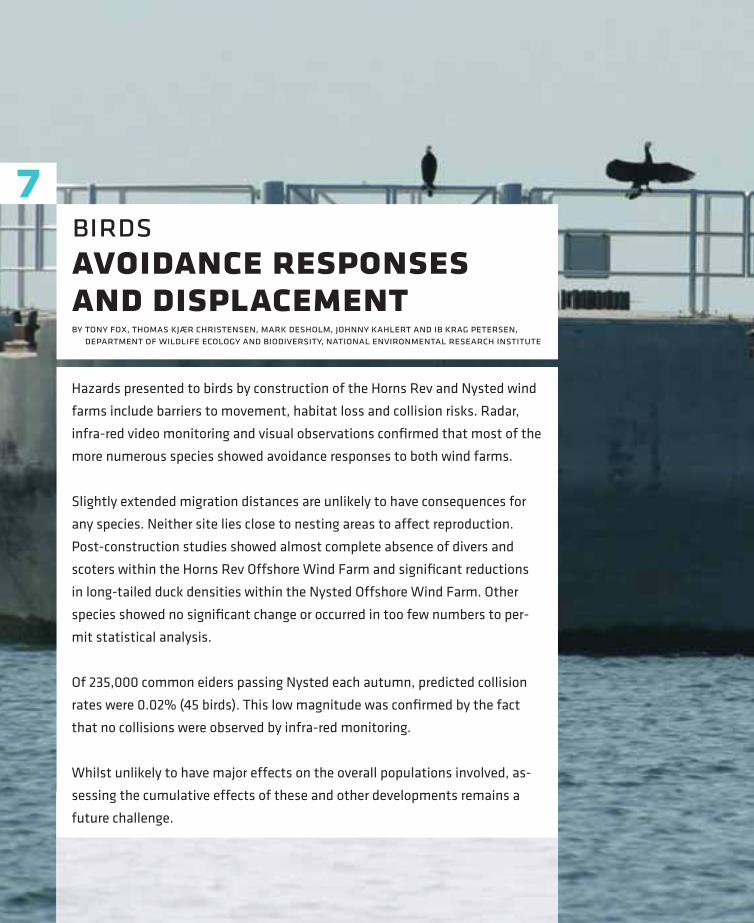
94 birds
7birdsavoidance responses and displacementby tony fox, thomas kjær christensen, mark desholm, johnny kahlert and ib krag petersen, department of wildlife ecology and biodiversity, national environmental research institute
Hazards presented to birds by construction of the Horns Rev and Nysted wind
farms include barriers to movement, habitat loss and collision risks. Radar,
infra-red video monitoring and visual observations confi rmed that most of the
more numerous species showed avoidance responses to both wind farms.
Slightly extended migration distances are unlikely to have consequences for
any species. Neither site lies close to nesting areas to affect reproduction.
Post-construction studies showed almost complete absence of divers and
scoters within the Horns Rev Offshore Wind Farm and signifi cant reductions
in long-tailed duck densities within the Nysted Offshore Wind Farm. Other
species showed no signifi cant change or occurred in too few numbers to per-
mit statistical analysis.
Of 235,000 common eiders passing Nysted each autumn, predicted collision
rates were 0.02% (45 birds). This low magnitude was confi rmed by the fact
that no collisions were observed by infra-red monitoring.
Whilst unlikely to have major effects on the overall populations involved, as-
sessing the cumulative effects of these and other developments remains a
future challenge.

birds 95
introductionhazards to birds at sea
Off shore wind farms represent the single most extensive
industrial infrastructural development in the marine
environment to date, and the erection of tall towers
supporting rotating turbine blades presents three types
of hazard to birds at sea (see Figure 7.1).
First, they can present a barrier to movement of migrat-
ing or feeding birds. Many bird species avoid unfamiliar
man-made objects, especially large moving structures, the
erection of which may defl ect prior migration routes or
feeding movements, although some may be attracted to
them. Displacement of migration routes will likely add
little to energetic costs by slightly extending traditional
routes to avoid turbines.
Displacement of feeding birds on a more frequent basis
(eg birds commuting daily between a roost and feeding site,
or parent birds fl ying between feeding areas and provision-
ing young at nests elsewhere), may incur heavier energetic
costs, which may ultimately aff ect survival or breeding
success. Behavioural avoidance of the vicinity of turbines
could also potentially displace feeding birds from wind
farms resulting in “eff ective” habitat loss. Even if the habitat
and food resource remain intact, they are lost to the birds
because of their reticence to approach the turbines.
Secondly, there may be physical habitat loss, as a food
resource is buried under the foundations, or lost below anti-
scour protection associated with the wind farm structures.
Th ese features may also create novel feeding opportunities,
for instance where hard concrete substrates or anti-scour
boulder protection are introduced to a formerly exclusively
sandy seabed. Hence, a second potential impact may be the
net change as a result of destruction and creation of habitats,
the eff ects of which also need to be assessed on birds.
Finally, if birds do not show avoidance behaviours,
there is a potential risk of collisions with the turbines.
Th e latter is oft en considered to be the most important
hazard because of its demographic eff ect on populations,
contentsIntroduction: Hazards to birds at sea
Methods: Radars, surveys and infra-red video
Results: Birds show avoidance responses
Discussion: Need for large scale assessment
IAPEME viewpoints
<
<
<
<
<
fi gure 7.1 major hazard factors to birdsFlow chart describing the three
major hazard factors (grey boxes)
presented to birds by the construc-
tion of off shore wind farms, show-
ing their physical and ecological
eff ects on birds, the energetic costs
and fi tness consequences of these
eff ects, and their ultimate impacts
on the population level (white box).
Th e light green boxes indicate
potentially measurable eff ects, the
dark blue boxes indicate processes
that need to be modelled (see text
for details).

96 birds
adding directly to the death rate. Th e impact of this el-
evated mortality depends on the population dynamics of
the species concerned. Long-lived species with naturally
low reproductive output (such as divers Gavia species
and common eider ducks Somateria mollissima) are slow
to replace themselves and can suff er rapid declines in
population size in response to relatively small increases in
annual adult mortality rates, making such species much
more vulnerable to collision mortality than, say small
fi nches, that regularly experience high mortality (eg on
migration), but exhibit higher reproductive potential to
rapidly replace annual losses.
Equally, habitat loss/gain and defl ection of fl ight trajec-
tories should not be considered trivial. For species with
highly restricted marine habitats, habitat loss may have
population level eff ects, because displaced birds have
poorer quality or little alternative habitat to which to resort.
For now, considering the fi rst two large off shore marine
wind farms ever constructed, these eff ects are likely to
be small, as the area aff ected compared to the extent of
similar shallow waters is miniscule, but the cumulative
impacts of many more such developments distributed
along the length of a species’ migratory corridor could
have impacts on survival and reproduction in the future.
Th e challenge of addressing cumulative impacts of this
and other human developments on populations of birds is
critical to the future exploitation of off shore wind resources
and is considered briefl y at the end of this chapter, but
needs to be the subject of continuing research.
effects of key hazards on birds
Th e focus of the present avian programme was to tackle
each major issue identifi ed as key hazards to birds: namely
fl ight displacement (A in Figure 7.1), changes in distri-
bution (B, C and D in Figure 7.1) and collision rate (E
in Figure 7.1). For each hazard, we needed to assess the
eff ects, based on observations of bird behaviour prior
to turbine erection, using measures that would enable
post-construction comparisons.
For fl ight displacement, the eff ects would be changes
in fl ight orientations (lateral avoidance, see Figure 7.2)
and potentially height (altitudinal avoidance) so the fre-
quency of fl ight tracks in three dimensional space had to
be described in a way that enabled assessment of eff ects
(specifi cally the extension of fl ight) post construction
(A1 and A2 in Figure 7.1).
For changes in distribution, eff ective loss/gain of habitat
needed to be compared by measuring bird densities at
sea in and around the proposed wind farm area prior to
and post construction (Figure 7.3), using bird densities
as the currency to measure habitat gain, or loss through
behavioural avoidance (B1 and B2 in Figure 7.1). Th e
physical loss and gain of habitat (C1/C2 and D1/D2 in
Figure 7.1) associated with turbine construction and
other wind farm structures were considered trivial in
proportional terms – even accounting for the anti-scour
structures, these features equated to less than 1% of the
focus on certain speciesFrom the start, it was impossible to address all hazards
with respect to all bird species occurring in the vicinity of
the wind farms. It was therefore necessary to focus upon
those avian species:
subject to special protection measures (eg under EU or
domestic legislation),
for which the two study areas have some signifi cance at
some stage in the annual life cycle (typically in numbers
exceeding 1% of the fl yway population),
that are for some reason especially susceptible to habi-
tat loss (eg highly specialised habitat) or collision (eg fl y
habitually at rotor height) or
that are susceptible to even small increases in adult
mortality (essentially long-lived birds with low annual
reproductive output).
For these reasons, most emphasis was placed upon stud-
ies of long lived large bodied birds, essentially marine
waterbirds.
<
<
<
<

birds 97
fi gure 7.3 displacement from feeding distribution associated with wind farm construction
Assume we fl y an aerial transect through a stretch
of sea, and over a series of fl ights, we gather mean
densities (brown) and an assessment of the varia-
tion bird density (grey error bars) along this strip of
sea (see A, top).
If birds show no avoidance behaviour to the turbines
(Case 1), we would expect the subsequent observed
mean densities gathered by aerial survey after the
erection of turbines not to differ from those prior to
construction (orange line see B middle graph).
If, however, birds will not approach a turbine within a
distance (shown by the pale blue arrow in C lower graph)
more than the gap between successive turbines (Case
2), then the area within the wind farm and an area
beyond the outermost turbines will be lost as potential
habitat (extent shown by dark blue arrow).
There may also be a further area lost where densities
are reduced, but some birds are willing to tolerate
approach (extent shown by the pale green arrow). The
theoretical total habitat loss in this one dimensional
scene equates to the area between the two curves.
fi gure 7.2 avoidance behaviour at nysted
If birds show lateral avoidance behaviour (in this case
at Nysted Offshore Wind Farm), it should be possible
to show the difference between the pre-construction
state (pink arrow showing the route taken by birds
prior to construction) compared to the avoidance
behaviour post construction (red arrow). Such ef-
fects can be detected statistically by sampling the
headings of radar tracks of birds as they progress
through the study area. The energetic costs of these
avoidance fl ights can be derived by estimating the
costs of fl ight per unit distance for a given species
under the prevailing wind conditions and comparing
the distances of the two trajectories.

98 birds
total area of marine substrate enclosed within the total
wind farm. Th eir eff ects would therefore be small and
diffi cult to distinguish from other distributional eff ects
described by monitoring changes in bird densities, except
for the arrival of new species attracted to novel habitats
post construction.
Finally, estimating bird collision rate (E1 in Figure
7.1) required an assessment of the rate of passage of
birds through the area swept by the turbine blades prior
to construction, and a modelling approach to assess the
proportions of these that would impact or be mortally
wounded by the turbines.
methodsradars, surveys and infra-red video
Th e Horns Rev and Nysted study areas diff ered markedly
in physical characteristics and bird species. Horns Rev’s
North Sea location is exposed to the prevailing south-
westerly winds, experiences lunar tides and is far more
“marine” than the more protected and enclosed brackish
Baltic location of the Nysted site, where changes in water
level result mainly from the eff ects of winds in the eastern
Baltic Sea, Kattegat and Skagerrak.
Numerically important species at Horns Rev included
divers (mostly red-throated Gavia stellata Figure 7.4),
gannet Morus bassanus, common scoter Melanitta nigra
(Figure 7.5), herring gull Larus argentatus, little gull L.
minutus, kittiwake Rissa tridactyla, arctic/common tern
Sterna paradisaea/hirundo and auks (guillemot Uria aalge
and/or razorbill Alca torda), with few common eider
which mostly associated with the coast.
At Nysted, cormorant Phalacrocorax carbo and mute
swan Cygnus olor occurred in internationally important
numbers (regularly >1% of the fl yway population). Also
numerically important were goldeneye Bucephala clangula,
long-tailed duck Clangula hyemalis (Figure 7.6), com-
mon eider (Figure 7.7), red-breasted merganser Mergus
fi gure 7.4 red throated diver gavia stellata
pho
to: j
ako
b si
guð
sso
n
fi gure 7.5 common scoter melanitta nigra
pho
to: d
an
iel
ber
gma
nn
fi gure 7.6 long-tailed duck clangula hyemalis
pho
to: g
reg
do
wn
ing
fi gure 7.7 common eider somateria mollissima
pho
to: d
an
iel
ber
gma
nn

birds 99
serrator, herring gull and great black-backed gull Larus
marinus, with divers and scoters in much fewer numbers.
Nysted also lies on the main migration route for many
thousands of waterbirds, dominated by eiders, which
occurred in internationally important numbers together
with dark-bellied brent geese Branta bernicla bernicla.
Regular counts suggest that barnacle goose Branta leu-
copsis and pintail Anas acuta could potentially occur in
internationally important numbers.
displacement studies
Th e study of bird fl ight trajectories was heavily reliant
upon remote sensing techniques, with conventional
azimuth ship navigation radar as the most important
tool for recording the patterns of all bird movements
in the vicinity of the wind farms. Th is provided two-di-
mensional tracks of all migrating birds within a radius
of approx 11 km of the radar antenna and hence a plan
view of how birds assort themselves in fl ight with regard
to the wind turbines.
At Nysted, the radar antenna and observers were located
on an observation tower placed in the sea 5 km northeast
of the wind farm (Figure 7.8). From here, radar observa-
tions were gathered and as much as possible, the bird or
fl ock of birds responsible for each radar screen track was
visually verifi ed to species and number of individuals,
enabling the collation of three years baseline data prior
to construction at this site.
At Horns Rev, the radar antenna, observation platform
and accommodation block for the human observers were
located on the transformer station, but since this logistic
platform was only available post construction, no prior
baseline exists for comparison with post-construction data
here. At both sites, the radar traces were transferred to
a geographical information system (GIS) for subsequent
statistical analysis (Figure 7.9). Supplementary bird fl ight
altitude distributions were derived by vertically mounted
marine radar and infra-red surveillance (Figure 7.10).
fi gure 7.8 nysted observation tower.
fi gure 7.10 Photograph of the Th ermal Animal Detection System
(TADS) in operational position, mounted on a turbine at Nysted,
to vertically monitor warm-bodied objects approaching the rotat-
ing turbine blades.
pho
to: m
ar
k d
esh
olm
pho
to: j
on
as
teil
ma
nn

100 birds
changes in distribution of species
Aerial surveys were designed to describe numbers and
distributions of the diff erent species to assess their status
and distribution throughout the year; later the objective
became to assess the changes in these measures post
construction. Aerial surveys were carried out at Horns
Rev and Nysted to count birds using trained observers
seated on either side of the high-winged aircraft .
Observers logged bird species, numbers and behaviour
with the precise time of the observation on a dictaphone
(Figure 7.11). Th e time associated with each bird/fl ock
observation could be converted to position via the timed
global positioning system (GPS) track recorded by computer
throughout the fl ight. Positioned observations were then
entered into the GIS for subsequent analysis. Cumulative
positions of birds/fl ocks could then be used to undertake
before/aft er construction comparisons of bird distributions
for species recorded in suffi cient numbers.
For both wind farms, aerial surveys covered an area of
sea much larger than the impact area. At Horns Rev, 30
north-south parallel transects were fl own at 2 km intervals
from the coast westwards to a line 37 km off Blåvands
Huk (Figure 7.12). Nysted was covered by 26 north-south
orientated transects extending approx 25 km south from
the mainland fl own at 2 km intervals (Figure 7.13).
Th e aerial survey count data were analysed comparing
bird encounter rates to test whether these were lower in
the wind farm area, a strip 2 km outside, a strip 4 km
outside and in the general area before and aft er turbine
construction. Th is enabled an assessment of the level
of attraction/avoidance shown by each species at both
wind farms post construction. Furthermore, cumulative
frequency distributions of species were compiled before
and aft er construction (based on measured distances to
the nearest turbines) to look for displacement eff ects.
estimating and measuring collisions
A stochastic predictive collision model was constructed
1 2 3 4 5 6 7 8 9 01 4 1 5 1 61 71 8 1 9 1
02 12 22 3 2
4 2 52 6 2
72
8292
03
11 21 31
N
0 10 20 km
Study areaSurvey way pointsSurvey transect linesMilitary danger and restriction areasHorns RevWind farmWind farm + 2 kmWind farm + 4 km
Fna ¯
Esbjerg
gnillak
S
ne
BlÂvands Huk
EK D73
EK R34
EK R35
33R
KE
EK D80
EK D81
23R
KE
fi gure 7.11 counting birds from aircraft
pho
to: i
b k
ra
g pe
ter
sen
fi gure 7.12 horns rev study area
Th e Horns Rev study area covered by the aerial surveys, showing
the positions of the wind turbines, with areas 2 km and 4 km
from the outermost turbines and the ideal survey transect lines
and way points.
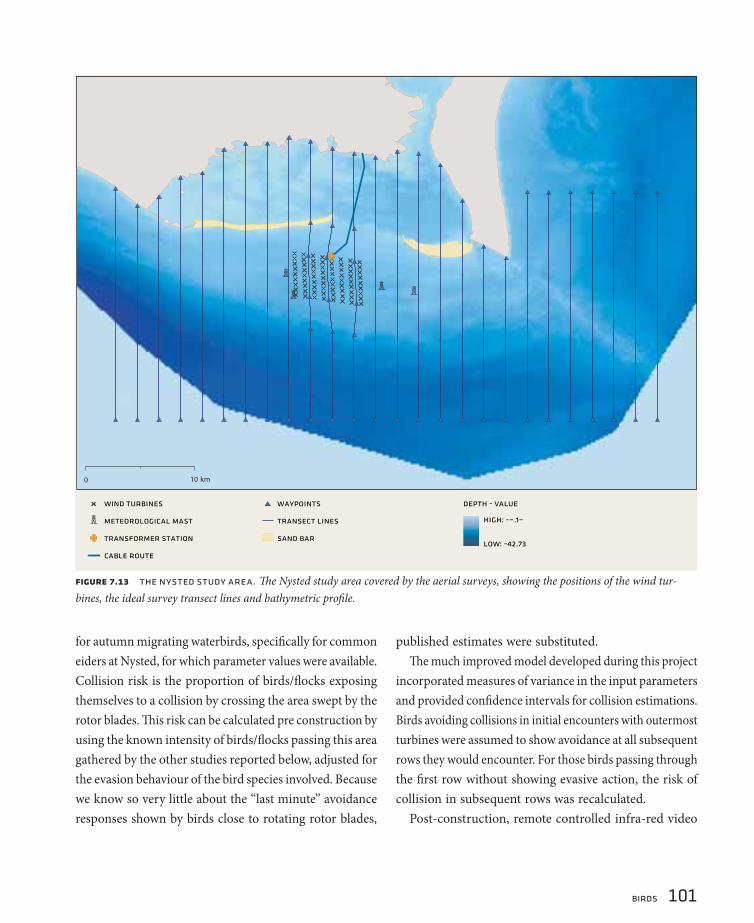
birds 101
for autumn migrating waterbirds, specifi cally for common
eiders at Nysted, for which parameter values were available.
Collision risk is the proportion of birds/fl ocks exposing
themselves to a collision by crossing the area swept by the
rotor blades. Th is risk can be calculated pre construction by
using the known intensity of birds/fl ocks passing this area
gathered by the other studies reported below, adjusted for
the evasion behaviour of the bird species involved. Because
we know so very little about the “last minute” avoidance
responses shown by birds close to rotating rotor blades,
published estimates were substituted.
Th e much improved model developed during this project
incorporated measures of variance in the input parameters
and provided confi dence intervals for collision estimations.
Birds avoiding collisions in initial encounters with outermost
turbines were assumed to show avoidance at all subsequent
rows they would encounter. For those birds passing through
the fi rst row without showing evasive action, the risk of
collision in subsequent rows was recalculated.
Post-construction, remote controlled infra-red video
fi gure 7.13 the nysted study area. Th e Nysted study area covered by the aerial surveys, showing the positions of the wind tur-
bines, the ideal survey transect lines and bathymetric profi le.

102 birds
fi gure 7.14 radar tracks of birds
Radar tracks of birds/bird fl ocks migrating southwards (A) and northwards (B) at Horns Rev during 2003-2005. Arrows show the average
orientation in the fl ight direction of birds within each grid cell. Th e vertical heights of the migrating birds are not known. Note radar shadows
to the north and east of the transformer station, where birds could not be detected because of the transformer station superstructure.
surveillance equipment (the Th ermal Animal Detection
System, TADS) was mounted on one of the Nysted tur-
bines, to monitor 30% of the sweep area of the turbine
for large waterbird collisions (Figure 7.10). Th is provided
data on both the specifi c nature and frequency of bird
avoidance actions and a direct sampled measure of the
number of collisions per unit time monitored.
resultsbirds show avoidance responses
Radar studies showed birds generally avoided Horns Rev
and Nysted wind farms, although responses were highly
species specifi c. At Horns Rev, radar tracks of birds show
circular adjustments in northward and southward fl ight
tracks around the periphery of the wind farm out to 5
km (Figure 7.14). Between 71 and 86% of all bird fl ock
radar trajectories heading for the wind farm at 1.5–2 km
distance ultimately avoided entering into the wind farm
between the turbine rows. Patterns at Nysted confi rm
similar large scale avoidance patterns, predominantly
amongst waterbirds there as well. Th ere was considerable
movement of birds along the periphery of both wind
farms, as birds preferentially fl ew around rather than
between the turbines (eg Figure 7.15).
Radar studies at Nysted showed that the proportion
of autumn migrating birds (essentially large waterfowl
and mostly common eider) rounding Gedser Odde that
avoided passing through the wind farm area varied lit-
tle between 91 and 92% aft er construction compared to
52–76% during the baseline period when no turbines
were present in the area. Th e latter comparison off ers

birds 103
a more robust demonstration of bird avoidance, which
contributed most to the overall reduction of 78% in the
use of the wind farm airspace by birds post construction
compared to that prior to construction.
changes to fl ight directions
Defl ection behaviour was readily visible amongst radar
tracks, resulting from birds making gradual and systematic
modifi cation to their fl ight routes in response to the visual
stimulus of the wind farm (1–2 km at Horns Rev and
1.5–5 km at Nysted), with more dramatic changes in fl ight
defl ection close to the outermost turbines (at 500 m or
closer at both Horns Rev and Nysted, eg Figure 7.15).
For some species (notably common eiders rounding Gedser
Odde in excellent visibility), it is not possible to exclude that
birds react at 10–15 km by modifying their fl ight orientation.
Such changes in fl ight route were not present in the baseline
pre-construction data and hence could be interpreted as a direct
consequence of the erection of the turbines. However, such
avoidance represented an extension of only between 0.5%
(night) and 0.7% (day) to the normal estimated 800 km
common eider annual migration route.
At both Horns Rev and Nysted, changes in fl ight direction
tended to occur closer to the wind farm at night (0.5 km)
than by day (1.5 km or more). At Nysted, although there was
still a remarkably high level of avoidance eff ect by night (6
out of 10 fl ocks, which crossed the eastern edge of the wind
farm pre construction avoided it post construction), this
was less pronounced than by daytime (9 out of 10).
Extended periods of infra-red monitoring at night using
TADS at Nysted provided unexpected evidence that no
movements of birds were detected below 120 m during the
hours of darkness, even during periods of heavy migration.
Th is confi rms the results from night time vertical-mounted
radar studies that night migrating birds below 1500 m
generally fl ew at higher altitudes than those by day. Th e
constraints of night time observation unfortunately mean
that visual verifi cation of the species involved was not
possible, but at least some of these birds must be common
eider fl ocks which are known to migrate under cover of
darkness, although in lesser numbers than by day.
responses are highly species specifi c
Th e studies were generally unable to gather data on
avoidance responses during poor visibility (eg fog or
precipitation) aff ecting the avoidance response, because
too few observations of intense migration traffi c occurred
during periods of poor visibility to enable such assess-
ments. Waterbird migration typically reduces substantially
or ceases during periods of poor visibility and indeed
during the observations reported here, the arrival of fog
and active rain associated with frontal systems invariably
resulted in the cessation of active migration that had been
observed during previous periods of good visibility. Th e
lack of observations during periods with <1 km visibility
at either of the observation platforms therefore precludes
provision of support for any major hypothesis that such
fi gure 7.15 flight trajectories of birds at nysted
Th e westerly orientated fl ight trajectories of birds tracked by radar
at the Nysted Off shore Wind Farm during the initial operation of the
wind turbines. Black lines indicate migrating waterbird fl ocks and
the red dots indicate the wind turbines. Reproduced from Desholm &
Kahlert (2005) with permission from Royal Society of London.

104 birds
conditions modify the avoidance response.
We must stress that these responses are those shown
by waterbirds generally (except where otherwise specifi ed),
and at Nysted by common eiders in particular because
they are the most abundant species present. Nevertheless,
it was clear that the avoidance responses are highly species
specifi c, that individuals show diff erent responses to wind
farms and that all birds can potentially enter the wind farms.
Some species were almost never witnessed fl ying between
turbines despite their abundance outside (eg divers and gan-
nets), others rarely did so (eg scoters) or generally avoided
fl ying far into the wind farm (eg terns), whilst others (eg
cormorant and gulls, especially greater black-backed and
herring gulls) showed no sign of avoidance at all.
no attraction responses
Observations did not support the alternative hypothesis that
some fl ying birds of certain species show a lateral attraction
response to the wind farm. Gulls (especially greater black-
backed and herring gulls) and cormorant were undoubt-
edly attracted to the turbine foundations as loafi ng areas,
but specifi c support for the hypothesis that these species
show a gradual and systematic defl ection towards the wind
farm was hard to establish, and there was little evidence of
changes in local abundance of these species in the vicinity
of and within the wind farm based on the aerial survey
data. Th ere was no support at all for the hypothesis that
large nocturnal migrating waterbirds were attracted to the
wind farm (eg as a result of the illumination).
changes in feeding and resting distribution
Comparison of pre- and post-construction aerial sur-
veys of waterbird distributions generally showed they
avoided both off shore wind farms, although responses
were highly species specifi c. Divers at Horns Rev showed
almost complete avoidance of the wind farm area post
construction, despite being present in average densities
prior to construction (Figure 7.16).
Comparisons of the bird densities inside the area of the wind
farms (pale blue columns), an area 2 km outside of the outer edge
of the turbines (dark blue) and 2–4 km outside of the outermost
turbines (light blue) before and aft er construction of the turbines.
Comparisons are given for the remainder of the area (green) and
the total areas including all areas (brown). Values are the means
for the pre- and post-construction periods for the month of the
year with the highest counts for each species, March for divers,
scoters, gulls and auks, January for long-tailed ducks and April
and May for terns. Th e 95% confi dence intervals are shown for
each value, and the statistical probability level obtained from the
results of students’ t-tests for each comparison are given above
the columns (n.s. represents no signifi cant diff erence).
fi gure 7.16 comparison of bird densities pre and post construction

birds 105
106 birds
Th e interpretation of the use by common scoter of the
Horns Rev Off shore Wind Farm is diffi cult, because of the
birds’ absence in the vicinity during the baseline study,
compared with very large numbers post construction
(potentially as a result of changes in food distribution).
Th e extreme scarcity of visual observations of scoters
fl ying in between turbines and the lack of observations
during aerial surveys post construction (when up to
381,000 were present in the general area) confi rm that
this was also amongst the species that showed almost
complete avoidance of fl ying or swimming between the
rows of turbines, despite very large concentrations in the
surrounding waters (Figure 7.17).
Long-tailed ducks showed statistically signifi cant
reductions in density post construction in the Nysted
wind farm (and in sectors 2 km outside) where they had
shown higher than average densities prior to construc-
tion. Th is strongly suggests major displacement of this
species from formerly favoured feeding areas, although
the absolute numbers were relatively small and there-
fore of no signifi cance to the population overall (Figure
7.16). Terns and auks were almost never counted in the
Horns Rev Off shore Wind Farm post construction, but
were present in densities similar to the overall average
prior to turbine erection, but because of high variance
during the baseline, the diff erences were not statistically
signifi cant (Figure 7.16). Other species, such as little and
herring gulls, showed no signifi cant change in distribu-
tion. Comparing pre-construction distributions of birds
with suffi cient sample sizes with those post construction,
no bird species convincingly demonstrated enhanced
use of the waters within the two Danish off shore wind
farms aft er the erection of turbines, but it was clear, for
example amongst cormorants at Nysted, the wind farm
area was used occasionally for social feeding by very large
numbers of birds post construction.
Although bird displacement (as a result of behavioural
avoidance of wind farms) represents eff ective habitat loss,
it is important to assess the relative loss in terms of the
proportion of potential feeding habitat (and hence the
proportion of birds) aff ected relative to the areas outside
of the wind farm. For most of the species considered here,
that proportion is relatively small and therefore likely
to be of little biological consequence. However, the ad-
ditional costs of many other such wind farm eff ects may
constitute a more signifi cant eff ect and represents a high
priority when considering cumulative impacts of many
such developments along an avian fl yway.
low probability of waterbird collisions
Th e avoidance responses documented above mean that
although erecting turbines at sea does have a major eff ect
on the local distribution, abundance and fl ight patterns of
birds, the corollary is that many fewer birds come within
the risk zone of the rotor blade sweep area. Radar study
results demonstrated that many birds showed avoidance
responses up to 5 km from the turbines, and that >50%
of birds heading for the wind farm avoid passing within
it. Radar studies at Horns Rev and Nysted also confi rm
that many birds entering the wind farms re-orientate to
fl y down between turbine rows, frequently equidistant
between turbines (eg Figure 7.15), further minimising
collision risk. Th e Nysted TADS study confi rmed that
waterbirds (mostly common eider) reduced their fl ight
altitude within the wind farm, fl ying more oft en below
rotor height than they did outside the wind farm.
Th e stochastic predictive collision model was used
to estimate the numbers of common eiders, the most
common species in the area, likely to collide with the
sweeping turbine blades each autumn at the Nysted
Off shore Wind Farm. Using parameters (including those
described above) derived from radar investigations and
TADS, and 1,000 iterations of the model, it was predicted
with 95% certainty that out of 235,000 passing birds,
0.018–0.020% would collide with all turbines in a single
autumn (41–48 individuals).

birds 107
With such a low level of probability of collision expected
at any one turbine, it was predicted that the TADS moni-
toring system would fail to detect a single collision of a
waterbird during more than 2,400 hours of monitoring
that was undertaken at the site, and this proved to be the
case, despite the eff ectiveness of TADS in detecting birds
(Figure 7.18). Th is level of monitoring resulted in a mere
11 bird detections well away from the sweep area of the
turbine blades, two passing bats, two passing objects that
were either small birds or bats, a moth and one collision
of a small bird/bat.
major consequences unlikely
Th e objectives of the assessment undertaken here were
to predict the potential eff ects of the construction of
the fi rst two large scale major off shore wind farms in
Danish waters and then to measure the observed eff ects
post construction. Because these two wind farms are the
fi rst of their size on the planet, for which we have only
0 10 2050 10 205 km km
Distribution of common scoter, Melanitta nigra, around the Horns Rev Off shore Wind Farm based on 16 pre-construction aerial sur-
veys (left plot), compared to 15 post-construction surveys (right). Observations are arranged around north-south oriented lines along
the survey track lines, each point indicates an individual bird or fl ock, the point size being proportional to the number of birds. Small
crosses indicate the positions of the turbines, the mainland is indicated in grey and the bathymetry of the area is indicated by the blue
shading (darker colour representing deeper water). Changes in overall distribution may refl ect changes in food distribution between
the two periods, but it cannot be excluded that the absence of birds southeast of the wind farm post construction was at least partly
due to maintenance traffi c in this area.
fi gure 7.18 infra-red image of passing bird flock
An infra-red image of a passing fl ock of common eiders, Somateria
mollissima, captured by the Th ermal Animal Detection System
(TADS) during operation at the Nysted Off shore Wind Farm.
Th is scene was captured whilst the camera was pointing away
from the turbine rotors.
pho
to: m
ar
k d
esh
olm
108 birds
3 years of post-construction data we should be cautious
about drawing general inferences from the results at
this stage.
Nevertheless, the broad conclusion is that at least the
majority of the more numerous bird species at Horns
Rev and Nysted show avoidance responses to both wind
farms. Whilst this may add to energetic costs, neither site
is so close to a nesting area of any of the species to aff ect
reproduction, and the slight extension to fl ight distances
(generally <10 km) is unlikely to have any major conse-
quences for any of the species involved at this level. Th e
responses were highly species- and site-specifi c and subject
to infl uence by factors such as wind, so it is not possible
to generalise, but general avoidance also extended, not
just to fl ying between turbines, but also to not resting or
foraging between them.
Aerial surveys showed almost complete displacement of
divers at Horns Rev, where virtually no common scoters
were encountered between the turbines, confi rmed by
visual and radar observations which showed the species
was reticent to fl y or swim between the turbines. Th ere
were signifi cant reductions in long-tailed duck densities
within the Nysted wind farm compared with pre construc-
tion and control areas. Th is implies that construction of
wind farms in favoured feeding areas for these species,
and potentially others, will cause habitat loss for at least
three years aft er construction, even if the habitat and the
feeding resource remained intact. Th is habitat loss for such
benthic and pelagic feeders is a major consideration in
any future environmental impact assessment, especially
where there are high bird concentrations or where there
is evidence of habitat limitation at the stage of the life
cycle when the habitat is exploited.
Avian avoidance behaviour of turbines minimizes col-
lision risk, and these early post-construction studies show
that, despite very heavy common eider migration in the
Nysted area, their avoidance of turbines at diff erent spatial
scales resulted in very low modelled collision risk. Th e
modelling collision risk at offshore wind farmsThe stochastic collision risk model is a mathematical means
of estimating the likelihood of a bird colliding with a turbine,
based on the product of an array of probabilities (each deter-
mined by different factors), drawn from observations, which
includes an assessment of natural variability (see Petersen
et al. 2006 for a full explanation). Few of these probabilities
can be determined in advance of turbine construction, but
many more can be obtained from comparisons between pre
and post construction measurements.
For example, baseline mapping of radar tracks of fl ying
individual birds or fl ocks enables a basic assessment of
the proportion that entered the wind farm area prior to
construction. Vertical and horizontal radar and infrared
technology studies can measure the proportion of those
birds entering the wind farm that would potentially fl y within
horizontal and vertical reach of the rotor blade sweep area.
The combination of these parameters is crucial for a basic
environmental impact assessment of the proportions of
birds passing through a proposed wind farm area that are at
potential risk from collision. However, if a species also tends
to avoid travelling through the wind farm post construction,
or fl ies at a lower altitude and equidistant between turbines
when they do so (as was the case with eiders at Nysted),
the probability of collision is further reduced compared with
the original prediction. At present, only the Horns Rev and
Nysted offshore studies have provided such information to
parameterise such models.
Many of these probabilities are also affected by environ-
mental conditions, such as wind strength and direction, or
the specifi c local conditions that affect migration in the
vicinity, which also need to be taken into account in mod-
elling collision risk. Even those birds that do approach the
rotor blade sweep area may avoid collision by pure chance
(which can be mathematically estimated based on known
factors such as bird size, fl ight speed and rotor speed) or
by active avoidance (which is likely to be highly species
specifi c and requires much greater study). These site- and
species-specifi c probabilities require fresh empirical stud-
ies to generate robust risk probabilities at other offshore
wind farm sites in the future in order to conclude on any
generic effects.

birds 109
model predictions of collision rates (confi rmed by TADS
monitoring) suggested that large waterbird collisions were
extremely rare events, amounting at Nysted (with 95%
confi dence) to 40–50 common eiders on average per year,
less than 0.05% of the annual hunt in Denmark (currently
approx 70,000 birds). TADS monitoring of a single tur-
bine is expensive in terms of equipment and analysis, but
TADS deployment was invaluable for supporting collision
model predictions and providing data on the frequency
and nature of near turbine avoidance behaviours of birds
(and indeed moths and bats), knowledge of which has
been previously virtually non-existent.
discussionneed for large scale assessment
Th e issues of fl ight displacement, habitat loss and colli-
sion are common to all wind farm developments, so the
most eff ective fi rst tier level of screening for potential
locations for off shore wind farms throughout the world
should be based upon large scale assessment of avian
migration routes and of feeding distributions of birds
in the marine environment. Aerial survey techniques
enable large areas of off shore waters to be censused in
relatively short periods and large scale radar to describe
bird migration in relation to the geography of coastlines
fi gure 7.19 Th e collision risk with the wind turbines is very low.
Of 235,000 common eiders passing Nysted each autumn, predicted
collision rates were 0.02% (45 birds). Th e low fi gure was confi rmed
by the fact that no collisions were observed by infra-red monitoring
of the turbine blades.
pho
to: n
yste
d o
ffsh
or
e w
ind
fa
rm
110 birds
and the world’s major avian fl yways.
It is more feasible now than ever before to assess at
international and regional scales, the relative sensitivity of
particular areas to development by constructions because of
collision or avoidance by birds. Our experience confi rmed
the need for pre- and post-construction monitoring to
demonstrate eff ects and measure their magnitude and
we strongly recommend this is undertaken at consented
off shore wind farm locations to thoroughly document
the abundance and distribution of all bird species pre
construction, to investigate any residual eff ects aft er miti-
gation, to assess the eff ectiveness of mitigation measures
and contribute to our gathering knowledge of the eff ects
of off shore wind farm constructions on diff erent species
under a range of diff ering circumstances.
measuring cumulative effects
Th e European Union’s Environmental Impact Assessment
Directive requires some assessment of the cumulative
eff ects and impacts arising from each wind farm develop-
ment and from other projects (which may include both
other wind farms and other relevant human development
projects) that impact upon the same fl yway populations.
Such assessments are extremely diffi cult without a common
currency. Human development pressures may enhance
energy expenditure, destroy habitat, inhibit nesting or
kill birds, none of which are directly comparable in terms
of their impacts.
It is necessary to establish a common measure for
comparison, and gauge the eff ects of individual devel-
opments to overall impacts at the population level. Th e
opportunity to defi ne the impact in terms of the contri-
bution to changes in annual population size off ers one
of the few possibilities to compare very diff erent eff ects
overall and to make an assessment of their cumulative
results. Such an approach is neither simple nor easy, but
the framework described in Figure 7.1 off ers some pos-
sibility of attaining this goal.
collision riskRisk of bird mortality through collisions with turbines has long
been one of the main environmental issues associated with
wind farms. Collision risk can be estimated through models,
but modelling requires a number of key parameters of bird
behaviour to be measured or guessed (Band et al. in press). In
the context of the present studies, we can have great confi -
dence in the data on numbers of birds using the study areas, as
there have been detailed and accurate surveys over many years.
However, there is a shortage of data on the avoidance behaviour
of birds approaching turbines and this is a key determinant of
the collision rates computed from models (Chamberlain et al.
2006). For onshore wind farms, there is a possibility to obtain
empirical data on collision rates by collecting carcasses, but that
is not possible at marine wind farms. Study of bird behaviour in
the vicinity of onshore wind farms can be done relatively eas-
ily by direct observation or radio tracking (Barrios & Rodriguez
2004; Drewitt & Langston 2006). This is less practical at sea,
although observations can be made of fl ight altitudes, speeds
and behaviours of seabirds that can provide data on species
vulnerability and some of the parameters required for collision
risk models (Garthe & Hüppop 2004). The research at Horns
Rev and Nysted provides novel and critically important data on
the behavioural responses of waterbirds to marine wind farms,
obtained through the development of sophisticated methods
such as the novel TADS (thermal animal detection system)
and use of state of the art radar that can track individual birds
over the sea. These studies have provided very strong evidence
indicating that collision mortality of waterbirds during migra-
tory passage at Horns Rev and Nysted is unlikely to have a
signifi cant impact on populations.
IAPEME viewpoints

birds 111
There has been a general concern world-wide that even if there
are few collisions under normal conditions, bird populations may
be affected by catastrophic mortality events on rare occasions
when visibility is impaired by fog or other adverse weather
conditions. The observations at Nysted that waterbirds tend
not to fl y in the area of the turbines at night, or under adverse
weather conditions (as found elsewhere; Petterson 2005) suggest
that collision risk is not likely to be high even under conditions
when the turbines are less visible, although more work testing
this hypothesis would be desirable.
habitat loss and increased travel costsAlthough the strong tendency for waterbirds to avoid entering
the wind farm seems to indicate that collision rates will be
very low, the strong avoidance behaviour may lead to greater
loss of habitat and energy costs of increased travel distances.
Such travel costs may also be an issue for nocturnal migrant
passerines where body reserves dictate migratory ability and
survival prospects (Alerstam 1990; Ballasus & Hüppop 2006).
The studies at Horns Rev and Nysted suggest that extra travel
costs (and costs of habitat loss) for seabirds are likely to be
trivial in the context of a single wind farm. But the development
of numerous marine wind farms along the coasts of Europe
leads to questions about cumulative effects. Marine wind
farms tend to be sited in water depths that are the preferred
habitat of bird species of conservation concern such as com-
mon scoters and red-throated divers, species that are already
considered to be vulnerable to impacts of disturbance (Kaiser
et al. 2006; Schwemmer & Garthe 2006). Assessing cumula-
tive effects on bird populations is clearly an important topic
for future research.
It seems likely that studies in other parts of the world will fi nd
similar bird behaviours in relation to offshore wind farms to
those reported here, but there is a clear need to investigate
how much the behaviour of birds varies between sites and
species; it would be inappropriate to assume that data from
Horns Rev and Nysted can necessarily be applied to offshore
wind farms elsewhere.
questions arising for future studyThe Danish research has developed valuable new tools for study
of birds in relation to marine wind farms, and has provided
insights into the fl exibility of waterbird behavioural responses
to the hazard of turbines suggesting that collision rates are
likely to be less of a problem than often suggested, whereas
habitat loss may potentially be a greater issue if numerous
sites are developed along an avian fl yway or key winter range.
It is evident from the studies of benthic organisms and fi sh
at Horns Rev and Nysted that ecological changes in the wind
farm will probably take many years to reach equilibrium. Birds
may respond to these changes; for example the wind farm
may become more attractive if food stocks increase. Birds may
also learn to adapt to the new structures, so that behavioural
responses may differ after some years from those seen when
the farm was new. The extent of adaptation by birds is yet to
be seen, but given the long life-spans of seabirds such changes
can be anticipated, and may infl uence parameters of collision
risk models. These questions also merit research, but the
greatest challenge for the future may be the development of
paradigms to assess cumulative impacts of marine wind farms
on bird populations at a landscape scale.

112 socioeconomic effects
8socioeconomic effectspositive attitudes in local communitiesby jacob ladenburg, jesper tranberg, alex dubgaard (institute of food and resource economics, kvl) and susanne kuehn
A sociological and environmental economic study reveals that both the local
and national populations are positive towards the offshore wind farms. How-
ever, it is very clear that there is a difference in attitudes between the two lo-
cal areas and also between the attitudes at local and national level.
In terms of the preferences and willingness to pay for the future placing of
wind farms the results show a clear picture. People are willing to pay to place
future offshore wind farms away from the shore to reduce their visual impact.
However, the willingness to pay to have wind farms moved completely out of
sight is limited. The results also indicate that the preferences vary with regard
to the experience with visual intrusions of offshore wind farms.

socioeconomic effects 113
introductionattitudes and preferences
In Denmark the number of land-based wind turbines
has increased signifi cantly during the last decades.
At the same time focus on the negative eff ects on the
surroundings in terms of noise, refl ections and visual
intrusions have been the focus of much debate. Moving
wind power off shore has been expected to reduce some
of these negative eff ects but the attitudes and preferences
actually found in the local communities have not been
investigated so far.
An investigation of the perception of landscape eff ects
was the aim of the socioeconomic study. Th e study was
conducted as two separate studies, containing a sociological
study examining the local attitudes and an environmental
economic study investigating people’s preferences for
future locations of off shore wind farms.
When investigating the preferred locations several factors
were expected to be important. Th e size of the individual
wind turbines, distance from the shore, size of the wind
farms and the number of wind farms are all characteristics
which were expected to infl uence the individual percep-
tion of the visual intrusions of off shore wind farms.
From a policy point of view the diff erent intrusion
characteristics are very interesting as they entail important
information on the welfare economic impacts of locating
off shore wind farms within sight from the shore. To be
able to estimate the preferences and willingness to pay
for a reduction of the visual intrusions associated with
the diff erent characteristics of off shore wind farms, the
Choice Experiment valuation method was viewed as ideal
for the purpose compared to other approaches.
two local areas with different set-ups
Th is chapter will make it evident that there is a clear
diff erence in the attitudes and preferences between the
two local areas of Horns Rev and Nysted. A diff erence
in preferences exists between the local population and
the Danish population as well.
Th e Horns Rev Off shore Wind Farm is located 14 km
west of the coast of the Blåvands Huk area. Th e area is
predominated by recreational homes and 3260 people
are permanent residents in the municipality. Only a few
homes, both permanent and recreational, have a location
with a view of the wind farm from their plot.
Th e wind farm at Nysted is located 10 km from the
coastline and, contrary to Blåvands Huk, quite a few of
the 4,285 citizens can actually see the wind farm from
their houses. Th e wind farm can also be viewed from the
town of Nysted and from the town harbour, which is a
central meeting place for both locals and tourists.
Th e somewhat diff erent local conditions of the two sites
are important to keep in mind since they are expected
to be the major reason for the diff erences in attitudes
found in the sociological study, and in part the reason
why diff erent preferences for future locations are revealed.
It is also important to keep in mind that the distance
between the wind farm and the coastline diff ers for the
two locations. Th is diff erence creates a dissimilar visual
interference, which is expected to be the origin of much
of the diff erence in attitudes.
methodssociology and economics
Not surprisingly the two studies apply diff erent approaches
due to their diff erent aims.
Th e sociological study takes a qualitative approach by
contentsIntroduction: Attitudes and preferences
Methods: Sociology and economics
Results: A generally positive attitude
Discussion: First study to address distance
IAPEME viewpoinst
<
<
<
<
<
114 socioeconomic effects
relying on in-depth interviews for its empirical work to
expose the attitudes towards the two local wind farms.
A total of 46 persons were interviewed, each interview
lasted between one and two hours. Th e sociological study
was supplemented with an analysis of the local media
coverage of the wind farms. Th e study includes two lo-
cal samples but also investigates the change in attitudes
over time in interviews conducted before and aft er the
construction of the wind farms.
Th e environmental economic study uses a quantitative
questionnaire based on the Choice Experiment approach
to elicit the preferences for diff erent location strategies.
As follow-up questions the questionnaire also included a
series of attitudinal questions on wind farms in general.
Th e environmental economic study includes a Horns
Rev, Nysted and a national sample. Th is makes it possible
to compare the local fi ndings with the general national
attitudes and preferences.
In spite of the diff erent focuses and approaches the two
studies were able to benefi t from each other. Th e fi ndings
in the sociological survey supported the formulation of
the attitudinal questions in the environmental economic
questionnaire. Subsequently the responses to the attitu-
dinal part of the questionnaire were used to validate the
results of the sociological interviews.
assessment of local attitudes
Th e sociological study was initiated in the spring of 2003
when the pre-construction interviews at Nysted were
conducted. Th e study ended in the autumn of 2004 with
follow-up interviews at Nysted. As mentioned these last
interviews were conducted to monitor if there had been
a change in attitudes.
During this period the interviews in the Horns Rev area
(Blåvands Huk) were also conducted (no pre-construction
interviews were conducted at Horns Rev). Th e analysis
of the local media was also made during this period. It
is worth noting that the people selected for these in-
depth interviews were chosen because they had shown
an interest in the local project. Th erefore, their opinion
cannot be directly transferred to cover the opinion of
the general local public.
Th e interviews were carried out on the basis of a guide
containing themes on the decision-making process, gen-
eral view and perception of wind energy and the general
opinion about nature and environmental issues. In the
second stage interviews, whose main purpose it was to
detect whether a development in attitude had taken place,
the interview guide was expanded. Th is expansion was
based on relevant questions which had come up during
the fi rst interview sessions and in the questionnaire from
the environmental economic study.
Part of the sociological study focused on the debate
in two local newspapers in relation to the wind farms.
Th e selected papers were Lolland-Falster Folketidende
(Nysted) and Jyske Vestkysten (Horns Rev), relevant
articles in the period of 1997 to 2004 were analysed. Th e
analysis investigated what attitudes the papers presented
and to what extent the public discussion and attitudes
were infl uenced by the papers.
choice experiments
Th e environmental economic study of preferences for the
location of future wind farms in terms of the distance
from the shore line was conducted as a mail survey in
May 2004. Th e Choice Experiments valuation survey was
based on 1400 randomly selected individuals and divided
into three samples; a national sample of 700 respondents
represented the Danish population and two samples of
350 respondents each represented the populations living
close to the two wind farms at Nysted and Horns Rev.
In total 672 usable questionnaires were returned,
distributed onto 362, 140 and 170 respondents from the
national, Horns Rev and Nysted samples respectively. Th is
is equal to an eff ective response rate of 48%, which can
be considered as good in this type of research.
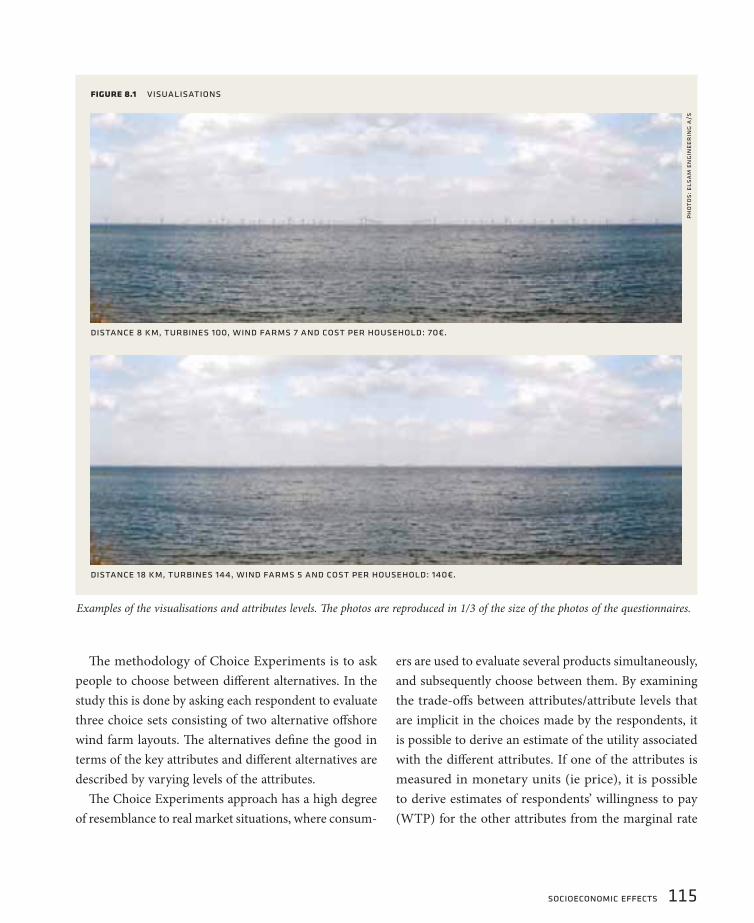
socioeconomic effects 115
Th e methodology of Choice Experiments is to ask
people to choose between diff erent alternatives. In the
study this is done by asking each respondent to evaluate
three choice sets consisting of two alternative off shore
wind farm layouts. Th e alternatives defi ne the good in
terms of the key attributes and diff erent alternatives are
described by varying levels of the attributes.
Th e Choice Experiments approach has a high degree
of resemblance to real market situations, where consum-
ers are used to evaluate several products simultaneously,
and subsequently choose between them. By examining
the trade-off s between attributes/attribute levels that
are implicit in the choices made by the respondents, it
is possible to derive an estimate of the utility associated
with the diff erent attributes. If one of the attributes is
measured in monetary units (ie price), it is possible
to derive estimates of respondents’ willingness to pay
(WTP) for the other attributes from the marginal rate
fi gure 8.1 visualisations
distance 8 km, turbines 100, wind farms 7 and cost per household: 70€.
Examples of the visualisations and attributes levels. Th e photos are reproduced in 1/3 of the size of the photos of the questionnaires.
distance 18 km, turbines 144, wind farms 5 and cost per household: 140€.
pho
tos:
els
am
en
gin
eer
ing
a/s

116 socioeconomic effects
of substitution between the monetary attribute and the
other attributes.
Th e attributes that form each alternative are the dis-
tance from the shore, the size of the wind farm and the
price of electricity. Th e diff erent levels of each attribute
are combined using statistic methods, and 36 diff erent
alternatives were used to construct the choice sets. Th e
price, here as an additional payment over the electric-
ity bill, and the size of the wind farm (49, 100 or 144
turbines of 5 MW each) are relatively easy to relate to.
However, the visual impact caused by diff erent distances
and sizes might be diffi cult to comprehend. To counter
this each choice set was supplemented by a visualisation
of the two choices.
resultsa generally positive attitude
Both the sociological and the environmental economic
studies showed a positive attitude towards wind power
in general. Of the 46 individuals in the sociological study
only two expressed a negative attitude towards the future
use of wind power as a sound alternative to other types
of renewable and non-renewable fuels. Th e same fi ndings
were made in the environmental economic study where
both local and national respondents pointed to wind
energy as their favoured choice of reducing CO 2 emis-
sions. In comparison it was found that solar power and
energy savings were among the second most preferred,
whereas nuclear power and tradable CO 2-quotas were
among the less favoured.
Th ere was a consensus between the three samples on
the preferred source of energy but the respondents in the
Nysted area stand out from the national and Horns Rev
samples by placing more emphasis on biomass. Along
the same lines the respondents at Nysted seem to value
natural gas less. According to the sociological study the
reason for these deviations in the Nysted sample might
be due to positive local experience with biomass (see
Figure 8.2).
attitude towards existing wind farms
In both studies the respondents were asked to state their
attitude towards existing and future off shore wind farms.
In the environmental economic study it was found that
people in the Horns Rev area are more positive towards
existing off shore wind farms than respondents in the
Nysted area. Th is is expressed by more respondents stating
that they are “very positive” towards the existing off shore
wind farms in the Horns Rev sample. At the same time
a predominant part of the “negative” replies happens to
be from Nysted (see Figure 8.3).
Th ese fi ndings are consistent with the fi ndings in the
sociological study. Here it was found that the people in
the Horns Rev area accept the local wind farm to a higher
extent than is the case in the Nysted area.
When looking into who is the most sceptical of the
Percentage of each sample who answered ”to a great extent” when
asked whether the energy source should be used “to a great extent”,
“to some extent” or “not at all” in the Danish eff ort to meet CO2
reduction demands.
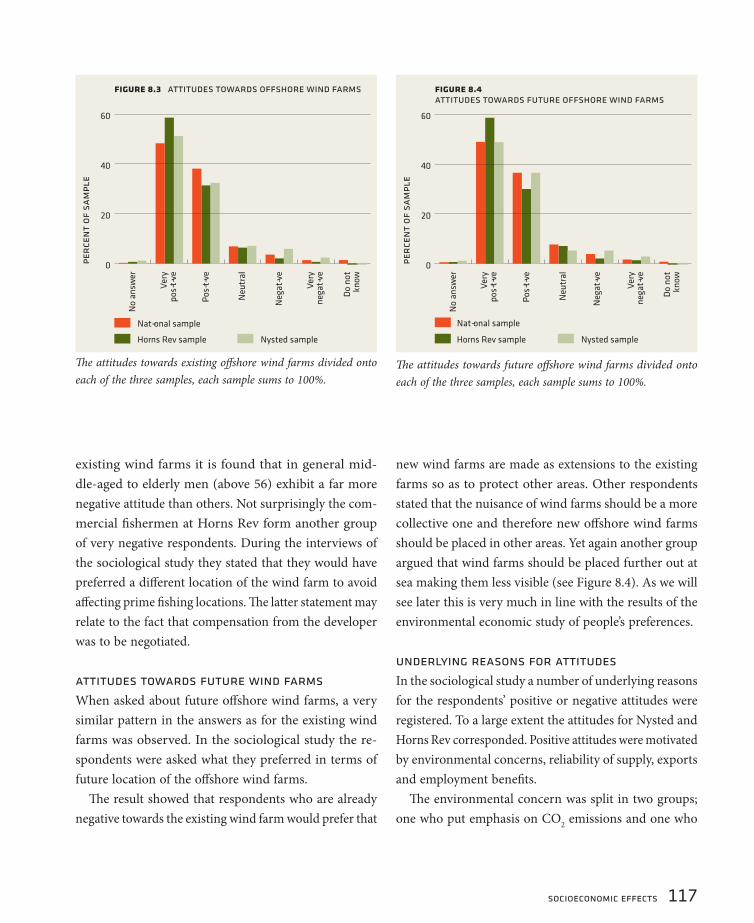
socioeconomic effects 117
existing wind farms it is found that in general mid-
dle-aged to elderly men (above 56) exhibit a far more
negative attitude than others. Not surprisingly the com-
mercial fi shermen at Horns Rev form another group
of very negative respondents. During the interviews of
the sociological study they stated that they would have
preferred a diff erent location of the wind farm to avoid
aff ecting prime fi shing locations. Th e latter statement may
relate to the fact that compensation from the developer
was to be negotiated.
attitudes towards future wind farms
When asked about future off shore wind farms, a very
similar pattern in the answers as for the existing wind
farms was observed. In the sociological study the re-
spondents were asked what they preferred in terms of
future location of the off shore wind farms.
Th e result showed that respondents who are already
negative towards the existing wind farm would prefer that
new wind farms are made as extensions to the existing
farms so as to protect other areas. Other respondents
stated that the nuisance of wind farms should be a more
collective one and therefore new off shore wind farms
should be placed in other areas. Yet again another group
argued that wind farms should be placed further out at
sea making them less visible (see Figure 8.4). As we will
see later this is very much in line with the results of the
environmental economic study of people’s preferences.
underlying reasons for attitudes
In the sociological study a number of underlying reasons
for the respondents’ positive or negative attitudes were
registered. To a large extent the attitudes for Nysted and
Horns Rev corresponded. Positive attitudes were motivated
by environmental concerns, reliability of supply, exports
and employment benefi ts.
Th e environmental concern was split in two groups;
one who put emphasis on CO2 emissions and one who
Th e attitudes towards existing off shore wind farms divided onto
each of the three samples, each sample sums to 100%.
Th e attitudes towards future off shore wind farms divided onto
each of the three samples, each sample sums to 100%.

118 socioeconomic effects
emphasised pollution by NOX and SO
2 as their main
concern. Th e argument of exports and employment were
stressed by almost all of the respondents with a positive
stance, and it was the general opinion among the posi-
tive group that the nuisance of a local facility could be
endured as long as it assured employment and a Danish
leading position within wind power.
Among the respondents who expressed a negative at-
titude two things were in focus. Firstly, visual intrusions
were a concern. Secondly, there was a concern that the
wind farms would have a negative impact on nature.
Th e loss of the undisturbed view of the coastline and
the ocean is mentioned by several of the respondents
as a major issue.
At both locations, respondents mentioned that they
were highly surprised with the decision to place a wind
farm in the area as they found that exactly this spot
contained outstanding natural values. Th is observation
points towards the fact that a decision made at a national
level, including the pros and cons, oft en will confl ict with
local preferences. One possible explanation is that experi-
ences with nature are closely connected to the individual
formation of identity.
In this way the authority’s management of landscapes
becomes management of identity. Th is could explain the
strong feelings and major protests that oft en arise when
governmental decisions are made concerning local nature/
identity. Another source of concern and negative attitude
was the light markers for air traffi c, which were seen as a
major aesthetic and landscape disturbing factor.
perception of impact on wildlife
As a follow-up question in the environmental economic
questionnaire, the respondents were asked to what extent
they perceived wind farms as a danger to birds and marine
animals. Th e answer to this is interesting as it gives a hint
of the informational level of the respondents and can be
related to the scientifi c studies on birds and marine life.
Th e prevailing attitude among both local and national
respondents is that the impact on birds and marine life is
neutral. However, between 22 and 29% of the respondents
in the three samples stated that they believed the wind
farm to have a negative or very negative eff ect on bird
life. In comparison, only 12 to 19% answered that wind
farms would have a negative or very negative eff ect on
underwater marine wildlife.
A rather large proportion of the respondents answered
“don’t know” when asked about their opinion on the wind
farms’ eff ect on marine wildlife (see Figure 8.5). Th is is
not surprising as the question requires prior knowledge
of the subject. It is interesting to note that respondents
in the two local samples have a signifi cantly lower per-
centage of “don’t knows” than the national sample. Th is
indicates that the local populations have (or think they
have) a much higher level of knowledge when it comes
to the eff ects of wind farms than is the case of the Danish
population as a whole.
Along the same lines it can be seen that the respond-
Respondents’ perception of the wind farms’ eff ect on the bird life
in the area, each sample sums to 100%.
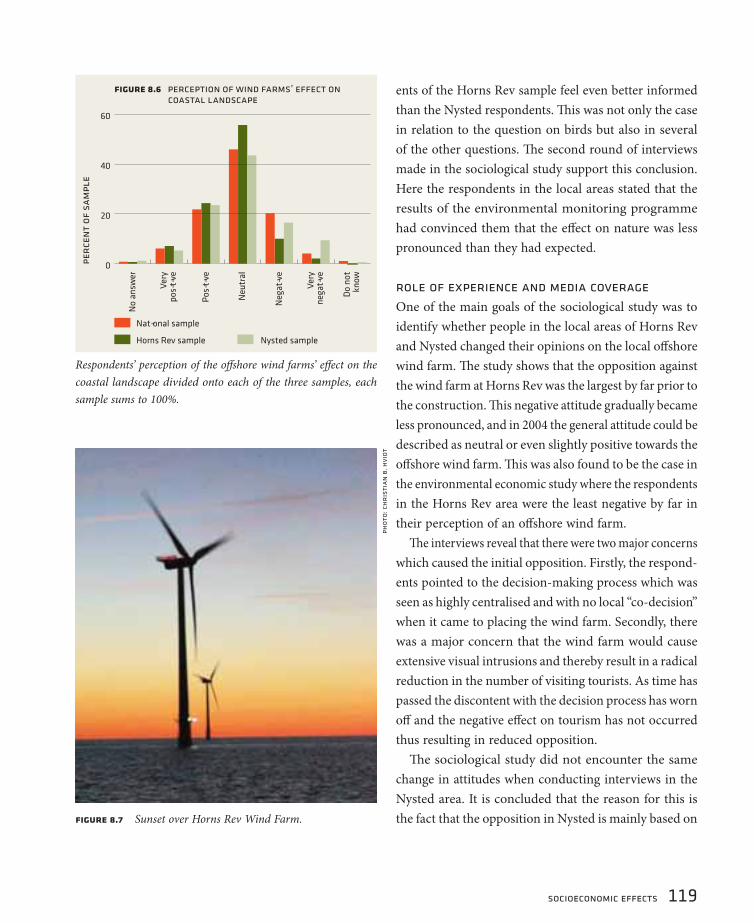
socioeconomic effects 119
ents of the Horns Rev sample feel even better informed
than the Nysted respondents. Th is was not only the case
in relation to the question on birds but also in several
of the other questions. Th e second round of interviews
made in the sociological study support this conclusion.
Here the respondents in the local areas stated that the
results of the environmental monitoring programme
had convinced them that the eff ect on nature was less
pronounced than they had expected.
role of experience and media coverage
One of the main goals of the sociological study was to
identify whether people in the local areas of Horns Rev
and Nysted changed their opinions on the local off shore
wind farm. Th e study shows that the opposition against
the wind farm at Horns Rev was the largest by far prior to
the construction. Th is negative attitude gradually became
less pronounced, and in 2004 the general attitude could be
described as neutral or even slightly positive towards the
off shore wind farm. Th is was also found to be the case in
the environmental economic study where the respondents
in the Horns Rev area were the least negative by far in
their perception of an off shore wind farm.
Th e interviews reveal that there were two major concerns
which caused the initial opposition. Firstly, the respond-
ents pointed to the decision-making process which was
seen as highly centralised and with no local “co-decision”
when it came to placing the wind farm. Secondly, there
was a major concern that the wind farm would cause
extensive visual intrusions and thereby result in a radical
reduction in the number of visiting tourists. As time has
passed the discontent with the decision process has worn
off and the negative eff ect on tourism has not occurred
thus resulting in reduced opposition.
Th e sociological study did not encounter the same
change in attitudes when conducting interviews in the
Nysted area. It is concluded that the reason for this is
the fact that the opposition in Nysted is mainly based on
Respondents’ perception of the off shore wind farms’ eff ect on the
coastal landscape divided onto each of the three samples, each
sample sums to 100%.
fi gure 8.7 Sunset over Horns Rev Wind Farm.
pho
to: c
hr
isti
an
b. h
vidt
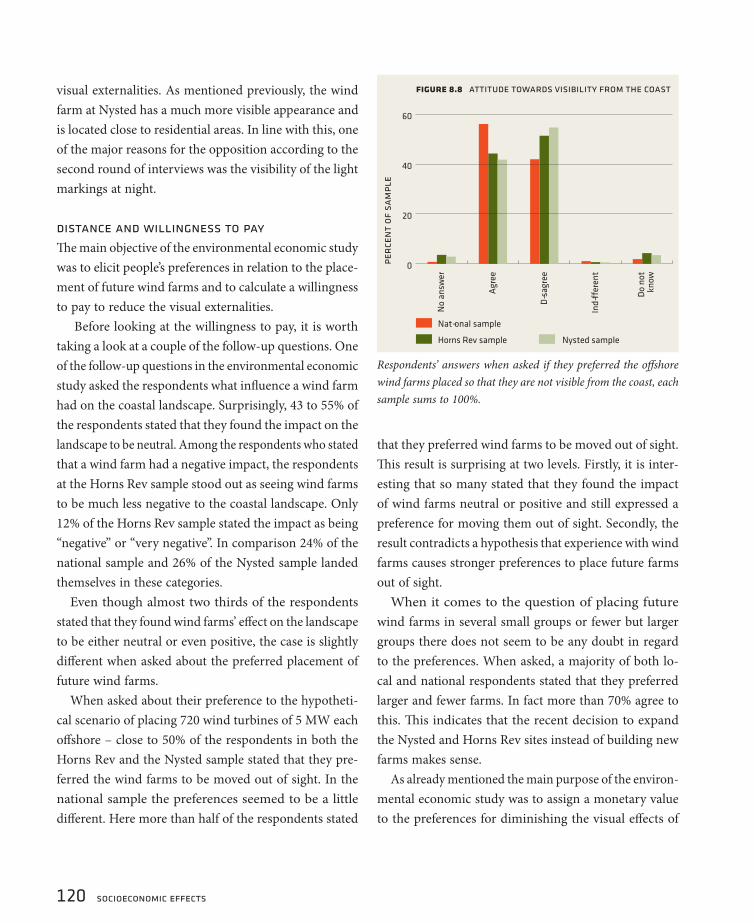
120 socioeconomic effects
visual externalities. As mentioned previously, the wind
farm at Nysted has a much more visible appearance and
is located close to residential areas. In line with this, one
of the major reasons for the opposition according to the
second round of interviews was the visibility of the light
markings at night.
distance and willingness to pay
Th e main objective of the environmental economic study
was to elicit people’s preferences in relation to the place-
ment of future wind farms and to calculate a willingness
to pay to reduce the visual externalities.
Before looking at the willingness to pay, it is worth
taking a look at a couple of the follow-up questions. One
of the follow-up questions in the environmental economic
study asked the respondents what infl uence a wind farm
had on the coastal landscape. Surprisingly, 43 to 55% of
the respondents stated that they found the impact on the
landscape to be neutral. Among the respondents who stated
that a wind farm had a negative impact, the respondents
at the Horns Rev sample stood out as seeing wind farms
to be much less negative to the coastal landscape. Only
12% of the Horns Rev sample stated the impact as being
“negative” or “very negative”. In comparison 24% of the
national sample and 26% of the Nysted sample landed
themselves in these categories.
Even though almost two thirds of the respondents
stated that they found wind farms’ eff ect on the landscape
to be either neutral or even positive, the case is slightly
diff erent when asked about the preferred placement of
future wind farms.
When asked about their preference to the hypotheti-
cal scenario of placing 720 wind turbines of 5 MW each
off shore – close to 50% of the respondents in both the
Horns Rev and the Nysted sample stated that they pre-
ferred the wind farms to be moved out of sight. In the
national sample the preferences seemed to be a little
diff erent. Here more than half of the respondents stated
that they preferred wind farms to be moved out of sight.
Th is result is surprising at two levels. Firstly, it is inter-
esting that so many stated that they found the impact
of wind farms neutral or positive and still expressed a
preference for moving them out of sight. Secondly, the
result contradicts a hypothesis that experience with wind
farms causes stronger preferences to place future farms
out of sight.
When it comes to the question of placing future
wind farms in several small groups or fewer but larger
groups there does not seem to be any doubt in regard
to the preferences. When asked, a majority of both lo-
cal and national respondents stated that they preferred
larger and fewer farms. In fact more than 70% agree to
this. Th is indicates that the recent decision to expand
the Nysted and Horns Rev sites instead of building new
farms makes sense.
As already mentioned the main purpose of the environ-
mental economic study was to assign a monetary value
to the preferences for diminishing the visual eff ects of
Respondents’ answers when asked if they preferred the off shore
wind farms placed so that they are not visible from the coast, each
sample sums to 100%.

socioeconomic effects 121
wind farms. Even though the follow-up questions reveal
that far from all respondents found that wind farms had
a negative eff ect on the landscape, a substantial willing-
ness to pay to place wind farms more than 8 km from
the shore was found.
the national sample
Taking the national sample as the “standard” case, the
results show the following pattern: Willingness to pay
(WTP) to extend the distance from 8 to 12 km is 332
DKK/household/year. WTP increases by more than
100% to extend the distance from 12 to 18 km where the
visual intrusions are signifi cantly reduced, and by approx
30% to have the distance extended from 18 to 50 km, ie
virtually out of sight.
In other words, there is a signifi cant willingness to
pay to have wind farms located at distances where the
visual intrusions are fairly modest, ie up to 18 km from
the shore. Th ere are not equally strong preferences – in
terms of willingness to pay – to have wind farms moved
further out to a distance of 50 km where they are virtually
invisible from the shore.
the local samples
Taking the two local samples, the results show a some-
what diff erent WTP pattern. In the Horns Rev sample,
respondents are willing to pay (only) 261 DKK/house-
hold/year to have the distance extended from 8 to 12 km.
WTP increased by close to 150% to have the distance
extended from 12 to 18 km, but surprisingly there is no
extra WTP to have wind farms moved from 18 to 50 km
from the shore. (Th e diff erence in the drop in WTP from
643 DKK to 591 DKK when going from 18 to 50 km is
not statistically signifi cant).
In the Nysted area, respondents are willing to pay
nearly twice as much as in the national sample to have
the distance of wind farms extended from 8 to 12 km
from the shore. WTP for extending the distance to 18
km is not much higher than WTP for 12 km, but WTP
increases by more than 160% for locating wind farms out
of sight, ie at a distance equal to 50 km from the shore.
It seems obvious to seek the explanation to these WTP
patterns in the diff erent experience with off shore wind
farms for the people in the two areas. Th e Horns Rev
Off shore Wind Farm is located at a distance of 14 km
from the coast. Th at is, at a distance where the visual
intrusions are signifi cantly reduced. Th e Nysted Off shore
Wind Farm, on the other hand, is located at a distance of
only 10 km from the shore. Furthermore, the visibility at
Nysted is assumed to be better than at Horns Rev. Th is
means that the visual intrusions are rather signifi cant.
As noted previously, the Nysted sample did not have
a much greater share of respondents expressing negative
attitudes towards wind farms. However, when focussing
on respondents expressing preferences to move wind
farms out of sight, this subgroup had considerably stronger
preferences for this alternative in the Nysted sample
than the similar subgroups in the two other samples.
As discussed earlier the sociological investigation in the
Willingness to pay (WTP) to place wind farms at distances larger
than 8 km from the shore.
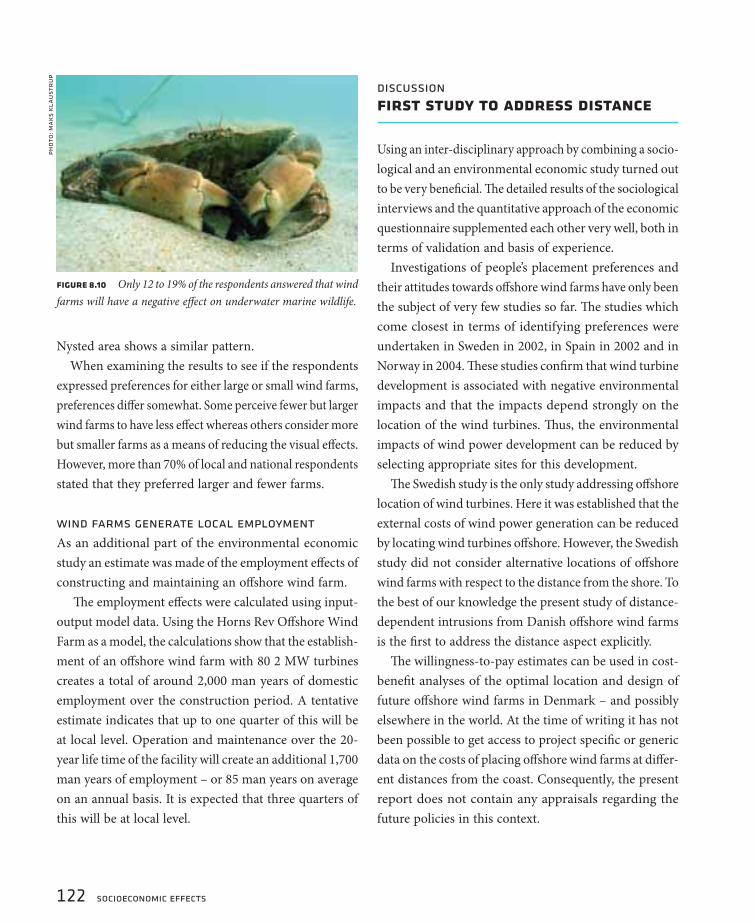
122 socioeconomic effects
Nysted area shows a similar pattern.
When examining the results to see if the respondents
expressed preferences for either large or small wind farms,
preferences diff er somewhat. Some perceive fewer but larger
wind farms to have less eff ect whereas others consider more
but smaller farms as a means of reducing the visual eff ects.
However, more than 70% of local and national respondents
stated that they preferred larger and fewer farms.
wind farms generate local employment
As an additional part of the environmental economic
study an estimate was made of the employment eff ects of
constructing and maintaining an off shore wind farm.
Th e employment eff ects were calculated using input-
output model data. Using the Horns Rev Off shore Wind
Farm as a model, the calculations show that the establish-
ment of an off shore wind farm with 80 2 MW turbines
creates a total of around 2,000 man years of domestic
employment over the construction period. A tentative
estimate indicates that up to one quarter of this will be
at local level. Operation and maintenance over the 20-
year life time of the facility will create an additional 1,700
man years of employment – or 85 man years on average
on an annual basis. It is expected that three quarters of
this will be at local level.
discussionfi rst study to address distance
Using an inter-disciplinary approach by combining a socio-
logical and an environmental economic study turned out
to be very benefi cial. Th e detailed results of the sociological
interviews and the quantitative approach of the economic
questionnaire supplemented each other very well, both in
terms of validation and basis of experience.
Investigations of people’s placement preferences and
their attitudes towards off shore wind farms have only been
the subject of very few studies so far. Th e studies which
come closest in terms of identifying preferences were
undertaken in Sweden in 2002, in Spain in 2002 and in
Norway in 2004. Th ese studies confi rm that wind turbine
development is associated with negative environmental
impacts and that the impacts depend strongly on the
location of the wind turbines. Th us, the environmental
impacts of wind power development can be reduced by
selecting appropriate sites for this development.
Th e Swedish study is the only study addressing off shore
location of wind turbines. Here it was established that the
external costs of wind power generation can be reduced
by locating wind turbines off shore. However, the Swedish
study did not consider alternative locations of off shore
wind farms with respect to the distance from the shore. To
the best of our knowledge the present study of distance-
dependent intrusions from Danish off shore wind farms
is the fi rst to address the distance aspect explicitly.
Th e willingness-to-pay estimates can be used in cost-
benefi t analyses of the optimal location and design of
future off shore wind farms in Denmark – and possibly
elsewhere in the world. At the time of writing it has not
been possible to get access to project specifi c or generic
data on the costs of placing off shore wind farms at diff er-
ent distances from the coast. Consequently, the present
report does not contain any appraisals regarding the
future policies in this context.
fi gure 8.10 Only 12 to 19% of the respondents answered that wind
farms will have a negative eff ect on underwater marine wildlife.
pho
to: m
ak
s k
lau
str
up

socioeconomic effects 123
IAPEME was pleased to see the results of this survey of public
attitudes, as we had suggested that this work should be carried
out as part of the overall monitoring programme. The survey used
standard methods of questioning the public but also developed
a novel quantitative assessment of the willingness of people
to pay for a reduced visual impact of the development. Many
of the fi ndings confi rm attitudes that had been anticipated,
and it is interesting to see in particular the willingness of local
people to pay for lower visual intrusiveness of adjacent offshore
wind farm developments. It is also clear that local opinions
vary somewhat between communities; in this case the views
of residents near the Nysted Offshore Wind Farm were more
negative than those of a nationwide sample, whereas those of
residents near the Horns Rev Offshore Wind Farm were more
positive than the national sample. It is important to be aware
of these local variations.
A strong local public attitude appears also to be seen in many
other countries, where land-based or nearshore wind farms can
be highly unpopular with local communities. In many countries
there is frequent local opposition to planning applications for
wind farms, despite the general view among objectors that
wind farms should be developed (somewhere else) as a means
of reducing CO2 emissions. In qualitative terms this is simply a
“not in my back yard” attitude. The economic assessment of
the willingness-to-pay for removal of the development to an
acceptable distance represents an elegant step from qualitative
to quantitative. These estimates also have the potential to be
used in cost-benefi t analyses of optimal locations and designs
of offshore wind farms.
Most opposition to offshore wind farms in Denmark appears
to be related to local visual impact, although there have been
concerns about possible environmental impacts raised particularly
by fi shermen and ornithologists. It would be interesting to see
whether public attitudes to offshore wind farms will become
more positive in the light of evidence from studies at Horns Rev
and Nysted, such as summarized in this book, indicating little
or no adverse effects on the environment at these sites.
IAPEME viewpoints

124 planning
The promotion of wind energy has been part of Danish energy strategies for
decades. The contract for the establishment of two new offshore wind farms
have been awarded in 2005 and 2006 and Denmark is currently working on
a new plan for siting of the next possible generation of offshore wind farms
from 2010 to 2025.
The right to exploit wind energy within Danish waters belongs to the State and
permission to conduct preliminary studies and to exploit wind energy at sea is
granted by the Danish Energy Authority.
Offshore wind farm projects may only be carried out on the basis of a detailed
Environmental Impact Assessment (EIA) and after the general public, the
authorities and organisations concerned have had an opportunity to express
their opinions. Once the EIA procedure has been completed, and the deadline
for appeal has expired, the Danish Energy Authority grants the fi nal approval.
planningpolicy, planning, participation and permission
9
by steffen nielsen, danish energy authority
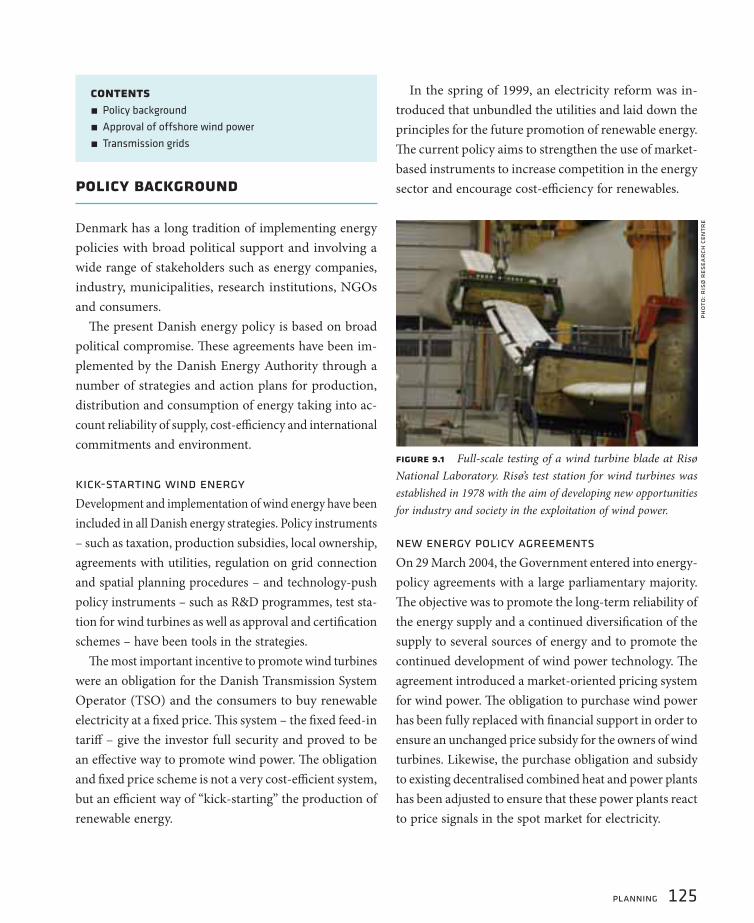
planning 125
policy background
Denmark has a long tradition of implementing energy
policies with broad political support and involving a
wide range of stakeholders such as energy companies,
industry, municipalities, research institutions, NGOs
and consumers.
Th e present Danish energy policy is based on broad
political compromise. Th ese agreements have been im-
plemented by the Danish Energy Authority through a
number of strategies and action plans for production,
distribution and consumption of energy taking into ac-
count reliability of supply, cost-effi ciency and international
commitments and environment.
kick-starting wind energy
Development and implementation of wind energy have been
included in all Danish energy strategies. Policy instruments
– such as taxation, production subsidies, local ownership,
agreements with utilities, regulation on grid connection
and spatial planning procedures – and technology-push
policy instruments – such as R&D programmes, test sta-
tion for wind turbines as well as approval and certifi cation
schemes – have been tools in the strategies.
Th e most important incentive to promote wind turbines
were an obligation for the Danish Transmission System
Operator (TSO) and the consumers to buy renewable
electricity at a fi xed price. Th is system – the fi xed feed-in
tariff – give the investor full security and proved to be
an eff ective way to promote wind power. Th e obligation
and fi xed price scheme is not a very cost-effi cient system,
but an effi cient way of “kick-starting” the production of
renewable energy.
In the spring of 1999, an electricity reform was in-
troduced that unbundled the utilities and laid down the
principles for the future promotion of renewable energy.
Th e current policy aims to strengthen the use of market-
based instruments to increase competition in the energy
sector and encourage cost-effi ciency for renewables.
new energy policy agreements
On 29 March 2004, the Government entered into energy-
policy agreements with a large parliamentary majority.
Th e objective was to promote the long-term reliability of
the energy supply and a continued diversifi cation of the
supply to several sources of energy and to promote the
continued development of wind power technology. Th e
agreement introduced a market-oriented pricing system
for wind power. Th e obligation to purchase wind power
has been fully replaced with fi nancial support in order to
ensure an unchanged price subsidy for the owners of wind
turbines. Likewise, the purchase obligation and subsidy
to existing decentralised combined heat and power plants
has been adjusted to ensure that these power plants react
to price signals in the spot market for electricity.
contentsPolicy background
Approval of offshore wind power
Transmission grids
<
<
<
fi gure 9.1 Full-scale testing of a wind turbine blade at Risø
National Laboratory. Risø’s test station for wind turbines was
established in 1978 with the aim of developing new opportunities
for industry and society in the exploitation of wind power.
pho
to: r
isø
res
ear
ch c
entr
e

126 planning
Among others things the parties agreed on a second
re-powering scheme for the replacement of onshore wind
turbines at unfavourable locations with new wind turbines
in better locations, increased research and development
and demonstration of advanced energy technologies
as well as the future expansion of Denmark’s off shore
wind farms. Th e basis for the installation of two new
off shore wind farms of 200 MW each was made. Th e
two new farms will be capable of supplying electricity to
350,000–400,000 households, equivalent to approx 4% of
the total Danish electricity consumption.
horns rev 2 and rødsand 2
Aft er the screening of potential sites the Danish Energy
Authority called for tenders for two off shore wind farms,
one at Horns Rev 2 and one at Rødsand 2 in the summer
and autumn of 2004. Th e winners of the tender processes
are given the right to undertake preliminary studies,
establish a production facility and exploit off shore wind
energy; however, the successful tenderer must adhere
to the same planning process as applies to all off shore
wind power projects, including environmental impact
assessment (EIA) procedures.
In June 2005, DONG Energy, who had submitted the
tender with the lowest feed-in price, was chosen as the
winner of the tender for a 200 MW off shore wind farm
at Horns Rev 2. Th e price has been set at approx EUR
0.069/kWh fi xed for 50,000 full-load hours, which cor-
responds to approx twelve years’ electricity production.
Th e farm will be put into operation in 2009. Th e off shore
wind farm is to be located about 10 km northwest of
the existing wind farm at Horns Rev and will cover a
total area of about 35 km2. Energinet.dk is responsible
for extending the electricity grid to the wind farm. It is
estimated that the off shore wind farm at Horns Rev 2
will be able to supply approx 200,000 households with
electricity annually, corresponding to approx 2% of the
Danish electricity consumption. Th e EIA was published
for public consultation in October 2006.
A consortium consisting of DONG Energy and E.ON
Sweden was appointed the winner of the tender at Rød-
sand on 6 April 2006. Th e tender submitted off ered the
lowest kWh price of approx EUR 0.066/kWh fi xed for
50,000 full-load hours. Th is is equivalent to approx 14
years electricity production. Th e off shore wind farm at
Rødsand will supply 200,000 households annually, which
corresponds to approx 2% of the total Danish electricity
consumption. Th e off shore wind farm will be situated
three km west of the existing wind farm at Rødsand. It
has been agreed to commission the wind farm in 2010.
Energinet.dk is responsible for extending the electricity
grid to the wind farm in cooperation with SEAS Trans-
mission. Th e next step for the consortium will be to carry
out preliminary studies and to prepare an EIA in order
research, development and technical approvalDenmark currently has a wide range of unique techno-
logical development environments in the wind power
industry that combined with government-subsidised
research environments give rise to optimistic expecta-
tions for further economic growth. This applies both
to large wind turbine manufacturers and to Danish
research institutions and universities. Danish wind
power – onshore and offshore – provides valuable
data and experience for the further development of
the technology and energy supply solutions as well
as export opportunities.
Currently an effort is made to fi nd new suitable
locations for test turbines onshore and offshore. A
test site at Høvsøre on the northwestern coast of
Jutland has given manufacturers the opportunity
to lease test stands in order to test new prototypes
for short periods since 2004. The test site consists
of fi ve test stands allowing turbines with heights of
up to 165 m and a capacity of 5 MW each.

planning 127
to clarify all impacts on nature and the environment. Th e
EIA will be subject to a public consultation.
assessments of future offshore expansions
If oil prices are high and international climate objectives
result in higher CO2 allowance prices, both wind energy
and biomass will become competitive and the amount of
renewable energy produced could increase signifi cantly.
Under such conditions wind power may be able to cover
more than 50% of the Danish electricity consumption in
2025 out of which most is envisaged to be off shore.
As a follow-up to the Energy Strategy 2025, the Gov-
ernment has decided that the Action Plan on Off shore
Wind Power from 1997 is to be updated by a committee.
Th e objective is to carry out an assessment of where future
expansions of off shore wind power can take place.
Th e committee will also consider possibilities for grid
connection of even larger off shore wind farms and new
technological possibilities for establishing wind turbines
in deeper water. Th e possible introduction of off shore
wind turbines in relation to other interests such as en-
vironmental protection, navigation, military, fi shery and
visual consequences, etc, are to be assessed. In order to
maintain and further develop peak competencies in the
wind power sector in Denmark, the committee will also
assess where it might be possible to locate off shore test
sites for wind turbines.
Th us in December 2005 the Danish Energy Authority
started the work on a new plan addressing the issue of
placing the next generation of off shore wind farms from
2010 to 2025. Th e process builds on the Action Plan from
1997 as well as on experience from the Horns Rev and
fi gure 9.2 In 2004 a large majority in the Danish Parliament agreed on a new energy policy including expansion of off shore wind farms.
pho
to: f
olk
etin
get

128 planning
Nysted demonstration off shore wind farms and on the
results of the screenings carried out in relation to the
two upcoming 200 MW wind farms.
approval of offshore wind power
Th e conditions for off shore farms are laid down in the
Danish Electricity Supply Act adopted by Parliament in
May 1999 as a result of the liberalisation of the Danish
electricity sector. It provides that the right to exploit energy
from water and wind within the territorial waters and
the exclusive economic zone (up to 200 nautical miles)
around Denmark belongs to the Danish State.
Th e act also lays down the procedures for the approval
of electricity production from water and wind and pre-
investigation of this within the national territorial waters
and within the economic zone belonging to Denmark.
Permission will be given for a specifi c area, and if a
project is expected to have an environmental impact an
EIA must be carried out.
open-door procedure
According to the provisions of the Electricity Supply
Act regarding electricity generating installations at sea,
permission for preliminary studies and for exploitation
of wind energy at sea may only be given either aft er
applications have been requested in connection with a
call for tenders or aft er an application has been made
public and other interested parties have been given the
opportunity to apply.
Th e latter procedure is known as an open-door procedure,
since applicants may seek authorisation at any time to
carry out preliminary studies, establish installations and
exploit wind energy. On the basis of a specifi c application
and according to objective criteria, the Danish Energy
Authority may decide that expansion is to be carried out
in a given area as requested. Other interests in the marine
area concerned will be taken into consideration when
the decision is made as to whether the area in question
is to be expanded.
If the Danish Energy Authority decides that no major
societal interests are compromised by the expansion of
an off shore wind farm, it has the authority to invite other
interested parties to apply to develop a given project,
thus ensuring competition regarding the conditions. Th e
Danish Energy Authority has not, however, yet carried
out an open-door procedure for off shore wind farms. A
new amendment to the Electricity Supply Act from the
spring of 2006 exempts test turbines from the open-door
procedure/tendering provision.
Th e procedure for establishing off shore wind farms
has been gradually developed as experience has been
gained during the fi rst eight Danish off shore wind power
projects. Th e Danish Energy Authority functions as a one
EIA reportThe rules governing EIA reports are described in
Executive Order no. 815 of 28 August 2000 on as-
sessment of the environmental impact of offshore
electricity producing installations. Any party applying
to establish an offshore wind farm must prepare an
environmental report in order to ensure;
that the environmental conditions within the de-
fi ned installation are described,
that impact and reference areas are studied and
described,
that all known environmental impacts in connec-
tion with the establishment and operation of the
wind turbine installation have been previously
considered and assessed, and
that the authorities and the general public have a
basis for assessing and making a decision regard-
ing the project.
<
<
<
<
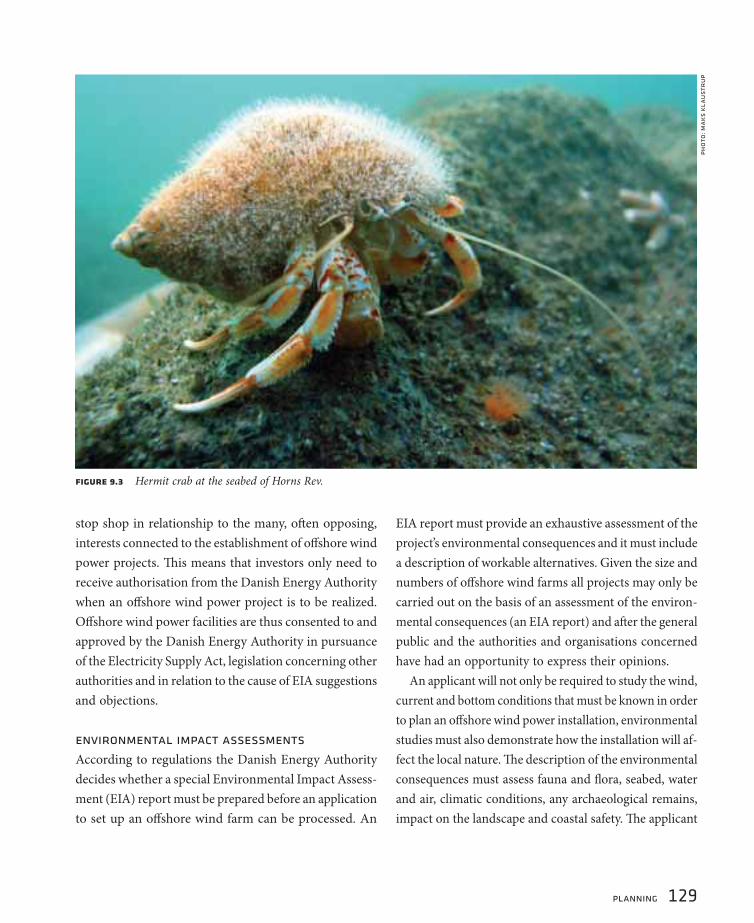
planning 129
pho
to: m
ak
s k
lau
str
up
fi gure 9.3 Hermit crab at the seabed of Horns Rev.
stop shop in relationship to the many, oft en opposing,
interests connected to the establishment of off shore wind
power projects. Th is means that investors only need to
receive authorisation from the Danish Energy Authority
when an off shore wind power project is to be realized.
Off shore wind power facilities are thus consented to and
approved by the Danish Energy Authority in pursuance
of the Electricity Supply Act, legislation concerning other
authorities and in relation to the cause of EIA suggestions
and objections.
environmental impact assessments
According to regulations the Danish Energy Authority
decides whether a special Environmental Impact Assess-
ment (EIA) report must be prepared before an application
to set up an off shore wind farm can be processed. An
EIA report must provide an exhaustive assessment of the
project’s environmental consequences and it must include
a description of workable alternatives. Given the size and
numbers of off shore wind farms all projects may only be
carried out on the basis of an assessment of the environ-
mental consequences (an EIA report) and aft er the general
public and the authorities and organisations concerned
have had an opportunity to express their opinions.
An applicant will not only be required to study the wind,
current and bottom conditions that must be known in order
to plan an off shore wind power installation, environmental
studies must also demonstrate how the installation will af-
fect the local nature. Th e description of the environmental
consequences must assess fauna and fl ora, seabed, water
and air, climatic conditions, any archaeological remains,
impact on the landscape and coastal safety. Th e applicant
130 planning
must also demonstrate how any damaging environmental
impacts can be reduced or neutralised.
important involvement of the public
According to the Danish Electricity Supply Act the es-
tablishment of off shore wind farms requires a permit as
well as a license for the operation. Th e twofold approval
process includes permission for preliminary surveys and
later a fi nal approval of the project – a building permit.
Both of these permissions depend upon a process of
public consultation in order to take into account the dif-
ferent interests. In relation to the last issue the applicant
is called upon to do an EIA.
When, on the basis of these preliminary studies, an
application (including an EIA report) has been submitted
regarding an off shore wind power project, the Danish
Energy Authority present this material for public con-
sultation with a deadline of at least eight weeks.
Experience gained during the fi rst EIA procedures for
off shore wind farms has shown that the authorities concerned,
interest organisations and citizens all use of the public
consultation of EIA reports in order to present comments
that contribute to the fi nal defi nition of the projects.
Once the EIA procedure has been completed, the Dan-
ish Energy Authority prepares the fi nal authorisation for
the establishment of the off shore wind farm in question.
Th is is done according to detailed conditions that refl ect
both the conclusions of the EIA report and consultation
responses from the general public and the authorities
concerned. Public consultation of the EIA report is an
open and fl exible process that makes it possible for the
Danish Energy Authority to clarify and prioritise the
various – and oft en opposing – interests associated with
the establishment of an off shore wind farm.
authorisation is made public
Th e authorisation issued by the Danish Energy Authority
is made public. Any party with a justifi ed and individual
interest in the decision has the right to register a complaint
with the Energy Appeal Board regarding the decision’s
environmental aspects. Th e authorisation may not be
acted upon before the appeal deadline has expired. Once
authorised to carry out a project, the developer must
provide the Danish Energy Authority with documentation
proving how the conditions in the permit issued will be
fulfi lled. Th is must be done in the form of a detailed project
description of the construction/installation works. Th e
developer may not begin to construct the off shore wind
farm until the Danish Energy Authority has determined
that the documentation submitted is suffi cient.
When an installation is ready to produce electricity
for the grid, the holder of the authorisation for the es-
tablishment applies to the Danish Energy Authority for a
permit to exploit the wind energy. Electricity production
may not begin before such a permit has been issued.
Th e issuing of the permit to produce electricity is given
upon documentation that all conditions in the permit
issued have either been fulfi lled or how fulfi lment will
be achieved.
In addition, the developer must also obtain a licence
to produce electricity if the overall project has a capac-
ity of more than 25 MW and if the developer does not
already hold such a licence.
transmission grids
Large off shore wind farms are usually located far from
major centres of consumption and are connected to
the transmission grid in sparsely populated areas. Th e
transmission grid must therefore be able to transport the
power from the off shore wind farms over long distances.
Up to the present time, it has basically been suffi cient
to use the existing transmission grid, originally built to
transport power in the opposite direction, from central-
ised power plants to consumers. It has therefore been
possible to grid connect the fi rst off shore wind farms
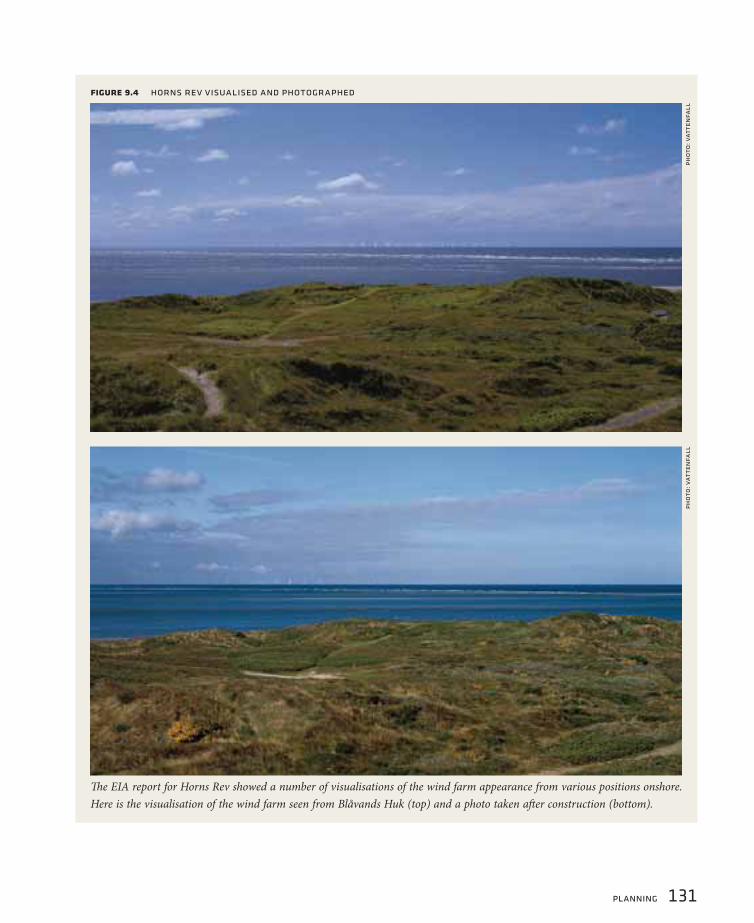
planning 131
fi gure 9.4 horns rev visualised and photographed
Th e EIA report for Horns Rev showed a number of visualisations of the wind farm appearance from various positions onshore.
Here is the visualisation of the wind farm seen from Blåvands Huk (top) and a photo taken aft er construction (bottom).
pho
to: v
atte
nfa
llph
oto
: vat
ten
fall

132 planning
at Horns Rev and Nysted without major investments in
grid reinforcement.
Th e two large off shore wind farms at Horns Rev and
Nysted are technically prepared to provide various system
services ie requirements of control capabilities, the output
of reactive power, the ability to remain operational and to
continue production when there is a grid outage, gradient
limitation and the contents of operation agreements.
bottlenecks in the transmission grid
It is envisaged that bottlenecks will be created if the
transmission grid is not reinforced when the Horns Rev 2
and Rødsand 2 off shore wind farms are grid connected in
these areas by 2009/2010. Such bottlenecks can limit the
possibilities for fully exploiting wind power. Depending
on the location, it is therefore to be expected that future
Danish wind power expansions will necessitate a cor-
responding expansion of the transmission grid if it is to
make full use of the wind power.
Th e Transmission System Operator (TSO), Energinet.dk,
has been entrusted with the responsibility of the long-
term general planning of the Danish electricity system.
Th e investments in transmission lines have service lives of
30–40 years so it is important that the system responsibility
can be planned from a very long-term perspective.
So far – within the framework for the existing and planned
large scale off shore wind farms – the TSO assumes all costs
for bringing the electricity production ashore whereas the
owner is to fi nance the internal grid of the off shore wind
farm up to the off shore transformer platform.
In addition – and this applies to the two upcoming
wind farms Horns Rev 2 and Rødsand 2 – the investors
receive a sales guarantee so that they will be paid for the
production they could have made but which the TSO is
not able to handle in a given situation. Th ese terms enable
the TSO to weigh the costs of grid reinforcement to handle
extreme situations against the costs of compensating the
wind farm owners.
fi gure 9.5 Transformer station at the Nysted Off shore Wind Farm.
pho
to: n
yste
d o
ffsh
or
e w
ind
fa
rm

planning 133
wind power economics
The economy of wind power operation depends partly on the
total amount of electricity produced by the wind turbines and
partly on the feed-in price and on installation and operating
costs. Wind turbines generally feature high investment costs
but have no fuel costs. Hence, the production costs are highly
dependent on the investment costs and their fi nancing.
investment costsFor onshore wind turbines, investment costs, including fi nanc-
ing, typically account for 75–85% of the production costs while
operational costs account for the remainder. For offshore wind
turbines, investment costs make up 70% of the production
costs and operational costs are somewhat higher than for
onshore turbines, primarily because the load on wind turbines
at sea is greater and maintenance is therefore more costly and
more complicated.
In addition to the actual cost of the wind turbine itself,
investment costs relate to the construction of the founda-
tion, the internal collection grid, planning, etc. For offshore
wind turbines, grid connection and the foundations generally
account for a relatively higher percentage of the costs than
for wind turbines onshore where the cost of the wind turbine
itself accounts for considerably more than half of the total
costs involved.
annual productionAnnual production is often declared as corresponding to a
number of full-load hours. A full-load hour is an hour in which
a wind turbine produces at full capacity. An annual number
of full-load hours is the time it will take a given wind turbine
to yield its annual production if it is able to produce with its
installed capacity all of the time.
At sea, an annual production of approx 4000 full-load hours
can be expected in the best areas in terms of wind, such as
in the North Sea at Horns Rev. For a 2 MW wind turbine, this
corresponds to the electricity consumed by approx 2000 single-
family households. In the inner Danish waters, such as at
Nysted-Rødsand, the estimate is approx 3500 full-load hours.
For a single 2.3 MW wind turbine at the Nysted Offshore Wind
Farm, this corresponds to the electricity consumed by approx
1900 single-family households. In comparison, the corresponding
production from wind turbines onshore varies between approx
1500 full-load hours and approx 3000 full-load hours at the best
locations which, in Denmark, are on coasts facing westward.
production costsThe production cost for wind generated electricity per kWh has
decreased rapidly over the last two decades and the trend is
that in a few years the production from large size turbines will
be able to compete on equal terms with electricity production
from conventional power stations. Consequently, the consumer
price for wind generated electricity approaches the level of other
electricity prices. For long periods of time, the difference has
been as little as 0.03 DKK/kWh.
availabilityThe technical availability of new on onshore wind turbines in
Denmark is usually in the range of 98–100%. Offshore the avail-
ability of the small nearshore farms is also high, but in 2004
the availability for Horns Rev was low due to a comprehensive
repair of the gears and transformers on all the Vestas turbines.
However, in 2005 all turbines operated nearly 100% with an
availability of 95%, where as the Siemens (Bonus) turbines at
Nysted reached 97%.
life-cycle outputA life-cycle analysis is a relevant tool to assess the net energy
output from a wind turbine throughout its entire life. As an
example, with an expected electricity production output of
approx 12,000 MWh per year for a 3 MW offshore wind turbine,
the wind turbine will generate the equivalent amount of energy
needed for manufacture, transport and operation of the wind
turbine in approx eight months.

134 references
2: introduction
towards a common sustainable energy future
CIRCA:
forum.europa.eu.int/public/irc/env/Home/main
Concerted action for Off shore wind energy Deployment (COD):
See www.off shorewindenergy.org/index_cod.php
Copenhagen Strategy: www.ens.dk/sw14310.asp
OSPAR: www.environmentalexchange.info
3: horns rev and nysted
152 wind turbines at sea – 325 mw capacity
Betke, K. 2006. Measurement of underwater noise emit-
ted by an off shore wind turbine at Horns Rev. Report
from ITAP – Institute für technische und angewandte
Physik GmbH.
Ingemansson Technology AB, 2003. Utgrunden off -shore
wind farm. Measurements of underwater noise. June
2003.
4: infauna, epifauna and vegetation
change in diversity and higher biomass
Birklund, J. 2006. Surveys of the Benthic Communities
in Nysted Off shore Wind Farm in 2005 and Changes
in the Communities since 1999 and 2001. Commis-
sioned by Energi E2.
Birklund, J. 2006. Th e Hard Bottom Communities on Founda-
tions in Nysted Off shore Wind Farm and Schönheiders
Pulle in 2005 and Development of the Communities
in 2003–2005. Commissioned by Energi E2.
Jensen, A.C., Collins, K.J. and Lockwood, A.P.M. (Eds.).
2000. Artifi cial Reefs in European Seas. Kluwer Aca-
demic Publishers. Dordrecht.
Leonhard, S.B. and Birklund J. 2006. Benthic Communities
and Off shore Wind Farms. Experiences from Horns
Rev and Nysted Off shore Wind Farms. Reviewing
and Concluding Summary Report. Commissioned
by Vattenfall and Energy E2.
Leonhard, S.B. and Pedersen, P. 2006. Benthic Communities
at Horns Rev Before, During and Aft er Construction
of Horns Rev Off shore Wind Farm. Commissioned
by Vattenfall.
5: fi sh
few effects on the fi sh communities so far
Jensen, A., K. Collins and P. Lockwood (Eds.). 2000. Arti-
fi cial Reefs in European Seas. Dordrecht: 1–508.
Einbinder, S., Perelberg, A., Ben-Shaprut, O., Fouchart, M.H.
and Shashar, N. 2006. Eff ects of artifi cial reefs on fi sh
grazing in their vicinity: evidence from algae presenta-
tion experiments. Mar Envir Res 61:110–119
Greenstreet, S.P.R., Armstrong, E., Mosegaard, H., Jensen,
H., Gibb, I.M., Fraser, H.M., Scott, B.E., Holland, G.J.
and Sharples, J. 2006. Variation in the abundance of
sandeels Ammodytes Marinus off southeast Scotland:
an evaluation of area-closure fi sheries management and
stock abundance assessment methods. ICES Journal
of Marine Science 63: 1530–1550.
referencesTh e Background reports of the environmental monitoring
programme can be downloaded from
www.ens.dk/off shorewind

references 135
Grossman, G.D., Jones, G.P. and Seaman, W.J. 1997. Do
artifi cial reefs increase regional fi sh production? A
review of existing data. Fisheries 22:17–23
Kalmijn, A.J. 2000. Detection and processing of electro-
magnetic and nearfi eld acoustic signals in elasmobrach
fi shes. Phil. Trans. Royal. Soc. B 355:1135–1141
Karlsson, L. 1985. Behavioural responses of European com-
mon eels (Anguilla anguilla) to the geomagnetic fi eld.
Helgoländer Meeresuntersuchungen, 39: 71–81.
Løkkeborg, S., Humborstad,O-B, Jørgensen, T. and Soldal,
A.V. 2002. Spatio-temporal variations in gillnet catch
rates in the vicinity of North Sea oil platforms. ICES
Journal of Marine Science, 59: 294–299.
Magill, S.H and Sayer, M.D.J. 2002. Seasonal and in-
terannual variation in fi sh assemblages of northern
temperate rocky subtidal habitats. Journal of fi sh
biology. 61: 1198–1216.
Powers, S.P., Grabowski, J.H., Peterson, C.H. and Lindberg,
W.J. 2003. Estimating enhancement of fi sh production
by off shore artifi cial reefs: uncertainty exhibited by di-
vergent scenarios. Mar Ecol Prog Ser 264:265–277
Relini, G., Relini, G., Torchia, G. and De Angelis, G. 2002.
Trophic relationships between fi shes and an artifi cial
reef. ICES J Mar Sci 59:S36–S42
Soldal, A.V., Svelling, S., Jørgensen, T. and Løkkeborg, S.
2002. Rigs-to reefs in the North Sea: Hydroacoustic
quantifi cation of fi sh in the vicinity of a ”Semi-
Cold” platform. ICES Journal of Marine Science, 59:
281–287.
Sjöberg, N.B. and Petersson, E. 2005. Blankålsmärkning
– Til for at hjälpe för förstå blankålens migration i
Östersjön. Fiskeriverkets Sövatternslaboratorium i
Drottingholm, March 2005.
Westerberg, 1994. Fiskeriundersøgninger vid havbaseret
vindkraft verk 1990–1993. Fiskeriverkets Utredningskon-
toret Jønkøbing. Rapport 5-1994. Gøteborgfi lialen.
Westin, L. 2003. Migration failre in stocked eels An-
guilla anguilla. Marine Ecology Progress Series, 254:
307–311, 2003.
Wright, P.J., Jensen, H. and Tuck, I. 2000. Th e infl uence
of sediment type on the distribution of the lesser
sandeel, Ammodytes marinus. Journal of Sea Research
44: 243–256, 2000.
FishBase – A Global Information System on Fishes.
www.fi shbase.org
6: marine mammals
seals and porpoises react differently
Carstensen, J., Henriksen, O.D. and Teilmann, J. 2006.
Impacts on harbour porpoises from off shore wind
farm construction: Acoustic monitoring of echoloca-
tion activity using porpoise detectors (T-PODs). Mar.
Ecol.Prog.Ser. 321:295-308.
Dietz, R., Teilmann, J., Henriksen, O.D. and Laidre, K.
2003. Movements of seals from Rødsand seal sanctuary
monitored by satellite telemetry. Relative importance
of the Nysted Off shore Wind Farm area to the seals.
National Environmental Research Institute Technical
Report No. 429: 44 pp.
www.dmu.dk/1_viden/2_Publikationer/
3_fagrapporter/rapporter/FR429.pdf

136 references
Edrén, S.M.C., Teilmann, J., Carstensen, J., Harders, P.
and Dietz, R. 2005. Eff ect of Nysted Off shore Wind
Farm on seals in Rødsand seal sanctuary - based on
remote video monitoring and visual observations. Final
report commissioned by ENERGI E2 A/S. National
Environmental Research Institute: 52 pp.
www.nystedhavmoellepark.dk/upload/pdf/
SealsVideo_2004.pdf
Härkönen, T., Dietz, R., Reijnders, P., Teilmann, J., Hard-
ing, K., Hall, A., Brasseur, S., Siebert, U, Goodman, S.J.,
Jepson, P.D., Rasmussen, T.D. and Th ompson, P. 2006.
A review of the 1988 and 2002 phocine distemper
virus epidemics in European harbour seals. Diseases
of Aquatic Organisms 68: 115-130.
Hammond, P.S., Berggren, P., Benke, H., Borchers, D.L.,
Collet, A., Heide-Jørgensen, M.-P., Heimlich, S., Hiby,
A.R., Leopold, M.F. and Øien, N. 2002. Abundance of
harbour porpoise and other cetaceans in the North
Sea and adjacent waters. – Journal of Applied Ecol-
ogy 39:361-376.
Madsen, P.T., Wahlberg, M., Tougaard, J., Lucke, K. and
Tyack, P. 2005. Wind turbine underwater noise and
marine mammals: Implications of current knowledge
and data needs. Mar. Ecol. Prog. Ser. 309, 279-295.
Marine Mammal Commission. 2004. Noise Expsoure
Criteria. Presentation at the Second Plenary Meet-
ing of the Advisory Committee on Acoustic Impacts
on Marine Mammals, April 28-30, 2004, Arlington,
Virginia.
National Research Council. 2005. Marine Mammal
Populations and Ocean Noise: Determining When
Noise Causes Biologically Signifi cant Eff ects. National
Academy Press, Washington, D.C.
Teilmann, J. and Lowry, N. 1996. Status of the Harbour
Porpoise (Phocoena phocoena) in Danish waters.
– Report of the International Whaling Commission
46: 619-625.
Teilmann, J., Dietz, R., Larsen, F., Desportes, G., Geertsen,
B.M., Andersen, L.W., Aastrup, P.J., Hansen, J.R. and
Buholzer, L. 2004. Satellitsporing af marsvin i danske
og tilstødende farvande. Danmarks Miljøundersøgelser.
– Technical report from National Environmental
Research Institute 484: 86 pp. Available at:
www2.dmu.dk/1_viden/2_Publikationer/
3_fagrapporter/rapporter/FR484_samlet.PDF
Teilmann, J., Carstensen, J., Dietz, R., Edrén, S.M.C. and
Andersen, S.M. 2006. Final report on aerial monitor-
ing of seals near Nysted Off shore Wind Farm. Final
report commissioned by Energi E2 A/S. Available at:
uk.nystedhavmoellepark.dk/
Teilmann, J., Tougaard, J., Carstensen, J., Dietz, R. and
Tougaard, S. 2006. Summary report on seal monitoring
around Nysted and Horns Rev Off shore Wind Farms.
Final report commissioned by Energi E2 A/S and
Vattenfall A/S. Available at www.hornsrev.dk
Teilmann, J., Tougaard, J. and Carstensen, J. 2006. Summary
report on harbour porpoise monitoring around Nysted
and Horns Rev Off shore Wind Farms. Final report
commissioned by Energi E2 A/S and Vattenfall A/S.
Available at www.hornsrev.dk
Tougaard, J., Carstensen, J., Bech, N.I. and Teilmann,
J. 2006. Final report on the eff ect of Nysted Off -
shore Wind Farm on harbour porpoises. Final re-
port commissioned by Energi E2 A/S. Available at:
uk.nystedhavmoellepark.dk
references 137
Tougaard, J., Carstensen, J., Wisz, M.S., Jespersen, M.,
Teilmann, J., Bech, N.I. and Skov, H. 2006. Harbour
Porpoises on Horns Reef Eff ects of the Horns Reef Wind
Farm. Final report commissioned by Vattenfall A/S.
Available at www.hornsrev.dk
Tougaard, J., Tougaard, S., Jensen, R.C., Jensen, T., Teil-
mann, J., Adelung, D., Liebsch, N. and Müller, G. 2006.
Harbour seals at Horns Reef before, during and aft er
construction of Horns Rev Off shore Wind Farm. Final
report commissioned by Vattenfall A/S. Available at
www.hornsrev.dk
Trilateral Seal Expert Group. 2005. Counting Harbour Seals
in the Wadden Sea in 2004 and 2005 – Expected and
unexpected results. Wadden Sea Newsletter, 1:26-27
7: birds
avoidance responses and displacement
Alerstam, T. 1990. Bird Migration. Cambridge University
Press, Cambridge.
Ballasus, H. and Hüppop, O. 2006. Estimating the con-
dition and fl ight range of short- and long- distance
passerine migrants: Are additional fl ight costs caused
by barrier-eff ects from off shore windfarms a problem?
J Ornithol 147: S130-S131.
Band, W., Madders, M. and Whitfi eld, D.P. in press. De-
veloping fi eld and analytical methods to assess avian
collision risk at wind farms. In: de Lucas, M., Janss,
G. and Ferrer, M. (Eds.) Birds and Wind Power. Lynx
Edicions, Barcelona.
Barrios, L. and Rodriguez, A. 2004. Behavioural and
environmental correlates of soaring-bird mortality at
on-shore wind turbines. J Appl Ecol 41: 72-81.
Blew, J., Diederichs, A., Grünkorn, T., Hoff man, M. and
Nehls, G. 2006. Investigations of the bird collision risk
and the response of harbour porpoises in the off shore
wind farms Horns Rev, North Sea, and Nysted, Bal-
tic Sea, in Denmark. Report from the University of
Hamburg and BioConsult SH, 165pp.
Chamberlain, D., Freeman, S., Rehfi sh, M., Fox, T. and
Desholm, M. 2005. Appraisal of Scottish Natural
Heritage’s Wind Farm Collision Risk Model and its
Application. BTO Research Report 401. British Trust
for Ornithology, Th etford.
Chamberlain, D.E., Rehfi sche, M.R., Fox, A.D., Desholm,
M. and Anthony, S. 2006. Th e importance of deter-
mining avoidance rates in relation to the use of wind
turbine collision risk models to predict bird mortality
Ibis 148: S198-S202.
Desholm, M. 2003. Th ermal Animal Detection System
(TADS). Development of a method for estimating
collision frequency of migrating birds at off shore wind
turbines. National Environmental Research Institute
Report 440. NERI, Rønde. Available at:
www2.dmu.dk/1_viden/2_Publikationer/
3_fagrapporter/rapporter/FR440.pdf
Desholm, M. and Kahlert, J. 2005. Avian collision risk at an
off shore wind farm. Biology Letters 1(3) 296-298.
Desholm, M., Fox, A.D., Beasley, P. and Kahlert, J. 2006.
Remote techniques for counting and estimating the
number of bird-wind turbine collisions at sea: a review
Ibis 148: S76-S89.
Drewitt, A.L. and Langston, R.H.W. 2006. Assessing the
impacts of wind farms on birds. Ibis 148: S29-S42.

138 references
Fox, A.D., Desholm, M., Kahlert, Christensen, T.K. and
Petersen, I.K. 2006. Information needs to support
environmental impact assessment of the eff ects of
European marine off shore wind farms on birds. Ibis
148: S129-S144.
Garthe, S. and Hüppop, O. 2004. Scaling possible adverse
eff ects of marine wind farms on seabirds: develop-
ing and applying a vulnerability index. J Appl Ecol
41: 724-734.
Guillemette, M. and Larsen, J.K. 2002. Post-development
Experiments to Detect Anthropogenic Disturbances:
Th e Case of Sea Ducks and Wind Parks. Ecological
Applications 12(3): 868-877.
Hüppop, O., Dierschke, J. and Wendeln, H. 2004. Zugvögel
und Off shore-Windkraft anlagen: Konfl ikte und Lösun-
gen. Berichte zum Vogelschutz 41: 127-218.
Kaiser, M.J., Galandini, M., Showler, D.A., Elliott, A.J.,
Caldow, R.W.G., Rees, E.I.S., Stillman, R.A. and
Sutherland, W.J. 2006. Distribution and behaviour
of common scoter Melanitta nigra relative to prey
resources and environmental parameters. Ibis 148:
S110-S128.
Petersen, I.K., Christensen, T.K., Kahlert, J., Desholm,
M. and Fox, A.D. 2006. Final results of bird stud-
ies at the off shore windfarms at Nysted and Horns
Reef, Denmark. National Environmental Research
Institute, Rønde.
Petterson, J. 2005. Th e impact of off shore wind farms on
bird life in Southern Kalmar Sound, Sweden. Report
to Swedish Energy Agency, 124pp.
Schwemmer, P. and Garthe, S. 2006. Sea ducks and
impacts of ship traffi c in the Baltic Sea. J Ornithol
147: S249.
Tucker, V.A. 1996. A mathematical model of bird collisions
with wind turbine rotors. J Solar Energy Engineering
188: 253-262.
West, A.D and Caldow, R.W.G. 2006. Th e development
and use of individuals-based models to predict the
eff ects of habitat loss and disturbance on waders and
waterfowl. Ibis 148: S158-S168.
Whitfi eld, D.P. and Madders, M. 2005. A review of
the impacts of wind farms on hen harriers Cir-
cus cyaneus. Natural Research Information Note
1. Natural Research Ltd, Banchory. Available at:
www.natural-research.org/documents/NRIN-1.pdf
Winkelman, J.E. 1995. Bird/wind turbine investigations in
Europe. pp. 110-140 In: Proc. Nat. Avian - Wind Power
Planning Meeting, Denver, Colorado, July 1994.
8: socioeconomic effects
positive attitudes in local communities
Alvarez-Farizo, B. and Hanley, N. 2002. Using conjoint
analysis to quantify public preferences over the envi-
ronmental impacts of wind farms. An example from
Spain, Energy Policy, vol. 30, no. 2, pp. 107–116.
Bruun, J. 2002. Den nationale identitets natur, i Agger et
al: Naturens værdi. Vinkler på danskernes forhold til
naturen. Gads Forlag, København.
Ek, K. 2002. Valuing the Environmental Impacts of Wind
Power, a Choice Experiments Approach. Licentiate
Th esis, Luleå University, Sweden.

references 139
Kuehn, S. 2005a. Havvindmøller i lokalområdet – en
undersøgelse ved Horns Rev Havmøllepark. Bag-
grundsrapport. Unpublished.
Kuehn, S. 2005b. Havvindmøller i lokalområdet – en
undersøgelse ved Nysted Havmøllepark. Baggrund-
srapport. Unpublished.
Ladenburg, J., Dubgaard, A., Martinsen, L., and Tranberg,
J. 2005. Economic Valuation of the Visual Externalities
of Off shore Wind Farms, Report from the Food and
Resource Economic Institute, Th e Royal Veterinary
and Agricultural University, Copenhagen, Report
no. 179.
Ladenburg, J. 2006. Attitudes towards Wind Power De-
velopment in Denmark, Th e Royal Veterinary and
Agricultural University, Food and Resource Economic
Institute, Working Paper no. 3.
Navrud, S. 2004. Miljøkostnader av vindkraft i Norge.
Institutt for Økonomi og Ressursforvaltning.Univer-
sitetet for Miljø- og Biovitenskap (UMB).

140 subject index
aAcoustic monitoring 82-84, 88
Aerial surveys 100
Algae communities 57
Anoxic 57
Approval procedures 128
Arctic/Common Tern 98
Artifi cial substrates 45
Auk 98, 106
Aviation lights 33
Avoidance 14-15, 96-97
bBACI (Before Aft er Control Impact) 28
Barnacle Goose 99
Benthic communities 44-63
Birds 94-111
Bird collision rate 98, 108-109
Brackish water 21, 50-51
cChanges in distribution 96, 100
Choice experiment 114
Collision model 108
Collision risk 18, 100, 106-110
Colonisation 45, 53
Common Eider 98
Common Scoter 98
Cormorant 31
Cumulative impacts 15, 96
dDanish Energy Authority 10, 29
Danish Nature and Forest Agency 10, 29
Dark-bellied Brent Geese 99
Defl ection 103
Deposit feeding 59
Desiccation 56
Displacement 95
Divers 98-99
DONG Energy 10, 29
Dredging 61
eEcosystems 21
Ecosystem modelling 75
Electricity reform 125
Electricity supply act 129-130
Electromagnetic fi elds 74-76
Energy policy 125-128
Environmental Economic study 113
Environmental Impact Assessment (EIA) 129-130
Environmental management systems 43
Environmental monitoring programme 28-31
Epifauna 49
Epifouling communities 51-52, 60
EU Bird Protection area 38
European Union 23
fFish 64-79
Flight displacement 96
Foundations 34, 37-38, 41-42, 45-46, 56-57, 60-61,
65, 89
Frederikshavn 26
gGannet 98
Goldeneye 98
References indicate pages where a given
subject is described in greater detail.
subject index

subject index 141
Gravity foundations 34, 41
Great Black-backed Gull 99
Grey seal 81-83, 86, 92-93
Gulls 104
hHabitat loss/gain 96
Harbour porpoises 83, 88-90
Harbour seal 81
Hard bottom sampling 46
Hazards to birds 95
Herring Gull 99
Horns Rev 2 126
Horns Rev Off shore Wind Farm 27, 35-38
Hub 33
Hydrography 36, 39
iIAPEME 18-19, 62-63, 78-79, 92-93, 110-111, 123
Infauna 46, 50, 63
Intertidal 54
kKittiwake 98
lLittle Gull 98
Long-tailed Duck 98
mMacro algae 57, 60
Marine Mammals 80-93
Meteorology mast 36, 40
Middelgrunden 26
Monocultures 52
Monopile foundations 37
Mussel beds 50
Mute Swan 98
nNacelle 33
Native communities 45
Natura 2000 23
Navigational lighting 37-38
Navigation markings 33
Noise 33-34, 43, 81, 89, 91
Nursery ground 57
Nysted Off shore Wind Farm 27, 38-42
oOpen-door procedure 128
Oxygen defi ciency 60
pPhocine distemper virus 82
Physical habitat loss 95
Pile driving 14, 18, 84-85, 89-92
Pingers 43, 89
Pintail 99
Piscivore 75
Predators 54 ,62
rRadar 98-99
Ramsar site 38
Red-breasted Merganser 98
Research projects 24-25
Re-suspension 61
Rotor blades 33
Rødsand 38-40, 83-86
Rødsand 2 126
Rødsand seal sanctuary 83
Rønland 26
sSand scouring 56-57
Satellite taggings 86

142 subject index
Satellite transmitters 82-83
Scoters 99
Scour protection 37
Seabed sampling 46
Seal scarers 43, 89
Sediment spill 61
Sediment coarseness 58-59
Sediment spill 35, 61
Ship surveys 83, 88
Socioeconomic eff ects 112-123
Sociological study 113
Sublittoral 56
Subtidal 54
tTADS 99
Terns 104
Th e Baltic Sea 39-40, 70
Th e Environmental Group 29
Th e ”Green Group” 29
Th e North Sea 36, 48-49, 69, 98
T-POD 84
Transformer substation 34, 41
Transmission grids 130
Transmission system operator 132
Trawling 61
Tunø Knob 26
Turbine rotor 33
Turbine tower 33
vVattenfall 10, 29
Video monitoring 82
Vindeby 26
Visual impact 33, 123
Visual intrusion 113
wWillingness to pay 120-122
Wind power economics 133
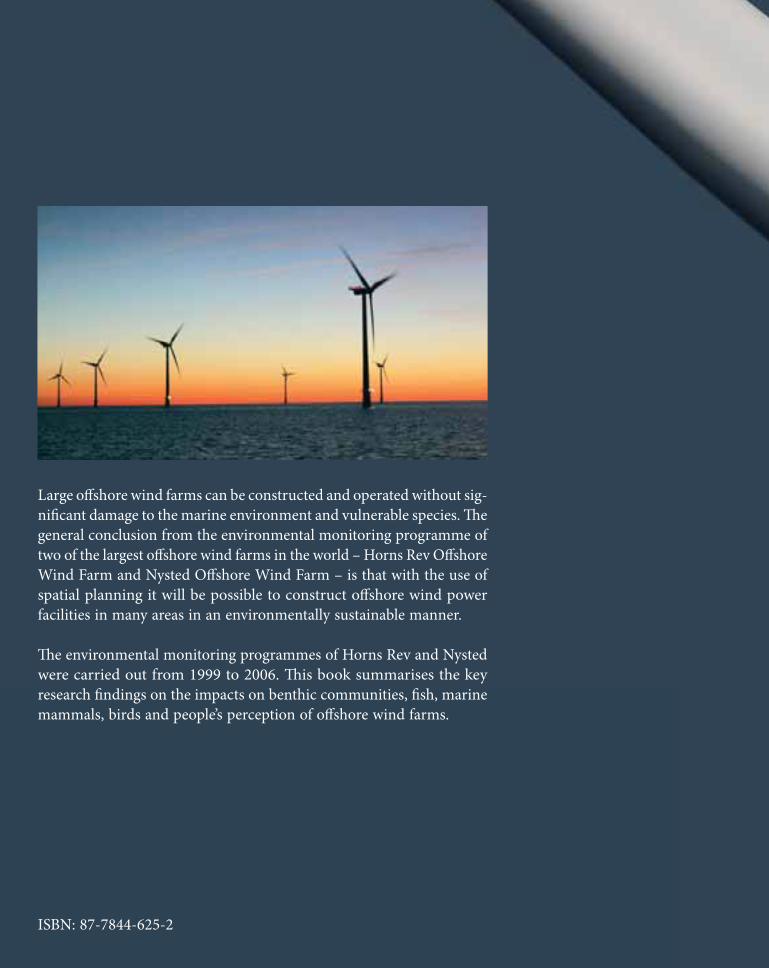
Large off shore wind farms can be constructed and operated without sig-
nifi cant damage to the marine environment and vulnerable species. Th e
general conclusion from the environmental monitoring programme of
two of the largest off shore wind farms in the world – Horns Rev Off shore
Wind Farm and Nysted Off shore Wind Farm – is that with the use of
spatial planning it will be possible to construct off shore wind power
facilities in many areas in an environmentally sustainable manner.
Th e environmental monitoring programmes of Horns Rev and Nysted
were carried out from 1999 to 2006. Th is book summarises the key
research fi ndings on the impacts on benthic communities, fi sh, marine
mammals, birds and people’s perception of off shore wind farms.
ISBN: 87-7844-625-2