Two Layer Porous Asphalt - Danish Experiences - BRRC Seminar 2005

Danish Experiences of Improvingthe Utilisation of Nitrogen and Phosphorus in Feeding of Pigs
Sigurd Boisen, Dr. agro. Boisen ConsultSønæsvej 6, 8800 Viborg, Denmark

• Nitrogen (N) and phosphorus (P) are key elements inall living organismsAdequate supply of N and P is essential for a
sustainable plant production from which a number of organic compounds, e.g.:• Essential amino acids, essential fatty acids, and vitamins are produced
Adequate supply of these compounds is essential for all mono-gastric animals, e.g. pigs.
Sustainable Pig Production
• Protein level in the feed• Protein digestibility• Protein quality• Feed utilisation• Pig genetic: Meat percentage in the slaughter pig
Factors influencing N-losses in Pig Production
• Phosphorus level in the feed• Phytic phosphorus• Phytase activity• Feeding system (dry or wet feeding)• Industrial (exogenous) phytases
Factors influencing P-losses in Pig Production
• Barley• Wheat
• Soybean meal
Traditionally most important Feedstuffs in Danish Pig Diets

Protein fractions: %(Osborne)
Glutelins 25
Prolamins 50(Hordein)
Glubulins + 25Albumins
Endosperm
Aleurone layerEmbryo
Barley seed (N):
}{

Ideal protein
• Perfect ratio among the essentialamino acids (EAA) required for optimal performance (maintenance + production)
• Profile in which every amino acid is equally limiting
• Minimal surplus of N

Ideal protein (g per 160g N)
Barley (relative to IP)
Wheat (relative to IP)
Soybean meal (relative to IP)
Lysine 70 53 40 87
Methionine 18 100 89 72
Cystine 18 133 122 83
Threonine 45 73 61 78
Tryptophan 12 100 83 100
Isoleucine 40 91 83 125
Leucine 80 93 84 95
Valine 52 98 87 95
Histidine 25 97 98 100
Phenylalanine 40 135 117 125
Tyrosine 40 81 74 98 *Standardised digestible amino acids
Protein quality of common feedstuffs(amino acid composition* relative to the composition of ideal protein)
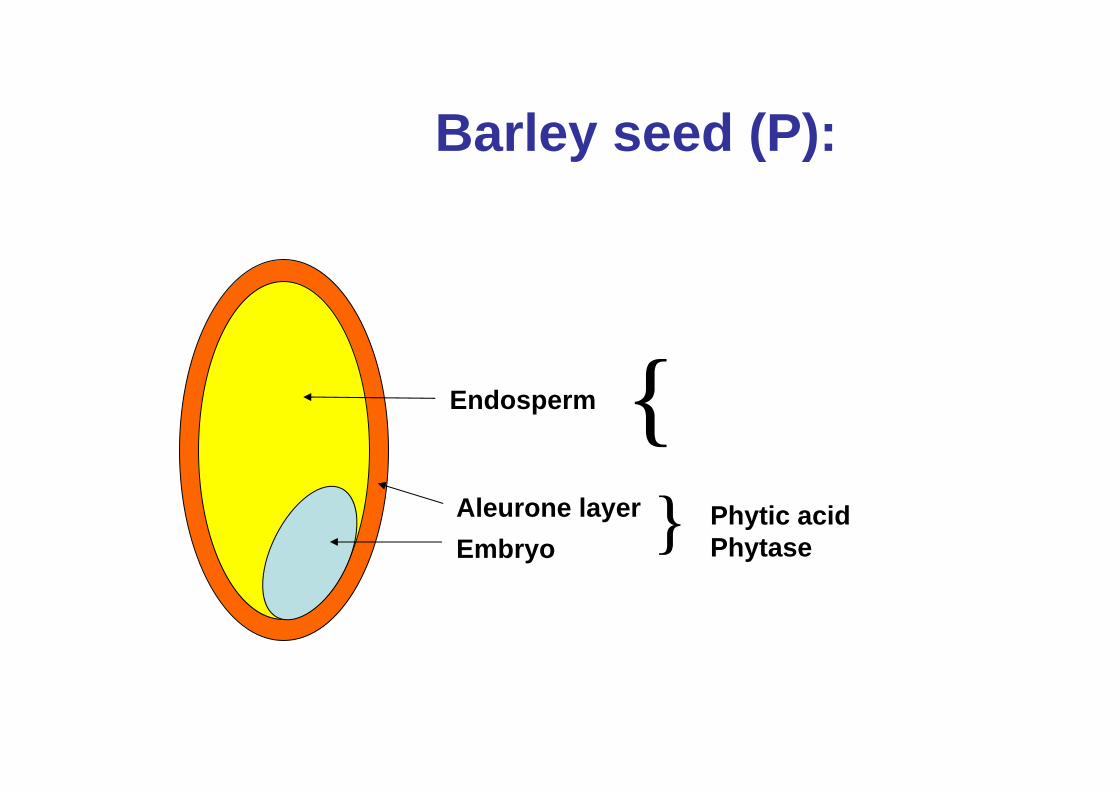
Phytic acidPhytase
Endosperm
Aleurone layerEmbryo
Barley seed (P):
}{
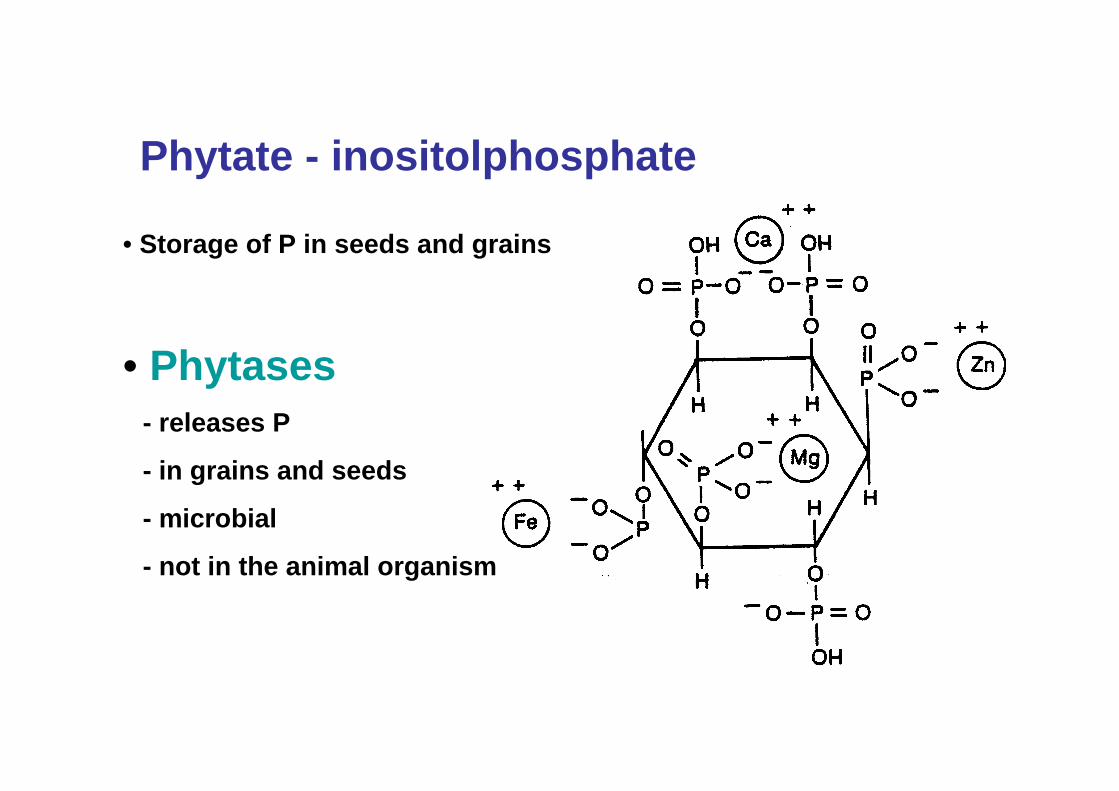
Phytate - inositolphosphate
• Storage of P in seeds and grains
• Phytases- releases P
- in grains and seeds
- microbial
- not in the animal organism

Phytase activity in cereals 1
Barley Wheat* Triticale Rye Maize
Phytase activity 24 53 70 115 0
1Phytic acid P account for about 80% of total P in cereal grains (Boisen, 1987)*Wheat bran: three-fold phytase activity (and three-fold phytic acid)

Nitrogen (g/FUp)
N in feed
Digestible N
Digestible ideal protein-N
Weight (kg)
N in Faeces
N in Urin
N inbody
N behov


70
80
90
100
In vivo: In vitro:
Apparentdigestedprotein
Undi-gestedprotein
Endo-genousprotein loss:
Extra
Basal
Real
Standardized’True’
Apparent
Dig
estib
ility
(%)
Determination of standardized digestibility

Standardized digestibility of protein and amino acids in selected common feedstuffs
Barley Wheat Soybean meal
NRC 1998
CVB 1999
In vitro
NRC 1998
CVB 1999
In vitro
NRC 1998
CVB 1999
In vitro
Crude protein - 80 80 - 89 91 - 87 92
Lysine 79 76 77 81 84 83 89 89 89
Methionine 86 82 85 90 90 90 91 90 91
Cystine 86 80 82 90 87 91 84 86 83
Threonine 81 80 80 84 86 90 85 86 86
Tryptophan 80 77 81 90 88 86 87 87 86
Isoleucine 84 82 82 89 91 90 88 88 88
Leucine 86 82 83 89 90 90 88 88 88
Valine 82 81 80 86 89 88 86 87 87
Histidine 86 83 83 89 91 94 90 90 90
Phenylalanine 88 84 86 91 91 92 88 89 90
Tyrosine 87 - 86 89 - 90 90 - 89
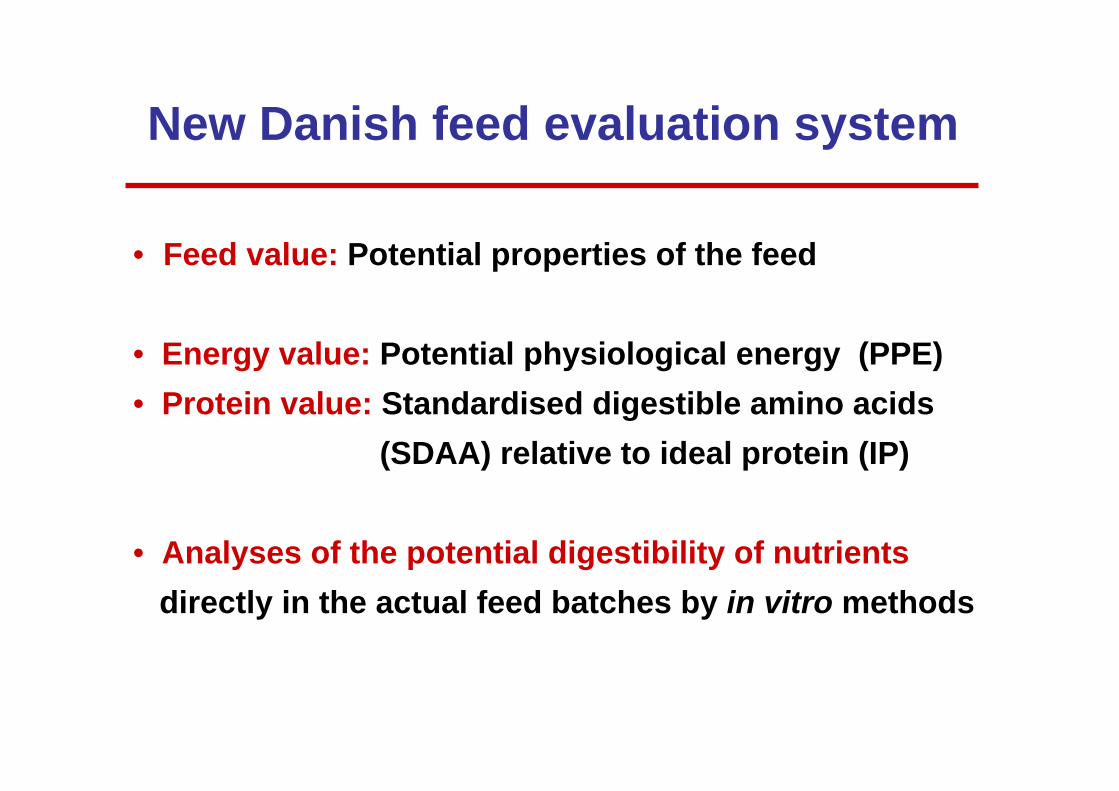
• Feed value: Potential properties of the feed
• Energy value: Potential physiological energy (PPE)• Protein value: Standardised digestible amino acids
(SDAA) relative to ideal protein (IP)
• Analyses of the potential digestibility of nutrientsdirectly in the actual feed batches by in vitro methods
New Danish feed evaluation system

Energy value:
Adenosine-tri-phosphate (ATP):
• Universal energy donor for all energy requiring processes in living organisms
Potential physiological energy (PPE):
• Physiologically available energy conserved in ATP after oxidation of nutrients at cellular level

FEED VALUE: Conversion of dietary nutrientsto physiological energy and growth
Protein AA ProteinIP
Protein
Ash
Carbo-hydrates Glu
SCFAAcCoA Energy
ATP
Lipids Fat
Lipids FA/MG LipidsTG Fat
Feed Digestive tract Intermediary metabolism Pig
4.4
0.30.2
1.0
Water
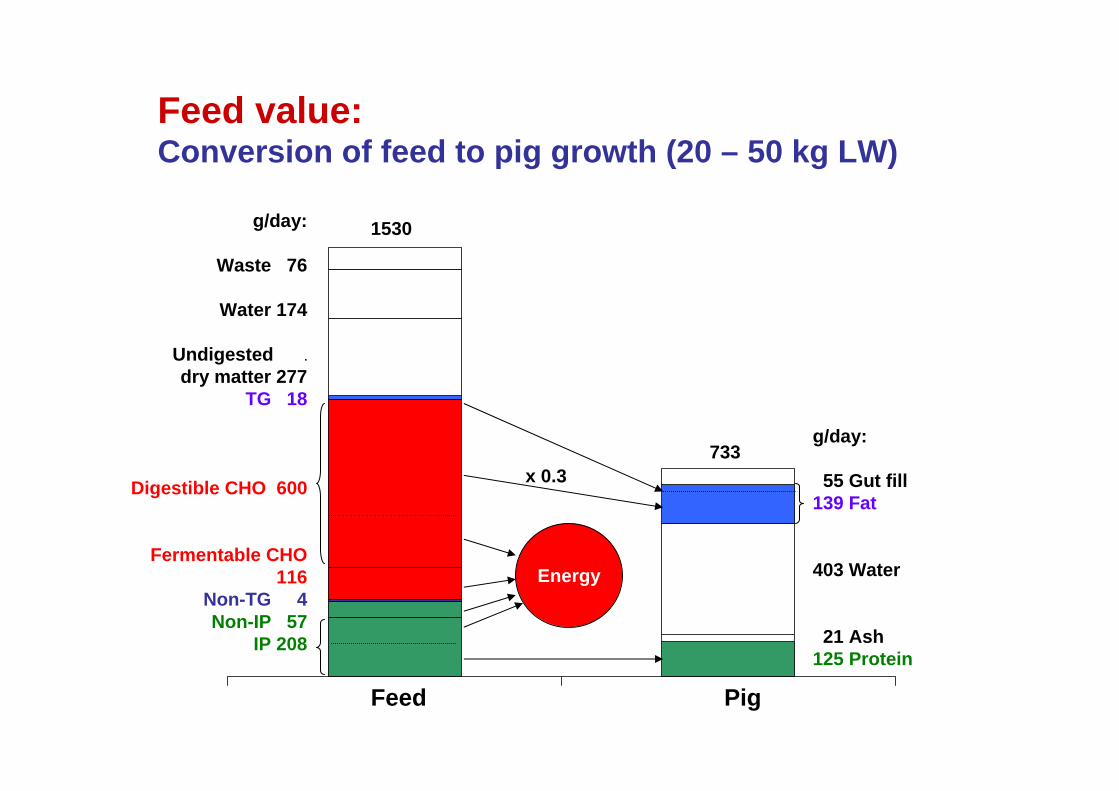
Feed value:Conversion of feed to pig growth (20 – 50 kg LW)
g/day:
Waste 76
Water 174
Undigested .
dry matter 277TG 18
Digestible CHO 600
Fermentable CHO 116
Non-TG 4Non-IP 57
IP 208
g/day:
55 Gut fill139 Fat
403 Water
21 Ash125 Protein
Energy
1530
733
PigFeed
x 0.3

-2.2Fur animals1.92.8Poultry
17.854.3Feed phosphates
4.520.3Cattle11.428.5Pigs
P in feedphosphates
Total P inFeeds
Phosphorus in husbandry animal diets
Commercial mineral feed mixtures
1. Minerals/Phosphates
2. Industrial amino acids (Lys, Thr, Met)
3. Phytase
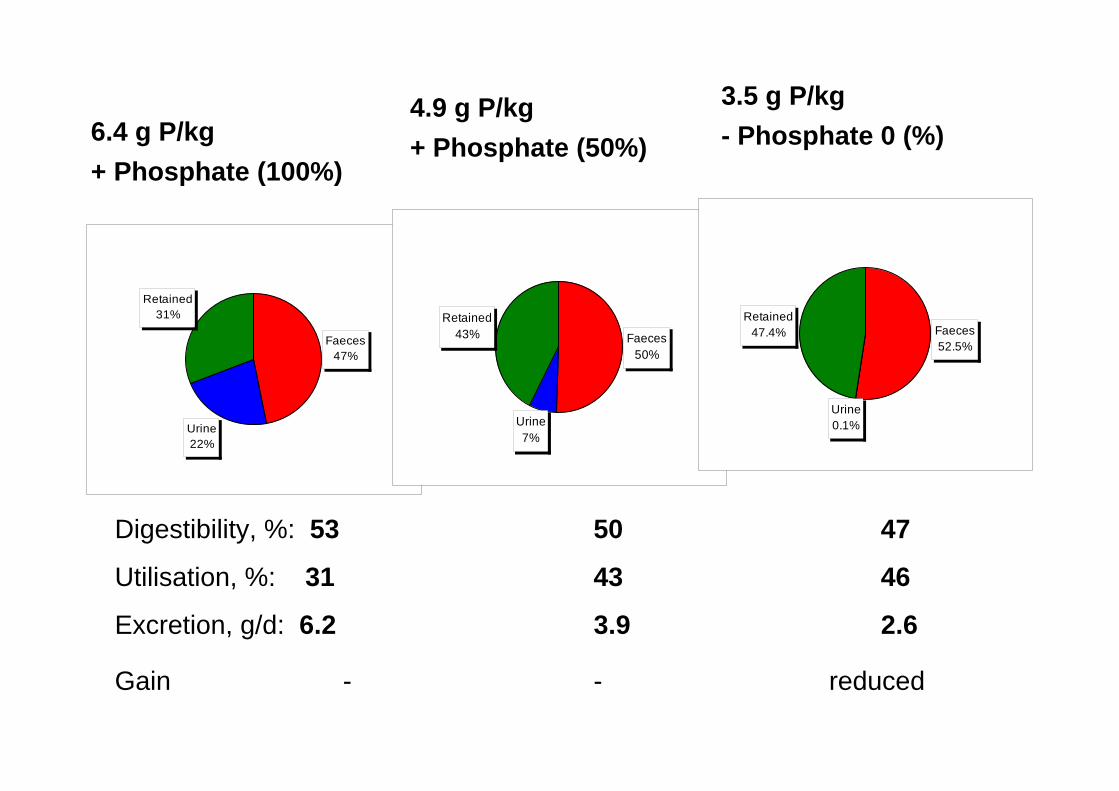
Faeces47%
Urine22%
Retained31%
Faeces50%
Urine7%
Retained43% Faeces
52.5%
Urine0.1%
Retained47.4%
6.4 g P/kg+ Phosphate (100%)
4.9 g P/kg+ Phosphate (50%)
3.5 g P/kg- Phosphate 0 (%)
Digestibility, %: 53 50 47
Utilisation, %: 31 43 46
Excretion, g/d: 6.2 3.9 2.6
Gain - - reduced

Faeces47%
Urine22%
Retained31%
Faeces50%
Urine7%
Retained43%
6.4 g P/kg+ Phosphate (100%)
4.9 g P/kg+ Phosphate (50%)
3.5 g P/kg+ Phytase
Digestibility, %: 53 50 70
Utilisation, %: 31 43 65
Excretion, g/d: 6.2 3.9 1.6
Faeces30%
Urine5%
Retained65%
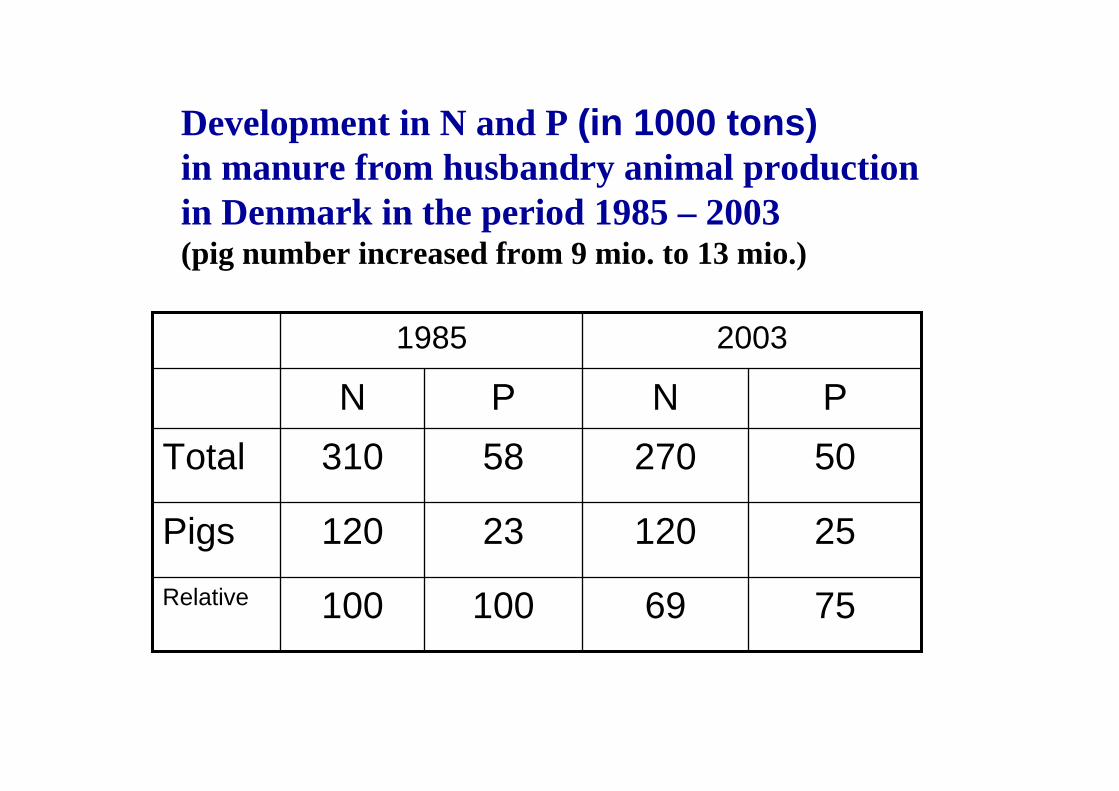
100
23
58P
69
120
270N
20031985
75100Relative
25120Pigs
50310TotalPN
Development in N and P (in 1000 tons)in manure from husbandry animal productionin Denmark in the period 1985 – 2003 (pig number increased from 9 mio. to 13 mio.)

0,543,0331 - 1042007
0,543,1831 - 1042006
0,613,1730 - 1022004
PhosphorusNitrogenWeight range
Development in excretion of nitrogen and phosphorus in slaughter pig production

• One animal unit (= 1 DE) corresponds to 100 kg N from husbandry animal manure at storage (e.g. tank with slurry or manure) based on different categories:
• 1 Milking cow (small race: e.g. Jersey• 0.85 Milking cow (heavy race)• 4.3 Sows with piglets up to 7.2 kg• 35 slaughter pigs from 30 – 102 kg• 167 poultry (egg layers)• 2,900 chickens (from hatch to slaughter)DE is justified continuously when the general N/P regularly has been
improved for the specific category
Definition of Animal Units

• Reduction of dietary protein level• Improved feed utilisation• Supplementation of benzoic acid :
- up to 0.5% in diets for piglets- up to 1.0% in diets for slaughter pigs
(1% benzoic acid in the diet: reduced slurry-pH => reduced ammonia evaporation with about 10%)
Reduction of ammonia evaporation from pig production


Feeding robot JKL 2000 P*Components description
KarruselFodertrugBevægelige gitreUddrivningsarmFoderlågeSeparationslågeVægtIndgangslågeTransponderantenne

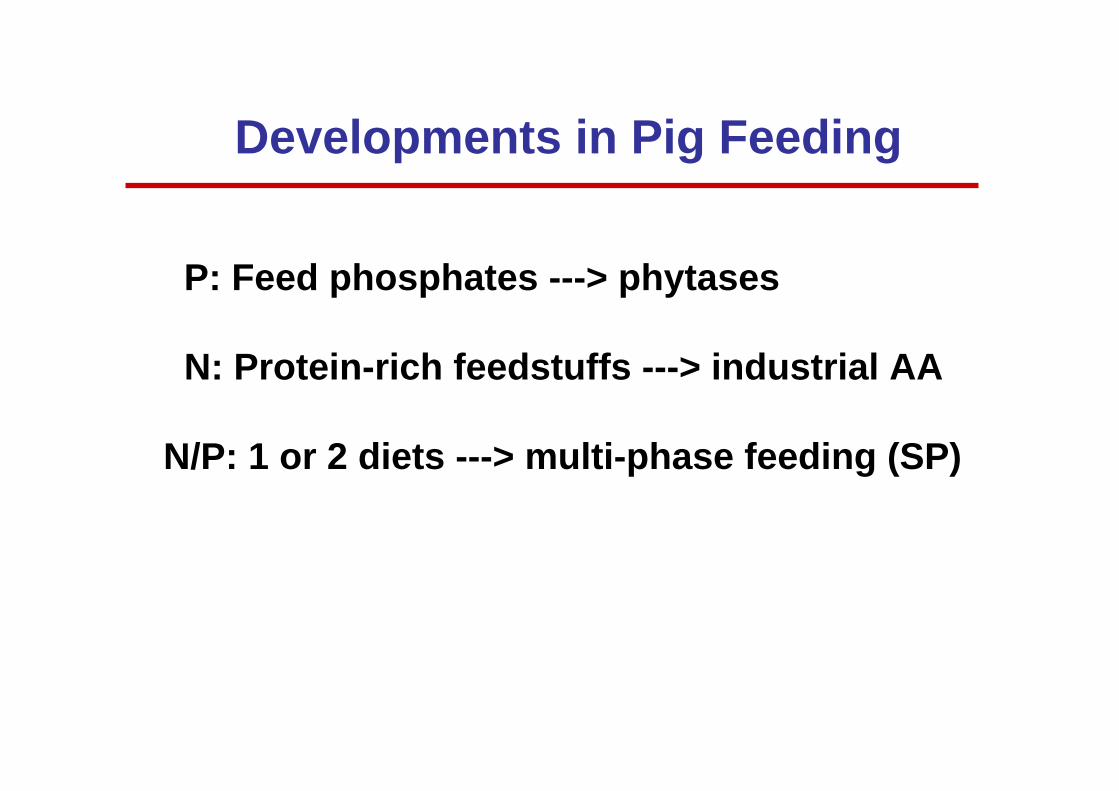
Developments in Pig Feeding
P: Feed phosphates ---> phytases
N: Protein-rich feedstuffs ---> industrial AA
N/P: 1 or 2 diets ---> multi-phase feeding (SP)

Commercial mineral feed mixtures
1. Minerals/Phosphates
2. Industrial amino acids (Lys, Thr, Met)
3. Phytase

The oversupply of phosphorus from agriculture (presently 33,000 tons) is intended to be reduced with 50% during the next 10 years
Reduction of phosphorus from husbandry animal production

• Emission* of ammonia must be reduced relatively to the emission in 2005 with:
15% in 200720% in 200825% in 2009_________________________________________*from pig stables with partial solid floor in 2005.
New Danish Law for the Environment from 1/1 2007

New Law for Environment 2007:
- all farms with husbandry animals
Focus on:
1) N and P to water environment
2) ammonia and odour from the animal production

Conclusion
N surplus from Danish pig productions have been reduced during the last two decades- mainly caused by improved protein quality
by supplementations of industrial amino acids
P surplus from Danish pig productions will be reduced during the next decade - mainly due to general use of effective
industrial phytases which can avoid supplementation of inorganic phosphates
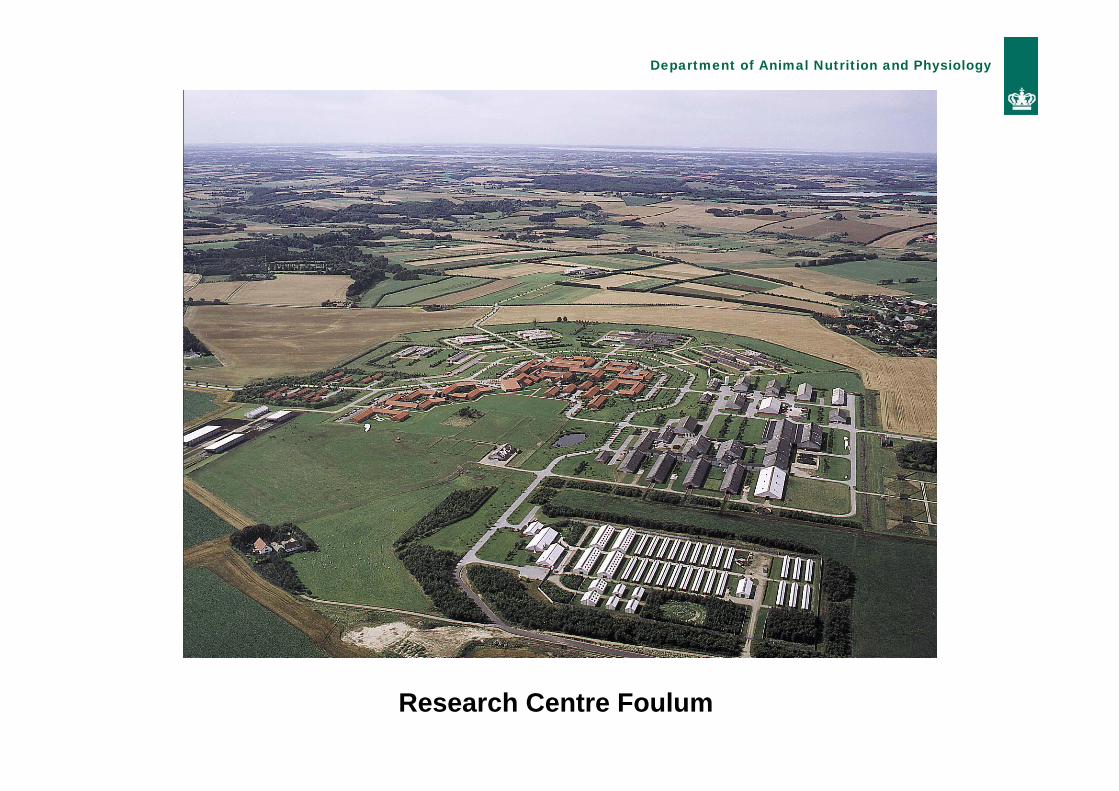
Department of Animal Nutrition and Physiology
Research Centre Foulum


1.97 kgDeposited N
1.45 kgTheoretical minimal excretion of N (3.42 kg – 1.97 kg)
3.42 kgDigestible protein (80% of feed protein)
2.73 kgIdeal protein (90% of digestible protein)
2.46 kgTotal N-requirements (20% for maintenance)
Calculation of minimal N-excretion from theslaughter pig production (30 – 100 kg liveweight)

PROTEINAA
Digestible Digestible Fermentable Digestible
CARBOHYDRATESS+S
LIPIDSFA
Acetyl - CoA
ENERGY
PROTEIN WATERASH LIPIDS
1. Chemical analyses(Feed composition)
2. In vitro analyses(Simulation ofdigestion)
3. Calculations(Potential energygeneration and nutrient deposition)
4. Animal model(Feed intake, Pdmax,deposition and excretion)
Summary of feed evaluation

Feed optimization
C RD SD
SD SD
Growth
Mainte-nanceBEL
Reqiuire-ments
Safty-margin
/economical
optimum
Standar-dized
digestibleamino acids
per FU
Norm
SELUD
A RD SD
B RD SD+
Diet: Pig:
UD = undigestedRD = real digestedSD = standardized digested
SEL = specific endogenous lossBEL = basal endogenous loss
Feedstuffs:

Nutritional value of feedstuffs
• Energy value (from all organic compounds)• Protein value (amino acids)• Minerals and vitamins
• Composition of carbohydrates and lipids• Anti-nutritional factors (ANF's)• Effects of storing and processing