Global Europe Consumers attitudes - Men and Beauty - Europe - 2008

DANISH CONSUMERS’ ATTITUDES
TOWARDS FUNCTIONAL FOODS
Working paper no 62
February 1999
MAPP
•T
HE
AARHUS SCHO
OL
•
O
FBUSINESSCENTER FOR MARKEDSOVERVÅGNING, -VURDERING OG -BEARBEJDNING TIL FØDEVARESEKTOREN . ÅRHUS
CENTRE FOR MARKET SURVEILLANCE, RESEARCH AND STRATEGY FOR THE FOOD SECTOR . AARHUS . DENMARK

DANISH CONSUMERS’ ATTITUDES
TOWARDS FUNCTIONAL FOODS
Jacob B. PoulsenThe Aarhus School of Business

EXECUTIVE SUMMARY
1. “Functional foods” is a relatively new term used to describe food productswhich have been enriched with natural substances/components with a specificphysiological preventive and/or health-promoting effect. As yet, there are fewactual functional foods in the Danish market, but in Japan and the USA, wherethese products are relatively common, sales are enjoying growth rates far abovethose for conventional products.
2. The aim of this study is to examine Danish consumers’ attitudes to functionalfoods, including: whether enrichment with health-promoting substances resultsin a higher value perception among consumers; the relative importance consu-mers attach to enrichment compared with other product attributes; whichbeliefs consumers associate with enrichment; and, which beliefs influence anddetermine consumers’ purchasing intentions and the relative importance ofthese beliefs.
3. The study consists of three analyses: focus-group interviews, the aim of whichis to get an overview of the issue and generate input for the quantitative ana-lyses. The quantitative analyses consist of a conjoint analysis and a surveybased on the Theory of Reasoned Action. These analyses are based on concrete,non-existent examples of functional foods, a dairy product and a bread product,each of which has been enriched with three different substances: a) soluble foodfibre, b) omega-3, and c) calcium and vitamin D.
4. The focus-group interviews show that the main beliefs which consumersassociate with functional foods are the convenience of enrichment through dailydiet, (un)naturalness, apprehension about changes in taste, higher price, un-certainty about belief in the effect of enrichment, dosage (when is there enough/too much of the enrichment substance), own ignorance and uncertainty aboutmanufacturers’ knowledge of the health effects of eating enriched products. Therespondents have very little knowledge of functional foods and were fairly scep-tical. However, attitudes to concrete examples of functional foods were muchmore positive than attitudes to the concept of functional foods.
5. The conjoint analyses show that, in general, consumers preferred the non-enriched variety, though with the exception of bread enriched with fibre, sincethe benefit of this is greater than for the conventional product. About 75% ofconsumers attach relatively more importance to enrichment than the otherproduct attributes. For about 30% of consumers in the case of the dairy productand 50% in the case of the bread product, enrichment in one of the three formsresulted in a higher value perception, while about 25% and 40% respectivelyattached a lot of importance to the products not being enriched.
6. The cluster analysis identified several segments with a preference for the va-rious enriched products. Two relatively large segments (25% and 20% of re-spondents respectively) had a higher value perception for the enriched than forthe conventional product, especially as regards the calcium and vitamin D-en-riched dairy product and the fibre-enriched bread product, and these segmentsalso attach relatively more importance to enrichment than the other productattributes. The analysis also identified a large segment with a preference for the
calcium and vitamin D-enriched bread product, about 30% of respondents say-ing they preferred this product variety and 35% saying they attached relativelygreat importance to enrichment. Only very few respondents preferred enrich-ment with omega-3, which was also the case for enrichment with fibre in thedairy product.
7. In general, attitudes to enrichment are more positive as regards the breadproduct and product varieties enriched with substances already present in theconventional product. However, attitudes are generally more negative asregards enrichment with omega-3 than with the two other substances. On thewhole, consumers’ attitudes to functional foods depend on both the type of prod-uct enriched, the enrichment substance and the combination of these.
8. The questionnaire survey shows that consumers’ purchasing intentions asregards the various enriched products are almost solely explained by their atti-tudes to purchasing the respective product varieties (attitude to behaviour, AB),and only to a very small extent by the subjective norm (SN). The beliefs whichexplain AB, and thus also purchasing intentions, are: perceived convenience ofgetting the enrichment substance through the daily diet (explains on average42% of the explained variation in AB for the various product varieties), price(21%) perceived naturalness of the enriched products (18%), and the perceivedpositive health effect of eating the enriched rather than the conventionalproduct (14%).
9. There are no systematic differences or similarities in the relative importanceof the individual beliefs for AB as regards product, enrichment substance or thecombination of these. There are, on the other hand, systematic absolute differ-ences between the mean values for the product varieties. The means are thusgenerally higher (more positive attitude and higher purchasing intentions) forenriched varieties of the bread product and in those cases where products havebeen enriched with a substance that already occurs naturally in the conven-tional product. An analysis of variance shows that the perceived naturalness ofthe enriched product is the most explanatory belief for how positive respond-ents’ initial attitudes are to the concrete product varieties.
10. As regards demographic differences, the study shows that the elderly andwomen are more positive about functional foods than the other respondents. Nodifferences were found with regard to income or educational level.
11. The most important implications of the study are that the development offunctional foods should take a starting point in concepts which consumers re-gard as relatively natural. In this connection, both the conventional productitself, the enrichment substance and the combination of these have a certainimportance. Thus, consumers are most positive about functional foods whichhave been enriched with a substance already present in the conventional prod-uct. With regard to price, the analyses show that some segments are willing topay more for functional foods if they think there is a health effect. The market-ing of functional foods should emphasise the convenience of getting enrichmentsubstances through the daily diet and naturalness, since these factors are themost important in determining consumers’ intention to buy functional foods.
Introduction 1
Background 1
Aims of the study 1
Theoretical basis 2
Methods 2
The concept of functional foods 3
The empirical study 3
The qualitative study 3
General aspects of food products 4
Attitudes towards functional foods, including the consequences associated
with enrichment 5
Importance of the results for the design of the conjoint analysis and survey 6
Summary of focus group results 7
The quantitative studies 7
Data collection 7
The conjoint analysis 8
Design and data collection 10
Results 10
Homogeneity of the respondents 12
Segmentation 13
Validity of the conjoint analysis 20
Concluding remarks on the conjoint analysis 21
The questionnaire survey 22
Design and implementation 22
Results 23
Correlation between attitudes and demography 31
Differences in attitude between segments identified by the
conjoint analyses 33
Validity of the questionnaire survey and consistency with the
conjoint analyses 35
Questionnaire survey – concluding remarks 36
Marketing implications of the study 37
References 39
Appendix 1. Dissimilarity measures for a variable number of clusters 42
Appendix 2. Cluster homogeneity after aggregation 43
Appendix 3. Relative importance of the attributes for the other segments 44

INTRODUCTION
Background
“Functional foods” is a relatively new concept, which has emerged as a result ofthe last few decades’ increasing focus on and awareness of the influence of dieton health.
Up to now, the food industry has responded to consumers’ demand for healthierfoods by developing endless “light” products, which have been modified mainlyby reducing the sugar, calorie and fat content. In addition, recent years haveseen the development of more “natural” products – especially through a reduc-tion in the number of additives and the breakthrough for ecological products.
Functional foods are a natural continuation of the above trend. The increaseddemand for healthier foods, together with new developments in food technology,have made it both intriguing and possible to add health-boosting substances toexisting products. Functional foods is thus a term for products enriched withnatural, i.e. occurring in nature, substances such as vitamins, fibre and plant ex-tracts in order to increase the health effects of the conventional, basic product.
The definition of functional foods varies enormously in the literature, and whileconsequently there is no agreement on a formal definition, there are certainpoints in common. Functional foods can thus be defined as:
A product which has been modified or enriched with naturally occurring sub-stances with a specific physiological preventive and/or health-boosting effect.The product must also be part of the normal daily consumption of food/fluids.
Aims of the study
The aims of the study are:
To establish a decision-making basis for the development and marketing offunctional foods by examining consumers’ attitudes towards concrete functionalfoods, including:
• the extent to which enrichment with health-boosting substances results in ahigher value perception among consumers;
• the relative importance consumers attach to enrichment compared withother product attributes;
• the consequences consumers associate with enrichment; and
• the beliefs which influence and determine consumers’ intention to purchasefunctional foods.
1

Theoretical basis
In consumer behaviour theory, the purchase of groceries is regarded as habitualbehaviour, where the consumer chooses between products in the evoked set, anactivated set of products accepted by the consumer (Howard & Sheth, 1969). Theextent to which enrichment will affect the composition of the consumer’s evokedset depends on the relative importance attached to enrichment compared withother product attributes and the consequences (beliefs) associated with enrich-ment (see, for example, Ajzen & Fishbein, 1980).
The theoretical basis of this study is the cognitive paradigm and the behaviour-al model used is Ajzen and Fishbein’s (1980) attitudinal model, the Theory ofReasoned Action. The Theory of Reasoned Action describes and explains indivi-duals’ attitudes towards a given behaviour and behavioural intentions based onthe experienced consequences of this behaviour (Ajzen & Fishbein, 1980).
Since there is often little similarity between expressed attitudes towardsbehaviour and actual behaviour, the Theory of Reasoned Action uses anintermediate indicator – the intention of carrying out a given behaviour – whichhas proved to be a better predictor of behaviour (Ajzen & Fishbein, 1980; Ajzen,1988). The intention is made up of the attitude towards behaviour (AB) and thesubjective norm (SN, which is the individual’s perception of relevant otherperson’s attitude towards the behaviour).
Methods
Very little research has been done on consumers’ attitudes towards functionalfoods, so empirical studies are essential to achieve the aims outlined above. Thescarcity of a priori knowledge also makes external validation more difficult,which is why the study should include more than one method, so that theresults of the different methods can be compared.
It would also be a good idea to include more than one product, allowing the re-sults to be generalised and not solely applying to a specific product. Two differ-ent products – a dairy product and a bread product – have thus been chosen forthis study, and the two products (subsequently referred to as basic products) aresufficiently different to allow a certain degree of generalisation of the results. Inaddition, three enrichment substances were chosen for the study: a) soluble foodfibres, b) omega-3 fatty acid from fish oil, and c) calcium and vitamin D.
Based on the above, together with the aims and theoretical basis of the study,one qualitative and two quantitative methods were employed for the empiricalstudy of consumers’ attitudes towards functional foods. The qualitative studyconsists of two focus-group interviews, and the quantitative methods comprisea conjoint analysis and a survey based on the Theory of Reasoned Action. Theconjoint analysis focuses on describing consumers’ attitudes and assessing theextent to which enrichment leads to a higher value perception than the basicproduct without enrichment, while the survey focuses on explaining whichunderlying beliefs form these attitudes, and the extent to which these have adeterminant effect on the purchasing intention.
2

The study is limited to the Danish market, and all the empirical surveys havebeen carried out in the Aarhus area.
THE CONCEPT OF FUNCTIONAL FOODS1
Basically, food can be enriched in three ways (Engel, 1996). The simplest way isto enrich products with vitamins, minerals, fibre, plant extracts and similarnatural substances. The three enrichment substances discussed here are all ofthis type, which is also the most common form of enrichment in Denmark.Another way is to modify the composition of animal feedstuffs, thereby manipu-lating the basic product itself. The third method of enrichment is what can becalled chemical enrichment, which is enrichment with live cultures (which haveno taste themselves), e.g. Guerana, caffeine or extra protein.
Generally speaking, functional foods can also be classified as follows:
• Upgrading, i.e. the addition of more of a substance that is already presentin the product.
• Substitution, i.e. one substance in the product is replaced by a similar, lessunhealthy/more healthy substance (e.g. fat replaced by omega-3 fatty acid).
• Enrichment, i.e. the addition of a substance that is not present in the basicproduct.
• Elimination, i.e. the elimination of unwanted, unhealthy ingredients, whichis typically how light products are made.
THE EMPIRICAL STUDY
The qualitative study
The first part of the empirical studies consisted of two focus group interviews.The main aim of the qualitative preliminary study was to give an insight intothe problem and to create a basis for the operationalisation of the two quantita-tive studies.
The first focus group consisted of eight persons aged 25-55, six of whom werewomen. The other group consisted of six women aged 60-75. The selectioncriteria were that all ages should be represented, and that respondents shouldbe able to generate useful and relevant information about their food consump-tion and purchasing. Thus, all respondents were those mainly responsible forthe daily shopping in their respective households and regularly bought dairyand bread products.
In the analysis of the two focus groups below, the first part discusses generalaspects of food products, including an examination of the relevance of PerceivedBehavioural Control for this study. Perceived Behavioural Control is a compo-
3
1 See MAPP working paper no 55 (Jonas & Beckmann, 1998) for a more thorough discussion of the concept offunctional foods.

nent proposed by Ajzen (1985), and covers consumers’ perceived control overbehaviour. The second part of the analysis deals with attitudes towardsfunctional foods, including the beliefs associated with eating functional foods.The analysis concludes with a discussion of the importance of the focus groupresults for the operationalisation of the quantitative studies.
General aspects of food products
The respondents regarded the general level of quality of food products in Den-mark as satisfactory, though both groups said that shopping was becoming in-creasingly difficult. Typical comments were: It’s getting so complicated, youalmost have to bring a manual when you go shopping (woman, 47 years old), andyou can’t be expected to know everything (woman, 55). The general impression wasthat confidence in food standards is due more to confidence in the public healthauthorities than in food producers. Several respondents said that the mediaattention given to penicillin residues, salmonella, etc., in food has made them loseconfidence in food producers. A few even went as far as to say that someproducers had undermined the concept of light products and ecological products.Less scrupulous producers thus weaken confidence in the industry as a whole,the result of which is widespread scepticism towards industry initiatives.
The analysis clearly showed that consumers attached a lot of importance to con-venience, the price/quality relation and taste. This merely confirms the findingsof a number of existing studies (see, for example, Tuorila, 1987). Both groupswere fully aware of the power of advertising. As one respondent put it: Advertscan make us believe anything – they’re so convincing (woman, 55). It was alsoevident that public health campaigns to persuade consumers to cut down on fathave hit home, since all respondents were well aware of the harmful effects oftoo much fat, and most of them had tried to change their shopping habitsaccordingly. However, this conflicts with actual behavioural patterns after thevarious campaigns (see, for example, Nørbæk, 1995).
In general, respondents knew quite a bit about the importance of diet to health.The elderly in particular were willing to do a lot to keep healthy and thusremain active. This group also remarked on the difficulty of ensuring a varieddiet in a small household. There was also a general willingness to pay for health,eg through buying vitamin pills, etc., but the credibility of the product concernedwas crucial here. A typical remark was: Does it work – can we trust the manu-facturers? (woman, 58). The elderly in particular relied heavily on “word ofmouth” and impartial persons (eg doctors) as reference persons. The young wereless willing to pay for health – among other things because they had less money.Nonetheless, studies show that it is especially the young who buy ecologicalproducts, which are usually dearer (Bech-Larsen, 1996b).
With regard to ‘perceived behavioural control’ the respondents did not see anyproblems concerning buying, preparing or eating functional foods; consequentlythe Theory of Reasoned Action was chosen as theoretical point of departure.
4
Attitudes towards functional foods, including the consequencesassociated with enrichment
The respondents were unfamiliar with the term functional foods – not one ofthem knew anything about the concept. Everybody had heard of Green Gaio(yoghurt-type product with causido culture), however, and most had heard ofBlue Gaio (spread with omega-3 fatty acis), but nobody had thought of them asbeing enriched. A few ate Green Gaio, but not everybody ate it because of enrich-ment – it was just as much because they liked the taste of it. The elderlyappeared to be more aware of the health effect, however.
The term “functional foods” gave negative associations in both groups (“junkfood” and americanisation), and functional foods were not regarded as an overallsolution to problems of bad and unvaried diets. A typical remark was: Whatevernext? (man, 25), which was fairly representative of the initial scepticism withwhich the concept was greeted. It was thus seen as unnatural, enrichment beingequated with additives, and, as one respondent put it: It makes me think of foodbeing injected with a syringe (woman, 26). This was more common among theyoung and middle-aged (focus group 1) than the elderly (focus group 2). As arespondent in group 1 said: There are no limits to inventiveness when money’sinvolved (man, 31). This led to a discussion as to whether functional foods werea step in the wrong direction – the first step on a slippery slope. Several re-spondents observed that something should be done to change people’s bad foodhabits instead, though they also admitted that this is not easy. The overall viewof the respondents, therefore, was that, once enriched products come onto themarket, most people will choose the easy way, which can also be seen as a formof impotence on the part of consumers. It can thus be concluded that a negativeattitude towards functional foods as a concept does not necessarily mean that,in the long run, consumers will not buy these products.
In general, the elderly were more interested in the concept, and accepted enrich-ment if it involved healthy and natural substances: If it’s good for me, why not?(woman, 66). Attitudes in both groups were generally more positive when it wasadded that the products were enriched with natural substances and not addi-tives in the usual sense. I’d willingly take fish oil if it meant avoiding artificialadditives (woman, 61).
Despite the general scepticism about functional foods as a concept, both groupstended to have much more positive attitudes towards specific examples (eg fruitjuice with calcium, Green Gaio, and imaginary products such as bread withbroccoli extract). This probably reflects an uncertainty about the concept andwhat it involves, and several respondents did in fact say that it would probablybe more accepted when it became better known. At the same time, the differencein attitudes between the concept and product level confirms the belief that con-sumers’ attitudes towards functional foods should be investigated at theproduct-specific level, since this will yield more valid results about attitudestowards specific enriched products.
Both groups recognised the need for such products (diseases of civilisation, thedesire for “eternal youth”, an active life in old age, etc.). The elderly were veryconscious about having an active life and “lasting longer”, and all the elderlyrespondents took various forms of dietary supplements, etc. They also appeared
5
to care little about price if they believed there was an effect, which, from a mar-keting point of view, is interesting in relation to functional foods. As one of theelderly put it: We’re easy targets (woman, 71), in the sense that, it they think itworks, the elderly will buy even quite expensive products. The elderly in parti-cular observed that functional foods were a convenient way of getting dailydoses of various substances.
The interviews revealed clear reservations about functional foods. Both groupssaid that control and information are important. This can prove to be decisive,since respondents felt they were not equipped to judge the various functionalfoods, which was reflected in such comments as: We don’t know enough to be ableto see through the sales pitch (woman, 68). The respondents were generally sus-picious about manufacturers’ motives (profit) and competencies (pseudo-science). We’re at the mercy of the manufacturers (man, 31). The respondentsalso felt that it would be hard to assess the effect of enrichment, and belief inan effect was stated as being an important reason for buying the product.
The respondents wanted clear information about what enrichment was sup-posed to be good for and about whether the amount can be controlled (too much,when has one had enough, and what is the combined effect of several functionalfoods?). An impartial regulatory body would thus clearly increase credibility,and in this connection the elderly were unanimous in saying that if doctors re-commended a product, eg on radio or TV, they would definitely buy it. A furtherbarrier as regards functional foods was the fear of changes in taste.
Importance of the results for the design of the conjoint analysis andsurvey
The focus-group interviews identified the most important attributes and pur-chasing motives for the two basic products, together with respondents’ attitudestowards functional foods. Based on this, a number of choices were made for thetwo quantitative studies. As regards the conjoint analysis, the most importantattributes for the dairy product were: price, type (ordinary or ecological) andpackaging (cardboard or plastic). The most important attributes for the breadproduct were: price, type (white or brown) and brand. In addition, enrichmentwill be included as a fourth attribute for both products.
For the survey, we chose beliefs concerning taste, price and naturalness as ex-planatory variables for the attitude component, AB, since these were commonpurchasing motives/perceived consequences in relation to functional foods (andthe dairy product and bread product in general). Convenience was also a pro-minent purchasing motive for functional foods, respondents saying that it wouldbe more convenient to take vitamins, minerals, etc., through their daily diet.Furthermore, we formulated beliefs concerning respondents’ uncertainty aboutdosage (too much or too little) and a belief concerning whether the enrichedproducts have a better effect on health than the corresponding conventionalproducts. We have also included a belief on respondents’ confidence in produ-cers’ competence, plus a belief concerning respondents’ perception of their sub-jective knowledge about the health effects of enrichment.
6
Summary of focus group results
The results from the two focus groups show that the success of functional foodsin Denmark will depend on the fulfilment of a number of conditions. Clearly, ob-jective and well-documented information will be crucial, and (government) con-trol of food producers will considerably increase trust in the various producers,and thus also functional foods as a whole. While consumers are generally scep-tical about functional foods as a concept, attitudes are more positive at the prod-uct level. The elderly are a prime segment, inasmuch as they are more interestedand less price sensitive. The very term “functional foods” gives many consumersnegative associations, so a new and more neutral name would be advisable.
The focus groups showed that the main barriers to functional foods are:
• Distrust of manufacturers’ motives and competence (credentials).
• Consumers’ lack of ability to evaluate functional foods (Credence charac-teristics. See, for example, Andersen (1994) for an in-depth discussion of cre-dentials and credence characteristics.)
– Uncertainty about the health effects of enrichment (does it work; con-fidence in producers).
– Uncertainty about dosage (too much or too little?).
• Consumers think they can taste the enrichment substances.
• Consumers generally associate functional foods with something unnatural.
Manufacturers must therefore be perceived to be credible, so that consumersfeel confident about their products. If both products, documentation and infor-mation are credible and objective, even trusted experts (doctors, etc.) are likelyto endorse the product, which will probably increase consumers’ trust evenmore, especially the elderlies’.
The quantitative studies
Data collection
Since the empirical part of the study is based on two different methods, it wouldobviously be best to use the same respondents for both methods. Among otherthings, this will allow us to investigate (via the survey) which beliefs determinepreferences (the conjoint analysis). It also means each respondent being inter-viewed for two conjoint interviews (one for the dairy product and one for thebread product), in addition to filling out a questionnaire, which all in all israther a lot. It was therefore decided that this would be asking too much, and adifferent approach was chosen, where the cjoint interview as conducted at thesupermarket and given a questionnaire and a stamped, self-addressed envelopeto take home.
7

According to Wells (1993), consumer-psychological research all too often lacksecological validity, since students are typically used as respondents. Moreover,the studies are carried out in an unrealistic context. In this study, we have triedto increase the ecological validity by carrying out the conjoint analysis close tothe point of purchase, immediately after consumers leave it. Respondents arethus contacted at the exit, thereby ensuring that they have gone through thesame cognitive decision processes (purchase of groceries) required in the study,which, ceteris paribus, will increase its ecological validity. In addition, twoscreening questions were used in order to ensure that respondents were rele-vant and suitable for the study, which also increased its validity. The screeningquestions were meant to ensure that respondents (a) were those responsible fordaily shopping, and (b) regularly bought both basic products.
It can be seen from the above that the sample was not chosen by randomselection. This is a fairly normal approach in experiments which often requirethe researcher to be present. In order to increase the randomness of the sample,we chose an approach where every third consumer to leave the supermarketwas contacted. The respondents were contacted outside three different super-markets: one in the centre of Aarhus, one in an Aarhus suburb and one in a townin the Aarhus hinterland.
The conjoint analysis
A conjoint analysis was chosen for several reasons. Firstly, it is well suited tothe study of imaginary products, and secondly, experiments often give morevalid results (Blunch, 1990). Conjoint analysis is a general term for a number ofdecompositional methods for determining preference structures (see, forexample, Green & Srinivasan, 1978, 1990; Louviere, 1994).
Like the expectancy-value models which constitute part of its theoretical basis,conjoint analysis is also compensatory. Conjoint analysis thus has a theoreticalbasis in utility theory and expectancy-value models (see, for example, Ajzen &Fishbein, 1980; Rosenberg, 1956), as well as Lancaster’s theory of consumer be-haviour (Green & Srinivasan, 1978; Louviere, 1994). Lancaster (1966) assumesthat consumers’ utility of a product can be decomposed into a separate utilityfor each of the product’s attributes, much like multi-attribute models, whichassume that consumers’ overall attitude towards a product is expressed by thesum of their attitudes towards the product’s individual attributes. Multi-attri-bute attitude models are thus characterised by a “build-up” approach, whereasconjoint analysis takes a starting point in the overall attitude and then breaksthis down (decomposes) into attitudes towards individual attributes.
While multi-attribute models and conjoint analysis have a common theoreticalbasis, they often have different aims. Thus, expectancy-value models mainly ex-plain why and how a concrete attitude is formed, while conjoint analysis focusesmore on the prediction/determination of consumers’ attitudes based on trade-offs between the various attributes and the levels of these attributes, and, al-though explanations of why and how the attitudes have been formed are desir-able, they are a secondary aim of the analysis (Green & Srinivasan, 1978).
8

Using conjoint analysis enables the transformation of consumers’ subjectiveattitudes towards estimated parameters in the form of utility functions (Green& Srinivasan, 1978). The interesting thing about utility functions is that theymake it possible to observe the consequences of a change in the level of an attri-bute for the overall preference. Conjoint analysis thus makes it possible to im-plicitly estimate the relative importance of individual pre-specified attributes.The advantage of the estimation being implicit is that it prevents respondentsoverestimating the significance of individual attributes, which is a risk with ex-plicit estimation (Green & Rao, 1971). Another advantage of implicit estimationis that the method better reflects consumers’ decision process in the actual pur-chase situation.
A further advantage of conjoint analysis is that it can be used to show howimaginary products will be received by consumers. As a result of this possibility,conjoint analysis is today widely used in, among other things, product develop-ment and concept testing (Crawford, 1997; Green & Srinivasan, 1990; Green &Krieger, 1987, 1991a).
Conjoint analysis is based on a linear compensatory assumption expressed asfollows, and is, with the use of the OLS algorithm, parallel to regression withdummy (Grunert, 1996):
(1)
where Ui = the total utility for product i
Xijk = 1 if product i has level k for variable j, otherwise 0
βkj = contribution to total utility of level k for variable j
ei = error component for product i
The variables (Xj) are the various prespecified attributes included in the studydesign.
According to Blunch (1990), conjoint analysis is unsuitable for the analysis ofgroceries characterised by a low degree of involvement and habitual purchasingbehaviour, which must be assumed to be the case with the dairy and bread prod-ucts. Consumers are likely to make some kind of decision as regards new prod-uct varieties, however, which are the focus of this study. The main thing for thisstudy is thus not how consumers make decisions within a given evoked set(Howard & Sheth, 1988), but how they react to new product types. Thus, the wayin which the conjoint analysis encourages consumers to compare various alter-natives should not be assumed to be much different from an actual purchasingsituation where the consumer notices a new product (Thøgersen, 1996). More-over, a number of applications of conjoint analysis on groceries have shown thatthe method is usable and gives valid results (see, for example, Baadsgaard, Gru-nert, Grunert & Skytte, 1994; Bech-Larsen, 1996b; Grunert, 1996; Speece &Maclachlan, 1991; Thøgersen, 1996; Wittink & Cattin, 1989).
U X ei kjjk
ijk i= +∑∑ β
9
Design and data collection
The respondents were asked to rank product profiles of the dairy and breadproduct according to the likelihood of their buying the product varieties. Theproduct profiles contained a colour photograph and a description of the respec-tive product varieties. The attributes included in the conjoint analyses wereidentified during the focus-group interviews. The attributes for the dairyproduct are: price (consumers were confronted with three different prices: DKK5.50, DKK 6.25, and DKK 7.00), type (ordinary, ecological) and packaging(cardboard, plastic). Those for the bread product are: price (DKK 17.00, DKK19.25, and DKK 21.50), type (white, brown) and make (brand, discount label). Inaddition to these, enrichment (no enrichment, omega-3, fibre or calcium andvitamin D) is included as a fourth attribute for both products.
There is a total of 48 product combinations (2x2x4x3) for both the dairy and thebread product, which is too many for the respondents to cope with. A reduceddesign of 16 product profiles for each product was therefore created using theprogram “Conjoint Designer” (Bretton-Clark, 1990). In addition, a so-called hold-out card, for validating the results of the study, was also included in the design.
The conjoint interviews were carried out in the autumn of 1997. A total of 1029persons were contacted, of whom 689 agreed to participate. Of these, the screen-ing questions found 332 suitable respondents, of whom 218 agreed to participatein the actual study. 210 respondents returned the questionnaire, of which 205were valid, and due to the desire to merge the two studies, the analysis is basedon these 205 respondents.
Results
The program “Conjoint Analyzer” (Bretton-Clark, 1992) was used to estimate theutility function and the relative importance of the attributes. The program alsoestimates individual utility functions for the 205 respondents, and these showthat, in general, respondents have been consistent in ranking the product pro-files, both as regards the dairy and the bread product. Of the 205 respondents,192 have an adjusted correlation coefficient (adj. R2) of over 0.4 for the dairyproduct and 190 have a value greater than 0.4 for the bread product. The corre-lation coefficient is a measure of how well the variation in data is described bythe selected attributes. Neither Bretton-Clark (1992) nor the other literature onconjoint analysis specify standards for the determination of a minimum for thecorrelation coefficient. Bech-Larsen (1996) and Thøgersen (1996) use a mini-mum of 0.3 and 0.4 respectively, though without explaining why. In this study,the limit is set at 0.4, which is why the remaining analyses are based on the 192respondents for the dairy product and the 190 for the bread product. Since therespondents eliminated by screening only constitute about 7% of all respond-ents, their demographic characteristics have not been examined further. The ag-gregated adjusted correlation coefficient is 0.898 for the dairy product (SE =0.018) and 0.837) for the bread product (SE = 0.018), which is highly satisfactory.
The distribution of the respondents by preference for different levels has beenestimated by means of Bretton-Clark (1992), and is shown in tables 1 and 2.
10
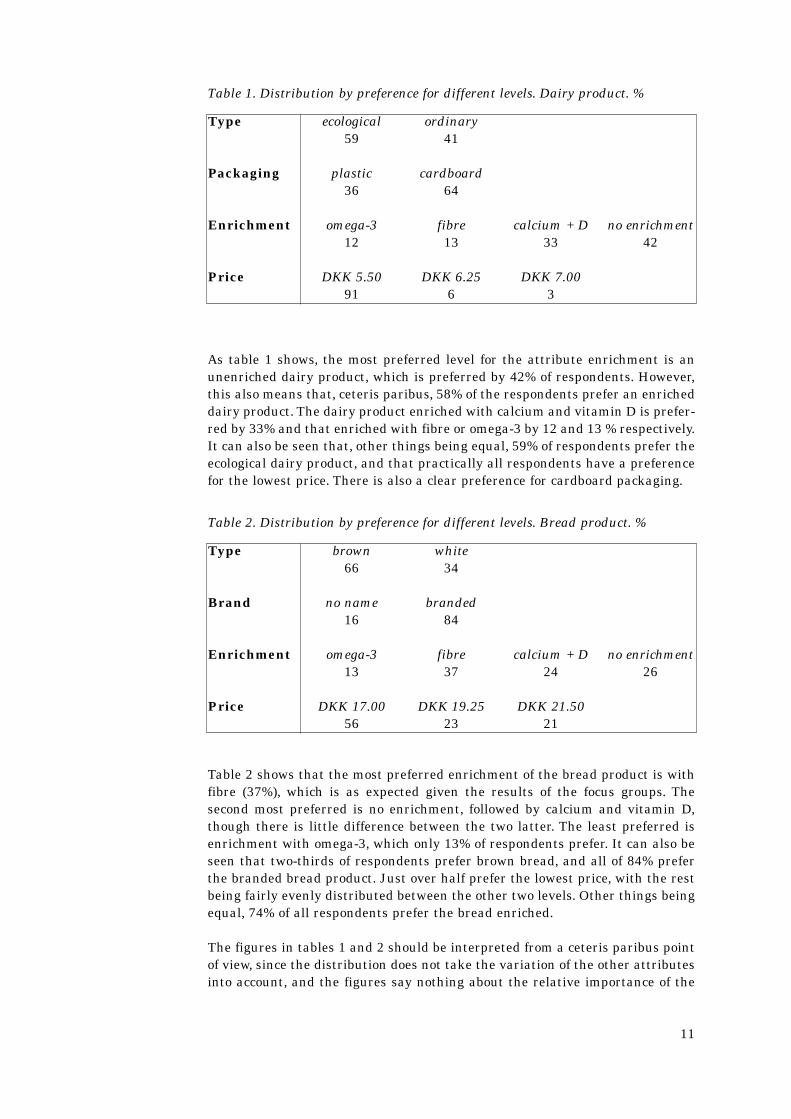
As table 1 shows, the most preferred level for the attribute enrichment is anunenriched dairy product, which is preferred by 42% of respondents. However,this also means that, ceteris paribus, 58% of the respondents prefer an enricheddairy product. The dairy product enriched with calcium and vitamin D is prefer-red by 33% and that enriched with fibre or omega-3 by 12 and 13 % respectively.It can also be seen that, other things being equal, 59% of respondents prefer theecological dairy product, and that practically all respondents have a preferencefor the lowest price. There is also a clear preference for cardboard packaging.
Table 2 shows that the most preferred enrichment of the bread product is withfibre (37%), which is as expected given the results of the focus groups. Thesecond most preferred is no enrichment, followed by calcium and vitamin D,though there is little difference between the two latter. The least preferred isenrichment with omega-3, which only 13% of respondents prefer. It can also beseen that two-thirds of respondents prefer brown bread, and all of 84% preferthe branded bread product. Just over half prefer the lowest price, with the restbeing fairly evenly distributed between the other two levels. Other things beingequal, 74% of all respondents prefer the bread enriched.
The figures in tables 1 and 2 should be interpreted from a ceteris paribus pointof view, since the distribution does not take the variation of the other attributesinto account, and the figures say nothing about the relative importance of the
11
Table 1. Distribution by preference for different levels. Dairy product. %
Type
Packaging
Enrichment
Price
ecological59
plastic36
omega-312
DKK 5.5091
ordinary41
cardboard64
fibre13
DKK 6.256
calcium + D33
DKK 7.003
no enrichment42
Table 2. Distribution by preference for different levels. Bread product. %
Type
Brand
Enrichment
Price
brown66
no name16
omega-313
DKK 17.0056
white34
branded84
fibre37
DKK 19.2523
calcium + D24
DKK 21.5021
no enrichment26
attributes. And, of course, the distribution is also a function of the number oflevels for the attributes in question.
Generally speaking, the preference distributions in the two tables show that,other things being equal, some consumers will prefer enriched products. Theresults also indicate that the naturalness of the enriched substance vis-à-vis thebasic product is decisive, and that the relatively big difference between the twoproducts in the percentage of respondents who do not want enrichment pointsto the importance of the basic product itself. These results confirm the resultsof the focus group interviews, where both groups indicated the naturalness ofthe enrichment substance in relation to the basic product and the basic productitself as being important in determining their preferences. At first sight, itmight seem surprising that omega-3 is not preferred by more respondents. Afterall, omega-3 bread has been available for a while now, and the study was carriedout just after MD Foods’ intensive marketing of Blue Gaio, a spread enrichedwith omega-3 fatty acids. However, it soon became clear that a lot of respond-ents didn’t know what omega-3 was. This ignorance about omega-3, and thusalso its health effect, must therefore be assumed to be the main reason why thisform of enrichment was so little preferred by the respondents. The conjointanalyses do not allow such an unambiguous conclusion, however, since, as men-tioned above, their aim is first and foremost to describe consumers’ preferences.A more detailed analysis of the causes of the preference difference will thereforebe presented in connection with the analysis of the survey.
Homogeneity of the respondents
Before interpreting the estimated utility functions, it is necessary to examinewhether respondents have homogeneous preferences as regards the attributes’relative importance and the individual levels. In order to evaluate this, both anaggregated and an individual utility function for the 190/192 respondents hasbeen calculated using Bretton-Clark (1992). The aggregated relative importance(ARI) of the attributes is calculated in one sequence on the basis of all the data,whereas the individual relative importance (IRI) is calculated in two sequences.With the latter, the individual utility functions for all the respondents arecalculated first, after which they are added up and a simple average calculated.IRI thus contains the entire “span” of relative importance, while this is evenedout with ARI. By comparing the two estimates, it is possible to assess whetherthe respondents have homogeneous preferences. If the two estimates differ morefrom each other than can be explained by a measurement error (standarddeviation), it means the respondents are heterogeneous (Bretton-Clark, 1992),and an interpretation based on ARI will not yield valid conclusions.
Tables 3 and 4 show the calculations of IRI and ARI for the dairy product andbread product respectively.
12

As can be seen from the two tables, with the exception of packaging for the dairyproduct, the respondents have clear heterogeneous preferences. This is alsoemphasised by the fact that the order of the attributes’ relative importance isdifferent for IRI and ARI for both products. This also indicates a segmentedmarket (Bretton-Clark, 1992) for both products.
As mentioned, the heterogeneity of preferences means that interpretationsbased on the aggregated utility functions will not yield valid conclusions. Theattribute enrichment is generally very significant for the respondents, however,the IRI of both products being greatest for enrichment. Only a segmentation canshed more light on this, since, as previously mentioned, the respondents’ prefer-ences are not homogeneous.
Segmentation
In a conjoint analysis, the segmentation of respondents can be carried out on thebasis of the individual utility functions. The purpose of segmentation is, as men-tioned, to identify segments which attach relatively much importance to enrich-
13
Individual Aggregated
Rel. Importancea) Rel. Importance
Type 19.61 (1.23) 12.46
Packaging 18.72 (1.28) 19.45
Enrichment 45.64 (1.49) 29.66
Price 16.03 (0.99) 38.43
Total 100 100
a) Standard deviation in brackets.
Table 4. Aggregated and individual importance of the attributes. Breadproduct. %
Individual AggregatedRel. Importancea) Rel. Importance
Type 14.83 (0.91) 10.00
Brand 23.29 (1.31) 38.89
Enrichment 42.64 (1.55) 28.96
Price 19.24 (1.11) 22.15
Total 100 100
a) Standard deviation in brackets.
Table 3. Aggregated and individual importance of the attributes. Dairyproduct. %
ment, plus to try to identify segments with homogeneous preferences as regardsthe individual levels, and if so, estimate their accompanying utility functionsand identify their demographic characteristics.
The segmentation was carried out using the program “Conjoint Segmenter”(Bretton-Clark, 1993). This uses a hierarchical cluster analysis (Ward’smethod), where homogeneity is maximised within the individual clusters andminimised between them.
The program can handle from 2 to 15 clusters, and shows a dissimilarity mea-sure for the number of clusters (see appendix 1). There are no specific rules orstatistical methods for choosing the number of clusters (Bretton-Clark, 1993),and, as in many other cases, the trade-off between clarity and precision is part-ly what determines the choice. The dissimilarity measures can be used in thesame way as a scree plot in factor analysis (Bretton-Clark, 1993), where a largedecrease in the dissimilarity measure indicating that relatively greater homoge-neity can be achieved by the addition of an extra cluster. The aim of the analysisshould also be considered and has been decisive for the number of clusterschosen in this analysis, since it was important to identify a segment with a pre-ference for every level of the enrichment attribute (including no enrichment).This means that, in the subsequent analyses, it will be possible to identify anydemographic difference with regard to preferences for the respective enrichmentlevels, plus evaluate via the survey which beliefs are the most important for posi-tive or negative attitudes towards the various enrichment substances. In orderto ensure that enrichment has a certain relative importance for the respondentsin the identified segments vis-à-vis the other product attributes, the clusteranalysis is based on utility values for all the attributes, and not just enrichment.
In order to be sure of identifying a segment for every enrichment level (includingno enrichment), it was necessary to have seven clusters for the dairy product andnine for the bread product. This gave the desired four segments for the breadproduct, though not separate segments for fibre and omega-3 for the dairy prod-uct. That the number of clusters for the dairy product was limited to seven is dueto the fact that further segmentation would not result in separate segments forfibre and omega-3. Moreover, the mixed segment with a preference for bothomega-3 and fibre is very small (n=22), which would make further segmentationpointless. It is not surprising that separate segments cannot be identified forfibre and omega-3, since, other things being equal, only 13% of respondents pre-fer each of the two substances in the dairy product (see table 1), while segmen-tation is based on overall evaluation in relation to all the attributes in the design.
A smaller number of clusters would make interpretation easier, and the methodmeant that existing clusters with homogeneous preferences for the enriched sub-stances were divided because of heterogeneity in relation to other attributes. Forreasons of clarity, in the tables below these clusters have again been combined, acalculation of ARI and IRI showing that it wouldn’t affect homogeneity as re-gards the enrichment substances (see appendix 2). Since combining the clustersagain merely means returning respondents to their original cluster, and doesn’taffect homogeneity as regards enrichment, this is methodologically defensible.
14

As can be seen from tables 5 and 6, several segments for both products attach re-latively much importance to enrichment. These segments will therefore be ana-lysed more closely. The segments marked *) consist of the combined clusters, andthus are not homogeneous for all attributes. As mentioned, however, the respond-ents in these segments are homogeneous in the relative weight they attach to en-richment, which is what matters as far as this study is concerned. An even if theclusters were not combined, there would still be heterogeneity with regard to theother attributes. In practice, therefore, complete homogeneity is impossible toachieve if, at the same time, the clusters have to be kept at a manageable andmeaningful number.
Now that segments with homogeneous preferences for enrichment have beenidentified, we can estimate and interpret utility functions for individual seg-ments. This is done by means of the “Conjoint Analyzer” program (Bretton-Clark,1992). The analysis will focus on those segments which, relatively speaking,attach the greatest importance to enrichment, ie segments D2, D3, D4, B2, B3,B4 and B6 (utility functions for the other segments are shown in appendix 3). Itcan be seen in table 7 (dairy product) that segment D2 (37.5% of respondents) at-taches a lot of importance to the dairy product not being enriched, and eventhough this segment has a small positive utility from enrichment with calciumand vitamin D, the utility from a non-enriched product is significantly higher.
15
Table 5. ARI for all respondents and segments. Dairy product. %
All D1 D2*) D3*) D4 D5n=192 n=35 n=72 n=45 n=22 n=18
Type 12.46 2.21 20.25 18.29 6.34 51.47
Packaging 19.45 65.53 6.84 1.88 33.92 2.15
Enrichment 29.66 17.48 52.75 42.94 52.25 17.11
Price 38.43 14.78 20.16 36.89 7.49 29.27
Total 100. 100 100 100 100 100*) Segments consisting of two combined clusters.
Table 6. ARI for all respondents and segments. Bread product. %
All B1 B2*) B3*) B4*) B5 B6n=190 n=20 n=45 n=53 n=38 n=19 n=15
Type 10.00 29.20 9.31 18.04 11.54 0.42 14.82
Brand 38.89 35.34 22.18 32.80 37.58 18.27 17.13
Enrichment 28.96 18.72 61.87 35.19 44.78 16.82 49.92
Price 22.15 16.74 6.64 13.98 6.10 64.49 18.13
Total 100 100 100 100 100 100 100*) Segments consisting of two combined clusters.

*) The aggregated utility function is included solely as an illustration. Due to heterogeneity, an
interpretation of the aggregated utility function does not yield valid conclusions.
Segment D2 also prefers the ecological dairy product in cardboard packaging,and, relatively speaking, is not very price sensitive. Younger respondents areoverrepresented in D2 and respondents over 55 underrepresented, and there isalso a slight overrepresentation of men.
Segment D3 (23.5% of respondents) has a clear preference for the calcium andvitamin D-enriched dairy product. Two-thirds of the segment is very price sensi-tive while the other third is hardly price sensitive at all. As with D2, there is aslight preference for the ecological dairy product, but in this segment packaging
16
Table 7. Dairy product: Utility functions, relative importance of attributes anddemographic characteristics for all respondents and segments D2, D3 and D4
All D2 D3 D4n=192* n=72 n=45 n=22
Type; relative importance 13% 20% 18% 7%– Ecological 0.5 1.2 1.2 -0.3– Ordinary -0.5 -1.2 -1.2 0.3
Packaging; relative importance 19% 7% 2% 34%– Plastic -0.7 -0.4 -0.1 1.8– Cardboard 0.7 0.4 0.1 -1.8
Enrichment; relative importance 30% 53% 43% 52%– Omega-3 -1.2 -2.2 -1.2 1.2– Fibre -0.7 -2.1 -0.3 3.0– Calcium og vitamin D 0.8 0.2 3.6 -1.6– No enrichment 1.1 4.1 -2.1 -2.6
Price; relative importance 38% 20% 37% 7%– DKK 5.50 -10.3 -8.9 -17.8 -2.9– DKK 6.25 -11.7 -10.2 -20.3 -3.3– DKK 7.00 -13.1 -11.4 -22.7 -3.7
Demography:Age– 30 years 25% 34% 24% 9%– 31-55 years 50% 50% 42% 59%– 56- years 25% 16% 33% 32%
Sex– male 23% 30% 18% 0%– female 77% 70% 82% 100%
Education– up to and including A-level 65% 60% 71% 54%– higher education 35% 40% 29% 46%
Household income– < DKK 300.000 58% 57% 60% 55%– > DKK 300.000 42% 43% 40% 45%

is unimportant. There is a clear overrepresentation of respondents over 55 insegment D3, together with women and persons with little formal education.
Segment D4 (11.5%) prefers both fibre and omega-3, though with a significantlyhigh utility for the former. This segment is indifferent to the type of dairy prod-uct, but attaches relatively much importance to packaging, and is the only seg-ment to prefer plastic packaging. It is also the most price sensitive segment. Themiddle-aged and elderly are overrepresented, and the segment consists entirelyof women. There is also an overrepresentation of respondents with a highereducation.
Surprisingly, the preference for the ecological dairy product is no greater in thesegment which prefers the non-enriched product than in the segment whichprefers enrichment with calcium and vitamin D. It would only be reasonable toassume that consumers who prefer ecological food products, which are producedby relatively natural production methods, would also prefer non-enriched prod-ucts, since there can be a conflict between (natural) ecological and enrichedproducts, even though the enrichment substance is natural. However, the pre-ference for the ecological dairy product is at the same level in both D2 and D3(approximately the same relative importance, and part-worths). Thus, theredoesn’t seem to be a conflict when products are enriched with calcium and vita-min D. Enrichment with calcium and vitamin D is a relatively natural enrich-ment, however, and only represents an upgrading of the product. Enrichmentwith fibre and omega-3 is another matter. As table 7 shows, the segment whichprefers enrichment with fibre and omega-3 (D4) also prefers the conventionaldairy product, and for these respondents the attribute “type” is more or less un-important. This therefore indicates an (expected) conflict between ecology andfunctional foods in cases where enrichment is not considered to be natural inrelation to the basic product. This is also a reflection of a certain degree ofinteraction effect between the two attributes, though an assumption about amarginal importance of interaction effects are still considered valid. Neverthe-less, the observed interaction between “type” and “enrichment” means that therelative importance of the two attributes can be slightly overestimated, sincethe same information is measured twice.
Table 8 (bread product) shows that segment B2 (23.5% of the respondents) hasa clear preference for the bread product without enrichment. The segment alsohas a positive utility from enrichment with fibre, however, though it is far lessthan that for the non-enriched bread. The segment can thus clearly be charac-terised as a segment which prefers non-enriched bread. The segment has anoverrepresentation of middle-aged respondents and respondents with a highereducation, while the elderly are underrepresented.
17
*) The aggregated utility function is included solely as an illustration. Due to heterogeneity, an
interpretation of the aggregated utility function does not yield valid conclusions.
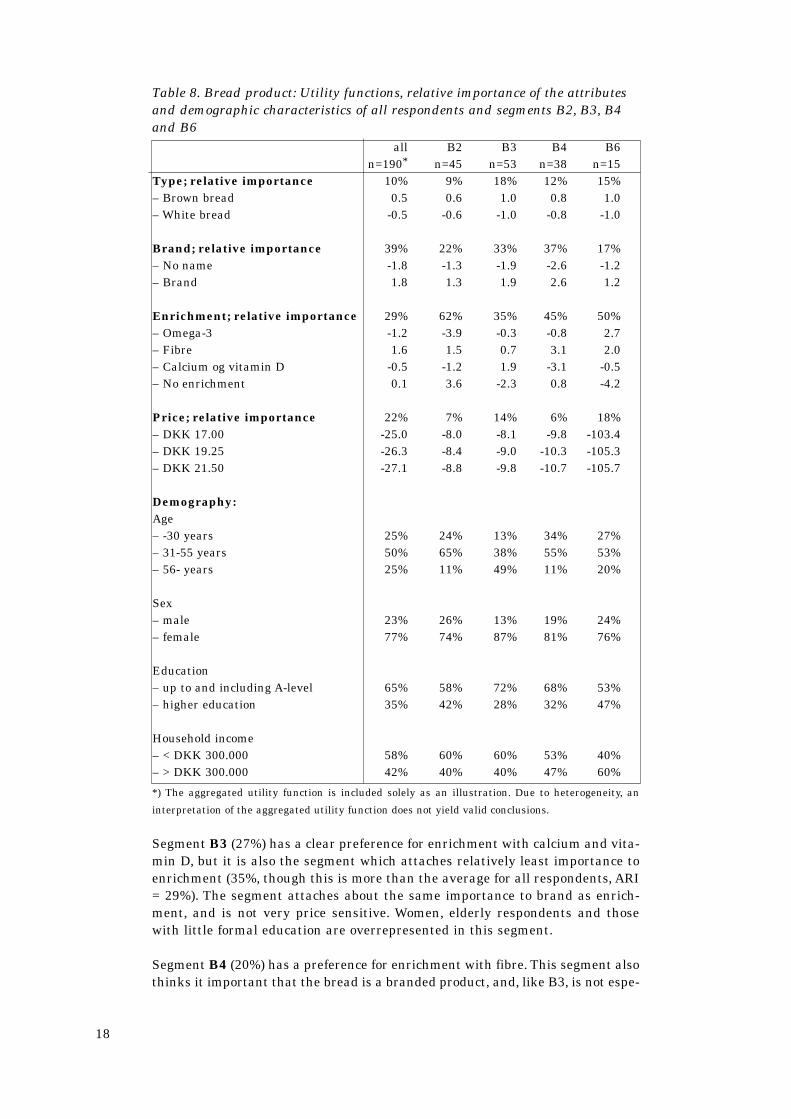
Segment B3 (27%) has a clear preference for enrichment with calcium and vita-min D, but it is also the segment which attaches relatively least importance toenrichment (35%, though this is more than the average for all respondents, ARI= 29%). The segment attaches about the same importance to brand as enrich-ment, and is not very price sensitive. Women, elderly respondents and thosewith little formal education are overrepresented in this segment.
Segment B4 (20%) has a preference for enrichment with fibre. This segment alsothinks it important that the bread is a branded product, and, like B3, is not espe-
18
Table 8. Bread product: Utility functions, relative importance of the attributesand demographic characteristics of all respondents and segments B2, B3, B4and B6
all B2 B3 B4 B6n=190* n=45 n=53 n=38 n=15
Type; relative importance 10% 9% 18% 12% 15%– Brown bread 0.5 0.6 1.0 0.8 1.0– White bread -0.5 -0.6 -1.0 -0.8 -1.0
Brand; relative importance 39% 22% 33% 37% 17%– No name -1.8 -1.3 -1.9 -2.6 -1.2– Brand 1.8 1.3 1.9 2.6 1.2
Enrichment; relative importance 29% 62% 35% 45% 50%– Omega-3 -1.2 -3.9 -0.3 -0.8 2.7– Fibre 1.6 1.5 0.7 3.1 2.0– Calcium og vitamin D -0.5 -1.2 1.9 -3.1 -0.5– No enrichment 0.1 3.6 -2.3 0.8 -4.2
Price; relative importance 22% 7% 14% 6% 18%– DKK 17.00 -25.0 -8.0 -8.1 -9.8 -103.4– DKK 19.25 -26.3 -8.4 -9.0 -10.3 -105.3– DKK 21.50 -27.1 -8.8 -9.8 -10.7 -105.7
Demography:Age– -30 years 25% 24% 13% 34% 27%– 31-55 years 50% 65% 38% 55% 53%– 56- years 25% 11% 49% 11% 20%
Sex– male 23% 26% 13% 19% 24%– female 77% 74% 87% 81% 76%
Education– up to and including A-level 65% 58% 72% 68% 53%– higher education 35% 42% 28% 32% 47%
Household income– < DKK 300.000 58% 60% 60% 53% 40%– > DKK 300.000 42% 40% 40% 47% 60%
cially price sensitive. The younger respondents are overrepresented in this seg-ment, which also has a preponderance of women and middle-aged respondents.
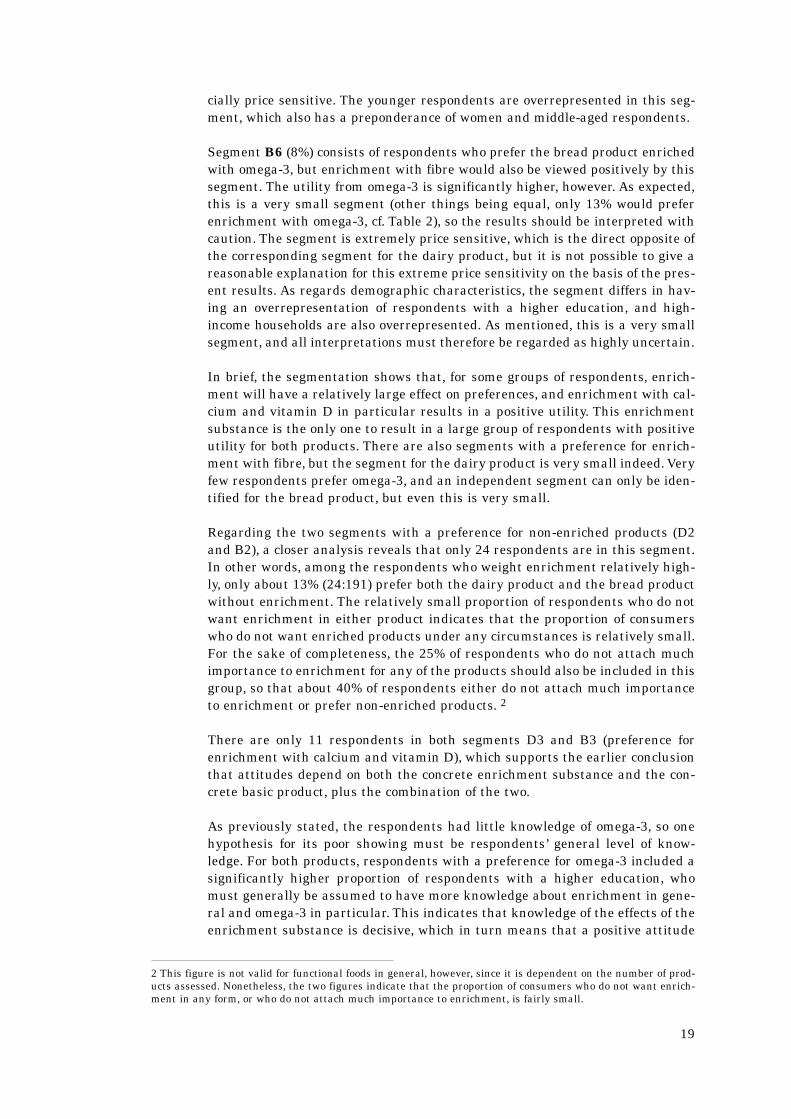
Segment B6 (8%) consists of respondents who prefer the bread product enrichedwith omega-3, but enrichment with fibre would also be viewed positively by thissegment. The utility from omega-3 is significantly higher, however. As expected,this is a very small segment (other things being equal, only 13% would preferenrichment with omega-3, cf. Table 2), so the results should be interpreted withcaution. The segment is extremely price sensitive, which is the direct opposite ofthe corresponding segment for the dairy product, but it is not possible to give areasonable explanation for this extreme price sensitivity on the basis of the pres-ent results. As regards demographic characteristics, the segment differs in hav-ing an overrepresentation of respondents with a higher education, and high-income households are also overrepresented. As mentioned, this is a very smallsegment, and all interpretations must therefore be regarded as highly uncertain.
In brief, the segmentation shows that, for some groups of respondents, enrich-ment will have a relatively large effect on preferences, and enrichment with cal-cium and vitamin D in particular results in a positive utility. This enrichmentsubstance is the only one to result in a large group of respondents with positiveutility for both products. There are also segments with a preference for enrich-ment with fibre, but the segment for the dairy product is very small indeed. Veryfew respondents prefer omega-3, and an independent segment can only be iden-tified for the bread product, but even this is very small.
Regarding the two segments with a preference for non-enriched products (D2and B2), a closer analysis reveals that only 24 respondents are in this segment.In other words, among the respondents who weight enrichment relatively high-ly, only about 13% (24:191) prefer both the dairy product and the bread productwithout enrichment. The relatively small proportion of respondents who do notwant enrichment in either product indicates that the proportion of consumerswho do not want enriched products under any circumstances is relatively small.For the sake of completeness, the 25% of respondents who do not attach muchimportance to enrichment for any of the products should also be included in thisgroup, so that about 40% of respondents either do not attach much importanceto enrichment or prefer non-enriched products. 2
There are only 11 respondents in both segments D3 and B3 (preference forenrichment with calcium and vitamin D), which supports the earlier conclusionthat attitudes depend on both the concrete enrichment substance and the con-crete basic product, plus the combination of the two.
As previously stated, the respondents had little knowledge of omega-3, so onehypothesis for its poor showing must be respondents’ general level of know-ledge. For both products, respondents with a preference for omega-3 included asignificantly higher proportion of respondents with a higher education, whomust generally be assumed to have more knowledge about enrichment in gene-ral and omega-3 in particular. This indicates that knowledge of the effects of theenrichment substance is decisive, which in turn means that a positive attitude
19
2 This figure is not valid for functional foods in general, however, since it is dependent on the number of prod-ucts assessed. Nonetheless, the two figures indicate that the proportion of consumers who do not want enrich-ment in any form, or who do not attach much importance to enrichment, is fairly small.

towards an enriched product will depend on knowledge of the enrichmentsubstance, and that, from a manufacturer’s point of view, functional foodsshould initially be kept at a relatively simple level. This point will be analysedin greater depth in connection with the questionnaire survey, which preciselydeals with respondents’ subjective knowledge and assessment of the healtheffects of the enrichment substances.
Validity of the conjoint analysis
Actual validity tests are rarely carried out in connection with conjoint analyses(Green & Srinivasan, 1990), most often only the adjusted correlation coefficient(R2) being used as an indicator of the study’s reliability and validity. TheBretton-Clark programs (1990, 1992) allow a so-called hold-out analysis to becarried out, which evaluates respondents’ consistency as regards the ranking ofthe profile cards (Bretton-Clark, 1990). The present design includes a hold-outcard, and the result of the hold-out analysis for the two conjoint analyses isshown in tables 9 and 10.
The hold-out analysis consists in a calculation of the correlation coefficient(Pearson’s r) between the expected rank of the hold-out card and its actual rank,together with a calculation of the average absolute rank interval (AAR) betweenthe actual and expected rank. Both calculations take a starting point in the esti-mated utility function. Since the respondents have heterogeneous preferences,the ideal would be to base the analysis on respondents’ individual utility func-tions (Bretton-Clark, 1992), but this requires the use of three hold-out cards. Soas not to make the conjoint interview too long, only one card has been used, sothe analysis is carried out at the aggregated level.
20
Table 9. Hold-out analysis for the dairy product for all respondents and the fivesegments
All D1 D2 D3 D4 D5
Pearson’s r 0.88 0.75 0.88 0.79 0.76 0.72
GAR 1.66 1.44 1.32 1.62 2.27 2.18
Table 10. Hold-out analysis for the bread product for all respondents and thesix segments
All B1 B2 B3 B4 B5 B6
Pearson’s r 0,77 0,82 0,77 0,67 0,90 0,71 0,74
GAR 2,00 1,57 1,79 2,13 1,40 1,93 2,24
While Bretton-Clark (1992) does not specify concrete standards for acceptable va-lues for the two measures, several guidelines are not specified, on the basis ofwhich the above values for the total function and the individual segments mustbe regarded as completely satisfactory for both products. Respondents appear tohave been slightly less consistent in ranking the bread product, which agrees withthe significantly higher aggregated correlation coefficient for the dairy product.
Concluding remarks on the conjoint analysis
The conjoint analyses show that about three-quarters of respondents (72% forthe dairy product and 79% for the bread product) attach a lot of importance toenrichment (including no enrichment). A clustering also identified segmentswith a preference for the individual enrichment substances (though not sepa-rate segments for enrichment with fibre and omega-3 for the dairy product) andsegments which did not want enrichment at all (38% for the dairy product and24% for the bread product). However, a closer analysis of those respondents whoattach relatively great importance to enrichment revealed that only about 13%of these did not want enrichment for either product. About 25% of respondentsdid not attach much importance to enrichment, and thus also functional enrich-ment, for either product. All in all, therefore, just under 40% of respondentseither attach relatively little importance to enrichment or do not want it at all.As mentioned above, however, this figure should not be generalised, since it isdependent on the number of products included.
Furthermore, the analyses showed that the perceived degree of naturalness asregards the combination of enrichment substance and basic product influencesrespondents’ attitudes, in that enrichment with calcium and vitamin D is themost preferred for the dairy product and enrichment with fibre the most prefer-red for the bread product. The basic product itself also proved to be decisive, amuch higher proportion of respondents accepting enrichment in the bread prod-uct than in the dairy product. This can be connected with the degree of proces-sing of the basic product, which is rather lower for the (fresh) dairy product thanfor the bread product. Against this, however, is the fact that respondents whohave a negative attitude towards enrichment do not have a greater preferencefor the ecological dairy product – which must be considered less processed thanthe conventional product – than those with a positive attitude. The enrichmentsubstance also influences attitudes, which is illustrated by the fact thatrelatively few respondents prefer omega-3 enrichment of either product. Thelow preference for omega-3 can seem surprising – especially as regards thebread product, since omega-3-enriched bread has long been available. However,as previously mentioned, the respondents had little knowledge of omega-3 andits effects on health, so it can fairly reasonably be assumed that people do notbuy Omega-3 Bread (as the existing product is called) primarily because ofenrichment but more, for example, for its taste. Most consumers thus regardOmega-3 Bread more as a name than as a form of enrichment.
With regard to demography, the elderly respondents are generally more positiveabout enriched products, which accords with the impression from the focus groupinterviews. Fibre-enriched bread is an exception, however, the younger andmiddle-aged respondents being overrepresented. In general, women are morepositive about enrichment than men, which, as regards enrichment with calcium
21

and vitamin D, is hardly surprising given the media attention and public infor-mation campaigns about the importance of calcium for women, but women arealso generally the most positive about the other enrichment substances.
The analysis of the conjoint study focused on determining how enrichment isweighted by the respondents, how important it is, and how the part worths forthis attribute can be described, plus identifying segments with homogeneouspreferences. The analysis has only focused on the underlying beliefs whichdetermine the observed preference distribution and utility functions to a lesserextent. An analysis of respondents’ underlying motives and attitudes is thus thestarting point of the following section, which discusses the questionnaire surveyand results.
The questionnaire survey
The aim of the questionnaire survey is to investigate and explain which beliefsdetermine respondents’ attitudes towards the enriched products. The theo-retical basis of the survey is the Theory of Reasoned Action (TRA). The survey isbased directly on the model, so this and the following section will focus mainlyon the model’s applicability and operationalisation in relation to this study.
A large number of uses of TRA in relation to food products have proved theapplicability of the model in this area and gives a relatively good explanation ofpurchasing intentions and/or behaviour (see, for example, Shepherd & Stockley,1985; Sparks, Hedderly & Shepherd, 1992; Thompson, Haziris & Alekos, 1994).A meta-analysis of Sheppard, Hartwick & Warshaw (1988), based on 87 surveys(not only food products, but a large number of different areas), shows an averagecorrelation between the model’s components and the purchasing intention of0.66. In its original form, the model consists solely of the components “attitudetowards behaviour” (AB) and “subjective norm” (SN), but a number of other com-ponents have since been included by other researchers, eg “moral obligation”(Beck & Ajzen, 1991), “habit” (Tuorila & Pangborne, 1988), “past behaviour”(Bentler & Speckart, 1979), “perceived consumer effectiveness” (PCE) (Ellen,Weiner & Cobb-Walgren, 1991), and “perceived risk” (eg Frewer, Shepherd &Sparks, 1993, 1994).
Design and implementation
The design of the questionnaire has mainly followed the guidelines set out byAjzen and Fishbein (1980) and Ajzen (1988), with the individual questions beingbased on the focus-group interviews.
The survey involves two products and three enrichment substances, so the ques-tionnaire is divided into six parts, with the same questions for the dairy productenriched with omega-3, fibre, and calcium and vitamin D, and likewise for thebread product. There are 21 different questions in all, giving a total of 126questions (6x21) for the whole questionnaire.
In order to achieve greater accuracy, the model’s components (purchasing inten-tion, AB and SN) are measured by three items, as recommended by Ajzen and
22
Fishbein (1980). However, some studies have shown that SN can be measuredsolely by one item (Ajzen, 1988), which is the approach taken in this survey, andthe formulation proposed by Ajzen is used.
The items are measured solely by beliefs on a unipolar scale from 1 (completelydisagree) to 7 (completely agree). The same scale is used to measure purchasingintentions, while AB is measured by three differently formulated evaluative state-ments, though also on a unipolar scale.
As previously mentioned, the 218 respondents were given the questionnaire totake home after the conjoint interviews. In addition to written guidelines en-closed with the questionnaire, respondents were also given a thorough intro-duction to the questionnaire at the supermarket, where it was also emphasisedhow important it was that they complete and return it, using the stamped, self-addressed envelope provided. Respondents were also asked for their telephonenumber, in case they “mislaid” the questionnaire. In order to motivate respond-ents further, each participant received groceries to the value of about DKK 70,half being given in advance as a thank you for returning the questionnaire. Inall, 210 respondents returned the questionnaire (13 after telephone reminders),of which five were unusable, giving a final sample of 205 persons. This is aresponse rate of 94% (75% if we include all those who were contacted but did notwish to participate), which must be considered extremely satisfactory, andpartly – if not fully – makes up for the fact that the survey is not based on asimple random sample.
Results
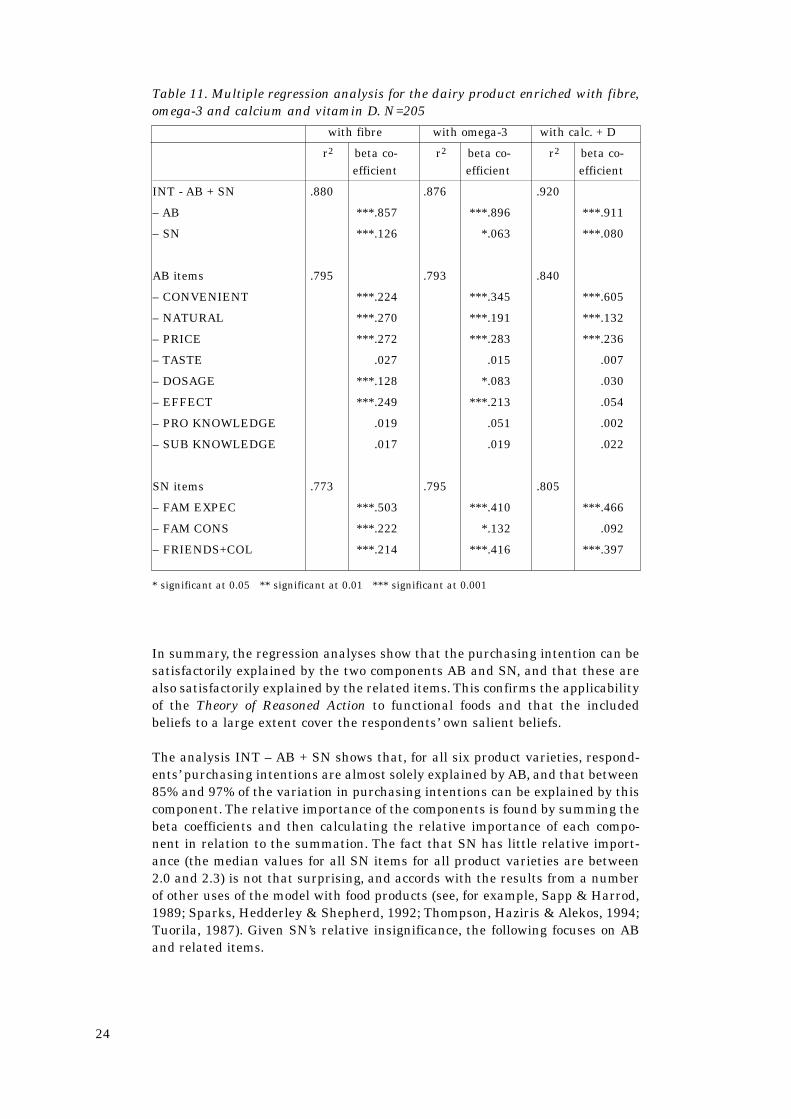
A regression analysis has been carried out for each of the six product varieties,the results of which are shown in tables 11 and 12 .
As can be seen from the two tables, the determination coefficient, r2 (subse-quently called the degree of explanation), which lies between 0.85 and 0.92, issatisfactory for all six product varieties. By comparison, in their meta-analysisof 87 studies, Sheppard, Hartwick and Warshaw (1988) found an average cor-relation of 0.66. The tables also show that the components AB and SN aresatisfactorily explained by the accompanying items, the degree of explanationlying between 0.72 and 0.84.
23
* significant at 0.05 ** significant at 0.01 *** significant at 0.001
In summary, the regression analyses show that the purchasing intention can besatisfactorily explained by the two components AB and SN, and that these arealso satisfactorily explained by the related items. This confirms the applicabilityof the Theory of Reasoned Action to functional foods and that the includedbeliefs to a large extent cover the respondents’ own salient beliefs.
The analysis INT – AB + SN shows that, for all six product varieties, respond-ents’ purchasing intentions are almost solely explained by AB, and that between85% and 97% of the variation in purchasing intentions can be explained by thiscomponent. The relative importance of the components is found by summing thebeta coefficients and then calculating the relative importance of each compo-nent in relation to the summation. The fact that SN has little relative import-ance (the median values for all SN items for all product varieties are between2.0 and 2.3) is not that surprising, and accords with the results from a numberof other uses of the model with food products (see, for example, Sapp & Harrod,1989; Sparks, Hedderley & Shepherd, 1992; Thompson, Haziris & Alekos, 1994;Tuorila, 1987). Given SN’s relative insignificance, the following focuses on ABand related items.
24
Table 11. Multiple regression analysis for the dairy product enriched with fibre,omega-3 and calcium and vitamin D. N=205
with fibre with omega-3 with calc. + D
r2 beta co- r2 beta co- r2 beta co-efficient efficient efficient
INT - AB + SN .880 .876 .920
– AB ***.857 ***.896 ***.911
– SN ***.126 *.063 ***.080
AB items .795 .793 .840
– CONVENIENT ***.224 ***.345 ***.605
– NATURAL ***.270 ***.191 ***.132
– PRICE ***.272 ***.283 ***.236
– TASTE .027 .015 .007
– DOSAGE ***.128 *.083 .030
– EFFECT ***.249 ***.213 .054
– PRO KNOWLEDGE .019 .051 .002
– SUB KNOWLEDGE .017 .019 .022
SN items .773 .795 .805
– FAM EXPEC ***.503 ***.410 ***.466
– FAM CONS ***.222 *.132 .092
– FRIENDS+COL ***.214 ***.416 ***.397

* significant at 0.05 ** significant at 0.01 *** significant at 0.001
AB thus mainly explains purchasing intentions, and what determines this canbe seen from “AB items” in tables 11 and 12. Three beliefs are significant(p<0.001) for all six product varieties, namely CONVENIENT, NATURAL, andPRICE. EFFECT is significant in five cases (the exception being the dairy prod-uct with calcium and vitamin D), and DOSAGE in two (for the dairy productwith fibre and omega-3 respectively).
Relatively speaking, CONVENIENT is thus the most significant belief forattitudes towards buying enriched food products in five out of six cases, and, onaverage, explains 42% of attitudes for all six product varieties (see also figure1). Only for the dairy product with fibre is CONVENIENT not the mostsignificant belief, though even here it explains 20% of AB. PRICE is generallythe next most explanatory item (21%), while NATURAL explains 18% onaverage. Together, the three beliefs explain an average of 81% of AB for the sixproduct varieties. EFFECT explains an average of 14% and DOSAGE theremaining 5%.
As can be seen from the two regression analyses, TASTE has no importance forAB, and with it purchasing intentions. At first sight, this might appear sur-prising, but this result is analogous to a study of consumers’ attitudes towardsfresh fish (Grunert, Bisp, Bredahl, Sørensen & Nielsen, 1995), which found thatthe perceived wholesomeness of fish did not influence purchasing intentions.
25
Table 12. Multiple regression analysis for the bread product enriched withfibre, omega-3 and calcium and vitamin D. N=205
with fibre with omega-3 with calc. + D
r2 beta co- r2 beta co- r2 beta co-efficient efficient efficient
INT - AB + SN .856 .898 .867
– AB ***.887 ***.895 ***.871
– SN *.078 ***.088 ***.104
AB items .728 .818 .779
– CONVENIENT ***.464 ***.480 ***.529
– NATURAL ***.212 ***.169 ***.184
– PRICE ***.178 ***.244 ***.178
– TASTE .045 .016 .031
– DOSAGE .066 .032 .040
– EFFECT **.151 ***.177 *.111
– PRO KNOWLEDGE .050 .040 .008
– SUB KNOWLEDGE .016 .048 .007
SN items .788 .763 .741
– FAM EXPEC ***.597 ***.623 ***.567
– FAM CONS *.122 .070 .038
– FRIENDS+COL ***.228 ***.357 ***.314

Everybody knows that fish is good for you, so this attribute does not influencepurchasing intentions. In our study, all respondents thus more or less agreeabout not accepting a non-defined change in taste, which is why taste will nothave any influence on the variation in purchasing intentions, since it isimportant for all respondents.
It is thus very much the same beliefs that determine attitudes towards the sixproduct varieties, and thus also purchasing intentions. Table 13 shows therelative importance of the significant beliefs as regards AB for the six productvarieties.
Note: bf = bread product with fibre; bc = bread product with calcium and vitamin D; bo = bread
product with omega-3; df = dairy product with fibre; dc = dairy product with calcium and vitamin
D; do = dairy product with omega-3.
As can be seen from the above, convenience is relatively very important for bothproducts when they are enriched with calcium and vitamin D. This is probablyconnected with the widespread use of calcium tablets, which explains whyprecisely this form of enrichment is regarded as convenient. This also agrees
26
Figure 1. Explanatory beliefs for purchasing intentions. All six productvarieties. N=205
CONVENIENT
PRICE
NATURAL
EFFECT
DOSAGE
PRO KNOWLEDGE
SUB KNOWLEDGE
TASTE
FAM EXPEC
FAM CONS
FRIENDS+COL
20-62%
Interval
18-25%
14-24%
0-22%
0-10%
– –
– –
– –
43-64%
0-24%
22-43%
42%
Averagea)
21%
18%
14%
5%
– –
– –
– –
58%
9%
33%
Attitude towardbehaviour
(AB)
Behaviouralintention
(INT)
Subjective norm(SN)
r2=.856-.920
85-92%, aver. 91%
8-15%, aver. 9%
belief has no importance for AB Averages correspond to one joint analysis of the six product varieties, n=1230a)
Table 13. Relative importance of significant beliefs as regards AB. %
bf bc bo df dc do average
CONVENIENT 46 53 45 20 62 31 42
PRICE 18 18 22 24 24 25 21
NATURAL 21 18 16 24 14 17 18
EFFECT 15 11 17 22 -- 20 14
DOSAGE -- -- -- 10 -- 7 5
with the results of the focus group interviews. Price seems to be slightly moreimportant for the enriched dairy product than the enriched bread product –except for the omega-3 bread product, where the relative importance of price isat the same level as the dairy product varieties. On the basis of the conjointanalyses, it was expected that EFFECT would have relatively more importancefor enrichment with omega-3 due to respondents’ poor knowledge of the sub-stance, but as the above shows, this proved not to be the case.
NATURAL lies at a relatively stable level for all six product varieties (between14% and 24%), and there is no discernible pattern in the variation of the import-ance of this belief. Based on the conjoint analyses, NATURAL could have beenexpected to be relatively more important for the dairy product than for the breadproduct, and, conversely, less important for product varieties where theenrichment substance is already present in the basic product. This is not thecase, however, and all we can say is that the importance of perceived naturalnessfor purchasing intentions is not markedly different for the six product varieties.
As with NATURAL, the relative importance of the perceived health effect(EFFECT) of eating the enriched product rather than the basic product is also ata stable level, though it is less important for attitudes towards the two productvarieties enriched with calcium and vitamin D (totally unimportant for the dairyproduct) than to the other product varieties. As regards the two other enrichmentsubstances, EFFECT is slightly more important for the dairy product than thebread product, while DOSAGE is important for attitudes towards these twovarieties of the dairy product (with omega-3 and fibre). The conjoint analysisshows that there is absolutely least preference for these two product varieties,which indicates that attitudes and the decision process are more complex thanfirst supposed, and that they are formed on the basis of several beliefs when thereis a relatively low preference for the enriched product. It is not possible to draw aclear conclusion, however, since attitudes towards omega-3 bread (the breadproduct variety which respondents prefer the least) are not influenced by morebeliefs than for the bread product with fibre or calcium and vitamin D. It wouldthus be natural to conclude that the basic product itself is also decisive for thecomplexity of attitude formation, and that this is generally more complex for thedairy product, where relatively more respondents prefer the conventional product(cf. the conjoint analyses). However, this accords poorly with attitude formationfor the dairy product variety with calcium and vitamin D, where AB is solelydetermined by three beliefs.
It is surprising that DOSAGE is unimportant for enrichment with calcium andvitamin D, since both focus groups stressed precisely dosage problems in con-nection with vitamin enrichment. That DOSAGE is significant for the dairyproduct with fibre and omega-3 respectively is also somewhat surprising, andthere is no immediate explanation for these apparent contradictions.
At least as relevant as the significant beliefs are the unimportant beliefs, threeof which are common to all six product varieties. Apart from TASTE, which wasdiscussed above, food producers’ knowledge (PROKNOWLEDGE) of the generaleffects of enrichment are unimportant as regards attitudes. This can seem sur-prising, especially in view of the results of the focus group interviews, where pre-cisely these factors were prominent, but any assessment of the consistency of theresults should take account of the level of abstraction of the respective methods.
27
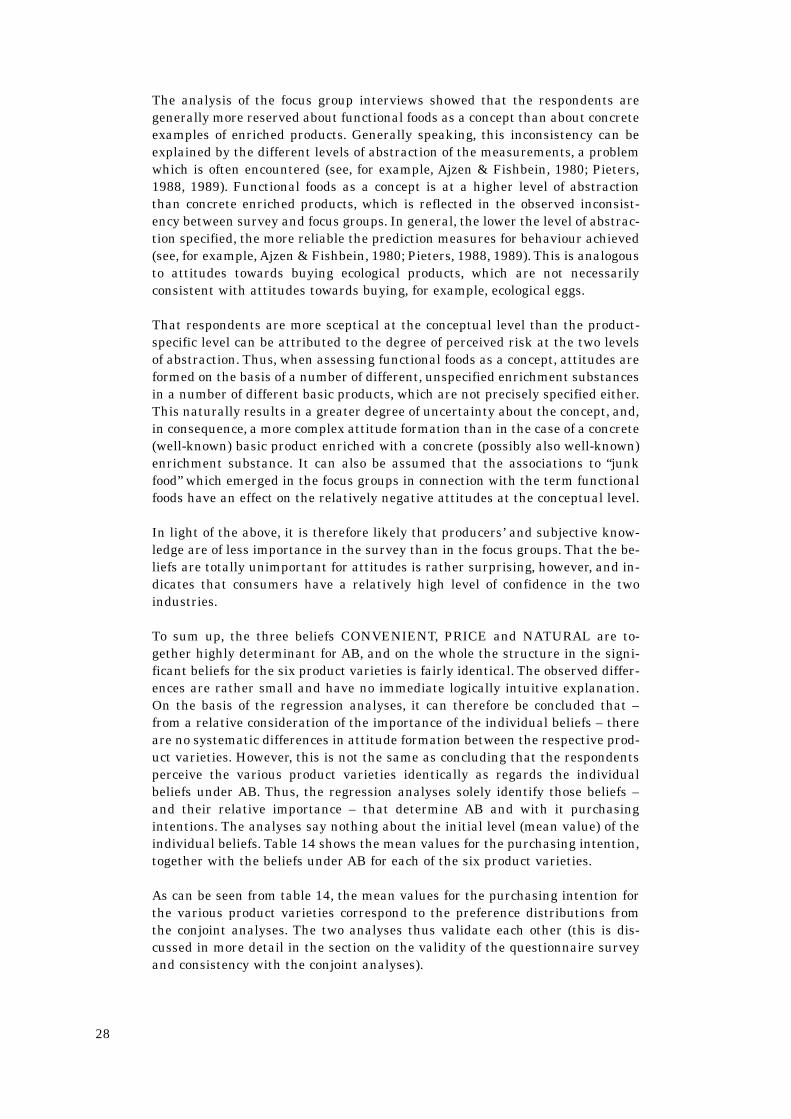
The analysis of the focus group interviews showed that the respondents aregenerally more reserved about functional foods as a concept than about concreteexamples of enriched products. Generally speaking, this inconsistency can beexplained by the different levels of abstraction of the measurements, a problemwhich is often encountered (see, for example, Ajzen & Fishbein, 1980; Pieters,1988, 1989). Functional foods as a concept is at a higher level of abstractionthan concrete enriched products, which is reflected in the observed inconsist-ency between survey and focus groups. In general, the lower the level of abstrac-tion specified, the more reliable the prediction measures for behaviour achieved(see, for example, Ajzen & Fishbein, 1980; Pieters, 1988, 1989). This is analogousto attitudes towards buying ecological products, which are not necessarilyconsistent with attitudes towards buying, for example, ecological eggs.
That respondents are more sceptical at the conceptual level than the product-specific level can be attributed to the degree of perceived risk at the two levelsof abstraction. Thus, when assessing functional foods as a concept, attitudes areformed on the basis of a number of different, unspecified enrichment substancesin a number of different basic products, which are not precisely specified either.This naturally results in a greater degree of uncertainty about the concept, and,in consequence, a more complex attitude formation than in the case of a concrete(well-known) basic product enriched with a concrete (possibly also well-known)enrichment substance. It can also be assumed that the associations to “junkfood” which emerged in the focus groups in connection with the term functionalfoods have an effect on the relatively negative attitudes at the conceptual level.
In light of the above, it is therefore likely that producers’ and subjective know-ledge are of less importance in the survey than in the focus groups. That the be-liefs are totally unimportant for attitudes is rather surprising, however, and in-dicates that consumers have a relatively high level of confidence in the twoindustries.
To sum up, the three beliefs CONVENIENT, PRICE and NATURAL are to-gether highly determinant for AB, and on the whole the structure in the signi-ficant beliefs for the six product varieties is fairly identical. The observed differ-ences are rather small and have no immediate logically intuitive explanation.On the basis of the regression analyses, it can therefore be concluded that –from a relative consideration of the importance of the individual beliefs – thereare no systematic differences in attitude formation between the respective prod-uct varieties. However, this is not the same as concluding that the respondentsperceive the various product varieties identically as regards the individualbeliefs under AB. Thus, the regression analyses solely identify those beliefs –and their relative importance – that determine AB and with it purchasingintentions. The analyses say nothing about the initial level (mean value) of theindividual beliefs. Table 14 shows the mean values for the purchasing intention,together with the beliefs under AB for each of the six product varieties.
As can be seen from table 14, the mean values for the purchasing intention forthe various product varieties correspond to the preference distributions fromthe conjoint analyses. The two analyses thus validate each other (this is dis-cussed in more detail in the section on the validity of the questionnaire surveyand consistency with the conjoint analyses).
28

Note: bf = bread product with fibre; bc = bread product with calcium and vitamin D; bo = bread
product with omega-3; df = dairy product with fibre; dc = dairy product with calcium and vitamin
D; do = dairy product with omega-3.
All differences <0.3 are significant at αk<0.05. Higher values indicate a more positive attitude.
The table also shows that, in general, the mean values are higher for the basicbread product. Similarly, for the product varieties where enrichment consists inupgrading a substance already present in the basic product, the mean valuesare higher than for the two other product varieties of the respective basic prod-ucts. All in all, these differences support the conclusion of the conjoint analysesconcerning the importance of both the basic product and the enrichment sub-stance, together with the combination of these.
With regard to the beliefs, the mean values reveal that, even though the regres-sion analyses do not show large (systematic) differences in the structure or rela-tive importance of the beliefs, in several cases the absolute values of the productvarieties are significantly different from each other. The reason these differencesdo not show up clearly in the regression analyses is that the estimations arebased on the belief ’s variance, and if the variance of the respective beliefs is notsignificantly different between the product varieties, differences in the level ofthe explanatory beliefs will not be registered in the beta coefficients. Thus, if thevalue of individual beliefs is changed for all significant beliefs from one productvariety to another, the variance is not changed, which means that the absolutedifference in attitude will not show up in a relative consideration of the respec-tive beta coefficients. This is precisely the case for the six product varieties, sincethe average profiles for the purchasing intention and explanatory beliefs underAB are more or less parallel, but vertically displaced, as can be seen in figure 2.
The figure shows a clear connection between product variety and the level of be-liefs, and, furthermore, the beliefs are strongly mutually correlated. A calcula-tion of the correlation coefficients between the explanatory variables thusshows that the correlations lie between 0.84 and 0.98 on what can be character-ised as an aggregated level, in that each product variety is regarded as a singleobservation based on the average for all 205 respondents.
29
Table 14. Mean values for the purchasing intention and explanatory beliefsunder AB
bf bc bo df dc do
INTENTION 5.1 3.8 3.6 3.3 4.2 3.2
CONVENIENT 5.1 4.0 4.0 3.7 4.4 3.8
PRICE 4.1 3.1 3.2 2.8 3.5 2.8
NATURAL 5.0 3.6 3.5 3.2 3.8 3.2
EFFECT 5.0 4.4 4.1 3.8 4.4 4.0
DOSAGE 4.3 3.9 4.0 3.9 3.9 3.9
PRO KNOWLEDGE 4.5 3.9 4.0 4.0 4.1 4.0
SUB KNOWLEDGE 4.7 3.9 4.0 4.0 4.1 3.8
TASTE 1.9 1.8 1.8 1.7 1.8 1.7
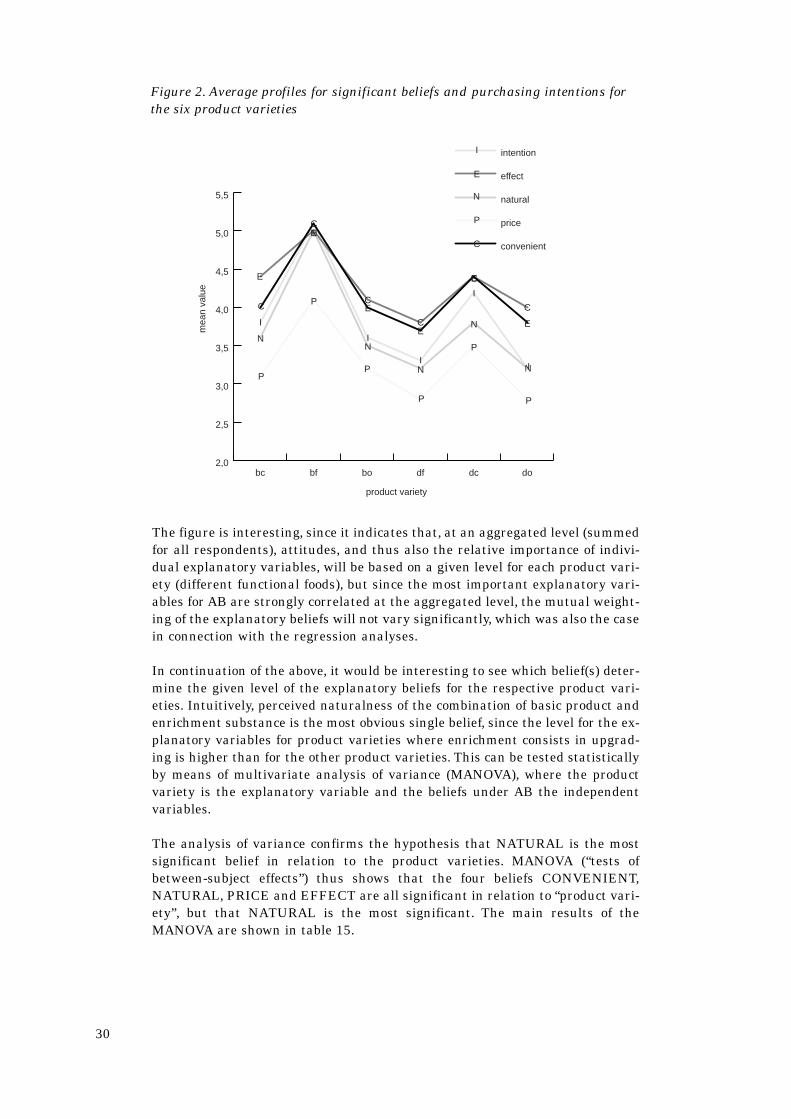
The figure is interesting, since it indicates that, at an aggregated level (summedfor all respondents), attitudes, and thus also the relative importance of indivi-dual explanatory variables, will be based on a given level for each product vari-ety (different functional foods), but since the most important explanatory vari-ables for AB are strongly correlated at the aggregated level, the mutual weight-ing of the explanatory beliefs will not vary significantly, which was also the casein connection with the regression analyses.
In continuation of the above, it would be interesting to see which belief(s) deter-mine the given level of the explanatory beliefs for the respective product vari-eties. Intuitively, perceived naturalness of the combination of basic product andenrichment substance is the most obvious single belief, since the level for the ex-planatory variables for product varieties where enrichment consists in upgrad-ing is higher than for the other product varieties. This can be tested statisticallyby means of multivariate analysis of variance (MANOVA), where the productvariety is the explanatory variable and the beliefs under AB the independentvariables.
The analysis of variance confirms the hypothesis that NATURAL is the mostsignificant belief in relation to the product varieties. MANOVA (“tests ofbetween-subject effects”) thus shows that the four beliefs CONVENIENT,NATURAL, PRICE and EFFECT are all significant in relation to “product vari-ety”, but that NATURAL is the most significant. The main results of theMANOVA are shown in table 15.
30
Figure 2. Average profiles for significant beliefs and purchasing intentions forthe six product varieties
2,0
2,5
3,0
3,5
4,0
4,5
5,0
5,5
intention
effect
natural
price
convenient
dodcdfbobfbc
P
C
C
C
C
C
C
C
I
E
E
E
E
E
E
E
I
II
I
I
I
N
N
N
N
NN
N
P
P
P
P
P
P
product variety
mea
n va
lue
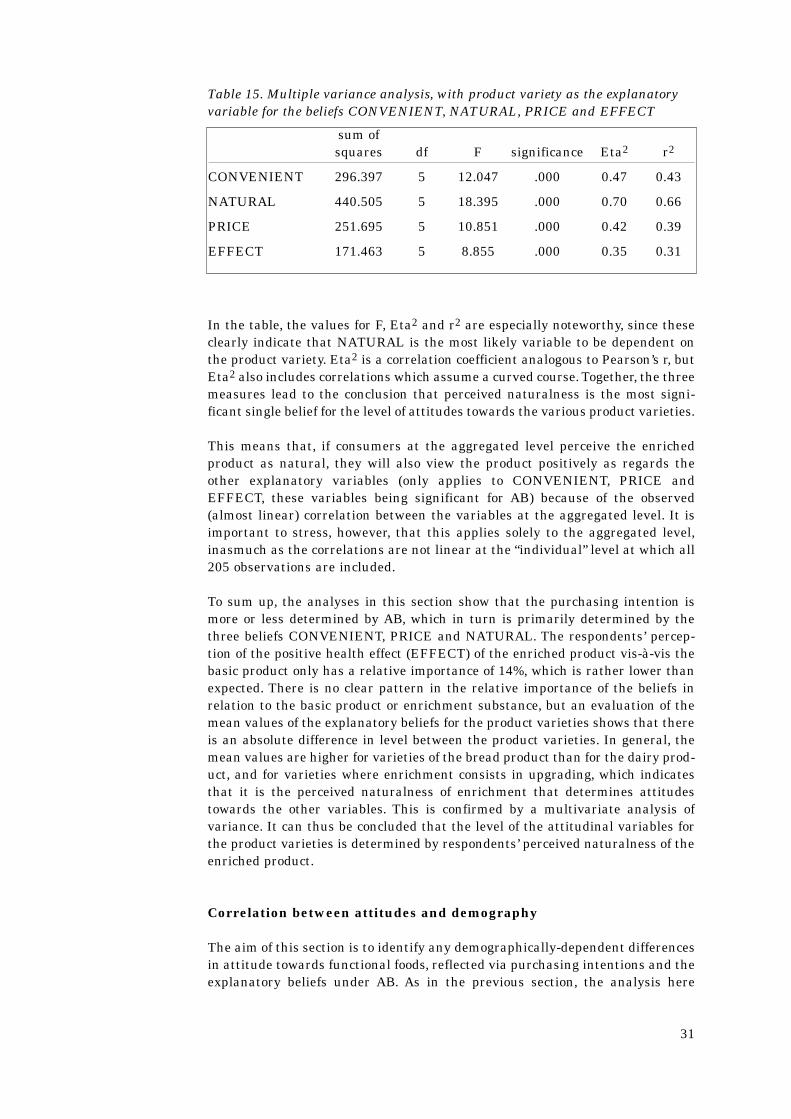
In the table, the values for F, Eta2 and r2 are especially noteworthy, since theseclearly indicate that NATURAL is the most likely variable to be dependent onthe product variety. Eta2 is a correlation coefficient analogous to Pearson’s r, butEta2 also includes correlations which assume a curved course. Together, the threemeasures lead to the conclusion that perceived naturalness is the most signi-ficant single belief for the level of attitudes towards the various product varieties.
This means that, if consumers at the aggregated level perceive the enrichedproduct as natural, they will also view the product positively as regards theother explanatory variables (only applies to CONVENIENT, PRICE andEFFECT, these variables being significant for AB) because of the observed(almost linear) correlation between the variables at the aggregated level. It isimportant to stress, however, that this applies solely to the aggregated level,inasmuch as the correlations are not linear at the “individual” level at which all205 observations are included.
To sum up, the analyses in this section show that the purchasing intention ismore or less determined by AB, which in turn is primarily determined by thethree beliefs CONVENIENT, PRICE and NATURAL. The respondents’ percep-tion of the positive health effect (EFFECT) of the enriched product vis-à-vis thebasic product only has a relative importance of 14%, which is rather lower thanexpected. There is no clear pattern in the relative importance of the beliefs inrelation to the basic product or enrichment substance, but an evaluation of themean values of the explanatory beliefs for the product varieties shows that thereis an absolute difference in level between the product varieties. In general, themean values are higher for varieties of the bread product than for the dairy prod-uct, and for varieties where enrichment consists in upgrading, which indicatesthat it is the perceived naturalness of enrichment that determines attitudestowards the other variables. This is confirmed by a multivariate analysis ofvariance. It can thus be concluded that the level of the attitudinal variables forthe product varieties is determined by respondents’ perceived naturalness of theenriched product.
Correlation between attitudes and demography
The aim of this section is to identify any demographically-dependent differencesin attitude towards functional foods, reflected via purchasing intentions and theexplanatory beliefs under AB. As in the previous section, the analysis here
31
Table 15. Multiple variance analysis, with product variety as the explanatoryvariable for the beliefs CONVENIENT, NATURAL, PRICE and EFFECT
sum ofsquares df F significance Eta2 r2
CONVENIENT 296.397 5 12.047 .000 0.47 0.43
NATURAL 440.505 5 18.395 .000 0.70 0.66
PRICE 251.695 5 10.851 .000 0.42 0.39
EFFECT 171.463 5 8.855 .000 0.35 0.31

focuses on the beliefs under AB because of the relatively modest importance ofSN for purchasing intentions.
In analyses of differences in attitude between demographic characteristics, a no-minal scale is used for the independent variables, which indicates an affiliationto prespecified groups. The demographic variables measured in this analysis aresex, age, income and educational level. A (multiple) variance analysis is the mostsuitable method in analyses where nominal scales are used for the independentvariables and interval scales for the dependent variables (Blunch, 1990).
Table 16 shows purchasing intentions in relation to demographic character-istics. In the case of sex, women have a significantly higher purchasing inten-tion than men for all six product varieties. As regards age, the older respondentsare generally the most positive – only for the bread product with fibre is thedifference not significant. The middle-aged are least positive, though for four outof the six product varieties the difference between the middle-aged and young-est respondents is not significant, so the results for age are also consistent withthe results of the conjoint analyses.
With regard to educational level, the table shows that those with the shortest edu-cation have a significantly higher purchasing intention for all six product vari-eties, while household income only affects purchasing intentions in the case of thebread product with fibre or omega-3, where the group with the highest income hasa higher purchasing intention than respondents with a lower household income.
Note: bf = bread product with fibre; bc = bread product with calcium and vitamin D; bo = bread
product with omega-3; df = dairy product with fibre; dc = dairy product with calcium and vitamin
D; do = dairy product with omega-3.
All differences <0.3 are significant at αk<0.05. Higher values indicate a higher purchasing intention.
The differences in beliefs and weights between the demographic groups havebeen found via multiple variance analysis and discriminant analysis.
32
Table 16. Mean values for purchasing intention, by demographic characteristics
df do dc bf bo bc
SEX
– male 2,7 2,4 3,4 4,5 3,0 3,1
– female 3,5 3,5 5,0 5,3 3,9 4,0
AGE
– - 30 years 2,9 2,9 4,2 5,3 3,6 3,5
– 31-55 years 2,9 2,8 3,9 5,1 3,2 3,5
– 56 years- 4,4 4,4 4,9 5,0 4,8 4,8
EDUCATION
– up to and incl. A-levels 3,7 3,6 4,5 5,3 3,9 4,1
– higher education 2,5 2,6 3,7 4,9 3,4 3,2
INCOME
– < DKK 300.000 3,3 3,2 4,2 5,0 3,6 3,8
– > DKK300.000 3,3 3,3 4,2 5,3 3,9 3,8

The main conclusions of the analyses are that women’s more positive attitudetowards the enriched products can be explained by their greater willingness toaccept a higher price, and that women regard the products as more natural andfind it more convenient to take the enrichment substance through their dailydiet. On average, these three beliefs explain about 90% of the differencebetween men and women for the six product varieties.
As for age, the more positive attitude of the oldest segments (over 55) can beexplained mainly by the fact that these consumers find it more convenient to getenrichment substance through their daily diet than the other consumers.Furthermore, the elderly regard the enriched products as more natural than theother respondents, and are willing to pay more for these products.
With regard to educational level, the analyses show that the relatively morepositive attitude among respondents with a lower educational level is due to thefact that these respondents are generally more positive about PRICE,NATURAL and CONVENIENT.
Differences in attitude between segments identified by the conjointanalyses
The aim of this section is to identify the beliefs which help discriminate betweenthe “positive” and “negative” segments found by the cluster analysis in connec-tion with the conjoint analyses. Unlike in previous sections, this analysis is thusbased solely on respondents with a relatively unambiguous attitude, respondentsnot directly for or against enriched products being excluded. By this means, theanalysis can identify those beliefs which explain that respondents have a mark-ed positive or negative preference to enriched products in general, together withthe beliefs that explain the difference between the individual product varieties.
As in the previous section, the independent variable is based on a nominal scale,and indicates a group affiliation (positive or negative preference), while aninterval scale is used for the explanatory variables (items under AB), which isthe reason for using MANOVA and discriminant analysis again.
Before discussing the analysis itself, it would be useful to examine the extent towhich the segments’ mean values for the purchasing intention correspond togroup affiliation – in other words, whether respondents’ preferences in the con-joint analyses are consistent with purchasing intentions in the questionnairesurvey. The survey shows that the six segments with a positive preference forenrichment all have a significantly higher purchasing intention (p < 0.001) thanthe negative segments. The two surveys are thus consistent with each other, soit is perfectly valid to regard the groups as positive and negative segments inthe questionnaire survey too.
In order to discover which beliefs generally discriminate between positive andnegative segments, all segments with a clearly positive or negative preferencefor each of the six product varieties are placed in one data set and a varianceand discriminant analysis carried out (there are 117 observations in the nega-tive group and 195 in the positive, ie 312 observations out of a total of 1230, cf.the conjoint analyses, tables 7 and 8). The analysis of variance is significant,
33

and, not surprisingly, the discriminant analysis shows that the beliefs CONVE-NIENT, NATURAL, PRICE and EFFECT are significant, but PROKNOW-LEDGE is also significant in relation to the discriminant function.
While the discriminatory beliefs are thus more or less the same as the most sig-nificant in the regression analyses, the relative importance differs between thetwo analyses. The most significant belief for the discriminant function isNATURAL, which has a relative importance of 27%. CONVENIENT has a rela-tive importance of about 24%, while PRICE and EFFECT are each about 22%and PROKNOWLEDGE 5%. It can be seen from this that NATURAL andEFFECT have a greater relative importance in this analysis than in the regres-sion analyses (NATURAL 18% and EFFECT 14%, cf. figure 1). At the same time,the relative importance of CONVENIENT for the discriminant function is onlyabout half (relative importance of 42% in the regression analysis), while therelative importance of PRICE is the same in the two analyses.
The difference in attitude between the absolute most negative and absolutemost positive respondents is thus more a question of the perceived naturalnessof enriched products and the effect of enrichment vis-à-vis the conventionalproduct than is the case in the regression analysis of all respondents, whereCONVENIENT is the most dominant belief. Thus, the explanatory beliefs do notdetermine the purchasing intention with the same relative importance for thenegative respondents as for the group of more or less indifferent respondents(neither in the positive nor negative segments). The more negative respondentsare towards enriched products, the less natural they perceive them to be, andthe less they believe in an enrichment effect. Conversely, CONVENIENT is rela-tively more important for the indifferent, and since the positive and negativesegments combined only represent 312 out of 1230 observations, the differencesbetween the absolute negative and absolute positive are “levelled out” in the re-gression analyses. CONVENIENT is thus of relatively great importance to AB,and with it the purchasing intention. This does not mean that the validity of theregression analyses is disputed, however, only that, for the truly negative re-spondents, NATURAL and EFFECT are relatively more important for attitudesthan for the sample in general.
The discriminant analyses for the six product varieties show that there are nogreat differences between them.
Summing up, the discriminant analyses of the segments identified by the con-joint analyses show that the relative importance of NATURAL and EFFECT isgreater for the segments with a clear preference for or against enriched prod-ucts than for the sample as a whole. Compared with the positive respondents,therefore, the negative respondents regard functional foods as less natural andbelieve significantly less in an increased health effect of enrichment. PRICE andCONVENIENT are also important, though the latter far less than for respond-ents as a whole.
34

Validity of the questionnaire survey and consistency with the conjointanalyses
A comparison of the results of the two quantitative surveys shows that theylargely validate each other, ie the results are not dependent on the measure-ment instruments used. Thus, the purchasing intention for the various productvarieties agrees completely with the preference distribution from the conjointanalyses. The surveys are not completely independent, however, since they arebased on the same respondents. Thus, the external validation, as the compari-son of the two surveys’ results can be described, is only reliable if the sample isapproximately representative and not subject to “non-response bias”.
Non-response bias is minimal if the evaluation is based on the response rate.However, it would be more correct to base the evaluation on the relation be-tween the number of contacted, screened, suitable and participating respond-ents than on the response rate for participating respondents alone. As mention-ed in the section on the conjoint analyses, 1029 persons were contacted, of whom689 agreed to participate – ie 340 refused. Of those screened, only 48% weresuitable. Since a similar proportion of those who did not wish to participate canalso be assumed to be suitable, we can calculate a corrected participation figureof 80% of those contacted. The conjoint analyses thus have a “response rate” of80, while that of the questionnaire survey is 75, which is satisfactory for thistype of survey. The sample is a so-called convenience sample, however, andtherefore not necessarily representative of the population (the Aarhus area).
In connection with the interviews, we also compiled statistics for those who didnot want to participate in the survey. These statistics, which solely concern ageand sex (the former obviously being an estimate), show that, as regards sex, asignificantly larger proportion of men refused to participate in the study, whichis tantamount to a certain bias. As regards age distribution, there is no signifi-cant difference between those interviewed and those who refused to participate.
The representativeness of the sample can be assessed on the basis of the demo-graphic variables, and a comparison of the figures in the study with statisticsfor the municipality of Aarhus (Statistics Denmark, 1997) shows that there isan overrepresentation of women in our study (75% in the study, against 52% inAarhus). This is not surprising, however, since the sample (cf. screening) is madeup solely of persons who are responsible for the daily shopping, which, in reality,means mostly women. The overrepresentation of women is therefore not regard-ed as a serious bias, but, as mentioned above, a large proportion of men declinedto participate, so bias cannot be ruled out entirely. Nonetheless, the results arenot considered to be affected to any serious extent.
With regard to age, there is an underrepresentation of younger respondents(25% in the survey, against 32% in Aarhus), and an overrepresentation of elder-ly respondents (25% and 20% respectively), and while the age distribution in thesurvey is not markedly different from the population, a slight bias cannot bedenied. Since the surveys have shown that it is mainly the elderly who have apositive attitude towards enriched products, there is a risk that the proportionof positive respondents is slightly overrepresented in this study. As with the agedistribution, however, the relatively limited overrepresentation of elderly is notconsidered to critically affect the validity of the study. Nevertheless, since both
35
biases pull in the same direction, there must assumed to be an overrepresen-tation of positive respondents as regards functional foods. As mentioned above,however, both biases are relatively limited, so the validity of the study is notcritically affected.
The sample does not differ significantly from the population either in educa-tional level or income.
Questionnaire survey – concluding remarks
The questionnaire survey shows that consumers’ purchasing intentions as re-gards functional foods are mainly explained by AB, and that this is chieflyexplained by the beliefs CONVENIENT, PRICE, NATURAL and EFFECT inthat order. Since there is no systematic difference in the relative importance ofthe beliefs between the various product varieties, neither as regards the basicproduct nor the enrichment substance, it can be concluded that attitudes areformed in much the same way across different functional foods.
The above only applies to the relative importance of the beliefs, however, sincethe actual level (mean values) of attitudes towards the beliefs differssignificantly between most of the product varieties, and MANOVA shows thatperceived naturalness of the enriched product is the main determinant of theactual level.
Somewhat surprisingly, SUBKNOWLEDGE and PROKNOWLEDGE are com-pletely unimportant, and DOSAGE only marginally important, and this only fortwo of the six product varieties. These beliefs were very prominent in the focusgroups, but the inconsistency can be explained by the level of abstraction of thetwo methods: the three beliefs were mentioned chiefly in connection with theconcept of functional foods, and not so much at the product-specific level, whichis the starting point of the survey.
As far as the demographic differences are concerned, the analyses show that, ingeneral, women, the elderly and those with a low level of education were moreinclined to buy functional foods. The discriminant analyses show that womenfind it more convenient to get enrichment substances through their daily diet,they are more willing to pay extra, and find functional foods more natural. Thesame goes for the elderly, and these also believe more in a positive health effectof enrichment.
The analysis of the segments with a clear preference for one or other of the en-richment substances, or no enrichment (positive and negative segments), whichwere identified by the conjoint analyses, shows that the difference between thesegments’ attitudes is primarily explained by the beliefs NATURAL andEFFECT. Furthermore, these two beliefs have relatively greater importance forattitude formation in the segments (both positive and negative) than for all therespondents as a whole. PRICE and CONVENIENT likewise discriminate be-tween positive and negative segments, but appreciably less than the two formerbeliefs.
36
Marketing implications of the study
The focus group interviews revealed a widespread lack of knowledge about boththe concept of functional foods and the basic idea behind the products. Moreover,the name had negative associations. Present and potential producers of func-tional foods thus need to make consumers more aware of the concept and whatlies behind it. This also means putting more effort into convincing consumersthat, basically, functional foods are just food products that are enriched withnatural substances, and trying to overcome consumers’ negative associations to“junk food” and additives.
For the individual food producer, it is crucial that product development takes astarting point in products which consumers regard as relatively natural. Not allbasic products are equally suitable in this respect, however, the enrichment ofproducts with a low degree of processing resulting in less positive attitudes thanmore processed products. Upgrading seems to be the most preferred form of en-richment among consumers by far, which indicates that the development offunctional foods should be kept at a relatively simple level – at least, as long asconsumers know so little about the concept. If functional foods were promotedmore aggressively as products that are enriched with natural substances, itwould lead to more acceptance of and openness towards new functional foods,which in turn would allow producers to develop more “unnatural” combinationsand introduce them with a greater likelihood of success. For the present, how-ever, the key word for product development should be naturalness, which, asshown in this study, is emphasised by the importance attached to the basicproduct and the combination of basic product and enrichment substance.
With regard to the marketing of functional foods, the analyses show that themost important attributes that should be emphasised are convenience andnaturalness, which is an interesting result given legislation on health claims forfood products. The restrictions on marketing in current legislation are thus notthe barrier industry considers them to be today, since consumers’ beliefs in thehealth effect of functional foods is not decisive for attitudes and purchasingintentions. It should be pointed out in this connection, however, that the enrich-ment substances included in this study are all relatively familiar to consumers(though omega-3 somewhat less than the others), so enrichment with less fami-liar substances might lead to another conclusion, where belief in an effect wouldbe more determinative for consumers’ attitudes. However, as long as productsare kept at a “simple” level, with relatively familiar enrichment substances, pro-ducers should emphasise convenience and naturalness.
The study also shows that women and the elderly are relatively more interestedin functional foods than the other consumers, so product development and mar-keting should primarily focus on these segments. To this end, more researchmust be done on which health claims (and thus also enrichment substances) theelderly prefer, and, it goes without saying, marketing should concentrate on themedia which cater for the elderly.
No clear conclusions can be drawn about price. In the focus groups, the elderlyin particular expressed a willingness to pay more for functional foods if theythought there was a positive health effect. Notwithstanding, the conjoint ana-lyses show that, for the segment with a preference for the dairy product enrich-
37

ed with calcium and vitamin D, where elderly respondents are overrepresented,price is relatively very important. However, one-third of the respondents in thissegment are not very price sensitive at all, and a closer examination revealsthat precisely this third consists almost solely of the elderly. For the dairy prod-uct enriched with fibre or omega-3, the segment with a preference for theseenrichment substances in milk is not very price sensitive. For the segments witha preference for the bread product enriched with fibre or calcium and vitaminD, prices is not decisive, both segments having a very low price sensitivity, andprice is considerably less important than for respondents in general.
The discriminant analyses confirm that the segments with a preference forenriched products are more willing to pay, so even though no clear conclusionscan be drawn – mainly because of the high price sensitivity of two-thirds of therespondents with a preference for the dairy product enriched with calcium andvitamin D – the results of the study indicate that consumers with a positiveattitude towards concrete enriched products are willing to pay extra for them.This is an important factor in view of the relatively large product developmentcosts involved in functional foods.
38

REFERENCES
Ajzen, I. (1985). From intentions to actions: A theory of planned behavior. In: J. Kuhl &J. Beckmann (Eds.), Action control: From cognition to behavior, pp. 11-39, Berlin:Springer.
Ajzen, I. (1988). Attitudes, personality and behavior. Milton Keynes: Open UniversityPress.
Ajzen, I. & Fishbein, M. (1980). Understanding attitudes and predicting social behavior.Englewood Cliffs, NJ: Prentice-Hall.
Andersen, E. S. (1994). The evolution of credence goods: A transaction approach to productspecification and quality control. MAPP working paper no 21. Aarhus: The Aarhus Schoolof Business.
Baadsgaard, A., Grunert, K. G., Grunert, S. C. & Skytte, H. (1994). Undersøgelse af mulig-hederne for eksport af økologiske mælkeprodukter til Nordtyskland. MAPP project paper.Aarhus: The Aarhus School of Business.
Bech-Larsen, T. (1996). Forbrugernes holdninger til fødevareemballagen. PhD thesis.Aarhus: The Aarhus School of Business.
Beck, L. & Ajzen, I. (1991). Predicting dishonest actions using the Theory of PlannedBehavior. Journal of Research in Personality, 25, 285-301.
Bentler, P. M. & Speckart, G. (1979). Models of attitude-behavior relations. PsychologicalReview, 86(5), 452-464.
Blunch, N. J. (1990). Analyse af markedsdata. Herning: Systime a/s.
Bretton-Clark (1990). Conjoint designer. Morristown, NJ: Bretton-Clark.
Bretton-Clark (1991). Multiple correspondence analysis. Morristown, NJ: Bretton-Clark.
Bretton-Clark (1992). Conjoint analyzer. Morristown, NJ: Bretton-Clark.
Bretton-Clark (1993). Conjoint segmenter. Morristown, NJ: Bretton-Clark.
Crawford, C. M. (1997). New products management. Burr Ridge, IL: Richard D. Irwin, Inc.
Ellen, P. S., Wiener, J. L. & Cobb-Walgren, C. (1991). The role of perceived consumereffectiveness in motivating environmentally conscious behaviors. Journal of PublicPolicy & Marketing, 10(2), 102-117.
Engel, J. (1996). Functional foods kommer stærkt. Scandinavian Food, 4(Dec.), 5-14.
Frewer, L. J., Shepherd, R. & Sparks, P. (1993). The interrelationship between perceivedknowledge, control and risk associated with a range of food-related hazards targeted atthe individual, other people and society. Journal of Food Safety, 14, 19-40.
Frewer, L. J., Shepherd, R. & Sparks, P. (1994). Biotechnology and food production:Knowledge and perceived risk. British Food Journal, 96(9), 26-32.
Green, P. E. & Krieger, A. M. (1987). A consumer-based approach to designing productline extensions. Journal of Product Innovation Management, 4, 21-32.
Green, P. E. & Krieger, A. M. (1991). Segmenting markets with conjoint analysis. Journalof Marketing, 55 (October), 20-31.
Green, P. E. & Rao, R. V. (1971). Conjoint measurement for quantifying judgemental data.Journal of Marketing Research, 8, 355-363.
39

Green, P. E. & Srinivasan, V. (1978). Conjoint analysis in consumer research: Issues andoutlook. Journal of Consumer Research, 5, 103-123.
Green, P. E. & Srinivasan, V. (1990). Conjoint analysis in marketing: New developmentswith applications for research and practice. Journal of Marketing, (October), 3-19.
Grunert, K. G. (1996). What’s in a steak? A cross-cultural study on the quality perceptionof beef. MAPP working paper no 39. Aarhus: The Aarhus School of Business.
Grunert, K. G., Bisp, S., Bredahl, L., Sørensen, E. & Nielsen, N. A. (1995). A survey ofDanish consumers’ purchase of seafood. MAPP project report. Aarhus: The Aarhus Schoolof Business.
Howard, J. A. & Sheth, J. N. (1969). The theory of buyer behavior. New York: Wiley.
Howard, J. A. & Sheth, J. N. (1988). A theory of buyer behavior. In: B. M. Enis & K. K. Cox(Eds.), Marketing classics, pp. 105-123. Boston: Allyn and Bacon.
Lancaster, K. (1966). A new approach to consumer theory. Journal of Political Economy,74, 132-157.
Louviere, J. J. (1994). Conjoint analysis. In: R. E. Bagozzi (Ed.), Advanced methods ofmarketing research, pp. 223-259. Cambridge: Blackwell.
Nørbæk, P. (1995). Sundhedskampagne har ikke flyttet forbrugerne. Markedsføring,(marts), 6.
Pieters, R. G. M. (1988). Attitude-behavior relationships. In: W. F. van Raaij, G. M.Veldhoven & K. E. Wärneryd (Eds.), Handbook of economic psychology, pp. 147-204.Dordrecht: Kluwer.
Pieters, R. G. M. (1989). Attitude-behavior relations. In: R. G. M. Pieters (Ed.), Attitudesand behavior in a source separating program. A garbology approach, pp. 35-73. Delft:Eburon.
Rosenberg, M. J. (1956). Cognitive structure and attitudinal effect. Journal of Abnormaland Social Psychology, 53, 367-372.
Sapp, S. G. & Harrod, W. J. (1989). Social acceptability and intentions to eat beef: Anexpansion of the Fishbein-Ajzen model using reference group theory. Rural Sociology,54(3), 420-438.
Shepherd, R. & Stockley, L. (1985). Fat consumption and attitudes towards food with ahigh fat content. Human Nutrition: Applied Nutrition, 39, 431-442.
Sheppard, B. H., Hartwick, J. & Warshaw, P. R. (1988). The theory of reasoned action: Ameta-analysis of past research with recommendations for modifications and futureresearch. Journal of Consumer Research, 15 (December), 325-343.
Sparks, P., Hedderly, D. & Shepherd, R. (1992). An investigation into the relationshipbetween perceived control, attitude variability and the consumption of two commonfoods. European Journal of Social Psychology, 22, 55-71.
Speece, M. & Maclachlan, D. L. (1991). Measurement of milk container preferences.Journal of International Food & Agribusiness Marketing, 3, 43-64.
Thompson, K. E., Haziris, N. & Alekos, P. J. (1994). Attitudes and food choice behavior.British Food Journal, 96(11) 9-13.
Thøgersen, J. (1996). The demand for environmentally friendly packaging in Germany.MAPP Working paper 30. Aarhus: The Aarhus School of Business.
40

Tuorila, H. (1987). Selection of milk with varying fat contents and related overall liking,attitudes, norms and intentions. Appetite, 8, 1-14.
Tuorila, H. & Pangborn, R. M. (1988). Prediction of reported consumption of selected fat-containing foods. Appetite, 11, 81-95.
Wells, W. D. (1993). Discovery-oriented consumer research. Journal of ConsumerResearch, 19, 489-504.
Wittink, D. R. & Cattin, P. (1989). Commercial use of conjoint analysis: An update.Journal of Marketing, 53, 91-96.
41

APPENDIX 1. DISSIMILARITY MEASURES FOR A VARIABLE NUMBER OF
CLUSTERS (BRETTON-CLARK, 1993)
42
Dairy product
2 1234093169704963 6346109747204 3051234590725 175067176966 9038208007 1892118248 954404169 2897866210 1393031711 261805912 218880213 207180814 106160415 118010
Bread product
2 1418078244044803 11845085429764 537846333445 160337162246 7027828487 689296488 235309269 1249013710 809336611 743085412 63815913 49637814 18036115 77280
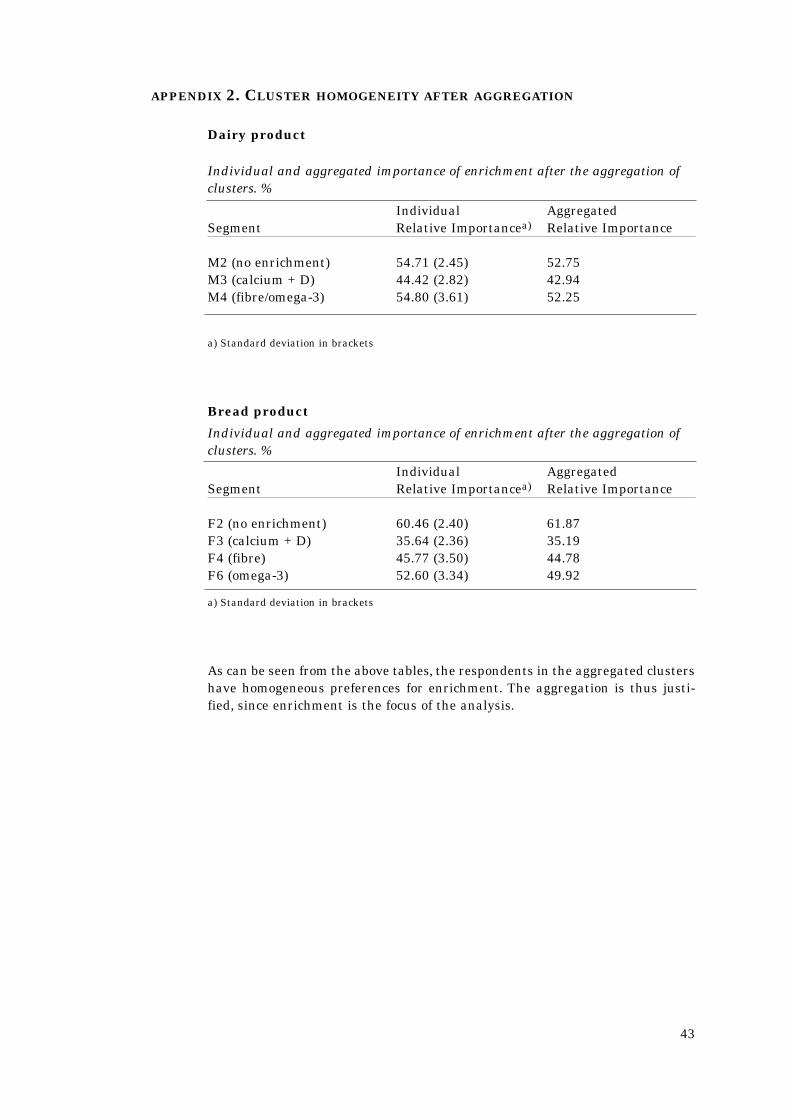
APPENDIX 2. CLUSTER HOMOGENEITY AFTER AGGREGATION
Dairy product
a) Standard deviation in brackets
Bread product
a) Standard deviation in brackets
As can be seen from the above tables, the respondents in the aggregated clustershave homogeneous preferences for enrichment. The aggregation is thus justi-fied, since enrichment is the focus of the analysis.
43
Individual and aggregated importance of enrichment after the aggregation ofclusters. %
Individual AggregatedSegment Relative Importancea) Relative Importance
M2 (no enrichment) 54.71 (2.45) 52.75M3 (calcium + D) 44.42 (2.82) 42.94M4 (fibre/omega-3) 54.80 (3.61) 52.25
Individual and aggregated importance of enrichment after the aggregation ofclusters. %
Individual AggregatedSegment Relative Importancea) Relative Importance
F2 (no enrichment) 60.46 (2.40) 61.87F3 (calcium + D) 35.64 (2.36) 35.19F4 (fibre) 45.77 (3.50) 44.78F6 (omega-3) 52.60 (3.34) 49.92

APPENDIX 3. RELATIVE IMPORTANCE OF THE ATTRIBUTES FOR THE OTHER
SEGMENTS
44
Bread product: Utility functions, relative importance of attributes for segmentsB1 and B5
B1 B5n=20 n=19
Type; relative importance 29% 0%– Brown 1.9 0.0– White -1.9 -0.0
Brand; relative importance 35% 19%– No name -2.3 -1.3– Brand 2.3 1.3
Enrichment; relative importance 19% 17%– Omega-3 -1.4 -0.5– Fibre 1.0 1.4– Calcium og vitamin D 0.1 -1.0– No enrichment 0.3 0.0
Pris; relative importance 17% 64%– DKK 17.00 -72.6 -30.5– DKK 19.25 -74.5 -35.0– DKK 21.50 -74.6 -39.6
Dairy product: Utility functions, relative importance of attributes for segmentsD1 and D5
D1 D5n=35 n=18
Type; relative importance 2% 51%– Ecological 0.1 -3.1– Ordinary -0.1 3.1
Packaging; relative importance 66% 3%– Plastic -3.9 -0.1– Cardboard 3.9 0.1
Enrichment; relative importance 17% 17%– Omega-3 -0.5 -0.3– Fibre -0.9 1.0– Calcium og vitamin D 0.2 0.3– No enrichment 1.2 1.1
Price; relative importance. 15% 29%– DKK 5.50 -6.4 -12.8– DKK 6.25 -7.3 -14.5– DKK 7.00 -8.2 -16.2