Danielle E. Medek HHS Public Access The Canberra … · Regional and seasonal variation in airborne...
21
Regional and seasonal variation in airborne grass pollen levels between cities of Australia and New Zealand Danielle E. Medek, The Canberra Hospital, PO Box 11, Woden, ACT 2606, Australia Paul J. Beggs, Department of Environmental Sciences, Faculty of Science and Engineering, Macquarie University, Sydney, Australia Bircan Erbas, School of Psychology and Public Health, La Trobe University, Melbourne, Australia Alison K. Jaggard, Department of Environmental Sciences, Faculty of Science and Engineering, Macquarie University, Sydney, Australia Bradley C. Campbell, School of Agriculture and Food Science, The University of Queensland, Brisbane, Australia Don Vicendese, School of Psychology and Public Health, La Trobe University, Melbourne, Australia Fay H. Johnston, Menzies Research Institute Tasmania, University of Tasmania, Hobart, Australia Ian Godwin, School of Agriculture and Food Science, The University of Queensland, Brisbane, Australia Alfredo R. Huete, Plant Functional Biology and Climate Change, University of Technology, Sydney, Sydney, Australia Brett J. Green, National Institute for Occupational Safety and Health, Centers for Disease Control and Prevention, Morgantown, WV, USA Pamela K. Burton, Campbelltown Hospital and the School of Medicine, University of Western Sydney, Macarthur, NSW, Australia David M. J. S. Bowman, Correspondence to: Danielle E. Medek. Author declarations JMD’s institute has received collaborative research funds from Stallergenes, consultancy fees, Honoraria payments from Stallergenes and Glaxo Smith Kline for presentations at Australian Society for Clinical Immunology and Allergy Education Meetings. JMD is an inventor on a patent granted in Australia and further applications for improving diagnosis and treatment of subtropical grass pollen allergy. HHS Public Access Author manuscript Aerobiologia (Bologna). Author manuscript; available in PMC 2016 July 29. Published in final edited form as: Aerobiologia (Bologna). 2016 June ; 32(2): 289–302. doi:10.1007/s10453-015-9399-x. Author Manuscript Author Manuscript Author Manuscript Author Manuscript
Transcript of Danielle E. Medek HHS Public Access The Canberra … · Regional and seasonal variation in airborne...

Regional and seasonal variation in airborne grass pollen levels between cities of Australia and New Zealand
Danielle E. Medek,The Canberra Hospital, PO Box 11, Woden, ACT 2606, Australia
Paul J. Beggs,Department of Environmental Sciences, Faculty of Science and Engineering, Macquarie University, Sydney, Australia
Bircan Erbas,School of Psychology and Public Health, La Trobe University, Melbourne, Australia
Alison K. Jaggard,Department of Environmental Sciences, Faculty of Science and Engineering, Macquarie University, Sydney, Australia
Bradley C. Campbell,School of Agriculture and Food Science, The University of Queensland, Brisbane, Australia
Don Vicendese,School of Psychology and Public Health, La Trobe University, Melbourne, Australia
Fay H. Johnston,Menzies Research Institute Tasmania, University of Tasmania, Hobart, Australia
Ian Godwin,School of Agriculture and Food Science, The University of Queensland, Brisbane, Australia
Alfredo R. Huete,Plant Functional Biology and Climate Change, University of Technology, Sydney, Sydney, Australia
Brett J. Green,National Institute for Occupational Safety and Health, Centers for Disease Control and Prevention, Morgantown, WV, USA
Pamela K. Burton,Campbelltown Hospital and the School of Medicine, University of Western Sydney, Macarthur, NSW, Australia
David M. J. S. Bowman,
Correspondence to: Danielle E. Medek.
Author declarations JMD’s institute has received collaborative research funds from Stallergenes, consultancy fees, Honoraria payments from Stallergenes and Glaxo Smith Kline for presentations at Australian Society for Clinical Immunology and Allergy Education Meetings. JMD is an inventor on a patent granted in Australia and further applications for improving diagnosis and treatment of subtropical grass pollen allergy.
HHS Public AccessAuthor manuscriptAerobiologia (Bologna). Author manuscript; available in PMC 2016 July 29.
Published in final edited form as:Aerobiologia (Bologna). 2016 June ; 32(2): 289–302. doi:10.1007/s10453-015-9399-x.
Author M
anuscriptA
uthor Manuscript
Author M
anuscriptA
uthor Manuscript

School of Biological Sciences, University of Tasmania, Hobart, Australia
Rewi M. Newnham,School of Geography, Environment and Earth Sciences, Victoria University of Wellington, Wellington, New Zealand
Constance H. Katelaris,Campbelltown Hospital and the School of Medicine, University of Western Sydney, Macarthur, NSW, Australia
Simon G. Haberle,Department of Archaeology and Natural History, College of Asia and the Pacific, The Australian National University, Canberra, Australia
Ed Newbigin, andSchool of BioSciences, The University of Melbourne, Melbourne, Australia
Janet M. DaviesSchool of Medicine, Translational Research Institute, The University of Queensland, Brisbane, Australia
Abstract
Although grass pollen is widely regarded as the major outdoor aeroallergen source in Australia
and New Zealand (NZ), no assemblage of airborne pollen data for the region has been previously
compiled. Grass pollen count data collected at 14 urban sites in Australia and NZ over periods
ranging from 1 to 17 years were acquired, assembled and compared, revealing considerable
spatiotemporal variability. Although direct comparison between these data is problematic due to
methodological differences between monitoring sites, the following patterns are apparent. Grass
pollen seasons tended to have more than one peak from tropics to latitudes of 37°S and single
peaks at sites south of this latitude. A longer grass pollen season was therefore found at sites
below 37°S, driven by later seasonal end dates for grass growth and flowering. Daily pollen counts
increased with latitude; subtropical regions had seasons of both high intensity and long duration.
At higher latitude sites, the single springtime grass pollen peak is potentially due to a cooler
growing season and a predominance of pollen from C3 grasses. The multiple peaks at lower
latitude sites may be due to a warmer season and the predominance of pollen from C4 grasses.
Prevalence and duration of seasonal allergies may reflect the differing pollen seasons across
Australia and NZ. It must be emphasized that these findings are tentative due to limitations in the
available data, reinforcing the need to implement standardized pollen-monitoring methods across
Australasia. Furthermore, spatiotemporal differences in grass pollen counts indicate that local,
current, standardized pollen monitoring would assist with the management of pollen allergen
exposure for patients at risk of allergic rhinitis and asthma.
Keywords
Aerobiology; Latitude; Grass pollen; Plant distribution; Australia; New Zealand
Medek et al. Page 2
Aerobiologia (Bologna). Author manuscript; available in PMC 2016 July 29.
Author M
anuscriptA
uthor Manuscript
Author M
anuscriptA
uthor Manuscript

1 Introduction
Grass pollen exposure represents a major public health burden in Australia and New Zealand
(NZ) for patients with seasonal allergic rhinitis and asthma (Hill et al. 1979; Erbas et al.
2007a, 2012). Although grass pollen is generally regarded as the major outdoor aeroallergen
source in Australasia (Bousquet et al. 2007), there are limited data on geographic and
temporal patterns of grass species phenology and their allergenic effects. Allergic
sensitization to C3 grasses has been well characterized. Introduced ryegrass (Lolium perenne) has been identified as one of the most significant aeroallergens of southern
temperate Australia (Ford and Baldo 1986; Schäppi et al. 1999). Tropical and subtropical
regions have received less attention in the study of respiratory allergy although C4 grasses
are recognized as significant contributors to allergic disease in northern Australia (Johnston
et al. 2009; Davies et al. 2012). The C4 grasses of the Chloridoideae and Panicoideae
subfamilies contain allergenic pollen (as reviewed in Davies 2014). Currently, there has been
no systematic study to evaluate differences in incidence of allergic disease triggered by C3
and C4 grass pollen; however, patients in subtropical regions show higher levels of allergic
sensitization and species-specific IgE reactivity to subtropical (C4) species than temperate
C3 species (Davies et al. 2011, 2012; Nony et al. 2015). Therefore, grass species distribution
has clinical significance due to both differences in season timing, and differences in allergen
composition and consequently immune recognition between subtropical and temperate grass
pollen (Andersson and Lidholm 2003; Johansen et al. 2009; Davies 2014).
Growth and flowering of grass species are closely coupled to seasonal variation in climate,
and continental scale climate gradients. For example, in Australia, seasonal water
availability is a predictor of C4 relative abundance, while daily minimum temperature in
January may predict C4 grass species richness (Murphy and Bowman 2007). Climate change
projections of increasing mean temperatures with variable effects on rainfall (IPCC 2013)
will have direct effects on plant phenology and on the distribution of allergenic species.
These changes will additionally influence pollen season and therefore the prevalence and
severity of allergic rhinitis and asthma, although our understanding of these changes is
currently limited and based on research that is largely derived from northern hemisphere
locales. Projecting these impacts in Australia and New Zealand requires an understanding of
variation in pollen seasonal dynamics over latitudinal and climatic gradients.
Australia presents a latitudinal gradient of both temperature and rainfall. The northern
tropics and subtropics are warm throughout the year, with summer rainfall, while
southeastern Australia has cool winters and either less seasonal or winter-dominant rainfall
patterns. Inland, winter and spring frosts are common. New Zealand’s climate is less diverse,
and is similar to southeastern Australia, though generally characterized by cooler
temperatures and higher rainfall (Sturman and Tapper 2006). Across these climate gradients,
there is distinctive variation in the composition and distribution of vegetation communities
and the airborne pollen assemblages they produce (Haberle et al. 2014).
Grass pollen from indigenous and introduced species form a major component of airborne
pollen in Australian and NZ and in broad terms reflects the distributions of a wide diversity
of C3 and C4 grasses. While all plants fix and assimilate carbon into a three-carbon sugar, C4
Medek et al. Page 3
Aerobiologia (Bologna). Author manuscript; available in PMC 2016 July 29.
Author M
anuscriptA
uthor Manuscript
Author M
anuscriptA
uthor Manuscript

photosynthesis involves a four-carbon intermediate, coupled with altered leaf anatomy,
allowing effective concentration of CO2 around carboxylation machinery. This reduces water
loss, and increases carboxylation efficiency, allowing C4 grasses to grow in drier, hotter
environments (Ehleringer et al. 1997). The relative distributions of C3 and C4 grasses are
strongly latitudinally dependent (Fig. 1). While C3 grasses, such as ryegrass (Lolium perenne), dominate in temperate regions of Australia and New Zealand (Hill et al. 1979), C4
species dominate grasslands of northern and central Australia, where the growing seasonal
average temperatures exceed 22 °C (Collatz et al. 1998) or season minimum temperatures
exceed 12–15 °C (Fig. 1; Hattersley 1983). These species include Sorghum halapense (Johnson grass), Paspalum notatum (Bahia grass) and Cynodon dactylon (Bermuda grass)
plus invasive species Andropogon gayanus (Gamba grass) and in the arid zone, Cenchrus ciliaris (Buffel grass). In temperate NZ, grass flowering follows a latitudinal trend, being
later in the growing season at the southernmost latitudes (Newnham 1999). Similar patterns
are likely to occur over broader climatic zones in Australia, but to date this question has not
been addressed.
Although available for most capital cities, seasonal grass pollen monitoring in Australia has
been poorly coordinated at a national level, with campaigns of variable duration and using a
variety of methodologies (Haberle et al. 2014). Aerobiological research in NZ has also been
limited in geographic coverage and temporal duration. The only study at a national scale was
conducted for a single season in 1988/89 (Newnham et al. 1995). Despite limitations with
data availability, an analytical synthesis of the data derived from these previous datasets
provides an opportunity to explore trends that can be further investigated using standardized
pollen counting methodology, such as the rigorous standards used across Europe and the
USA (Galán et al. 2014; American Academy of Allergy, Asthma & Immunology 2015).
Here, we specifically assess latitudinal variation and climate influences on the grass pollen
season timing and intensity, by analyzing existing pollen records along latitudinal gradients
in eastern Australia and NZ.
We have previously shown that the diversity of pollen recorded from Australian and New
Zealand monitoring sites reflects climate, land use and plant introduction (Haberle et al.
2014). We have also observed that the timing of the grass pollen season differs between
geographic locations and over time (Beggs et al. 2015). Here, we investigate the drivers of
variation in the characteristics of the grass pollen season across latitudinal and climatic
gradients.
2 Methods
We assembled daily (24 h) airborne grass pollen concentration data from eight Australian
and six NZ urban sites for sampling periods spanning from 1 to 17 years (Table 1; Haberle et
al. 2014). Pollen counts were performed and converted to grains per cubic meter of air for
sites in (from lowest to highest latitude) Darwin (two sites), Brisbane, Sydney, Canberra
(two sites) and Hobart over 2, 5, 8, 4 and 3 fiscal years, respectively (Dass 2010; Erbas et al.
2007b; Green et al. 2004; Katelaris and Burke 2003; Newnham et al. 1995; Newnham 1999;
Stevenson et al. 2007, Tng et al. 2010). Airborne pollen were counted within the expected
grass pollen season of 92 days for Melbourne (October–December) over 13 of the 17
Medek et al. Page 4
Aerobiologia (Bologna). Author manuscript; available in PMC 2016 July 29.
Author M
anuscriptA
uthor Manuscript
Author M
anuscriptA
uthor Manuscript

seasons, the others being full years, and between 88 and 134 days for the NZ sites (October–
April) over one season. Both Burkard (Australia) and Rotorod (NZ) volumetric samplers
were used, which for grass pollen, have been shown to be equivalent (Peel et al. 2014). For a
summary of sampling and counting techniques at each site see Table 1, references therein,
and Haberle et al. (2014).
Despite variability in timing, duration, sampling and counting techniques between sites, data
allowed for an exploration of both temporal and spatial variability in grass pollen seasons.
Pollen season timing was described by season start, end, duration and peak, calculated as
days since 1st July (Southern Hemisphere winter). For sites with year-long records, i.e.,
Darwin, Brisbane, Sydney, Canberra, and Hobart, and for 4 years in Melbourne, the pollen
season was defined as the period including 1–99 % (i.e., 98 %) of the total grass pollen
counts over the counting period or year (Galán et al. 1995). Start and end dates and total
season counts were excluded from analyses when the total count over the first or last 5 days
of measurement exceeded 1 % of the season total count. In these instances, it was assumed
that the grass pollen season extended beyond the sampling dates. This exclusion applied to
Sydney 2007, Palmerston, Northern Territory (NT) 2004, Canberra 2008, South Canberra
2010, Hobart 2007 and 2010, and Melbourne 1996–2012. Seasons were classified as having
multiple peaks if a 20-day running mean grass pollen count dropped below 5 grains m−3,
and then exceeded 5 grains m−3 for >2 days. This technique identified most sites with
visually identifiable later-season peaks, with the exception of 1 year in Brisbane when
counts did not drop sufficiently. Where multiple season peaks were identified, the day of the
second peak maximum count was recorded. To describe variation in pollen counts over the
season, we calculated the total annual count, maximum daily concentration and number of
days exceeding 20 and 50 grains m−3.
Daily maximum and minimum temperature (°C) and daily rainfall (mm), were obtained
from the Australian Bureau of Meteorology (www.bom.gov.au) and for NZ, the national
climate database (http://cliflo.niwa.co.nz/). Average spring temperature was defined as the
daily average of maximum and minimum temperature, averaged over the months of spring
(September–November).
The distribution of data was assessed by the Kolmolgorov–Smirnov test for normality. For
variables used to define pollen season intensity, differences between sites were assessed by
Kruskal–Wallis Test with Dunn’s pairwise comparisons.
For season timing, least squares linear regression was performed on the medians for each
site, examining correlation of pollen start, end and peak dates, and total season count with
latitude, temperature, and July rainfall. We chose median as it is robust in comparison with
the mean due to the underlying variation between years. Data were analyzed using the
statistical package R (2.15.3). Results are expressed as medians with 95 % confidence
intervals (CI). All of the analyses were done at a significance level of 0.05 unless otherwise
stated.
Growing degree days (GDD) for the timing of season peaks were calculated. This parameter
is widely used in the modeling of phenology (McMaster and Wilhelm 1997). The GDD is
Medek et al. Page 5
Aerobiologia (Bologna). Author manuscript; available in PMC 2016 July 29.
Author M
anuscriptA
uthor Manuscript
Author M
anuscriptA
uthor Manuscript

the cumulative temperature, in degrees, over the season, calculated based on the average
temperature for each day, summed over days from 1st July to the season peak. Average
temperature for each day is the average of daily temperature maximum and minimum. While
many GDD calculations exclude days below a baseline temperature, no baseline temperature
was defined.
3 Results
3.1 Total grass pollen count
To examine variation in the intensity of the grass pollen season, the total pollen counts were
compared between sites. In Australia, the total grass pollen per season (or year for Darwin,
Brisbane, Sydney, Canberra and Hobart) ranged from 793 (median, IQR 712–1066) grains
m−3 in Darwin to 4028 (median, IQR 3425–6093) grains m−3 in Brisbane (Fig. 2a).
The interannual variation in total pollen within Australian sites was reflected in the wide
variation within sites, and by the large difference between the highest and lowest season
total grass pollen counts (median 2.6, IQR 2.1–3.2). Darwin showed significantly lower total
grass pollen counts than Brisbane and Melbourne. Hobart showed statistically significant
lower total grass pollen counts than Brisbane. In NZ, total grass pollen per season ranged
from 783 grains m−3 in Christchurch to 11,910 grains m−3 in Gore. In interpreting this data,
it should be noted that total pollen counts may have been influenced by differing trap
heights.
3.2 Grass pollen season peaks
The maximum daily grass pollen count displayed both broad geographic and interannual
variability. In Australia, maximum daily pollen counts ranged from a median of 44 (IQR 22–
76) in Darwin to 231 (IQR 151–328) grains m−3 in Melbourne (Fig. 2b). Melbourne showed
significantly higher maximum daily grass pollen than Darwin, but the apparent differences
between Melbourne and other Australian cities (particularly Brisbane and Hobart) were not
statistically significant. At sites with data from multiple seasons, there was considerable
year-to-year variability in maximum daily grass pollen count; the difference between the
highest and lowest value varied 3.8-fold (IQR; 2.9–3.9). In NZ, maximum daily grass pollen
counts ranged from 45 in Christchurch to 2005 grains m−3 in Gore (Fig. 2d).
3.3 Seasonal distribution of pollen counts
Brisbane had the highest number of days per season with counts >20 grains m−3 (Fig. 3a),
whereas Melbourne showed the highest median number of days >50 grains m−3. For NZ
sites, Kaikohe, Palmerston North and Gore all showed>25 days per season with pollen
counts>50 grains m−3 (Fig. 3d).
3.4 Distribution of grass pollen concentrations
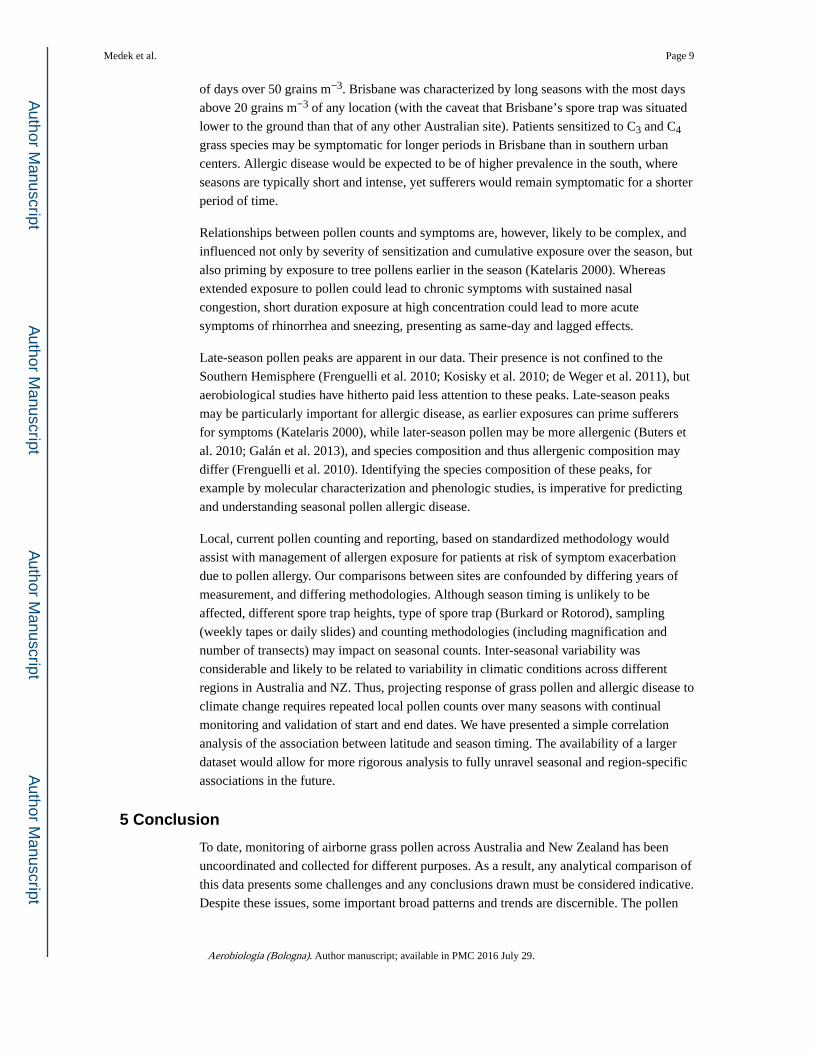
The character of the pollen season differed substantially between latitudes (Fig. 4). In
northern Australia, for example Brisbane, pollen seasons had multiple peaks, with summer/
early autumn peaks that were often larger than spring peaks. In mid-latitudes, for example
Sydney, grass pollen seasons again had multiple peaks, but spring peaks were larger than
Medek et al. Page 6
Aerobiologia (Bologna). Author manuscript; available in PMC 2016 July 29.
Author M
anuscriptA
uthor Manuscript
Author M
anuscriptA
uthor Manuscript

summer peaks. In contrast, in southernmost sites, for example Hobart, seasons were
characterized by a single peak, occurring in spring/summer (Fig. 4a). In NZ, no sites aside
from Auckland showed multiple seasonal peaks. Indeed, when comparing sites with one and
two or more peaks, sites with multiple peaks tended to be at lower latitudes (Fig. 4b, p <0.01).
3.5 Pollen season timing
Grass pollen season timing was strongly linked to latitude, and likewise to average spring
temperature, partly from the presence or absence and timing of the second seasonal peak.
While overall the season start date showed no relationship with latitude or average spring
temperature, among southern temperate sites, start date occurred later at cooler, higher
latitude sites. Likewise, across all sites, season end date occurred earlier with increasing
latitude and decreasing average spring temperature. Thus, season length decreased with
distance from the equator, or decreasing spring temperatures (Fig. 5c, d). The timing of
season peak, the highest pollen count from 1st July, occurred later in lower latitudes, but of
the higher latitude sites, peaks occurred later with increasing latitudes or colder spring
temperature (Fig. 5e, f). Latitudinal trends in season start and peak dates were similar when
comparison was made within countries (and thus within the groups of sites that used only
Rotorod or Hirst-type spore traps), but only trends in peak and end date were significant in
Australia, and no trends achieved statistical significance in New Zealand data.
Seasonal maximum pollen peaks occurred at high latitudes on a median growing degree day
of 1977 °C (interquartile range 1693–2151). The GDD of low latitude pollen season peaks
was greater and more variable, with a minimum of 2483 °C in Brisbane (1996) to a
maximum of 8374 °C in Darwin (2003).
The correlation between pollen season timing and rainfall was examined. A trend was found
for increasing total grass pollen count with increasing July rainfall (not shown, p = 0.05), yet
half the variance in season count remained unaccounted for (R2 = 0.5). This trend was not
improved by removing Darwin and Brisbane from the analysis. There were also no clear
trends in total grass pollen counts with latitude or spring temperature (total season count vs.
latitude, p = 0.24, R2 = 0.21).
4 Discussion
Grass pollen season duration and intensity are among the most important parameters for
determining allergy symptom duration and severity. In Australia and NZ, the currently
available datasets suggest that considerable geographical variability exists in both total grass
pollen counts and peak season duration. Within the temperate sites, the grass season start
date occurred later in more southern latitudes with cooler climates; however, the data
indicate an even greater latitudinal response in season end date, occurring earlier with
increased latitude. These changes led to the consistent trend of shorter seasons at higher
latitudes. The grass pollen trends are likely to reflect climate influences on both species
distribution and grass phenology. Delayed season end date in lower latitudes is likely to
reflect the presence or absence of summer and autumn pollen peaks. Multiple peaks within a
season may represent different species flowering at various temporal intervals and/or
Medek et al. Page 7
Aerobiologia (Bologna). Author manuscript; available in PMC 2016 July 29.
Author M
anuscriptA
uthor Manuscript
Author M
anuscriptA
uthor Manuscript

multiple flowering events for the same species in a year. For example, the flowering season
of Gamba grass is noted to occur after that of native grasses in NT (Stevenson et al. 2007).
These variables have not been able to be evaluated on a broader scale as the pollen-
monitoring methods used do not differentiate grass pollen to species level nor between C3
and C4 types.
While C3 grasses tend to flower in spring, C4 species are summer-flowering (Ehleringer et
al. 1997; Bass et al. 2000; Australasian Society of Clinical Immunology and Allergy 2014).
The multiple peaks in summer through autumn in northern Australia are likely to represent
the flowering of C4 species. Additionally, at higher latitudes, summer peaks may reflect a
second generation of spring-flowering grasses germinating and flowering, which may only
be possible where development to flowering occurs before autumn frosts.
Some of the observed variation in pollen season timing with latitude is likely to be related to
consistent latitudinal trends in temperature. However, both day length and rainfall patterns
are also strongly dependent on latitude in Australia (Sturman and Tapper 2006). These
additional factors are likely to influence grass distribution and development. Again, while
the temperate season peak could be roughly estimated by growing degree day calculations,
there was considerable variability between sites, suggesting the importance of variables
other than temperature. Indeed, within sites, rainfall influences phenology. Spring rainfall is
a predictor of total season pollen count in Melbourne (de Morton et al. 2011), whereas the
pollen season of Darwin is closely related to the onset of the wet season and bears little
relation to seasonal temperature change (Stevenson et al. 2007). While pollen levels in
Brisbane were associated with rainfall, this relationship was not associated with cumulative
winter rainfall as observed in Melbourne, but with summer rainfall events (Green et al.
2002). In our study, winter rainfall was a poorer predictor of median seasonal counts across
all sites, and even across southern temperate sites alone.
The underlying cause of the trends in grass pollen season across latitudinal gradients is
linked to climate effects on grass species abundance and species diversity, especially
seasonal patterns in temperature and water availability (Murphy and Bowman 2007).
Agricultural practices and thus pasture composition is likely to be influenced by climate
change; moreover, the response of introduced species to climate change in Australia is
uncertain, and will likely involve altered ranges and patterns of dominance (Haberle et al.
2014). It will therefore be important to monitor the distribution of C4 and C3 grasses for
changes that may have a clinical impact upon the exposure to pollen and immune responses
of patients to different allergen repertoires present within pollen of subtropical and
temperate grasses (reviewed in Davies 2014).
In this study, trends in the number of days above 20 and 50 grains m−3 were found to reflect
both season intensity and season duration. While the variation in years of measurement,
collection and counting methods suggests that care should be exercised when analyzing
absolute pollen counts across sites, and the extreme high counts of the southern states
contrast with the low daily counts yet long seasons in northern sites. How allergic disease
manifests in the population may vary accordingly. While Darwin had very long seasons,
daily pollen counts were relatively low. In contrast, Melbourne showed the highest number
Medek et al. Page 8
Aerobiologia (Bologna). Author manuscript; available in PMC 2016 July 29.
Author M
anuscriptA
uthor Manuscript
Author M
anuscriptA
uthor Manuscript
of days over 50 grains m−3. Brisbane was characterized by long seasons with the most days
above 20 grains m−3 of any location (with the caveat that Brisbane’s spore trap was situated
lower to the ground than that of any other Australian site). Patients sensitized to C3 and C4
grass species may be symptomatic for longer periods in Brisbane than in southern urban
centers. Allergic disease would be expected to be of higher prevalence in the south, where
seasons are typically short and intense, yet sufferers would remain symptomatic for a shorter
period of time.
Relationships between pollen counts and symptoms are, however, likely to be complex, and
influenced not only by severity of sensitization and cumulative exposure over the season, but
also priming by exposure to tree pollens earlier in the season (Katelaris 2000). Whereas
extended exposure to pollen could lead to chronic symptoms with sustained nasal
congestion, short duration exposure at high concentration could lead to more acute
symptoms of rhinorrhea and sneezing, presenting as same-day and lagged effects.
Late-season pollen peaks are apparent in our data. Their presence is not confined to the
Southern Hemisphere (Frenguelli et al. 2010; Kosisky et al. 2010; de Weger et al. 2011), but
aerobiological studies have hitherto paid less attention to these peaks. Late-season peaks
may be particularly important for allergic disease, as earlier exposures can prime sufferers
for symptoms (Katelaris 2000), while later-season pollen may be more allergenic (Buters et
al. 2010; Galán et al. 2013), and species composition and thus allergenic composition may
differ (Frenguelli et al. 2010). Identifying the species composition of these peaks, for
example by molecular characterization and phenologic studies, is imperative for predicting
and understanding seasonal pollen allergic disease.
Local, current pollen counting and reporting, based on standardized methodology would
assist with management of allergen exposure for patients at risk of symptom exacerbation
due to pollen allergy. Our comparisons between sites are confounded by differing years of
measurement, and differing methodologies. Although season timing is unlikely to be
affected, different spore trap heights, type of spore trap (Burkard or Rotorod), sampling
(weekly tapes or daily slides) and counting methodologies (including magnification and
number of transects) may impact on seasonal counts. Inter-seasonal variability was
considerable and likely to be related to variability in climatic conditions across different
regions in Australia and NZ. Thus, projecting response of grass pollen and allergic disease to
climate change requires repeated local pollen counts over many seasons with continual
monitoring and validation of start and end dates. We have presented a simple correlation
analysis of the association between latitude and season timing. The availability of a larger
dataset would allow for more rigorous analysis to fully unravel seasonal and region-specific
associations in the future.
5 Conclusion
To date, monitoring of airborne grass pollen across Australia and New Zealand has been
uncoordinated and collected for different purposes. As a result, any analytical comparison of
this data presents some challenges and any conclusions drawn must be considered indicative.
Despite these issues, some important broad patterns and trends are discernible. The pollen
Medek et al. Page 9
Aerobiologia (Bologna). Author manuscript; available in PMC 2016 July 29.
Author M
anuscriptA
uthor Manuscript
Author M
anuscriptA
uthor Manuscript

season displays spatiotemporal variability across Australia and New Zealand. Much of the
variation over latitude lies in the less-studied late-season pollen peaks. These peaks may
relate to the presence of warmer-climate C4 grasses in northern latitudes. Patterns of allergic
disease may reflect the differing seasonal characters, with longer, lower intensity seasons in
northern latitudes, and shorter yet more intense seasons in southern latitudes. These trends in
grass pollen aerobiology need to be confirmed with well-designed, prospective studies
employing standardized collection and counting methodologies across multiple sites in the
Australasian region.
Acknowledgments
The Australian Aerobiology Working Group was supported by the Australian Centre for Ecological Analysis and Synthesis (ACEAS), Terrestrial Ecosystem Research Network (TERN). Merck Sharp and Dohme provided additional independent untied co-sponsorship for the Working Group. The authors wish to thank Associate Professor Alison Specht, Program Manager, and the staff of ACEAS, TERN for assistance in organizing the Workshops of the Working Group “Understanding Australian aerobiology to monitor environmental change and human allergenic exposure”, North Stradbroke Island, Australia (March and November, 2013). We thank Doctors Diana Bass and Geoffrey Morgan for provision of their published pollen count data from Sydney. Alison Jaggard has been assisted by the New South Wales Government through its Environmental Trust (project reference number 2011/RD/0049). The findings and the conclusions in this report are those of the authors and do not necessarily represent the views of the US National Institute for Occupational Safety and Health. The authors also acknowledge the contributions a diverse group of people made to this study through counting pollen and maintaining the pollen records that we consolidated and analyzed. Finally, the authors wish to thank Associate Professor Jeroen Buters (Germany), Associate Professor Frank Murray (Australia), and Dr Michel Thibaudon (France) for their contributions to the working group.
References
American Academy of Allergy, Asthma & Immunology. [Accessed 15 Jul 2015] Counting stations. 2015. http://www.aaaai.org/global/nab-pollen-counts/counting-stations.aspx
Andersson K, Lidholm J. Characteristics and immunobiology of grass pollen allergens. International Archives of Allergy and Immunology. 2003; 130(2):87–107. [PubMed: 12673063]
Australasian Society of Clinical Immunology and Allergy. [Accessed 05 Apr 2014] Pollen calendar–guide to common allergenic pollen. 2014. http://www.allergy.org.au/patients/allergic-rhinitis-hay-fever-and-sinusitis/guide-to-common-allergenic-pollen
Bass DJ, Delpech V, Beard J, Bass P, Walls RS. Late summer and fall (March–May) pollen allergy and respiratory disease in Northern New South Wales, Australia. Annals of Allergy, Asthma & Immunology. 2000; 85(5):374–381.
Beggs PJ, Katelaris CH, Medek D, Johnston FH, Burton PK, Campbell B, et al. Differences in grass pollen allergen exposure across Australia. Australian and New Zealand Journal of Public Health. 2015; 39(1):51–55. [PubMed: 25648730]
Bousquet PJ, Hooper R, Kogevinas M, Jarvis D, Burney P. Number of allergens to be tested to assess allergenic sensitization in epidemiologic studies: Results of the European Community Respiratory Health Survey I. Clinical and Experimental Allergy. 2007; 37(5):780–787. [PubMed: 17456226]
Buters JTM, Weichenmeier I, Ochs S, Pusch G, Kreyling W, Boere AJF, et al. The allergen Bet v 1 in fractions of ambient air deviates from birch pollen counts. Allergy. 2010; 65(7):850–858. [PubMed: 20132158]
Collatz GJ, Berry JA, Clark JS. Effects of climate and atmospheric CO2 partial pressure on the global distribution of C4 grasses: Present, past, and future. Oecologia. 1998; 114(4):441–454. [PubMed: 28307893]
Dass, D. Honours Thesis. The Australian National University; 2010. Influence of weather on prevalence and seasonality of airspora in Canberra.
Davies JM. The contribution of subtropical grass pollen allergens to the global burden of allergic respiratory disease. Clinical and Experimental Allergy. 2014; 44(6):790–801. [PubMed: 24684550]
Medek et al. Page 10
Aerobiologia (Bologna). Author manuscript; available in PMC 2016 July 29.
Author M
anuscriptA
uthor Manuscript
Author M
anuscriptA
uthor Manuscript

Davies JM, Dang TD, Voskamp A, Drew AC, Biondo M, Phung M, et al. Functional immunoglobulin E cross-reactivity between Pas n 1 of Bahia grass pollen and other group 1 grass pollen allergens. Clinical and Experimental Allergy. 2011; 41(2):281–291. [PubMed: 21231976]
Davies JM, Li H, Green M, Towers M, Upham JW. Subtropical grass pollen allergens are important for allergic respiratory diseases in subtropical regions. Clinical and Translational Allergy. 2012; 2(4):1–10. [PubMed: 22409857]
de Morton J, Bye J, Pezza A, Newbigin E. On the causes of variability in amounts of airborne grass pollen in Melbourne, Australia. International Journal of Biometeorology. 2011; 55(4):613–622. [PubMed: 20814699]
de Weger LA, Beerthuizen T, Gast-Strookman JM, van der Plas DT, Terreehorst I, Hiemstra PS, Sont JK. Difference in symptom severity between early and late grass pollen season in patients with seasonal allergic rhinitis. Clinical and Translational Allergy. 2011; 1(1):1–11. [PubMed: 22409866]
Ehleringer JR, Cerling TE, Helliker BR. C4 photosynthesis, atmospheric CO2, and climate. Oecologia. 1997; 112(3):285–299. [PubMed: 28307475]
Erbas B, Akram M, Dharmage SC, Tham R, Dennekamp M, Newbigin E, et al. The role of seasonal grass pollen on childhood asthma emergency department presentations. Clinical and Experimental Allergy. 2012; 42(5):799–805. [PubMed: 22515396]
Erbas B, Chang JH, Dharmage S, Ong EK, Hyndman R, Newbigin E, Abramson M. Do levels of airborne grass pollen influence asthma hospital admissions? Clinical and Experimental Allergy. 2007a; 37(11):1641–1647. [PubMed: 17877763]
Erbas B, Chang J-H, Newbigin E, Dhamarge S. Modelling atmospheric concentrations of grass pollen using meteorological variables in Melbourne, Australia. International Journal of Environmental Health Research. 2007b; 17(5):361–368. [PubMed: 17924264]
Ford SA, Baldo BA. A re-examination of ryegrass (Lolium perenne) pollen allergens. International Archives of Allergy and Immunology. 1986; 81(3):193–203.
Frenguelli G, Passalacqua G, Bonini S, Fiocchi A, Incorvaia C, Marcucci F, et al. Bridging allergologic and botanical knowledge in seasonal allergy: A role for phenology. Annals of Allergy, Asthma & Immunology. 2010; 105(3):223–227.
Galán C, Antunes C, Brandao R, Torres C, Garcia-Mozo H, Caeiro E, et al. Airborne olive pollen counts are not representative of exposure to the major olive allergen Ole e 1. Allergy. 2013; 68(6):809–812. [PubMed: 23647633]
Galán C, Emberlin J, Domínguez E, Bryant RH, Villamandos F. A comparative analysis of daily variations in the Gramineae pollen counts at Córdoba, Spain and London, UK. Grana. 1995; 34(3):189–198.
Galán C, Smith M, Thibaudon M, Frenguelli G, Oteros J, Gehrig R, et al. Pollen monitoring: minimum requirements and reproducibility of analysis. Aerobiologia. 2014; 30(4):385–395.
Green BJ, Dettmann ME, Rutherford S, Simpson RW. Airborne pollen of Brisbane, Australia: A five-year record, 1994–1999. Grana. 2002; 41(4):242–250.
Green BJ, Dettmann M, Yli-Panula E, Rutherford S, Simpson R. Atmospheric Poaceae pollen frequencies and associations with meteorological parameters in Brisbane, Australia: A 5-year record, 1994–1999. International Journal of Biometeorology. 2004; 48(4):172–178. [PubMed: 14997370]
Haberle SG, Bowman DMJS, Newnham RM, Johnston FH, Beggs PJ, Buters J, et al. The macroecology of airborne pollen in Australian and New Zealand urban areas. PLoS ONE. 2014; 9(5):e97925.doi: 10.1371/journal.pone.0097925 [PubMed: 24874807]
Hattersley PW. The distribution of C3 and C4 grasses in Australia in relation to climate. Oecologia. 1983; 57(1–2):113–128. [PubMed: 28310164]
Hill DJ, Smart IJ, Knox RB. Childhood asthma and grass pollen aerobiology in Melbourne. The Medical Journal of Australia. 1979; 1(10):426–429. [PubMed: 470669]
IPCC. Climate Change 2013: The Physical Science Basis: Working Group I Contribution to the Fifth Assessment Report of the Intergovernmental Panel on Climate Change. Cambridge: Cambridge University Press; 2013.
Medek et al. Page 11
Aerobiologia (Bologna). Author manuscript; available in PMC 2016 July 29.
Author M
anuscriptA
uthor Manuscript
Author M
anuscriptA
uthor Manuscript

Johansen N, Weber RW, Ipsen H, Barber D, Broge L, Hejl C. Extensive IgE cross-reactivity towards the Pooideae grasses substantiated for a large number of grass-pollen-sensitized subjects. International Archives of Allergy and Immunology. 2009; 150(4):325–334. [PubMed: 19571564]
Johnston FH, Hanigan IC, Bowman DMJS. Pollen loads and allergic rhinitis in Darwin, Australia: A potential health outcome of the grass-fire cycle. EcoHealth. 2009; 6(1):99–108. [PubMed: 19424756]
Katelaris CH. Allergic rhinoconjunctivitis—An overview. Acta Ophthalmologica Scandinavica. 2000; 78(s230):66–68.
Katelaris CH, Burke TV. A 7 year pollen profile of major Olympic Games venues in Sydney, Australia. Aerobiologia. 2003; 19(2):121–124.
Kosisky SE, Marks MS, Nelson MR. Pollen aeroallergens in the Washington, DC, metropolitan area: A 10-year volumetric survey (1998–2007). Annals of Allergy, Asthma & Immunology. 2010; 104(3):223–235.
McMaster GS, Wilhelm WW. Growing degree-days: One equation, two interpretations. Agricultural and Forest Meteorology. 1997; 87(4):291–300.
Murphy BP, Bowman DMJS. Seasonal water availability predicts the relative abundance of C3 and C4 grasses in Australia. Global Ecology and Biogeography. 2007; 16(2):160–169.
Newnham RM. Monitoring biogeographical response to climate change: The potential role of aeropalynology. Aerobiologia. 1999; 15(2):87–94.
Newnham RM, Fountain DW, Cornford CC, Forde MB. A national survey of airborne pollen and grass flowering in New Zealand, with implications for respiratory disorder. Aerobiologia. 1995; 11(4):239–252.
Nony E, Timbrell V, Hrabina M, Boutron M, Solley G, Moingeon P, Davies JM. Specific IgE recognition of pollen allergens from subtropic grasses in patients from the subtropics. Annals of Allergy, Asthma & Immunology. 2015; 114:214, e220.
Peel RG, Kennedy R, Smith M, Hertel O. Relative efficiencies of the Burkard 7-day, Rotorod and Burkard Personal samplers for Poaceae and Urticaceae pollen under field conditions. Annals of Agricultural and Environmental Medicine. 2014; 21(4):745–752. [PubMed: 25528914]
Schäppi GF, Taylor PE, Pain MCF, Cameron PA, Dent AW, Staff IA, Suphioglu C. Concentrations of major grass group 5 allergens in pollen grains and atmospheric particles: Implications for hay fever and allergic asthma sufferers sensitized to grass pollen allergens. Clinical and Experimental Allergy. 1999; 29(5):633–641. [PubMed: 10231323]
Stevenson J, Haberle SG, Johnston FH, Bowman DMJS. Seasonal distribution of pollen in the atmosphere of Darwin, tropical Australia: Preliminary results. Grana. 2007; 46(1):34–42.
Sturman, AP., Tapper, NJ. The weather and climate of Australia and New Zealand. 2. Oxford: Oxford University Press; 2006.
Tng DYP, Hopf F, Haberle SG, Bowman DMJS. Seasonal pollen distribution in the atmosphere of Hobart, Tasmania: Preliminary observations and congruence with flowering phenology. Australian Journal of Botany. 2010; 58(6):440–452.
Medek et al. Page 12
Aerobiologia (Bologna). Author manuscript; available in PMC 2016 July 29.
Author M
anuscriptA
uthor Manuscript
Author M
anuscriptA
uthor Manuscript

Fig. 1. Location of pollen-monitoring sites, with distribution of C3 (black) and C4 (light gray) grass
genera, and sites of co- occurring C3 and C4 grasses (dark gray) in Australia and New
Zealand based on observation of C3 (Agrostis, Avena, Bromus, Dactylis, Danthonia, Festuca, Holcus, Hordeum, Lolium, Phalaris, Phleum, Poa, Rytidosperma, Triticum, and
Zoysia) and C4 (Andropogon, Aristida, Astrebla, Cenchrus, Cynodon, Echinochloa, Enteropogon, Eragrostis, Panicum, Paspalum, Sorghum, Sporobolus, Themeda, and Triodia)
in Australia, and C3 (Agrostis, Anthoxanthum, Austrostipa, Avena, Bromus, Chionochloa, Critesion, Dactylis, Deschampsia, Deyeuxia, Festuca, Holcus, Koeleria, Lachnagrostis, Lolium, Nassella, Pennisetum, Phalaris, Phleum, Poa, Rytidosperma, and Trise-tum) and C4
(Andropogon, Cynodon, Panicum, Paspalum, Setaria, and Sorghum) in NZ. Sources Atlas of
Living Australia (http://www.ala.org.au/), and New Zealand Virtual Herbarium (http://
www.virtualherbarium.org.nz/)
Medek et al. Page 13
Aerobiologia (Bologna). Author manuscript; available in PMC 2016 July 29.
Author M
anuscriptA
uthor Manuscript
Author M
anuscriptA
uthor Manuscript

Fig. 2. Variation in airborne grass pollen season intensity as described by total (a, b) and maximum
(c, d) grass pollen count for Australia (a, c) and New Zealand (b, d). Data points represent
values for separate seasons. For Melbourne, pollen count data were only available for 3
months from October 1 (Kruskal–Wallis with Dunn’s pairwise comparisons; *p <0.05; **p <0.01). Median and Interquartile ranges are shown for sites with data for >4 seasons
Medek et al. Page 14
Aerobiologia (Bologna). Author manuscript; available in PMC 2016 July 29.
Author M
anuscriptA
uthor Manuscript
Author M
anuscriptA
uthor Manuscript

Fig. 3. Sum of days with grass pollen levels exceeding 20 (a, b) or 50 (c, d) grains m−3 in Australia
(a, c) and New Zealand (b, d). Data points represent values for separate seasons. For
Melbourne, pollen count data were only available for 3 months from October 1 (Kruskal–
Wallis with Dunn’s pairwise comparisons; *p <0.05; **, p <0.01; ***p <0.005). Median and
Interquartile ranges are shown for sites with data for>4 seasons
Medek et al. Page 15
Aerobiologia (Bologna). Author manuscript; available in PMC 2016 July 29.
Author M
anuscriptA
uthor Manuscript
Author M
anuscriptA
uthor Manuscript
Fig. 4. Latitudinal gradients in seasonal distribution of pollen. a Examples of pollen season
distributions for sites in warmer climates (Brisbane and Sydney) that show two or more
grass pollen peaks, and a cooler-climate site (Hobart) that shows one season peak. Lines represent 20-day moving average pollen counts, and points represent daily counts. Counts
are plotted over a fiscal year from July 1st. b Latitudinal distribution of sites with single
(Melbourne, Hobart, Kaikohe, Palmerston North, Christchurch, Gore) versus multiple
(Darwin, Brisbane, Sydney, Canberra and Auckland) peaks in pollen seasons (median and
IQR)
Medek et al. Page 16
Aerobiologia (Bologna). Author manuscript; available in PMC 2016 July 29.
Author M
anuscriptA
uthor Manuscript
Author M
anuscriptA
uthor Manuscript

Fig. 5. Variation in timing of pollen season with latitude (a, c, e) and average spring temperature (b, d, f). Three measures of pollen season timing are shown: season start (a, b) and end date (c, d), and season peak (e, f). Points represent medians, with bars representing the interquartile
range when more than two values were available. Filled symbols represent Australian sites
and hollow symbols represent NZ sites. Significant regression lines are presented. Gray
Medek et al. Page 17
Aerobiologia (Bologna). Author manuscript; available in PMC 2016 July 29.
Author M
anuscriptA
uthor Manuscript
Author M
anuscriptA
uthor Manuscript
symbols in panels a, b, e, f indicate Northern Territory and Brisbane sites, which are
excluded in these cases from the regression. For statistical details, see Table 2
Medek et al. Page 18
Aerobiologia (Bologna). Author manuscript; available in PMC 2016 July 29.
Author M
anuscriptA
uthor Manuscript
Author M
anuscriptA
uthor Manuscript

Author M
anuscriptA
uthor Manuscript
Author M
anuscriptA
uthor Manuscript
Medek et al. Page 19
Tab
le 1
Site
cha
ract
eris
tics,
incl
udin
g la
titud
e (°
S), y
ears
of
polle
n re
cord
s us
ed, a
vera
ge a
nnua
l max
imum
(M
axT
) an
d m
inim
um (
Min
T)
tem
pera
ture
s, m
ean
annu
al p
reci
pita
tion
(MA
P), a
nd e
leva
tion
Site
Lat
itud
e(°
S)Y
ears
Max
T(°
C)
Min
T(°
C)
MA
P(m
m)
Ele
vati
on (m)
Env
iron
men
tC
limat
eM
onit
orhe
ight
(m)
Mon
itor
type
Mag
nifi
cati
on,
tran
sect
s
Aus
tral
ia
Dar
win
(tw
o si
tes)
a12
2003
–200
433
.319
.317
3013
Urb
an, o
pen
woo
dlan
dT
ropi
cal,
win
ter
dry
14B
urka
rd40
×, 4
tran
sect
s
Bri
sban
eb27
1994
–199
830
.310
997
13U
rban
Hum
id s
ubtr
opic
al2
Bur
kard
25×
, ent
ire
slid
e
Sydn
eyc
3419
93–1
995
2008
–201
225
.98
1213
74U
rban
, eve
rgre
en f
ores
t, w
oodl
and
Mar
itim
e te
mpe
rate
10B
urka
rd40
×, 3
tran
sect
s
Can
berr
a (t
wo
site
s)d
3520
07–2
010
28−
0.1
612
569
Urb
an, c
ropl
and,
gra
ssla
ndM
ariti
me
tem
pera
te8,
14
Bur
kard
40×
, 4/1
tran
sect
s
Mel
bour
nee
3819
96–2
012
25.9
665
043
Urb
anM
ariti
me
tem
pera
te14
Bur
kard
20×
, 1 tr
anse
ct
Hob
artf
4320
08–2
010
21.6
4.5
616
58E
verg
reen
for
est,
urba
nM
ariti
me
tem
pera
te12
Bur
kard
40×
, 4 tr
anse
cts
New
Zea
land
Kai
kohe
g35
1988
24.3
7.8
1304
198
Eve
rgre
en f
ores
tM
ariti
me
tem
pera
te2
Rot
orod
40×
Auc
klan
dg37
1989
23.7
7.1
1239
15U
rban
Mar
itim
e te
mpe
rate
3R
otor
od40
×
Palm
erst
on N
orth
g40
1988
22.9
4.7
968
36G
rass
land
, cro
plan
dM
ariti
me
tem
pera
te5
Rot
orod
40×
Chr
istc
hurc
hg44
1988
232
651
14U
rban
, gra
ssla
ndM
ariti
me
tem
pera
te20
Rot
orod
40×
Dun
edin
h46
1992
18.9
3.2
814
4G
rass
land
, mix
ed f
ores
tM
ariti
me
tem
pera
te5
Rot
orod
40×
Gor
eg46
1988
18.7
111
4957
Gra
ssla
ndM
ariti
me
tem
pera
te2
Rot
orod
40×
“Env
iron
men
t” li
sts
the
mos
t com
mon
land
use
type
s ba
sed
on I
nter
natio
nal G
eosp
here
–Bio
sphe
re P
rogr
amm
e cl
assi
fica
tions
, with
in a
10-
km r
adiu
s of
the
site
. “C
limat
e” li
sts
each
site
’s K
öppe
n cl
imat
e cl
assi
fica
tion.
Ele
vatio
n re
fers
to h
eigh
t abo
ve s
ea le
vel.
Mon
itor
heig
ht
refe
rs to
hei
ght a
bove
gro
und
leve
l at t
he s
ite. “
Mag
nifi
catio
n, tr
anse
cts”
ref
ers
to th
e ob
ject
ive
used
whe
n co
untin
g, a
nd th
e nu
mbe
r of
tran
sect
s pe
rfor
med
acr
oss
each
slid
e. F
or f
urth
er in
form
atio
n on
mon
itori
ng p
roto
cols
and
site
des
crip
tions
, see
Hab
erle
et a
l. (2
014)
a Stev
enso
n et
al.
(200
7),
b Gre
en e
t al.
(200
4),
c Kat
elar
is a
nd B
urke
(20
03),
d Das
s (2
010)
,
e Erb
as e
t al.
(200
7b),
f Tng
et a
l. (2
010)
,
g New
nham
et a
l. (1
995)
,
Aerobiologia (Bologna). Author manuscript; available in PMC 2016 July 29.

Author M
anuscriptA
uthor Manuscript
Author M
anuscriptA
uthor Manuscript
Medek et al. Page 20h N
ewnh
am (
1999
)
Aerobiologia (Bologna). Author manuscript; available in PMC 2016 July 29.

Author M
anuscriptA
uthor Manuscript
Author M
anuscriptA
uthor Manuscript
Medek et al. Page 21
Tab
le 2
Res
ults
of
sim
ple
linea
r re
gres
sion
for
pol
len
seas
on p
aram
eter
s ag
ains
t lat
itude
and
ave
rage
spr
ing
tem
pera
ture
(Sp
ring
T)
Pol
len
seas
on p
aram
eter
Com
pari
son
Slop
eC
IR
2p
Star
t dat
e (E
xcl.
NT
and
Bri
sban
e)L
atitu
de5.
82.
0, 9
.50.
690.
010
Spri
ng T
−9.
6−
17.9
, −1.
20.
570.
030
End
dat
eL
atitu
de−
6.1
−8.
4, −
3.8
0.74
<0.
001
Spri
ng T
14.9
9.1,
20.
70.
870.
001
Seas
on le
ngth
Lat
itude
−7.
7−
11.8
, −3.
70.
780.
003
Spri
ng T
14.3
5.0,
23.
50.
700.
009
Seas
on p
eak
(Exc
l. N
T a
nd B
risb
ane)
Lat
itude
4.0
1.9,
9.7
0.67
0.00
2
Spri
ng T
−7.
4−
11.6
, −3.
30.
650.
003
Site
s in
the
Nor
ther
n Te
rrito
ry (
Dar
win
and
Pal
mer
ston
) an
d B
risb
ane
wer
e ex
clud
ed f
rom
line
ar r
egre
ssio
n of
sea
son
star
t and
pea
k
Aerobiologia (Bologna). Author manuscript; available in PMC 2016 July 29.