Dams in Oregon · Dams in Oregon More than 1,100 dams in state dam inventory . 48 dams more than...
51
U.S. Department of the Interior U.S. Geological Survey U.S. Department of the Interior U.S. Geological Survey Dams in Oregon: impacts, opportunities and future directions Rose Wallick Chauncey Anderson, Stewart Rounds, Mackenzie Keith, Krista Jones USGS Oregon Water Science Center
Transcript of Dams in Oregon · Dams in Oregon More than 1,100 dams in state dam inventory . 48 dams more than...

U.S. Department of the Interior U.S. Geological Survey U.S. Department of the Interior U.S. Geological Survey
Dams in Oregon: impacts, opportunities and future directions Rose Wallick Chauncey Anderson, Stewart Rounds, Mackenzie Keith, Krista Jones USGS Oregon Water Science Center

Dams in Oregon
More than 1,100 dams in state dam inventory 48 dams more than 100ft tall 10 dams more than 300 ft tall Cougar Dam is tallest – 519 ft
Dam Height

Overview Purpose and environmental impacts of dams Strategies to address impacts Removal, infrastructure modifications, operations
Science insights from USGS studies Future directions

U.S. has more than 87,000 documented
dams Source: National Inventory of Dams,
ttp://nid.usace.army.mil/
After Doyle et al. (2003)
Dam
s bu
ilt p
er d
ecad
e
Cougar Dam, completed 1963, 519 ft
Detroit Dam, completed 1953, 463 ft
Photographs courtesy USACE
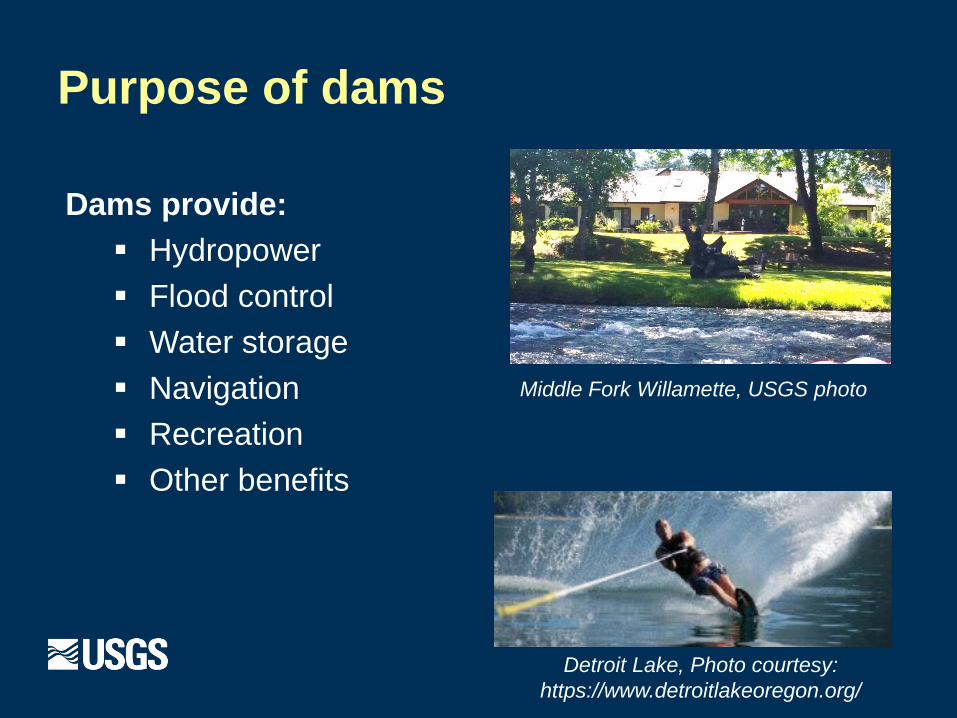
Purpose of dams
Dams provide: Hydropower Flood control Water storage Navigation Recreation Other benefits
Detroit Lake, Photo courtesy: https://www.detroitlakeoregon.org/
Middle Fork Willamette, USGS photo
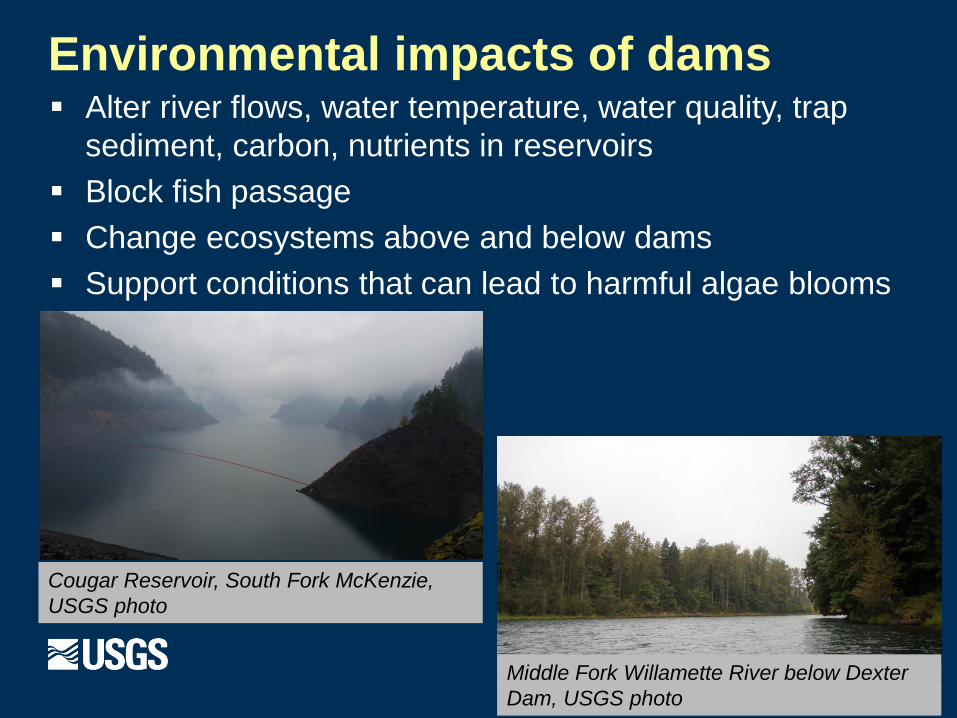
Environmental impacts of dams Alter river flows, water temperature, water quality, trap
sediment, carbon, nutrients in reservoirs Block fish passage Change ecosystems above and below dams Support conditions that can lead to harmful algae blooms
Middle Fork Willamette River below Dexter Dam, USGS photo
Cougar Reservoir, South Fork McKenzie, USGS photo

Motivating factors for removing, upgrading or re-operating dams
Iron Gate Dam and Reservoir, Klamath River, Photograph by C. Anderson, USGS
Examples include: • Dams age, expensive to maintain safely • Facilities may not work as initially intended • Reservoirs fill with sediment • Regulatory requirements
• Fish passage • Water quality

Management strategies Obsolete or unsafe dams are candidates for removal Upgrade facilities Fish passage Temperature control Total dissolved gas Modify operations of existing facilities Environmental flows for habitats Flow management to address temperature Drawdowns to flush sediment or pass fish
Portable Floating Fish Collector, Cougar Reservoir, photo by R. Wallick, USGS
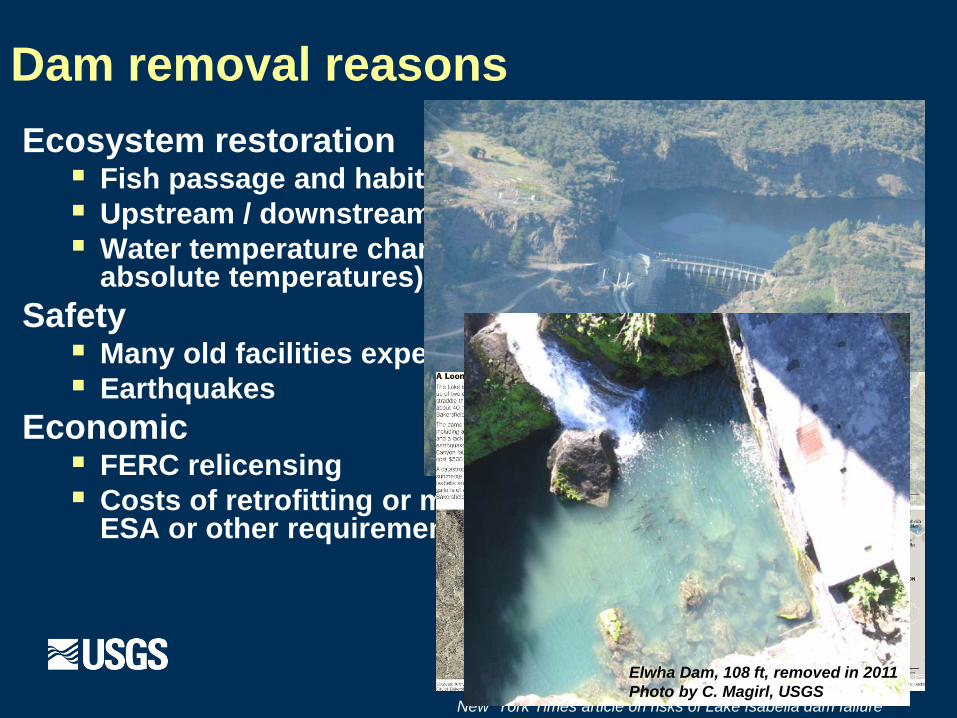
Dam removal reasons Ecosystem restoration Fish passage and habitat Upstream / downstream connectivity Water temperature changes (seasonal timing, &
absolute temperatures) Safety Many old facilities expensive to modernize Earthquakes
Economic FERC relicensing Costs of retrofitting or management changes to meet
ESA or other requirements
New York Times article on risks of Lake Isabella dam failure
Elwha Dam, 108 ft, removed in 2011 Photo by C. Magirl, USGS

Dam removal
in the U.S.
Major et al., Gravel-Bed Rivers v. 8, in press, based on American
Rivers database
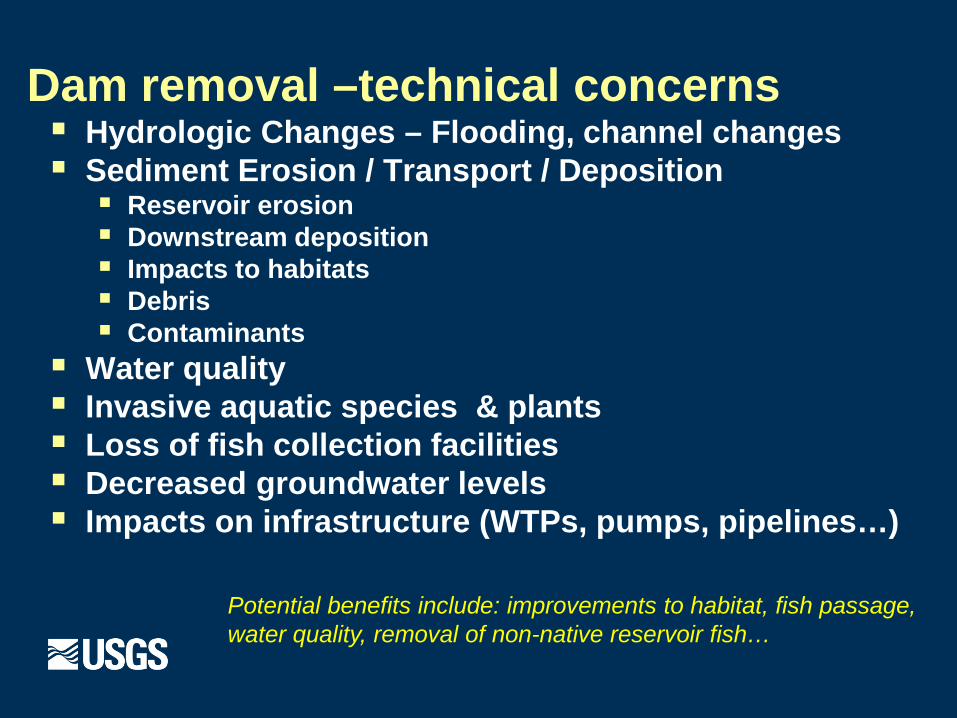
Dam removal –technical concerns Hydrologic Changes – Flooding, channel changes Sediment Erosion / Transport / Deposition Reservoir erosion Downstream deposition Impacts to habitats Debris Contaminants
Water quality Invasive aquatic species & plants Loss of fish collection facilities Decreased groundwater levels Impacts on infrastructure (WTPs, pumps, pipelines…)
Potential benefits include: improvements to habitat, fish passage, water quality, removal of non-native reservoir fish…

Effects of dam removal proportional to dam size and operation
• Dam’s effects on flow and sediment transport (dam presence and operations both matter)
• Dam height, and pace of removal • Reservoir sediment volume, composition
Glines Canyon Dam, Elwha River, WA Homestead Dam, Ashuelot River, NH (Gartner et al., 2015)
4 m high dam
64 m high dam
USGS photographs

Overarching conceptual model
Foley and others, 2017
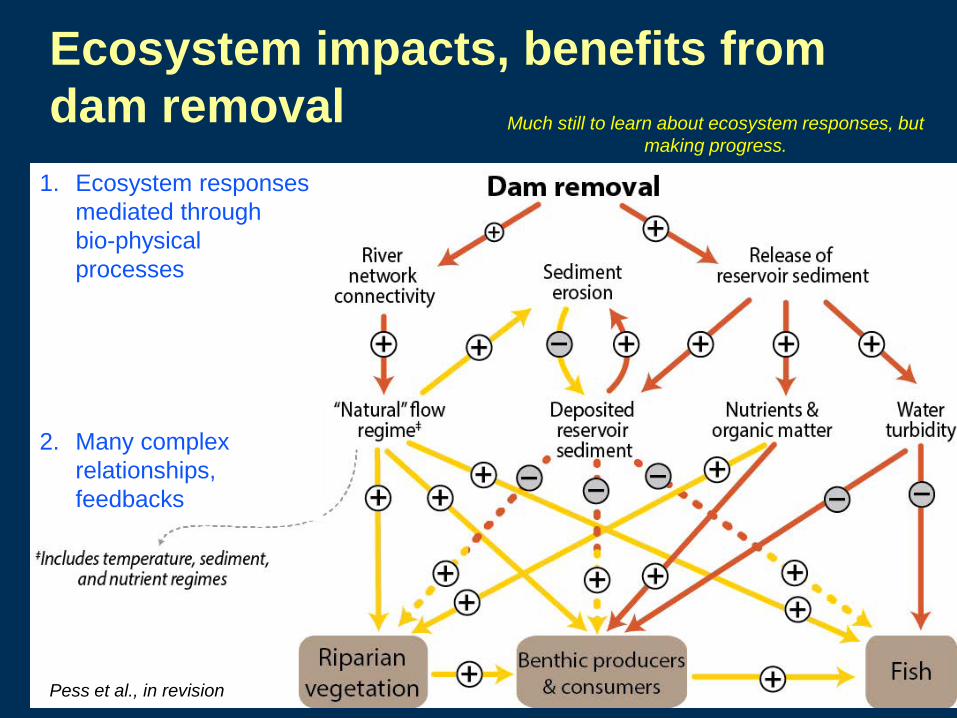
Ecosystem impacts, benefits from dam removal
Pess et al., in revision
Much still to learn about ecosystem responses, but making progress.
1. Ecosystem responses mediated through bio-physical processes
2. Many complex relationships, feedbacks

Coupled upstream-downstream system
Pess et al., in revision
Ecological responses
Pess et al, in revision.

Case study: Marmot Dam, Sandy River
Lessons learned (Foley and others, 2017) • Physical responses typically fast • Ecological responses differ longitudinally • Connectivity quickly restored • Geomorphic context matters • Quantitative models useful for predicting effects • Fish respond rapidly
February 26, 2008
Photos by J. Major, USGS

U.S. Department of the Interior U.S. Geological Survey
Using science and engineering to inform dam operations
Examples from Willamette and Columbia
(photos from Corps of Engineers and PGE)
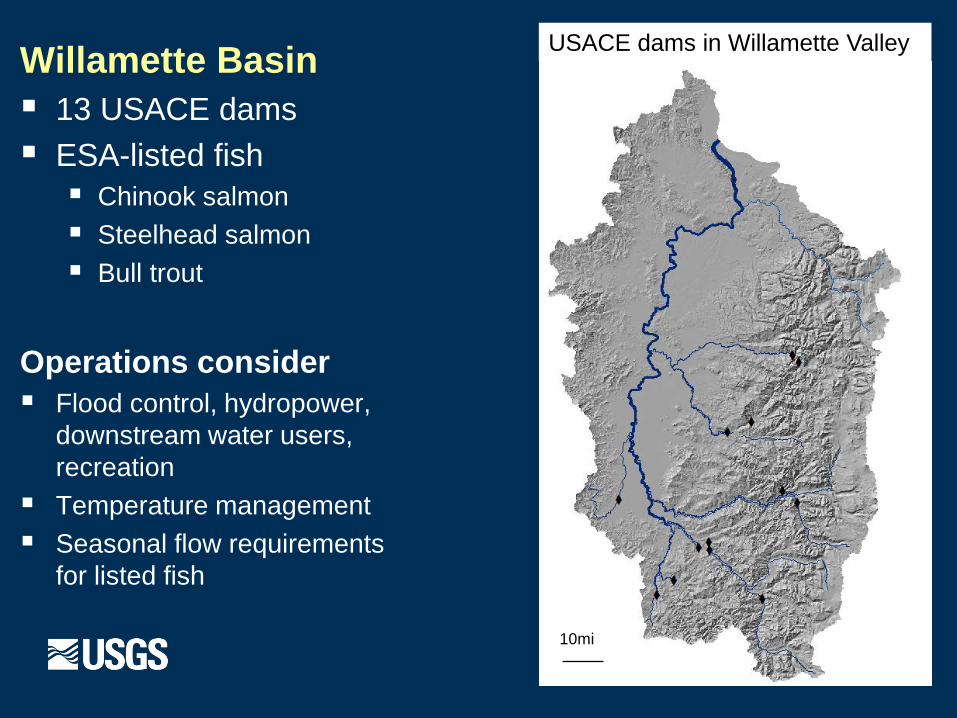
Willamette Basin 13 USACE dams ESA-listed fish Chinook salmon Steelhead salmon Bull trout
Operations consider Flood control, hydropower,
downstream water users, recreation
Temperature management Seasonal flow requirements
for listed fish
USACE dams in Willamette Valley
10mi

Total Dissolved Gas Critical regulatory metric for dam operations Goal: Minimize gas bubble trauma for outmigrating juvenile
salmonids Real time decisions regarding spill and power generation Infrastructure improvements
Lower Granite Dam, Snake River. Photo credit: E. Glisch, USACE

Total Dissolved Gas Monitoring
http://www.nwd.usace.army.mil/Missions/Water/Columbia/Water-Quality/
U.S. Department of the Interior U.S. Geological Survey
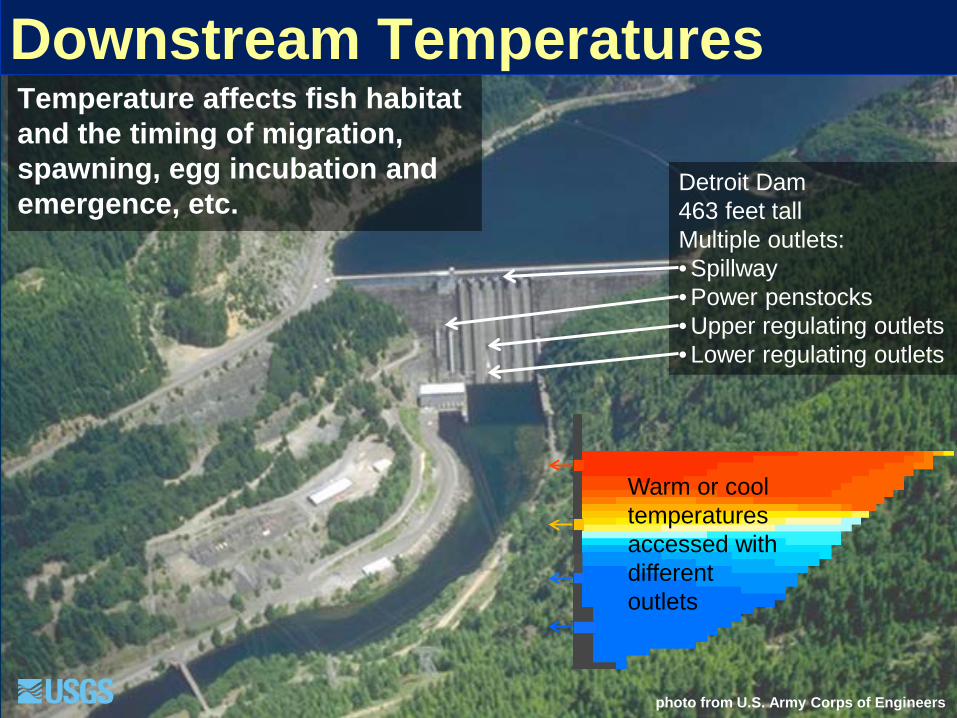
Detroit Dam 463 feet tall Multiple outlets: • Spillway • Power penstocks • Upper regulating outlets • Lower regulating outlets
Downstream Temperatures Temperature affects fish habitat and the timing of migration, spawning, egg incubation and emergence, etc.
Warm or cool temperatures accessed with different outlets
photo from U.S. Army Corps of Engineers

U.S. Department of the Interior U.S. Geological Survey
Willamette River Models
• Calibrated for 2001 and 2002 for temperature TMDL.
• Used to assess effects of upstream dams.
• Used to evaluate 2011 (cool/wet) and 2015 (hot/dry) conditions and aid in evaluations of flow management
• Used to help quantify a Thermal Mosaic of the river.
CE-QUAL-W2 444 river
miles
map from USGS

Flow Comparison, With and Without Dams
Apr May Jun Jul Aug Sep Oct 2002
1,000
10,000
100,000
Stre
amflo
w (f
t3 /s)
With Dams No Dams
Simulated Flow, Willamette River at Salem
40,000
20,000
4,000
2,000
23
See http://pubs.usgs.gov/sir/2010/5153/
Lower flows in winter and spring
Higher flows in late summer and early fall

0
2
4
6
8
10
12
14
16
18
20
Wat
er T
empe
ratu
re (°
C)
2002 J F M A M J J A S O N D J F M A M J J A S O N D
2001
Measured, with dams
North Santiam River at Big Cliff Dam
Estimated, without dams
Temperature Comparison, With and Without Dams
See http://pubs.usgs.gov/sir/2010/5153/
Warmer in
autumn Cooler in summer
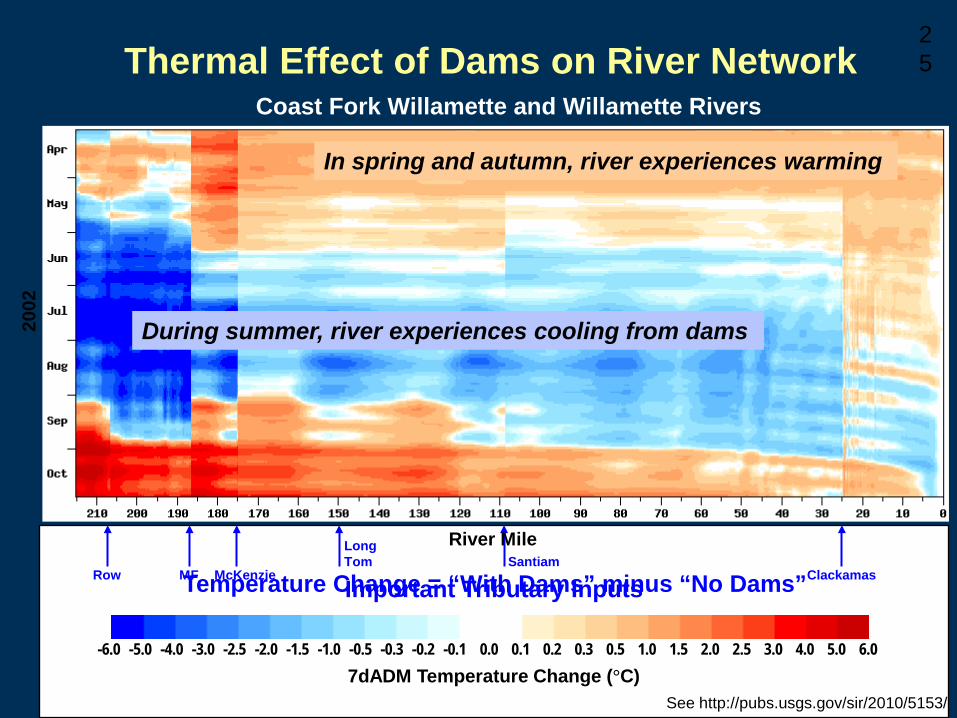
Thermal Effect of Dams on River Network Coast Fork Willamette and Willamette Rivers
2002
Important Tributary Inputs
River Mile
Temperature Change = “With Dams” minus “No Dams” McKenzie Santiam
MF Row
Long Tom
Clackamas
-6.0 -5.0 -4.0 -3.0 -2.5 -2.0 -1.5 -0.3 -1.0 -0.5 -0.1 0.0 -0.2 6.0 5.0 4.0 3.0 2.5 2.0 1.5 0.3 1.0 0.5 0.1 0.2 7dADM Temperature Change (°C)
25
See http://pubs.usgs.gov/sir/2010/5153/
During summer, river experiences cooling from dams
In spring and autumn, river experiences warming

Downstream Thermal Effect of Dams on Fish Fish Use Periods
2002
-6.0 -5.0 -4.0 -3.0 -2.5 -2.0 -1.5 -0.3 -1.0 -0.5 -0.1 0.0 -0.2 6.0 5.0 4.0 3.0 2.5 2.0 1.5 0.3 1.0 0.5 0.1 0.2 7dADM Temperature Change (°C)
Return
Holding
Spawning
Incubation
26

McK
enzi
e
Sant
iam
Tual
atin
Cal
apoo
ia
27 20
11
Modeled 7-day Average of Daily Max Temperatures
Preliminary results; subject to revision
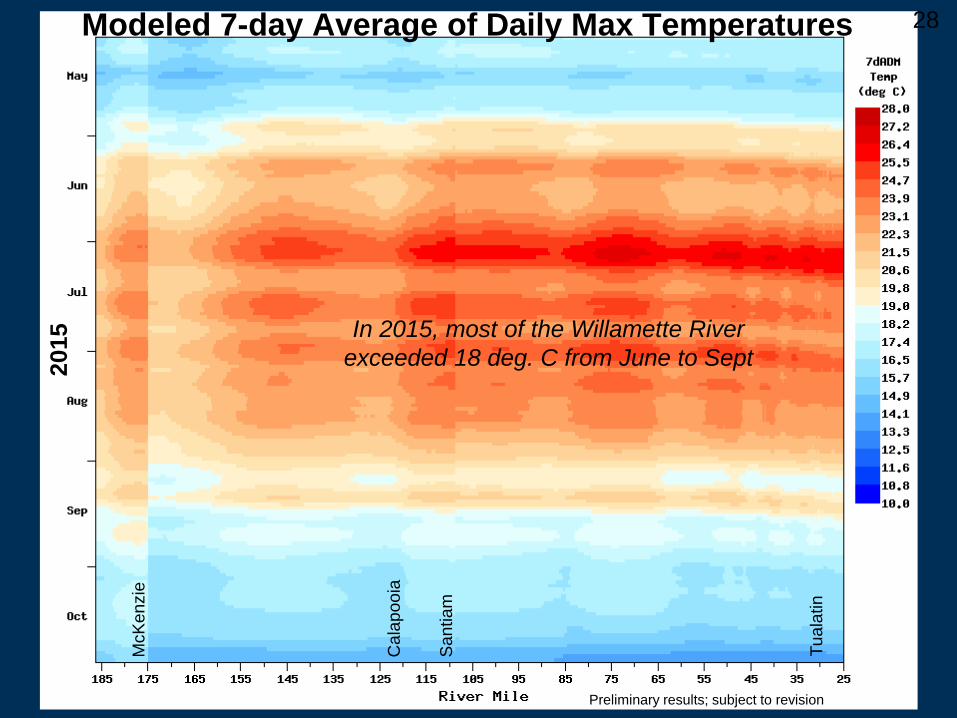
McK
enzi
e
Sant
iam
Tual
atin
Cal
apoo
ia
28 20
15
Modeled 7-day Average of Daily Max Temperatures
Preliminary results; subject to revision
In 2015, most of the Willamette River exceeded 18 deg. C from June to Sept
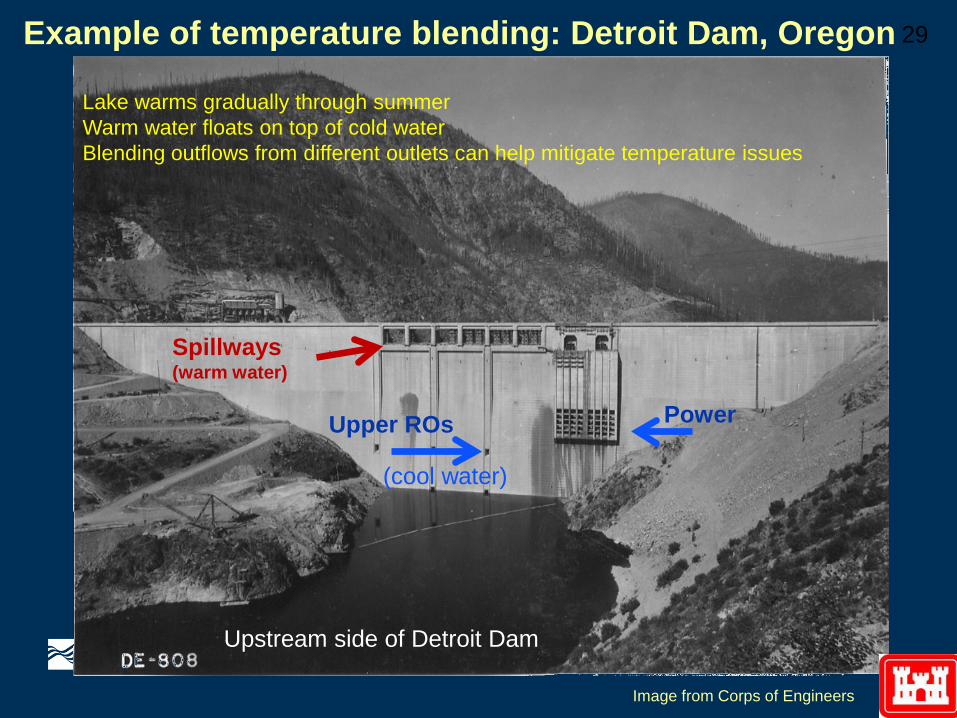
Example of temperature blending: Detroit Dam, Oregon
Spillways (warm water)
Upper ROs Power
29
Image from Corps of Engineers
Upstream side of Detroit Dam
Lake warms gradually through summer Warm water floats on top of cold water Blending outflows from different outlets can help mitigate temperature issues
(cool water)

Detroit Lake water levels for different scenarios
rule curve
30
See http://dx.doi.org/10.3133/ofr20151012
Month
In all years, lake level above spillway, but duration varies • In dry year, water level drops below spillway August 1 • In cool/wet years and normal year, below spillway early September

Detroit Modeled Temperatures, Without Blending
In all year types, temperature exceeds target during salmon spawning/incubation period
~ 6 °C
temperature target
rule curve
31
See http://dx.doi.org/10.3133/ofr20151012
Brown lines are desirable temperature ranges
When releasing cool water from power penstock, temperatures are below target most of summer. Water remaining in the fall is warm, resulting in releases that exceed targets for spawning and incubation.

power, U.RO blending
cold water exhausted;
lake well- mixed
Blending Releases from Multiple Outlets to Manage Temperature
32
See http://dx.doi.org/10.3133/ofr20151012
Assumes at least 40% of released water from power penstock
Power + spillway blending begins when lake above spillway
Even in hot, dry year, exceed target by ~4°C (compared with 6-7°C with no blending)
loss of spillway, power only temperature drops
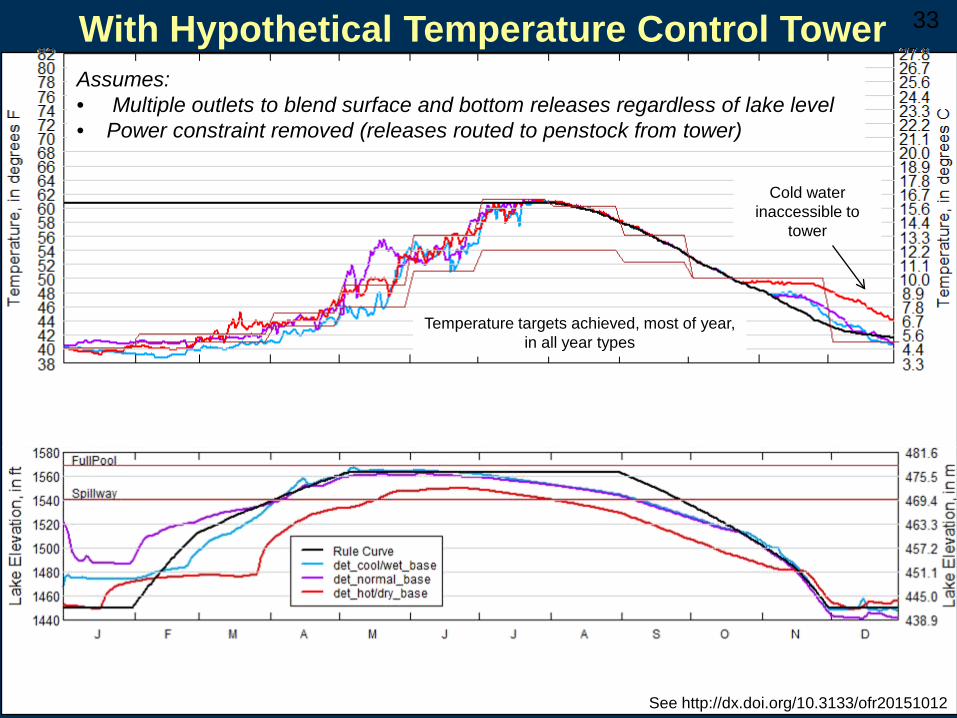
With Hypothetical Temperature Control Tower 33
See http://dx.doi.org/10.3133/ofr20151012
Assumes: • Multiple outlets to blend surface and bottom releases regardless of lake level • Power constraint removed (releases routed to penstock from tower)
Temperature targets achieved, most of year, in all year types
Cold water inaccessible to
tower

Summary of Temperature Management • Temperature is a major influence on fish • Monitoring needed for understanding effect of flow, operation,
and other factors • Modification of seasonal temperatures impacts multiple life
stages of anadromous fish • Mitigation
• With blending from multiple existing outlets • With temperature towers • Accompanied with reduced power generation
• Models can inform real-time operations and design of new structures.

Reservoir Operations for Fish Passage: Fall Creek Lake Drawdowns
Fall Creek Lake, photo courtesy USACE
Photo courtesy USGS Western Fisheries Research Center,
Columbia River Research Laboratory
Fall Creek Lake during 2016 drawdown, photo by M. Keith (USGS)

Fall Creek Lake
Fall Creek Lake during 2016 drawdown, photo by M. Keith (USGS)

Typical operations Limited downstream fish passage
During drawdown, lake temporarily lowered to streambed Fish exit through regulating outlet at base of dam
Reservoir sediment also transported through reservoir and into downstream reach
Illustrations by M. Keith, USGS
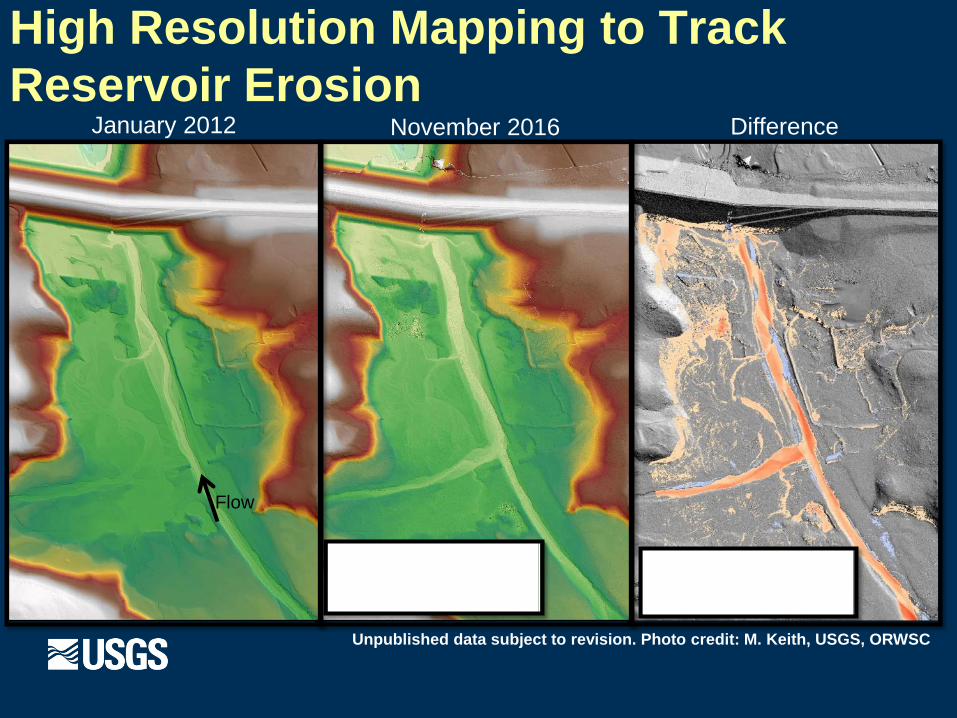
High Resolution Mapping to Track Reservoir Erosion
January 2012 November 2016
Difference
Flow
Unpublished data subject to revision. Photo credit: M. Keith, USGS, ORWSC

Downstream sediment deposition from drawdown of Fall Creek Lake
Photo credit: M. Keith, USGS
Study in progress: modeling and analyses to identify flow management strategies with potential to reduce sediment impacts
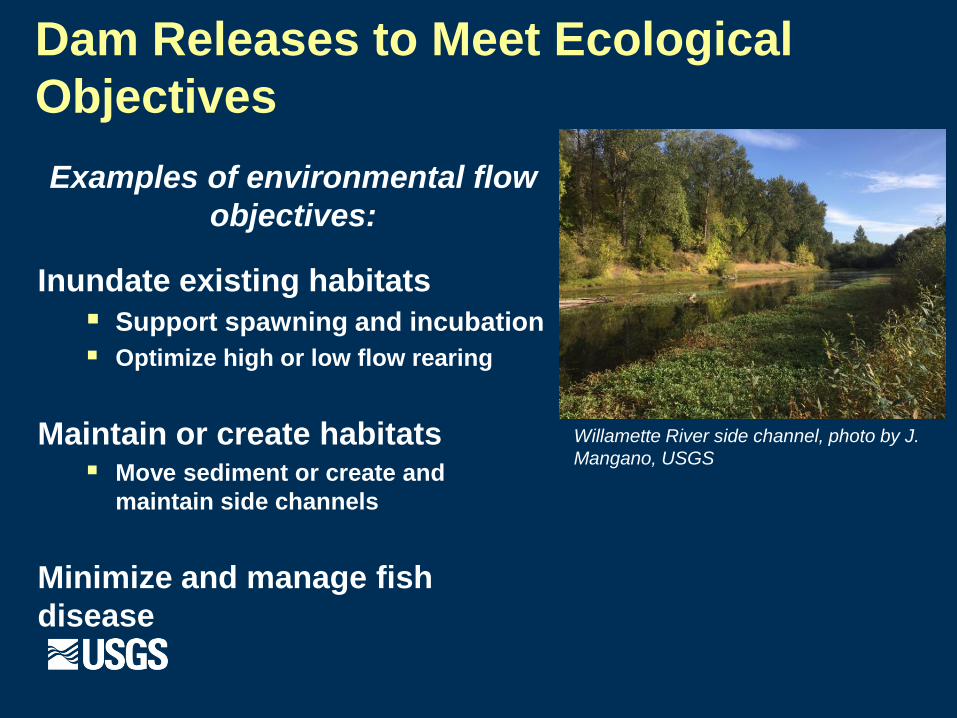
Dam Releases to Meet Ecological Objectives Examples of environmental flow
objectives:
Inundate existing habitats Support spawning and incubation Optimize high or low flow rearing
Maintain or create habitats Move sediment or create and
maintain side channels
Minimize and manage fish disease
Willamette River side channel, photo by J. Mangano, USGS

N. Santiam
S. Santiam
McKenzie
MFK Willamette
Willamette
Alluvial reaches
Large dams
map by USGS
Low flows: Shallow bars
Flows to support Spring Chinook rearing habitat
Moderate flows: Vegetated bars
CFK Willamette
Photo courtesy Freshwaters Illustrated
High flows: Side channels and floodplains
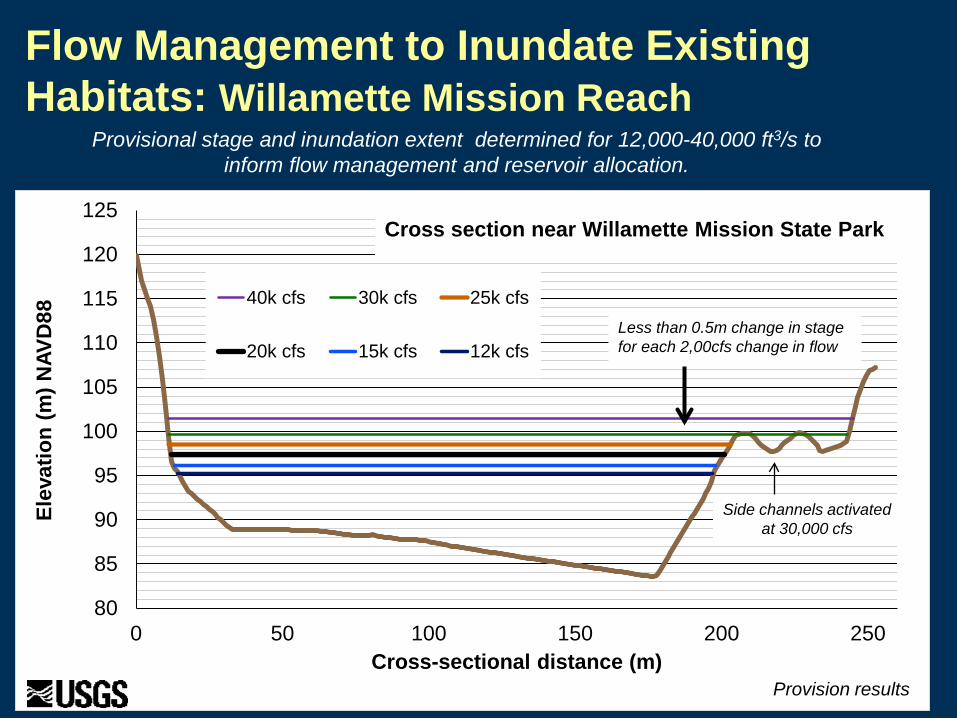
Flow Management to Inundate Existing Habitats: Willamette Mission Reach
Provisional stage and inundation extent determined for 12,000-40,000 ft3/s to inform flow management and reservoir allocation.
80
85
90
95
100
105
110
115
120
125
0 50 100 150 200 250
Elev
atio
n (m
) NAV
D88
Cross-sectional distance (m)
40k cfs 30k cfs 25k cfs
20k cfs 15k cfs 12k cfs
Cross section near Willamette Mission State Park
Side channels activated at 30,000 cfs
Provision results
Less than 0.5m change in stage for each 2,00cfs change in flow
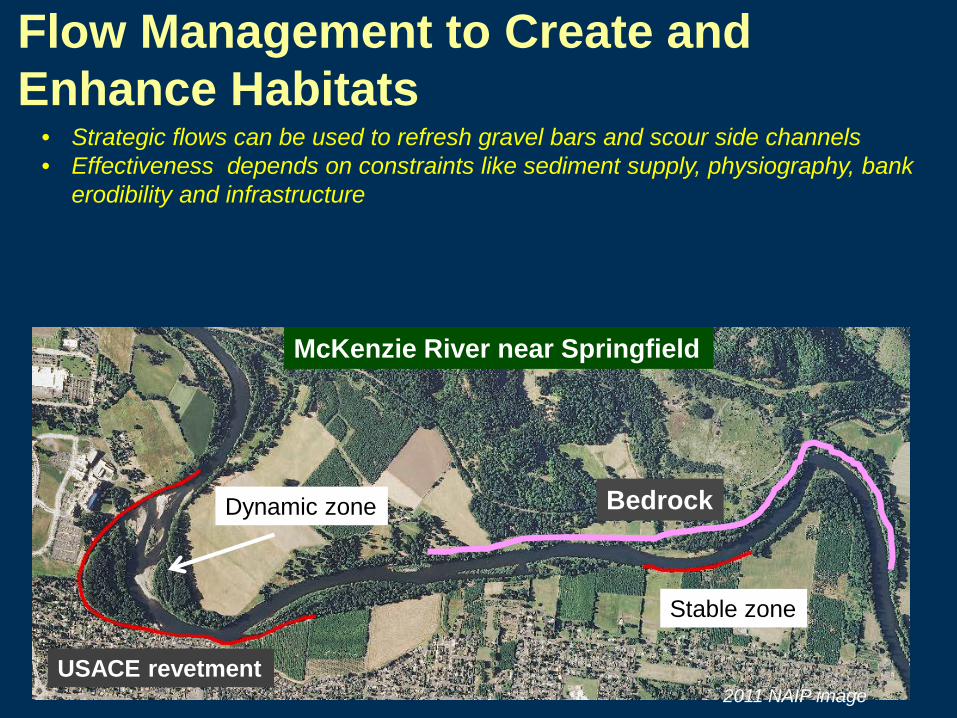
Flow Management to Create and Enhance Habitats
• Strategic flows can be used to refresh gravel bars and scour side channels • Effectiveness depends on constraints like sediment supply, physiography, bank
erodibility and infrastructure
McKenzie River near Springfield
USACE revetment
Bedrock Dynamic zone
Stable zone
2011 NAIP image
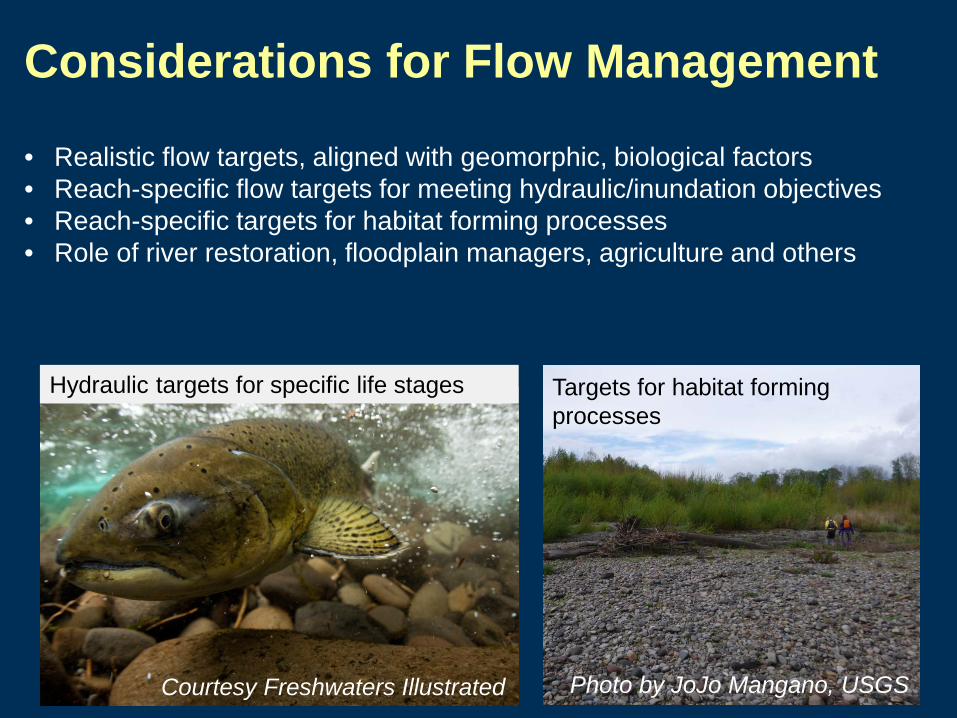
Considerations for Flow Management
Courtesy Freshwaters Illustrated
Targets for habitat forming processes
Hydraulic targets for specific life stages
• Realistic flow targets, aligned with geomorphic, biological factors • Reach-specific flow targets for meeting hydraulic/inundation objectives • Reach-specific targets for habitat forming processes • Role of river restoration, floodplain managers, agriculture and others
Photo by JoJo Mangano, USGS

Questions for Future Research How can we optimize upgrades to benefit multiple purposes? How can we maximize benefits of dams, minimize ecological impacts and do this cost-effectively? How can we better anticipate societal values and needs 50 + years in future? What can we learn now to better plan for future? How can science community better support engineering community?
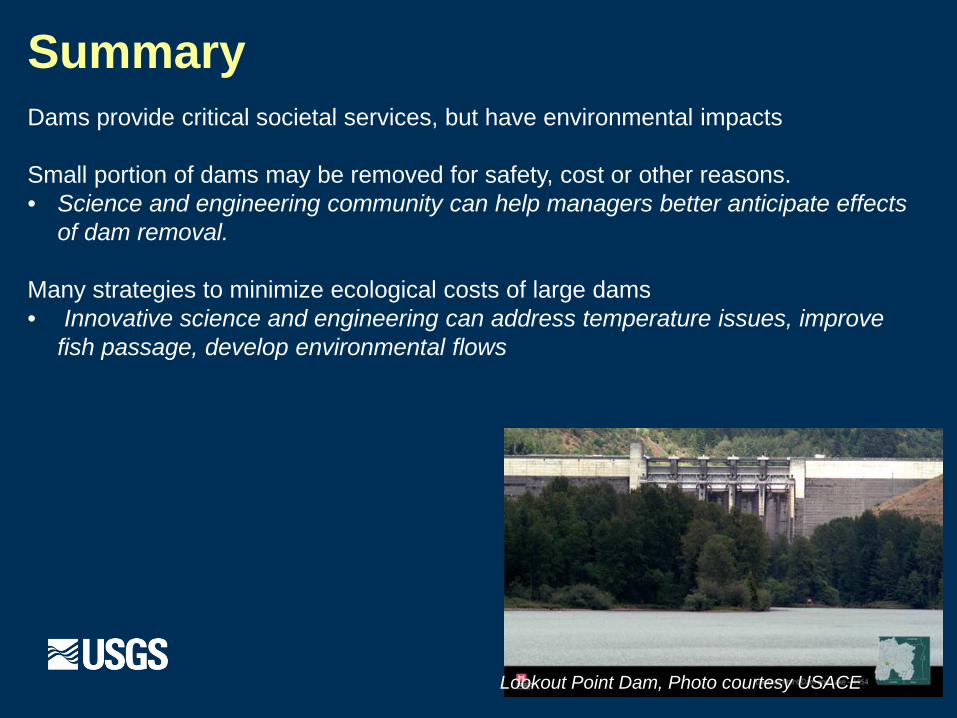
Summary Dams provide critical societal services, but have environmental impacts Small portion of dams may be removed for safety, cost or other reasons. • Science and engineering community can help managers better anticipate effects
of dam removal. Many strategies to minimize ecological costs of large dams • Innovative science and engineering can address temperature issues, improve
fish passage, develop environmental flows
Lookout Point Dam, Photo courtesy USACE
References Rose Wallick, [email protected], 503-251-3219
• Bartholow, J.M., 2000, The stream segment and stream network temperature models— A self-study course: U.S. Geological Survey Open-File Report 99-112, 276 p. (Available at https://pubs.er.usgs.gov/publication/ofr99112.)
• Rounds, S.A., 2010, Thermal effects of dams in the Willamette River basin, Oregon: U.S. Geological Survey Scientific Investigations Report 2010-5153, 64 p. (Available at http://pubs.usgs.gov/sir/2010/5153/.)
• Schenk, L.N., and Bragg, H.M., 2014, Assessment of suspended-sediment transport, bedload, and dissolved oxygen during a short-term drawdown of Fall Creek Lake, Oregon, winter 2012–13: U.S. Geological Survey Open-File Report 2014–1114, 80 p., http://dx.doi.org/10.3133/ofr20141114.
• Geomorphic and Vegetation Processes of the Willamette River Floodplain, Current Understanding and Unanswered Questions: http://pubs.usgs.gov/of/2013/1246/
• USGS Environmental Flow Reports for Sustainable Rivers Program • McKenzie Basin: http://or.water.usgs.gov/proj/McKenzie_flows/ • Santiam Basin: http://pubs.usgs.gov/of/2012/1133
• Major, J.J., O’Connor, J.E., Podolak, C.J., Keith, M.K., Grant, G.E., Spicer, K.R., Pittman, S., Bragg, H.M., Wallick, J.R., Tanner, D.Q., Rhode, A., and Wilcock, P.R., 2012, Geomorphic response of the Sandy River, Oregon, to removal of Marmot Dam: U.S. Geological Survey Professional Paper 1792, 64 p. and data tables. (Available at https://pubs.usgs.gov/pp/1792/.)
• Duda, J.J., Warrick, J.A., and Magirl, C.S., 2011, Elwha River dam removal--Rebirth of a river: U.S. Geological Survey Fact Sheet 2011-3097, 4 p.

Extra slides
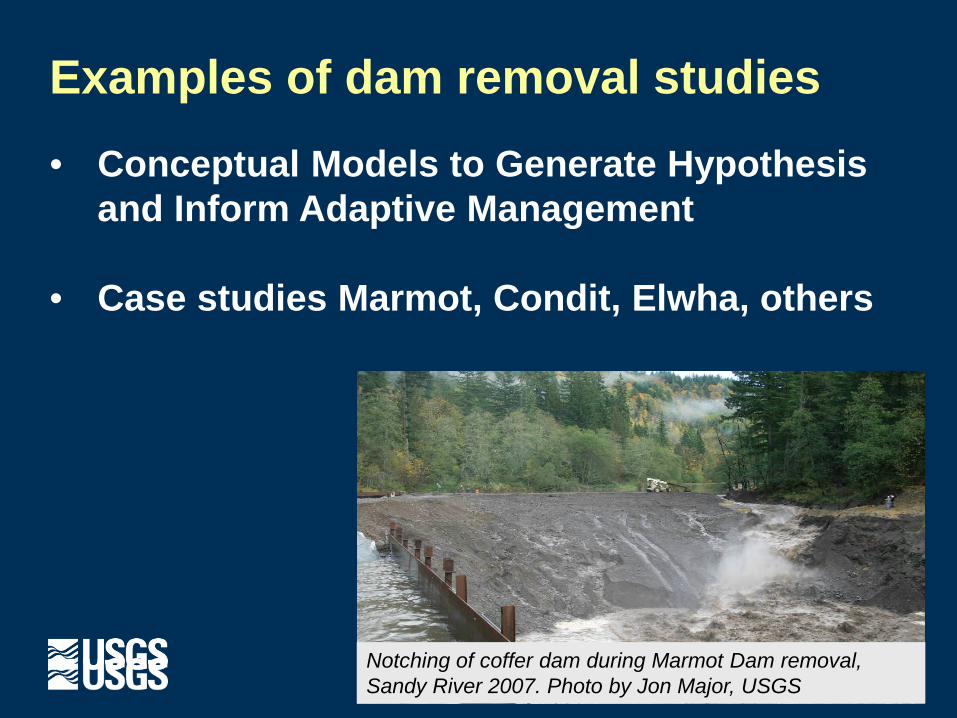
Examples of dam removal studies • Conceptual Models to Generate Hypothesis
and Inform Adaptive Management
• Case studies Marmot, Condit, Elwha, others
Notching of coffer dam during Marmot Dam removal, Sandy River 2007. Photo by Jon Major, USGS

Factors affecting in-reservoir and release temperatures
The CE-QUAL-W2 model can simulate all of these factors
• Residence time • Depth, volume, surface area • Climate and meteorology
• Stratification (depth/timing) • Outlet depth • Operations
Elev
atio
n [m
]
Tem
pera
ture
[°C
]
Spillway (470 m)
Power (425 m)
Upper RO (407 m)
Lower RO (384 m)

Existing condition Without dams
Jan
1
Feb
1
Mar
1
Apr 1
May
1
Jun
1
Jul 1
Aug
1
Sep
1
Oct
1
Nov
1
Dec
1
Flow comparison: Klamath River
Minimized Adult Disease Risk (12-13 °C)
Optimal Adult Migration (15-19 °C) Optimal Juvenile Growth
(13-20 °C)
Source: PacifiCorp 2005; Klamath SD EIS, 2012