
dam_project.pptx
21
Dam and Reservoir Influences on the Dynamics of the Boise River Basin Evan Norman, Sara Kaster, Wyatt Medley Boise State University Geos 498
-
Upload
evan-norman -
Category
Documents
-
view
16 -
download
0
Transcript of dam_project.pptx
Dam and Reservoir Influences on the Dynamics of the
Boise River BasinEvan Norman, Sara Kaster, Wyatt Medley
Boise State UniversityGeos 498
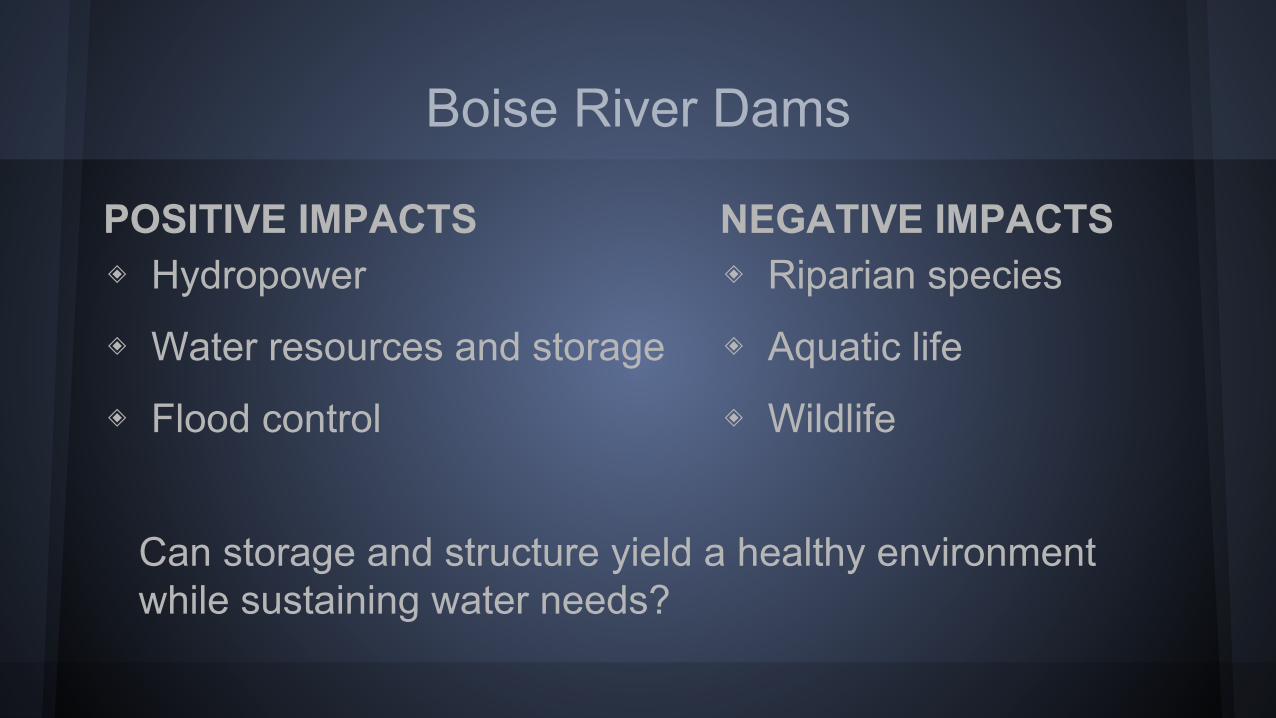
Boise River Dams
NEGATIVE IMPACTS◈ Riparian species
◈ Aquatic life
◈ Wildlife
POSITIVE IMPACTS◈ Hydropower
◈ Water resources and storage
◈ Flood control
Can storage and structure yield a healthy environment while sustaining water needs?

Upper Dams
Anderson Ranch Photo by Wyatt Medley
Arrowrock Lucky Peak Diversion http://aptaperture.com/2010/10/14/wyoming-utah-and-idaho/Photo by Evan Norman Photo by Evan Norman

PourpointLocation
Watershed Area (km2)
Diversion 22.55
Lucky Peak 1213.55
Arrowrock 3212.64
Anderson Ranch 2527.03

StorageGraf, W. (1999) - reservoir storage provides a relative measure of changes in flow regimes and downstream effects.- ratio of storage capacity to annual runoff in a watershed highlight areas with greatest change in discharge (GP, RM, SW).
Eastern U.S. Western U.S.
Total Capacity (af) 162,327,587 217,694,485
Average Capacity (af) 2,135,889 4,535,302Dept. of the Interior,Bureau of Reclamation
Local Reservoir Capacities (acre-feet)◈ Anderson Ranch = 413,100◈ Arrowrock = 272,000◈ Lucky Peak = 264,400
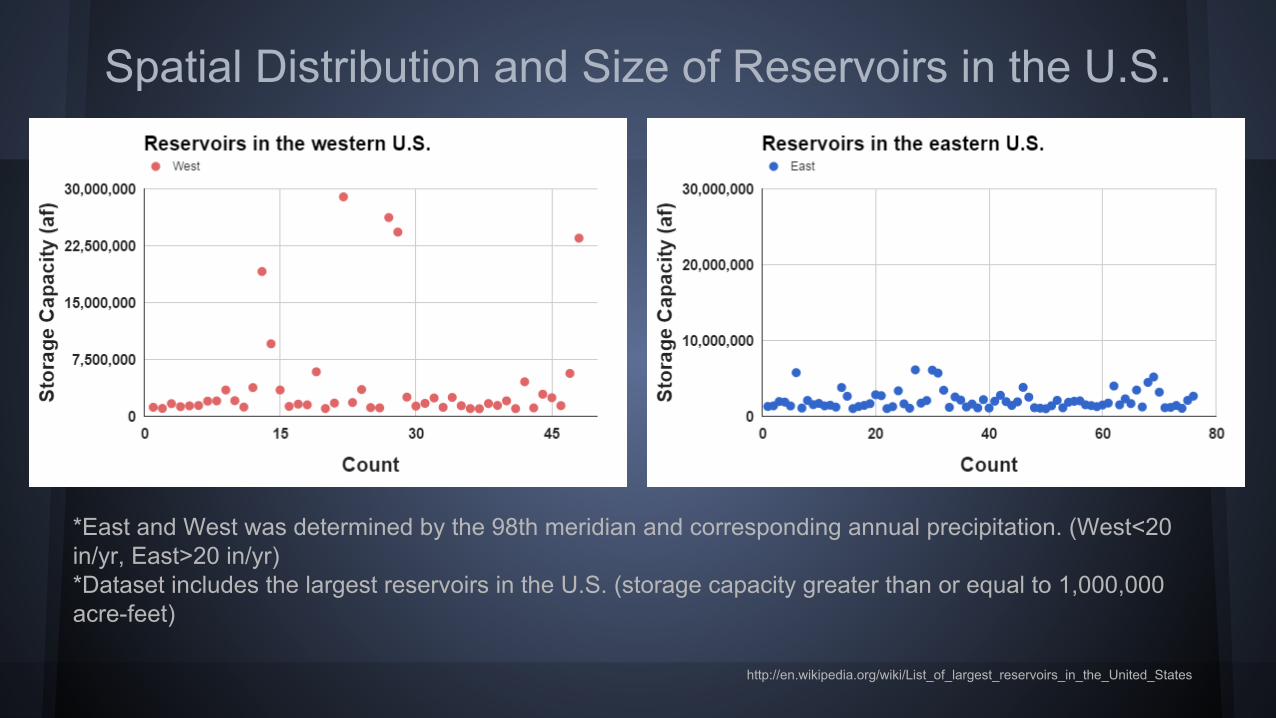
Spatial Distribution and Size of Reservoirs in the U.S.
*East and West was determined by the 98th meridian and corresponding annual precipitation. (West<20 in/yr, East>20 in/yr)*Dataset includes the largest reservoirs in the U.S. (storage capacity greater than or equal to 1,000,000 acre-feet)
http://en.wikipedia.org/wiki/List_of_largest_reservoirs_in_the_United_States

Storage Key Points◈ The ratio of storage capacity to annual runoff and reservoir size are the
most significant contributors to downstream impacts (Graf, 1999).◈ Climate impact on storage - determines the capacity of reservoirs.
Impacts◈ Sedimentation◈ Agriculture◈ Riparian Species◈ Water Quality

(Syvitski, Vorosmarty, Kettner, & Green, 2005).
Sediment Flux
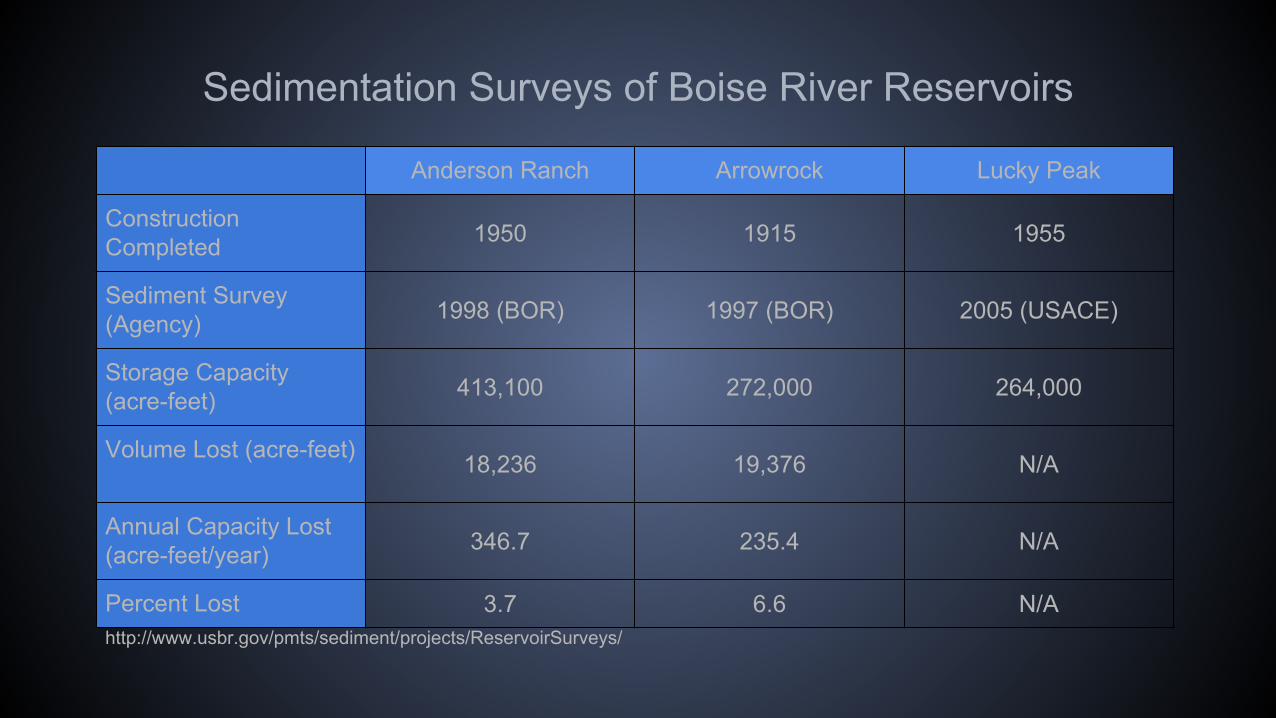
Sedimentation Surveys of Boise River Reservoirs
Anderson Ranch Arrowrock Lucky Peak
Construction Completed 1950 1915 1955
Sediment Survey (Agency) 1998 (BOR) 1997 (BOR) 2005 (USACE)
Storage Capacity (acre-feet) 413,100 272,000 264,000
Volume Lost (acre-feet) 18,236 19,376 N/A
Annual Capacity Lost (acre-feet/year) 346.7 235.4 N/A
Percent Lost 3.7 6.6 N/Ahttp://www.usbr.gov/pmts/sediment/projects/ReservoirSurveys/

Local Water Availability ◈ Demand- use, consumption, need, economics (Merrett, 2009)
◈ Annual SRP water diversions change from demand to supply driven (Hoekema and Sridhar., 2011)
◈ Seasonal melting (Marks et al., 2010)
◈ 2080 peak streamflow will change from April to late February (Vano et al., 2010)

Changes in Minimum and Maximum Temperatures at Low to High Elevations in the RCEW
(Nayak et al. 2010)
Watershed elevation range of the upper Boise dams: 847-3197 m
High Elevation Site2093m
Mid elevation Site:1652 m
Low Elevation Site:1200m
Year (1962- 2007)
Tmin
(C)
Tmax (C
)Tm
in (C
)Tm
in (C
)Tm
ax (C)
Tmax (C
)

Agriculture◈ Storage depicts farming practices (Hoekema and Sridhar., 2011)
◈ New York Canal irrigation recharge (Hoekema, 2011)
◈ Upstream users vs. downstream users (Hoekema, 2011)
◈ Chances junior water rights holders will have unavailable water increases from 27% in 2020 to 33% in 2040 and 68% in 2080 (Vano et al., 2010)

Boise River Seasonal Water Diversions
(Hansen et al. 2014)

Flows Impact on Water QualityLiu et al (2014)
◈ Speed & Volume
◈ Temperature
◈ Sediment transport
◈ Nutrient loadings
http://www.destination360.com/north-america/us/idaho/snake-river-canyon

Water Quality in Streams
http://www.vtwaterquality.org/wqd_mgtplan/swms_appC.htm

Riparian Species and Aquatic Life
◈ 19 species of concern
(Chinook, Steelhead, Sockeye)
◈ Levels of dissolved oxygen
◈ Temperature changes
http://www.oceanlight.com/log/adams-river-sockeye-salmon-swimming-upstream.html
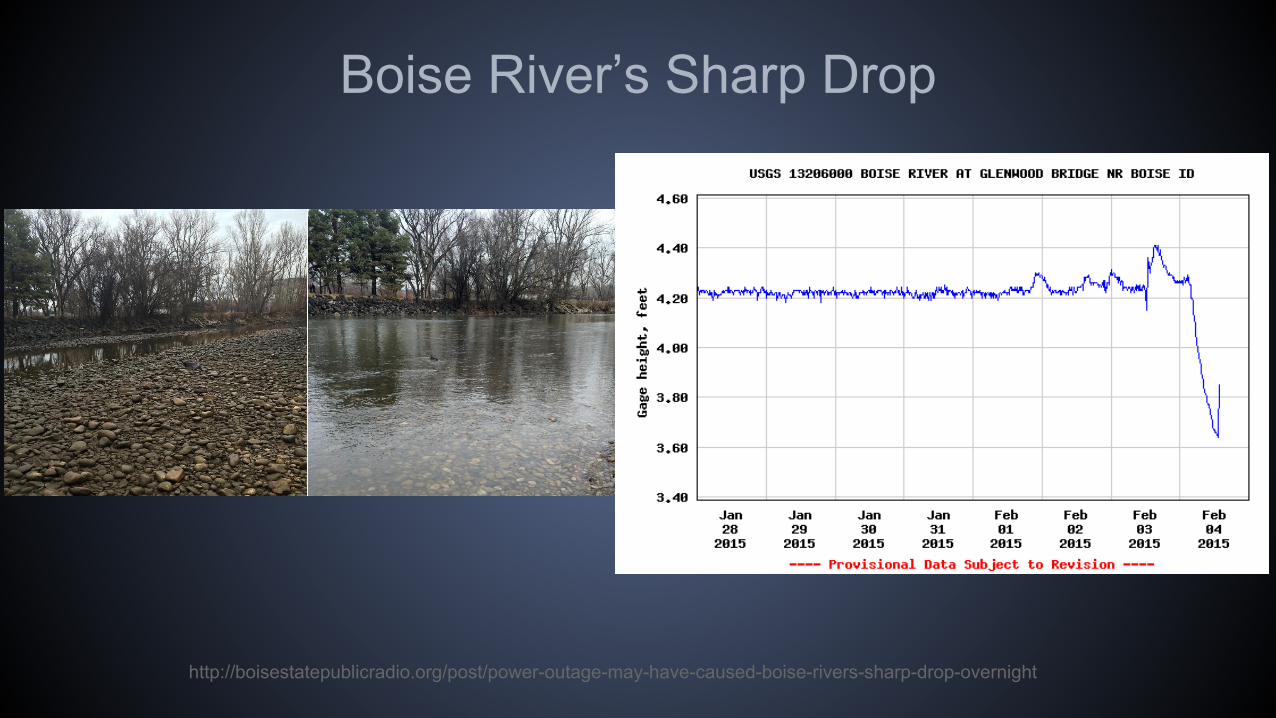
Boise River’s Sharp Drop
http://boisestatepublicradio.org/post/power-outage-may-have-caused-boise-rivers-sharp-drop-overnight
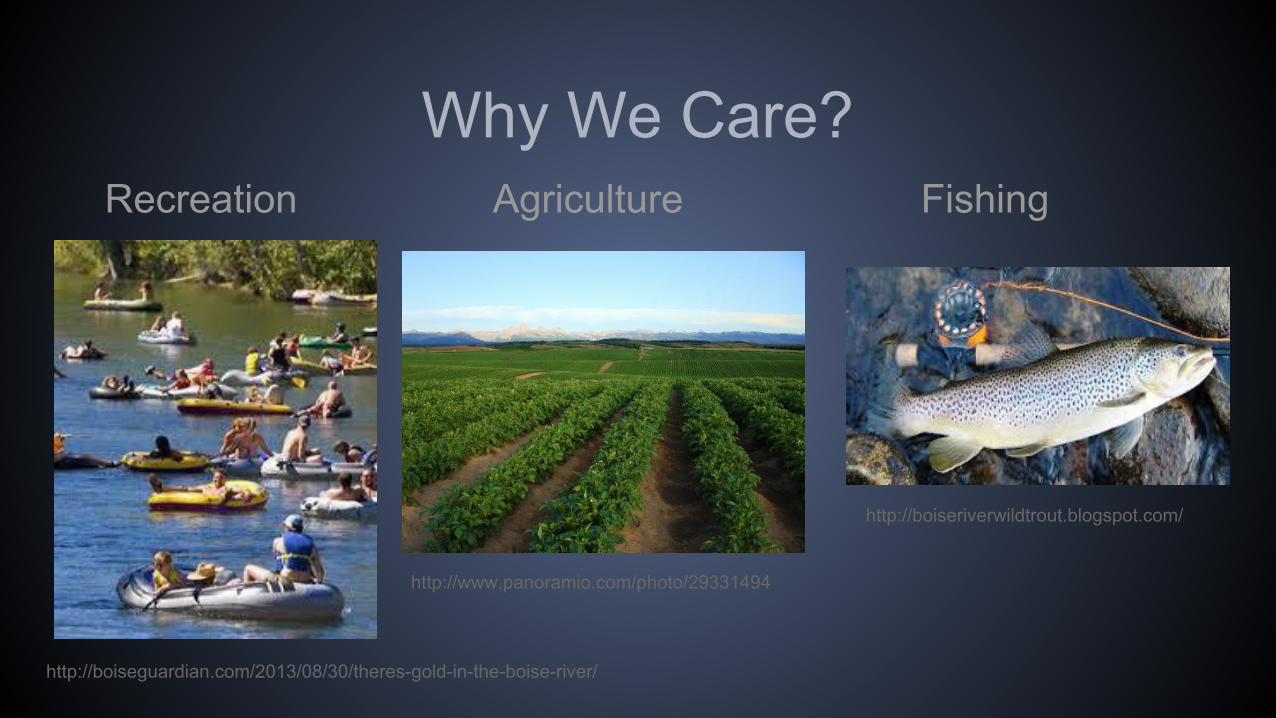
Why We Care?
http://boiseriverwildtrout.blogspot.com/
http://boiseguardian.com/2013/08/30/theres-gold-in-the-boise-river/
Recreation FishingAgriculture
http://www.panoramio.com/photo/29331494

Positive Impacts Negative ImpactsStorage Storage
Flood control Channel morphology
Agriculture Fish and riparian species
Recreation Water quality
Hydropower Sediment transport
Electricity revenue Maintenance costs
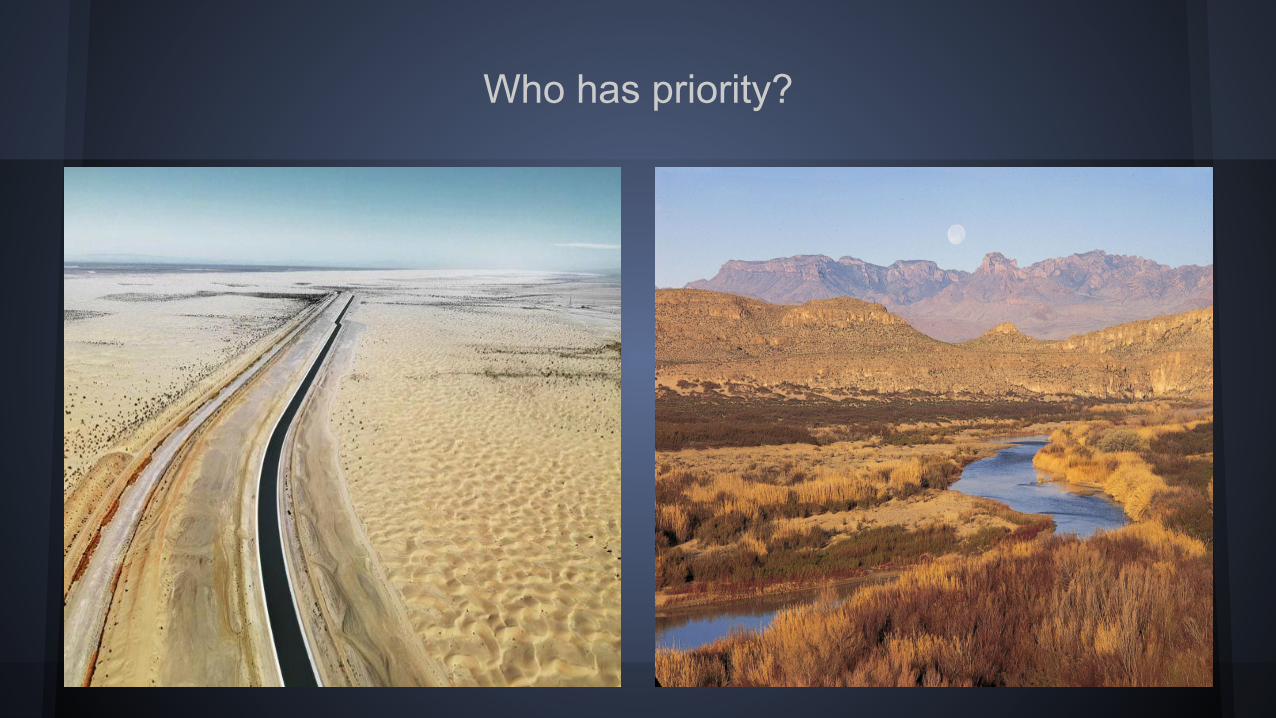
Who has priority?

ReferencesWebsites: Idaho Rivers United
Gordon, E., Meentemeyer K. (2006) Effects of dam operation and land use on stream morphology and riparian vegetation. Geomorphology v 82, p. 412-429
Graf, W. (1999) Dam nation: A geographic census of American dams and their large-scale hydrologic impacts. Water Resources Research v. 35 p. 1305-1311
Hansen, Z., Lowe, S., Xu, W. (2014) Long-term impacts of major water storage facilities on agriculture and the natural environment: Evidence from Idaho (U.s) Ecological Economics v.100, p. 106-118
Hoekema, D., Sridhar, V., (2011) Relating climatic attributes and water resources allocation: A study using surface water supply and soil moisture indices in the Snake River basin, Idaho. Water Resources Research v. 47 DOI: 10.1029/2010WR0096970
Liu, Y., Yang W., Yu Z., Lung, I., Yarotski, J., Elliott, J., and Tiessen, K. (2014) Assessing the Effects of Small Dams on Stream Flow and Water Quality in Agricultural Watershed. Journal of Hydrologic Engineering v 19, p. 1237-1240
Merrett,S. (2004) The Demand for Water: Four Interpretations, Water International, v. 29:1, p. 27-29, DOI: 10.1080/02508060408691745
Nayak A, Marks D, Chandler DG, Seyfried M. (2010) Long-term snow, climate, and streamflow trends at the Reynolds Creek Experimental Watershed, Owyhee Mountains, Idaho, United States. Water Resources Research v. 46: W06519. DOI: 10.1029/2008WR007525
Syvitski, J., Vorosmarty, C., Kettner, A., Green, P. (2005) Impact of humans on the flux of terrestrial sediment to the global coastal ocean. Science. v. 308, p. 376-380
Vano, J., Scott, M., Voisin, N., Stockle, C., Hamlet, A., Mickelson, K., Elsner, M., & Lettenmaier, D. (2010) Climate change impacts on water management and irrigated agriculture in the Yakima River Basin, Washington, USA. Climatic Change. v. 102, p 287 – 317.


