DAM DEVELOPMENT OPTIONS & ECONOMIC … Final Reports/Dam...Pre-feasibility Study into Measures to...
128
DWA Namibia Report No.: 400/8/1/P-05 DWAF RSA Report No.: PB D000/00/4403 LOR Consultants.: 97331/3484 FINAL March 2005 DAM DEVELOPMENT OPTIONS & ECONOMIC ANALYSIS - VOLUME 1
Transcript of DAM DEVELOPMENT OPTIONS & ECONOMIC … Final Reports/Dam...Pre-feasibility Study into Measures to...

DWA Namibia Report No.: 400/8/1/P-05 DWAF RSA Report No.: PB D000/00/4403 LOR Consultants.: 97331/3484
FINAL
March 2005
DAM DEVELOPMENT OPTIONS & ECONOMIC ANALYSIS
- VOLUME 1

Pre-feasibility Study into Measures to Improve the Management of the Lower Orange River FINAL
DAM DEVELOPMENT OPTIONS – VOLUME 1 MARCH 2005 i
PROJECT NAME : PRE-FEASIBILITY STUDY INTO MEASURES
TO IMPROVE THE MANAGEMENT OF THE
LOWER ORANGE RIVER AND TO PROVIDE
FOR FUTURE DEVELOPMENTS ALONG THE
BORDER BETWEEN NAMIBIA AND SOUTH
AFRICA
REPORT TITLE : Dam Development Options and Economic
Analysis – Volume 1 & Volume 2 (Appendices)
AUTHORS : R A Alexander
D I van Wyk
REPORT STATUS : Final
DWAF RSA REPORT NO. : PB D000/00/4403
DWA NAMIBIA REPORT NO.: 400/8/1/P-05
LORC REF. NO. : 097331/3484
DATE : March 2005
Submitted on behalf of the Project Team by:
...…………………… ………… …………………………… …………
SC VOGEL (Date) A TANNER (Date)
Task Leader Study Leader
PERMANENT WATER COMMISSION
Directorate of Project Planning
Approved for the Planning Committee of the Permanent Water Commission by:
..………………… .………………... ….………………… …….……………
P Heyns (Date) PH van Niekerk (Date)
Pre-feasibility Study into Measures to Improve the Management of the Lower Orange River FINAL
DAM DEVELOPMENT OPTIONS – VOLUME 1 MARCH 2005 ii
LIST OF REPORTS
TITLE
REPORT NUMBER
DWAF
RSA
DWA
Namibia
LORC
(NS)
Main Report PB D000/00/4703 400/8/1/P-13 3749/97331
Legal, Institutional, Water Sharing, Cost Sharing, Management and Dam Operation PB D000/00/4603 400/8/1/P-10 3692/97331
Specialist Report on the Environmental Flow Requirements - Riverine PB D000/00/4503 400/8/1/P-07 3519/97331
Specialist Report on the Determination of the Preliminary Ecological Reserve
on a Rapid Level for Orange River Estuary
PB D000/00/4503 400/8/1/P-08 3663/97331
Water Requirements PB D000/00/4202 400/8/1/P-02 3486/97331
Hydrology, Water Quality and Systems Analysis (Volume A) PB D000/00/4303 400/8/1/P04 3736/97331
Hydrology, Water Quality and Systems Analysis (Volume B) PB D000/00/4303 400/8/1/P-03 3485/97331
Water Conservation and Demand Management PB D000/00/4903 400/8/1/P-12 3487/97331
Dam Development Options and Economic Analysis – Volume 1 PB D000/00/4403 400/8/1/P-05 3484/97331
Dam Development Options and Economic Analysis – Volume 2 (Appendices) PB D000/00/4403 400/8/1/P-05 3484/97331
Environmental Assessment of the Proposed Dam Sites on the Orange River PB D000/00/4503 400/8/1/P-06 3873/97331
Vioolsdrift/Noordoewer Joint Irrigation Scheme: Assessment of Viability PB D000/00/4803 400/8/1/P-11 3525/97331
Public Consultation PB D000/00/4503 400/8/1/P-09 3869/97331
Inception Report
PB D000/00/4102 400/8/1/P-01 3365/97331
Pre-feasibility Study into Measures to Improve the Management of the Lower Orange River FINAL
DAM DEVELOPMENT OPTIONS – VOLUME 1 MARCH 2005 iii
EXECUTIVE SUMMARY
PURPOSE AND CONTENT OF THIS REPORT
The Pre-feasibility Study into measures to improve the management of the Lower
Orange River (LORMS) has been split into a number of main tasks, of which the Dam
Development Options is one. The Dam Development task has, in turn, been split into
the following sub-tasks:
• 4.1a: Identification of dam sites
• 4.1b: Pre-screening of development options
• 4.1c: Development of design and cost criteria
• 4.1d: Preliminary designs and cost estimates
• 4.1e: Operating rules
• 4.1f: Areas of inundation
• 4.1g: Border demarcation
• 4.2: Economic analyses
• 4.3: Water sharing, cost sharing and dam operation
This report covers all of the above tasks with the exception of the following tasks
which will be reported on separately:
• 4.1e: Operating rules
• 4.1g: Border demarcation
• 4.3: Water sharing, cost sharing and dam operation
This report therefore includes:
• Revised and updated dam design component-sizing criteria, and dam costing
criteria.
• Details of additional dam sites that were identified on the Orange River along the
common border.
• Details of a dam site that was identified on the Fish River.
• Details of pre-screening factors that were applied in making an initial elimination
of dam sites.
• Details of the various pre-screening processes in which dam development options
were eliminated from further consideration.
• A list of more promising dam sites that were considered in more detail.
• Comparison of the best dam development option with the previously-identified
Vioolsdrif and Boegoeberg Dam sites.

Pre-feasibility Study into Measures to Improve the Management of the Lower Orange River FINAL
DAM DEVELOPMENT OPTIONS – VOLUME 1 MARCH 2005 iv
DEVELOPMENT OF DESIGN AND COST CRITERIA
The study commenced with a review of the ‘Guidelines for the preliminary sizing,
costing and engineering economic evaluation of planning options’ developed during
the Vaal Augmentation Planning Study (VAPS) for the South African Department of
Water Affairs and Forestry (DWAF).
The component sizing criteria were reviewed and modified where deemed necessary.
In particular, the sections on flood determination for the various dam types were
rewritten due to inconsistencies in the terminology and presentation in the VAPS
guidelines. The sections on foundation grouting were rewritten to be consistent
between the various dam types.
The cost models were updated by utilising contract prices, with appropriate
escalation, for the recently constructed Maguga, Mohale, Inyaka and Bivane (Paris)
Dams, as well as the Matsoku Weir.
IDENTIFICATION OF DAM SITES
The purpose of this sub-task was to mark up all the relevant options identified in the
Orange River Development Project Replanning Study (ORRS) on the 1:50 000
topographical maps, to identify any new options to the west of the 20° longitude along
the common border between South Africa and Namibia and to identify a potential
dam site on the Fish River.
Options Upstream of the Common Border
In the ORRS, eight possible development options upstream of the common border
were identified and evaluated. No new sites were identified in this study. These
development options are listed in the Table 1.

Pre-feasibility Study into Measures to Improve the Management of the Lower Orange River FINAL
DAM DEVELOPMENT OPTIONS – VOLUME 1 MARCH 2005 v
Table 1: Development Options Identified in the ORRS Upstream of the
Common Border within the LORMS Study Area
Development Option Location
New Boegoeberg Dam ~ 1 km downstream of existing Boegoeberg Dam
Hospital Dam ~ 20 km upstream of Prieska
Lanyonvale Dam ~ 60 km downstream of Douglas
Torquay Dam ~ 47 km downstream of Hopetown and ~ 35 km upstream of Vaal/Orange
Confluence
Hereford Weir ~ 35 km downstream of Hopetown
Eskdale Weir ~ 15 km downstream of Hopetown
Elandsdraai Dam ~ 15 km upstream of Hopetown
Havenga Bridge Dam ~ 15 km downstream of Vanderkloof Dam
Options along the Common Border
All the potential dam sites along the common border that were identified in this study,
as well as those identified in the ORRS, are listed in the Table 2.
Table 2: Development Options Identified along the Common Border
Name of Dam Site Appendix Approximate Chainage (1)
(km)
Comment
Kabies C2 148 Identified in ORRS
Grootpens A C3 173
Grootpens B C3 177
Aussenkehr C3 223 Identified in ORRS
Vioolsdrif A C4 303 Identified in ORRS
Vioolsdrif B C4 318 Identified in ORRS
Vioolsdrif C C4 322 Identified in ORRS
Vioolsdrif D C4 327
Kambreek C6 433 Identified in ORRS
Coboop A C6 465
Coboop B C6 475
Coboop C C6 479
Beenbreek C7 512
Yas C7 542
Komsberg C7 580 Note
1) The chainage is the approximate distance measured along the Orange River, starting at the mouth of the river.
Pre-feasibility Study into Measures to Improve the Management of the Lower Orange River FINAL
DAM DEVELOPMENT OPTIONS – VOLUME 1 MARCH 2005 vi
Options on the Fish River
A site was selected at Koubis, immediately upstream of the Ai-Ais Nature Reserve, as
being representative of typical sites in the area to provide reservoir characteristics for
input into the hydrological model of the Lower Orange River (LOR). Initial runs of the
hydrological model indicated that a dam on the Fish River would not be attractive in
the regional context and no further investigations was carried out.
ENVIRONMENTAL CONSIDERATIONS AND EXISTING INFRA-STRUCTURE
Before the pre-screening of the development options could be undertaken,
background data had to be obtained on the environmental considerations associated
with, as well as the existing infrastructure that could be affected by the proposed
options. The following pre-screening factors were investigated:
• Reaches of ecological importance and sensitivity;
• Areas of archaeological and historical interest;
• Cultivated land that could be inundated due to dam development;
• Land over which various mining and prospecting licenses had been issued, and
for which the licensees would have to be compensated for areas that would be
inundated;
• Towns and villages that would be inundated;
• National parks;
• Powerlines across the river, that would possibly have to be re-routed; and
• Roads and bridges across the river that would possibly have to be re-routed.
Ecological Issues
The following issues of concern were identified:
• The natural distribution of the median monthly flows in the LOR, which have
already been significantly altered by the Gariep and Vanderkloof Dams, may be
distorted even more.
• A new impoundment will have physico-chemical effects such as stratification and
riverbed degradation.
• It will also impact on the riverine biota, such as vegetation, freshwater
invertebrates and freshwater fish species.
• Unique river reaches such as inland deltas will be affected.

Pre-feasibility Study into Measures to Improve the Management of the Lower Orange River FINAL
DAM DEVELOPMENT OPTIONS – VOLUME 1 MARCH 2005 vii
Areas of Archaeological and Historical Interest
The following conclusions were made on the above topic:
• Extrapolating what is known from localities to the east and west of the study area,
it could reasonably be predicted that any potential dam site within the study area
will have heritage impacts.
• The Richtersveld is archaeologically rich and inundation of the river valley will
have an impact in the immediate vicinity of the river.
• A preliminary field assessment will be necessary before any idea of the kinds of
impacts that may be involved, can be gained.
• Some detailed archival research may also be necessary to identify places of
conflict as well as help establish the significance of any sites found.
Cultivated Land
Presently cultivated areas along the common border, as well as potentially irrigable
areas along both the South African and Namibian sides of the river were recorded
during the course of the investigation into water demand and management.
Mining and Prospecting Licenses
Mining and prospecting licenses have been issued over much of the reach of the
common border and mining for diamonds, pegmatites, fluorspar and tungsten had
taken place in the area. It is not possible to quantify the cost of compensation for the
loss of prospecting and mining licenses, or differentiate between the licenses. The
cost of compensation has therefore been assumed to be equal for all sites.
Roads and Bridges
Three bridges cross the Orange River along the common border, namely at
Oranjemund/Alexander Bay, Vioolsdrif/Noordoewer and Onseepkans. The extent to
which these bridges and their approaches will be inundated by any dams constructed
on the river will depend on the full supply levels of the dams.
Towns and Villages
Two towns, namely Goodhouse and Onseepkans, could be partly or wholly inundated
by water impounded by new dams constructed at the Vioolsdrif and Kambreek sites.
Pre-feasibility Study into Measures to Improve the Management of the Lower Orange River FINAL
DAM DEVELOPMENT OPTIONS – VOLUME 1 MARCH 2005 viii
National Parks
The Ai-Ais Nature Reserve in Namibia and the Richtersveld Nature Reserve and
Augrabies Falls National Park in South Africa border on the Orange River and may
therefore be partly inundated by dam construction along the common border.
Powerlines
Four powerlines that cross the Orange River along the common border have been
identified, namely at Oranjemund, Rosh Pinah, Noordoewer and on the Farm Kabis.
PRE-SCREENING OF DEVELOPMENT OPTIONS
Options Upstream of the Common Border
The ORRS concluded that most of the initial development options considered in the
Orange River Basin could be eliminated from further consideration on financial,
social, engineering or environmental grounds. Only a small number of options
remained as possible future developments, however, it was not possible to make firm
recommendations at that stage.
In all of the remaining options, it was considered necessary to create some form of
operational storage along the Orange River at either Vioolsdrif or Boegoeberg. Both
options had similar Unit Reference Values (URVs) and it was not possible to
eliminate either of them during the Pre-feasibility Phase of the ORRS.
In the LORMS, no reason could be found to differ from the conclusion of the ORRS
that the most feasible option for the construction of a new dam upstream of the
common border is the New Boegoeberg Dam.
Options along the Common Border:
A preliminary pre-screening was done on the dam sites that were identified earlier,
with a view of eliminating those options that were clearly flawed from engineering,
social or environmental considerations. The remaining options, namely Vioolsdrif A
(as representative of the four sites), Yas and Komsberg were subjected to a cost
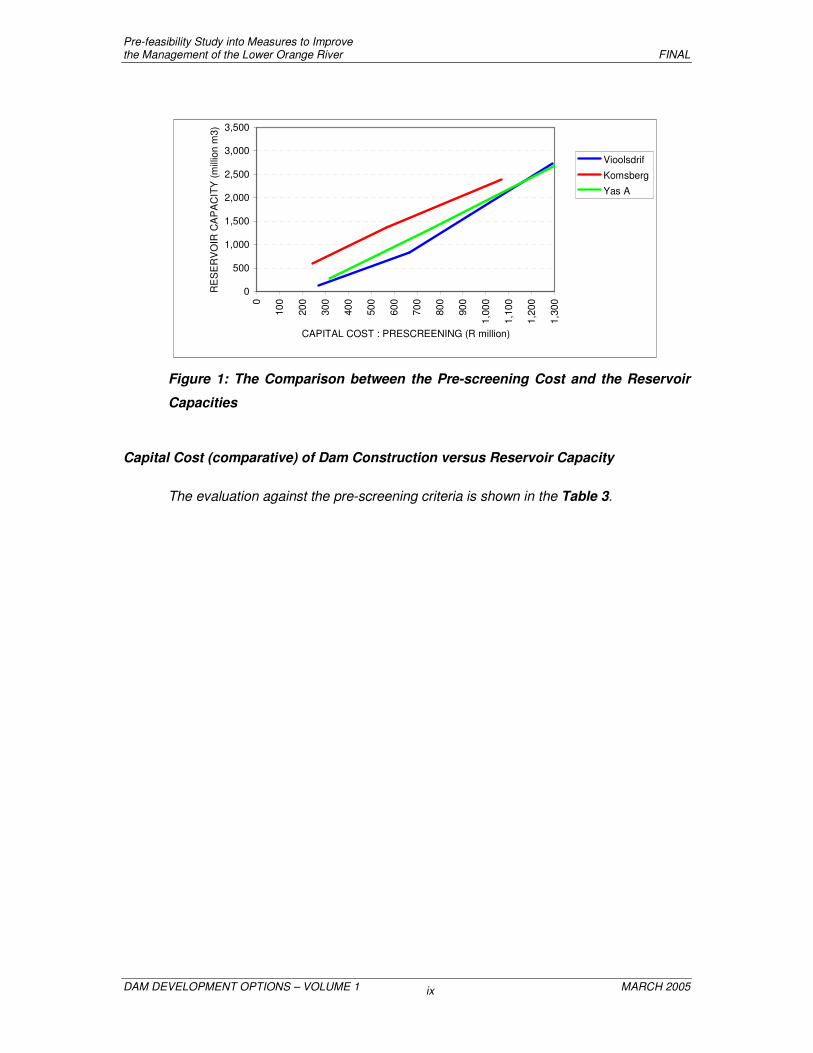
analysis and evaluation against the pre-screening criteria. The comparison between
the pre-screening cost and the reservoir capacities is shown in the Figure 1.
Pre-feasibility Study into Measures to Improve the Management of the Lower Orange River FINAL
DAM DEVELOPMENT OPTIONS – VOLUME 1 MARCH 2005 ix
0
500
1,000
1,500
2,000
2,500
3,000
3,500
0
100
200
300
400
500
600
700
800
900
1,00
0
1,10
0
1,20
0
1,30
0
CAPITAL COST : PRESCREENING (R million)
RE
SE
RV
OIR
CA
PA
CIT
Y (m
illio
n m
3)
Vioolsdrif
Komsberg
Yas A
Figure 1: The Comparison between the Pre-screening Cost and the Reservoir
Capacities
Capital Cost (comparative) of Dam Construction versus Reservoir Capacity
The evaluation against the pre-screening criteria is shown in the Table 3.
Pre-feasibility Study into Measures to Improve the Management of the Lower Orange River FINAL
DAM DEVELOPMENT OPTIONS – VOLUME 1 MARCH 2005 x
Table 3: The Evaluation against the Pre-screening Criteria
Pre-screening Factor Dam Site
Vioolsdrif A Yas Komsberg
Site considerations
Topography of site and basin Moderately good dam site Good dam site Very good dam site -
narrow valley
Geological conditions Only the Vioolsdrif Dam site was investigated (in the ORRS study) and geological
conditions can therefore not be used as a factor for pre-screening purposes.
Construction materials & borrow
areas
Only the Vioolsdrif Dam site was investigated (in the ORRS study) and this pre-screening
factor can therefore not be used as a factor for pre-screening purposes.
Storage capacity potential Potential storage capacities all exceed the maximum volume that can be utilized effectively
Small re-regulating dam or large
storage dam
All sites are suitable for either a small re-regulating dam, or a larger storage dam.
Design floods similar due to relatively great distance to main catchment areas Design floods & spillway
arrangements Mass concrete overflow Mass concrete overflow plus possible by-wash
Mass concrete overflow
Seismic characteristics All of the sites are situated in a low seismic risk area.
River diversion during construction For pre-screening purposes only mass concrete gravity dams were considered, and river diversion considerations are therefore identical.
Considerations to site establishment Not considered during pre-screening.
Access roads Access is difficult due to steep
valley sides
1:50 000 maps do not indicate roads in the immediate vicinity of the dam sites
Contribution to the system yield Considered to be similar for all sites due to negligible additional inflow from catchment
areas in the vicinity of these dams sites. Social and environmental impacts
Potential social impacts Social impacts of the individual sites were not investigated, but the social impacts of the sites should not differ from one another significantly.
Potential environmental impacts Considered relatively low Inundation of parts of the Augrabies Falls National Park
Pre-feasibility Study into Measures to Improve the Management of the Lower Orange River FINAL
DAM DEVELOPMENT OPTIONS – VOLUME 1 MARCH 2005 xi
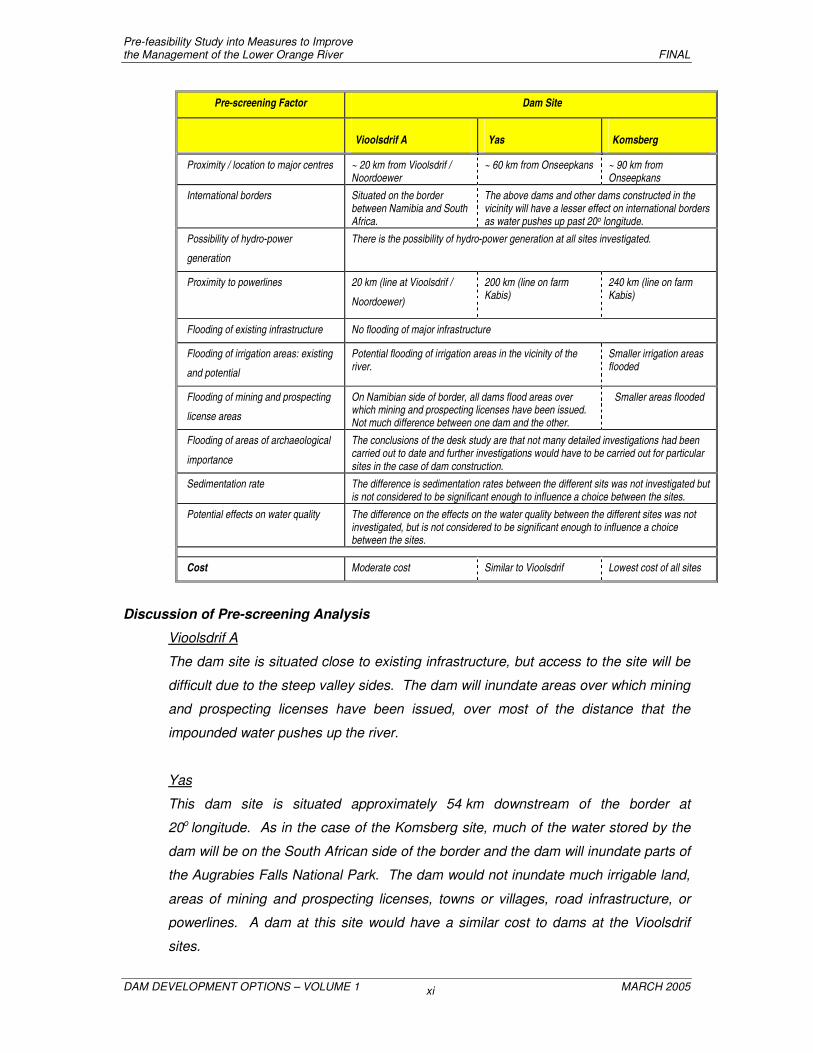
Pre-screening Factor Dam Site
Vioolsdrif A Yas Komsberg
Proximity / location to major centres ~ 20 km from Vioolsdrif / Noordoewer
~ 60 km from Onseepkans ~ 90 km from Onseepkans
International borders Situated on the border between Namibia and South Africa.
The above dams and other dams constructed in the vicinity will have a lesser effect on international borders as water pushes up past 20o longitude.
Possibility of hydro-power
generation
There is the possibility of hydro-power generation at all sites investigated.
Proximity to powerlines
20 km (line at Vioolsdrif /
Noordoewer)
200 km (line on farm Kabis)
240 km (line on farm Kabis)
Flooding of existing infrastructure No flooding of major infrastructure
Flooding of irrigation areas: existing
and potential
Potential flooding of irrigation areas in the vicinity of the river.
Smaller irrigation areas flooded
Flooding of mining and prospecting
license areas
On Namibian side of border, all dams flood areas over which mining and prospecting licenses have been issued. Not much difference between one dam and the other.
Smaller areas flooded
Flooding of areas of archaeological
importance
The conclusions of the desk study are that not many detailed investigations had been carried out to date and further investigations would have to be carried out for particular sites in the case of dam construction.
Sedimentation rate The difference is sedimentation rates between the different sits was not investigated but is not considered to be significant enough to influence a choice between the sites.
Potential effects on water quality The difference on the effects on the water quality between the different sites was not investigated, but is not considered to be significant enough to influence a choice between the sites.
Cost Moderate cost Similar to Vioolsdrif Lowest cost of all sites
Discussion of Pre-screening Analysis
Vioolsdrif A
The dam site is situated close to existing infrastructure, but access to the site will be
difficult due to the steep valley sides. The dam will inundate areas over which mining
and prospecting licenses have been issued, over most of the distance that the
impounded water pushes up the river.
Yas
This dam site is situated approximately 54 km downstream of the border at
20o longitude. As in the case of the Komsberg site, much of the water stored by the
dam will be on the South African side of the border and the dam will inundate parts of
the Augrabies Falls National Park. The dam would not inundate much irrigable land,
areas of mining and prospecting licenses, towns or villages, road infrastructure, or
powerlines. A dam at this site would have a similar cost to dams at the Vioolsdrif
sites.

Pre-feasibility Study into Measures to Improve the Management of the Lower Orange River FINAL
DAM DEVELOPMENT OPTIONS – VOLUME 1 MARCH 2005 xii
Komsberg
This dam site is situated approximately 7 km downstream of the border at
20o longitude. Most of the water stored by the dam will therefore be on the
South African side of the border and the dam will inundate parts of the Augrabies
Falls National Park, which is situated along the northern side of the river. The dam
would not inundate much irrigable land, areas of mining and prospecting licenses,
towns or villages, road infrastructure, or powerlines.
Based on the 1:50 000 mapping, this site was found to be the most economical site
along the common border for the construction of a dam for the range of reservoir
capacities under consideration. However, the extent of the inundation of the
Augrabies Falls National Park remained of concern.
Conclusions
Based on the pre-screening the following conclusions were made:
• The Yas Dam site does not offer any significant cost benefits over the Vioolsdrif
site and will inundate parts of the Augrabies Falls National Park. It was therefore
excluded from further analysis.
• From a capital cost point of view (as defined in this report), the Komsberg site is
more cost-effective than the Vioolsdrif site for the construction of either a smaller
re-regulating dam or a larger dam to improve the yield of the system. The
allowable inundation of the Augrabies Falls National Park, however, still had to be
determined.
The net result of the pre-screening was that both the Viooldrif A and the Komsberg
Dam sites were taken to a Decision-making Workshop.
ASSESSMENT OF PRE-SCREENED DEVELOPMENT OPTIONS
In the pre-screening process the number of dam sites that could possibly be carried
forward to the preliminary design stage was reduced to the following sites:
Upstream of 20o longitude (i.e. upstream of the common border):
• New Boegoeberg Dam

Pre-feasibility Study into Measures to Improve the Management of the Lower Orange River FINAL
DAM DEVELOPMENT OPTIONS – VOLUME 1 MARCH 2005 xiii
Downstream of 20o longitude (i.e. along the common border):
• Vioolsdrif Dam
• Komsberg Dam
These three possible options were investigated in order to make more accurate cost
estimates, determine yields and assess benefits and impacts. The options were then
evaluated at a Decision-making Workshop by a team consisting of the Client,
selected stakeholders and the Consultant.
Prior to the workshop, the following activities were carried out on the three dams:
• A yield analysis was carried out in order to determine the required storage
capacities for specified yields.
• A sedimentation analysis was carried out on the New Boegoeberg and Vioolsdrif
sites in order to estimate the sedimentation volumes.
• A financial analysis was carried out in order to determine the unit reference values
of dams of various storage capacities.
The pertinent data for the New Boegoeberg, Vioolsdrif and Komsberg Dam sites is
summarised in Table 4.
Table 4: Pertinent Values for the Preferred Sites for Re-regulating Dams
New Boegoeberg Vioolsdrif Komsberg
Proposed dam size (million m3) 163 260 260
Unit reference value (@ 8%) (R/m3) 0,35 0,26 0,24
Saving in operational losses (million m3/a) 62 170 126
At the workshop, it was decided that the Vioolsdrif and Komsberg Dam sites were
preferred to the New Boegoeberg Dam site for the following reasons:
• Significantly lower unit reference values; and
• Significantly larger saving in operational losses.
Due to the fact that dams for all heights under consideration at the Komsberg site
would inundate parts of the Augrabies Falls National Park, it was decided that the
Komsberg site should not be considered unless there were significant cost
advantages. The cost estimates of the Vioolsdrif and New Boegoeberg Dam sites

Pre-feasibility Study into Measures to Improve the Management of the Lower Orange River FINAL
DAM DEVELOPMENT OPTIONS – VOLUME 1 MARCH 2005 xiv
had been done on 1:10 000 mapping with 5 m contours, whilst that of the Komsberg
Dam site was done on 1:50 000 mapping with 20 m contours. It was therefore
decided that 1:10 000 mapping should also be prepared for the Komsberg site.
Based on this mapping, the quantities for the Komsberg Dam site were re-calculated.
The URV for a dam with a capacity of 260 million m3 increased to R0.28/m3.
The river bed levels downstream of the Augrabies Falls were also checked by using
the Digital Elevation Models (DEMs) of the area. The river bed level at the Komsberg
Dam site is at approximately RL 430.8 m. Above a full supply level (FSL) of
approximately RL 432 m water will start pushing up into the Augrabies Falls National
Park, and the rapids downstream of the Falls will start to be inundated at levels above
RL 450 m. The FSL for the proposed re-regulating dam will be at approximately
RL 446m.
After the workshop, field visits were made to the Vioolsdrif and Komsberg areas in
order to carry out a vegetation study and ecological and archaeological assessments.
The improved costs, the results of the vegetation and archaeological studies, the
ecological assessment, as well as other factors that needed to be considered in
assessing the options were presented to the Client.
A summary of the above assessments is presented in Table 5.
Table 5: Summary of Assessment of Vioolsdrif and Komsberg Options
Dam Sites Vioolsdrif Komsberg
Issues
Potentially serious implications of any raising of the dam in future
None
Inundation of the rapids downstream of the Augrabies Falls.
Impact on Augrabies Falls and National Park None Dam basin inside the Park and potential sediment and back water affects in rapids
Saving in operational losses (million m3/a) 170 126
Ecological
Would have the most impact relative to the other options.
Would have a lower impact than the Vioolsdrif Dam option.
Archaeological Would have the greater impact on archaeological remains.
Would have a lesser impact on archaeological remains than Vioolsdrif.
Vegetation Would overall affect a less developed stretch of riparian landscapes and habitats.
Would affect large stretches of relatively pristine riparian woodlands, though interrupted by agricultural developments.
Unit reference values (R/m3) 0.26 0.28
Pre-feasibility Study into Measures to Improve the Management of the Lower Orange River FINAL
DAM DEVELOPMENT OPTIONS – VOLUME 1 MARCH 2005 xv
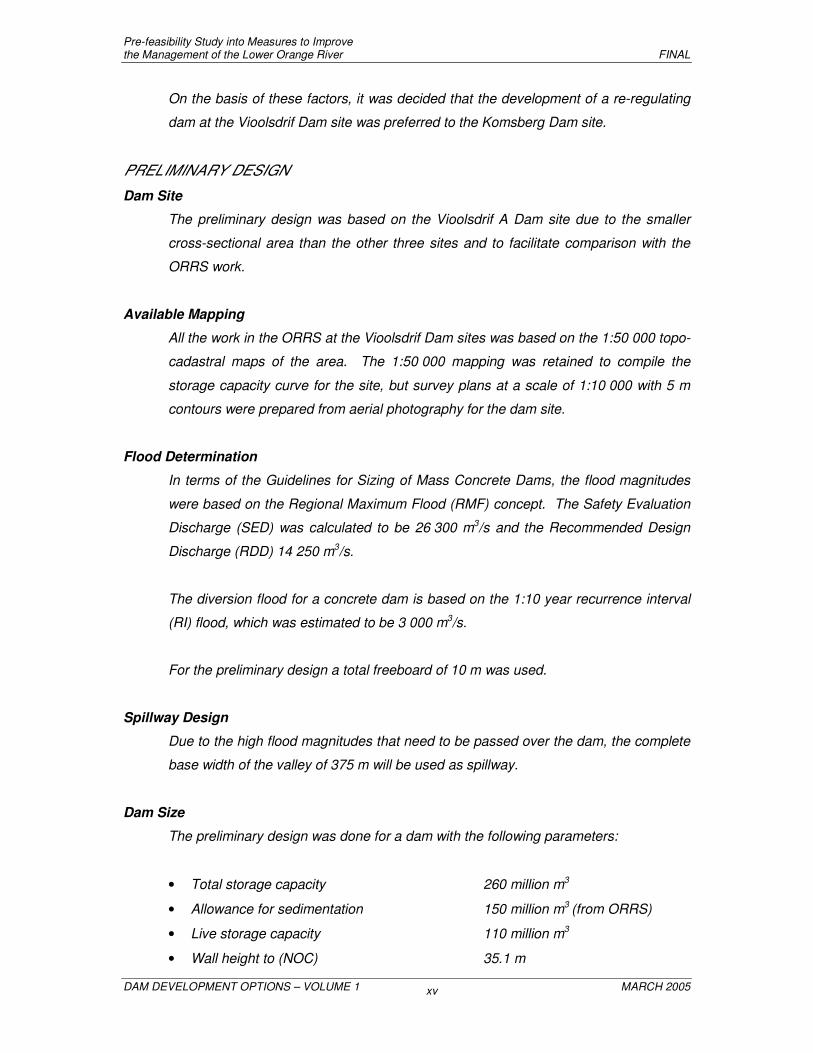
On the basis of these factors, it was decided that the development of a re-regulating
dam at the Vioolsdrif Dam site was preferred to the Komsberg Dam site.
PRELIMINARY DESIGN
Dam Site
The preliminary design was based on the Vioolsdrif A Dam site due to the smaller
cross-sectional area than the other three sites and to facilitate comparison with the
ORRS work.
Available Mapping
All the work in the ORRS at the Vioolsdrif Dam sites was based on the 1:50 000 topo-
cadastral maps of the area. The 1:50 000 mapping was retained to compile the
storage capacity curve for the site, but survey plans at a scale of 1:10 000 with 5 m
contours were prepared from aerial photography for the dam site.
Flood Determination
In terms of the Guidelines for Sizing of Mass Concrete Dams, the flood magnitudes
were based on the Regional Maximum Flood (RMF) concept. The Safety Evaluation
Discharge (SED) was calculated to be 26 300 m3/s and the Recommended Design
Discharge (RDD) 14 250 m3/s.
The diversion flood for a concrete dam is based on the 1:10 year recurrence interval
(RI) flood, which was estimated to be 3 000 m3/s.
For the preliminary design a total freeboard of 10 m was used.
Spillway Design
Due to the high flood magnitudes that need to be passed over the dam, the complete
base width of the valley of 375 m will be used as spillway.
Dam Size
The preliminary design was done for a dam with the following parameters:
• Total storage capacity 260 million m3
• Allowance for sedimentation 150 million m3 (from ORRS)
• Live storage capacity 110 million m3
• Wall height to (NOC) 35.1 m

Pre-feasibility Study into Measures to Improve the Management of the Lower Orange River FINAL
DAM DEVELOPMENT OPTIONS – VOLUME 1 MARCH 2005 xvi
• Wall height to FSL 25.1 m
• River bed level RL 176.4 m (approximately)
• FSL RL 201.5 m
• NOC RL 211.5 m
• Total crest length 485 m
Dam Type Selection
Due to the large design floods the complete river section must be utilised as a
spillway. A concrete gravity dam was therefore considered to be the only type of dam
suitable for the site. Due to its inherent lower costs a rollcrete dam was chosen for
the preliminary design.
Outlet Works
The estimated monthly demand figures for a re-regulating dam vary from a minimum
of 2.3 m3/s in June to 11.8 m3/s in January. Two 2 m diameter pipe stacks are
allowed for with 1.8 m diameter inlets at 7 m centres. With a normal operating flow
velocity of 4 m/s each pipe stack can discharge 12.6 m3/s. The water will be
discharged through 1.2 m diameter sleeve valves.
The estimated maximum environmental flow requirement is 400 m3/s in February.
Whilst it can be expected that the dam would normally overflow during this time,
allowance has been made for the installation of two 3.0 m wide by 3.5 m high radial
gates to act as bottom outlets.
Flood Diversion Works
The first stage of the river diversion will consist of an approximately semi circular 8 m
high rollcrete cofferdam that will be built on the left hand side of the river valley to
close off 250 m of the river channel. Culverts will be installed in the rollcrete for
diversion purposes during the second stage.
The second stage will require 15 m high rollcrete upstream and downstream
cofferdams to link the right flank with the already completed dam.
Access Roads and Site Establishment
Access to the site is difficult due to the steep valley sides. There is also no space
available at the dam site for site establishment. For the purposes of the preliminary
design a gravel access road on the left bank was costed. The access road will be
Pre-feasibility Study into Measures to Improve the Management of the Lower Orange River FINAL
DAM DEVELOPMENT OPTIONS – VOLUME 1 MARCH 2005 xvii
prone to frequent flooding unless it can be located above approximately 10 m above
the river bed level.
Dam Raising
According to the systems analysis, the projected future downstream demands would
require a live storage volume of 1 500 million m3. The 50-year sediment volume was
estimated at approx 600 million m3. The total storage volume would be
2 100 million m3 at a spillway height of 54.6 m. This would require a 29.5 m raising of
the re-regulating dam.
The re-regulating dam can be raised by adding rollcrete on the downstream side. In
order to allow for such an eventuality the Outlet Works were moved 24 m
downstream in the preliminary design. The Intake Tower will be extended vertically
whilst adding further intakes to the pipe stacks.
Hydropower Potential
The available flow rate for hydropower generation was taken as the monthly demand
figures plus the minimum environmental flow requirement (EFR). The average flow
rate over a full year was estimated at 15.4 m3/s. The minimum available head is
20.3 m.
The maximum generating capacity is 4.2 MW. The total annual power generation
was estimated at 21.3 GWh.
The estimated capital cost of the power station is R30 million, which allows for all civil
and mechanical/electrical works up to and including the switchgear at the dam site.
No allowance was made for the cost of any distribution lines. The estimated potential
income is R3.4 million per annum, based on a selling rate of R0.12 per kWh and a
carbon emission reduction subsidy of R0.04 per kWh.
COST ESTIMATE
The total project cost for a rollcrete re-regulating dam at the Vioolsdrif A site at
April 2004 rates is estimated to be R 561 million.

Pre-feasibility Study into Measures to Improve the Management of the Lower Orange River FINAL
DAM DEVELOPMENT OPTIONS – VOLUME 1 MARCH 2005 xviii
ECONOMIC ANALYSIS
The Boegoeberg, Vioolsdrif and Komsberg sites were compared on an engineering
economic basis. It firstly proved that the Vioolsdrif site is more beneficial than the
Boegoeberg site for the full spectrum of capacities investigated. Initially, a re-
regulating dam at Komsberg seemed more beneficial than at Vioolsdrif, but after
more detailed mapping was obtained, Vioolsdrif proved to be the more economic site
for the re-regulating dam.
The analysis proved that the re-regulating dam only will not make adequate additional
yield available to serve the full demand until 2025. Additional storage on the system
is required.
Analysis of the Vioolsdrif Dam options proved that a phased development, i.e., the
future raising of the re-regulating dam, is economically more beneficial than
construction to full capacity at once for the larger capacity dam. The outcome of
other studies will also influence the decision if the re-regulating dam is to be raised or
additional storage is to be created elsewhere in the system. It is recommended that
this aspect be investigated further in the Feasibility Study.

Pre-feasibility Study into Measures to Improve the Management of the Lower Orange River FINAL
DAM DEVELOPMENT OPTIONS – VOLUME 1 MARCH 2005 xix
TABLE OF CONTENTS
VOLUME 1 REPORT
EXECUTIVE SUMMARY iii
TABLE OF CONTENTS xix
LIST OF ABBREVIATIONS xxv
LIST OF TABLES xxvi
LIST OF FIGURES xxvii
1. INTRODUCTION ............................................................................................28
1.1 PURPOSE AND CONTENT OF THIS REPORT .................................................28
1.2 METHODOLOGY................................................................................................29
1.3 PREVIOUS INVESTIGATIONS...........................................................................29
2. DEVELOPMENT OF DESIGN AND COST CRITERIA ..................................32
2.1 INTRODUCTION ................................................................................................32
2.2 CHANGES MADE TO THE COMPONENT SIZING CRITERIA...........................32
2.3 CHANGES MADE TO THE COSTING MODELS ................................................35
2.3.1 Introduction .....................................................................................................35
2.3.2 Review of Costing ...........................................................................................35
3. IDENTIFICATION OF DAM SITES.................................................................38
3.1 PURPOSE OF SUB-TASK..................................................................................38
3.2 METHODOLOGY................................................................................................38
3.2.1 Options Upstream of the Common Border.......................................................38
3.2.2 Options along the Common Border .................................................................38
3.2.3 Options on the Fish River ................................................................................39
3.3 POTENTIAL DAM SITES IDENTIFIED ...............................................................39
3.3.1 Options Upstream of the Common Border.......................................................39
3.3.2 Options along the Common Border .................................................................40
3.3.3 Options on the Fish River ................................................................................42
4. ENVIRONMENTAL CONSIDERATIONS AND EXISTING
INFRASTRUCTURE.......................................................................................43
4.1 INTRODUCTION ................................................................................................43
4.2 ECOLOGICAL IMPORTANCE AND SENSITIVITY OF THE LOWER ORANGE
RIVER.................................................................................................................43
4.2.1 River Flow .......................................................................................................43
Pre-feasibility Study into Measures to Improve the Management of the Lower Orange River FINAL
DAM DEVELOPMENT OPTIONS – VOLUME 1 MARCH 2005 xx
4.2.2 Issues of Concern in respect of Dam Construction in the Orange River Reach
from 20o Longitude to the Orange-Fish River Confluence................................44
4.3 REPORT ON THE HERITAGE SENSITIVITY OF THE SOUTH AFRICAN SIDE
OF THE ORANGE RIVER DOWNSTREAM OF 20O LONGITUDE......................49
4.3.1 Introduction .....................................................................................................49
4.3.2 Method ............................................................................................................49
4.3.3 Restrictions .....................................................................................................49
4.3.4 Available Information.......................................................................................49
4.3.5 An Estimation of Sensitivity .............................................................................51
4.3.6 Conclusions.....................................................................................................52
4.4 REPORT ON THE HERITAGE SENSITIVITY OF THE NAMIBIAN SIDE OF THE
ORANGE RIVER DOWNSTREAM OF 20O LONGITUDE....................................53
4.5 CULTIVATED LAND ...........................................................................................54
4.6 MINING AND PROSPECTING LICENSES .........................................................55
4.6.1 South Africa.....................................................................................................55
4.6.2 Namibia...........................................................................................................55
4.7 ROADS AND BRIDGES......................................................................................56
4.8 TOWNS AND VILLAGES....................................................................................57
4.9 NATIONAL PARKS.............................................................................................57
4.10 POWERLINES....................................................................................................58
5. PRE-SCREENING OF DEVELOPMENT OPTIONS.......................................59
5.1 PURPOSE OF SUB-TASK..................................................................................59
5.2 PRE-SCREENING FACTORS ............................................................................59
5.3 OPTIONS UPSTREAM OF THE COMMON BORDER........................................60
5.3.1 Potential Development Options .......................................................................60
5.3.2 Cost Analysis and Economic Analysis .............................................................62
5.3.3 Conclusions of the ORRS................................................................................63
5.3.4 Conclusions of the Review of the ORRS .........................................................64
5.4 OPTIONS ALONG THE COMMON BORDER.....................................................64
5.4.1 Potential Development Options .......................................................................64
5.4.2 Cost Analysis...................................................................................................65
5.4.3 Evaluation against Pre-screening Criteria........................................................67
5.4.4 Discussion of Pre-screening Analysis ..............................................................69
5.4.5 Conclusions.....................................................................................................70
6. ASSESSMENT OF PRE-SCREENED DEVELOPMENT OPTIONS...............71
6.1 INITIAL SELECTION...........................................................................................71
6.2 KOMSBERG DAM SITE......................................................................................72

Pre-feasibility Study into Measures to Improve the Management of the Lower Orange River FINAL
DAM DEVELOPMENT OPTIONS – VOLUME 1 MARCH 2005 xxi
6.3 ECOLOGICAL ASSESSMENT............................................................................73
6.3.1 Vegetation Study .............................................................................................73
6.3.2 Ecological Assessment....................................................................................73
6.3.3 Archaeological Assessment.............................................................................74
6.4 CONCLUSIONS..................................................................................................74
7. SEDIMENTATION ANALYSIS .......................................................................75
7.1 INTRODUCTION ................................................................................................75
7.2 SUMMARY OF REPORT....................................................................................75
7.2.1 Introduction .....................................................................................................75
7.2.2 Sediment Loads of the Orange River...............................................................75
7.2.3 Estimated Sedimentation Rates for Future Reservoirs at Boegoeberg and
Vioolsdrif .........................................................................................................76
8. PRELIMINARY DESIGN ................................................................................78
8.1 VIOOLSDRIF DAM SITES ..................................................................................78
8.2 AVAILABLE MAPPING .......................................................................................78
8.3 GEOLOGY..........................................................................................................79
8.4 FLOOD DETERMINATION .................................................................................79
8.4.1 Flood Magnitudes............................................................................................79
8.4.2 Flood Attenuation ............................................................................................80
8.4.3 Freeboard........................................................................................................80
8.5 SPILLWAY DESIGN ...........................................................................................81
8.6 DAM SIZE...........................................................................................................81
8.7 DAM TYPE SELECTION.....................................................................................82
8.8 OUTLET WORKS ...............................................................................................82
8.9 FLOOD DIVERSION WORKS.............................................................................83
8.9.1 Stage 1............................................................................................................83
8.9.2 Stage 2............................................................................................................84
8.10 ACCESS ROADS AND SITE ESTABLISHMENT................................................84
8.11 DAM RAISING ....................................................................................................85
8.12 HYDROPOWER POTENTIAL.............................................................................86
8.13 EXTENT OF INUNDATION.................................................................................86
9. COST ESTIMATE...........................................................................................87
9.1 INTRODUCTION ................................................................................................87
9.2 EXPLANATORY NOTES ....................................................................................87
9.2.1 Clearing...........................................................................................................87
9.2.2 River diversion.................................................................................................87
9.2.3 Excavation.......................................................................................................87

Pre-feasibility Study into Measures to Improve the Management of the Lower Orange River FINAL
DAM DEVELOPMENT OPTIONS – VOLUME 1 MARCH 2005 xxii
9.2.4 Drilling and grouting.........................................................................................87
9.2.5 Formwork ........................................................................................................87
9.2.6 Concrete..........................................................................................................88
9.2.7 Reinforcing ......................................................................................................88
9.2.8 Mechanical Items ............................................................................................88
9.2.9 Fencing ...........................................................................................................88
9.2.10 Preliminary Works ...........................................................................................88
9.2.11 Accommodation...............................................................................................88
9.2.12 VAT.................................................................................................................89
9.2.13 Cost of Relocations .........................................................................................89
9.2.14 Cost of Land Acquisition..................................................................................89
9.2.15 Allowance for Raising......................................................................................89
10. ECONOMIC ANALYSIS .................................................................................90
10.1 METHODOLOGY................................................................................................90
10.1.1 Calculation of URV ..........................................................................................90
10.1.2 Option Costs ...................................................................................................90
10.1.3 Option Benefit..................................................................................................91
10.1.4 Demand Curve ................................................................................................92
10.1.5 Existing Yield...................................................................................................92
10.1.6 Discount Rate..................................................................................................92
10.1.7 Implementation Date .......................................................................................92
10.2 SCENARIOS.......................................................................................................92
10.3 ASSESSMENT OF PRE-SCREENED DAM DEVELOPMENT OPTIONS ...........93
10.4 ASSESSMENT OF MANAGEMENT OPTIONS ..................................................95
10.5 VIOOLSDRIFT DEVELOPMENT OPTIONS........................................................95
11. CONCLUSIONS AND RECOMMENDATIONS ..............................................97
11.1 DEVELOPMENT OF DESIGN AND COST CRITERIA........................................97
11.2 IDENTIFICATION OF DAM SITES......................................................................97
11.3 ENVIRONMENTAL CONSIDERATIONS AND EXISTING INFRASTRUCTURE .98
11.3.1 Ecological Issues.............................................................................................99
11.3.2 Areas of Archaeological and Historical Interest................................................99
11.3.3 Cultivated Land ...............................................................................................99
11.3.4 Mining and Prospecting Licenses ....................................................................99
11.3.5 Roads and Bridges........................................................................................100
11.3.6 Towns and Villages .......................................................................................100
11.3.7 National Parks...............................................................................................100
11.3.8 Powerlines.....................................................................................................100
Pre-feasibility Study into Measures to Improve the Management of the Lower Orange River FINAL
DAM DEVELOPMENT OPTIONS – VOLUME 1 MARCH 2005 xxiii
11.4 PRE-SCREENING OF DEVELOPMENT OPTIONS..........................................100
11.4.1 Options Upstream of the Common Border.....................................................100
11.4.2 Options along the Common Border ...............................................................101
11.4.3 Discussion of Pre-screening Analysis ............................................................101
11.5 CONCLUSIONS................................................................................................102
11.6 ASSESSMENT OF PRE-SCREENED DEVELOPMENT OPTIONS ..................103
11.7 PRELIMINARY DESIGNS AND COST ESTIMATES.........................................105
11.7.1 Dam Site .......................................................................................................105
11.7.2 Available Mapping .........................................................................................105
11.7.3 Flood Determination ......................................................................................106
11.7.4 Spillway Design .............................................................................................106
11.7.5 Dam Size.......................................................................................................106
11.7.6 Dam Type Selection ......................................................................................106
11.7.7 Outlet Works .................................................................................................107
11.7.8 Flood Diversion Works ..................................................................................107
11.7.9 Access Roads and Site Establishment ..........................................................107
11.7.10 Dam Raising..................................................................................................107
11.7.11 Hydropower Potential ....................................................................................108
11.8 COST ESTIMATE .............................................................................................108
11.9 ECONOMIC ANALYSIS....................................................................................108
12. REFERENCES .............................................................................................110
VOLUME 2 : APPENDICES
A : Guidelines for the preliminary sizing, costing and engineering economic
evaluation of planning options
B : Locality map
C : Location of potential dam sites (1:250 000 and 1:500 000 maps)
C1 to C8: Orange River mouth to 20o longitude (including pre-screening
factors)
C9 to C12: 20o longitude to Vanderkloof Dam
C13: Fish River
C14: Correspondence with South African Department of Minerals
and Energy
D : Layouts of potential dam sites (1:20 000 maps)
E : Cross-sections of potential dam sites
F : Longitudinal profile of the Orange River

Pre-feasibility Study into Measures to Improve the Management of the Lower Orange River FINAL
DAM DEVELOPMENT OPTIONS – VOLUME 1 MARCH 2005 xxiv
G : Report on the sedimentation analysis
H : Preliminary design of Vioolsdrif Re-regulating Dam
I : Unit Reference Value Calculations
I 1: Pre-screened options and scenarios
I 2: Management options
I 3: Vioolsdrift development options
Pre-feasibility Study into Measures to Improve the Management of the Lower Orange River FINAL
DAM DEVELOPMENT OPTIONS – VOLUME 1 MARCH 2005 xxv
LIST OF ABBREVIATIONS
Consultant : Lower Orange River Consultants
DEM : Digital Elevation Model
DWAF : Department of Water Affairs and Forestry
EFR : Environmental Flow Requirement
FSL : Full supply level
LORMS : Lower Orange River Management Study
LOR : Lower Orange River
MAR : Mean Annual Runoff
MOL : Minimum Operating Level
NOC : Non Overspill Crest
ORRS : Orange River Development Project Replanning Study
ORS : Orange River System
RDD : Recommended Design Discharge
RI : Recurrence Interval
RL : Reduced Level
RMF : Regional Maximum Flood
SED : Safety Evaluation Discharge
ToR : Terms of Reference
URV : Unit Reference Value
VAPS : Vaal Augmentation Planning Study
NPV : Nett Present Value
R/m3 : Rand per cubic meter
c/m3 : Cent per cubic meter
WC & DM : Water Conservation and Demand Management

Pre-feasibility Study into Measures to Improve the Management of the Lower Orange River FINAL
DAM DEVELOPMENT OPTIONS – VOLUME 1 MARCH 2005 xxvi
LIST OF TABLES
Table 2.1: Embankment Dams: Sizing Guidelines ..............................................................33
Table 2.2: Mass Concrete Dams: Sizing Guidelines............................................................34
Table 3.1: Development Options Identified in the ORRS Upstream of the Common
Border within the LORMS Study Area ................................................................40
Table 3.2: Development Options Identified along the Common Border ...............................40
Table 4.1: Key Freshwater Fish Species Expected to be affected by Dam
Construction in the LOR Stretch between 20º Longitude and the Orange-
Fish Confluence .................................................................................................46
Table 4.2: River Reaches in the Orange River Stretch 20º Longitude to the Orange-
Fish Confluence considered to be of Ecological Importance...............................48
Table 4.3: South African Side of the Orange River: Sites of Historical and
Archaeological Interest.......................................................................................51
Table 4.4: Mining and Prospecting Licenses Issued............................................................56
Table 4.5: Bridges across Orange River along the Common Border.....................................56
Table 4.6: Locations of Towns and Villages ........................................................................57
Table 4.7: Locations of National Parks that may be affected by Dam Construction
along the Common Border .................................................................................57
Table 4.8: Locations of High-voltage Powerlines Crossing the Orange River along
the Common Border...........................................................................................58
Table 5.1: Details of Development Options Identified in the ORRS Upstream of the
Common Border.................................................................................................61
Table 5.2: Single Dam Development Options considered in the Pre-feasibility
Phase of the ORRS............................................................................................63
Table 5.3: Potential Dam Sites identified along the Common Border ..................................64
Table 5.4: Pre-screening.....................................................................................................68
Table 6.1: Pertinent Values for the Preferred Sites for Re-regulating Dams........................72
Table 6.2: Summary of Assessment of Vioolsdrif and Komsberg Options...........................74
Table 7.1: Estimated 50-year Sediment Volumes for Storage Reservoirs at
Vioolsdrif and Boegoeberg .................................................................................77
Table 8.1: Calculation of Freeboard ....................................................................................80
Table 10.1: Assessment of Dam Development Options ........................................................94
Table 10.2: Water Conservation and Demand Management Options ...................................95
Table 10.3: Vioolsdrif Dam Development Options.................................................................96
Table 11.1: Pertinent Values for the Preferred Sites for Re-regulating Dams......................104
Table 11.2: Summary of Assessment of Vioolsdrif and Komsberg Options.........................105

Pre-feasibility Study into Measures to Improve the Management of the Lower Orange River FINAL
DAM DEVELOPMENT OPTIONS – VOLUME 1 MARCH 2005 xxvii
LIST OF FIGURES
Figure 5-1: Capital Cost (Comparative) of Dam Construction versus Dam Height ................66
Figure 5-2: Reservoir Capacity versus Dam Height ..............................................................66
Figure 5-3: Capital Cost (Comparative) of Dam Construction versus Reservoir
Capacity.............................................................................................................67
Figure 10-1: Benefit of Vioolsdrif Re-regulating Dam Option............................................91
Figure 10-2: Plot of Yield for a Scenario...........................................................................93
Figure 11-1: Capital Cost (Comparative) of Dam Construction versus Reservoir
Capacity...........................................................................................................101
Pre-feasibility Study into Measures to Improve the Management of the Lower Orange River FINAL
DAM DEVELOPMENT OPTIONS – VOLUME 1 MARCH 2005 28
1. INTRODUCTION
1.1 Purpose and Content of This Report
The Pre-feasibility study into measures to improve the management of the Lower
Orange River (LORMS) has been split into a number of main tasks, of which the Dam
Development Options is one. The Dam Development task has, in turn, been split into
the following sub-tasks:
• 4.1a: Identification of dam sites
• 4.1b: Pre-screening of development options
• 4.1c: Development of design and cost criteria
• 4.1d: Preliminary designs and cost estimates
• 4.1e: Operating rules
• 4.1f: Areas of inundation
• 4.1g: Border demarcation
• 4.2: Economic analyses
• 4.3: Water sharing, cost sharing and dam operation
This report covers all of the above tasks with the exception of the following tasks
which will be reported on separately:
• 4.1e: Operating rules
• 4.1g: Border demarcation
• 4.3: Water sharing, cost sharing and dam operation
This report therefore includes:
• Revised and updated dam design component-sizing criteria, and dam costing
criteria.
• Details of additional dam sites that were identified on the Orange River along the
common border.
• Details of a dam site that was identified on the Fish River.
• Details of pre-screening factors that were applied in making an initial elimination
of dam sites.
• Details of the various pre-screening processes in which dam development options
were eliminated from further consideration.
• A list of more promising dam sites that were considered in more detail.
Pre-feasibility Study into Measures to Improve the Management of the Lower Orange River FINAL
DAM DEVELOPMENT OPTIONS – VOLUME 1 MARCH 2005 29
• Comparison of the best dam development option with the previously-identified
Vioolsdrif and Boegoeberg Dam sites.
• Explanation and results of economic analysis.
1.2 Methodology
The work relating to this task was carried out in the following manner:
• The Vaal Augmentation Planning Study’s (VAPS) report on Guidelines for the
Preliminary Sizing, Costing and Engineering Economic Evaluation of Planning
Options (DWAF, 1996) was studied in order to review the dam design criteria, and
update the costing models.
• The report on Potential Dam Development and Hydro Power Options of the
ORRS Study (DWAF, 1998a) was studied and particular attention was paid to
investigations and recommendations pertaining to dam development options.
• The reach of the Orange River, from the mouth of the river to 20° longitude, was
inspected for possible dam sites which had not already been identified in the
Orange River Development Project Replanning Study (ORRS).
• The reach of Fish River from the confluence with the Orange River to a point in
the vicinity of Keetmanshoop was inspected for possible dam sites.
• A preliminary screening process was undertaken to identify all of the dam
development options, which were considered to be flawed from an engineering,
social or environmental viewpoint.
• Preliminary cost analyses were carried out to determine the most cost effective
options from a capital cost and reservoir size viewpoint.
• A preliminary design was carried out on the most feasible dam development
option identified in the pre-screening stage.
1.3 Previous Investigations
Previous investigations that are relevant to this study are:
• The Vaal Augmentation Planning Study: Guidelines for the preliminary sizing,
costing and engineering economic evaluations of planning options.
• The Orange River Development Project Replanning Study: Potential Dam
Development and Hydro Power Options.
These studies are discussed in more detail below.

Pre-feasibility Study into Measures to Improve the Management of the Lower Orange River FINAL
DAM DEVELOPMENT OPTIONS – VOLUME 1 MARCH 2005 30
(a) Vaal Augmentation Planning Study: Guidelines for the Preliminary Sizing,
Costing and Engineering Economic Evaluation of Planning Options
During the execution of the VAPS, the Project Planning Directorate of the South
African Department of Water Affairs and Forestry (DWAF) recognised that the
standard methodology developed during the study for the sizing and costing of water
resource project components and for the economic evaluation of water resource
development options would be a valuable tool for subsequent planning exercises. It
was accordingly decided to capture the guidelines in a single document, which would
be made available to planning professionals, both within the Department and those
consultants appointed by the Department, to undertake specific assignments.
The purpose of these guidelines was to provide a standard framework for first pass
comparative costing and project economic evaluation of water resource development
options. It was envisaged that as additional information was obtained on the options
under investigation, that the models provided in the guidelines would be expanded
and adjusted to reflect the actual circumstances more accurately. The guidelines
were merely planning tools and were not suitable for the preparation of detailed
designs, engineers’ estimates or tender documentation.
Guidelines were given on the following aspects of dam development:
• Level of detail required for the different planning phases.
• Component signing criteria for embankment dams (earthfill with impervious core,
rockfill with impervious core and rockfill with reinforced concrete upstream face),
mass concrete dams, weirs, canals, syphons, pipelines, pumping stations, tunnels
and pumped storage.
• Costing models for embankment dams, mass concrete dams, weirs, canals,
syphons, pipelines, pumping stations, tunnels and multi-level intake structures.
• Social, environmental and administration costs, economic life, annual
maintenance and operational costs.
• Method of measurement.
• Project economic evaluation models.

Pre-feasibility Study into Measures to Improve the Management of the Lower Orange River FINAL
DAM DEVELOPMENT OPTIONS – VOLUME 1 MARCH 2005 31
(b) Orange River Development Project Replanning Study (ORRS): Potential
Dam Development and Hydropower Options
Various dam development options were initially evaluated as part of the
Reconnaissance Phase of the ORRS. All development options considered in
previous studies were included in the initial evaluation, together with new options
identified by the Project Team.
Twenty-three development options were carried through to the Pre-feasibility Phase
of the study, and were analysed in the chapter “Potential Dam Development and
Hydropower Options”.

Pre-feasibility Study into Measures to Improve the Management of the Lower Orange River FINAL
DAM DEVELOPMENT OPTIONS – VOLUME 1 MARCH 2005 32
2. DEVELOPMENT OF DESIGN AND COST CRITERIA
2.1 Introduction
During the execution of the VAPS, the Project Planning Directorate of the South
African DWAF recognised that the standard methodology developed during that study
for the sizing and costing of water resource project components and for the economic
evaluation of water resource development options would be a valuable tool for
subsequent planning exercises. It was accordingly decided to capture these
guidelines in a single document that could be made available to planning
professionals, both within the Department and those consultants appointed by the
Department, to undertake specific assignments (DWAF, 1996).
In the Terms of Reference (ToR) for the LORMS project, it was stated that these
guidelines could form the basis for the preliminary designs and initial cost analyses.
Therefore, for the purposes of the LORMS, the design criteria utilised in the VAPS
study were reviewed and modified where deemed necessary, and the cost models
updated by utilising contract prices for the Maguga, Mohale, Inyaka and Bivane
(Paris) Dams, as well as the Matsoku Weir. Due to the specific nature of this study,
namely the development of dam options for the Lower Orange River (LOR), only the
design criteria and cost models for dams were reviewed.
The reviewed and modified cost criteria have been compiled into a separate
document, attached hereto as Appendix A.
2.2 Changes made to the Component Sizing Criteria
The component sizing criteria utilised in the VAPS were reviewed and modified where
deemed necessary. In particular, the sections on flood determination for the various
dam types were rewritten due to inconsistencies in the terminology and presentation
in the VAPS guidelines. Anomalies between the sections on typical dimensions and
the figures were corrected. The sections on foundation grouting were rewritten to be
consistent between the various dam types. References to the sizing of outlet works
were consolidated under the section on intake and outlet works. The references to
typical costs for mechanical items were moved from the design guidelines to
Section 5.9.

Pre-feasibility Study into Measures to Improve the Management of the Lower Orange River FINAL
DAM DEVELOPMENT OPTIONS – VOLUME 1 MARCH 2005 33
The sizing guidelines adopted for the walls of embankment dams and mass concrete
dams are shown in Table 2.1 and Table 2.2.
Table 2.1: Embankment Dams: Sizing Guidelines

Pre-feasibility Study into Measures to Improve the Management of the Lower Orange River FINAL
DAM DEVELOPMENT OPTIONS – VOLUME 1 MARCH 2005 34
Table 2.2: Mass Concrete Dams: Sizing Guidelines
Pre-feasibility Study into Measures to Improve the Management of the Lower Orange River FINAL
DAM DEVELOPMENT OPTIONS – VOLUME 1 MARCH 2005 35
2.3 Changes made to the Costing Models
2.3.1 Introduction
Simple spreadsheet models, each comprising a bill of rates, were prepared for first
pass pricing of the following dam types:
• Earthfill embankment dams;
• Rockfill embankment dams;
• Mass concrete dams; and
• Rollcrete dams.
The cost models were standardised, with one page measuring direct cost items, and
one page for Preliminary and General Items and items for design, supervision and
contingencies.
2.3.2 Review of Costing
2.3.2.1 Sources of Information
The following sources of information were used. The reasons for using the source,
as well as the pitfalls with regard to the unit prices are also given:
Maguga Dam
Maguga Dam is a 115 m high clay core rockfill dam on the Komati River in Swaziland.
It was completed in February 2002.
The latest payment certificate (No. 44) was used, being a fair representation of the
final value of the project. As the tender prices were very keen at the time, the unit
rates are considered to be low. The value of any variations or claims particular to a
work section was therefore added to the total value of that section to arrive at a more
realistic cost.
Mohale Dam
Mohale Dam is a 145 m high concrete-faced rockfill dam on the Sengunyane River in
Lesotho. It was completed in March 2002.

Pre-feasibility Study into Measures to Improve the Management of the Lower Orange River FINAL
DAM DEVELOPMENT OPTIONS – VOLUME 1 MARCH 2005 36
The original priced bill of quantities of the awarded contract was used. There were
very few claims or variations on this contract. The contractor was also already “on
site”, which would have had a significant influence on some of the rates, especially
the rate for placing the rockfill.
Injaka Dam
The Injaka Dam is a 53 m high earthfill dam on the Marite River in Mpumalanga. It
was completed in 2001.
The latest payment certificate was used as there are major variations and claims on
the original bill of quantities (R67 million out of R216 million, which have a substantial
influence on the unit rates). It is also interesting to note that, although this dam
seems to have a major earthfill embankment, the cost of the earthfill section is
relatively small in relation to the total cost, being only 14%. Should some of the cost
in the “Miscellaneous” (20%) or “Preliminary and General” (46%) sections be
allocated to the unit rates of the earthfill, these rates would be more realistic.
Matsoku Weir
The Matsoku Weir is a 19 m high mass gravity concrete structure on the Matsoku
River in Lesotho. It was completed in October 2002.
The latest payment certificate (No. 54) was used, being a fair representation of the
final value of the project. As the tender prices were very keen at the time, the unit
rates are considered to be on the low side. The contract also included the Matsoku
Tunnel to Katse Dam and is therefore not considered to be completely representative
of a dam project. In particular the “P & G” section comprised 176% of the unit rate
sections.
Bivane (Paris) Dam
The Bivane (Paris) Dam is a 68 m high concrete arch dam on the Bivane River in
Kwazulu-Natal. It was completed in the year 2000.
Pre-feasibility Study into Measures to Improve the Management of the Lower Orange River FINAL
DAM DEVELOPMENT OPTIONS – VOLUME 1 MARCH 2005 37
The third-lowest tender was used as the awarded tender does not provide realistic
values. The contractor and the owners are still busy with litigation more than 2 years
after completion of the contract. This tender (the 3rd lowest) was also the one
recommended to the owners of the dam. With regard to the unit prices from this
document, the following was kept in mind:
• The site is perfectly suited for an arch dam.
• Prices for the foundation excavation and formwork were higher than for gravity
dams due to the difficult access and the general complexities involved with an
arch dam.
2.3.2.2 Methodology
The following methodology was applied:
• All items in each document were classified according to the items used in the
VAPS document. Those items that did not fall under any specific item were
classified under “Miscellaneous”.
• A weighted average was then determined for the unit rates of each item.
• Finally, using the unit rates determined and the percentages for items such as
Landscaping, Miscellaneous and Preliminary and General, the total cost of a
selection of the projects was tested using the applicable cost model compared to
the actual cost to make sure that all costs were included in the unit rates and the
percentages.
2.3.2.3 Updating of VAPS Rates
The unit rates in the VAPS cost models were escalated to April 2004 by using high
plant component indices for the embankment dams and high material indices for the
concrete dams. These rates were then compared to the rates developed above and
appropriate values were selected for inclusion in the LORMS cost models.
Pre-feasibility Study into Measures to Improve the Management of the Lower Orange River FINAL
DAM DEVELOPMENT OPTIONS – VOLUME 1 MARCH 2005 38
3. IDENTIFICATION OF DAM SITES
3.1 Purpose of Sub-Task
The purpose of this sub-task is:
• To mark up all the relevant options identified in the ORRS on the 1:50 000
topographical maps (the study area of the ORRS that was considered to be of
relevance to the LORMS, was taken as the area downstream of Vanderkloof
Dam).
• To identify any new options to the west of the 20° longitude along the common
border between South Africa and Namibia (i.e., in addition to those already
identified in the ORRS).
• To identify a potential dam site on the Fish River, the reservoir characteristics of
which were required for input into the hydrological model of the LOR.
3.2 Methodology
3.2.1 Options Upstream of the Common Border
Details on the potential development options identified in the ORRS were obtained
from the chapter “Potential Dam Development and Hydro Power Options” of the
ORRS Study.
3.2.2 Options along the Common Border
The initial identification of potential dam sites along the common border was done
with a view to identify all options from a topographical perspective only. Other factors
were evaluated during the pre-screening phase.
The following factors were considered in the identification of potential dam sites along
the common border:
• The width of the valley.
• The suitability of the site for the construction of an auxiliary by-wash or off-
channel spillway (a dam on the LOR would have to be able to pass floods in
excess of 25 000 m3/s).

Pre-feasibility Study into Measures to Improve the Management of the Lower Orange River FINAL
DAM DEVELOPMENT OPTIONS – VOLUME 1 MARCH 2005 39
• The height to which a dam could be constructed before water starts spilling over
into adjacent areas, thereby by-passing the dam.
The following factors were not taken into account at this stage, but were considered
in more detail in the next investigation stage as is reported in Section 5:
(1) Potential storage capacity.
(2) Whether a smaller dam (i.e., a re-regulating dam) or larger dam (i.e., to increase
the yield of the system) was required.
(3) Proximity to other identified sites.
(4) All impacts, such as:
• Inundation of land, whether it was developed or not;
• Inundation of road, rail and other infrastructure;
• Inundation of towns and villages;
• Inundation of sites of historical or archaeological interest;
• etc.
3.2.3 Options on the Fish River
The following factors were considered in the identification of a potential dam site on
the Fish River:
• To maximise the value of the dam, it had to be as close to the confluence with the
Orange River as possible in order to utilise the available run-off.
• As the initial purpose of identifying a dam site on the Fish River was to determine
the reservoir characteristics for input into the hydrological model of the LOR, it
was not necessary to determine the absolute optimum site.
• It was assumed that a dam within the Ai-Ais Nature Reserve would not be
acceptable and no potential dam sites between the northern border of the
Reserve and the confluence of the Orange River were investigated.
3.3 Potential Dam Sites Identified
3.3.1 Options Upstream of the Common Border
During the Reconnaissance Phase of the ORRS, twenty-three possible development
options were identified along the Orange River. The eight options upstream of the
common border are listed in Table 3.1 below and their positions shown in
Appendices C10 to C12.
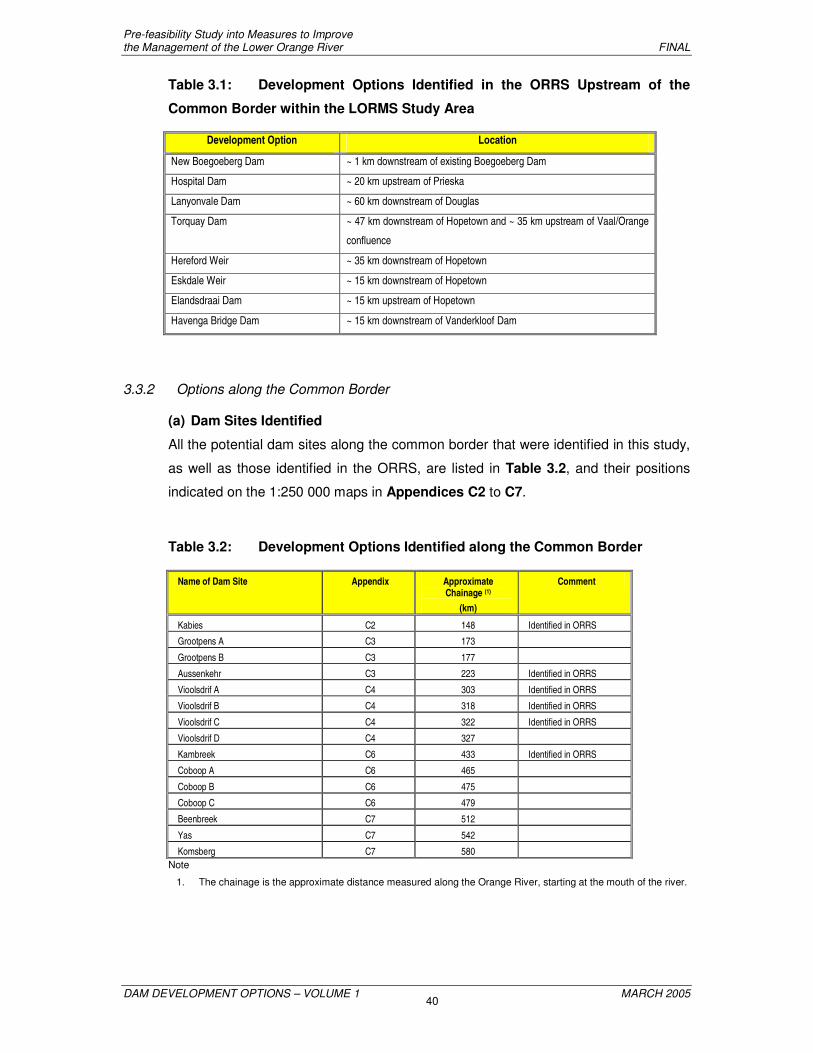
Pre-feasibility Study into Measures to Improve the Management of the Lower Orange River FINAL
DAM DEVELOPMENT OPTIONS – VOLUME 1 MARCH 2005 40
Table 3.1: Development Options Identified in the ORRS Upstream of the
Common Border within the LORMS Study Area
Development Option Location
New Boegoeberg Dam ~ 1 km downstream of existing Boegoeberg Dam
Hospital Dam ~ 20 km upstream of Prieska
Lanyonvale Dam ~ 60 km downstream of Douglas
Torquay Dam ~ 47 km downstream of Hopetown and ~ 35 km upstream of Vaal/Orange
confluence
Hereford Weir ~ 35 km downstream of Hopetown
Eskdale Weir ~ 15 km downstream of Hopetown
Elandsdraai Dam ~ 15 km upstream of Hopetown
Havenga Bridge Dam ~ 15 km downstream of Vanderkloof Dam
3.3.2 Options along the Common Border
(a) Dam Sites Identified
All the potential dam sites along the common border that were identified in this study,
as well as those identified in the ORRS, are listed in Table 3.2, and their positions
indicated on the 1:250 000 maps in Appendices C2 to C7.
Table 3.2: Development Options Identified along the Common Border
Name of Dam Site Appendix Approximate Chainage (1)
(km)
Comment
Kabies C2 148 Identified in ORRS
Grootpens A C3 173
Grootpens B C3 177
Aussenkehr C3 223 Identified in ORRS
Vioolsdrif A C4 303 Identified in ORRS
Vioolsdrif B C4 318 Identified in ORRS
Vioolsdrif C C4 322 Identified in ORRS
Vioolsdrif D C4 327
Kambreek C6 433 Identified in ORRS
Coboop A C6 465
Coboop B C6 475
Coboop C C6 479
Beenbreek C7 512
Yas C7 542
Komsberg C7 580 Note
1. The chainage is the approximate distance measured along the Orange River, starting at the mouth of the river.
Pre-feasibility Study into Measures to Improve the Management of the Lower Orange River FINAL
DAM DEVELOPMENT OPTIONS – VOLUME 1 MARCH 2005 41
(b) Basis of Identification as a Potential Dam Site
(1) Sites between Oranjemund and the confluence of the Fish River:
• The Kabies site is situated downstream of the confluence of the Fish and
Orange Rivers, and was identified in the ORRS. Due to the wide valley at
the site, the site has poor characteristics compared to the other sites
identified on the Orange River, but is the best site downstream of the
confluence.
(2) Sites between the confluence of the Fish River and Vioolsdrif / Noordoewer:
• The Grootpens A and B sites were selected on the basis of the river valleys
being relatively narrow at the sites.
• The Aussenkehr site was identified in the ORRS.
(3) Sites between Vioolsdrif / Noordoewer and Onseepkans:
• The Vioolsdrif A, B and C sites were identified in the ORRS.
• The Vioolsdrif D site was identified in this (the LORMS) Study as the site
appears to be narrower than the A, B or C sites.
• The Kambreek site was identified in the ORRS.
• The Coboop A, B and C sites were identified because of the relatively narrow
widths of the valleys at the sites.
(4) Sites between Onseepkans and 20o longitude:
• Twenty-four dam sites were investigated over the reach between the
20o longitude and Onseepkans at Beenbreek, Naros, Warmbad, Ondermatje,
Yas, Stolzenfels, Skuitdrif, Narries and Komsberg.
• The Komsberg Dam site was selected as a potential site as it has a relatively
narrow valley (e.g., narrower than that of the Vioolsdrif A site).
• The topography of the Yas and Beenbreek sites offers the possibility of
constructing by-wash or off-channel spillways (depending on the required
elevation for the spillway).
• The other sites were all eliminated due to larger cross-sectional areas than
the above sites.

Pre-feasibility Study into Measures to Improve the Management of the Lower Orange River FINAL
DAM DEVELOPMENT OPTIONS – VOLUME 1 MARCH 2005 42
3.3.3 Options on the Fish River
The Fish River runs in a relatively narrow gorge over much of the reach between
Keetmanshoop and the confluence with the Orange River. A site was selected at
Koubis, immediately upstream of the Ai-Ais Nature Reserve, as being representative
of typical sites in the area to provide reservoir characteristics for input into the
hydrological model of the LOR. If the initial runs of the hydrological model indicated
that a dam on the Fish River could be attractive in the regional context, further
investigations to optimise the selection of the site would have been carried out.
The location of the Koubis Dam site is shown on the 1:500 000 map in
Appendix C13.

Pre-feasibility Study into Measures to Improve the Management of the Lower Orange River FINAL
DAM DEVELOPMENT OPTIONS – VOLUME 1 MARCH 2005 43
4. ENVIRONMENTAL CONSIDERATIONS AND EXISTING
INFRASTRUCTURE
4.1 Introduction
Before Task 4.1b (Pre-screening of Development Options) could be undertaken,
background data had to be obtained on the environmental considerations associated
with, as well as the existing infrastructure that could be affected by the proposed
options. The following pre-screening factors were investigated and are reported on in
this section:
• Reaches of ecological importance and sensitivity.
• Areas of archaeological and historical interest.
• Presently cultivated land or land that could potentially be cultivated in future, and
which will be inundated due to dam development.
• Land over which various mining and prospecting licenses had been issued, and
for which the licensees would have to be compensated for areas that would be
inundated.
• Roads and bridges across the river that would possibly have to be re-routed.
• Towns and villages that would be inundated.
• National Parks.
• Powerlines across the river that would possibly have to be re-routed.
4.2 Ecological Importance and Sensitivity of the Lower Orange River
In the execution of Task 5 (Environmental and Social Issues), a report was prepared
by the Consultant titled “The Ecological Importance and Sensitivity of the Lower
Orange River Downstream of 20o Longitude to the Orange-Fish River Confluence”.
Sections of the report, which are relevant to the Dam Development Options task, are
summarised in the paragraphs below. For more detailed information, the above
report should be consulted.
4.2.1 River Flow
The median monthly flows in the previously termed Middle Orange River, with
Boegoeberg Dam as point of reference, were calculated, using data from 1914 to
1989. The Orange River System’s natural flow patterns showed an 82% summer
(October to May) / 18% winter (May to October) distribution.
Pre-feasibility Study into Measures to Improve the Management of the Lower Orange River FINAL
DAM DEVELOPMENT OPTIONS – VOLUME 1 MARCH 2005 44
Since the Vanderkloof Dam became operational in 1977, the natural flow regime of
the Middle Orange River has become greatly dampened, changing to a
59% summer / 41% winter flow distribution. Together with the Gariep Dam, the
Vanderkloof Dam also has a dampening effect on floods in the LOR as these two
impoundments are capable of totally or partially absorbing the minor to medium
floods required for ecological/environmental maintenance.
4.2.2 Issues of Concern in respect of Dam Construction in the Orange River Reach from
20o Longitude to the Orange-Fish River Confluence
4.2.2.1 Physico-chemical Effects of an Impoundment on a River
Medium to large impoundments normally display thermal stratification during summer,
e.g., an epilimnion (warm, productive, upper water layer), a thermocline (transitional
layer) and a hypolimnion (cold, mainly unproductive bottom water layer). During
winter, thermal stratification is much less pronounced, to completely absent in such
an impoundment. The depth and productivity of the epilimnion depends to a large
extent on the transparency/turbidity of the water in the impoundment. Being the
impoundment’s productive layer, a lot of physico-chemical (temperature, oxygen
content, pH, etc.) and biological (plankton production) modifications to the incoming
river water occur in the impoundment’s epilimnion. This can result in major
differences in the epilimnetic layer’s physico-chemical and biological character in
comparison with the downstream river water. This situation is aggravated by mineral
accumulation in the impoundment, which, in combination with the extreme
evaporation rates along the study area route, can lead to serious deterioration in
water quality (impoundment and downstream river) and even to eutrophication. On
the other hand, the impoundment’s hypolimnetic water is usually much colder, and
also poorer in oxygen content than the downstream river water. Water releases,
whether epi- or hypolimnetic, from such an impoundment to the downstream river
during summer can therefore send a host of physico-chemical and biological shocks
through the river stretch, which will negatively impact on the downstream biota.
Waterfalls and rapids are extremely important in replenishing the oxygen lost from the
riverine environment by water abstraction and the high temperatures characteristic of
the entire study area. This should definitely receive serious attention during dam site
selection, as inundation of such river phenomena will have detrimental effects on the
riverine biota.

Pre-feasibility Study into Measures to Improve the Management of the Lower Orange River FINAL
DAM DEVELOPMENT OPTIONS – VOLUME 1 MARCH 2005 45
Dam construction and river regulation usually lead to increases in riparian agricultural
activities, especially irrigation (catchment utilisation). This, in turn, will inevitably lead
to agricultural pollution resulting in changes to the river oxygen content, pH, turbidity
and conductivity.
Riverbed degradation resulting from suspended solid precipitation caused by the
combination of low flows (river regulation), high evaporation rates and high mineral
content (agricultural and other pollution) leads to aquatic habitat degradation, which
could be detrimental to the survival of certain indigenous, including endemic,
organisms, while being promotive to the unwanted establishment of other indigenous,
as well as alien organisms.
4.2.2.2 Effects of an Impoundment on the Riverine Biota
• Vegetation
The technically pristine inland deltas and shoreline and island vegetation along
the inaccessible floodplain stretches of the study area’s main river channel will be
threatened by dam construction as these stretches’ mountainous character
provides ideal dam sites. This will result in their being inundated. These river
stretches should rather be considered for conservation because of their value as
vegetation benchmarks and habitat for stream preferring aquatic organisms. On
the other hand, lower, stabilised water flow volumes will negatively affect natural
shoreline and island vegetation communities downstream of a major dam. This,
in turn, will result in riverbank destabilisation.
Increasing river regulation and catchment utilisation will result in increases in
filamentous Phycophytes and blue-green alga (algal blooms), and will also
promote habitat changes suitable for the encroachment and colonisation of plant
species such as the American floating water fern, water weeds and the river reed.
This, in turn, will promote the habitat possibilities and further artificial distribution
of certain economically important invertebrate pest species, as well as Red Billed
Quelea, of which individuals have already been observed as far downstream as
the Orange River mouth. It will also create habitat advantageous to certain fish
species (indigenous and alien), while negatively affecting others (certain endemic
and indigenous ones).

Pre-feasibility Study into Measures to Improve the Management of the Lower Orange River FINAL
DAM DEVELOPMENT OPTIONS – VOLUME 1 MARCH 2005 46
• Freshwater invertebrates
It can be expected that further river regulation will enhance habitat possibilities for
economically important invertebrates such as Blackflies, the snail intermediate
hosts of Bilharzia and Fluke spp., mosquito’s, etc. Certain free-living aquatic
invertebrates might also gradually make their appearance. Together with
increasing parasite infestations amongst the fish populations, they can serve as
indicators of water quality deterioration. It will therefore be absolutely necessary
to involve aquatic invertebrate specialists in possible further river regulation
investigations.
• Freshwater fish species
The key freshwater fish species of major concern in respect of dam construction
in the LOR stretch between 20º longitude and the Orange-Fish confluence are
listed in Table 4.1.
Table 4.1: Key Freshwater Fish Species Expected to be affected by Dam
Construction in the LOR Stretch between 20º Longitude and the Orange-Fish
Confluence
Common Name Status
Endemic Indigenous Vulnerable Red Data
Namaqua Barb X X
Largemouth Yellowfish X X
Rock Catfish X X
Smallmouth Yellowfish X
Orange River Mudfish X
Threespot Barb X X
Straightfin Barb X X
Five of the six endemic Orange River System (ORS) fish species occur in this river
section, of which one, the Namaqua Barb, is unique to the Orange River section
between Aughrabies Falls and the Orange River Mouth. Three of the five endemic
species, namely the Namaqua Barb, Largemouth Yellowfish and Rock Catfish are
Red Data listed. Although the other two endemic species, namely the
Smallmouth Yellowfish and Orange River Mudfish, are fairly abundant and thus
appear not to be threatened, they remain of concern because of their endemic status.

Pre-feasibility Study into Measures to Improve the Management of the Lower Orange River FINAL
DAM DEVELOPMENT OPTIONS – VOLUME 1 MARCH 2005 47
For instance, in the Orange River stretch between Vanderkloof Dam and the Orange-
Vaal confluence, it appears that the Orange River Mudfish populations are
approaching “bottle-neck” situations as a result of the extreme effects of river
regulation in this river section. On the other hand, in the over-extended Lower Vaal
River (Vaalharts Weir to Orange-Vaal Confluence) the Smallmouth Yellowfish
populations also appear to be approaching “bottleneck” situations.
Although the Threespot Barb and the Straightfin Barb are not endemic species, their
relatively low numbers thus far, recorded from the Orange River section between
Augrabies Falls and the Orange River Mouth, make them vulnerable to changes in
the main river channel. Their indigenous status in the river section makes it important
biotic components of the river section’s total ecology. As in the case of endemic
species, any threat to an indigenous species is indicative of negative impacts on the
ecosystem. For instance, siltation of rapids in the Lower Vaal River (Vaalharts Weir
to Orange-Vaal Confluence) resulted in the Threespot Barb nearing extinction in this
river section.
4.2.2.3 Impacts of Dams/Large Weirs on the Aquatic Biota of Rivers
• Dams/large weirs form major migration barriers resulting in genetic
compartmentalisation and inbreeding of aquatic populations. This enhances the
manifestation of poor genetic characteristics, weakening populations and
sometimes leading to extinction. It is therefore extremely important to consider
fishways as integral parts of dam/weir construction in river courses in order to
maintain genetic diversity within aquatic populations. It must be kept in mind that
there is more in a fishway than only providing for aquatic organisms to cross the
artificial barrier.
• Because thermal stratification is rather characteristic of large dams, structures for
downstream water releases should be designed to allow for mixing in order to
minimise physico-chemical shocks in the downstream river section.
• The height of a dam wall determines the length of the resulting inundated river
stretch, as well as the size of the impoundment’s surface area, which includes
peripheral land and tributary stretches to be submerged. Because the ORS is
poor in indigenous freshwater fish species diversity, and 12 out of the
15 indigenous ORS freshwater fish species, including one unique Red Data listed
endemic Namaqua Barb, one unique indigenous (River Sardine), two endemic
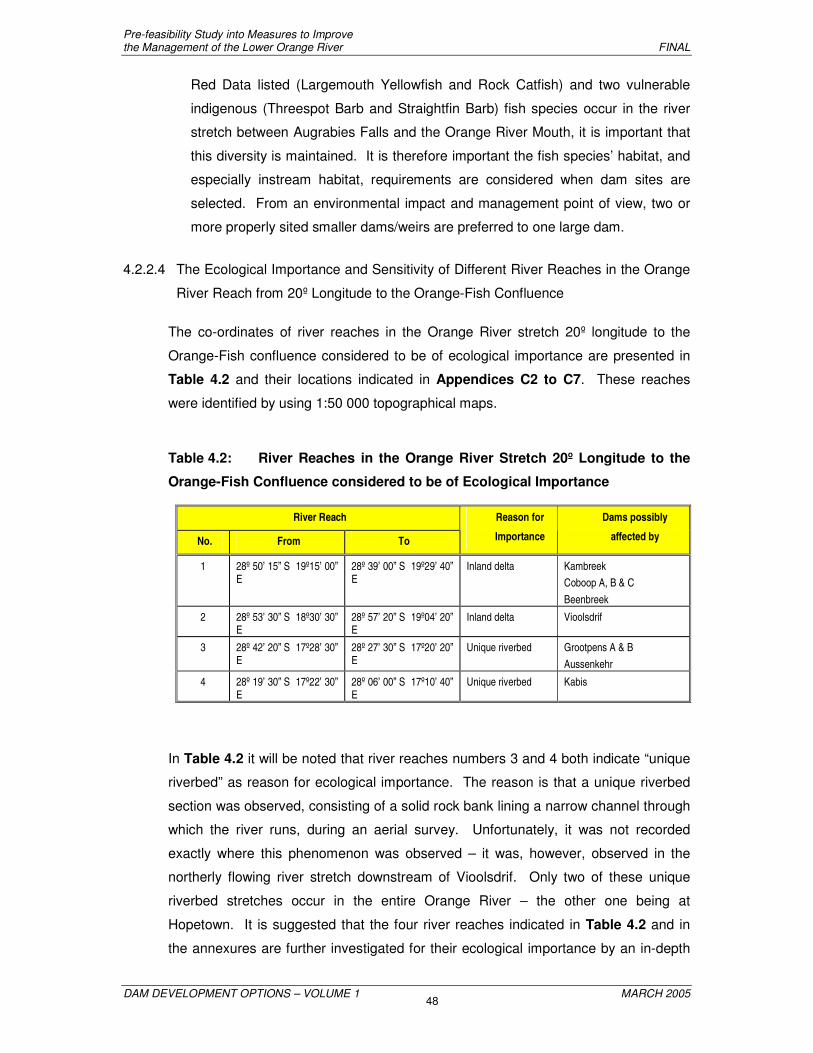
Pre-feasibility Study into Measures to Improve the Management of the Lower Orange River FINAL
DAM DEVELOPMENT OPTIONS – VOLUME 1 MARCH 2005 48
Red Data listed (Largemouth Yellowfish and Rock Catfish) and two vulnerable
indigenous (Threespot Barb and Straightfin Barb) fish species occur in the river
stretch between Augrabies Falls and the Orange River Mouth, it is important that
this diversity is maintained. It is therefore important the fish species’ habitat, and
especially instream habitat, requirements are considered when dam sites are
selected. From an environmental impact and management point of view, two or
more properly sited smaller dams/weirs are preferred to one large dam.
4.2.2.4 The Ecological Importance and Sensitivity of Different River Reaches in the Orange
River Reach from 20º Longitude to the Orange-Fish Confluence
The co-ordinates of river reaches in the Orange River stretch 20º longitude to the
Orange-Fish confluence considered to be of ecological importance are presented in
Table 4.2 and their locations indicated in Appendices C2 to C7. These reaches
were identified by using 1:50 000 topographical maps.
Table 4.2: River Reaches in the Orange River Stretch 20º Longitude to the
Orange-Fish Confluence considered to be of Ecological Importance
River Reach
No. From To
Reason for
Importance
Dams possibly
affected by
1 28º 50’ 15” S 19º15’ 00” E
28º 39’ 00” S 19º29’ 40” E
Inland delta Kambreek Coboop A, B & C Beenbreek
2 28º 53’ 30” S 18º30’ 30” E
28º 57’ 20” S 19º04’ 20” E
Inland delta Vioolsdrif
3 28º 42’ 20” S 17º28’ 30” E
28º 27’ 30” S 17º20’ 20” E
Unique riverbed Grootpens A & B Aussenkehr
4 28º 19’ 30” S 17º22’ 30” E
28º 06’ 00” S 17º10’ 40” E
Unique riverbed Kabis
In Table 4.2 it will be noted that river reaches numbers 3 and 4 both indicate “unique
riverbed” as reason for ecological importance. The reason is that a unique riverbed
section was observed, consisting of a solid rock bank lining a narrow channel through
which the river runs, during an aerial survey. Unfortunately, it was not recorded
exactly where this phenomenon was observed – it was, however, observed in the
northerly flowing river stretch downstream of Vioolsdrif. Only two of these unique
riverbed stretches occur in the entire Orange River – the other one being at
Hopetown. It is suggested that the four river reaches indicated in Table 4.2 and in
the annexures are further investigated for their ecological importance by an in-depth

Pre-feasibility Study into Measures to Improve the Management of the Lower Orange River FINAL
DAM DEVELOPMENT OPTIONS – VOLUME 1 MARCH 2005 49
aerial photograph study and/or an aerial survey. Aerial photographs of typical
sections of a ‘unique riverbed’ and of an ‘inland delta’ are indicated in Appendix C8.
4.3 Report on the Heritage Sensitivity of the South African Side of the
Orange River Downstream of 20o Longitude
4.3.1 Introduction
As part of Task 5, the Archaeology Contracts Office of the University of Cape Town
was appointed by the Consultant to conduct a literature and information review to
establish the archaeological sensitivity of the LOR from immediately west of
Augrabies National Park to the confluence of the Orange and Fish Rivers
(South African territory only). The purpose of the study was to provide input into
screening of potential options for a dam.
4.3.2 Method
No fieldwork was conducted during this study, and the findings described in the report
were based on reliable anecdotal observations by other archaeologists, published
documents, dissertations and unpublished reports and papers.
4.3.3 Restrictions
Despite fairly exhaustive enquiries, information with respect to the study area was
virtually non-existent. Virtually every area that has been subject to any research lies
outside the study area. There are no site records and no one has completed any
formal documented surveys. The information available is limited to a few casual
observations on sites that have not been mapped or afforded reliable co-ordinates.
The archaeology of the study area is to all intents and purposes, unexplored and
unknown.
4.3.4 Available Information
4.3.4.1 Area between the Mouth of the Orange River and the Richtersveld
All reliable observations are restricted to the area between the mouth of the Orange
to the Richtersveld West, including the confluence of the Fish and Orange Rivers.

Pre-feasibility Study into Measures to Improve the Management of the Lower Orange River FINAL
DAM DEVELOPMENT OPTIONS – VOLUME 1 MARCH 2005 50
Between 1996 and 2002, surveys were conducted in diamond mining concession
areas in the Richtersveld. This resulted in some 40 km of a 1 km wide strip of the
southern bank of the river (between Sendelings Drift and Baken) being surveyed in
detail, revealing the presence of Early, Middle and Late Stone Age archaeological
material. The following kinds of sites were located:
• Early Stone Age sites, found in and on river gravel terraces and even noted a
considerable distance from the river on the Namibian side within the Sperrgebiet.
• Scattered Middle Stone Age material, found on river terraces, on ridges
overlooking the river as well as on the higher slopes of hills.
• Late Stone Age sites, mostly confined to riverine silt bodies. A number of herder
sites were located, some of which have been radiocarbon dated and sampled.
Also present are Mid-Late Holocene sites, one of which contain a microlihic
industry and have been radio-carbon dated to circa 3000 BC.
• Rock Engravings, prolific within the river valley and tributaries. Most of these
are etched onto blue dolomite. The designs tend to be abstract, yet consistent.
Human and animal figure are rare but present. The age of the engravings is
unknown. Some appear to be fairly fresh while others are so worn and patinated
that they must be of considerable age – possibly some thousands of years. The
meanings of the enigmatic designs remain unknown and their significance is
unclear.
• Historic Sites, including the foundations of the historic mission church at
Sendelings Drift, places on the river where early copper mines in the Richterveld
shipped copper ore onto river barges for transport down river. The stone burial
mounds of Nama herders were noted throughout the study area.
• Ethno-archaeological Sites, consisting of the remains of herder encampments
that are not necessarily protected by heritage legislation, but are important as
they are the last physical remnants of a traditional lifestyle that is thousands of
years old and rapidly changing in the 21st century. These sites are of interest to
anthropologists, ethno-archaeologists and architects who have mapped and
documented the layout of these encampments in attempts to understand changes
and traditional values within Nama society.

Pre-feasibility Study into Measures to Improve the Management of the Lower Orange River FINAL
DAM DEVELOPMENT OPTIONS – VOLUME 1 MARCH 2005 51
4.3.4.2 Area Immediately West of Augrabies Falls
The area immediately west of the Augrabies Falls has been subject to archaeological
research by means of informal surveys, which have been conducted within the
National Park and on river-bordering farms in the Kakamas area.
Information obtained from the SAHRA library indicates that there are various sites of
historical and archaeological interest at the places indicated in Table 4.3.
Table 4.3: South African Side of the Orange River: Sites of Historical and
Archaeological Interest
Site Reason for Interest
Skuitdrif Historic river crossing German military outpost built in 1901 Ruins and graves
Pella Very important regional historic site Museum Tourist attraction Catholic mission church, built in 1878 Date plantations
Onseepkans Declared National Monument Historic bridge
Goodhouse Graves and church Historic buildings
Daberas Ruins
Pofadder Historic mission station & a declared monument
Riemvasmaak Identified archaeological sites
4.3.5 An Estimation of Sensitivity
Although very little is known about the archaeology of the study area, it is bracketed
by zones where some archaeological research has been conducted. The
Richtersveld to the west is known to be very archaeologically sensitive in terms of the
unique herder sites that have been identified along its banks. This is the only area in
South Africa where these sites have been identified. Similar sites have been
identified along the Middle Orange River to the east so it would seam reasonable to
assume that the chances of such occurring within the study area is very likely.
Similarly, a variety of historical, para-historical and pre-colonial sites, ranging from
Early to Late Stone Age, can be expected.

Pre-feasibility Study into Measures to Improve the Management of the Lower Orange River FINAL
DAM DEVELOPMENT OPTIONS – VOLUME 1 MARCH 2005 52
The predicted sensitivity of the different landscape with the study area is as follows:
• Immediate river bank, silt deposits
Buried and exposed pottery and fish bone rich sites of ancestors of the Nama,
burial cairns of Nama. Experience has shown that highly sensitive areas are
often located at the confluence of tributaries leading into the Orange. Older San
and other Holocene sites have also been documented on the silt flats and in any
small rock shelters or overhangs close to the river.
• Flat rocky outcrops, especially dolerite
It is almost guaranteed that there will be rock engravings on such outcrops.
• Old river terraces, ridges
These may hold general scatters of archaeological material, especially Early and
Middle Stone age.
• Tributaries and steep sided valleys
Such areas are likely to be archaeologically sensitive, especially if they contain
shelters and overhangs, as well as pools or fountains of permanent water.
• Historic and ethnographic sites
There are likely to be encampments abandoned by Nama herders along the banks
of the river. Furthermore, within the maximum flood level, there will be historic
buildings (early farms, missions), graveyards, possible places of conflict (Anglo-Boer
war and Korana uprising).
4.3.6 Conclusions
The following conclusions were made in the report:
• Extrapolating what is known from localities to the east and west of the study area,
the report stated that it could reasonably be predicted that any potential dam site
within the study area will have heritage impacts.
• The Richtersveld is archaeologically rich and inundation of the river valley will
have an impact in the immediate vicinity of the river.

Pre-feasibility Study into Measures to Improve the Management of the Lower Orange River FINAL
DAM DEVELOPMENT OPTIONS – VOLUME 1 MARCH 2005 53
• The report stated that it is clear that a preliminary field assessment is going to be
necessary before any idea of the kinds of impacts that may be involved can be
gained. As a first step, a physical inspection of the area and a strategy to
“sample” portions of land representative of topography, geology and at differing
differences from the river was required to get an idea of the range of sites, their
relative density from place to place and the degree of loss that a large
development such as this will cause to the National Estate.
• Some detailed archival research may also be necessary to identify places of
conflict, as well as help establish the significance of any sites found.
4.4 Report on the Heritage Sensitivity of the Namibian Side of the Orange
River Downstream of 20o Longitude
In a report prepared for Task 5, titled “A Preliminary Archaeological Assessment of
the Lower Orange River”, J Kinahan (2003), the status of archaeological remains and
historical interest of the northern bank of the Orange River along the common border
were identified. The report states that survey data available from the mouth of the
Boom River, the mouth of the Haib River and the vicinity of Stolzenfels provides more
detailed indications of the type of archaeological remains found in the LOR valley.
The positions of the three surveyed localities in the LOR valley are indicated in
Appendices C1, C2, C4 and C7.
Based on present knowledge, the archaeological characteristics of the LOR can be
summarised as follows:
• The full (mid-) Pleistocene (Middle Stone Age) to Holocene and recent historical
sequences is represented.
• Archaeological site distributions can be predicted on the basis of landscape
associations.
• Major tributary stream confluences are important archaeological localities,
especially in the vicinity of springs and seepages.
• The present banks of the Orange River are relatively unimportant localities.
• River crossings and access routes are historically important features.
• Recent grave sites tend to be located on the banks of the Orange River.

Pre-feasibility Study into Measures to Improve the Management of the Lower Orange River FINAL
DAM DEVELOPMENT OPTIONS – VOLUME 1 MARCH 2005 54
The report states that an archaeological assessment of the LOR will provide more
detailed knowledge of an interesting, but poorly known area. It is not anticipated that
the survey would yield major archaeological finds that might present a “fatal flaw” in
any proposed development. On the contrary, an archaeological assessment of the
area is likely to record a large number of small sites indicating intermittent settlement
of the Orange River valley throughout the archaeological record. The most important
findings expected from the area would include:
• In situ Pleistocene stone artefacts in spring tufas and overbank flood deposits.
• Well-defined associations between later Pleistocene sites and resource
concentrations.
• Well-defined patterns of nomadic pastoralist stockpost location on the Orange
River and its major tributaries.
• An improved knowledge of rock engravings site distribution in this area.
• Detailed knowledge of the archaeological and historical use of river crossings as
trade routes.
• The location of recent (historical) and archaeological graves that may have to be
moved in the event of dam construction.
4.5 Cultivated Land
During the course of the investigation into water demand and management, presently
cultivated areas along the common border were recorded, and potentially irrigable
areas were identified along both the South African and Namibian sides of the border.
Refer to the report on Water Demand and Management in Task 3 for more
information on the identification and classification of cultivated land.
Much of these areas lies along the banks of the river, and may therefore be inundated
by water impounded by a dam that is constructed on the river. Refer to
Appendices C1 to C7 for the locations of the cultivated areas.

Pre-feasibility Study into Measures to Improve the Management of the Lower Orange River FINAL
DAM DEVELOPMENT OPTIONS – VOLUME 1 MARCH 2005 55
4.6 Mining and Prospecting Licenses
4.6.1 South Africa
According to the publication “The Mineral Resources of South Africa” (Council for
Geoscience, 1998), several mining activities had been or is still taking place along the
LOR.
In the section of the river downstream of Vioolsdrif, diamondiferous gravels have
been prospected or exploited in at least 40 deposits, 21 of which occur on the
South African bank of the river. Numerous pegmatites occur in the area on the farms
Steinkopf 22 and Vioolsdrif 226. Some of these pegmatites are mined sporadically by
means of hand cobbing. Fluorspar has been found in the pegmatite field developed
in the vicinity of Onseepkans.
Tungsten deposits occur in the narrow stretch of highly dissected terrain flanking the
Orange River from near Vioolsdrif to Pella. Although tungsten was first mined on an
organised basis in 1934 at Groendoorn 23 km south of Vioolsdrif, and there have
been sporadic short-lived tungsten operations in recent years, the main period of
mining activity was during World War II. A deposit of scheelite was recovered on the
farm Coboop 89 some 20 km south of Onseepkans. Tungsten was also mined on the
farm Daberas 8, some 7 km west of the 20°longitude, between 1938 and 1943.
According to the Department of Mines and Energy in Springbok, no further
prospecting licenses have been issued on the South African side of the common
border, but this should be investigated in more detail for the preferred dam site
(see Appendix C14).
4.6.2 Namibia
The areas over which mining and prospecting licenses of one kind or another have
been issued are indicated in Appendices C1 to C7. The license numbers are given
in Table 4.4. As can be seen from the maps in the appendices, licenses have been
issued over just about the whole reach of the river along the common border.
Officials of the Namibia Ministry of Mines and Energy indicated that the Ministry does
not have the authority to cancel or prevent the renewal of licenses that have been
issued, unless it can be proven that the licensee is not complying with the conditions
of the license (e.g., not actively mining or prospecting on the land for which the

Pre-feasibility Study into Measures to Improve the Management of the Lower Orange River FINAL
DAM DEVELOPMENT OPTIONS – VOLUME 1 MARCH 2005 56
license has been issued). Mining and prospecting licenses could therefore be
considered in the same category as water and property rights, that is the owners and
licenses holders have to be financially compensated if they have to give up their
rights.
Table 4.4: Mining and Prospecting Licenses Issued
License No. Type
2557
2963
2744
2610
2628
2844
3049
3050
2101
2656
2337
2228
Exclusive prospecting license
2278 Mineral deposit retention license
2857
2989
2751
3046
3034
3027
2872
2912
Exclusive prospecting license
Note:
This table reflects the status on 7 October 2002 of licenses issued by the Ministry of Mines and Energy (Namibia)
4.7 Roads and Bridges
A number of bridges across the Orange River link Namibia and South Africa.
The extent to which these bridges and their approaches will be inundated by any
dams constructed on the river will depend on the full supply levels of the dams.
The bridges are listed in Table 4.5 below.
Table 4.5: Bridges across Orange River along the Common Border
Location
Name of bridge Distance from river mouth (km)
Dams that may result in the bridges being
inundated
Oranjemund / Alexander Bay 10 (none)
Vioolsdrif / Noordoewer 275 (none)
Onseepkans 493 Kambreek
Coboop A, B & C
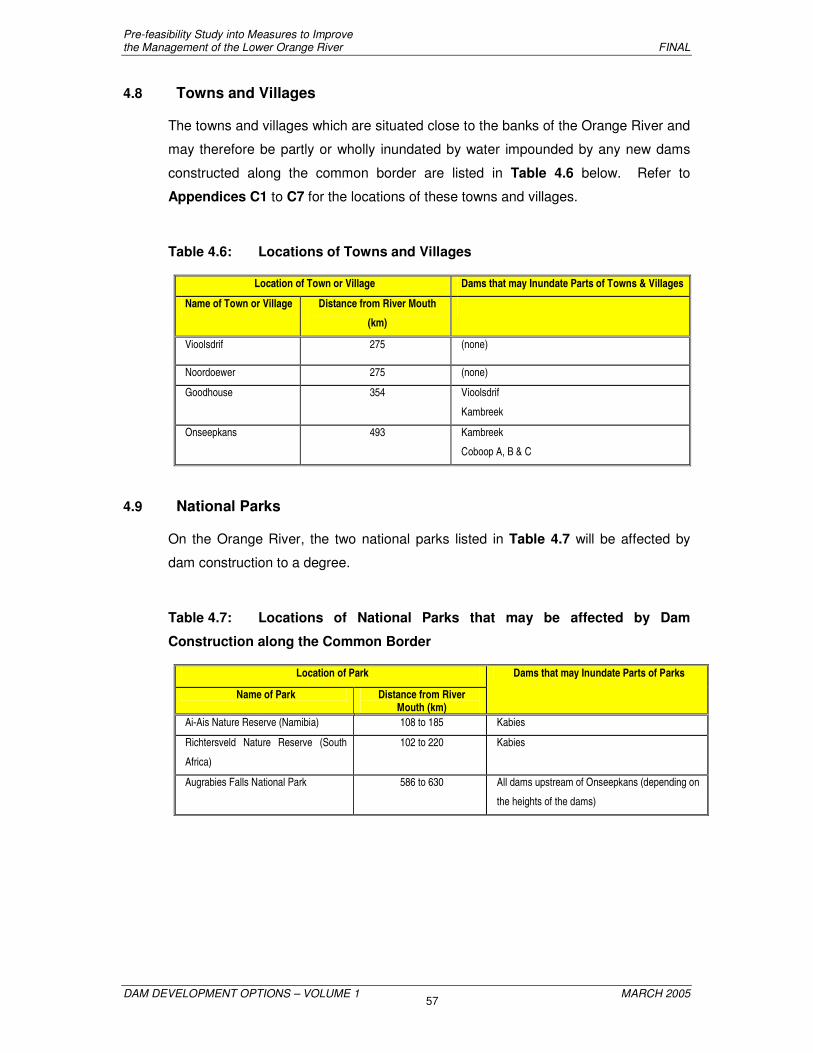
Pre-feasibility Study into Measures to Improve the Management of the Lower Orange River FINAL
DAM DEVELOPMENT OPTIONS – VOLUME 1 MARCH 2005 57
4.8 Towns and Villages
The towns and villages which are situated close to the banks of the Orange River and
may therefore be partly or wholly inundated by water impounded by any new dams
constructed along the common border are listed in Table 4.6 below. Refer to
Appendices C1 to C7 for the locations of these towns and villages.
Table 4.6: Locations of Towns and Villages
Location of Town or Village Dams that may Inundate Parts of Towns & Villages
Name of Town or Village Distance from River Mouth
(km)
Vioolsdrif 275 (none)
Noordoewer 275 (none)
Goodhouse 354 Vioolsdrif
Kambreek
Onseepkans 493 Kambreek
Coboop A, B & C
4.9 National Parks
On the Orange River, the two national parks listed in Table 4.7 will be affected by
dam construction to a degree.
Table 4.7: Locations of National Parks that may be affected by Dam
Construction along the Common Border
Location of Park
Name of Park Distance from River Mouth (km)
Dams that may Inundate Parts of Parks
Ai-Ais Nature Reserve (Namibia) 108 to 185 Kabies
Richtersveld Nature Reserve (South
Africa)
102 to 220 Kabies
Augrabies Falls National Park 586 to 630 All dams upstream of Onseepkans (depending on
the heights of the dams)
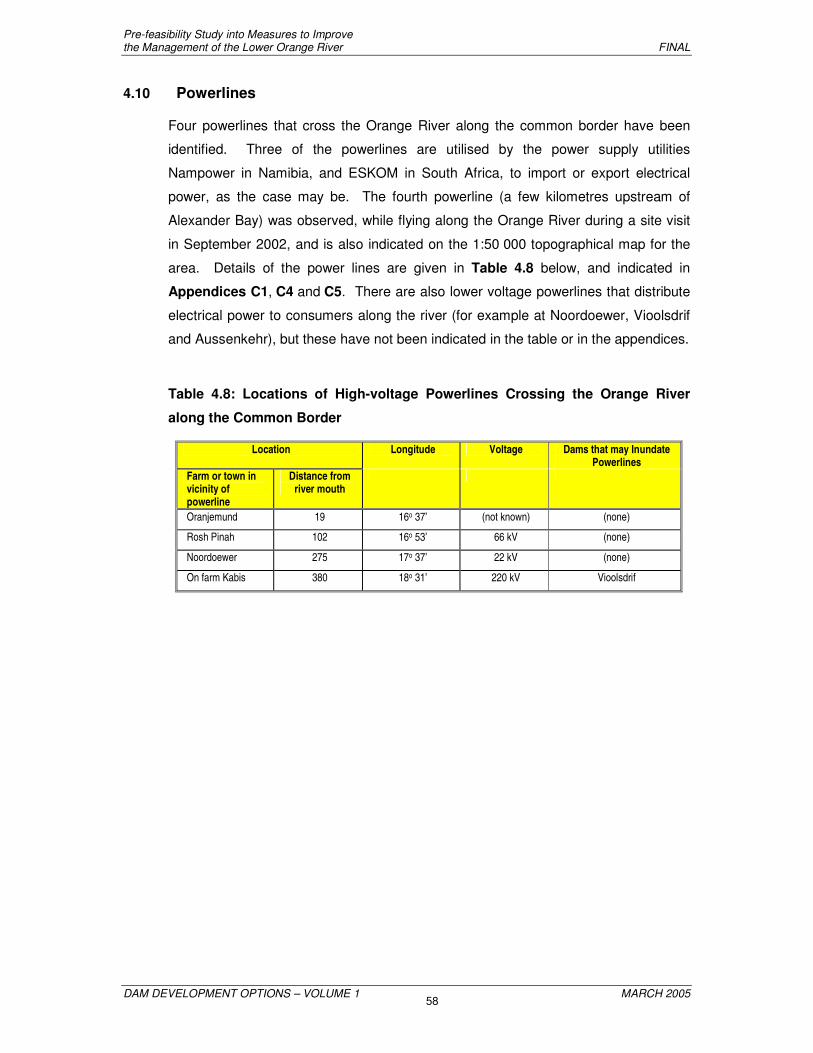
Pre-feasibility Study into Measures to Improve the Management of the Lower Orange River FINAL
DAM DEVELOPMENT OPTIONS – VOLUME 1 MARCH 2005 58
4.10 Powerlines
Four powerlines that cross the Orange River along the common border have been
identified. Three of the powerlines are utilised by the power supply utilities
Nampower in Namibia, and ESKOM in South Africa, to import or export electrical
power, as the case may be. The fourth powerline (a few kilometres upstream of
Alexander Bay) was observed, while flying along the Orange River during a site visit
in September 2002, and is also indicated on the 1:50 000 topographical map for the
area. Details of the power lines are given in Table 4.8 below, and indicated in
Appendices C1, C4 and C5. There are also lower voltage powerlines that distribute
electrical power to consumers along the river (for example at Noordoewer, Vioolsdrif
and Aussenkehr), but these have not been indicated in the table or in the appendices.
Table 4.8: Locations of High-voltage Powerlines Crossing the Orange River
along the Common Border
Location Longitude Voltage Dams that may Inundate Powerlines
Farm or town in vicinity of powerline
Distance from river mouth
Oranjemund 19 16o 37’ (not known) (none)
Rosh Pinah 102 16o 53’ 66 kV (none)
Noordoewer 275 17o 37’ 22 kV (none)
On farm Kabis 380 18o 31’ 220 kV Vioolsdrif

Pre-feasibility Study into Measures to Improve the Management of the Lower Orange River FINAL
DAM DEVELOPMENT OPTIONS – VOLUME 1 MARCH 2005 59
5. PRE-SCREENING OF DEVELOPMENT OPTIONS
5.1 Purpose of Sub-Task
This sub-task is numbered 4.1b. The purpose of this task is to evaluate the
development options identified in Task 4.1a against the specified pre-screening
factors listed below with a view to identifying the most favourable sites for the
Preliminary Design Task (Task 4.1d).
5.2 Pre-screening Factors
Factors considered in the pre-screening of the various potential dam sites include:
Site considerations:
• topography of the site and basin;
• geological conditions;
• construction materials and borrow areas;
• storage capacity potential;
• whether the dam should be a small re-regulating dam or a large storage dam;
• design floods and spillway arrangements;
• seismic characteristics;
• river diversion during construction;
• considerations with regard to site establishment; and
• access roads.
CONTRIBUTION TO THE SYSTEM YIELD
Social and environmental impacts:
• potential social impacts; and
• potential environmental impacts.
Other factors:
• proximity and location with respect to major demand centres;
• international borders;
• possibility of hydro-power generation;
• proximity to power lines;
• flooding of existing infrastructure and its relocation (including feasibility, costs and

Pre-feasibility Study into Measures to Improve the Management of the Lower Orange River FINAL
DAM DEVELOPMENT OPTIONS – VOLUME 1 MARCH 2005 60
social impacts);
• flooding of existing or potential irrigation areas;
• flooding of mining and prospecting licence areas;
• flooding of areas of archaeological importance;
• likely sedimentation rate; and
• potential effects on water quality.
5.3 Options Upstream of the Common Border
5.3.1 Potential Development Options
The eight potential development options identified in the ORRS that are of relevance
to the LORMS are listed in Table 5.1. During the ORRS, a pre-screening was
performed on these options and the reasons why they were either omitted or
recommended for further detailed analysis are also listed.
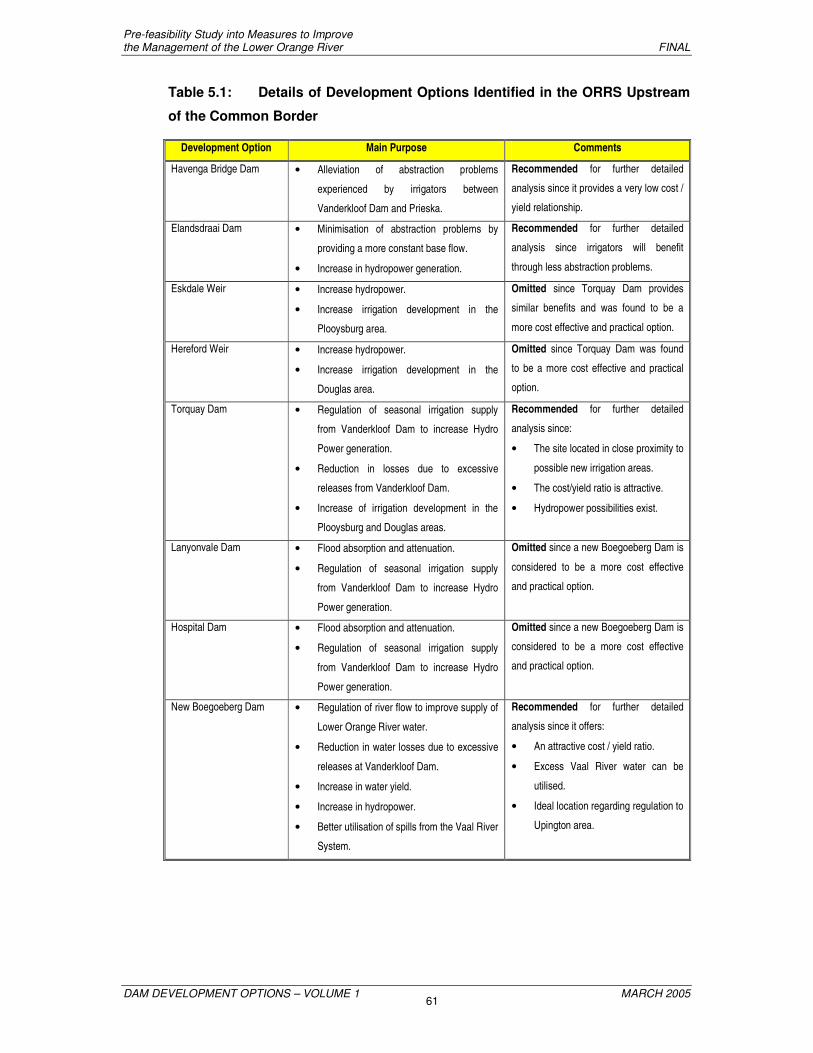
Pre-feasibility Study into Measures to Improve the Management of the Lower Orange River FINAL
DAM DEVELOPMENT OPTIONS – VOLUME 1 MARCH 2005 61
Table 5.1: Details of Development Options Identified in the ORRS Upstream
of the Common Border
Development Option Main Purpose Comments
Havenga Bridge Dam • Alleviation of abstraction problems
experienced by irrigators between
Vanderkloof Dam and Prieska.
Recommended for further detailed
analysis since it provides a very low cost /
yield relationship.
Elandsdraai Dam • Minimisation of abstraction problems by
providing a more constant base flow.
• Increase in hydropower generation.
Recommended for further detailed
analysis since irrigators will benefit
through less abstraction problems.
Eskdale Weir • Increase hydropower.
• Increase irrigation development in the
Plooysburg area.
Omitted since Torquay Dam provides
similar benefits and was found to be a
more cost effective and practical option.
Hereford Weir • Increase hydropower.
• Increase irrigation development in the
Douglas area.
Omitted since Torquay Dam was found
to be a more cost effective and practical
option.
Torquay Dam • Regulation of seasonal irrigation supply
from Vanderkloof Dam to increase Hydro
Power generation.
• Reduction in losses due to excessive
releases from Vanderkloof Dam.
• Increase of irrigation development in the
Plooysburg and Douglas areas.
Recommended for further detailed
analysis since:
• The site located in close proximity to
possible new irrigation areas.
• The cost/yield ratio is attractive.
• Hydropower possibilities exist.
Lanyonvale Dam • Flood absorption and attenuation.
• Regulation of seasonal irrigation supply
from Vanderkloof Dam to increase Hydro
Power generation.
Omitted since a new Boegoeberg Dam is
considered to be a more cost effective
and practical option.
Hospital Dam • Flood absorption and attenuation.
• Regulation of seasonal irrigation supply
from Vanderkloof Dam to increase Hydro
Power generation.
Omitted since a new Boegoeberg Dam is
considered to be a more cost effective
and practical option.
New Boegoeberg Dam • Regulation of river flow to improve supply of
Lower Orange River water.
• Reduction in water losses due to excessive
releases at Vanderkloof Dam.
• Increase in water yield.
• Increase in hydropower.
• Better utilisation of spills from the Vaal River
System.
Recommended for further detailed
analysis since it offers:
• An attractive cost / yield ratio.
• Excess Vaal River water can be
utilised.
• Ideal location regarding regulation to
Upington area.

Pre-feasibility Study into Measures to Improve the Management of the Lower Orange River FINAL
DAM DEVELOPMENT OPTIONS – VOLUME 1 MARCH 2005 62
The following options for dams upstream of the common border were carried through
to the Pre-Feasibility Phase of the ORRS:
• Torquay
• Boegoeberg
Due to time and budget constraints only the yield related options were analysed as
part of the ORRS with the result that those options intended as re-regulation options
for the hydropower releases from Vanderkloof Dam (Havenga Bridge and
Elandsdraai) were excluded from the Pre-Feasibility Phase.
5.3.2 Cost Analysis and Economic Analysis
The cost analysis of the various development options was undertaken by using the
basic principals developed for the VAPS. This included preliminary designs and cost
models for each option followed by the calculation of unit reference values (URVs).
The methodology of calculating the URVs is described in Section 9.
Quantities were taken from 1:10 000 orthophoto contoured maps or from detailed
surveys (1:2 000) if available, as well as from 1:50 000 contour maps. The economic
calculation basically determined the net present (1994) cost associated with the
capital expenditure, as well as the maintenance and operation costs. The water yield
from a specific scheme (with growth according to the future water requirements)
expressed in terms of a net present value was then used to calculate the URV of the
scheme in R/m3 yield (or c/m3). In general, the economic calculations were
performed in the following manner:
• An 8% discount rate was used (sensitivity was also evaluated with 6% and 10%
discount rates);
• The phasing of schemes, and components thereof, were scheduled in accordance
with the demand projections for the Vaal Basin and required filling times of the
major proposed dams;
• The costs of the inter-basin transfer component of the various options were only
included for the combined dam development options;
• Costs of land and betterment were included where applicable; and
• Social costs and impacts were not included in the economic assessment, but
were taken into account in the overall assessments.

Pre-feasibility Study into Measures to Improve the Management of the Lower Orange River FINAL
DAM DEVELOPMENT OPTIONS – VOLUME 1 MARCH 2005 63
The results of the analyses (excluding dams along the common border) are
summarised in Table 5.2.
Table 5.2: Single Dam Development Options considered in the Pre-
feasibility Phase of the ORRS
No. Option Purpose Net
Capacity
(mil. m3)
Capital Cost
(R.million)
Excess Yield
(mil. m3/a)
URV
(c/m3)
(@ 8%)
5a Torquay Dam 1 020 m Reduce operating
losses
50 95 115* 79
5b Torquay Dam 1 040 m Yield increase 500+ 202 70 289
5c Torquay Dam 1 050 m Yield increase 800 330 128 257
6a At existing site Boegoeberg
Dam
894 m
Reduce operating
losses
90 63 130* 49
6b New Boegoeberg Dam 894 m Reduce operating
losses
90 84 130* 65
6c New Boegoeberg Dam 909 m Yield increase 470 199 14 1444
6d New Boegoeberg Dam 920 m Yield increase 1 900 313 286 117
* Indication of the saving in operating losses which can be gained when utilising the given dam as a re-regulation dam
only
+ Required capacity at Torquay Dam to change hydro-power based releases from Vanderkloof Dam to the required
downstream irrigation demand based releases pattern
5.3.3 Conclusions of the ORRS
The ORRS concluded that most of the initial development options considered in the
Orange River Basin could be eliminated from further consideration on financial,
social, engineering or environmental grounds. Only a small number of options
remained as possible future developments, however, it was not possible to make firm
recommendations at that stage.
In all of the remaining options, it was considered necessary to create some form of
operational storage along the Orange River at either Vioolsdrif or Boegoeberg. Both
options had similar URVs and it was not possible to eliminate either of them during
the Pre-feasibility Phase of the ORRS.

Pre-feasibility Study into Measures to Improve the Management of the Lower Orange River FINAL
DAM DEVELOPMENT OPTIONS – VOLUME 1 MARCH 2005 64
5.3.4 Conclusions of the Review of the ORRS
No reason could be found to differ from the conclusion of the ORRS that the most
feasible option for the construction of a new dam upstream of the common border
was the New Boegoeberg Dam. However, the ORRS Report did not provide
sufficient motivation for the choice of the Vioolsdrif Dam as the most feasible site for
the construction of a dam along the common border. This was known beforehand
though, and is one of the reasons that the ToR states that the emphasis for the Dam
Development Options of this study (i.e., the LORMS) shall be to investigate dam sites
along the common border.
5.4 Options along the Common Border
5.4.1 Potential Development Options
For ease of reference all the potential dam sites along the common border that were
identified in this study, as well as those identified in the ORRS, are repeated
in Table 5.3. The locations are shown on the 1:250 000 maps in
Appendices C2 to C7. A preliminary pre-screening was done on these options with
a view to eliminate those options that were clearly flawed from an engineering, social
or environmental viewpoint.
Table 5.3: Potential Dam Sites identified along the Common Border
Name of Dam Site
Appendix Comments
Kabies C2 Omitted. Downstream demands too low. Inundate parts of Richtersveld National Park.
Grootpens A C3 Omitted. Inundate irrigation areas at Aussenkehr.
Grootpens B C3 Omitted. Inundate irrigation areas at Aussenkehr.
Aussenkehr C3 Omitted. Too far downstream for Vioolsdrif demands and too far upstream to capture Fish River water.
Vioolsdrif A C4
Vioolsdrif B C4
Vioolsdrif C C4
Vioolsdrif D C4
Kambreek C6 Omitted. Considered inferior to Vioolsdrif A site from engineering and geological viewpoint in ORRS.
Coboop A C6 Omitted. Low potential storage due to steep river.
Coboop B C6 Omitted. Low potential storage due to steep river.
Coboop C C6 Omitted. Low potential storage due to steep river.
Beenbreek C7 Omitted. Dam site much inferior to other sites, and low potential storage due to steep river.
Yas C7
Komsberg C7

Pre-feasibility Study into Measures to Improve the Management of the Lower Orange River FINAL
DAM DEVELOPMENT OPTIONS – VOLUME 1 MARCH 2005 65
5.4.2 Cost Analysis
In order to compare the remaining options, approximate dam cost versus height
curves as well as storage capacity curves was prepared.
Due to the fact that a dam on the LOR would have to be able to pass floods in excess
of 25 000 m3/s, only mass concrete dams were considered for the purposes of pre-
screening in order to incorporate overflow spillways in the dam structures.
The width of the particular site was measured at each contour interval using the
1:50 000 topographical maps. In most cases the contour intervals were 20 m with a
few isolated cases of 10 m intervals. These figures were entered into a spreadsheet,
as well as the all-in unit rate for mass concrete dams. The all-in rate was obtained by
multiplying the mass concrete rate from the Design and Cost Criteria in Appendix A
by a factor of 4.5 to provide an indication of the total cost of the particular dam. The
factor of 4.5 was based on the approximate ratio of concrete cost to total cost for the
Boegoeberg and Vioolsdrif Dams as presented in the ORRS Report. In this way, it
was possible to determine the cost of each ‘layer’, and therefore also the cost of the
whole wall. In order to allow for freeboard requirements, it was assumed that the total
height of the dam wall was 10 m above the full supply level (FSL).
Various ways of determining the surface areas of reservoirs were investigated, such
as:
• digitizing the contours on the 1:50 000 maps;
• by producing vector files from Digital Elevation Models (DEMs), which are
available from the Directorate: Survey and Mapping in Mowbray;
• by scanning the so-called contour separates of the 1:50 000 maps; and
• by utilizing so-called vector files in ‘dxf’ format, of the 1:50 000 topographical
maps.
As the ‘dxf’ files were available for the whole length of the Orange River along the
common border, the latter method was utilized to determine the areas between
contours by means of computer-aided draughting software.

Pre-feasibility Study into Measures to Improve the Management of the Lower Orange River FINAL
DAM DEVELOPMENT OPTIONS – VOLUME 1 MARCH 2005 66
The approximate dam cost versus height curves, as well as the storage capacity
curves was consolidated into graphs of dam cost versus storage capacity to allow
comparison between the remaining options. The graphs are shown in Figure 5-1,
Figure 5-2 and Figure 5-3, and compare the Vioolsdrif A, Yas and Komsberg sites.
The Vioolsdrif B, C and D sites were omitted from this comparison as they are
considered to be variations of the Vioolsdrif site in general, which will receive further
attention during the Preliminary Design Task if the Vioolsdrif site is selected.
The layouts and cross-sections of the Vioolsdrif A, Yas and Komsberg sites are
shown in Appendices D and E, respectively.
Figure 5-1: Capital Cost (Comparative) of Dam Construction versus Dam
Height
Figure 5-2: Reservoir Capacity versus Dam Height
0
10
20
30
40
50
60
70
80
0
100
200
300
400
500
600
700
800
900
1 00
0
1 10
0
1 20
0
1 30
0CAPITAL COST: PRE-SCREENING (R million)
HE
IGH
T TO
FS
L ( m
) Vioolsdrif
Komsberg
Yas A
0
10
20
30
40
50
60
70
80
0
500
1 00
0
1 50
0
2 00
0
2 50
0
3 00
0
RESERVOIR CAPACITY (million m3)
HE
IGH
T TO
FS
L ( m
)
Vioolsdrif
Komsberg
Yas A

Pre-feasibility Study into Measures to Improve the Management of the Lower Orange River FINAL
DAM DEVELOPMENT OPTIONS – VOLUME 1 MARCH 2005 67
Figure 5-3: Capital Cost (Comparative) of Dam Construction versus Reservoir
Capacity
5.4.3 Evaluation against Pre-screening Criteria
In order to evaluate the remaining options against all the pre-screening criteria, a
matrix was compiled as shown in Table 5.4. The table takes into account all the
potential impacts discussed in Section 4.
0
500
1 000
1 500
2 000
2 500
3 000
3 500
0
100
200
300
400
500
600
700
800
900
1 00
0
1 10
0
1 20
0
1 30
0
CAPITAL COST : PRESCREENING (R million)
RE
SE
RV
OIR
CA
PA
CIT
Y (m
illio
n m
3)
Vioolsdrif
Komsberg
Yas A

Pre-feasibility Study into Measures to Improve the Management of the Lower Orange River FINAL
DAM DEVELOPMENT OPTIONS – VOLUME 1 MARCH 2005 68
Table 5.4: Pre-screening
Pre screening Factor Dam Site
Vioolsdrif A Yas Komsberg
Site Considerations
Topography of site and basin Moderately good dam site Good dam site Very good dam site -
narrow valley
Geological conditions Only the Vioolsdrif Dam site was investigated (in the ORRS Study) and geological
conditions can therefore not be used as a factor for pre-screening purposes.
Construction materials & borrow
areas
Only the Vioolsdrif Dam site was investigated (in the ORRS Study) and this pre-screening
factor can therefore not be used as a factor for pre-screening purposes.
Storage capacity potential Potential storage capacities all exceed the maximum volume that can be utilized effectively
Small re-regulating dam or large
storage dam
All sites are suitable for either a small re-regulating dam, or a larger storage dam.
Design floods similar due to relatively great distance to main catchment areas Design floods & spillway
arrangements Mass concrete overflow Mass concrete overflow plus possible by-wash
Mass concrete overflow
Seismic characteristics All of the sites are situated in a low seismic risk area.
River diversion during construction For pre-screening purposes only mass concrete gravity dams were considered, and river diversion considerations are therefore identical.
Considerations to site establishment Not considered during pre-screening.
Access roads Access is difficult due to steep
valley sides
1:50 000 maps do not indicate roads in the immediate vicinity of the dam sites
Contribution to the system yield Considered to be similar for all sites due to negligible additional inflow from catchment
areas in the vicinity of these dam sites. Social and environmental impacts
Potential social impacts Social impacts of the individual sites were not investigated, but the social impacts of the sites should not differ from one another significantly.
Potential environmental impacts Considered relatively low Inundation of parts of the Augrabies Falls National Park
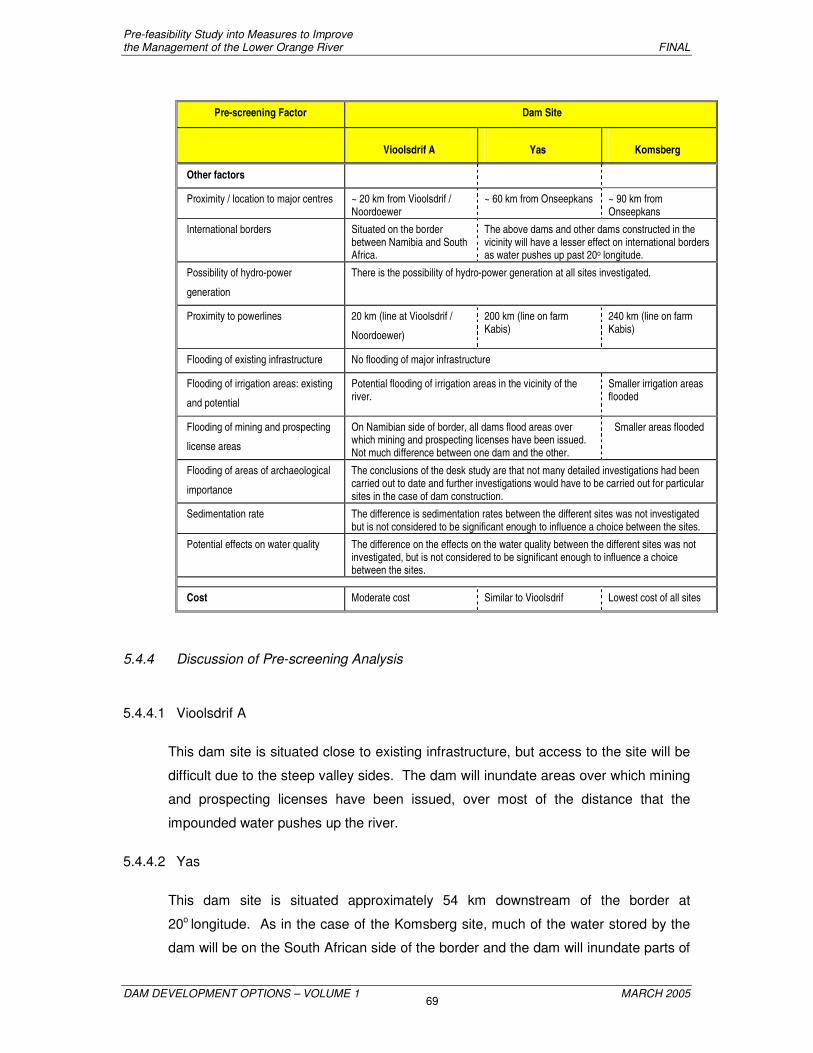
Pre-feasibility Study into Measures to Improve the Management of the Lower Orange River FINAL
DAM DEVELOPMENT OPTIONS – VOLUME 1 MARCH 2005 69
Pre-screening Factor Dam Site
Vioolsdrif A Yas Komsberg
Other factors
Proximity / location to major centres ~ 20 km from Vioolsdrif / Noordoewer
~ 60 km from Onseepkans ~ 90 km from Onseepkans
International borders Situated on the border between Namibia and South Africa.
The above dams and other dams constructed in the vicinity will have a lesser effect on international borders as water pushes up past 20o longitude.
Possibility of hydro-power
generation
There is the possibility of hydro-power generation at all sites investigated.
Proximity to powerlines 20 km (line at Vioolsdrif /
Noordoewer)
200 km (line on farm Kabis)
240 km (line on farm Kabis)
Flooding of existing infrastructure No flooding of major infrastructure
Flooding of irrigation areas: existing
and potential
Potential flooding of irrigation areas in the vicinity of the river.
Smaller irrigation areas flooded
Flooding of mining and prospecting
license areas
On Namibian side of border, all dams flood areas over which mining and prospecting licenses have been issued. Not much difference between one dam and the other.
Smaller areas flooded
Flooding of areas of archaeological
importance
The conclusions of the desk study are that not many detailed investigations had been carried out to date and further investigations would have to be carried out for particular sites in the case of dam construction.
Sedimentation rate The difference is sedimentation rates between the different sites was not investigated but is not considered to be significant enough to influence a choice between the sites.
Potential effects on water quality The difference on the effects on the water quality between the different sites was not investigated, but is not considered to be significant enough to influence a choice between the sites.
Cost Moderate cost Similar to Vioolsdrif Lowest cost of all sites
5.4.4 Discussion of Pre-screening Analysis
5.4.4.1 Vioolsdrif A
This dam site is situated close to existing infrastructure, but access to the site will be
difficult due to the steep valley sides. The dam will inundate areas over which mining
and prospecting licenses have been issued, over most of the distance that the
impounded water pushes up the river.
5.4.4.2 Yas
This dam site is situated approximately 54 km downstream of the border at
20o longitude. As in the case of the Komsberg site, much of the water stored by the
dam will be on the South African side of the border and the dam will inundate parts of
Pre-feasibility Study into Measures to Improve the Management of the Lower Orange River FINAL
DAM DEVELOPMENT OPTIONS – VOLUME 1 MARCH 2005 70
the Augrabies Falls National Park. The dam would not inundate much irrigable land,
areas of mining and prospecting licenses, towns or villages, road infrastructure, or
powerlines.
A dam at this site would have a similar cost to dams at the Vioolsdrif sites.
5.4.4.3 Komsberg
As can be seen from Appendix C7, this dam is situated approximately 7 km
downstream of the border at 20o longitude. Most of the water stored by the dam will
therefore be on the South African side of the border and the dam will inundate parts
of the Augrabies Falls National Park, which is situated along the northern side of the
river. The dam would not inundate much irrigable land, areas of mining and
prospecting licenses, towns or villages, road infrastructure or powerlines.
Based on the 1:50 000 mapping, this site was found to be the most economical site
along the common border for the construction of a dam for the range of reservoir
capacities under consideration. However, the extent of the inundation of the
Augrabies Falls National Park remained of concern.
5.4.5 Conclusions
Based on the pre-screening, the following conclusions were made:
• The Yas Dam site does not offer any significant cost benefits over the Vioolsdrif
site and will inundate parts of the Augrabies Falls National Park. It was therefore
excluded from further analysis.
• From a capital cost point of view (as defined in this report), the Komsberg site is
more cost-effective than the Vioolsdrif site for the construction of either a smaller
re-regulating dam or a larger dam to improve the yield of the system. The
allowable inundation of the Augrabies Falls National Park, however, still had to be
determined.
The nett result of the pre-screening was that both the Viooldrif A and the Komsberg
Dam sites were taken to a Decision-making Workshop, as discussed in the next
section.

Pre-feasibility Study into Measures to Improve the Management of the Lower Orange River FINAL
DAM DEVELOPMENT OPTIONS – VOLUME 1 MARCH 2005 71
6. ASSESSMENT OF PRE-SCREENED DEVELOPMENT
OPTIONS
6.1 Initial Selection
In the pre-screening process, the number of dam sites that could possibly be carried
forward to the preliminary design stage, was reduced to the following sites:
Upstream of 20o longitude (i.e., upstream of the common border):
• New Boegoeberg Dam
Downstream of 20° longitude (i.e., along the common border):
• Vioolsdrif Dam
• Komsberg Dam
These three possible options were investigated in more detail in order to make more
accurate cost estimates, determine yields and assess benefits and impacts.
The options were then evaluated at a Decision-making Workshop on 13 and
14 October 2003 by a team consisting of the Client, selected stakeholders and the
Consultant.
Prior to the workshop, the following activities were carried out on the three dams:
• A yield analysis was carried out in order to determine the required storage
capacities for specified yields (see Section 4.6 in the report titled ‘Hydrology,
Water Quality and Systems Analysis : Volume A – Systems Analysis).
• A sedimentation analysis was carried out on the New Boegoeberg and Vioolsdrif
sites in order to estimate the sedimentation volumes (see Section 7 of this
report).
• A financial analysis was carried out in order to determine the unit reference values
of the dams of various storage capacities. These were based on costing at
August 2002 prices and URVs at base year of 2003.
The pertinent data for the New Boegoeberg, Vioolsdrif and Komsberg Dam sites is
summarised in Table 6.1 and the URV calculations included in Appendix I.

Pre-feasibility Study into Measures to Improve the Management of the Lower Orange River FINAL
DAM DEVELOPMENT OPTIONS – VOLUME 1 MARCH 2005 72
Table 6.1: Pertinent Values for the Preferred Sites for Re-regulating Dams
New Boegoeberg Vioolsdrif Komsberg
Proposed dam size (million m3) 163 260 260
Unit reference value (@ 8%) (R/m3) 0,35 0,26 0,24
Saving in operational losses (million m3/a) 62 170 126
At the workshop, it was decided that the Vioolsdrif and Komsberg Dam sites were
preferred to the New Boegoeberg Dam site for the following reasons:
• Significantly lower URVs.
• Significantly larger saving in operational losses.
6.2 Komsberg Dam Site
Due to the fact that dams for all heights under consideration at the Komsberg site
would inundate parts of the Augrabies Falls National Park, it was decided that the
Komsberg site should not be considered unless there were significant cost
advantages. The cost estimates of the Vioolsdrif and New Boegoeberg Dam sites
had been done on 1:10 000 mapping with 5 m contours, whilst that of the Komsberg
Dam site was done on 1:50 000 mapping with 20 m contours. It was therefore
decided that 1:10 000 mapping should also be prepared for the Komsberg site.
Aerial photography at a scale of 1:50 000 was obtained from the Directorate: Surveys
and Mapping in Mowbray near Cape Town for Job No 1062 of 2002. A plan at a
scale of 1:10 000 was then prepared for the Komsberg Dam site.
Based on the above mapping, the quantities for the Komsberg Dam site were
recalculated. The URV for a dam with a capacity of 260 million m3 increased to
R0.28/m3.
The river bed levels downstream of the Augrabies Falls were also checked by using
the DEMs of the area. The DEMs consist of x, y and z co-ordinates on a grid of
25 x 25 m obtained from aerial photography, and is produced during the production
process of 1:10 000 orthophoto maps (no mapping is available as yet).
Pre-feasibility Study into Measures to Improve the Management of the Lower Orange River FINAL
DAM DEVELOPMENT OPTIONS – VOLUME 1 MARCH 2005 73
The river bed level at the Komsberg Dam site is at approximately RL 430.8 m
(from the 1:50 000 mapping). Above a FSL of approximately RL 432 m, water will
start pushing up into the Augrabies Falls National Park, and the rapids downstream of
the Falls will start to be inundated at levels above RL 450 m. The FSL for the
proposed re-regulating dam will be at approximately RL 446 m.
6.3 Ecological Assessment
After the Workshop, field visits were made to the Vioolsdrif and Komsberg areas in
order to carry out a vegetation study and ecological and archaeological assessments.
These studies came to the following conclusions:
6.3.1 Vegetation Study
• A dam site in the Vioolsdrif area would overall affect a less developed stretch of
riparian landscapes and habitat, but stretches of the river are invaded by alien
vegetation.
• A dam site in the Komsberg area would affect large stretches of relatively pristine
riparian woodlands, though interrupted by agricultural developments.
• Both dam options would inundate approximately 50 to 70 km of riparian habitat in
a presently little developed area, which is a major environmental impact.
6.3.2 Ecological Assessment
The ecological assessment was done to provide a coarse-level assessment, based
on readily available information, of the potential ecological implications on the LOR of
a dam situated at the Vioolsdrif and Komsberg Dam sites (the Boegoeberg Dam site
was also evaluated to provide an overall assessment).
From the assessment it was concluded that:
• All of the proposed options will have a detrimental impact on the riverine
ecosystem.
• A dam at Boegoeberg would have the least impact relative to the other options.
• A dam at Vioolsdrif would have the most impact relative to the other options,
particularly the options with the higher dam walls.
• Dams with lower dam walls have relatively less impact than those with higher dam
walls.
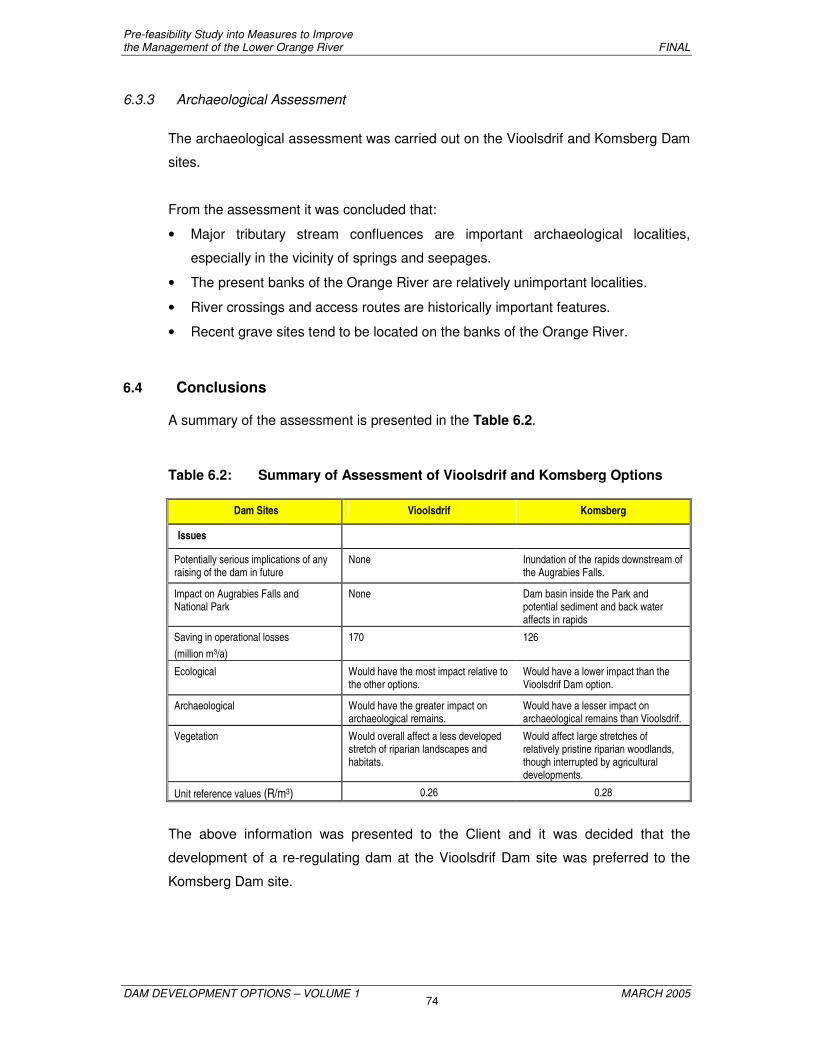
Pre-feasibility Study into Measures to Improve the Management of the Lower Orange River FINAL
DAM DEVELOPMENT OPTIONS – VOLUME 1 MARCH 2005 74
6.3.3 Archaeological Assessment
The archaeological assessment was carried out on the Vioolsdrif and Komsberg Dam
sites.
From the assessment it was concluded that:
• Major tributary stream confluences are important archaeological localities,
especially in the vicinity of springs and seepages.
• The present banks of the Orange River are relatively unimportant localities.
• River crossings and access routes are historically important features.
• Recent grave sites tend to be located on the banks of the Orange River.
6.4 Conclusions
A summary of the assessment is presented in the Table 6.2.
Table 6.2: Summary of Assessment of Vioolsdrif and Komsberg Options
Dam Sites Vioolsdrif Komsberg
Issues
Potentially serious implications of any raising of the dam in future
None
Inundation of the rapids downstream of the Augrabies Falls.
Impact on Augrabies Falls and National Park
None Dam basin inside the Park and potential sediment and back water affects in rapids
Saving in operational losses (million m3/a)
170 126
Ecological
Would have the most impact relative to the other options.
Would have a lower impact than the Vioolsdrif Dam option.
Archaeological Would have the greater impact on archaeological remains.
Would have a lesser impact on archaeological remains than Vioolsdrif.
Vegetation Would overall affect a less developed stretch of riparian landscapes and habitats.
Would affect large stretches of relatively pristine riparian woodlands, though interrupted by agricultural developments.
Unit reference values (R/m3) 0.26 0.28
The above information was presented to the Client and it was decided that the
development of a re-regulating dam at the Vioolsdrif Dam site was preferred to the
Komsberg Dam site.
Pre-feasibility Study into Measures to Improve the Management of the Lower Orange River FINAL
DAM DEVELOPMENT OPTIONS – VOLUME 1 MARCH 2005 75
7. SEDIMENTATION ANALYSIS
7.1 Introduction
In order to obtain an estimate of the expected sedimentation rates for possible future
reservoirs at Boegoeberg and Vioolsdrif, the Consultant commissioned
Professor Albert Rooseboom to perform a sedimentation analysis. The Komsberg
reservoir was not included as the two above dams would cover the extremities of the
study area. The report is attached hereto as Appendix G.
A summary of the report is given below.
7.2 Summary of Report
7.2.1 Introduction
Sediment loads that will be carried into new reservoirs can be predicted either from
sediment sampling on river streams or from calibrated sediment yield maps.
As part of the ORRS, a report titled “Sedimentation of Reservoirs in the Orange River
Basin” was prepared. This report deals inter alia with expected sedimentation rates
for reservoirs at Boegoeberg and Vioolsdrif. These predicted rates were based on
the most recent (1992) sediment yield map of South Africa. The accuracy of this map
is extremely low for the LOR area due to a lack of reliable calibration data. It was
therefore decided to investigate alternative approaches to obtain more reliable values
for the expected sedimentation rates. In a first attempt in 1998, Prof Rooseboom
used earlier sediment sampling data to obtain estimates for sedimentation rates that
are independent of the sediment yield maps. As this approach was unconventional,
its validity was re-considered and justification for its use is being provided in this
report.
7.2.2 Sediment Loads of the Orange River
7.2.2.1 Stream Sampling Data for the Orange River
Sediment loads in South African rivers are currently being recorded mainly by means
of regular re-surveys of existing dam basins. Prior to the construction of the majority
of dams in South Africa, where sediment accumulation could be measured, stream
Pre-feasibility Study into Measures to Improve the Management of the Lower Orange River FINAL
DAM DEVELOPMENT OPTIONS – VOLUME 1 MARCH 2005 76
sampling was undertaken on a number of tributaries of the Orange River (as well as
other rivers).
From data obtained from the Prieska and Upington stations for the period 1929 -
1969, it was deduced that the average sediment load decreased with time. Over the
same time period, the average sediment concentrations did not vary significantly.
The reduction in the sediment load can therefore be attributed to the reduction in the
mean annual runoff (MAR) due to the construction of major dams in the catchment.
It is therefore concluded that in the case of the LOR, sediment concentration values
recorded along the river, provide a more reliable basis for estimating sediment loads
at Boegoeberg and Vioolsdrif than the sediment yield maps.
7.2.2.2 Sediment Loads Derived from Reservoir Re-surveys
There is no information available from reservoir re-surveys that can be used to
calibrate the zones of the sediment yield map of South Africa, which fall within the
effective catchments of Boegoeberg and Vioolsdrif, with an acceptable degree of
accuracy. Although the base sediment yield map indicates that sediment yield rates
for these catchments will be low, it is not possible to estimate sediment yields for this
area accurately enough, given the large areas involved.
7.2.3 Estimated Sedimentation Rates for Future Reservoirs at Boegoeberg and Vioolsdrif
On the conservative assumption that the sediment load under natural (pre-dam)
conditions constituted 0,6% by mass, then the corresponding sediment loads under
“natural” conditions amount to 64 million tonnes per annum at Boegoeberg and
63 million tonnes per annum at Vioolsdrif. According to the current flow conditions
the average annual loads will be 29 million tonnes at Boegoeberg and 25 million
tonnes at Vioolsdrif. The first two figures compare well with early-recorded values
and the latter values compare realistically with the average recorded load of
34 million tonnes/a around 1964.
Whilst it is likely that sediment loads will decrease further this cannot be guaranteed
and the above figures of 29 and 25 million tonnes per annum must be taken as the
maximum foreseeable loads. It is reasonable to assume that an average sediment
concentration of 0,4% is a more probable value than 0,6%. On this basis, the likely
average annual sediment loads at Boegoeberg and Vioolsdrif amount to 20 and
17 million tonnes/a, respectively.

Pre-feasibility Study into Measures to Improve the Management of the Lower Orange River FINAL
DAM DEVELOPMENT OPTIONS – VOLUME 1 MARCH 2005 77
Table 7.1: Estimated 50-year Sediment Volumes for Storage Reservoirs at
Vioolsdrif and Boegoeberg
Dam Total Storage
(million m3)
Sediment Load
(million tonnes/a)
50-year Sedimentation Volume
(million m3)
Vioolsdrif >1220 16,6
(25 max)
602
(903 max)
Boegoeberg >1430 19,6
(29,5 max)
711
(1067 max)
If a storage reservoir is to be constructed at Boegoeberg, the best estimate of the
sediment load that will be entering the reservoir is 19,6 million tonnes per annum.
With a trap efficiency of 98%, this means that the 50-year sediment volume will be
711 million m³.
Similarly, if a storage reservoir is to be constructed at Vioolsdrif, the annual sediment
load would be 16,6 million tonnes and the 50-year sediment volume 602 million m³.
The maximum sediment load and volume values in the table are the maximum
foreseeable values. A re-regulation weir at Vioolsdrif with a total storage capacity of
260 million m³ will initially trap in the order of 80% of the incoming sediment load.
Similarly, a weir at Boegoeberg with a total storage capacity of 163 million m³ will trap
roughly 70% of the incoming sediment load. A weir at either of these positions will
therefore lose a large proportion of its storage capacity within 10 years unless it is
purposefully designed and operated.

Pre-feasibility Study into Measures to Improve the Management of the Lower Orange River FINAL
DAM DEVELOPMENT OPTIONS – VOLUME 1 MARCH 2005 78
8. PRELIMINARY DESIGN
8.1 Vioolsdrif Dam Sites
During the ORRS, three possible dam sites were identified between 9 and 10 km
upstream of the existing Vioolsdrif Weir. The uppermost site (referred to as
Vioolsdrif A in this study) was eventually chosen for inclusion in the ORRS Report.
A further two sites were identified 1.5 and 5 km upstream of the confluence of the
Haib and Orange Rivers (referred to as Vioolsdrif B and C, respectively in this study).
A further site (Vioolsdrif D) situated 8.5 km upstream of the confluence, was identified
in this study. The location of the sites is shown in Appendix C4.
The dam sites upstream of the confluence with the Haib River are some 50 to 150 m
wider than the Vioolsdrif A site. It offers some advantage with regard to easier
access and the wider cross-section could be of benefit to accept a wider spillway.
These aspects should be investigated during the detail site selection phase. For the
purposes of this report, the Vioolsdrif A Dam site was retained as the preferred site
due to the smaller cross-sectional area and also to facilitate comparison with the
ORRS work.
8.2 Available Mapping
All the work in the ORRS at the Vioolsdrif Dam sites was based on the 1:50 000 topo-
cadastral maps of the area.
The 1:50 000 mapping was retained to compile the storage capacity curve for the site
(see Section 5.4.2). The curve is shown on Figure H.1 in Appendix H.
In order to provide a better estimate of the construction quantities, aerial photography
at a scale of 1:60 000 was obtained from the Directorate: Surveys and Mapping in
Mowbray near Cape Town for Job No 997 of 1997. Survey plans at a scale of
1:10 000 with 5 m contours were then prepared for the Vioolsdrif A Dam site, as well
as the Vioolsdrif B to D Dam sites.
Due to the lack of sufficient control points in the vicinity of the dam sites, the overall
positioning and datum of the 1:10 000 mapping could not be guaranteed. In order to
facilitate comparison with the storage capacity curve generated from the 1:50 000
Pre-feasibility Study into Measures to Improve the Management of the Lower Orange River FINAL
DAM DEVELOPMENT OPTIONS – VOLUME 1 MARCH 2005 79
mapping, the river bed level at the Vioolsdrif A Dam site was adjusted to that of the
estimated 1:50 000 level. If the Vioolsdrif Dam sites were to be investigated further,
more accurate mapping based on dedicated aerial photography should be
undertaken.
8.3 Geology
The foundation consists of granodiorite of the intrusive Vioolsdrif site, of Mokolian
age. Intermittent, narrow bands of alluvium occur on both banks of the river.
The lower section of the left flank consists of large outcrops of black, fine-grained
granodiorite. The middle to upper section consists of coarse-grained granodiorite
intermixed with mica, which weathers to a flaky schist.
The overburden on both flanks consists of broken rock of varied description and takes
the form of a thin, patchy layer of rubble. Excavation depths of less than 1 to 2 m are
expected to expose suitable foundation rock.
The river section consists of thick alluvial deposits of boulders and sand. It is
anticipated that sound material will be found at an excavation depth of approximately
4 m.
Coarse aggregates can be produced from local sources near the dam site consisting
of quartzites, diorites and other rock types. Due to the narrow valley section in which
the dam site is located, the alluvial sand is not plentiful. Fine aggregates will
therefore also have to be produced by crushing of the local rock.
Photographs of the dam site are presented in Appendix H.
8.4 Flood Determination
8.4.1 Flood Magnitudes
In terms of the Guidelines for Sizing of Mass Concrete Dams (see Section 3.2 in
Appendix A), the flood magnitudes are to be based on the RMF concept.

Pre-feasibility Study into Measures to Improve the Management of the Lower Orange River FINAL
DAM DEVELOPMENT OPTIONS – VOLUME 1 MARCH 2005 80
In the ORRS, the regional maximum flood (RMF) was estimated to be 18 930 m3/s.
This was based on an effective catchment area of 404 000 km2 and a Francou Rodier
k-value of 2,8. In accordance with the Guidelines on Safety in Relation to Floods
(SANCOLD, 1991), the safety evaluation discharge (SED) is based on the RMF for a
region one step higher numerically than that in which the study catchment lies. For
the Vioolsdrif Dam site, this equates to a Francou Rodier k-value of 3.4. The SED
was then calculated to be 26 300 m3/s (similar to the figure in the ORRS).
The recommended design discharge (RDD) is based on the 1:200-year recurrence
interval (RI) flood. An approximate value is obtained by multiplying a factor from
TR137 (Kovacs, ZP, 1988) with the RMF. The RDD comes to 14 250 m3/s.
The diversion flood for a concrete dam is based on the 1:10-year RI flood. The
factors in TR137 also provide estimates of 1:20-year RI floods. The diversion flood
was estimated to be half that of the 1:20-year RI flood and comes to 3 000 m3/s.
8.4.2 Flood Attenuation
Due to the very large catchment area, insignificant flood attenuation is anticipated.
8.4.3 Freeboard
The freeboard requirements are set out in Table 8.1 and are based on a spillway
length of 375 m (see Section 8.5).
Table 8.1: Calculation of Freeboard
Characteristic Freeboard Requirement
(m)
For recommended design flood:
Overflow depth for 1:200 year flood of 14 250 m3/s
Wave height and run-up
Wind set-up
Surges
Total
6.89
2.73
0.25
0.50
10.37
For safety evaluation discharge
Flood magnitude = 26 300 m3/s
10.37
For the preliminary design, a total freeboard of 10 m was used.

Pre-feasibility Study into Measures to Improve the Management of the Lower Orange River FINAL
DAM DEVELOPMENT OPTIONS – VOLUME 1 MARCH 2005 81
8.5 Spillway Design
Due to the high flood magnitudes that need to be passed over the dam, the complete
base width of the valley of 375 m will be used as spillway.
The flood surcharge was calculated with a discharge coefficient of 2.1 and the results
are shown in Table 8.1.
A design head of 7.5 m was selected for the ogee to provide a ratio of 1.33 between
the maximum head during the SEF and the design head to limit the potential sub-
atmospheric pressures on the crest during the SEF to about one-half of the design
head. In this way the discharge capacity of the ogee is increased over the full range
of design flows (Design of Small Dams, 1987).
The necessity for a stilling basin was briefly investigated. For unit flows of 12 to
15 m3/s/m of spillway, steps on the downstream face (as associated with rollcrete
construction) can be used to dissipate energy and eliminate the need for a full stilling
basin (Mason, PJ, 2004). This will cater for flood discharges up to approximately
one-third of the RDD.
For higher discharges, the energy dissipating capability of the steps reduces due to
the development of skimming flow over the steps. However, due to the narrow river
valley and high flood discharges the estimated tailwater level will provide sufficient
water depth to force a hydraulic jump immediately downstream of the dam.
The estimated stilling basin length for the RDD is 50 m. The preliminary design
allows for an apron slab of 20 m long and the clearing of the riverbed of all loose
material down to bedrock for a further 30 m. This will have to be re-assessed during
the detail design stage.
8.6 Dam Size
The preliminary design was done for a dam with the following parameters:
• Total storage capacity 260 million m3
• Allowance for sedimentation 150 million m3
• Live storage capacity 110 million m3
• Wall height to non overspill crest (NOC) 35.1 m

Pre-feasibility Study into Measures to Improve the Management of the Lower Orange River FINAL
DAM DEVELOPMENT OPTIONS – VOLUME 1 MARCH 2005 82
• River bed level reduced level (RL) 176.4 m
(approximately)
• FSL RL 201.5 m
• NOC RL 211.5 m
• Wall height to FSL (i.e., spillway height) 25.1 m
• Total crest length 485 m
The allowance for sedimentation was based on a sediment load of 16.6 million
tonnes/a, a trap efficiency of 80% and a planning horizon of 15 years, as it was
considered unrealistic to add the 50-year sedimentation volume of 600 million m3 to a
live storage capacity of 110 million m3.
8.7 Dam Type Selection
Due to the large design floods the complete river section must be utilised as a
spillway. There is no possibility of a lateral spillway over a saddle or through a neck.
Embankment type dams that must not be overtopped are therefore not feasible.
The site also has no V-shape characteristics required for arch type dams.
Concrete gravity dams are therefore considered to be the only type of dam suitable
for the site. For a re-regulating dam a buttress type dam could be considered, but
this will preclude a later raising if the dam were to be upgraded to a yield dam.
Due to its inherent lower costs a rollcrete dam was chosen for the preliminary design.
The layout of the dam and a typical cross-section are shown in Figures H.3 and H.5
in Appendix J.
8.8 Outlet Works
The layout of the outlet works will depend on the method of operation to be adopted.
If the existing canal infrastructure downstream of the Vioolsdrif Weir is to be used,
water can be released down the river to the weir. If the head in the dam is to be
utilised, a pipeline distribution system starting at the dam needs to be constructed.
Pre-feasibility Study into Measures to Improve the Management of the Lower Orange River FINAL
DAM DEVELOPMENT OPTIONS – VOLUME 1 MARCH 2005 83
The estimated monthly demand figures for a re-regulating dam vary from a minimum
of 2.3 m3/s in June to 11.8 m3/s in January (see Section 2.3 in the report titled
‘Hydrology, Water Quality and Systems Analysis : Volume A – Systems Analysis).
Two 2 m diameter pipe stacks are allowed for with 1.8 m diameter inlets at 7 m
centres. With a normal operating flow velocity of 4 m/s, each pipe stack can
discharge 12.6 m3/s. The water will be discharged through 1.2 m diameter sleeve
valves. The intake tower will be equipped with coarse trash racks, fine screens and
stop log gates.
The estimated maximum environmental flow requirement (EFR) is 400 m3/s in
February. Whilst it can be expected that the dam would normally overflow during this
time, allowance has been made for the installation of two 3.0 m wide by 3.5 m high
radial gates to act as bottom outlets. With the water level at the bottom of the
110 million m3 live storage (approx RL 196.7 m) the gates will discharge in the order
of 170 m3/s each. With the water level at the FSL of 211.5 m, the gates will discharge
in the order of 200 m3/s each.
The intake to the bottom outlet will be equipped with coarse trash rack screens, stop
log gates and emergency gates. Energy dissipation through a hydraulic jump stilling
basin will not be possible as the tailwater level will be too low during the
environmental releases. Two super elevated deflector buckets are therefore
proposed to direct the flow away from the left bank. The need for a pre-excavated
plunge pool will have to be established during the detail design stage.
Details of the outlet works are shown in Figures H.6 to H.8 in Appendix H.
8.9 Flood Diversion Works
8.9.1 Stage 1
It is foreseen that an approximately semi circular rollcrete cofferdam will be built on
the left hand side of the river valley to close off 250 m of the river channel. If it is
assumed that the remaining 100 m wide river channel will act as a broad crested
weir, the cofferdam needs to be approximately 8 m high to pass the diversion flood of
3 000 m3/s.
About twelve culverts of 5 x 5 m will have to be installed in the rollcrete for diversion
purposes during Stage 2 (total area 300 m2 x 10 m/s = 3 000 m3/s).

Pre-feasibility Study into Measures to Improve the Management of the Lower Orange River FINAL
DAM DEVELOPMENT OPTIONS – VOLUME 1 MARCH 2005 84
8.9.2 Stage 2
Stage 2 will require rollcrete upstream and downstream cofferdams to link the right
flank with the already completed dam. A cofferdam height of 15 m would be required
to generate 10 m/s through the culverts. The Stage 1 cofferdam will be demolished.
When the dam is ready for impoundment, the river will be diverted through the outlet
works during a period of low flow. The culverts will be concreted up and the Stage 2
cofferdams will be demolished.
The proposed layout of the flood diversion works is shown in Figure H.4 in
Appendix H.
8.10 Access Roads and Site Establishment
Access to the site is difficult due to the steep valley sides. There is also no space
available at the dam site for site establishment.
A large enough area for site establishment was identified on the right bank between 4
and 6 km downstream of the site. The access road will consist of the following
components:
• 5 km long upgrading of the existing farm road off Namibia Route 1/1 to
accommodate construction traffic.
• 7 km long new road on the river bank with reasonably gentle side slopes.
• 1.5 km long by 8 m diameter tunnel to pass near vertical slopes along the river.
• 5 km long new road on the river bank over flat area past the site establishment
area.
• 2.5 km new road along the river bank with relatively steep side slopes (1V:1.8H).
The above proposal had to be discarded as the estimated construction cost of the
tunnel alone came to more than R40 million.
Pre-feasibility Study into Measures to Improve the Management of the Lower Orange River FINAL
DAM DEVELOPMENT OPTIONS – VOLUME 1 MARCH 2005 85
For the purposes of the preliminary design, a gravel access road on the left bank was
costed (see Figure H.2 in Appendix H). The road will consist of the following
components:
• 8.7 km long upgrading of the existing farm road off the N7 to accommodate
construction traffic.
• 1.8 km long cutting into the steep hillside (1V:1.2H) along the existing canal to
accommodate construction traffic.
• 3.5 km long new road on the river bank over flat area past the site establishment
area.
• 3 km long cutting into the steep (1V:1.2H) hillside.
• 3.6 km new road along the river bank with relatively steep side slopes (1V:1.9).
The access road will be prone to frequent flooding unless it can be located above
approximately 10 m above the river bed level.
The dam sites upstream of the confluence with the Haib River may be more suitable
in this respect as access can be gained from the north, roughly along the Haib River
course. An access track that was probably used for prospecting purposes already
exists along the river course. Suitable areas for site establishment including quarries
exist near the confluence. Due to the very low rainfall in the area, the Haib River is
not subject to flooding when the Orange River is in flood. This route should form part
of further studies during the detail design stage.
8.11 Dam Raising
According to the systems analysis, the projected future downstream demands would
require a live storage volume of 1 500 million m3 (see Section 4.6.5 in the report titled
‘Hydrology, Water Quality and Systems Analysis : Volume A – Systems Analysis).
The 50-year sediment volume was estimated at approx 600 million m3
(see Section 7.2.3). The total storage volume would be 2 100 million m3 at a spillway
height of 54.6 m. This would require a 29.5 m raising of the re-regulating dam.
The re-regulating dam can be raised by adding rollcrete on the downstream side. In
order to allow for such an eventuality the Outlet Works were moved 24 m
downstream in the preliminary design. The Intake Tower will be extended vertically
whilst adding further intakes to the pipe stacks.

Pre-feasibility Study into Measures to Improve the Management of the Lower Orange River FINAL
DAM DEVELOPMENT OPTIONS – VOLUME 1 MARCH 2005 86
8.12 Hydropower Potential
The available flow rate for hydropower generation was taken as the monthly demand
figures plus the minimum EFR. In the months of December, February and March the
flow rate was capped at 25 m3/s; to allow for a realistic range of flows through the
turbines. The average flow rate over a full year was estimated at 15.4 m3/s.
The available head was taken as the difference between the minimum operating level
(MOL) and the river bed level. The MOL was defined as the bottom of the
110 million m3 live storage at RL 196.7 m. With the riverbed level at RL 176.4 m the
minimum available head is 20.3 m.
The maximum generating capacity is 4.2 MW based on an efficiency factor of 85%.
The total annual power generation was estimated at 21.3 GWh based on 340
generating days per year.
It is foreseen that a machine hall will be excavated below the proposed outlet works
to house the mechanical/electrical equipment. Two machines with a generating
capacity of 2.1 MW each will be installed to allow for flexibility in terms of the required
flow rate.
The estimated capital cost of the power station is R30 million, which allows for all civil
and mechanical/electrical works up to and including the switchgear at the dam site.
No allowance was made for the cost of any distribution lines. The estimated potential
income is R3.4 million per annum, based on a selling rate of R0.12 per kWh and a
carbon emission reduction subsidy of R0.04 per kWh.
8.13 Extent of Inundation
The re-regulating dam will push up to the existing weir at Henkriesmond.
A simplified flow profile calculation was carried out to estimate the extent of the
backwater curve. During the 1:100-year flood event (estimated at 12 300 m3/s), the
flood level will vary from RL 208 m at the dam site to approximately RL 219 m at
Goodhouse. Upstream of Goodhouse, the natural flood levels will occur.
Pre-feasibility Study into Measures to Improve the Management of the Lower Orange River FINAL
DAM DEVELOPMENT OPTIONS – VOLUME 1 MARCH 2005 87
9. COST ESTIMATE
9.1 Introduction
A cost estimate was done for the construction of a rollcrete re-regulating dam at the
Vioolsdrif A site. The dam has a total capacity of 260 million m3 and a full supply
level at RL 201.5 m. The total project cost at April 2004 rates is estimated to be
R 561 million as detailed in Appendix H.
9.2 Explanatory Notes
9.2.1 Clearing
Clearing of an area of 10 ha at the dam site has been allowed for.
9.2.2 River diversion
The cost for the river diversion allows for excavation to bedrock, formwork for the
upstream and downstream faces of the cofferdams, as well as the culverts and
rollcrete.
9.2.3 Excavation
The bulk excavation allows for the excavation of the dam structure with 15%
assumed to be rock. The confined excavation allows for the excavation of the outlet
works with 80% assumed to be rock.
9.2.4 Drilling and grouting
The quantities for drilling and grouting were calculated in accordance with the
guidelines in Appendix A.
9.2.5 Formwork
The upstream and downstream faces of the dam were taken as gang formed, whilst
the outlet works were assumed to be all intricate formwork.
Pre-feasibility Study into Measures to Improve the Management of the Lower Orange River FINAL
DAM DEVELOPMENT OPTIONS – VOLUME 1 MARCH 2005 88
9.2.6 Concrete
The rollcrete quantity allows for the dam structure including the section at the outlet
works. The structural concrete quantity allows for the outlet works and the apron slab
below the spillway.
9.2.7 Reinforcing
A reinforcing density of 50 kg per m3 of structural concrete was allowed for taking into
account the massive nature of most of the outlet works.
9.2.8 Mechanical Items
The mechanical items were priced in accordance with the layouts shown in
Appendix J with the engineer’s estimate for the Berg River Dam as basis.
9.2.9 Fencing
A nominal allowance was made for fencing at the dam site only.
9.2.10 Preliminary Works
The cost estimate for the access road allows for the full distance from the N7 to the
dam site.
The allowances for the provision of electricity and construction water to site were
based on figures from the Mohale, Nyaka and Bivane (Paris) Dams and Matsoku
Weir.
The allowance for railhead and materials handling was escalated from the ORRS
figure.
9.2.11 Accommodation
The allowance for accommodation was based on figures for the Mohale, Nyaka,
Bivane (Paris) and Berg River Dams and Matsoku Weir, as well as the fact that the
site is situated in a remote area. It is recommended that accommodation at the
villages of Vioolsdrift / Noordoewer be considered for establishment of construction
accommodation.

Pre-feasibility Study into Measures to Improve the Management of the Lower Orange River FINAL
DAM DEVELOPMENT OPTIONS – VOLUME 1 MARCH 2005 89
9.2.12 VAT
The Value Added Tax rates of the Republic of South Africa and Namibia differ by 1%
and the higher value of 15% (applicable in Namibia) has been used.
9.2.13 Cost of Relocations
From the 1:50 000’s of the dam basin, it appears as if there are approximately 10
dwellings/houses to be relocated.
9.2.14 Cost of Land Acquisition
The area to be flooded by the 1:100 year floodline was estimated at 4 000 ha. From
the 1:50 000’s, it appears as if an area of about 200 ha has been developed. The
unit cost of the land was based on enquiries to a local farmer in the area.
The cost of compensation for mining and prospecting rights is dependent on whether
minerals are actually discovered and a nominal figure has been allowed for.
9.2.15 Allowance for Raising
The cost estimate includes a 24 m extension of the outlet works for a future raising of
the dam. The extension will involve the placing of approximately 10 300 m3 of
structural concrete at a total project cost of R12 million.

Pre-feasibility Study into Measures to Improve the Management of the Lower Orange River FINAL
DAM DEVELOPMENT OPTIONS – VOLUME 1 MARCH 2005 90
10. ECONOMIC ANALYSIS
10.1 Methodology
The various development options proposed for the study were analysed in terms of
their cost-benefit ratio or URV. The URV, expressed in R/m3 or c/m3, is the net
present value (NPV) of costs, including capital and operational costs, of a
development option divided by the net present value of the option benefits. The URV
was used to compare the various development options and facilitate the selection of
the most cost-effective option.
10.1.1 Calculation of URV
The calculation of the URV for the development options was carried out in an Excel
spreadsheet. Appendix I shows an example of the relevant sheets of the
spreadsheet for a development option (Vioolsdrift Re-regulating Dam). For
comparison, the options were analysed for the same commission year and for the
same evaluation period. The various components and assumptions of the URV
calculation are described below.
The URV was firstly calculated for each option with the same commissioning year to
determine the options with the lowest URV relative to other development options.
Once these were calculated the options were combined into a sequence of options,
forming a scenario in order to provide adequately in the water demands until 2025.
(See Section 10.1.7)
10.1.2 Option Costs
The costs of the development option over the evaluation period were calculated as
follows:
• Engineering costs: Pre-engineering costs were taken as 4% of the capital cost
and construction costs were taken as 15% of the capital cost.
• Annual maintenance costs: The civil component of maintenance cost was taken
as 0,25% of the civil capital cost and the mechanical and electrical component of
maintenance cost was taken as 4% of the mechanical and electrical capital cost.
These figures were taken from Appendix A, Section 3.5, “Guidelines for the
Economic Life, and Annual Operational and Maintenance Costs.”
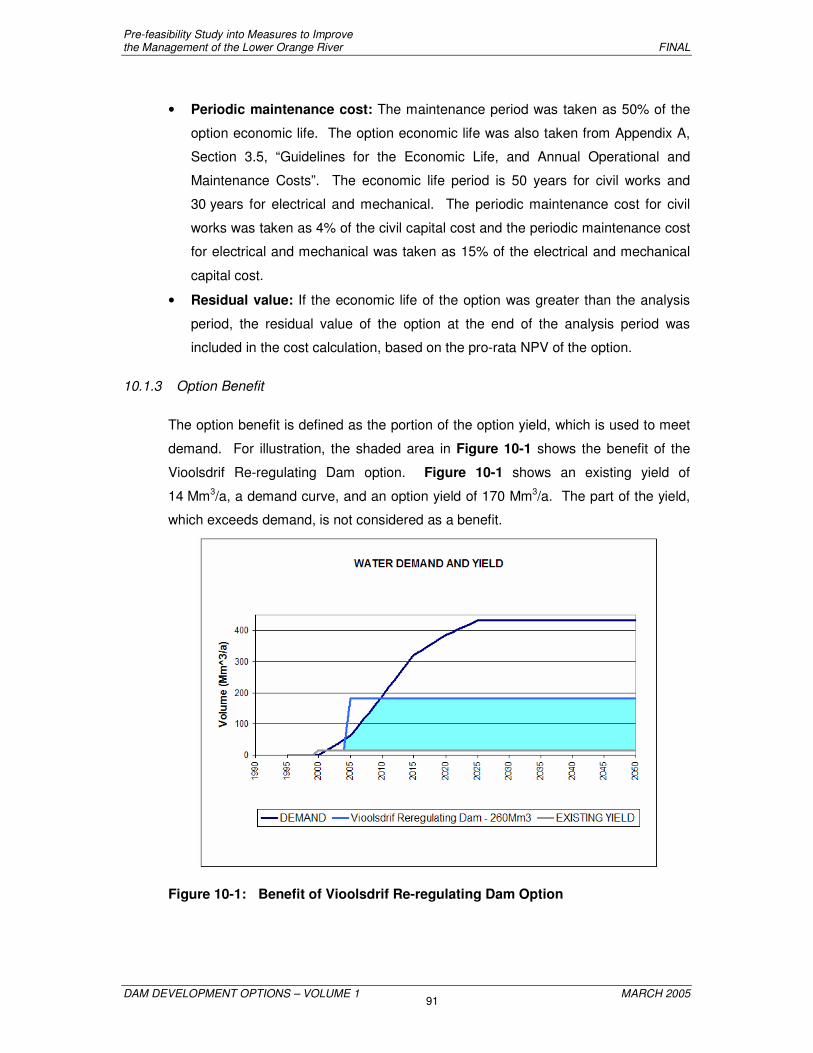
Pre-feasibility Study into Measures to Improve the Management of the Lower Orange River FINAL
DAM DEVELOPMENT OPTIONS – VOLUME 1 MARCH 2005 91
• Periodic maintenance cost: The maintenance period was taken as 50% of the
option economic life. The option economic life was also taken from Appendix A,
Section 3.5, “Guidelines for the Economic Life, and Annual Operational and
Maintenance Costs”. The economic life period is 50 years for civil works and
30 years for electrical and mechanical. The periodic maintenance cost for civil
works was taken as 4% of the civil capital cost and the periodic maintenance cost
for electrical and mechanical was taken as 15% of the electrical and mechanical
capital cost.
• Residual value: If the economic life of the option was greater than the analysis
period, the residual value of the option at the end of the analysis period was
included in the cost calculation, based on the pro-rata NPV of the option.
10.1.3 Option Benefit
The option benefit is defined as the portion of the option yield, which is used to meet
demand. For illustration, the shaded area in Figure 10-1 shows the benefit of the
Vioolsdrif Re-regulating Dam option. Figure 10-1 shows an existing yield of
14 Mm3/a, a demand curve, and an option yield of 170 Mm3/a. The part of the yield,
which exceeds demand, is not considered as a benefit.
Figure 10-1: Benefit of Vioolsdrif Re-regulating Dam Option

Pre-feasibility Study into Measures to Improve the Management of the Lower Orange River FINAL
DAM DEVELOPMENT OPTIONS – VOLUME 1 MARCH 2005 92
10.1.4 Demand Curve
The demand curve used in the option analysis, shown in Figure 10-1 and Figure
10-2, is the most probable demand growth curve described in other reports, such as
the Water Requirements Report and in Chapter 4 of Volume A of the Hydrology
Report.
10.1.5 Existing Yield
An existing yield of 14 Mm3/a was assumed for the option analysis. This value is the
surplus yield at 2005-development level for Reference Scenario 3, described in
Chapter 4 of Volume A of the Hydrology Report. The yield of the option being
analysed was added on to the existing yield, as shown in Figure 10-2.
10.1.6 Discount Rate
The URV was calculated for low, medium and high discount rate estimates of 6%, 8%
and 10%, to test sensitivity and later also tested at a 3% discount rate.
10.1.7 Implementation Date
All options were analysed with a common date for implementation. The date for
implementation was selected as 2005 being the point in time that a further resource
should be operational to meet the growth in demand. It means that it was assumed
that all capital expenditure required before that date were already done before 2005.
10.2 Scenarios
Development scenarios were generated by creating a sequence of options, when
each new option was commissioned in the year where the demand exceeded the
combined yield of the preceding options. This is illustrated in Figure 10-2, which
shows the scenario consisting of Vanderkloof Dam lower level storage followed by
the raising of Vioolsdrif Re-regulating Dam.

Pre-feasibility Study into Measures to Improve the Management of the Lower Orange River FINAL
DAM DEVELOPMENT OPTIONS – VOLUME 1 MARCH 2005 93
SCENARIO B - WATER DEM AND AND YIELD
0
100
200
300
400
500
600
1990
1995
2000
2005
2010
2015
2020
2025
2030
2035
2040
2045
2050
Vo
lum
e (M
m^3
/a)
3. Raisingreregulating dam
2. VioolsdriftReregulating Dam- 260Mm3
1. Vander KloofDam
DEMAND
EXISTING YIELD
Figure 10-2: Plot of Yield for a Scenario
The URV of each scenario was calculated by dividing the total NPV of costs of the
options forming the scenario by the total NPV of benefits of the options. The URVs of
different scenarios were compared to determine which scenarios were most cost-
effective.
The scenarios were compiled by implementing the most cost effective option first
followed by the second most cost effective option, considering the practical
implementation conditions as well.
10.3 Assessment of Pre-screened Dam Development Options
The initial processing of options took place on the basis of direct comparison of costs
and other factors as described earlier.
The relation of the most beneficial site between Boegoeberg, Vioolsdrift (and
Komsberg) for further analysis, took place in a multi criteria decision workshop. The
URVs for these options were calculated and is shown in Annexure I.
The capital costs and yields were used as was available at the time. The costing was
done at August 2002 prices and URVs calculated at 2003 base year. The results are
shown in Table 10.1.
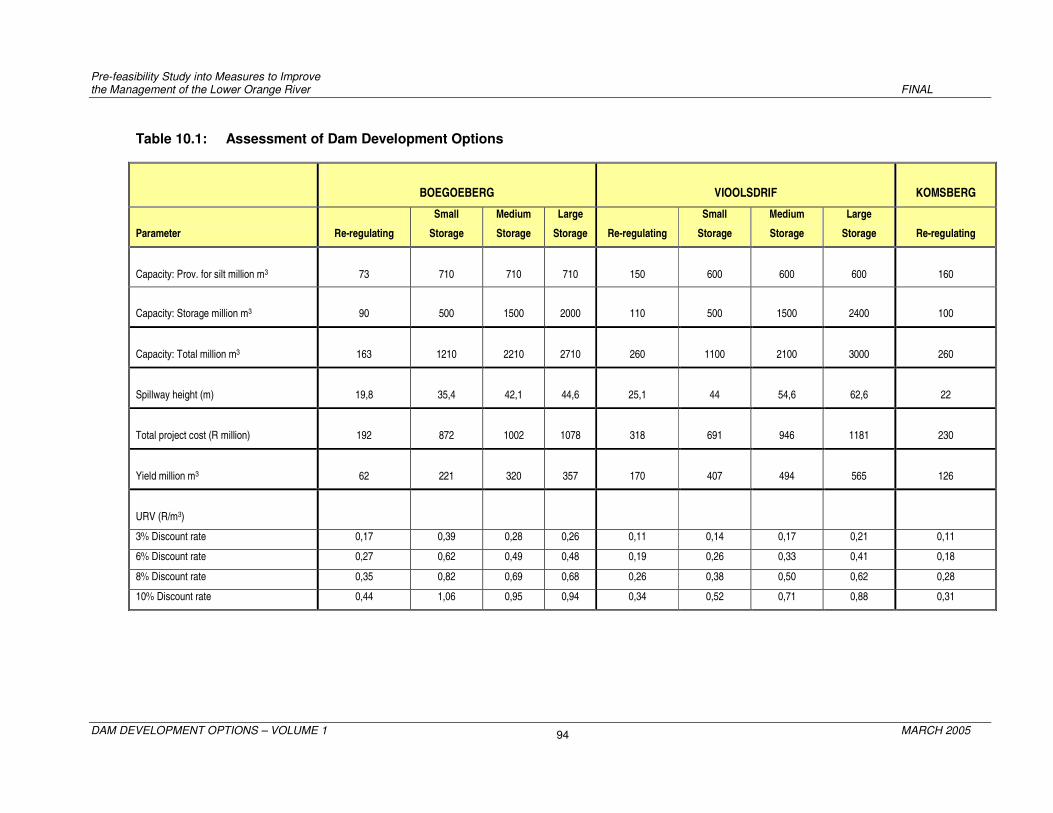
Pre-feasibility Study into Measures to Improve the Management of the Lower Orange River FINAL
DAM DEVELOPMENT OPTIONS – VOLUME 1 MARCH 2005 94
Table 10.1: Assessment of Dam Development Options
BOEGOEBERG
VIOOLSDRIF
KOMSBERG
Parameter
Re-regulating
Small
Storage
Medium
Storage
Large
Storage
Re-regulating
Small
Storage
Medium
Storage
Large
Storage
Re-regulating
Capacity: Prov. for silt million m3
73
710
710
710
150
600
600
600
160
Capacity: Storage million m3
90
500
1500
2000
110
500
1500
2400
100
Capacity: Total million m3
163
1210
2210
2710
260
1100
2100
3000
260
Spillway height (m)
19,8
35,4
42,1
44,6
25,1
44
54,6
62,6
22
Total project cost (R million)
192
872
1002
1078
318
691
946
1181
230
Yield million m3
62
221
320
357
170
407
494
565
126
URV (R/m3)
3% Discount rate 0,17 0,39 0,28 0,26 0,11 0,14 0,17 0,21 0,11
6% Discount rate 0,27 0,62 0,49 0,48 0,19 0,26 0,33 0,41 0,18
8% Discount rate 0,35 0,82 0,69 0,68 0,26 0,38 0,50 0,62 0,28
10% Discount rate 0,44 1,06 0,95 0,94 0,34 0,52 0,71 0,88 0,31
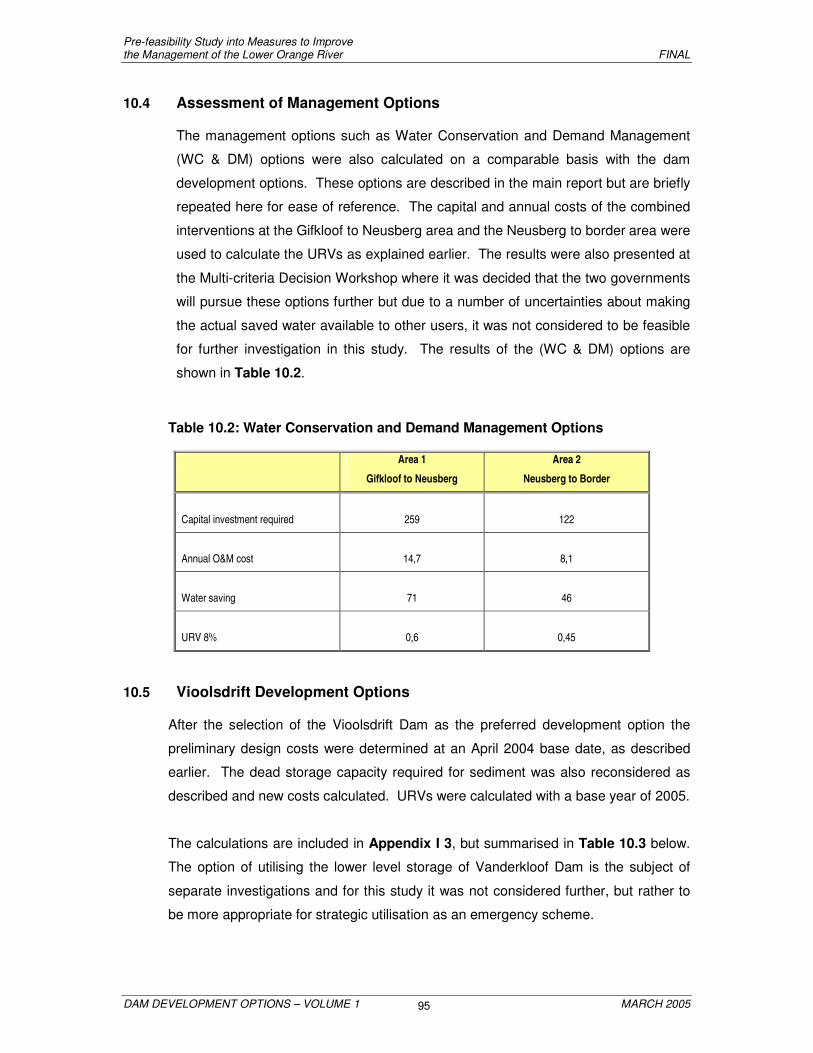
Pre-feasibility Study into Measures to Improve the Management of the Lower Orange River FINAL
DAM DEVELOPMENT OPTIONS – VOLUME 1 MARCH 2005 95
10.4 Assessment of Management Options
The management options such as Water Conservation and Demand Management
(WC & DM) options were also calculated on a comparable basis with the dam
development options. These options are described in the main report but are briefly
repeated here for ease of reference. The capital and annual costs of the combined
interventions at the Gifkloof to Neusberg area and the Neusberg to border area were
used to calculate the URVs as explained earlier. The results were also presented at
the Multi-criteria Decision Workshop where it was decided that the two governments
will pursue these options further but due to a number of uncertainties about making
the actual saved water available to other users, it was not considered to be feasible
for further investigation in this study. The results of the (WC & DM) options are
shown in Table 10.2.
Table 10.2: Water Conservation and Demand Management Options
Area 1
Gifkloof to Neusberg
Area 2
Neusberg to Border
Capital investment required
259
122
Annual O&M cost
14,7
8,1
Water saving
71
46
URV 8%
0,6
0,45
10.5 Vioolsdrift Development Options
After the selection of the Vioolsdrift Dam as the preferred development option the
preliminary design costs were determined at an April 2004 base date, as described
earlier. The dead storage capacity required for sediment was also reconsidered as
described and new costs calculated. URVs were calculated with a base year of 2005.
The calculations are included in Appendix I 3, but summarised in Table 10.3 below.
The option of utilising the lower level storage of Vanderkloof Dam is the subject of
separate investigations and for this study it was not considered further, but rather to
be more appropriate for strategic utilisation as an emergency scheme.
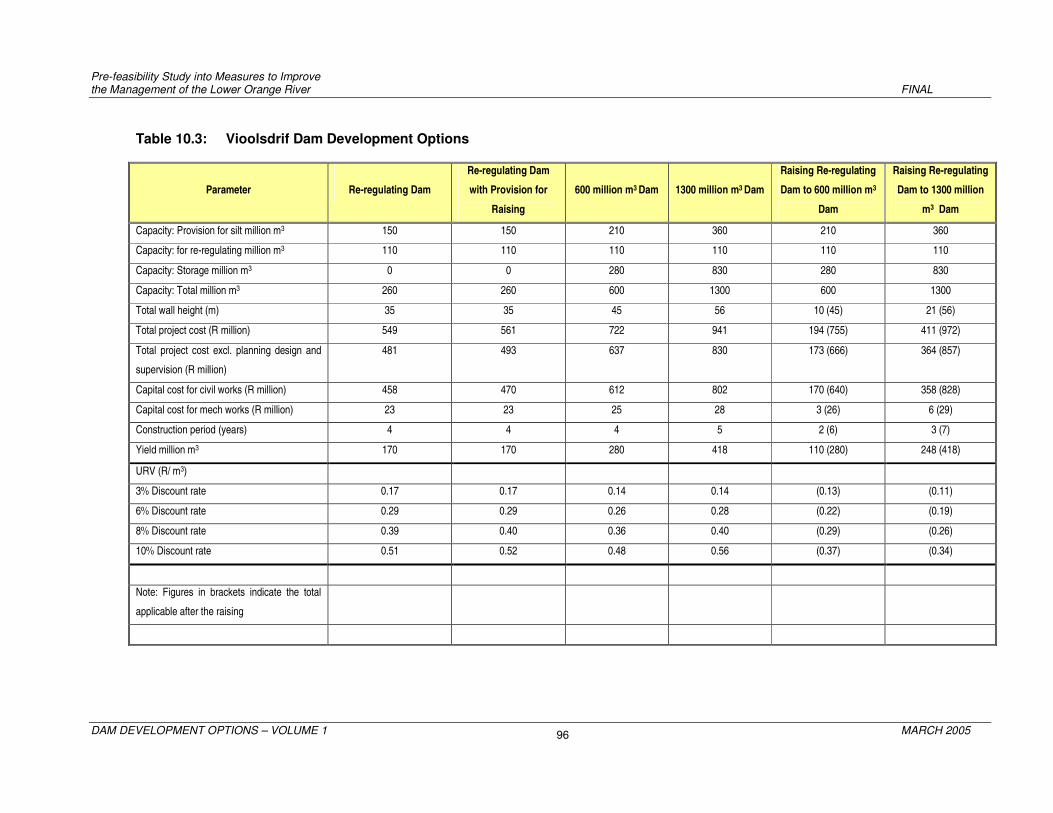
Pre-feasibility Study into Measures to Improve the Management of the Lower Orange River FINAL
DAM DEVELOPMENT OPTIONS – VOLUME 1 MARCH 2005 96
Table 10.3: Vioolsdrif Dam Development Options
Parameter
Re-regulating Dam
Re-regulating Dam
with Provision for
Raising
600 million m3 Dam
1300 million m3 Dam
Raising Re-regulating
Dam to 600 million m3
Dam
Raising Re-regulating
Dam to 1300 million
m3 Dam
Capacity: Provision for silt million m3 150 150 210 360 210 360
Capacity: for re-regulating million m3 110 110 110 110 110 110
Capacity: Storage million m3 0 0 280 830 280 830
Capacity: Total million m3 260 260 600 1300 600 1300
Total wall height (m) 35 35 45 56 10 (45) 21 (56)
Total project cost (R million) 549 561 722 941 194 (755) 411 (972)
Total project cost excl. planning design and
supervision (R million)
481 493 637 830 173 (666) 364 (857)
Capital cost for civil works (R million) 458 470 612 802 170 (640) 358 (828)
Capital cost for mech works (R million) 23 23 25 28 3 (26) 6 (29)
Construction period (years) 4 4 4 5 2 (6) 3 (7)
Yield million m3 170 170 280 418 110 (280) 248 (418)
URV (R/ m3)
3% Discount rate 0.17 0.17 0.14 0.14 (0.13) (0.11)
6% Discount rate 0.29 0.29 0.26 0.28 (0.22) (0.19)
8% Discount rate 0.39 0.40 0.36 0.40 (0.29) (0.26)
10% Discount rate 0.51 0.52 0.48 0.56 (0.37) (0.34)
Note: Figures in brackets indicate the total
applicable after the raising

Pre-feasibility Study into Measures to Improve the Management of the Lower Orange River FINAL
DAM DEVELOPMENT OPTIONS – VOLUME 1 MARCH 2005 97
11. CONCLUSIONS AND RECOMMENDATIONS
11.1 Development of Design and Cost Criteria
The study on the Dam Development Options commenced with a review of the
‘Guidelines for the preliminary sizing, costing and engineering economic evaluation of
planning options’ developed during the VAPS for the South African DWAF.
The component sizing criteria were reviewed and modified where deemed necessary.
In particular, the sections on flood determination for the various dam types were
rewritten due to inconsistencies in the terminology and presentation in the VAPS
guidelines. The sections on foundation grouting were rewritten to be consistent
between the various dam types. A section on guidelines for estimating social,
environmental and administration costs was included.
The cost models were updated by utilising contract prices, with appropriate
escalation, for the recently constructed Maguga, Mohale, Inyaka and Bivane (Paris)
Dams, as well as the Matsoku Weir.
It is recommended that these adjusted guidelines be accepted by the Client as the
new standardised guidelines.
11.2 Identification of Dam Sites
The purpose of this sub-task was to mark up all the relevant options identified in the
ORRS on the 1:50 000 topographical maps, to identify any new options to the west of
the 20° longitude along the common border between South Africa and Namibia and to
identify a potential dam site on the Fish River.
In the ORRS, eight possible development options upstream of the common border
were identified and evaluated. No new sites were identified in this study. These
development options are listed in Table 3.1. Furthermore, the potential dam sites
along the common border area that were identified in this study, as well as those
identified in the ORRS, are listed in Table 3.2.
These sites were all considered in the pre-screening process to determine the

Pre-feasibility Study into Measures to Improve the Management of the Lower Orange River FINAL
DAM DEVELOPMENT OPTIONS – VOLUME 1 MARCH 2005 98
possible sites to be considered further in the analysis.
A site was also selected at Koubis on the Fish River, immediately upstream of the Ai-
Ais Nature Reserve, as being representative of typical sites in the area that could also
provide in some needs at the River Mouth. This site provided reservoir
characteristics for input into the hydrological model of the LOR. Initial runs of the
hydrological model indicated that a dam on the Fish River would not be attractive in
the regional context and no further investigations were carried out.
11.3 Environmental Considerations and Existing Infrastructure
Before the pre-screening of the development options could be undertaken,
background data had to be obtained on the environmental considerations associated
with, as well as the existing infrastructure that could be affected by the proposed
options. The following pre-screening factors were investigated:
• Reaches of ecological importance and sensitivity.
• Areas of archaeological and historical interest.
• Cultivated land that could be inundated due to dam development.
• Land over which various mining and prospecting licenses had been issued, and
for which the licensees would have to be compensated for areas that would be
inundated.
• Towns and villages that would be inundated.
• National parks.
• Powerlines across the river that would possibly have to be re-routed.
• Roads and bridges across the river that would possibly have to be re-routed.
Pre-feasibility Study into Measures to Improve the Management of the Lower Orange River FINAL
DAM DEVELOPMENT OPTIONS – VOLUME 1 MARCH 2005 99
11.3.1 Ecological Issues
The following issues of concern were identified:
• The natural distribution of the median monthly flows in the LOR, which have
already been significantly altered by the Gariep and Vanderkloof Dams, may be
distorted even more.
• A new impoundment will have physico-chemical effects such as stratification and
riverbed degradation.
• It will also impact on the riverine biota, such as vegetation, freshwater
invertebrates and freshwater fish species.
• Unique river reaches such as inland deltas will be affected.
11.3.2 Areas of Archaeological and Historical Interest
The following conclusions were made on the above topic:
• Extrapolating from what is known from localities to the east and west of the study
area, it could reasonably be predicted that any potential dam site within the study
area will have heritage impacts.
• The Richtersveld is archaeologically rich and inundation of the river valley will
have an impact in the immediate vicinity of the river.
• A preliminary field assessment will be necessary before any idea of the kinds of
impacts that may be involved, can be gained.
• Some detailed archival research may also be necessary to identify places of
conflict as well as help establish the significance of any sites found.
11.3.3 Cultivated Land
Presently cultivated areas along the common border, as well as potentially irrigable
areas along both the South African and Namibian sides of the river were recorded
during the course of the investigation for the purpose of determining possible impacts,
existing and future water requirements. Also for WC & DM opportunities.
11.3.4 Mining and Prospecting Licenses
Mining and prospecting licenses have been issued over much of the reach of the
common border and mining for diamonds, pegmatites, flourspar and tungsten had
taken place in the area. It is not possible to quantify the cost of compensation for the
loss of prospecting and mining licenses, or differentiate between the licenses. The

Pre-feasibility Study into Measures to Improve the Management of the Lower Orange River FINAL
DAM DEVELOPMENT OPTIONS – VOLUME 1 MARCH 2005 100
cost of compensation has therefore been assumed to be equal for all sites.
11.3.5 Roads and Bridges
Three bridges cross the Orange River along the common border, namely at
Oranjemund/Alexander Bay, Vioolsdrif/Noordoewer and Onseepkans. The extent to
which these bridges and their approaches will be inundated by any dams constructed
on the river will depend on the full supply levels of the dams.
11.3.6 Towns and Villages
Two towns, namely Goodhouse and Onseepkans, could be partly or wholly inundated
by water impounded by new dams constructed at the Vioolsdrif and Kambreek sites.
Prieska may also be affected by a larger dam at Boegoeberg.
11.3.7 National Parks
The Ai-Ais Nature Reserve in Namibia and the Richtersveld Nature Reserve and
Augrabies Falls National Park in South Africa border on the Orange River and may
therefore be partly inundated by dam construction by some of the identified sites.
11.3.8 Powerlines
Four powerlines that cross the Orange River along the common border have been
identified, namely at Oranjemund, Rosh Pinah, Noordoewer and on the Farm Kabis.
11.4 Pre-screening of Development Options
11.4.1 Options Upstream of the Common Border
The ORRS concluded that most of the initial development options considered in the
Orange River Basin could be eliminated from further consideration on financial,
social, engineering or environmental grounds. Only a small number of options
remained as possible future developments, however, it was not possible to make firm
recommendations at that stage. In all of the remaining options, it was considered
necessary to create some form of operational storage along the Orange River at
either Vioolsdrif or Boegoeberg. Both options had similar URVs and it was not
possible to eliminate either of them during the Pre-feasibility Phase of the ORRS.

Pre-feasibility Study into Measures to Improve the Management of the Lower Orange River FINAL
DAM DEVELOPMENT OPTIONS – VOLUME 1 MARCH 2005 101
In the LORMS, no reason could be found to differ from the conclusion of the ORRS
that the most feasible option for the construction of a new dam upstream of the
common border is the New Boegoeberg Dam.
11.4.2 Options along the Common Border
A preliminary pre-screening was done on the dam sites that were identified earlier,
with a view of eliminating those options that were clearly flawed from engineering,
social or environmental considerations. It was concluded that the options, namely
Vioolsdrif A (as representative of the four sites), Yas and Komsberg were to be
subjected to further cost analysis and evaluation against the pre-screening criteria.
The comparison between the pre-screening cost and the reservoir capacities is
shown in Figure 11-1 as requested.
Figure 11-1: Capital Cost (Comparative) of Dam Construction versus Reservoir
Capacity
The details of the evaluation against the pre-screening criteria are shown in
Table 5.4, but the salient points are discussed below.
11.4.3 Discussion of Pre-screening Analysis
11.4.3.1 Vioolsdrif A
The dam site is situated close to existing infrastructure, but access to the site will be
difficult due to the steep valley sides. The dam will inundate areas over, which mining
and prospecting licenses have been issued, over most of the distance that the
impounded water pushes up the river.
0
500
1 000
1 500
2 000
2 500
3 000
3 500
0
100
200
300
400
500
600
700
800
900
1 00
0
1 10
0
1 20
0
1 30
0
CAPITAL COST : PRESCREENING (R million)
RE
SE
RV
OIR
CA
PA
CIT
Y (m
illio
n m
3)
Vioolsdrif
Komsberg
Yas A
Pre-feasibility Study into Measures to Improve the Management of the Lower Orange River FINAL
DAM DEVELOPMENT OPTIONS – VOLUME 1 MARCH 2005 102
11.4.3.2 Yas
This dam site is situated approximately 54 km downstream of the border at
20o longitude. As in the case of the Komsberg site, much of the water stored by the
dam will be on the South African side of the border and the dam will inundate parts of
the Augrabies Falls National Park. The dam would not inundate much irrigable land,
areas of mining and prospecting licenses, towns or villages, road infrastructure, or
powerlines. A dam at this site would have a similar cost to dams at the Vioolsdrif
sites.
11.4.3.3 Komsberg
This dam site is situated approximately 7 km downstream of the border at
20o longitude. Most of the water stored by the dam will therefore be on the South
African side of the border and the dam will inundate parts of the Augrabies Falls
National Park, which is situated along the northern side of the river. The dam would
not inundate much irrigable land, areas of mining and prospecting licenses, towns or
villages, road infrastructure, or powerlines.
Based on the 1:50 000 mapping, this site was found to be the most economical site
along the common border for the construction of a dam for the range of reservoir
capacities under consideration. However, the extent of the inundation of the
Augrabies Falls National Park remained of concern.
11.5 Conclusions
Based on the pre-screening the following conclusions were made:
• The Yas dam site does not offer any significant cost benefits over the Vioolsdrif
site and will inundate parts of the Augrabies Falls National Park. It was therefore
excluded from further analysis.
• From a capital cost point of view (as defined in this section of the report), the
Komsberg site is more cost-effective than the Vioolsdrif site for the construction of
either a smaller re-regulating dam or a larger dam to improve the yield of the
system. The allowable inundation of the Augrabies Falls National Park, however,
still had to be determined.

Pre-feasibility Study into Measures to Improve the Management of the Lower Orange River FINAL
DAM DEVELOPMENT OPTIONS – VOLUME 1 MARCH 2005 103
The net result of the pre-screening was that both the Viooldrif A and the Komsberg
Dam sites were considered in a multi criteria Decision-making Workshop.
11.6 Assessment of Pre-screened Development Options
In the pre-screening process the number of dam sites that could possibly be carried
forward to the preliminary design stage was reduced to the following sites:
Upstream of 20o longitude (i.e., upstream of the common border):
• New Boegoeberg Dam
Downstream of 20o longitude (i.e., along the common border):
• Vioolsdrif Dam
• Komsberg Dam
These three possible options were investigated in order to make more accurate cost
estimates, determine yields and assess benefits and impacts. The options were then
evaluated at a multi-criteria Decision-making Workshop by a team consisting of the
Client, selected stakeholders and the Consultant.
Prior to the workshop, the following activities were carried out on the three dams:
• A yield analysis was carried out in order to determine the required storage
capacities for specified yields.
• A sedimentation analysis was carried out on the New Boegoeberg and Vioolsdrif
sites in order to estimate the sedimentation volumes.
• A financial analysis was carried out in order to determine the unit reference values
of dams of various storage capacities.
The pertinent data for the New Boegoeberg, Vioolsdrif and Komsberg Dam sites is
summarised in Table 11.1.

Pre-feasibility Study into Measures to Improve the Management of the Lower Orange River FINAL
DAM DEVELOPMENT OPTIONS – VOLUME 1 MARCH 2005 104
Table 11.1: Pertinent Values for the Preferred Sites for Re-regulating Dams
New Boegoeberg Vioolsdrif Komsberg
Proposed dam size (million m3) 163 260 260
Unit reference value (@ 8%) (R/m3) 0,35 0,26 0,24
Saving in operational losses (million m3/a) 62 170 126
At the workshop, it was decided that the Vioolsdrif and Komsberg Dam sites were
preferred to the New Boegoeberg Dam site for the following reasons:
• Significantly lower unit reference values; and
• Significantly larger saving in operational losses.
Due to the fact that dams for all heights under consideration at the Komsberg site
would inundate parts of the Augrabies Falls National Park, it was decided that the
Komsberg site should not be considered unless there were significant cost
advantages. The cost estimates of the Vioolsdrif and New Boegoeberg Dam sites
had been done on 1:10 000 mapping with 5 m contours, whilst that of the Komsberg
Dam site was done on 1:50 000 mapping with 20 m contours. It was therefore
decided that 1:10 000 mapping should also be prepared for the Komsberg site.
Based on this mapping, the quantities for the Komsberg Dam site were re-calculated.
The URV for a dam with a capacity of 260 million m3 increased to R0.28/m3.
The river bed levels downstream of the Augrabies Falls were also checked by using
the DEMs of the area. The river bed level at the Komsberg Dam site is at
approximately RL 430.8 m. Above a FSL of approximately RL 432 m, water will start
pushing up into the Augrabies Falls National Park, and the rapids downstream of the
Falls will start to be inundated at levels above RL 450 m. The FSL for the proposed
re-regulating dam will be at approximately RL 446 m.
After the workshop, field visits were made to the Vioolsdrif and Komsberg areas in
order to carry out a vegetation study and ecological and archaeological assessments.
The improved costing, the results of the vegetation and archaeological studies, the
ecological assessment, as well as other factors that needed to be considered in
assessing the options were presented to the Client.

Pre-feasibility Study into Measures to Improve the Management of the Lower Orange River FINAL
DAM DEVELOPMENT OPTIONS – VOLUME 1 MARCH 2005 105
A summary of the above assessments is presented in Table 11.2.
Table 11.2: Summary of Assessment of Vioolsdrif and Komsberg Options
On the basis of these factors, it was decided that the development of a re-regulating
dam at the Vioolsdrif Dam site was preferred to the Komsberg Dam site.
11.7 Preliminary Designs and Cost Estimates
11.7.1 Dam Site
The preliminary design was based on the Vioolsdrif A Dam site due to the smaller
cross-sectional area than the other three sites and to facilitate comparison with the
ORRS work.
11.7.2 Available Mapping
All the work in the ORRS at the Vioolsdrif Dam sites was based on the 1:50 000 topo-
cadastral maps of the area. The 1:50 000 mapping was retained to compile the
storage capacity curve for the site, but survey plans at a scale of 1:10 000 with 5 m
contours were prepared from aerial photography for the dam site.
Dam Sites Vioolsdrif Komsberg
Issues
Potentially serious implications of any raising of the dam in future
None
Inundation of the rapids downstream of the Augrabies Falls.
Impact on Augrabies Falls and National Park
None Dam basin inside the Park and potential sediment and back water effects in rapids
Saving in operational losses (million m3/a)
170 126
Ecological
Would have the most impact relative to the other options.
Would have a lower impact than the Vioolsdrif Dam option.
Archaeological Would have the greater impact on archaeological remains.
Would have a lesser impact on archaeological remains than Vioolsdrif.
Vegetation Would overall affect a less developed stretch of riparian landscapes and habitats.
Would affect large stretches of relatively pristine riparian woodlands, though interrupted by agricultural developments.
Unit reference values (R/m3) 0.26 0.28

Pre-feasibility Study into Measures to Improve the Management of the Lower Orange River FINAL
DAM DEVELOPMENT OPTIONS – VOLUME 1 MARCH 2005 106
11.7.3 Flood Determination
In terms of the Guidelines for Sizing of Mass Concrete Dams, the flood magnitudes
were based on the RMF concept. The SED was calculated to be 26 300 m3/s and the
RDD 14 250 m3/s.
The diversion flood for a concrete dam is based on the 1:10-year recurrence Interval
(RI) flood, which was estimated to be 3 000 m3/s.
For the preliminary design a total freeboard of 10 m was used.
11.7.4 Spillway Design
Due to the high flood magnitudes that need to be passed over the dam, the complete
base width of the valley of 375 m will be used as spillway.
11.7.5 Dam Size
The preliminary design was done for a (re-regulating) dam with the following
parameters:
• Total storage capacity 260 million m3
• Allowance for sedimentation 150 million m3
• Live storage capacity 110 million m3
• Wall height to NOC 35.1 m
• Wall height to FSL (i.e. spillway height) 25.1 m
• River bed level RL 176.4 m (approximately)
• FSL RL 201.5 m
• NOC RL 211.5 m
• Total crest length 485 m
11.7.6 Dam Type Selection
Due to the large design floods, the complete river section must be utilised as a
spillway. A concrete gravity dam was therefore considered to be the only type of dam
suitable for the site. Due to its inherent lower costs, a rollcrete dam was chosen for
the preliminary design.

Pre-feasibility Study into Measures to Improve the Management of the Lower Orange River FINAL
DAM DEVELOPMENT OPTIONS – VOLUME 1 MARCH 2005 107
11.7.7 Outlet Works
The estimated monthly demand figures for a re-regulating dam vary from a minimum
of 2.3 m3/s in June to 11.8 m3/s in January. Two 2 m diameter pipe stacks are
allowed for with 1.8 m diameter inlets at 7 m centres. With a normal operating flow
velocity of 4 m/s each pipe stack can discharge 12.6 m3/s. The water will be
discharged through 1.2 m diameter sleeve valves.
The estimated maximum environmental flow requirement is 400 m3/s in February.
Whilst it can be expected that the dam would normally overflow during this time,
allowance has been made for the installation of two 3.0 m wide by 3.5 m high radial
gates to act as bottom outlets
11.7.8 Flood Diversion Works
The first stage of the river diversion will consist of an approximately semi circular 8 m
high rollcrete cofferdam that will be built on the left hand side of the river valley to
close off 250 m of the river channel. Culverts will be installed in the rollcrete for
diversion purposes during the second stage.
The second stage will require 15 m high rollcrete upstream and downstream
cofferdams to link the right flank with the already completed dam.
11.7.9 Access Roads and Site Establishment
Access to the site is difficult due to the steep valley sides. There is also no space
available at the dam site for site establishment. For the purposes of the preliminary
design a gravel access road on the left bank was costed. The access road will be
prone to frequent flooding unless it can be located above approximately 10 m above
the river bed level.
11.7.10 Dam Raising
According to the systems analysis, the projected future downstream demands may
require a live storage volume of 1 500 million m3. The 50-year sediment volume was
estimated at approx 600 million m3. The total storage volume would be
2 100 million m3 at a spillway height of 54.6 m. This would require a 29.5 m raising of
the re-regulating dam.

Pre-feasibility Study into Measures to Improve the Management of the Lower Orange River FINAL
DAM DEVELOPMENT OPTIONS – VOLUME 1 MARCH 2005 108
The re-regulating dam can be raised by adding rollcrete on the downstream side. In
order to allow for such an eventuality the Outlet Works were moved 24 m
downstream in the preliminary design. The Intake Tower will be extended vertically
whilst adding further intakes to the pipe stacks.
11.7.11 Hydropower Potential
The available flow rate for hydropower generation was taken as the monthly demand
figures plus the minimum EFR. The average flow rate over a full year was estimated
at 15.4 m3/s. The minimum available head is 20.3 m.
The maximum generating capacity is 4.2 MW. The total annual power generation
was estimated at 21.3 GWh.
The estimated capital cost of the power station is R30 million, which allows for all civil
and mechanical/electrical works up to and including the switchgear at the dam site.
No allowance was made for the cost of any distribution lines. The estimated potential
income is R3.4 million per annum, based on a selling rate of R0.12 per kWh and a
carbon emission reduction subsidy of R0.04 per kWh.
11.8 Cost Estimate
The total project cost for a rollcrete re-regulating dam at the Vioolsdrif A site at
April 2004 rates is estimated to be R 561 million. The costs for the raising of the dam
to 600 million m3 and 1300 million m3 capacity was also calculated at the same basis
to enable the economic analysis of further options.
11.9 Economic Analysis
The Boegoeberg, Vioolsdrif and Komsberg sites were compared on an engineering
economic basis. It firstly proved that the Vioolsdrif site is more beneficial than the
Boegoeberg site for the full spectrum of capacities investigated. Initially, a re-
regulating dam at Komsberg seemed more beneficial than at Vioolsdrif, but after
more detailed mapping was obtained, Vioolsdrif proved to be the more economic site
for the re-regulating dam.
The calculation of the URV for the different Vijoolsdrift options, based on the April
2004 cost estimates and 2005 URV base date, were performed and the results are
Pre-feasibility Study into Measures to Improve the Management of the Lower Orange River FINAL
DAM DEVELOPMENT OPTIONS – VOLUME 1 MARCH 2005 109
indicated in Table 10.3. The analysis proved that the provision for future raising of
the re-regulating dam is not that costly and it is recommended that it should be
designed accordingly. The analysis also proved that it is economically more feasible
to raise the re-regulating dam than to construct the full capacity dam at once. The
optimum phasing was not determined.
The analysis proved that the re-regulating dam only will not make adequate additional
yield available to serve the full demand until 2025. Additional storage on the system
is required. This additional storage can be created at Vioolsdrift or elsewhere outside
of the study area. The investigation of these options is outside the scope of this
study.

Pre-feasibility Study into Measures to Improve the Management of the Lower Orange River FINAL
DAM DEVELOPMENT OPTIONS – VOLUME 1 MARCH 2005 110
12. REFERENCES
Council for Geoscience, 1998 The Mineral Resources of South Africa, Sixth Edition,
Handbook 16, edited by MGC Wilson and CR
Anhaeusser.
Design of Small Dams, 1987 United States Department of the Interior, Bureau of
Reclamation.
DWAF, 1996 Vaal Augmentation Planning Study: Guidelines for the
preliminary sizing, costing and engineering economic
evaluation of planning options, Directorate Project
Planning, January 1996.
DWAF, 1998a Orange River Development Project Replanning Study,
Potential Dam Development and Hydro Power Options,
Directorate Project Planning, May 1998.
Kinahan, J, 2003 A preliminary archaeological assessment of the lower
Orange River, Quaternary Research Services.
Kovacs, ZP, 1988 Regional Maximum Flood Peaks in Southern Africa,
Technical Report TR 137.
Mason, PJ, 2004 A guide to Energy Dissipaters, HRW, March 2004.
Ninham Shand Desktop report: The ecological importance and
sensitivity of the lower Orange River downstream of 20o
longitude, to the Orange-Fish River confluence.

Pre-feasibility Study into Measures to Improve the Management of the Lower Orange River FINAL
DAM DEVELOPMENT OPTIONS – VOLUME 2 (APPENDICES) MARCH 2005
APPENDICES
A Guidelines for the Preliminary Sizing, Costing and Engineering Economic
Evaluation of Planning Options
B Locality Map
C Location of Potential Dam Sites (1:250 000 and 1:500 000 Maps)
C1 to C8: Orange River Mouth to 20o longitude (including pre-screening
factors)
C9 to C12: 20o Longitude to Vanderkloof Dam
C13: Fish River
C14: Correspondence with South African Department of Minerals
and Energy
D Layouts of Potential Dam Sites (1:20 000 maps)
E Cross-sections of Potential Dam Sites
F Longitudinal Profile of the Orange River
G Report on the Sedimentation Analysis
H Preliminary Design of Vioolsdrif Re-regulating Dam
I Unit Reference Value Calculations
I1: Pre-screened Options and Scenarios
I2: Management Options
I3: Vioolsdrift Development Options


Pre-feasibility study into measures to improve
the management of the Lower Orange River FINAL
DAM DEVELOPMENT OPTIONS MARCH 2005
APPENDIX A
Guidelines for the Preliminary Sizing, Costing and Engineering Economic
Evaluation of Planning Options

Pre-feasibility study into measures to improve
the management of the Lower Orange River FINAL
DAM DEVELOPMENT OPTIONS MARCH 2005
APPENDIX B
Locality Map
Pre-feasibility study into measures to improve
the management of the Lower Orange River FINAL
DAM DEVELOPMENT OPTIONS MARCH 2005
APPENDIX C
Location of Potential Dam Sites
(1:250 000 and 1:500 000 maps)
C1 to C8: Orange River Mouth to 20º Longitude (including Pre-
screening Factors)
C9 to C12: 20º Longitude to Vanderkloof Dam
C13: Fish River
Pre-feasibility study into measures to improve
the management of the Lower Orange River FINAL
DAM DEVELOPMENT OPTIONS MARCH 2005
APPENDIX C14
Correspondence with South African Department of Minerals and Energy

Pre-feasibility study into measures to improve
the management of the Lower Orange River FINAL
DAM DEVELOPMENT OPTIONS MARCH 2005
APPENDIX D
Layouts of Potential Dam Sites
(1:20 000 maps)
Pre-feasibility study into measures to improve
the management of the Lower Orange River FINAL
DAM DEVELOPMENT OPTIONS MARCH 2005
APPENDIX E
Cross-sections of Potential Dam Sites

Pre-feasibility study into measures to improve
the management of the Lower Orange River FINAL
DAM DEVELOPMENT OPTIONS MARCH 2005
APPENDIX F
Longitudinal Profile of the Orange River

Pre-feasibility study into measures to improve
the management of the Lower Orange River FINAL
DAM DEVELOPMENT OPTIONS MARCH 2005
APPENDIX G
Report on Sedimentation Analysis
Pre-feasibility study into measures to improve
the management of the Lower Orange River FINAL
DAM DEVELOPMENT OPTIONS MARCH 2005
APPENDIX H
Preliminary Design of Vioolsdrif Re-regulating Dam
Pre-feasibility study into measures to improve
the management of the Lower Orange River FINAL
DAM DEVELOPMENT OPTIONS MARCH 2005
APPENDIX I
Unit Reference Value Calculations
I1: Pre-screened Options and Scenarios
I2: Management Options
I3: Vioolsdrif Development Options

Pre-feasibility study into measures to improve
the management of the Lower Orange River FINAL
DAM DEVELOPMENT OPTIONS MARCH 2005
Photographs

Pre-feasibility study into measures to improve
the management of the Lower Orange River FINAL
DAM DEVELOPMENT OPTIONS MARCH 2005
Figures

Pre-feasibility study into measures to improve
the management of the Lower Orange River FINAL
DAM DEVELOPMENT OPTIONS MARCH 2005
Cost estimate

Pre-feasibility study into measures to improve
the management of the Lower Orange River Draft V2.5
DAM DEVELOPMENT OPTIONS MARCH 2005 1
No PAY DESCRIPTION UNIT RATE QUANTITY AMOUNT
REF 01-Apr-04 Rand Rand
1 5.1 Clearing 5.1.1 (a) sparse ha 4 000 7 28 000 5.1.2 (b) bush ha 8 000 2 16 000 5.1.3 (c) trees ha 16 000 1 16 000 2 5.2 River diversion Sum 42 000 000 3 5.3 Excavation
(a) Bulk 5.3.1 (i) all materials m3 23 131960 3 035 080 5.3.3 (ii) extra over for rock m3 42 23300 978 600 (b) Confined 5.3.2 (i) all materials m3 34 4150 141 100 5.3.3 (ii) extra over for rock m3 57 16600 946 200 5.3.4 (c) Final foundation preparation m2 37 23700 876 900
4 5.4 Drilling & Grouting (a) Curtain grouting m drill 370 4715 1 744 550 (b) Consolidation grouting m drill 370 12300 4 551 000 5 5.6 Formwork 5.6.1 (a) Gang formed m2 100 23030 2 303 000 5.6.2 (b) Intricate m2 210 13200 2 772 000 6 5.7 Concrete 5.7.3 (a) Rollcrete m3 310 217050 67 285 500 5.7.4 (b) Facecrete including waterstop m3 420 19020 7 988 400 5.7.2 (c) Structural m3 470 37820 17 775 400 7 5.8 Reinforcing t 5 200 1890 9 828 000 8 5.9 Mechanical Items 5.9.1 (a) Pipes, valves & gates Sum 14 500 000 5.9.2 (b) Cranes & hoists Sum 1 100 000 5.9.3 (c) Structural steelwork t 16 000 10 160 000
9 5.10 Fencing km 16 000 1 16 000
SUB-TOTAL 178 061 730

Pre-feasibility study into measures to improve
the management of the Lower Orange River Draft V2.5
DAM DEVELOPMENT OPTIONS MARCH 2005 2
No PAY DESCRIPTION UNIT RATE QUANTITY AMOUNT
REF 01-Apr-04
RAND
10 5.11 Landscaping (% of 1-9) % 5 8 903 087
11 5.12 Miscellaneous (% of 1-9) % 15 26 709 260 SUB TOTAL A 213 674 076 12 5.13 Preliminary & General (% of sub-total A) Fixed charges % 15 32 051 111 Time-related charges (3 years) % 25 53 418 519 13 5.14 Preliminary works 5.14.1 (a) Access road km 2 000 000 20.6 41 200 000 5.14.2 (b) Electrical supply to site Sum 4 000 000 5.14.3 (c) Construction water to site Sum 2 000 000 5.14.4 (d) Railhead & materials handling Sum 4 000 000 14 5.15 Accommodation Sum 10 000 000 SUB TOTAL B 360 343 706 15 5.16 Contingencies % 10 36 034 371 (% of sub total B) SUB TOTAL C 396 378 077 16 5.17 Planning design & supervision (% of sub total C) % 15 59 456 712 SUB TOTAL D 455 834 789 17 5.18 VAT (% of sub total D for Namibia) % 15 68 375 218 NETT PROJECT COST 524 210 007 18 5.19 Cost of relocations Sum 2 000 000 19 5.20 Cost of land acquisition Sum (a) Undeveloped ha 4 000 3 800 15 200 000 (b) Developed ha 50 000 200 10 000 000 (c) Compensation for mining and prospecting rights Sum 10 000 000
TOTAL PROJECT COST 561 410 007