Dairy Value Chain - WikispacesDairy+Value+Chain.pdf · Chart 6: Dairy Value Chain in Tanzania, with...
66
1 Dairy Value Chain December 2011 Tanzania Study Conducted by Artur Dillmann ([email protected]) and Maria Ijumba (Faida Market Link, [email protected])
Transcript of Dairy Value Chain - WikispacesDairy+Value+Chain.pdf · Chart 6: Dairy Value Chain in Tanzania, with...

1
Dairy Value Chain
December 2011
Tanzania
Study Conducted by
Artur Dillmann ([email protected]) and
Maria Ijumba (Faida Market Link, [email protected])
2
Table of Contents:
1. INTRODUCTION 12
1.1 BackgroundandContext 12
1.2 Purpose and Objective of Study 12
1.3 Limitations 13
1.4 Methodology 14
2. PESTLE ANALYSIS 16
2.1 The political environment 16
2.2 The economic environment 17
2.3 The social environment 18
2.4 The technological environment 18
2.5 The legal environment 19
2.6 The environmental issues 19
3. DAIRY VALUE CHAIN 20
3.1 Basic conditions of dairy sector 20
3.2 Dairy value chain map 22
3.3 Participants of the dairy value chain 25 3.3.1 Actors 25 3.3.2 Meso‐level stakeholders 27 3.3.3 Macro‐level stakeholders 27
3.4 Findings of primary data collection 27 3.4.1 Production 27 3.4.2 Seasonality of processing 28 3.4.3 Sales prices 30 3.4.4 Capacity 30 3.4.5 Relationships 31 3.4.6 Supporters 32 3.4.7 Issues of concern 33 3.4.8 Integration (forward/backward) 34 3.4.9 Barriers (entry/exit) 34 3.4.10 Weakest actor 35
3
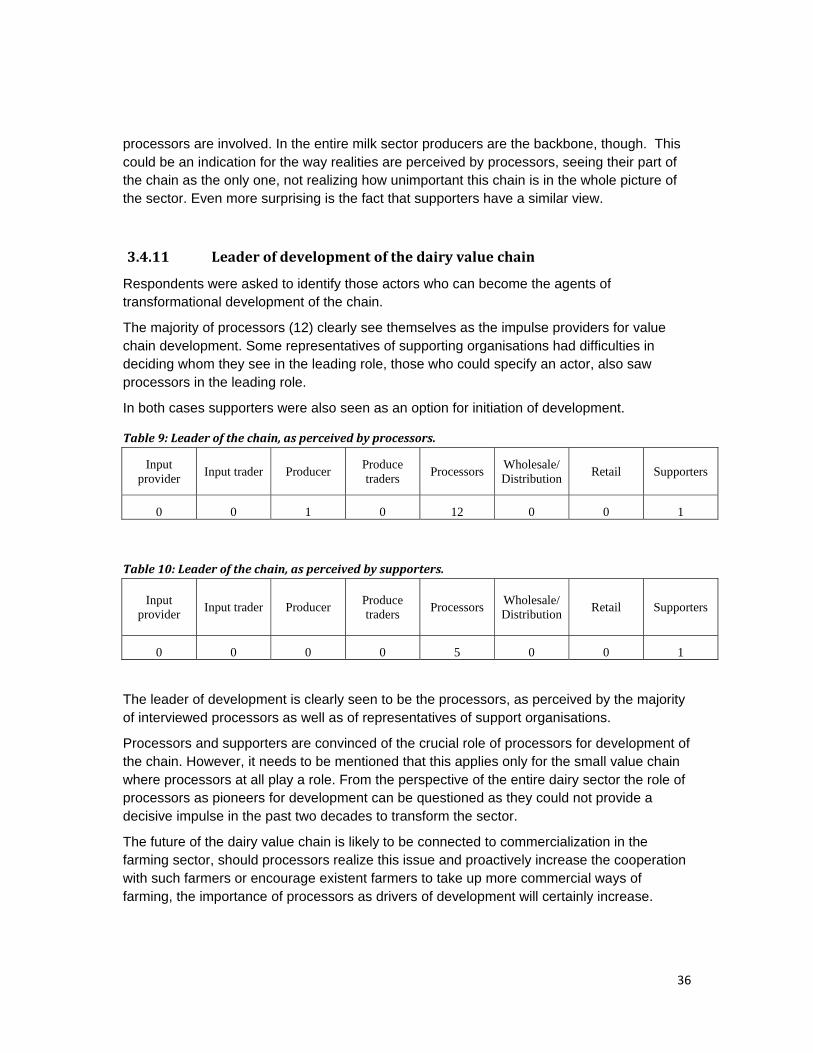
3.4.11 Leader of development of the dairy value chain 36
3.5 Costs 37 3.5.1 Costs of milk production 37 3.5.2 Costs of milk processing 42 3.5.3 Costs of milk trading 43
3.6 Suggestions for cost reductions 43
3.7 Margin Analysis 45
3.8 Consumer Perspective 47
3.9 SWOT Analysis 48 3.9.1. Strengths and Weaknesses Analysis 48 3.9.2. Threats Analysis 49 3.9.3. General SWOT 49
3.10 Suggested Interventions 52
4. RECOMMENDATIONS 56
5.1 General upgrading suggestions 58 5.2.1 Sector Development Strategy 58 5.2.2 Regular actors and stakeholders meetings 58 5.2.3 Web site for information exchange, improvement of transparency in the chain 59
5.2 Functional Upgrading 59 5.2.1 Close cooperation with macro‐level stakeholders (advocacy, policy, regulations) 59 5.2.2 Public Private Partnerships 60 5.2.3 Development of new management models (franchising) 60
5.3 Process Upgrading 61 5.3.1 Streamlining of raw material exchange processes 61 5.3.2 Introduction of energy saving measures 61 5.3.3 Improvement of dairy stock (not in traditional herds) 62 5.3.4 Skill development ‐ scholarships / excellence centres 63 5.3.5 Accounting systems at enterprise level 63 5.3.6 Value chain finance 63
5.4 Product Upgrading 64 5.4.1 Specific products for specific market segments 64 5.4.2 Improvement of core products 64 5.4.3 Improvement of packaging, labelling, brand name, quality assurance, etc. 65
5.5 Channel Upgrading 65 5.5.1 Deviating the chain towards high value products 65 5.5.2 Targeting urban consumers for high value dairy products 65
4
5.5.3 Institutional marketing (HRI) 65
5.6 Most urgent Interventions 65
Annexes:
Annex 1: Terms of Reference
Annex 2: List of people interviewed
Annex 3: Reference List
Annex 4: Questionnaires
Annex 5: Lists of names of VC actors
Annex 6: Capacity utilization of dairy plants
Annex 7: Slides of validation workshop presentation
5
List of Tables:
Table 1: Number of interviews on each level of the value chains 15 Table 2: Current functions of the value chain actors 22 Table 3: Share of milk (cultured and fresh) of total processed amount, in per cent 28 Table 4: Sales prices of milk and mtindi, wholesale prices 30 Table 5: Prioritization of constraints, dairy processors’ perspective 34 Table 6: Prioritization of constraints, supporters’ perspective 34 Table 7: Weakest actor of the dairy value chain, as perceived by processors 35 Table 8: Weakest actor of the dairy value chain, as perceived by meso and macro stakeholders 35 Table 9: Leader of the chain, as perceived by processors. 36 Table 10: Leader of the chain, as perceived by supporters. 36 Table11: Example 1of calculation of milk production costs, per day. Fodder prices being at max. level 37 Table12: Example 2 of calculation of milk production costs, per day. Fodder prices being at max. level 38 Table13: Delivery options of commercial producers 39 Table 14: Processing costs in a small scale dairy processing plant, case study 42 Table 15: Processing costs in a large dairy processing plant, case study 43 Table 16: Cost reduction suggestions 44 Table 17: Margin analysis along the dairy value chain 45 Table 18: Available resources in own enterprises, as perceived by processors. 49 Table 19: Threats according to 5 forces of M. Porter on enterprise level, as perceived by processors 49 Table 20: Suggested most urgent interventions in the dairy value chain, as perceived by processors 52 Table 21: Suggested most urgent interventions in the dairy value chain, as perceived by supporting agencies 54
List of Charts:
Chart 1: An Overview Map of the Dairy Sector (RLDC/NIRAS Survey on Dairy Products Market in Tanzania, 2010) 21 Chart 2: Dairy Market in Tanzania 22 Chart 3: Generic Dairy Value Chain in Tanzania 24 Chart 4: Present main Dairy Value Chains in Tanzania 24 Chart 5: Present Dairy Value Chain in Tanzania, with processing 25 Chart 6: Dairy Value Chain in Tanzania, with focus on improved production practices 25 Chart 7: Seasonality of dairy processing 28 Chart 8: Reported capacity utilization of small scale dairy plants 31 Chart 9: Average number of contacts of processors with other value chain actors 32 Chart 10: Comparison of margins 39 Chart 11: Margin Analysis 45 Chart 12: Margin analysis along dairy value chain 46 Chart 13: Costs and margin distribution along dairy value chain, for 1 litre of milk 47
6
Abbreviations:
ASDP Agricultural Sector Development Programme
BRELA Business Registration and Licensing Agency
CAADP Comprehensive African Agricultural Development Programme
DANIDA Danish Ministry of Foreign Affairs
FDI Foreign Direct Investment
GDP Gross Domestic Product
HRI Hotel, Restaurant, Institutions
MAFSC Ministry of Agriculture, Food Security and Cooperatives
NGO Non-Government Organisation
PASS Private Agriculture Sector Support
PPP Public Private Partnerships
RLDC Rural Livelihood Development Company
SACCOS Savings and Credit Cooperatives
SCF Small and medium enterprise competitiveness facility
SIDO-MUVI Small Industries Development Organisation’s Muungano wa Vikundi Vijijini Programme
SME Small and medium enterprise
SWOT Strengths, Weaknesses, Opportunities and Threats
TBS The Tanzania Bureau of Standards
TFDA Tanzania Food and Drug Authority
TIB Tanzania Investment Bank
VAT Value added tax
7
Summary
The dairy sector in Tanzania can be divided into three distinctive parts: the subsistence farming system with home consumption, semi-subsistence system with partial link to the market via informal channels and the improved farming system utilizing the formal marketing channels.
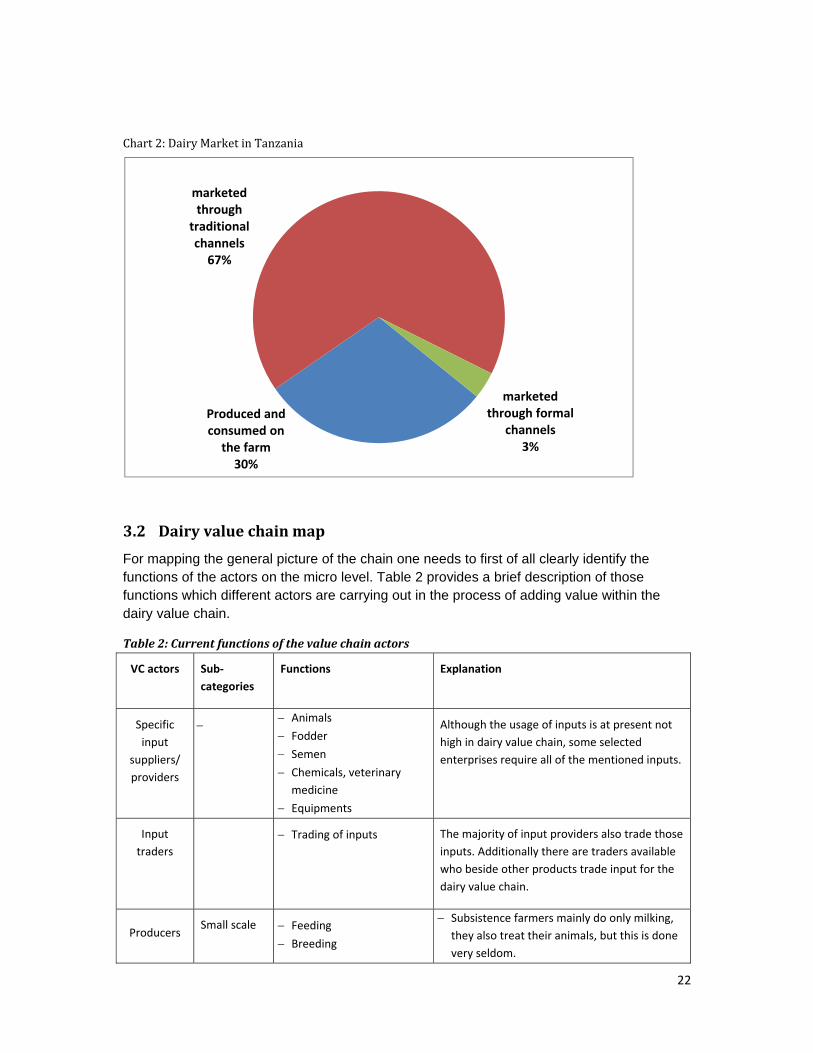
According to NIRAS/RLDC: Survey on Dairy Products Market in Tanzania, 2010 in the subsistence farming system milk is produced on the farm and entirely consumed by the farming community, this part of the dairy sector accounts for 29.5 % of total milk consumed in the country. Sixty seven percent of milk consumed in the country enters the market but it is marketed by hawkers through traditional channels. Considering the size of this sector, as well as its regional coverage it seems to be logical that the majority of interventions with the task of improvement of the dairy value chain were focussing their activities on this sector in the past two decades.
According to NIRAS/RLDC the formal market dealing with processed dairy products accounts only for 3.5 % of the total milk consumed in the country. Only 0.35 % of the total milk consumption is processed by small enterprises; about 1.8 % of consumed milk is imported; 1,64 % is processed in large scale enterprises, partly utilizing imported raw materials.
The purpose of this study was to identify constraints impacting the competiveness of food processing industries in the dairy sub-sector in order to suggest interventions to overcome these constraints. Consequently the dairy value chain was analysed from the perspective of dairy processors.
The processing industry consists of few large scale enterprises and a much larger number of small scale enterprises. The procedure of purchasing milk as raw material has been found to be similar independent of the size of the enterprise; on the marketing side the differences were significant dependent on the size of the enterprise.
Most interviewed processors were selling fresh milk, but their preference is with more processed dairy products. Interviewed enterprises had on average only a share of milk of about 30% of totally sold dairy products, 33% was sold as cultured milk and the remaining dairy products had a larger share of 37%.Few enterprises exclusively sold only processed products, such as e.g. cheese.
Seasonality was mentioned by all respondents as one of the main issues of concern. Selling milk to processing plant is the least profitable option for producers of milk. In dry season, when less milk is available and the prices are higher, the necessity to sell milk to processors is even lower. This fact is even exacerbated with the coincidence of the highest demand for milk consumption in dry season or low production season. All producers sell first directly to consumers, what they cannot sell is delivered to processors, thus the processors get less in dry season.
The overall results of capacity utilization of Tanzanian dairy processors are in line with the research findings of the study. The capacity utilization per month of small processors was found to be on average between 35% and 43%.Considering the non-harmonized production lines in combination with regular power cuts, the average capacity is much higher.
8
An average processor deals with about 600 other actors along the value chain. This requires a huge managerial effort. The main bottleneck seems to be raw material collection; processors need to be in contact with almost one person per litre of collected milk. From this perspective building lasting relationships with producers and hawkers can even be more important than any internal procedures in the factory.
The interviewed processors in the dairy value chain received support from 26 different organisations on the meso-level. Considering the fact that such a large number of various organisations provided support to the sector, it is surprising to see how little development the dairy sector experienced in past decades. Traditional approaches for value chain improvement are not likely to be fruitful, as it is probable that everything was tried out already. What is required now is out of the box thinking, new approaches to development which have not been tried yet.
Technology (qualification of personnel, machinery, equipment, product development, technical services) was identified by representatives of processing industry as the main issue of concern, followed by input supplies and finance. Infrastructural problems, management and market access are of medium importance. Policy/regulations/standards are of least importance. Representative of supporting agencies saw technology even stronger as the first limiting factor of value chain development. Processors further see producers as the weakest part of the chain. The meso- and macro-stakeholders of the chain have a similar assessment of the situation; seeing farmers as the weakest part of the chain. Processors who deal with less than 2% of totally produced milk in Tanzania think that producers are the problem. In the entire milk sector producers are undoubtedly the backbone, though. Processors seem to see their part of the chain as the only one, not realizing the limited importance of this part of the chain in the whole picture of the sector. Even more surprising is the fact that supporters have a similar view. Processors and supporters are convinced of the crucial role of processors for development of the chain.
The SWOT analysis leaves a positive picture of the dairy value chain, strengths and opportunities are perceived to be significant; threats are not limiting the potential development and weaknesses are many but they are on technical level, which can be easily surpassed. The SWOT analysis leaves the dairy value chain with bright future perspective. Processors see human resources as the weakest point of their enterprises, followed by lack of financial resources; they think that they are equipped sufficiently, but do not have the right knowledge and financial means to utilize their equipment fully. Dairy processors are not threatened by the environment of the industry.
Dairy production in Tanzania is done in extensive farming systems or on a more commercial level. Commercial dairy producers have the options of milk delivery to final consumers, to institutional buyers, and to processors. The rationale of commercial dairy producer is to sell as much as they can directly to consumers, followed by institutional buyers, and only what cannot be sold to those two buyers should be sold to processors. Processors do not really have a bargaining power, as a buyer of secondary importance they are fully dependent on the primary market developments. Traditional milk production has a different rationale, there are close to no costs involved in production of milk, the margins are high (close to 100 %) as labour, inventory and capital costs are not properly accounted for, and there are additionally hardly any risks involved.
9
Accordingly margin analysis along the value chain is very different, dependent on which farming system is considered. In traditional systems the margins of farmers are almost equal to turnover, hawkers as intermediaries are operating their activities at a gross margin of close to 50 %, processors have a margin of 32 %. If a more commercial oriented farming system is considered, than the margins of farmers are just at about 9%, processors are at the same level of 32 %, and retailers have a significant share, which starts at minimum 20 % but can be few times higher.
From consumer perspective at the present situation of the dairy market there is no pressing evidence that one should buy processed milk. Processed milk seems to be of better quality, but no assurance of quality control measures can be provided. The vast majority of consumers are therefore likely to buy the much cheaper unprocessed produce from hawkers as long as there is no full guarantee of the quality of processed products. The price of processed milk can easily be double of the unprocessed milk.
Recommendations
In the subsistence farming system milk is produced on the farm and entirely consumed by the farming community. Interventions in this sector can have a food security or nutritional orientation, but from value chain perspective the option of interventions are very limited. The only thinkable intervention is to provide market access to actors of this chain, thus transferring them into the next level of chain, assisting them to market their milk via informal channels.
Sixty seven percent of milk consumed in the country is produced in semi subsistence farming systems and marketed in unprocessed form through traditional channels. In the past the majority of interventions in the dairy value chain were focussing their activities in this sector. Although this sector seems to be the natural entry point for interventions, intensive efforts by a large variety of support agencies did not lead to significant results. Interventions in this part of the chain are necessary as they target the majority of dairy producers, but if strategic improvement of the dairy value chain is considered this part of the chain is not likely to provide the foundation for its development.
The future of the dairy value chain is in connecting the processing sector with the commercial farmers on one side and formal markets on the other side. Increase of milk production with intensive farming systems should be the aim. The task should be to increase the amount collected per farmer; processors need to reduce the number of required contacts in the chain in order to sustain their operations. Establishment of large number of small commercial farms in the vicinity of processing plants should be the aim of value chain development.
Future interventions in dairy value chain should completely ignore the subsistence farming sector, they should be designed to improve the operations of the semi-subsistence sector as a temporary intervention, but for the strategic development of the sector the entire concentration should be on intensive farming system with formal dairy value chain.
There are a variety of options to improve the existent dairy value chain that is based on extensive milk production in traditional herds. In such a system most significant
10
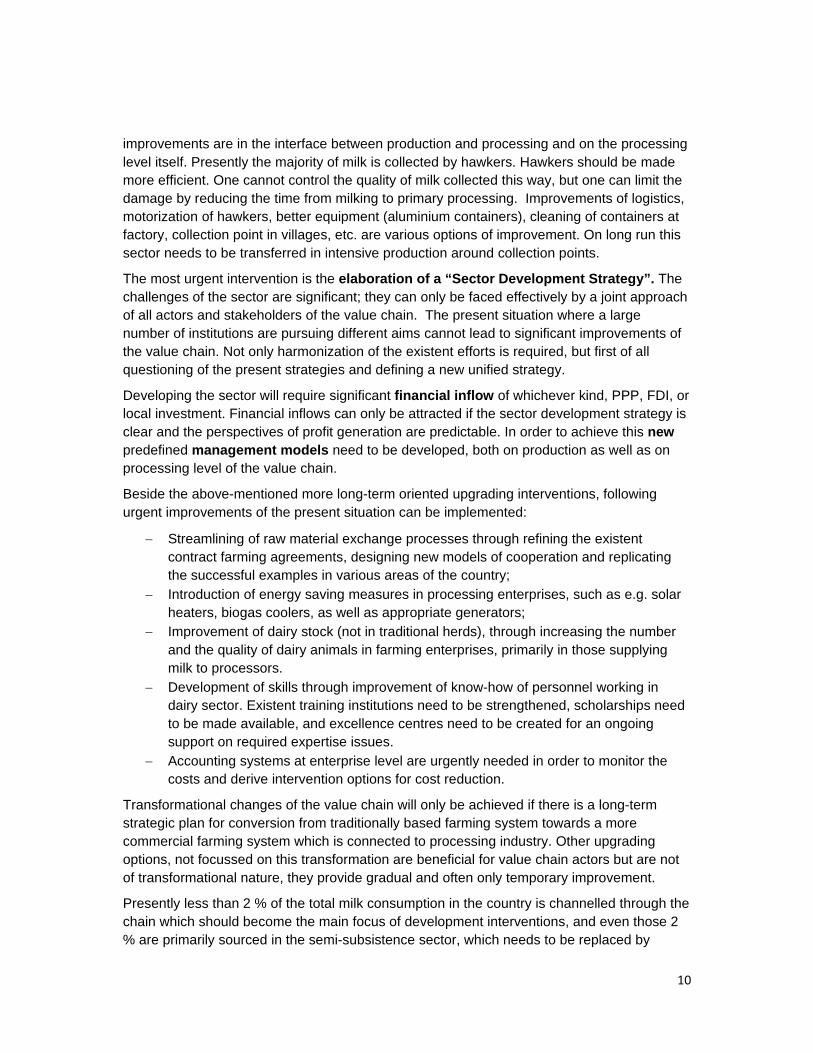
improvements are in the interface between production and processing and on the processing level itself. Presently the majority of milk is collected by hawkers. Hawkers should be made more efficient. One cannot control the quality of milk collected this way, but one can limit the damage by reducing the time from milking to primary processing. Improvements of logistics, motorization of hawkers, better equipment (aluminium containers), cleaning of containers at factory, collection point in villages, etc. are various options of improvement. On long run this sector needs to be transferred in intensive production around collection points.
The most urgent intervention is the elaboration of a “Sector Development Strategy”. The challenges of the sector are significant; they can only be faced effectively by a joint approach of all actors and stakeholders of the value chain. The present situation where a large number of institutions are pursuing different aims cannot lead to significant improvements of the value chain. Not only harmonization of the existent efforts is required, but first of all questioning of the present strategies and defining a new unified strategy.
Developing the sector will require significant financial inflow of whichever kind, PPP, FDI, or local investment. Financial inflows can only be attracted if the sector development strategy is clear and the perspectives of profit generation are predictable. In order to achieve this new predefined management models need to be developed, both on production as well as on processing level of the value chain.
Beside the above-mentioned more long-term oriented upgrading interventions, following urgent improvements of the present situation can be implemented:
− Streamlining of raw material exchange processes through refining the existent contract farming agreements, designing new models of cooperation and replicating the successful examples in various areas of the country;
− Introduction of energy saving measures in processing enterprises, such as e.g. solar heaters, biogas coolers, as well as appropriate generators;
− Improvement of dairy stock (not in traditional herds), through increasing the number and the quality of dairy animals in farming enterprises, primarily in those supplying milk to processors.
− Development of skills through improvement of know-how of personnel working in dairy sector. Existent training institutions need to be strengthened, scholarships need to be made available, and excellence centres need to be created for an ongoing support on required expertise issues.
− Accounting systems at enterprise level are urgently needed in order to monitor the costs and derive intervention options for cost reduction.
Transformational changes of the value chain will only be achieved if there is a long-term strategic plan for conversion from traditionally based farming system towards a more commercial farming system which is connected to processing industry. Other upgrading options, not focussed on this transformation are beneficial for value chain actors but are not of transformational nature, they provide gradual and often only temporary improvement.
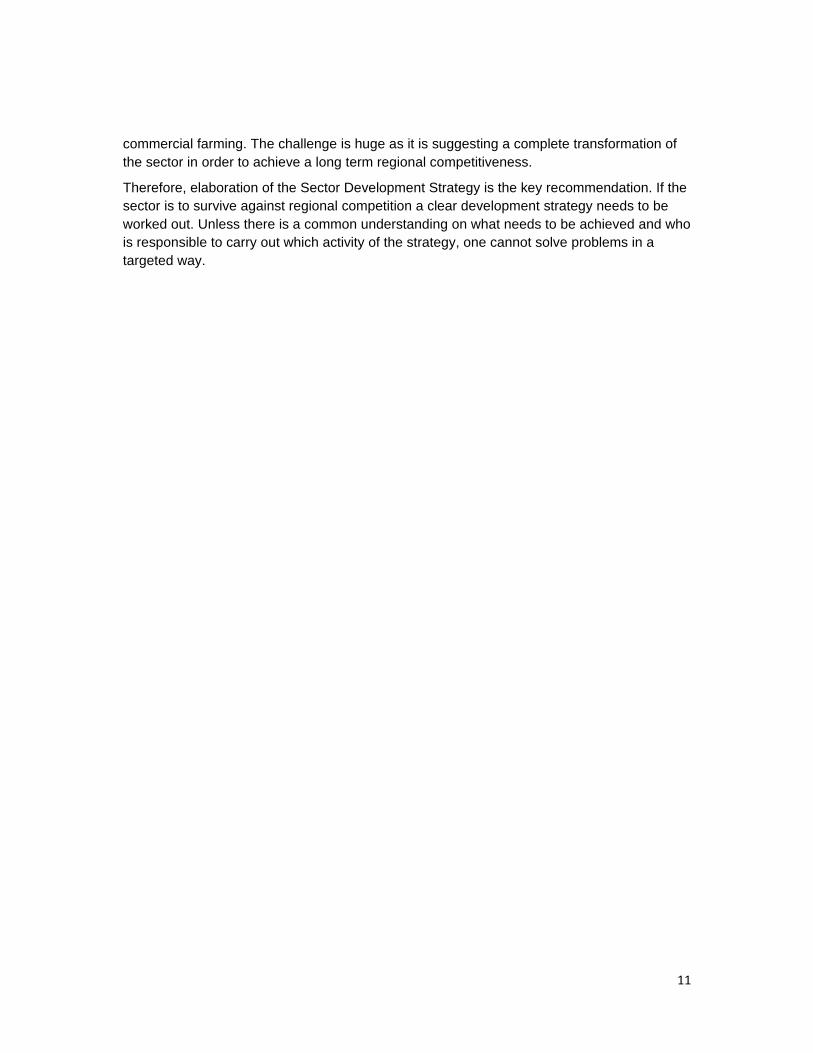
Presently less than 2 % of the total milk consumption in the country is channelled through the chain which should become the main focus of development interventions, and even those 2 % are primarily sourced in the semi-subsistence sector, which needs to be replaced by
11
commercial farming. The challenge is huge as it is suggesting a complete transformation of the sector in order to achieve a long term regional competitiveness.
Therefore, elaboration of the Sector Development Strategy is the key recommendation. If the sector is to survive against regional competition a clear development strategy needs to be worked out. Unless there is a common understanding on what needs to be achieved and who is responsible to carry out which activity of the strategy, one cannot solve problems in a targeted way.
12
B.REPORT
1. Introduction
1.1 Background and Context
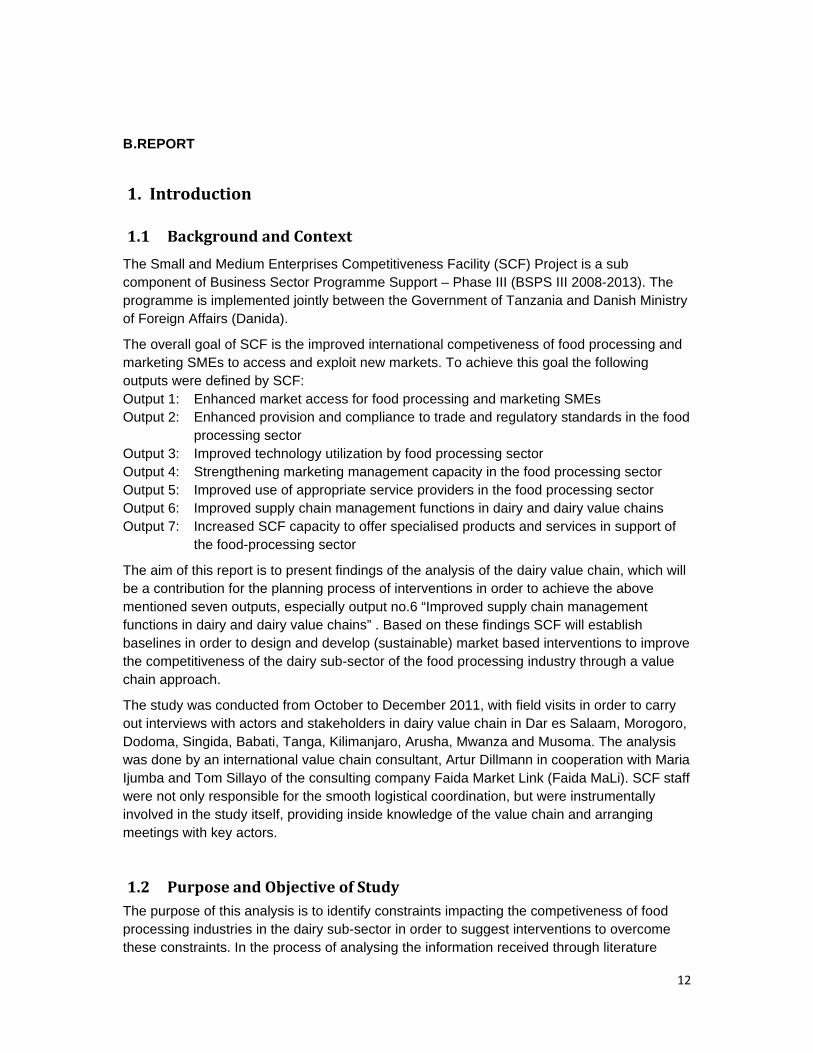
The Small and Medium Enterprises Competitiveness Facility (SCF) Project is a sub component of Business Sector Programme Support – Phase III (BSPS III 2008-2013). The programme is implemented jointly between the Government of Tanzania and Danish Ministry of Foreign Affairs (Danida).
The overall goal of SCF is the improved international competiveness of food processing and marketing SMEs to access and exploit new markets. To achieve this goal the following outputs were defined by SCF: Output 1: Enhanced market access for food processing and marketing SMEs Output 2: Enhanced provision and compliance to trade and regulatory standards in the food
processing sector Output 3: Improved technology utilization by food processing sector Output 4: Strengthening marketing management capacity in the food processing sector Output 5: Improved use of appropriate service providers in the food processing sector Output 6: Improved supply chain management functions in dairy and dairy value chains Output 7: Increased SCF capacity to offer specialised products and services in support of
the food-processing sector
The aim of this report is to present findings of the analysis of the dairy value chain, which will be a contribution for the planning process of interventions in order to achieve the above mentioned seven outputs, especially output no.6 “Improved supply chain management functions in dairy and dairy value chains” . Based on these findings SCF will establish baselines in order to design and develop (sustainable) market based interventions to improve the competitiveness of the dairy sub-sector of the food processing industry through a value chain approach.
The study was conducted from October to December 2011, with field visits in order to carry out interviews with actors and stakeholders in dairy value chain in Dar es Salaam, Morogoro, Dodoma, Singida, Babati, Tanga, Kilimanjaro, Arusha, Mwanza and Musoma. The analysis was done by an international value chain consultant, Artur Dillmann in cooperation with Maria Ijumba and Tom Sillayo of the consulting company Faida Market Link (Faida MaLi). SCF staff were not only responsible for the smooth logistical coordination, but were instrumentally involved in the study itself, providing inside knowledge of the value chain and arranging meetings with key actors.
1.2 Purpose and Objective of Study The purpose of this analysis is to identify constraints impacting the competiveness of food processing industries in the dairy sub-sector in order to suggest interventions to overcome these constraints. In the process of analysing the information received through literature
13
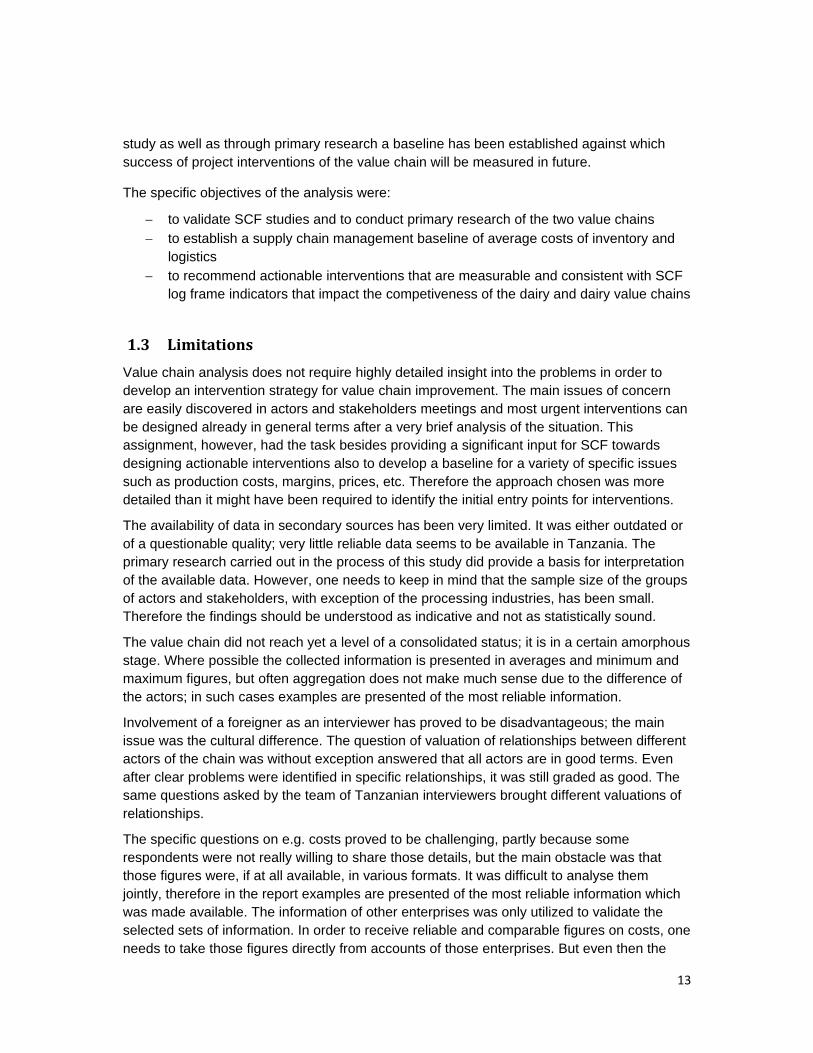
study as well as through primary research a baseline has been established against which success of project interventions of the value chain will be measured in future.
The specific objectives of the analysis were:
− to validate SCF studies and to conduct primary research of the two value chains − to establish a supply chain management baseline of average costs of inventory and
logistics − to recommend actionable interventions that are measurable and consistent with SCF
log frame indicators that impact the competiveness of the dairy and dairy value chains
1.3 Limitations
Value chain analysis does not require highly detailed insight into the problems in order to develop an intervention strategy for value chain improvement. The main issues of concern are easily discovered in actors and stakeholders meetings and most urgent interventions can be designed already in general terms after a very brief analysis of the situation. This assignment, however, had the task besides providing a significant input for SCF towards designing actionable interventions also to develop a baseline for a variety of specific issues such as production costs, margins, prices, etc. Therefore the approach chosen was more detailed than it might have been required to identify the initial entry points for interventions.
The availability of data in secondary sources has been very limited. It was either outdated or of a questionable quality; very little reliable data seems to be available in Tanzania. The primary research carried out in the process of this study did provide a basis for interpretation of the available data. However, one needs to keep in mind that the sample size of the groups of actors and stakeholders, with exception of the processing industries, has been small. Therefore the findings should be understood as indicative and not as statistically sound.
The value chain did not reach yet a level of a consolidated status; it is in a certain amorphous stage. Where possible the collected information is presented in averages and minimum and maximum figures, but often aggregation does not make much sense due to the difference of the actors; in such cases examples are presented of the most reliable information.
Involvement of a foreigner as an interviewer has proved to be disadvantageous; the main issue was the cultural difference. The question of valuation of relationships between different actors of the chain was without exception answered that all actors are in good terms. Even after clear problems were identified in specific relationships, it was still graded as good. The same questions asked by the team of Tanzanian interviewers brought different valuations of relationships.
The specific questions on e.g. costs proved to be challenging, partly because some respondents were not really willing to share those details, but the main obstacle was that those figures were, if at all available, in various formats. It was difficult to analyse them jointly, therefore in the report examples are presented of the most reliable information which was made available. The information of other enterprises was only utilized to validate the selected sets of information. In order to receive reliable and comparable figures on costs, one needs to take those figures directly from accounts of those enterprises. But even then the
14
accounting systems are diverse, and in some cases not even available. In order to increase the sample size several focus group interviews (especially on producers’ level) were carried out. The discussions in those groups were fruitful, showing that there is very little exchange of information on horizontal level. Answers to specific questions proved to be difficult to be obtained; long discussions were held on each issue not really leading to conclusions.
1.4 Methodology
One of the main requirements of every value chain analysis is the issue of evidence-based findings. Accuracy in the process of collection of information and the subsequent data processing is the precondition for elaboration of realistic conclusions and recommendations.
An important part of the process was the study of the available information, such as internal project documents as well as relevant external documents. The list of utilized documents can be found in Annex 3: References. Additionally, a significant number of company internal documents were utilized, which cannot be disclosed here due to confidentiality reasons.
The secondary data collection was verified by primary data collection, for which specific questionnaires were developed. These standardised questionnaires were worked out for the following groups of interviewees and can be found in Annex 4:
Questionnaire 1: Input traders Questionnaire 2: Service providers at micro level Questionnaire 3: Producers Questionnaire 4: Traders/Wholesalers/Distributors Questionnaire 5: Processors Questionnaire 6: Retailers Questionnaire 7: Meso-, Macro-Supporters
The Terms of Reference provided the guideline for designing the questionnaires. The aim was to collect only data which provides information towards the tasks specified in the terms of reference.
A significant part of each interview were the issues of how do the interviewees see themselves within the value chain and what do they suggest in order to improve the functionality of the chain. Comparing the perceptions of the roles of different actors and stakeholders, their understanding of the present status of the chain and their vision for its improvement was valuable in suggesting specific interventions, which will have high probability of ownership during their implementation by value chain actors.
The scope of this assignment did not justify a statistically sound evaluation of information. The sample size of respondents in each of the above-mentioned groups of interviewees was too small to apply any statistical evaluation methodology. Within the given timeframe as many stakeholders and actors as possible were interviewed in order to receive a broad picture; however, this still remained a qualitative assessment. List of interviewed people can be found in the Annex 2; Table 1 gives the number of interviewed people on each level of the value chain.
On macro level representatives of the relevant Ministries as well as regulatory bodies were
15
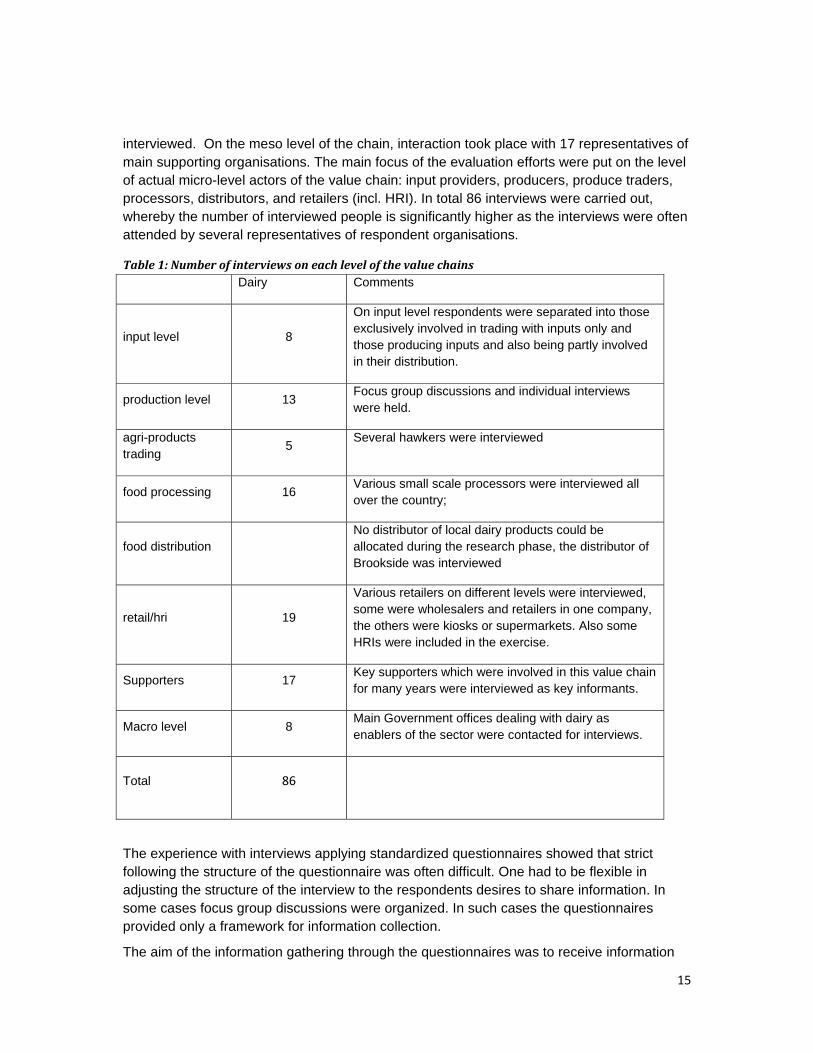
interviewed. On the meso level of the chain, interaction took place with 17 representatives of main supporting organisations. The main focus of the evaluation efforts were put on the level of actual micro-level actors of the value chain: input providers, producers, produce traders, processors, distributors, and retailers (incl. HRI). In total 86 interviews were carried out, whereby the number of interviewed people is significantly higher as the interviews were often attended by several representatives of respondent organisations.
Table 1: Number of interviews on each level of the value chains Dairy Comments
input level 8
On input level respondents were separated into those exclusively involved in trading with inputs only and those producing inputs and also being partly involved in their distribution.
production level 13 Focus group discussions and individual interviews were held.
agri-products trading
5 Several hawkers were interviewed
food processing 16 Various small scale processors were interviewed all over the country;
food distribution No distributor of local dairy products could be allocated during the research phase, the distributor of Brookside was interviewed
retail/hri 19
Various retailers on different levels were interviewed, some were wholesalers and retailers in one company, the others were kiosks or supermarkets. Also some HRIs were included in the exercise.
Supporters 17 Key supporters which were involved in this value chain for many years were interviewed as key informants.
Macro level 8 Main Government offices dealing with dairy as enablers of the sector were contacted for interviews.
Total 86
The experience with interviews applying standardized questionnaires showed that strict following the structure of the questionnaire was often difficult. One had to be flexible in adjusting the structure of the interview to the respondents desires to share information. In some cases focus group discussions were organized. In such cases the questionnaires provided only a framework for information collection.
The aim of the information gathering through the questionnaires was to receive information
16
on what exactly is the situation in the companies on various levels of the value chain, and how all actors perceive the future developments of the value chain and their individual role in it. All actors and stakeholders were given the chance to express their vision for development of the value chains or simply give suggestions for improvement.
Out of the interviewed companies two were sizable companies, processing 20,000 to 50,000 litres of milk daily, all other companies are operating on a much smaller scale. The two large processors we excluded from most calculations, as the nature of their enterprises is too different from others. Where required the situation in those two companies is additionally mentioned in the text.
2. PESTLE Analysis
2.1 The political environment
Conscious of the need to reverse the current declining trend in agriculture and to prioritize the sector in order to harness its full potential so as to guarantee sustainable food security and ensure economic prosperity for her people, Tanzania has embarked on what has come to be known as “Kilimo Kwanza” (agriculture first). All the ministries and government agencies have been instructed to align their development plans along the Kilimo Kwanza “vision”.
Kilimo Kwanza is going to be implemented in the framework of Agricultural Sector Development Programme (ASDP). Implementation of Kilimo Kwanza will be in line with the Comprehensive African Agricultural Development Programme (CAADP), which was endorsed in 2003 by African Heads of States in Maputo. If well implemented, Kilimo Kwanza will have a direct positive impact on the development of the dairy value chain. According to the 2010/11 budget the priority areas in agriculture development include but not limited to:
− Modernization of agriculture to realize high productivity through supporting production of high quality seeds; provision of subsidy on farm inputs; improving market information system for farmers; developing marketing infrastructures; and promoting value addition activities on agricultural products;
− Strengthening extension services and research on production of better crops and livestock breeds with high productivity; and improving provision of subsidies on veterinary drugs and vaccination.
− Strengthening and developing irrigation schemes, in order to attain the aspirations of Kilimo Kwanza, including construction of rain water harvesting dams to increase irrigation capacity for crops and pasture improvement;
− To establish national centres for land surveys and mapping and implementation of national land use plans;
− To promote small and medium scale businesses in order to increase quality and value addition by investing in agro-processing industries, storage facilities and incubator sites; promotion and the use of appropriate industrial technologies that conserve the environment, including production of farm implements;
17
− To establish the Agricultural Bank, strengthening the Tanzania Investment Bank and the Tanzania Women Bank and accelerate the implementation of agricultural financial leasing services and completes the establishment of the Tanzania Mortgage Refinance Company (TMRC).
Many tax changes have been made on agriculture sector in the 2010/2011 government budget. The proposed changes range from exemptions to zero-rating and special reliefs. The dairy value chain will gain from the following:
− VAT has been exempted on agricultural implements i.e. combine harvesters, tractors, hay making machinery and mowers used in agricultural production and livestock.
− VAT special relief has been granted to the supply of goods and services to the organised farms and farms under the registered cooperative unions for the purpose of building of farms infrastructure.
− VAT has been exempted on animal feeds and seed cake. The aim is to promote livestock farming and enable the oil seed farmers to receive better prices for their products.
− VAT relief has been provided on breeding services through artificial insemination. − VAT has been exempted on supply of packaging materials for fruit juices and milk
products. This is good and has potential to benefit smallholder farmers involved in value addition.
− VAT special relief has been provided for the supply of equipments to a registered Veterinary Practitioner under the Third Schedule to the VAT Act.
According to the Agricultural Council of Tanzania, the taxation in the agricultural sector in Tanzania is such a huge burden, financially and administratively, that farmers and producers are deprived of initiative and engagement. However, in the 2010/11 budget speech of the Ministry of Livestock and fisheries, the government has imposed an 18% VAT on all milk imports in order to encourage local investors into milk business. Although the Government is reviewing the tax structure to rationalize it and make it business friendly to local and foreign investors, taxes are still duplicated on producers by central government and local government authorities. The multiplication of taxes also means expanded administrative burdens on tax payers.
2.2 The economic environment
Tanzania’s inflation rate has been on a steep rise since January 2011, from less than 6% in January to 17.9% in October. It ranged between 9 -12.5% between 2009 and January 2010 when it started declining, reaching its lowest in September 2010 at 4%. Inflation is hurting the consumers as prices of all consumer commodities have been rising steeply. On the other hand, it has contributed to better farm gate prices for milk.
Bank interest rates are in the range of 18-22%. This limits the rural population in their ability to borrow for investments. They depend mostly on land for collateral but most of the rural population do not have title deeds that can be used as collateral. Most of the land has not been surveyed.
Tanzania unemployment rate has gone down from 12.9% in 2002 to 10.7 in 2011 and is not expected to fluctuate much in the coming year 2012. The dairy value chain is employing a
18
large number of people, significantly contributing to further decline in the level of unemployment in the country. Tanzania has demonstrated a good level of economic performance in recent past, GDP growth rate has been over 6 % for the last three years. The business environment indicators for Tanzania lag behind regional standards, and corruption is a serious impediment to doing business in the country. In the dairy sector, the government is set on creating an enabling environment for value addition of livestock products such as improvement of abattoirs, milk processing, and processing of hides and skins.
2.3 The social environment
Since 2007 the population growth rate in Tanzania has been declining slightly (2.09% in 2007 to 2.00% in 2011). This stabilisation in population growth means less pressure on government social services and therefore can strategise more towards economic development.
Poverty reduction has been a central goal of the Tanzania government and was a driving force behind the economic reforms initiated in 1986. While recent growth performance and future prospects are good, Tanzania remains a low-income country with a per capita GDP of about $1400 ( 2009). With a relatively equitable distribution of resources, poverty is widespread throughout the country.
In 2007, Benjamin Mutagwaba of the University of Dar es Salaam (Government Expenditure and Income Inequality in Tanzania: A Policy Dimension) used Theil’s measures of income inequality, and established that operating in agricultural activities results into income inequality increasing effects, thus further widening the poverty gap, while the non-agricultural activities, particularly business, result in income inequality decreasing effects, i.e. narrowing the poverty gap. Therefore, any policy intervention in terms of government support to the rural poor in order to alleviate, and eventually eradicate poverty should aim at sectors that have income inequality decreasing effects; in this case, business activities. This is in support of this study’s recommendation to bring together value chain actors to make a national strategy to develop the chain because this industry will contribute tremendously to reducing the poverty gap in Tanzania.
Most dairy producers are in the rural areas and have not had any formal education. This has a great bearing on strategies to promote new technologies in dairy production. Special capacity building programs need to be put in place to take care of this group of producers.
2.4 The technological environment
Technology is the main factor driving innovations within the dairy industry all over the world. Not only processing but also production and all the handling sectors of the chain have a significant level of technology utilization. In Tanzania the situation is significantly different. The majority of milk is produced in extensive farming systems, either having no or only very limited influence by technological innovations. Only a very small part of milk production is produced on intensive farms which utilize some of the innovative technologies.
In processing few enterprises have state of the art technology, which is mostly highly underutilized. The vast majority of enterprises, especially small scale processors utilize
19
technologies which were available on the market, which are often outdated.
2.5 The legal environment
The government is reviewing the National Livestock policy (2006), and in particular looking at various Acts such as Meat act no.10 of 2006, and Hides and Skins act no. 18 of 2008. Parliament has also passed the act governing grazing lands and animal feeds of 2010. In addition, the government will put more support for the Dairy Board and the Meat Board to be able to oversee the milk and meat quality respectively
Company registration procedures for processors have been simplified through BRELA. Dairy processors can operate legally by getting a business licence at Local Government level. However, there are still businesses which operate without any legal registration, just informally. Farmers’ organisations can be registered either as cooperatives, associations or business groups. Farmers’ organisation and legal registration is important for smooth and legal business undertakings with buyers. More important is the need for organised collective marketing for economies of scale. On their own, the rural farmers will not obtain legal registration as the required paperwork is cumbersome. They need capacity building and advisory support to get organised to the point of obtaining legal registration.
The Tanzania Bureau of Standards (TBS) is the regulatory body with the mandate over quality and ingredient standards of raw and processed foods for agricultural commodities. They carry out chemical analysis to test for composition of foods. All food processing industries, including dairy processing plants are by law supposed to comply with TBS standards and get a TBS mark on their products before they are allowed on the market. The real situation on the ground is quite different because the bulk of milk is sold locally along the traditional marketing channels without a TBS mark. This is a challenge to the regulatory body and to all value chain actors to control the quality of the dairy products being sold on the streets and in rural areas.
The other agency with the mandate to regulate food industry is the Tanzania Food and Drug Authority (TFDA) whose main role is to inspect and register processing premises, registration of food products, food import and export certification and food risk analysis. Both TBS and TFDA conduct periodic visits to clients to check compliance. However, their limited ability for outreach in the whole country leaves a lot to be desired in as far as food quality control and regulations enforcement is concerned. In some areas they partner with the Local Government Authority to carry out inspection duties.
2.6 The environmental issues
Dairy production in Tanzania is mostly done extensively, not requiring any chemical fertilizers and application of pesticides. The grazing lands and animal feeds act (2010) has tried to clarify the danger of free range grazing and having too many animals grazing on a small piece of land which causes too much land degradation. 70 Livestock extension agents from 31 districts have been trained on livestock production with environmental conservation perspective; and challenges of climate change in an effort to educate pastoralist to better gain from their stocks while conserving the environment (Budget Speech, Ministry of Livestock and Fisheries, 2010/11). Pasture improvement programs to boost milk and meat
20
production need to be stepped up not only in all areas where ranging is practiced but also in zero grazing production systems. 3. Dairy Value Chain
3.1 Basic conditions of dairy sector
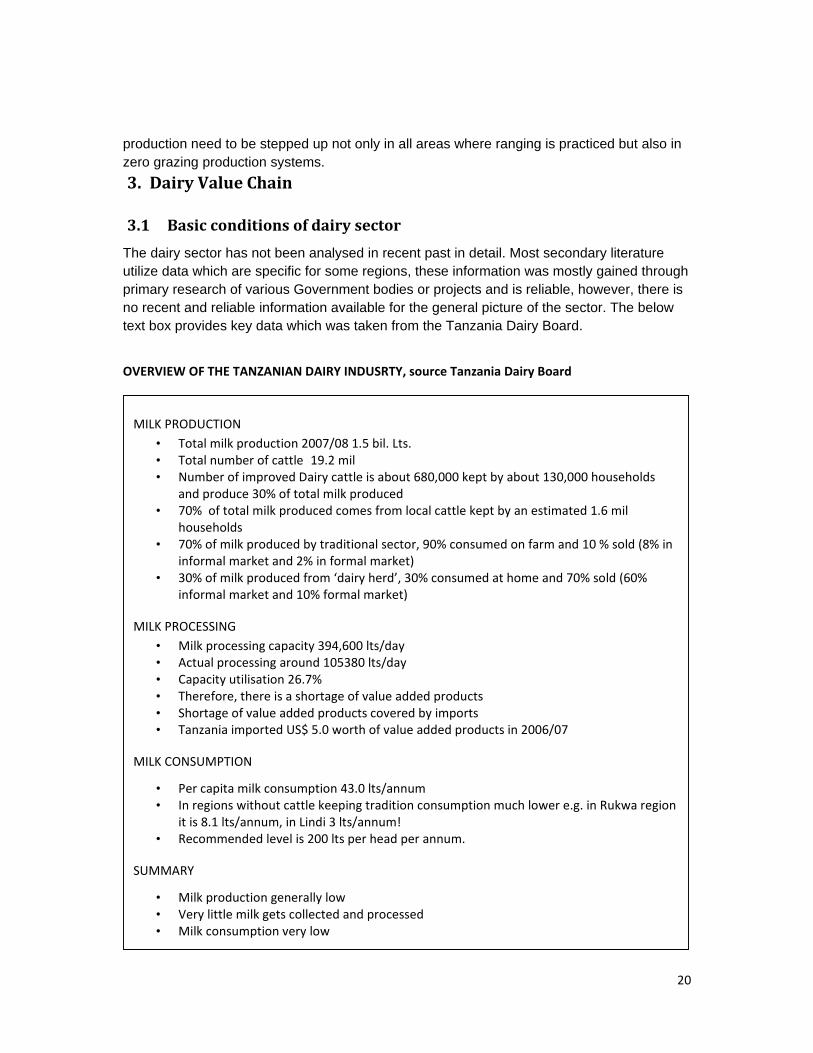
The dairy sector has not been analysed in recent past in detail. Most secondary literature utilize data which are specific for some regions, these information was mostly gained through primary research of various Government bodies or projects and is reliable, however, there is no recent and reliable information available for the general picture of the sector. The below text box provides key data which was taken from the Tanzania Dairy Board.
OVERVIEW OF THE TANZANIAN DAIRY INDUSRTY, source Tanzania Dairy Board
MILK PRODUCTION • Total milk production 2007/08 1.5 bil. Lts. • Total number of cattle 19.2 mil • Number of improved Dairy cattle is about 680,000 kept by about 130,000 households
and produce 30% of total milk produced • 70% of total milk produced comes from local cattle kept by an estimated 1.6 mil
households • 70% of milk produced by traditional sector, 90% consumed on farm and 10 % sold (8% in
informal market and 2% in formal market) • 30% of milk produced from ‘dairy herd’, 30% consumed at home and 70% sold (60%
informal market and 10% formal market)
MILK PROCESSING • Milk processing capacity 394,600 lts/day • Actual processing around 105380 lts/day • Capacity utilisation 26.7% • Therefore, there is a shortage of value added products • Shortage of value added products covered by imports • Tanzania imported US$ 5.0 worth of value added products in 2006/07
MILK CONSUMPTION
• Per capita milk consumption 43.0 lts/annum • In regions without cattle keeping tradition consumption much lower e.g. in Rukwa region
it is 8.1 lts/annum, in Lindi 3 lts/annum! • Recommended level is 200 lts per head per annum.
SUMMARY
• Milk production generally low • Very little milk gets collected and processed • Milk consumption very low
21
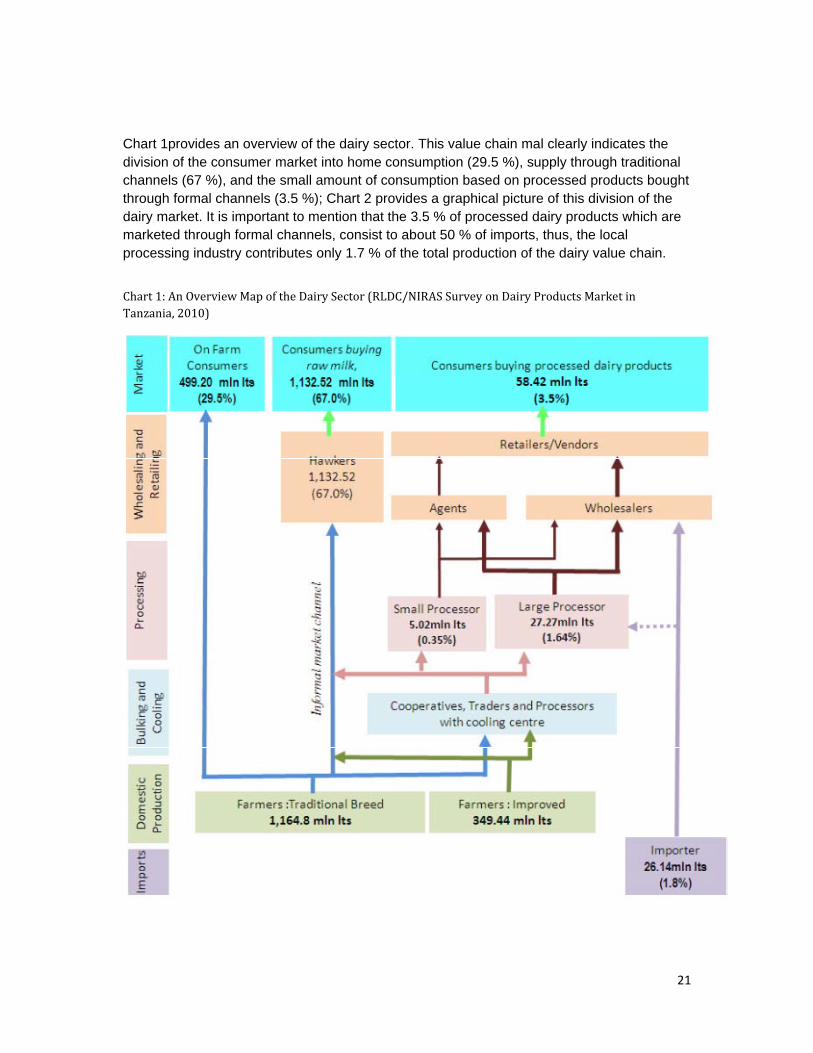
Chart 1provides an overview of the dairy sector. This value chain mal clearly indicates the division of the consumer market into home consumption (29.5 %), supply through traditional channels (67 %), and the small amount of consumption based on processed products bought through formal channels (3.5 %); Chart 2 provides a graphical picture of this division of the dairy market. It is important to mention that the 3.5 % of processed dairy products which are marketed through formal channels, consist to about 50 % of imports, thus, the local processing industry contributes only 1.7 % of the total production of the dairy value chain.
Chart 1: An Overview Map of the Dairy Sector (RLDC/NIRAS Survey on Dairy Products Market in Tanzania, 2010)
22
Chart 2: Dairy Market in Tanzania
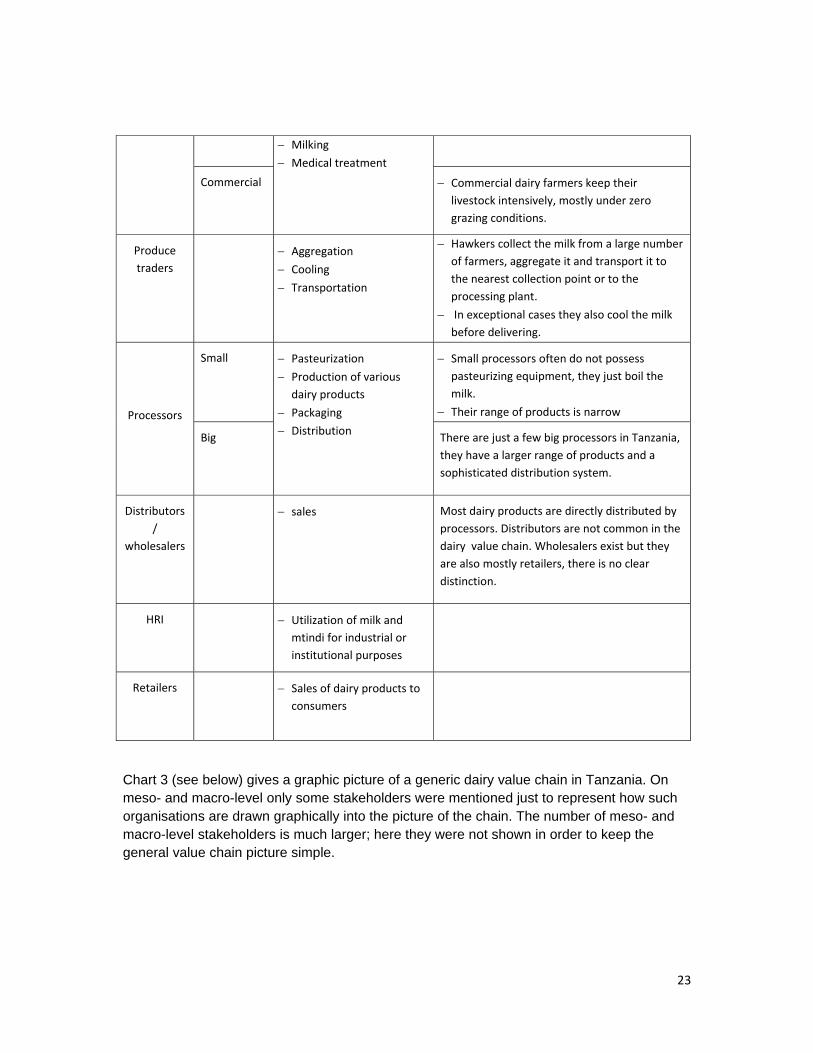
3.2 Dairy value chain map For mapping the general picture of the chain one needs to first of all clearly identify the functions of the actors on the micro level. Table 2 provides a brief description of those functions which different actors are carrying out in the process of adding value within the dairy value chain.
Table 2: Current functions of the value chain actors
VC actors Sub‐categories
Functions Explanation
Specific input
suppliers/ providers
− − Animals
− Fodder − Semen
− Chemicals, veterinary medicine
− Equipments
Although the usage of inputs is at present not high in dairy value chain, some selected enterprises require all of the mentioned inputs.
Input traders
− Trading of inputs The majority of input providers also trade those inputs. Additionally there are traders available who beside other products trade input for the dairy value chain.
Producers Small scale − Feeding
− Breeding
− Subsistence farmers mainly do only milking, they also treat their animals, but this is done very seldom.
Produced and consumed on the farm30%
marketed through
traditional channels67%
marketed through formal
channels3%
23
− Milking
− Medical treatment
Commercial
− Commercial dairy farmers keep their livestock intensively, mostly under zero grazing conditions.
Produce traders
− Aggregation − Cooling − Transportation
− Hawkers collect the milk from a large number of farmers, aggregate it and transport it to the nearest collection point or to the processing plant.
− In exceptional cases they also cool the milk before delivering.
Processors
Small
− Pasteurization − Production of various
dairy products
− Packaging − Distribution
− Small processors often do not possess pasteurizing equipment, they just boil the milk.
− Their range of products is narrow
Big
There are just a few big processors in Tanzania, they have a larger range of products and a sophisticated distribution system.
Distributors/
wholesalers
− sales Most dairy products are directly distributed by processors. Distributors are not common in the dairy value chain. Wholesalers exist but they are also mostly retailers, there is no clear distinction.
HRI
− Utilization of milk and mtindi for industrial or institutional purposes
Retailers
− Sales of dairy products to consumers
Chart 3 (see below) gives a graphic picture of a generic dairy value chain in Tanzania. On meso- and macro-level only some stakeholders were mentioned just to represent how such organisations are drawn graphically into the picture of the chain. The number of meso- and macro-level stakeholders is much larger; here they were not shown in order to keep the general value chain picture simple.

Chart 3: Ge
Chart 4 intotal milk is marketconsumeConsumpthe total m Chart 4: Pr
eneric Dairy V
ndicates twoproduction
ted through ed in Tanzanption of procmilk consum
resent main D
Value Chain in
o different mof Tanzaniahawkers in t
nia after beincessed local mption in the
Dairy Value Ch
Tanzania
ost common is consumethe traditionang processed
milk is closecountry.
ains in Tanzan
n options for ed on the faral way. Onlyd, this figuree to negligib
nia
value chainrm without ey very small ae includes alsle, as it is no
ns. About 1/3ntering the mamount of mso the imporot even at a
2
3 (29.5%) of market. 67%
milk (3.5 %) irted milk. 2 % ratio of
24
% s
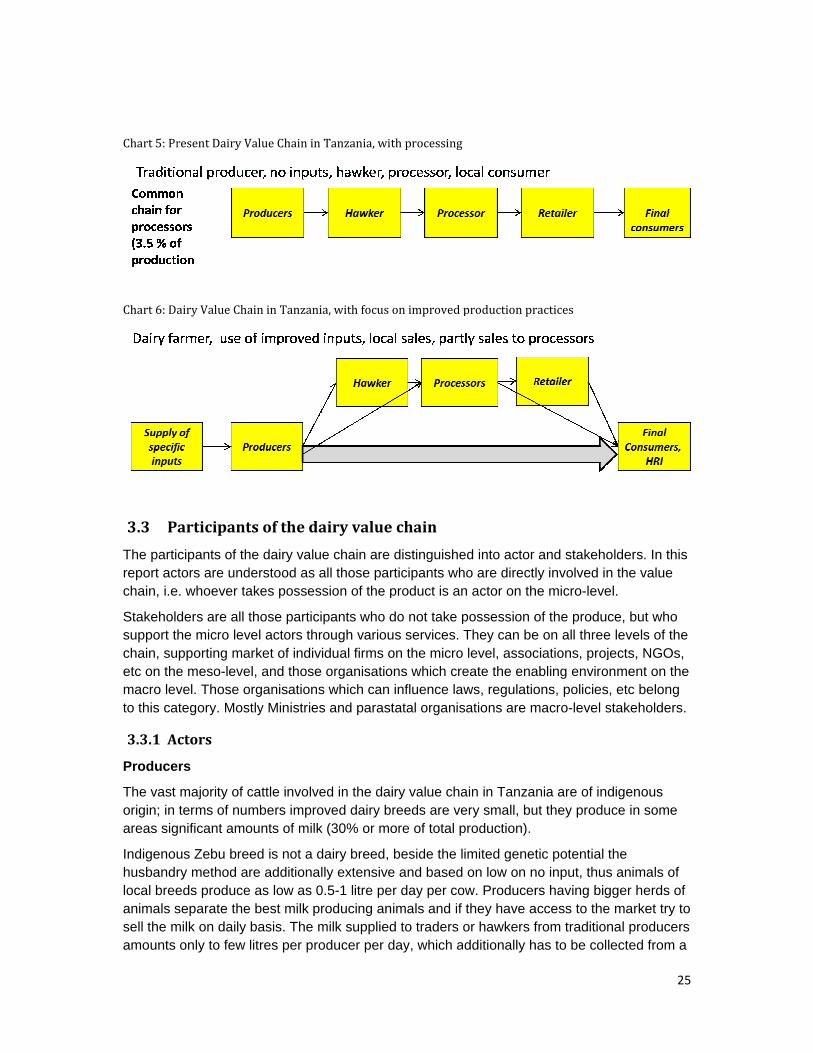
Chart 5: Pr
Chart 6: Da
3.3 P
The partireport acchain, i.e
Stakeholdsupport tchain, suetc on themacro levto this ca
3.3.1 A
Produce
The vast origin; in areas sig
Indigenouhusbandrlocal breeanimals ssell the mamounts
resent Dairy V
airy Value Cha
articipant
cipants of thtors are und
e. whoever ta
ders are all the micro levpporting mae meso-levevel. Those o
ategory. Mos
ctors
ers
majority of cterms of num
gnificant amo
us Zebu brery method aeds produceseparate themilk on daily
only to few
Value Chain in
ain in Tanzani
ts of the da
he dairy valuderstood as aakes posses
those particvel actors thrarket of indivel, and thoseorganisationsstly Ministries
cattle involvembers improounts of milk
ed is not a dre additiona
e as low as 0e best milk pbasis. The mlitres per pro
Tanzania, wit
ia, with focus
airy value
ue chain are all those par
ssion of the p
ipants who drough variouvidual firms oe organisatios which can s and parast
ed in the daioved dairy bk (30% or mo
dairy breed, lly extensive
0.5-1 litre peroducing anmilk suppliedoducer per d
th processing
on improved p
chain
distinguisherticipants whproduct is an
do not take pus services. on the micro ons which cre
influence lawtatal organis
iry value chareeds are veore of total p
beside the le and based r day per coimals and if d to traders oday, which a
production pr
ed into actor ho are directn actor on th
possession oThey can belevel, assoc
eate the enaws, regulatio
sations are m
ain in Tanzaery small, buproduction).
imited geneton low on n
ow. Producerthey have aor hawkers fdditionally h
ractices
and stakeholy involved in
he micro-leve
of the produe on all threeciations, projabling enviroons, policiesmacro-level s
nia are of inut they produ
tic potential no input, thusrs having big
access to thefrom traditio
has to be col
2
olders. In thn the value el.
ce, but who e levels of thjects, NGOs
onment on ths, etc belongstakeholders
digenous uce in some
the s animals ofgger herds oe market try nal producelected from
25
is
he s, he g s.
f of to rs a
26
large catchment’s area.
Producers are mostly located in areas where inputs for milk production improvements cannot be easily supplied and the genetic potential of animals is not conducive to utilization of more intensive husbandry methods. The local breed can be improved through cross breeds, but there are no strategic breeding programmes being implemented, thus improvements are only of temporary nature, mostly disappearing after just a few years.
Intensive dairy production is not wide spread in Tanzania, but the results on the existent farms are promising. The production level per cow is in the range of 10-20 litres per day, and those animals react positively to intensification of feeding. Such animals are kept either at zero grazing or limited grazing husbandry systems. Milk produced in such production systems is mostly sold directly to consumers or intermediaries, processing plant receive only a minor part of the milk produced on improved farms.
Hawkers
The origin of the majority of milk entering the market is from traditional herds which produce small amounts per cow and are spread over the entire country. Consequently, aggregation of this milk requires significant logistical efforts. Large number of hawkers is collecting the milk from traditional herds and bringing it directly to consumers or to processing plants.
A hawker utilizes mostly a bicycle as means of transportation; recently motorcycles are also being increasingly utilized. The amount a hawker can collect per days varies, it is reported hat 60 litres is the average per hawker per day, some manage to collect up to 100 litres.
Processors
There are very few large dairy enterprises in Tanzania, those enterprises are well equipped. Additionally there are various small scale producers all over the country, their processing capacity can be as low as 50 litres per day, but there are also enterprises processing more than 1000 litres per day.
Distributors/ Wholesalers
Distributors of dairy products are not common in the chain, even wholesalers are rare. Most products are sold directly to retailers; processors mostly deliver directly to retailers. Some have their own outlets also.
Retailers
Generally the sales of processed dairy products are carried out through:
− Direct sales at factory gate − Street sales − Kiosks, sell packaged produce of processors − Supermarkets, sell selected brands only
The vast majority of milk is sold without being processed, directly to consumers through hawkers, who collect the milk from producers and sell it to consumers
HRI
Institutional buyers such as hotels, restaurants, institutions, etc. can buy directly from
27
“It is difficult to compete with hawkers, they sell milk to final consumers almost for the same price as to us processors. But we have all the processing costs on top. As long as consumers are not demanding exclusively processed milk from industrial processors it will be remain difficult to sell milk to final consumers. Therefore we primarily sell processed products, such as mtindi or yoghurts.” ‐ Small scale processor in Arusha
processors or producers.
At present the market in Tanzania is far from being saturated, small processors still prefer to sell to institutional buyers, but they are considered just as another actor of the retailing chain. Mostly they get a discount of the cost reduction of packaging only; there are no special discounts above this.
HRI buyers require purchasing dairy produce only from certified manufacturers, who have a licence to supply to organisations, this is mostly neglected.
3.3.2 Mesolevel stakeholders
The dairy sector has always been very attractive for various projects or government interventions. The 16 interviewed processors mentioned 26 supporting agencies which cooperated with various actors of the dairy value chain in the past.
3.3.3 Macrolevel stakeholders
On the macro level the Ministry of Livestock is a key stakeholder as enabling body with the corresponding bodies of regional administration and local government. Additionally, various licensing organisations such as: Tanzania Bureau of Standards, Tanzanian Food and Drug Authority, as well as other parastatal organisations are macro-level stakeholders.
3.4 Findings of primary data collection
In order to validate the available information of project reports and secondary sources primary data collection exercise was carried out. The results of the findings of this exercise are presented in this part of the report.
3.4.1 Production
The majority of interviewed enterprises process fresh and cultured (mtindi) milk, only in exceptional cases processed milk or mtindi is not sold by processors but entirely processed into other products. Various other dairy products are produced, such as skimmed milk, UHT, yoghurt, ghee, butter, cheese, ice cream, cream. Beside milk the most common products are yoghurt, ghee, butter and cheese.
The unimportant role of ice cream is surprising; in supermarkets ice cream products capture by far the largest space, which could be an indication for a highly profitable niche.
28
Some enterprises are also involved in processing of non-dairy products, such as soy products, drinking water, juices, and honey.
Table 3: Share of milk (cultured and fresh) of total processed amount, in per cent
production of fresh milk
production of cultured Milk
Remaining dairy products
Average 30.27 32.91 36.82
Table 3 indicated that although every enterprise is selling fresh milk, the preference is with more processed dairy products. Some enterprises have a complete specialization on e.g. cheese, not selling any milk. Mtindi, is often sold for higher price and also the longer shelf life are the two main factors that more mtindi is processed and sold than fresh milk. If possible enterprises try to process the milk into more valuable products, rather then selling it as milk.
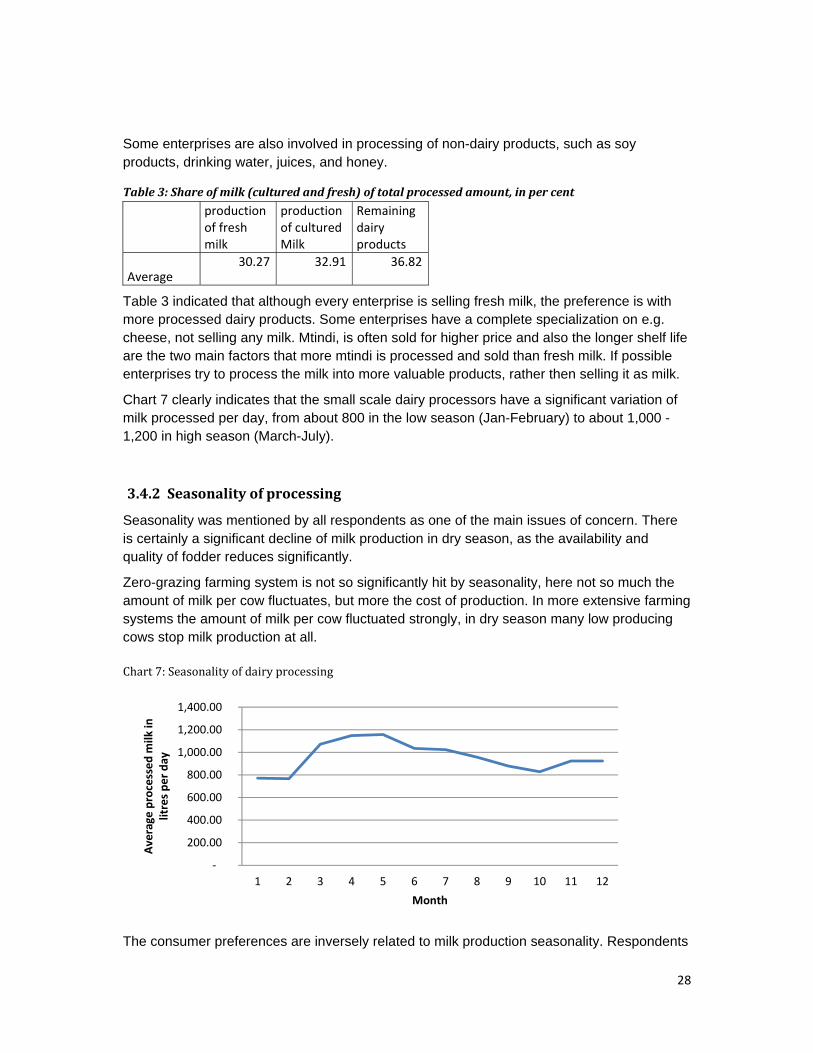
Chart 7 clearly indicates that the small scale dairy processors have a significant variation of milk processed per day, from about 800 in the low season (Jan-February) to about 1,000 -1,200 in high season (March-July).
3.4.2 Seasonality of processing
Seasonality was mentioned by all respondents as one of the main issues of concern. There is certainly a significant decline of milk production in dry season, as the availability and quality of fodder reduces significantly.
Zero-grazing farming system is not so significantly hit by seasonality, here not so much the amount of milk per cow fluctuates, but more the cost of production. In more extensive farming systems the amount of milk per cow fluctuated strongly, in dry season many low producing cows stop milk production at all. Chart 7: Seasonality of dairy processing
The consumer preferences are inversely related to milk production seasonality. Respondents
‐
200.00
400.00
600.00
800.00
1,000.00
1,200.00
1,400.00
1 2 3 4 5 6 7 8 9 10 11 12
Average
processed
milk in
litres pe
r day
Month
29
“Seasonality is a huge problem. Many of our suppliers deliver just a few litres of milk per day, in dry season they often stop delivering at all, or at least reduce to such a low level that is almost makes no sense to collect from them. In dry season we have to find new suppliers, travel further for collection, or simply process less.” Dairy processor in Central Zone
reported that the consumption of milk increases in dry season, when the production of milk goes down. The consumption pattern of dairy products is reported to change with the weather conditions. In rainy season the consumption of soft drinks seems to increase on the expense of milk consumption; in dry season preference is more often given to milk over soft drinks. Thus, although the price of milk is higher in dry season the consumption is still higher than in rain season. This issue needs to be properly researched, in order to be better exploited for marketing purposes.
Under the Chapter 3.6: Costs description is provided why selling milk to processing plant is the least profitable option for producers of milk. In dry season, when less milk is available and the prices are higher, the necessity to sell milk to processors is even lower. Not only is less milk generally available in dry season, but also its accessibility reduces significantly for processors.
Processing enterprises are utilizing the formal market channels, which constitutes only 3.5 % of totally consumed milk in the country. These 3.5 % can be again split up into 1.8 % is imported milk, 0.35 % is processed by small enterprises and 1.64 % is processed by large enterprises utilizing locally available as well as imported milk.. (NIRAS/RLDC: Survey on Dairy Products Market in Tanzania, May 2010). The majority of respondents of primary research were in the group of enterprises which contribute only 0.35 % of totally consumed milk in the country. Considering this fact, one can state that seasonality of production should not be the factor leading to seasonality of processing. Even if the production reduces to just 50 % in dry season, there is still plenty of milk available in the market for processors, as their share is still below 2 %.
The installed capacity in Tanzania can process 7.75% of domestically produced milk. Almost all plants run far below capacity, in average about 30 %. Seasonality of processing cannot be directly linked to seasonality of production, however the production fluctuates there will always be enough to cover the 2 % (0.35% + 1.64%) or the 6 % (if all plants run at full capacity).
Seasonality seems to have to do primarily with accessibility of milk in dry season, and only indirectly with the amount. The dry season or low production season seems to coincide with the highest demand for milk consumption, when demand is high, processors automatically get less. All producers sell first directly, what they cannot sell is delivered to processors, thus the processors get less in dry season.
Improvement of milk availability in dry season does not necessarily benefit processors, only when certain saturation is achieved on the market and farmers and hawkers cannot sell their milk directly, processors will start benefiting. If processors pay at least the amount per litre which farmers or hawkers are getting from their clients, they would get all the milk required to run their processing plants at full capacity. This, however, seems to be contradictory as processors cannot pay the same amount for milk as final consumers and additionally sell the milk to consumers after a costly processing procedure. It is likely that in such pricing
30
„We bought brand new machinery for milk processing. Even if one follows completely the instructions, one will never get the results which the manufacturers promise. The difference to the promised performance can be huge. Additionally the constant power cuts. What is the point discussing the right capacity level of machinery if half of the time you cannot use the machinery due to power cuts. And they come unpredictably and you never know when they are over.” Small processor from Central Zone
situations processing into higher value dairy products is less affected by seasonality, in such products the profitability level changes but not the general availability.
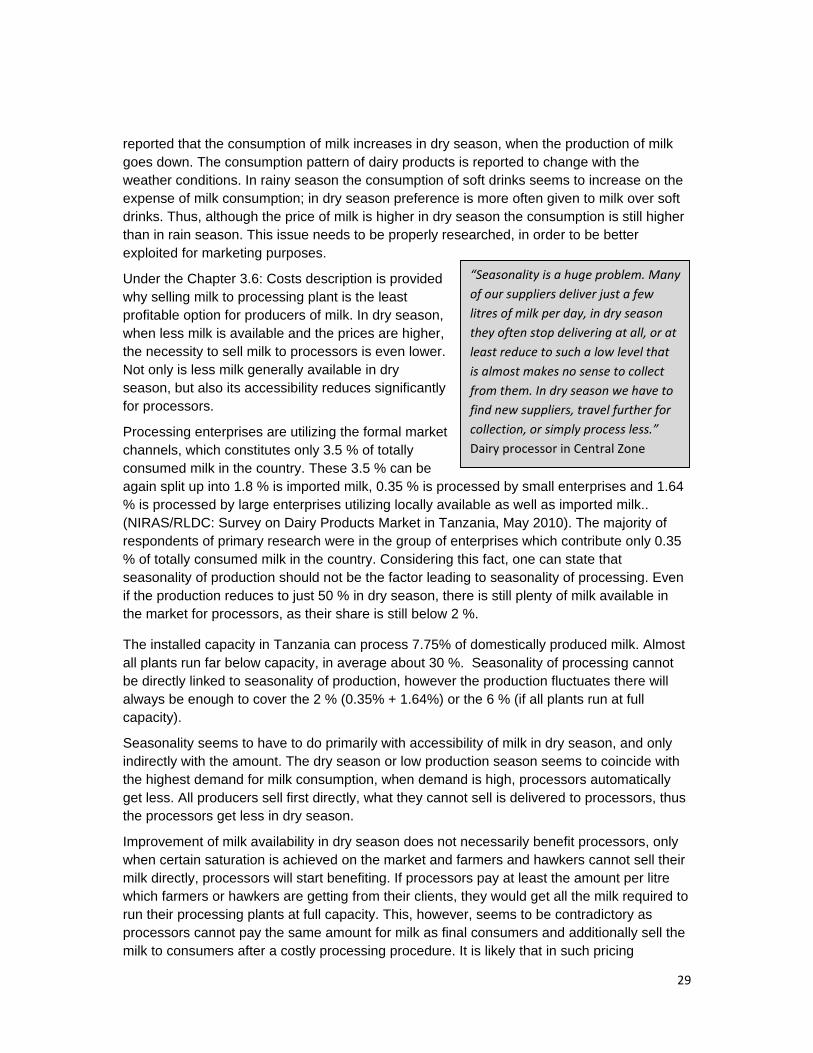
3.4.3 Sales prices
The sales prices of milk and cultured milk do not vary dependent on seasons or other factors. They are fixed over longer period of times. Milk offered to consumers through traditional markets has a seasonal fluctuation, being more expensive in dry season.
Table 4: Sales prices of milk and mtindi, wholesale prices
Milk Cultured
milk (Mtindi)
Maximum 2,200.00 2.200,00
Minimum 700.00 800,00
Average 1,207.69 1.350,00
In average milk is sold slightly cheaper than mtindi, big enterprises sell those products at the same price. The wholesale prices have a significant variation; the most expensive product is three times more expensive than the cheapest. The price difference is due to packaging, the milk for 700 Tsh is sold in bulk without containers, for 2,000.00 Tsh milk special bottles and attractive labels are utilized.
3.4.4 Capacity
Capacity utilization is mostly understood as the percentage of the potentially possible production, mostly the figures of machine manufacturers are taken for this comparison. Those figures are only applicable in economies where machines can be utilized to its fullest potential as there are no inhibiting obstacles available. In Tanzania the reliability of electricity leaves a lot to be desired. Power cuts can significantly reduce the capacity.
31
Chart 8: Reported capacity utilization of small scale dairy plants
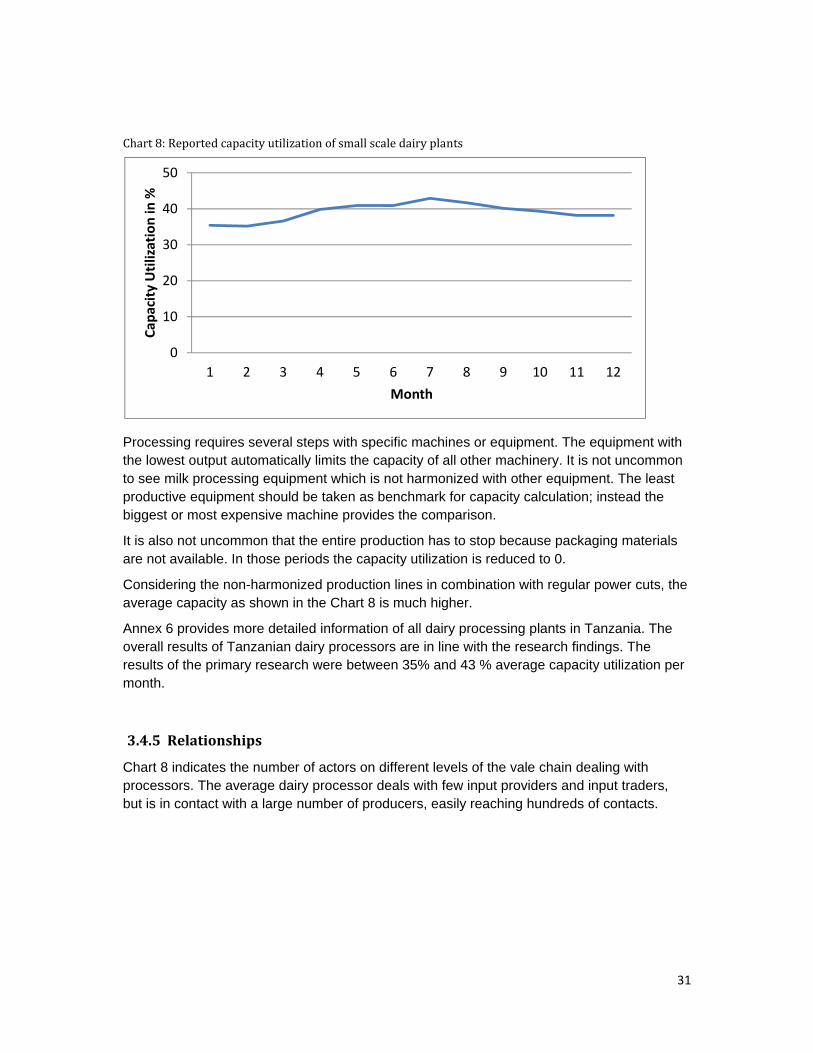
Processing requires several steps with specific machines or equipment. The equipment with the lowest output automatically limits the capacity of all other machinery. It is not uncommon to see milk processing equipment which is not harmonized with other equipment. The least productive equipment should be taken as benchmark for capacity calculation; instead the biggest or most expensive machine provides the comparison.
It is also not uncommon that the entire production has to stop because packaging materials are not available. In those periods the capacity utilization is reduced to 0.
Considering the non-harmonized production lines in combination with regular power cuts, the average capacity as shown in the Chart 8 is much higher.
Annex 6 provides more detailed information of all dairy processing plants in Tanzania. The overall results of Tanzanian dairy processors are in line with the research findings. The results of the primary research were between 35% and 43 % average capacity utilization per month.
3.4.5 Relationships
Chart 8 indicates the number of actors on different levels of the vale chain dealing with processors. The average dairy processor deals with few input providers and input traders, but is in contact with a large number of producers, easily reaching hundreds of contacts.
0
10
20
30
40
50
1 2 3 4 5 6 7 8 9 10 11 12
Capa
city Utilization in %
Month
32
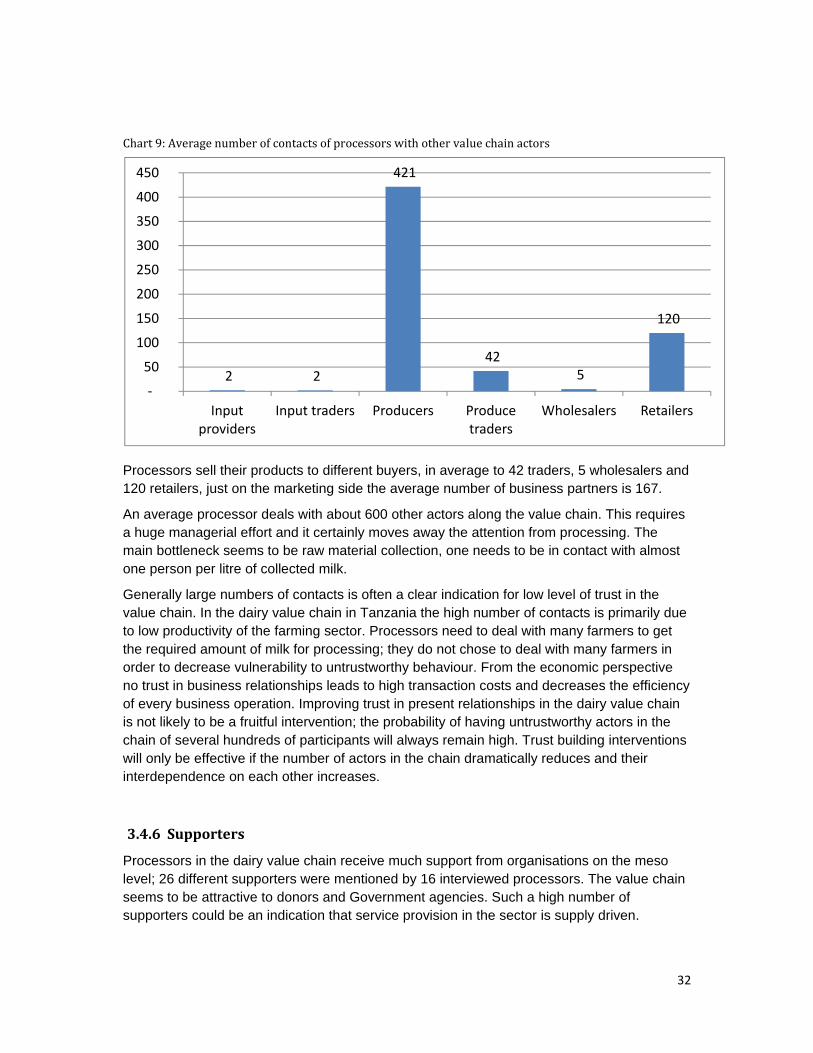
Chart 9: Average number of contacts of processors with other value chain actors
Processors sell their products to different buyers, in average to 42 traders, 5 wholesalers and 120 retailers, just on the marketing side the average number of business partners is 167.
An average processor deals with about 600 other actors along the value chain. This requires a huge managerial effort and it certainly moves away the attention from processing. The main bottleneck seems to be raw material collection, one needs to be in contact with almost one person per litre of collected milk.
Generally large numbers of contacts is often a clear indication for low level of trust in the value chain. In the dairy value chain in Tanzania the high number of contacts is primarily due to low productivity of the farming sector. Processors need to deal with many farmers to get the required amount of milk for processing; they do not chose to deal with many farmers in order to decrease vulnerability to untrustworthy behaviour. From the economic perspective no trust in business relationships leads to high transaction costs and decreases the efficiency of every business operation. Improving trust in present relationships in the dairy value chain is not likely to be a fruitful intervention; the probability of having untrustworthy actors in the chain of several hundreds of participants will always remain high. Trust building interventions will only be effective if the number of actors in the chain dramatically reduces and their interdependence on each other increases.
3.4.6 Supporters
Processors in the dairy value chain receive much support from organisations on the meso level; 26 different supporters were mentioned by 16 interviewed processors. The value chain seems to be attractive to donors and Government agencies. Such a high number of supporters could be an indication that service provision in the sector is supply driven.
2 2
421
42 5
120
‐
50
100
150
200
250
300
350
400
450
Input providers
Input traders Producers Produce traders
Wholesalers Retailers
33
„Interventions in the dairy sector are excellent for poverty reduction. In rural areas of Tanzania the majority of farmers have animals, and they consume milk regularly and also sell some on the market. Improvements in this sector automatically should affect positively almost every person living below the poverty line in rural areas of Tanzania. Well, we keep on saying this, and theoretically it is true, but so little has been changed of the situation of those farmers in spite of so many support programmes by the government and by various NGOs.” Member of an NGO
Considering the fact that such a large number of various organisations provided support to the sector, it is surprising to see how little development the dairy sector experienced in past decades. There seem to be no real solutions available for replication. Traditional approaches for value chain improvement are not likely to be fruitful, as it is probable that everything was tried out already. What is required now is out of the box thinking, new approaches to development which have not been tried yet. Whichever ideas for improvement are developed it needs to be kept in mind that a significant amount of patience will be required, as the existent problems are not easily solvable, as the experience of interventions in the last two decades clearly showed.
Such a large number of supporters could also be an indication that there was repetition or overlap of programmes. Further, actors of the chain might have developed demanding attitude towards supporters.
3.4.7 Issues of concern
Respondents were asked to name their main issues of concern or their problems. Further they were asked to prioritise groups of concern from the perspective of the value chain, out of predefined 7 groups, which came out of literature study.
The issues of concern on the enterprise level were different to the value chain level constraints; respondents do have a specific enterprise view which is different to the general view of the value chain.
On enterprise level technology, market access, input supplies and management issues were seen as problems; whereby policy, regulations, finance and infrastructure were not considered as problematic.
Table 5 shows the results of the prioritization exercise. Respondent were asked to grade the issues of concern according to the perceived magnitude of this concern for the entire chain; starting with one (1) being the biggest issue of concern and ending with seven (7) being the lowest. The lowest average figure would consequently be the biggest issue of concern of the interviewed entrepreneurs.
34
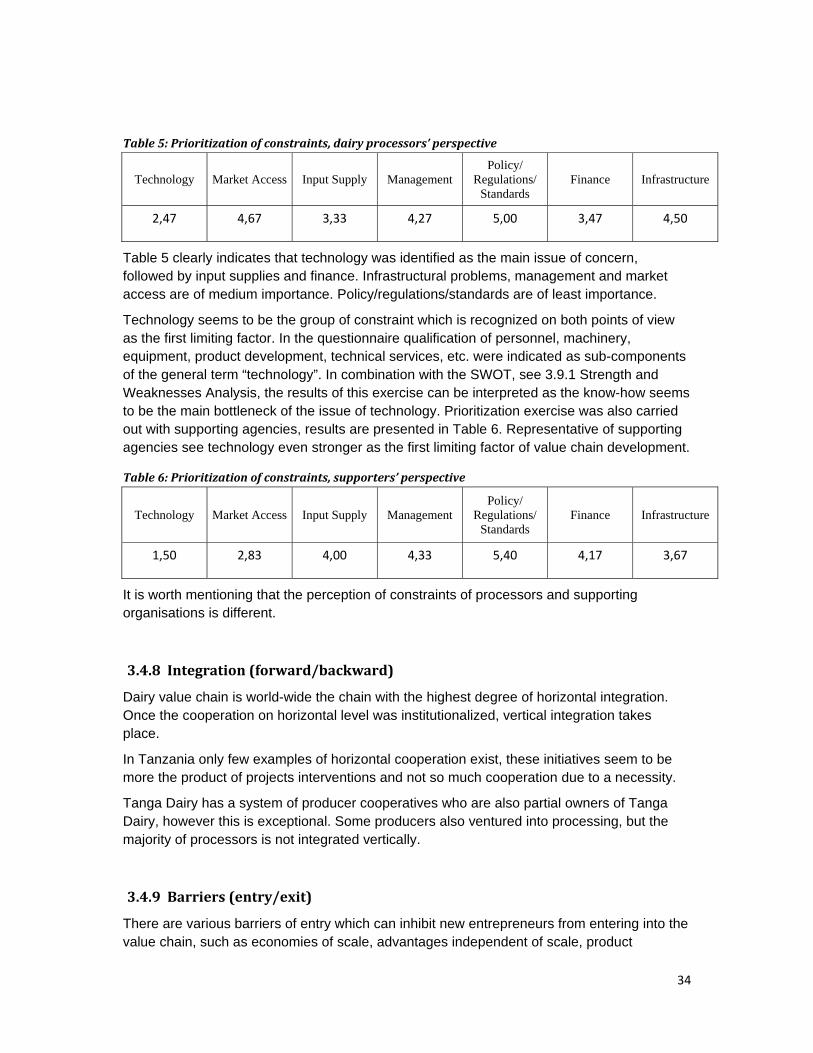
Table 5: Prioritization of constraints, dairy processors’ perspective
Technology Market Access Input Supply Management Policy/
Regulations/ Standards
Finance Infrastructure
2,47 4,67 3,33 4,27 5,00 3,47 4,50
Table 5 clearly indicates that technology was identified as the main issue of concern, followed by input supplies and finance. Infrastructural problems, management and market access are of medium importance. Policy/regulations/standards are of least importance.
Technology seems to be the group of constraint which is recognized on both points of view as the first limiting factor. In the questionnaire qualification of personnel, machinery, equipment, product development, technical services, etc. were indicated as sub-components of the general term “technology”. In combination with the SWOT, see 3.9.1 Strength and Weaknesses Analysis, the results of this exercise can be interpreted as the know-how seems to be the main bottleneck of the issue of technology. Prioritization exercise was also carried out with supporting agencies, results are presented in Table 6. Representative of supporting agencies see technology even stronger as the first limiting factor of value chain development.
Table 6: Prioritization of constraints, supporters’ perspective
Technology Market Access Input Supply Management Policy/
Regulations/ Standards
Finance Infrastructure
1,50 2,83 4,00 4,33 5,40 4,17 3,67
It is worth mentioning that the perception of constraints of processors and supporting organisations is different.
3.4.8 Integration (forward/backward)
Dairy value chain is world-wide the chain with the highest degree of horizontal integration. Once the cooperation on horizontal level was institutionalized, vertical integration takes place.
In Tanzania only few examples of horizontal cooperation exist, these initiatives seem to be more the product of projects interventions and not so much cooperation due to a necessity.
Tanga Dairy has a system of producer cooperatives who are also partial owners of Tanga Dairy, however this is exceptional. Some producers also ventured into processing, but the majority of processors is not integrated vertically.
3.4.9 Barriers (entry/exit)
There are various barriers of entry which can inhibit new entrepreneurs from entering into the value chain, such as economies of scale, advantages independent of scale, product
35
differentiation, hostility of existent competitors, and Government regulation on entry
Economies of scale certainly exist in the dairy value chain, reducing costs per unit (litre of milk), but with the present prices for finished products even small enterprises can survive on the market. Economies of scale will become increasingly important the more the turnover will become the decisive factor of profitability of enterprises.
Advantage independent of scale, such as know-how, favourable access to raw materials, and favourable location are also not significant. Although know-how is required to produce quality products, little knowledge of the processing technology still allows making marketable products. Location of processing plant and raw materials supplies are also not excluding new entrants, although strongly favouring new set ups to be close to milk collection areas.
Consumers in Tanzania are flexible; they are not conditioned to buying various products of the same company. Product differentiation is also not a barrier to new entrants. Existing competitors do not have power to stop new entrepreneurs from entering the market. Government regulations are also not excluding new entrants.
There are no significant barriers of entry into the business. Investment is required, but in comparison to the profit expectations the required investment is affordable. Similarly the exit barriers are also low, as all the machinery can be easily sold at any point in time.
3.4.10 Weakest actor
Every value chain is as weak as its weakest actor. Respondents were asked to identify those actors where they think the chain is most likely to break first, or where the load of constraints is the biggest, inhibiting the development of the entire chain.
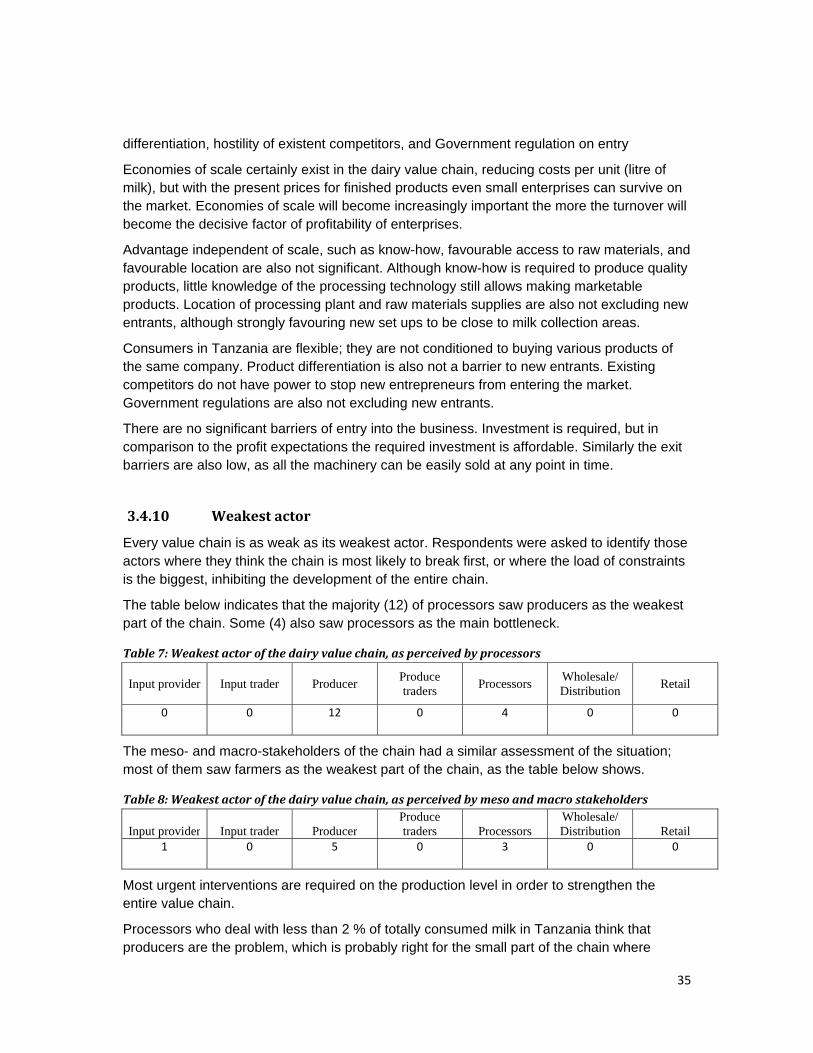
The table below indicates that the majority (12) of processors saw producers as the weakest part of the chain. Some (4) also saw processors as the main bottleneck.
Table 7: Weakest actor of the dairy value chain, as perceived by processors
Input provider Input trader Producer Produce traders Processors Wholesale/
Distribution Retail
0 0 12 0 4 0 0
The meso- and macro-stakeholders of the chain had a similar assessment of the situation; most of them saw farmers as the weakest part of the chain, as the table below shows.
Table 8: Weakest actor of the dairy value chain, as perceived by meso and macro stakeholders
Input provider Input trader ProducerProduce traders Processors
Wholesale/ Distribution Retail
1 0 5 0 3 0 0
Most urgent interventions are required on the production level in order to strengthen the entire value chain.
Processors who deal with less than 2 % of totally consumed milk in Tanzania think that producers are the problem, which is probably right for the small part of the chain where
36
processors are involved. In the entire milk sector producers are the backbone, though. This could be an indication for the way realities are perceived by processors, seeing their part of the chain as the only one, not realizing how unimportant this chain is in the whole picture of the sector. Even more surprising is the fact that supporters have a similar view.
3.4.11 Leader of development of the dairy value chain
Respondents were asked to identify those actors who can become the agents of transformational development of the chain.
The majority of processors (12) clearly see themselves as the impulse providers for value chain development. Some representatives of supporting organisations had difficulties in deciding whom they see in the leading role, those who could specify an actor, also saw processors in the leading role.
In both cases supporters were also seen as an option for initiation of development.
Table 9: Leader of the chain, as perceived by processors.
Input provider Input trader Producer Produce
traders Processors Wholesale/ Distribution Retail Supporters
0 0 1 0 12 0 0 1
Table 10: Leader of the chain, as perceived by supporters.
Input provider Input trader Producer Produce
traders Processors Wholesale/ Distribution Retail Supporters
0 0 0 0 5 0 0 1
The leader of development is clearly seen to be the processors, as perceived by the majority of interviewed processors as well as of representatives of support organisations.
Processors and supporters are convinced of the crucial role of processors for development of the chain. However, it needs to be mentioned that this applies only for the small value chain where processors at all play a role. From the perspective of the entire dairy sector the role of processors as pioneers for development can be questioned as they could not provide a decisive impulse in the past two decades to transform the sector.
The future of the dairy value chain is likely to be connected to commercialization in the farming sector, should processors realize this issue and proactively increase the cooperation with such farmers or encourage existent farmers to take up more commercial ways of farming, the importance of processors as drivers of development will certainly increase.
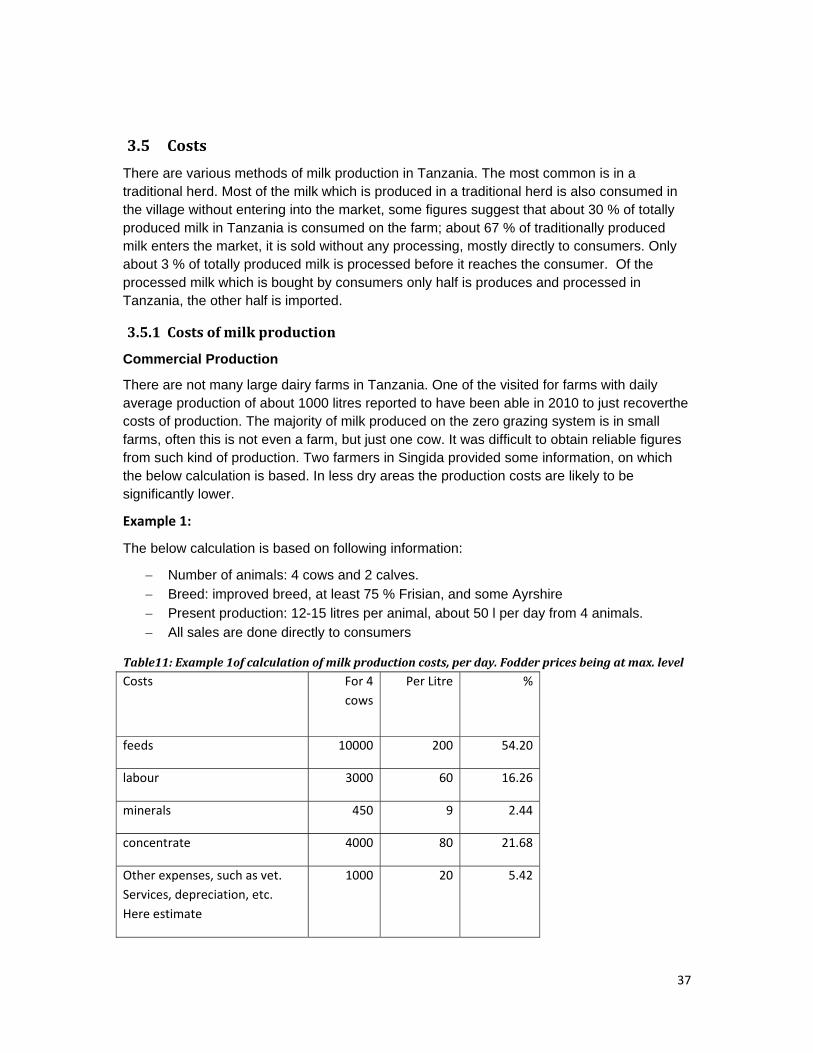
37
3.5 Costs
There are various methods of milk production in Tanzania. The most common is in a traditional herd. Most of the milk which is produced in a traditional herd is also consumed in the village without entering into the market, some figures suggest that about 30 % of totally produced milk in Tanzania is consumed on the farm; about 67 % of traditionally produced milk enters the market, it is sold without any processing, mostly directly to consumers. Only about 3 % of totally produced milk is processed before it reaches the consumer. Of the processed milk which is bought by consumers only half is produces and processed in Tanzania, the other half is imported.
3.5.1 Costs of milk production
Commercial Production
There are not many large dairy farms in Tanzania. One of the visited for farms with daily average production of about 1000 litres reported to have been able in 2010 to just recoverthe costs of production. The majority of milk produced on the zero grazing system is in small farms, often this is not even a farm, but just one cow. It was difficult to obtain reliable figures from such kind of production. Two farmers in Singida provided some information, on which the below calculation is based. In less dry areas the production costs are likely to be significantly lower.
Example 1:
The below calculation is based on following information:
− Number of animals: 4 cows and 2 calves. − Breed: improved breed, at least 75 % Frisian, and some Ayrshire − Present production: 12-15 litres per animal, about 50 l per day from 4 animals. − All sales are done directly to consumers
Table11: Example 1of calculation of milk production costs, per day. Fodder prices being at max. level
Costs For 4 cows
Per Litre %
feeds 10000 200 54.20
labour 3000 60 16.26
minerals 450 9 2.44
concentrate 4000 80 21.68
Other expenses, such as vet. Services, depreciation, etc. Here estimate
1000 20 5.42
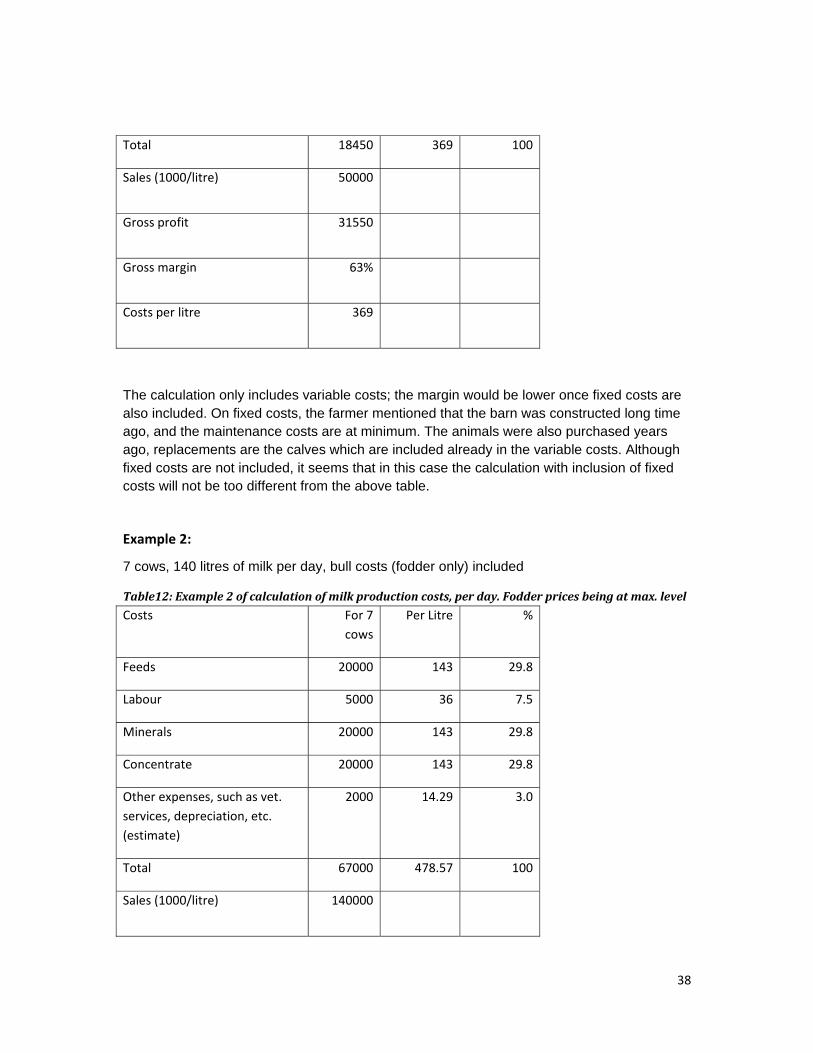
38
Total 18450 369 100
Sales (1000/litre) 50000
Gross profit 31550
Gross margin 63%
Costs per litre 369
The calculation only includes variable costs; the margin would be lower once fixed costs are also included. On fixed costs, the farmer mentioned that the barn was constructed long time ago, and the maintenance costs are at minimum. The animals were also purchased years ago, replacements are the calves which are included already in the variable costs. Although fixed costs are not included, it seems that in this case the calculation with inclusion of fixed costs will not be too different from the above table.
Example 2:
7 cows, 140 litres of milk per day, bull costs (fodder only) included
Table12: Example 2 of calculation of milk production costs, per day. Fodder prices being at max. level
Costs For 7 cows
Per Litre %
Feeds 20000 143 29.8
Labour 5000 36 7.5
Minerals 20000 143 29.8
Concentrate 20000 143 29.8
Other expenses, such as vet. services, depreciation, etc. (estimate)
2000 14.29 3.0
Total 67000 478.57 100
Sales (1000/litre) 140000
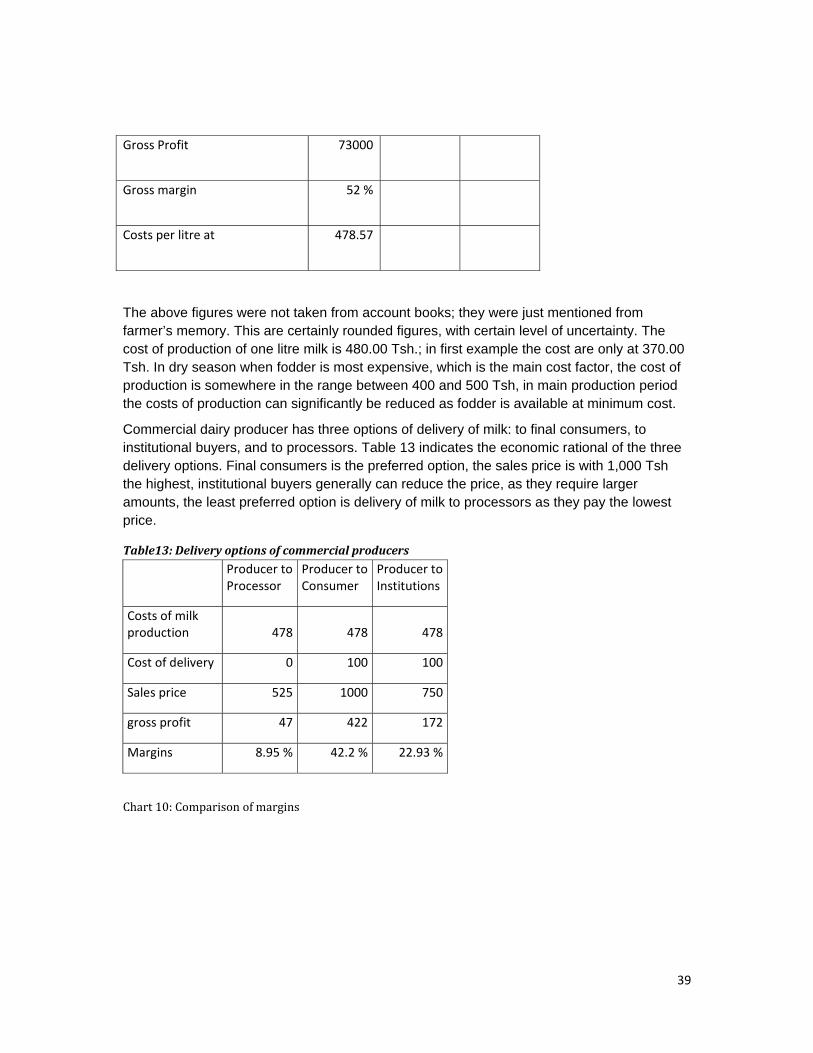
39
Gross Profit 73000
Gross margin 52 %
Costs per litre at 478.57
The above figures were not taken from account books; they were just mentioned from farmer’s memory. This are certainly rounded figures, with certain level of uncertainty. The cost of production of one litre milk is 480.00 Tsh.; in first example the cost are only at 370.00 Tsh. In dry season when fodder is most expensive, which is the main cost factor, the cost of production is somewhere in the range between 400 and 500 Tsh, in main production period the costs of production can significantly be reduced as fodder is available at minimum cost.
Commercial dairy producer has three options of delivery of milk: to final consumers, to institutional buyers, and to processors. Table 13 indicates the economic rational of the three delivery options. Final consumers is the preferred option, the sales price is with 1,000 Tsh the highest, institutional buyers generally can reduce the price, as they require larger amounts, the least preferred option is delivery of milk to processors as they pay the lowest price.
Table13: Delivery options of commercial producers
Producer to Processor
Producer to Consumer
Producer to Institutions
Costs of milk production 478 478 478
Cost of delivery 0 100 100
Sales price 525 1000 750
gross profit 47 422 172
Margins 8.95 % 42.2 % 22.93 %
Chart 10: Comparison of margins
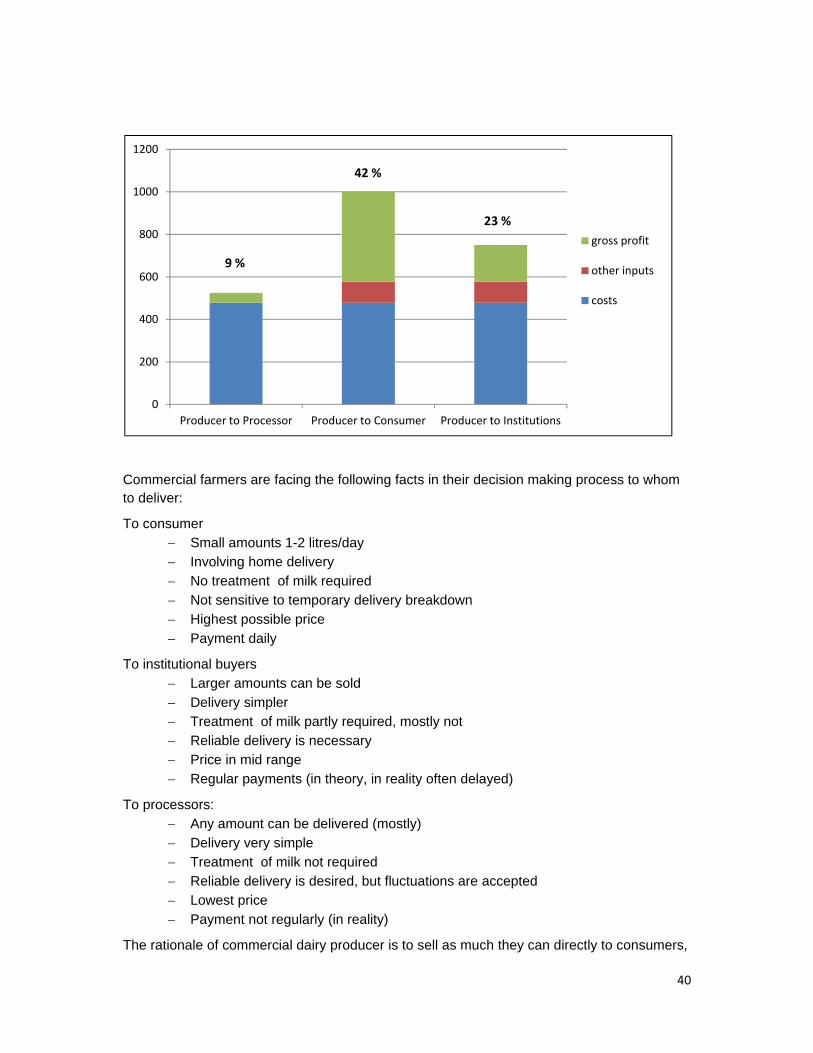
40
Commercial farmers are facing the following facts in their decision making process to whom to deliver:
To consumer − Small amounts 1-2 litres/day − Involving home delivery − No treatment of milk required − Not sensitive to temporary delivery breakdown − Highest possible price − Payment daily
To institutional buyers − Larger amounts can be sold − Delivery simpler − Treatment of milk partly required, mostly not − Reliable delivery is necessary − Price in mid range − Regular payments (in theory, in reality often delayed)
To processors: − Any amount can be delivered (mostly) − Delivery very simple − Treatment of milk not required − Reliable delivery is desired, but fluctuations are accepted − Lowest price − Payment not regularly (in reality)
The rationale of commercial dairy producer is to sell as much they can directly to consumers,
0
200
400
600
800
1000
1200
Producer to Processor Producer to Consumer Producer to Institutions
gross profit
other inputs
costs
9 %
42 %
23 %
41
if possible to have some regular institutional buyers who can buy in bulk, and only what cannot be sold to those two buyers should be sold to processor.
This issue is an extremely important matter for potential development of the dairy value chain. Even those producers which are partial owners of the processing industry will always try to supply directly to consumers and institutional buyers and only “leftovers” are delivered to processors. Processors do not really have a bargaining power, as a buyer of secondary importance they are fully dependent on the primary market developments.
Traditional Production
Traditional milk production has a different rationale than the commercially oriented production; milk is produced in herds of animals which are kept extensively, this farming system can be characterized as follows:
− Close to no costs involved, except labour costs and some vet. medicine costs − Animals tolerate close to any condition of environment − Production can be stopped and started at any time of the lactation − High margin, close to 100 % − Close to no risks
Traditional producers have close to no costs. They spend some money on deworming and other animal treatment, but these costs are not so significant. Fodder becomes only a cost factor when it is not available, but when it is available it is almost free of charge. Opportunity costs for labour cannot be counted as they really have no other opportunities to work in remote locations. Almost all the price the farmer gets can be considered as gross profit, or a profit margin of close to 100%. In traditional cattle keeping the herds are taken care of by men, the milking cows are mostly managed by women. Often when the herd moves for better pastures the milking cows remain with women at their settlement. Such animals are consequently not fully dependent of nature, fodder is sometimes collected by children, or if available additional feeds are given. However, this still remains on an extensive level, not causing significant costs.
Improvement of such a system is a challenging task. Mostly the issue of low productivity is taken as reason for interventions, with the aim of improving production from 1 litre per day and per cow to higher level. But such improvements can only be achieved at increased costs and risks, such as:
− Higher requirements for fodder and hygiene − Animals are less tolerant to harsh conditions − Animals have to be milked daily − Animals need to be produced at an increased breeding costs − Smaller margin − Higher risks
Although production increases due to improvement interventions, subsistence oriented farmer is likely to do better with traditional and not improved cattle. The risks certainly increase with introduction of the improvement options, which need to be considered, especially in subsistence oriented agriculture, where risk minimization is the main motivation
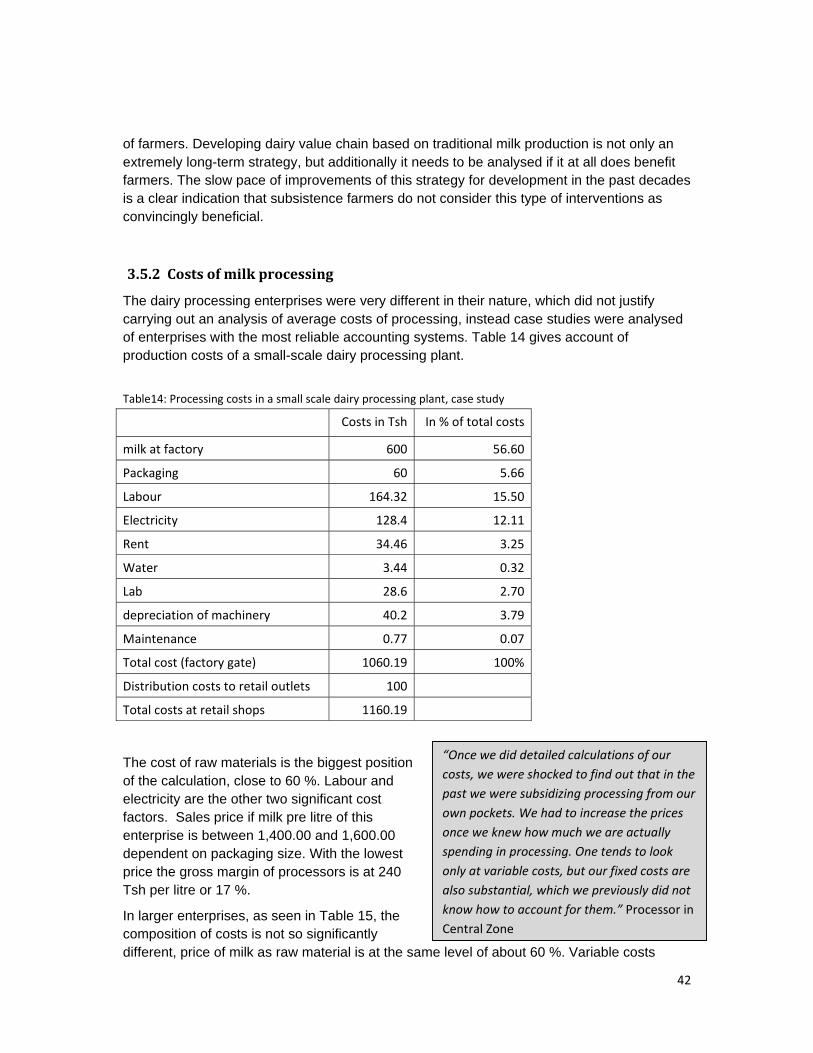
42
of farmers. Developing dairy value chain based on traditional milk production is not only an extremely long-term strategy, but additionally it needs to be analysed if it at all does benefit farmers. The slow pace of improvements of this strategy for development in the past decades is a clear indication that subsistence farmers do not consider this type of interventions as convincingly beneficial.
3.5.2 Costs of milk processing
The dairy processing enterprises were very different in their nature, which did not justify carrying out an analysis of average costs of processing, instead case studies were analysed of enterprises with the most reliable accounting systems. Table 14 gives account of production costs of a small-scale dairy processing plant.
Table14: Processing costs in a small scale dairy processing plant, case study
Costs in Tsh In % of total costs
milk at factory 600 56.60
Packaging 60 5.66
Labour 164.32 15.50
Electricity 128.4 12.11
Rent 34.46 3.25
Water 3.44 0.32
Lab 28.6 2.70
depreciation of machinery 40.2 3.79
Maintenance 0.77 0.07
Total cost (factory gate) 1060.19 100%
Distribution costs to retail outlets 100
Total costs at retail shops 1160.19
The cost of raw materials is the biggest position of the calculation, close to 60 %. Labour and electricity are the other two significant cost factors. Sales price if milk pre litre of this enterprise is between 1,400.00 and 1,600.00 dependent on packaging size. With the lowest price the gross margin of processors is at 240 Tsh per litre or 17 %.
In larger enterprises, as seen in Table 15, the composition of costs is not so significantly different, price of milk as raw material is at the same level of about 60 %. Variable costs
“Once we did detailed calculations of our costs, we were shocked to find out that in the past we were subsidizing processing from our own pockets. We had to increase the prices once we knew how much we are actually spending in processing. One tends to look only at variable costs, but our fixed costs are also substantial, which we previously did not know how to account for them.” Processor in Central Zone
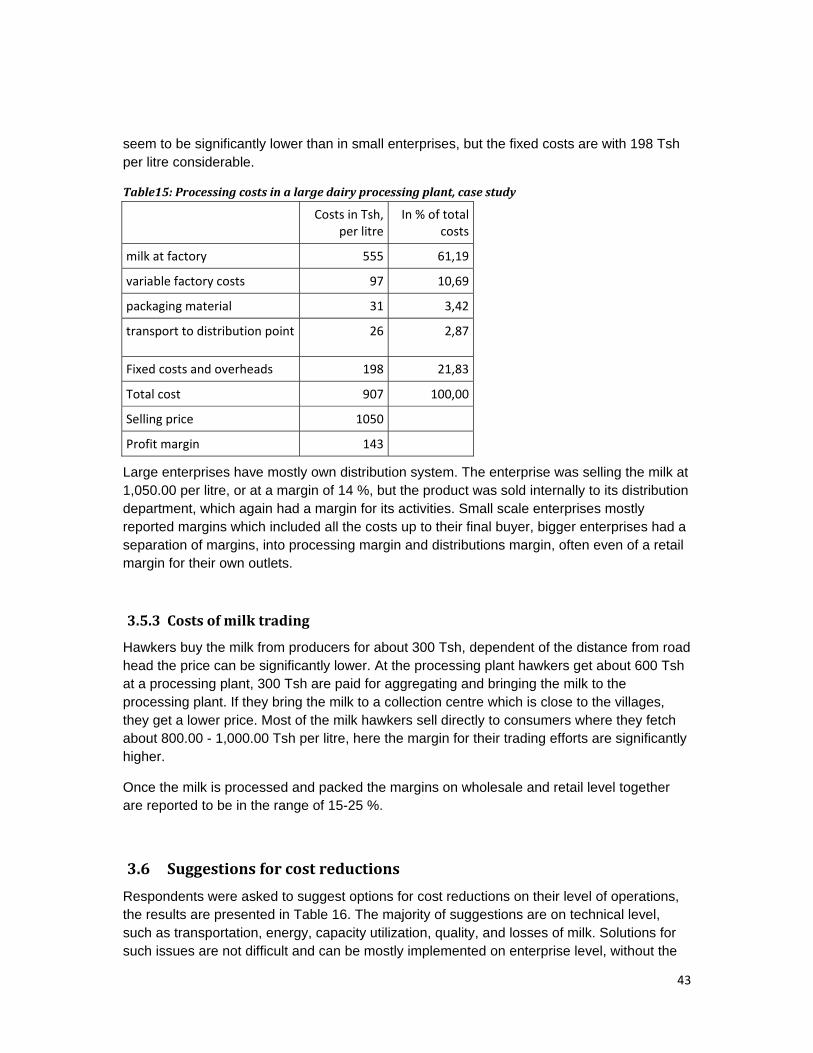
43
seem to be significantly lower than in small enterprises, but the fixed costs are with 198 Tsh per litre considerable.
Table15: Processing costs in a large dairy processing plant, case study
Costs in Tsh, per litre
In % of total costs
milk at factory 555 61,19
variable factory costs 97 10,69
packaging material 31 3,42
transport to distribution point 26 2,87
Fixed costs and overheads 198 21,83
Total cost 907 100,00
Selling price 1050
Profit margin 143
Large enterprises have mostly own distribution system. The enterprise was selling the milk at 1,050.00 per litre, or at a margin of 14 %, but the product was sold internally to its distribution department, which again had a margin for its activities. Small scale enterprises mostly reported margins which included all the costs up to their final buyer, bigger enterprises had a separation of margins, into processing margin and distributions margin, often even of a retail margin for their own outlets.
3.5.3 Costs of milk trading
Hawkers buy the milk from producers for about 300 Tsh, dependent of the distance from road head the price can be significantly lower. At the processing plant hawkers get about 600 Tsh at a processing plant, 300 Tsh are paid for aggregating and bringing the milk to the processing plant. If they bring the milk to a collection centre which is close to the villages, they get a lower price. Most of the milk hawkers sell directly to consumers where they fetch about 800.00 - 1,000.00 Tsh per litre, here the margin for their trading efforts are significantly higher.
Once the milk is processed and packed the margins on wholesale and retail level together are reported to be in the range of 15-25 %.
3.6 Suggestions for cost reductions
Respondents were asked to suggest options for cost reductions on their level of operations, the results are presented in Table 16. The majority of suggestions are on technical level, such as transportation, energy, capacity utilization, quality, and losses of milk. Solutions for such issues are not difficult and can be mostly implemented on enterprise level, without the
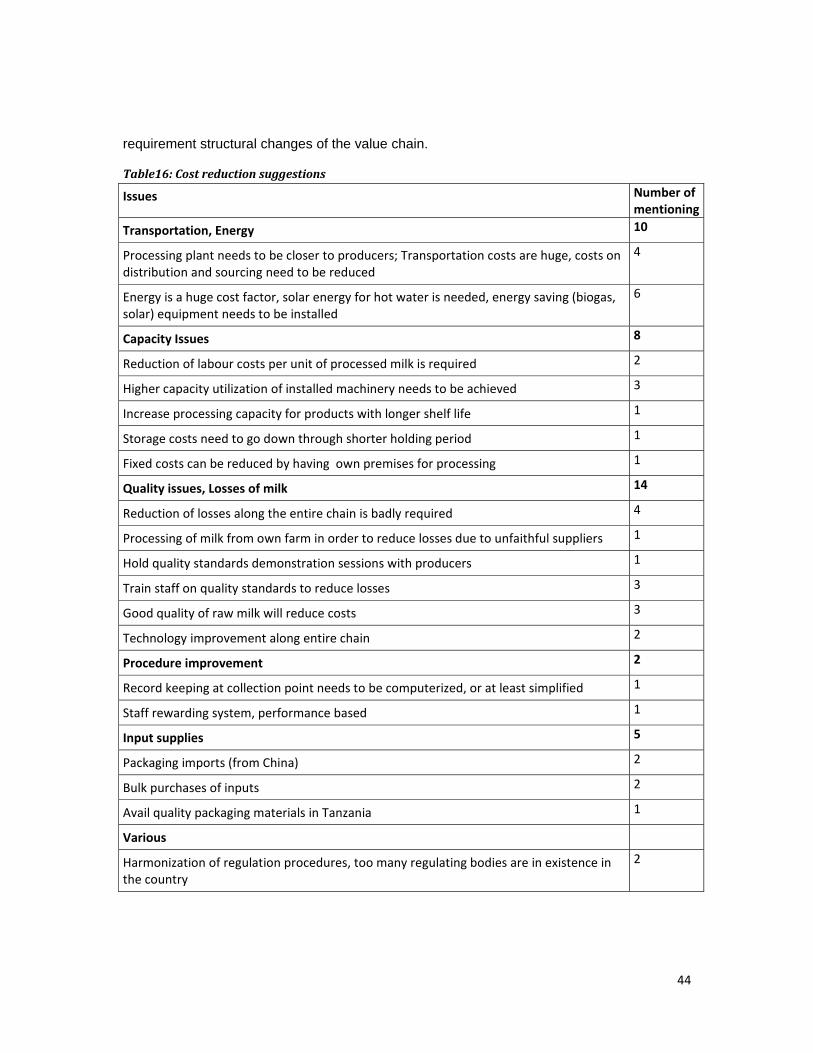
44
requirement structural changes of the value chain.
Table16: Cost reduction suggestions
Issues Number of mentioning
Transportation, Energy 10
Processing plant needs to be closer to producers; Transportation costs are huge, costs on distribution and sourcing need to be reduced
4
Energy is a huge cost factor, solar energy for hot water is needed, energy saving (biogas, solar) equipment needs to be installed
6
Capacity Issues 8
Reduction of labour costs per unit of processed milk is required 2
Higher capacity utilization of installed machinery needs to be achieved 3
Increase processing capacity for products with longer shelf life 1
Storage costs need to go down through shorter holding period 1
Fixed costs can be reduced by having own premises for processing 1
Quality issues, Losses of milk 14
Reduction of losses along the entire chain is badly required 4
Processing of milk from own farm in order to reduce losses due to unfaithful suppliers 1
Hold quality standards demonstration sessions with producers 1
Train staff on quality standards to reduce losses 3
Good quality of raw milk will reduce costs 3
Technology improvement along entire chain 2
Procedure improvement 2
Record keeping at collection point needs to be computerized, or at least simplified 1
Staff rewarding system, performance based 1
Input supplies 5
Packaging imports (from China) 2
Bulk purchases of inputs 2
Avail quality packaging materials in Tanzania 1
Various
Harmonization of regulation procedures, too many regulating bodies are in existence in the country
2
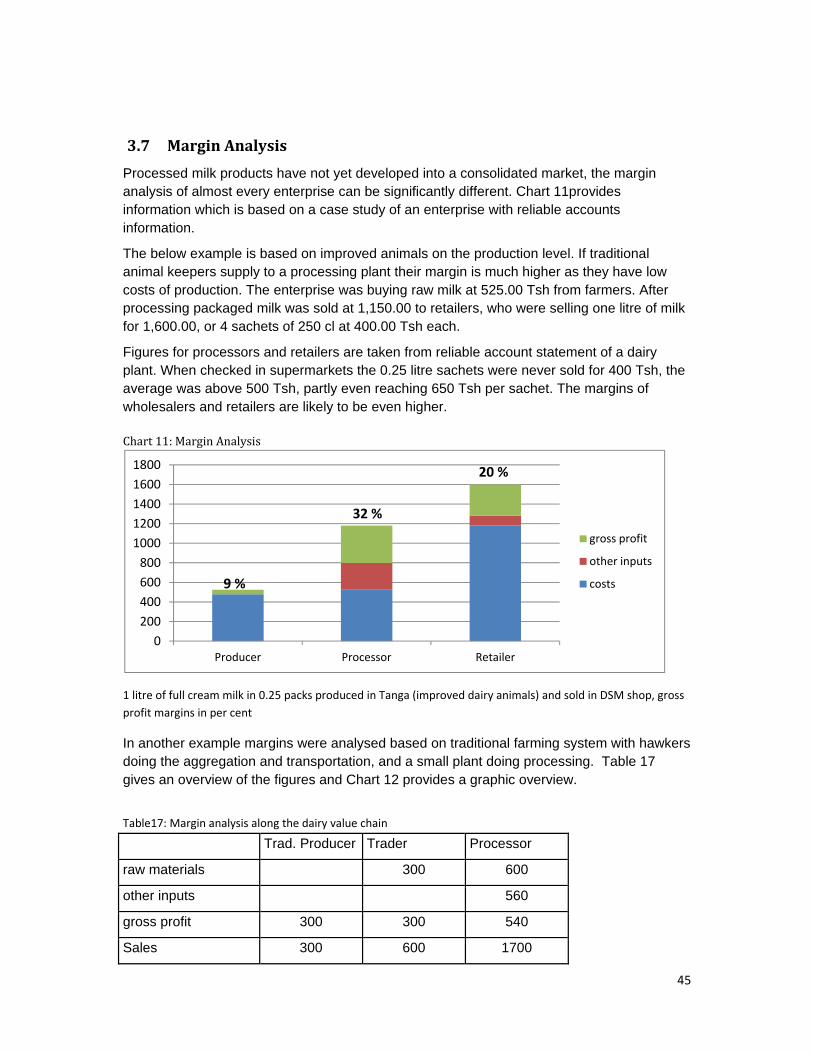
45
3.7 Margin Analysis
Processed milk products have not yet developed into a consolidated market, the margin analysis of almost every enterprise can be significantly different. Chart 11provides information which is based on a case study of an enterprise with reliable accounts information.
The below example is based on improved animals on the production level. If traditional animal keepers supply to a processing plant their margin is much higher as they have low costs of production. The enterprise was buying raw milk at 525.00 Tsh from farmers. After processing packaged milk was sold at 1,150.00 to retailers, who were selling one litre of milk for 1,600.00, or 4 sachets of 250 cl at 400.00 Tsh each.
Figures for processors and retailers are taken from reliable account statement of a dairy plant. When checked in supermarkets the 0.25 litre sachets were never sold for 400 Tsh, the average was above 500 Tsh, partly even reaching 650 Tsh per sachet. The margins of wholesalers and retailers are likely to be even higher. Chart 11: Margin Analysis
1 litre of full cream milk in 0.25 packs produced in Tanga (improved dairy animals) and sold in DSM shop, gross profit margins in per cent
In another example margins were analysed based on traditional farming system with hawkers doing the aggregation and transportation, and a small plant doing processing. Table 17 gives an overview of the figures and Chart 12 provides a graphic overview.
Table17: Margin analysis along the dairy value chain
Trad. Producer Trader Processor
raw materials 300 600
other inputs 560
gross profit 300 300 540
Sales 300 600 1700
9 %
32 %
20 %
0200400600800
10001200140016001800
Producer Processor Retailer
gross profit
other inputs
costs
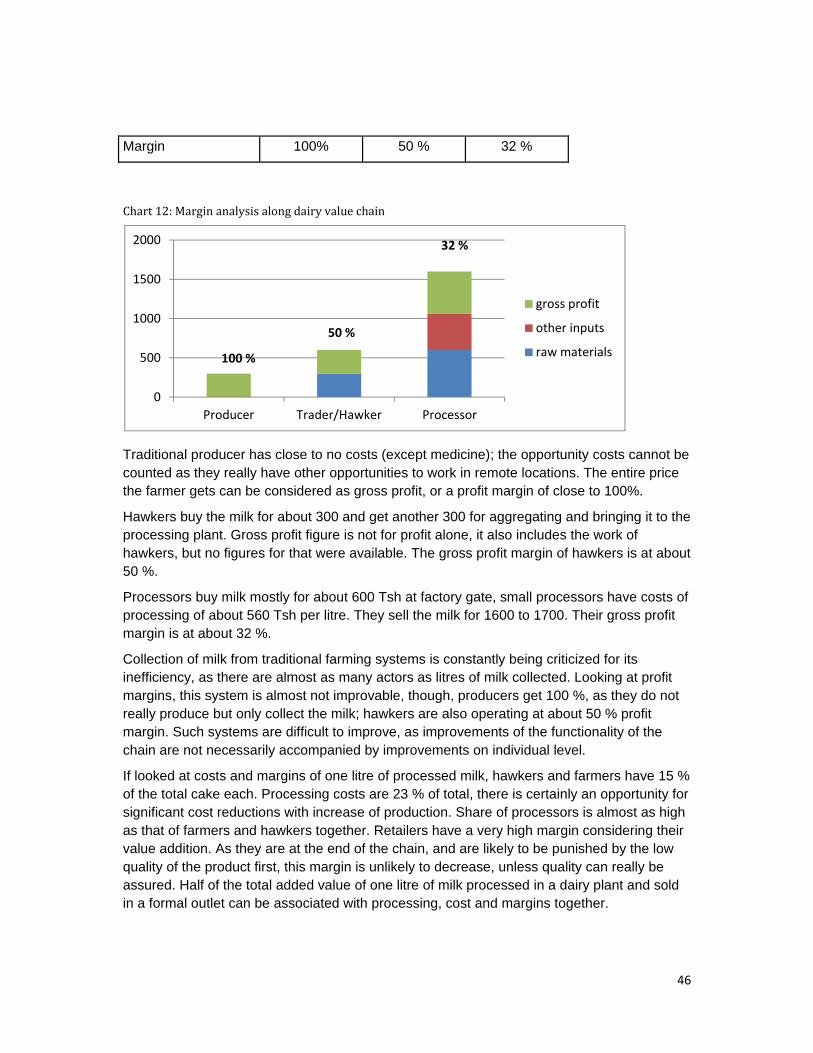
46
Margin 100% 50 % 32 %
Chart 12: Margin analysis along dairy value chain
Traditional producer has close to no costs (except medicine); the opportunity costs cannot be counted as they really have other opportunities to work in remote locations. The entire price the farmer gets can be considered as gross profit, or a profit margin of close to 100%.
Hawkers buy the milk for about 300 and get another 300 for aggregating and bringing it to the processing plant. Gross profit figure is not for profit alone, it also includes the work of hawkers, but no figures for that were available. The gross profit margin of hawkers is at about 50 %.
Processors buy milk mostly for about 600 Tsh at factory gate, small processors have costs of processing of about 560 Tsh per litre. They sell the milk for 1600 to 1700. Their gross profit margin is at about 32 %.
Collection of milk from traditional farming systems is constantly being criticized for its inefficiency, as there are almost as many actors as litres of milk collected. Looking at profit margins, this system is almost not improvable, though, producers get 100 %, as they do not really produce but only collect the milk; hawkers are also operating at about 50 % profit margin. Such systems are difficult to improve, as improvements of the functionality of the chain are not necessarily accompanied by improvements on individual level.
If looked at costs and margins of one litre of processed milk, hawkers and farmers have 15 % of the total cake each. Processing costs are 23 % of total, there is certainly an opportunity for significant cost reductions with increase of production. Share of processors is almost as high as that of farmers and hawkers together. Retailers have a very high margin considering their value addition. As they are at the end of the chain, and are likely to be punished by the low quality of the product first, this margin is unlikely to decrease, unless quality can really be assured. Half of the total added value of one litre of milk processed in a dairy plant and sold in a formal outlet can be associated with processing, cost and margins together.
0
500
1000
1500
2000
Producer Trader/Hawker Processor
gross profit
other inputs
raw materials50 %
32 %
100 %
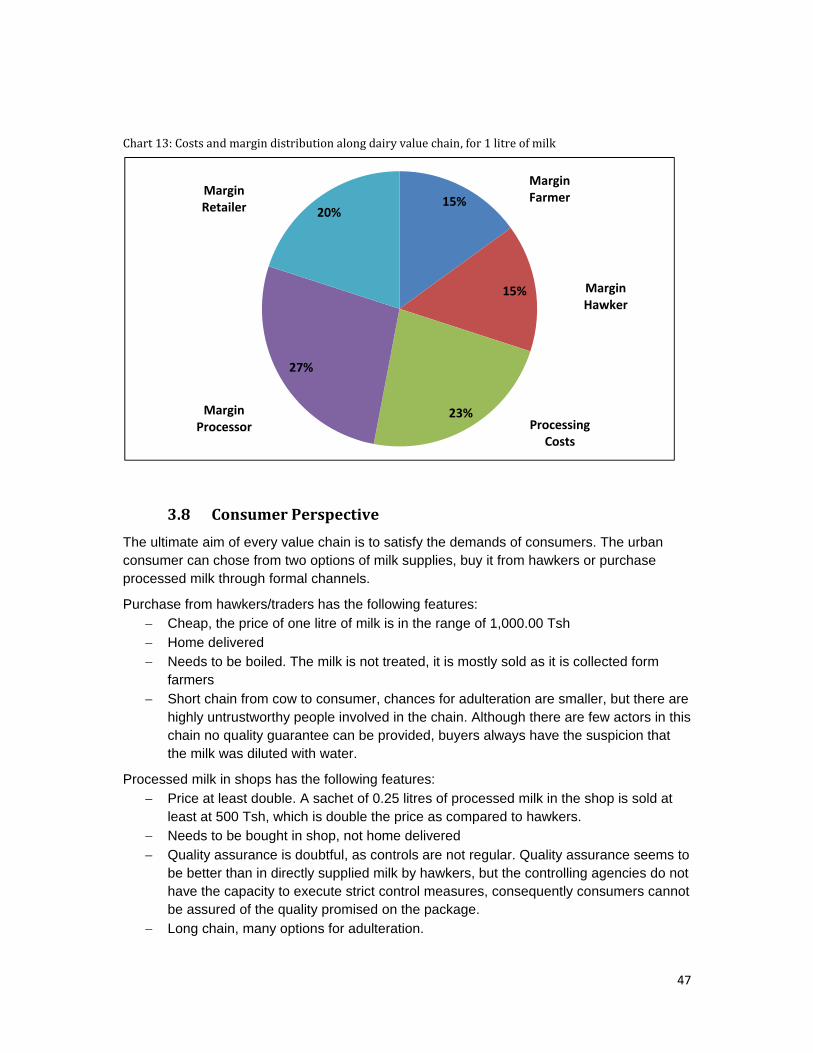
47
Chart 13: Costs and margin distribution along dairy value chain, for 1 litre of milk
3.8 Consumer Perspective
The ultimate aim of every value chain is to satisfy the demands of consumers. The urban consumer can chose from two options of milk supplies, buy it from hawkers or purchase processed milk through formal channels.
Purchase from hawkers/traders has the following features: − Cheap, the price of one litre of milk is in the range of 1,000.00 Tsh − Home delivered − Needs to be boiled. The milk is not treated, it is mostly sold as it is collected form
farmers − Short chain from cow to consumer, chances for adulteration are smaller, but there are
highly untrustworthy people involved in the chain. Although there are few actors in this chain no quality guarantee can be provided, buyers always have the suspicion that the milk was diluted with water.
Processed milk in shops has the following features: − Price at least double. A sachet of 0.25 litres of processed milk in the shop is sold at
least at 500 Tsh, which is double the price as compared to hawkers. − Needs to be bought in shop, not home delivered − Quality assurance is doubtful, as controls are not regular. Quality assurance seems to
be better than in directly supplied milk by hawkers, but the controlling agencies do not have the capacity to execute strict control measures, consequently consumers cannot be assured of the quality promised on the package.
− Long chain, many options for adulteration.
15%
15%
23%
27%
20%
Margin Farmer
Margin Hawker
Processing Costs
Margin Processor
Margin Retailer
48
The number of quality conscious consumers, who would preferably buy processed milk is mostly positively correlated to income increases. As Tanzania economy is steadily increasing the number of quality conscious consumers is likely to increase. In interviews respondents repeatedly mentioned that the number of quality conscious consumers is increasing, but there are no figures available to prove this trend. However, the numbers of quality conscious consumers who would exclusively buy processed milk are small; they are almost negligible as compared to the total number of milk consumers in the country. From consumer perspective there is no pressing evidence that one should buy processed milk, although it seems to be of better quality, no assurance of quality control measures can be provided. The vast majority of consumers are likely to buy cheaper produce as long as there is no full guarantee of the quality of processed products.
3.9 SWOT Analysis
3.9.1. Strengths and Weaknesses Analysis
The assessment of strengths and weaknesses was done of an aggregated level of processors. Processors were asked to grade their financial, physical and human resources on a scale of 1 (weak) to 5 (strong), as perceived by them. Assessment of the following resources was under investigation:
− Financial (capital, equity holders, bank loans, etc) − Physical (plant, equipment, location, access to raw materials, etc) − Human (training, experience, relationships, intelligence, skills)
The below table shows that human resources are graded as the weakest (2.25) point, followed by lack of financial resources; generally processors think that they are equipped sufficiently, but do not have the right knowledge and financial means to utilize their equipment fully.
“What choice do you have as consumer? Buying from hawkers, not knowing what you are actually getting? Is it just water what they added? Or buying processed milk from shops? Is it really better? How often it is also of strange taste? Can you be really sure that it is of better quality? I would love to buy processed milk in the shop, as most people in the word do, but as long as I cannot be sure of its superiority why should I pay double price? I guess the only milk of reliable quality is the UHT milk, but I just dislike the idea of buying imported milk in a country where cows almost outnumber people.” Consumer in Dar es Salaam
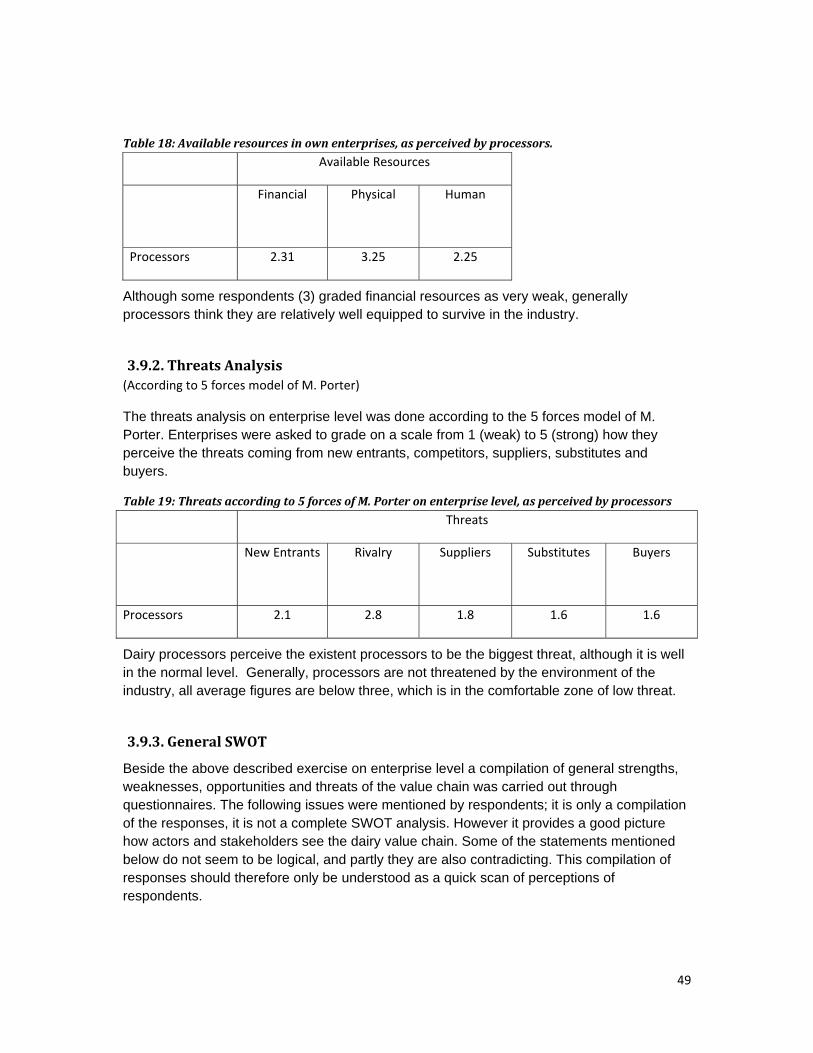
49
Table 18: Available resources in own enterprises, as perceived by processors.
Available Resources
Financial Physical Human
Processors 2.31 3.25 2.25
Although some respondents (3) graded financial resources as very weak, generally processors think they are relatively well equipped to survive in the industry.
3.9.2. Threats Analysis (According to 5 forces model of M. Porter)
The threats analysis on enterprise level was done according to the 5 forces model of M. Porter. Enterprises were asked to grade on a scale from 1 (weak) to 5 (strong) how they perceive the threats coming from new entrants, competitors, suppliers, substitutes and buyers.
Table 19: Threats according to 5 forces of M. Porter on enterprise level, as perceived by processors
Threats
New Entrants Rivalry Suppliers Substitutes Buyers
Processors 2.1 2.8 1.8 1.6 1.6
Dairy processors perceive the existent processors to be the biggest threat, although it is well in the normal level. Generally, processors are not threatened by the environment of the industry, all average figures are below three, which is in the comfortable zone of low threat.
3.9.3. General SWOT
Beside the above described exercise on enterprise level a compilation of general strengths, weaknesses, opportunities and threats of the value chain was carried out through questionnaires. The following issues were mentioned by respondents; it is only a compilation of the responses, it is not a complete SWOT analysis. However it provides a good picture how actors and stakeholders see the dairy value chain. Some of the statements mentioned below do not seem to be logical, and partly they are also contradicting. This compilation of responses should therefore only be understood as a quick scan of perceptions of respondents.
50
Strengths
Production issues: − Keeping animals is a traditional activity in Tanzania, people do not have to be trained
to start animal keeping − Land for dairy production is available in many parts of Tanzania − The number of animals is high, third highest in Africa − Some parts of the country are excellent for dairy production, e.g. in Tanga there is
good rain all year around and enough grass available − Producers have assured income throughout the year although the margins are small,
regularity of income − powerful tool for rural development as incomes can be generated in poorer parts of
the society on regular basis in most parts of the country
Marketing issues: − Huge market for dairy products in Tanzania and in the region − Consumer awareness is high in some parts of the country
Quality issues: − Exceptional nutritional value of milk for food security
Policy issues: − There is political will to support agriculture in general
Weaknesses:
General issues: − There is no proper vision for the chain development − lack of investment along the entire value chain − Poor chain management and coordination − No clear division of roles along the chain, too much integration by actors − Too many actors within the chain
Production issues: − 70 % of milk comes from non-dairy animals − Inability to absorb all milk during peak production − Feed costs are very high in intensive husbandry systems, feed prices bring down milk
production
Processing issues: − Low storage capacity in the market in Dar − Qualified dairy specialists and technicians not available − Poor milk collection systems, limited cold chains − No suppliers of dairy equipment and packaging materials in Tanzania
Marketing issues: − population is not educated of the value of milk − no consumption promotion of dairy products is done
51
− Market access for producers is bad − Local market is not supplied sufficiently − Tanzanian consumers prefer imported products − Low consumption of dairy products in Tanzania
Quality issues: − Hawkers adulterate milk and sell at the same price as processed milk − No approved milk containers for traders of raw milk are available
Policy issues: − Double standard, processors are checked by authorities black market not
Threats:
The threat analysis through questionnaires showed that processors do not perceive the value chain as threatening on their level of operations. Looking at the entire value chain the following issues were mentioned as threats:
Production issues: − Genetic erosion of the current dairy animals, despite efforts towards improvement of
dairy cattle the breed is not improving − Dairy research is not well developed in Tanzania, successes of the past almost
disappeared − High prices for inputs − Kenyan milk collectors inflate the prices and make milk less available
Processing issues: − At present prices processors will not be able to compete with hawkers − High prices for inputs
Marketing issues: − Imports of finished products are often cheaper than locally produced products − Consumption habits had changed, milk is not an essential commodity anymore
Policy issues: − Government does not see dairy as priority sector − Too many regulatory bodies dealing with dairy sector
Opportunities:
General issues: − Dairy sector has a huge potential to develop regions − Milk is important for food security − Many dairy sector supporters are coming up
Production issues:
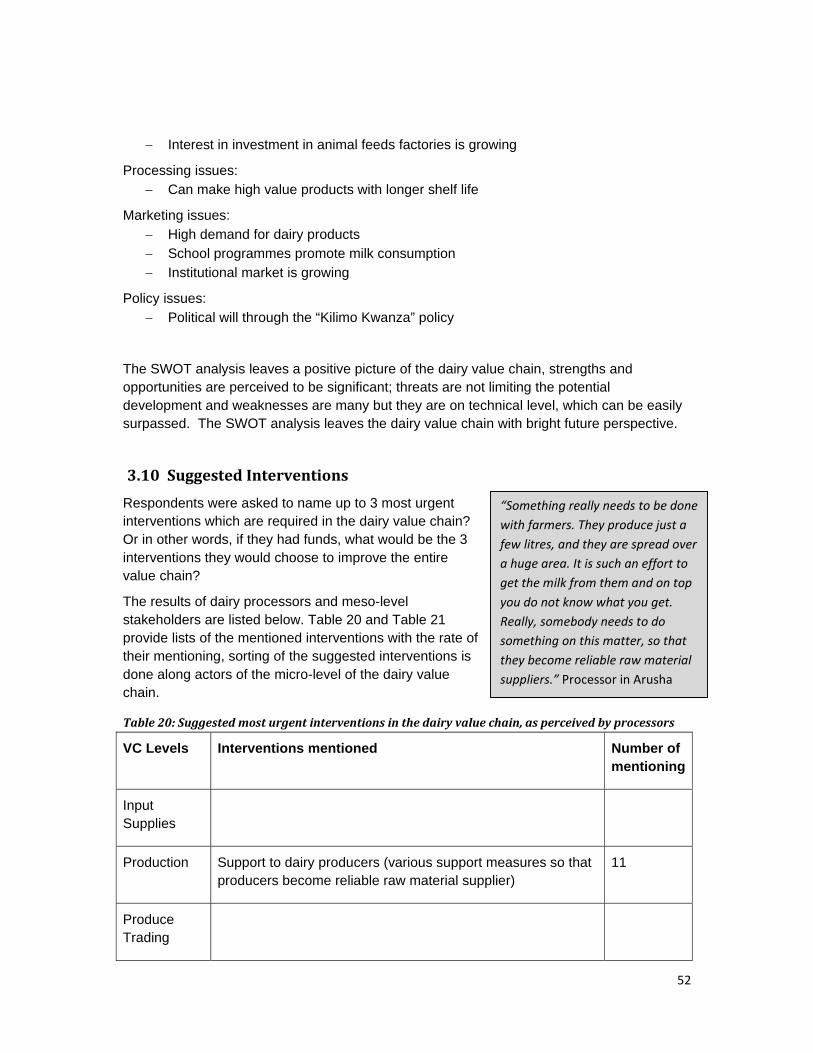
52
− Interest in investment in animal feeds factories is growing
Processing issues: − Can make high value products with longer shelf life
Marketing issues: − High demand for dairy products − School programmes promote milk consumption − Institutional market is growing
Policy issues: − Political will through the “Kilimo Kwanza” policy
The SWOT analysis leaves a positive picture of the dairy value chain, strengths and opportunities are perceived to be significant; threats are not limiting the potential development and weaknesses are many but they are on technical level, which can be easily surpassed. The SWOT analysis leaves the dairy value chain with bright future perspective.
3.10 Suggested Interventions Respondents were asked to name up to 3 most urgent interventions which are required in the dairy value chain? Or in other words, if they had funds, what would be the 3 interventions they would choose to improve the entire value chain?
The results of dairy processors and meso-level stakeholders are listed below. Table 20 and Table 21 provide lists of the mentioned interventions with the rate of their mentioning, sorting of the suggested interventions is done along actors of the micro-level of the dairy value chain.
Table 20: Suggested most urgent interventions in the dairy value chain, as perceived by processors
VC Levels Interventions mentioned Number of mentioning
Input Supplies
Production Support to dairy producers (various support measures so that producers become reliable raw material supplier)
11
Produce Trading
“Something really needs to be done with farmers. They produce just a few litres, and they are spread over a huge area. It is such an effort to get the milk from them and on top you do not know what you get. Really, somebody needs to do something on this matter, so that they become reliable raw material suppliers.” Processor in Arusha
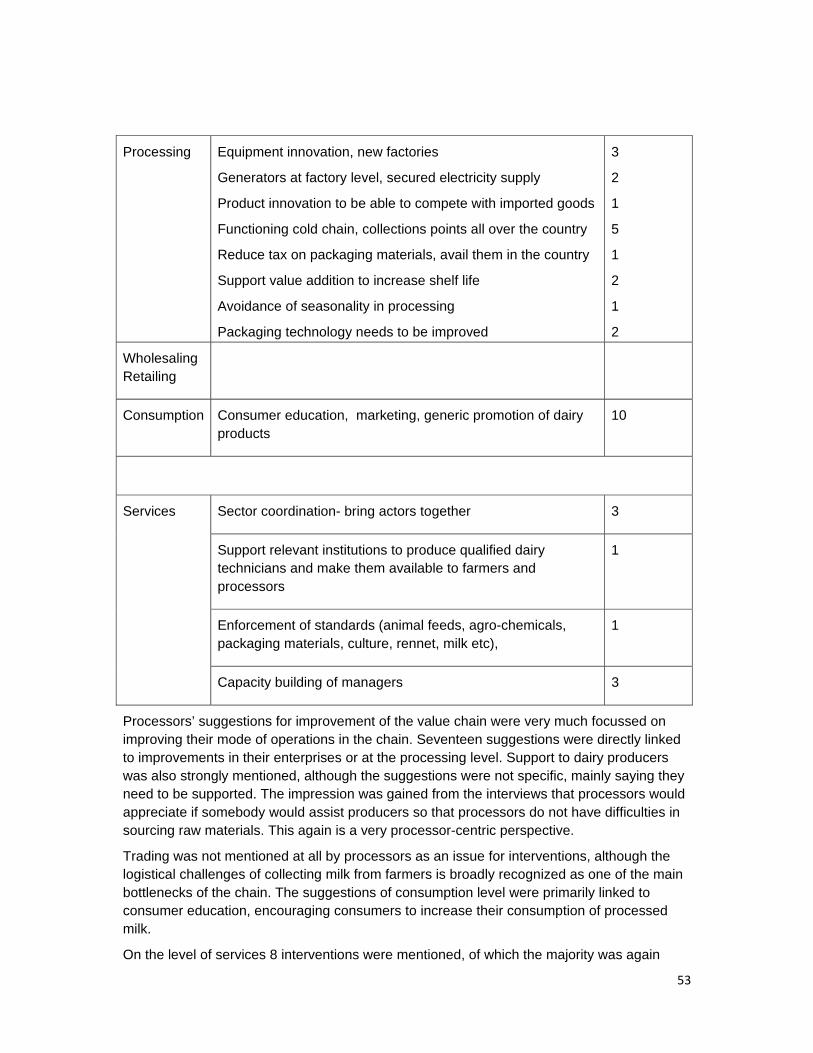
53
Processing Equipment innovation, new factories
Generators at factory level, secured electricity supply
Product innovation to be able to compete with imported goods
Functioning cold chain, collections points all over the country
Reduce tax on packaging materials, avail them in the country
Support value addition to increase shelf life
Avoidance of seasonality in processing
Packaging technology needs to be improved
3
2
1
5
1
2
1
2
Wholesaling Retailing
Consumption Consumer education, marketing, generic promotion of dairy products
10
Services Sector coordination- bring actors together 3
Support relevant institutions to produce qualified dairy technicians and make them available to farmers and processors
1
Enforcement of standards (animal feeds, agro-chemicals, packaging materials, culture, rennet, milk etc),
1
Capacity building of managers 3
Processors’ suggestions for improvement of the value chain were very much focussed on improving their mode of operations in the chain. Seventeen suggestions were directly linked to improvements in their enterprises or at the processing level. Support to dairy producers was also strongly mentioned, although the suggestions were not specific, mainly saying they need to be supported. The impression was gained from the interviews that processors would appreciate if somebody would assist producers so that processors do not have difficulties in sourcing raw materials. This again is a very processor-centric perspective.
Trading was not mentioned at all by processors as an issue for interventions, although the logistical challenges of collecting milk from farmers is broadly recognized as one of the main bottlenecks of the chain. The suggestions of consumption level were primarily linked to consumer education, encouraging consumers to increase their consumption of processed milk.
On the level of services 8 interventions were mentioned, of which the majority was again
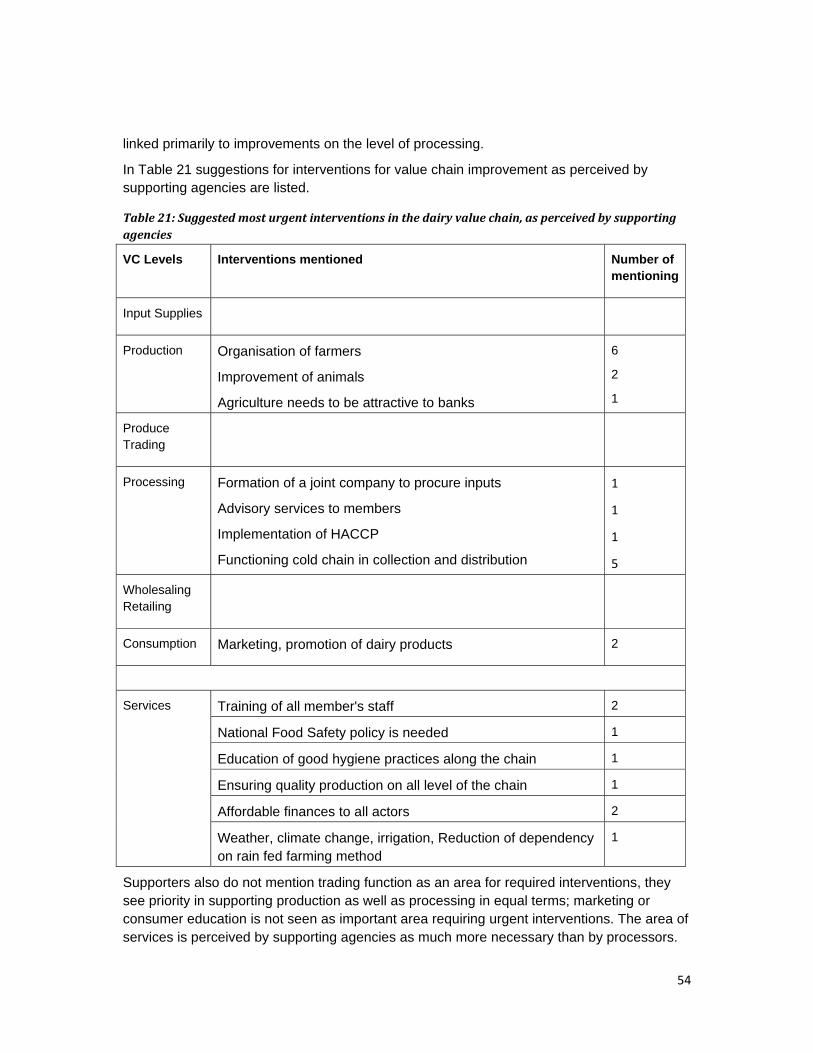
54
linked primarily to improvements on the level of processing.
In Table 21 suggestions for interventions for value chain improvement as perceived by supporting agencies are listed.
Table 21: Suggested most urgent interventions in the dairy value chain, as perceived by supporting agencies
VC Levels Interventions mentioned Number of mentioning
Input Supplies
Production Organisation of farmers
Improvement of animals
Agriculture needs to be attractive to banks
6
2
1
Produce Trading
Processing Formation of a joint company to procure inputs
Advisory services to members
Implementation of HACCP
Functioning cold chain in collection and distribution
1
1
1
5
Wholesaling Retailing
Consumption Marketing, promotion of dairy products 2
Services Training of all member's staff 2
National Food Safety policy is needed 1
Education of good hygiene practices along the chain 1
Ensuring quality production on all level of the chain 1
Affordable finances to all actors 2
Weather, climate change, irrigation, Reduction of dependency on rain fed farming method
1
Supporters also do not mention trading function as an area for required interventions, they see priority in supporting production as well as processing in equal terms; marketing or consumer education is not seen as important area requiring urgent interventions. The area of services is perceived by supporting agencies as much more necessary than by processors.

55
56
4. Recommendations
The dairy value chain can be divided into three distinctive parts: the subsistence farming system with home consumption, semi-subsistence system with partial link to the market via informal channels and the improved farming system utilizing the formal marketing channels.
In the subsistence farming system milk is produced on the farm, partly even processed and entirely consumed by the farming community. The produce of the subsistence farming system is not entering the monetary cycle, no change of ownership takes place from producer to consumer. Improvements in this part of the value chain cannot be designed as a value chain approach, as there is no chain involving various actors in existence. Interventions in this sector should have rather a food security or nutritional orientation. Nothing can be done in this part of the chain from value chain perspective; the only thinkable intervention is providing market access to actors of this sector, thus transferring them into the next level of chain, marketing of milk via informal channels. The existence of subsistence farming is inversely correlated to general rural development of Tanzania. It is likely that this sector will reduce in the same pace as the GDP of Tanzania and alternative employment opportunities in rural areas are increasing.
Sixty seven percent of milk produced in the country is marketed through traditional channels. Considering the size of this sector, as well as its regional coverage, it is spread out over the entire country; it seems to be logical that the majority of interventions with the task of improvement of the dairy value chain were focussing their activities in this sector in the past two decades. Additionally, any successes in this sector would encourage subsistence farmers to increase their market linkages, moving from first sector to the second. However, although this sector seems to be the natural entry point for interventions, intensive efforts by a large variety of support agencies did not lead to significant results in recent past. Interventions in this part of the chain are necessary as they target the majority of dairy producers, but if strategic improvement of the dairy value chain is considered this part of the chain is not likely to provide the foundation for its development.
Dairy industry is about moving or removing of water – close to consumers it makes sense to move the collected milk with the least processing effort to the consumer. All over the world there are intensive dairy plants around urban centres. The further one moves away with production from the actual consumers, milk should be transferred into more valuable products like cheese, butter, ghee, etc. Besides some physiological aspects of milk such as perishability the transportation costs is the decisive factor in which form the milk should be sold to consumers, as milk or as a processed product.
The present consumer prices for processed dairy products in Tanzania are on a high level, it makes economically sense to move raw milk over large distances and still make money on processing. Presently collection of milk is carried out even in small amounts from remote locations; up to several hundreds of kilometres is not an exception. Once the value chain reaches higher levels of development, this phenomenon is likely to disappear; milk will be processed closer to producers.
According to Table 22 future interventions from value chain perspective should completely ignore the subsistence farming sector, they should be designed to improve the operations of
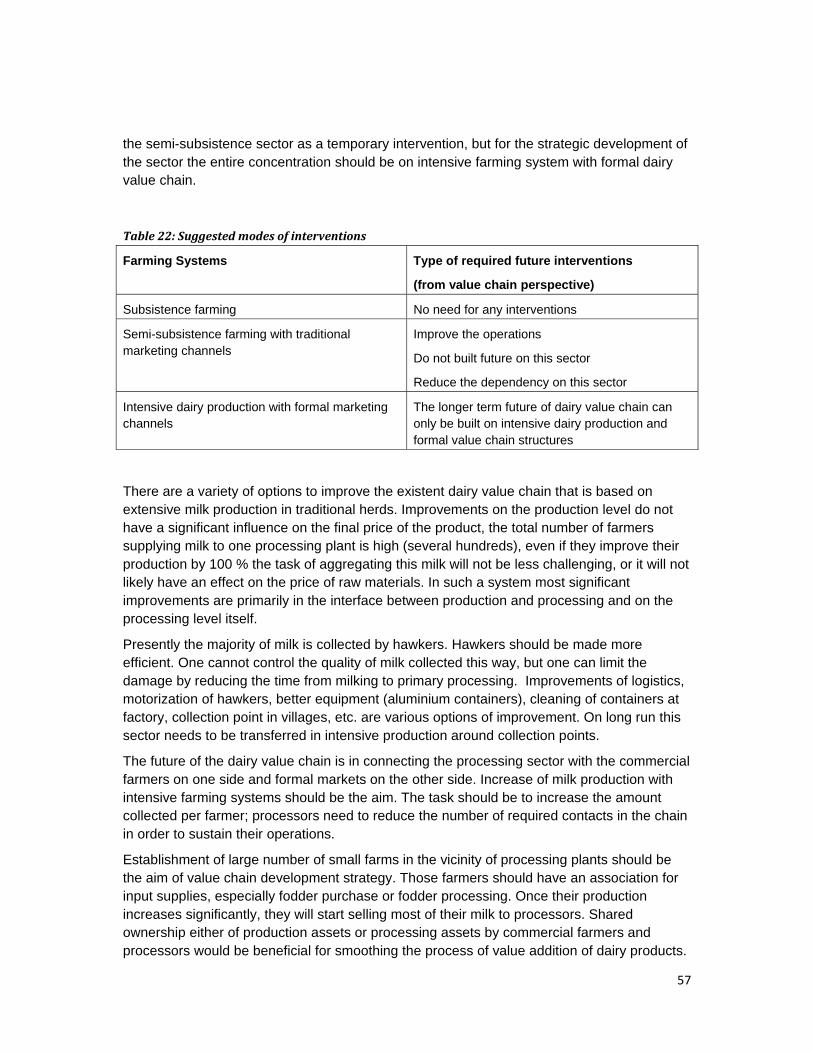
57
the semi-subsistence sector as a temporary intervention, but for the strategic development of the sector the entire concentration should be on intensive farming system with formal dairy value chain.
Table 22: Suggested modes of interventions
Farming Systems Type of required future interventions
(from value chain perspective)
Subsistence farming No need for any interventions
Semi-subsistence farming with traditional marketing channels
Improve the operations
Do not built future on this sector
Reduce the dependency on this sector
Intensive dairy production with formal marketing channels
The longer term future of dairy value chain can only be built on intensive dairy production and formal value chain structures
There are a variety of options to improve the existent dairy value chain that is based on extensive milk production in traditional herds. Improvements on the production level do not have a significant influence on the final price of the product, the total number of farmers supplying milk to one processing plant is high (several hundreds), even if they improve their production by 100 % the task of aggregating this milk will not be less challenging, or it will not likely have an effect on the price of raw materials. In such a system most significant improvements are primarily in the interface between production and processing and on the processing level itself.
Presently the majority of milk is collected by hawkers. Hawkers should be made more efficient. One cannot control the quality of milk collected this way, but one can limit the damage by reducing the time from milking to primary processing. Improvements of logistics, motorization of hawkers, better equipment (aluminium containers), cleaning of containers at factory, collection point in villages, etc. are various options of improvement. On long run this sector needs to be transferred in intensive production around collection points.
The future of the dairy value chain is in connecting the processing sector with the commercial farmers on one side and formal markets on the other side. Increase of milk production with intensive farming systems should be the aim. The task should be to increase the amount collected per farmer; processors need to reduce the number of required contacts in the chain in order to sustain their operations.
Establishment of large number of small farms in the vicinity of processing plants should be the aim of value chain development strategy. Those farmers should have an association for input supplies, especially fodder purchase or fodder processing. Once their production increases significantly, they will start selling most of their milk to processors. Shared ownership either of production assets or processing assets by commercial farmers and processors would be beneficial for smoothing the process of value addition of dairy products.
58
In the following upgrading suggestions for value chain development are listed for consideration. Last chapter provides the selection of the most urgent interventions.
5.1 General upgrading suggestions
5.2.1 Sector Development Strategy
If the sector is to survive against regional competition a clear development strategy needs to be worked out. Unless all actors and stakeholders have a common understanding on what needs to be achieved and who is responsible to carry out which activity of the strategy, one cannot solve problems in a targeted way.
There needs to be ownership for the sector development strategy; this can only be achieved through a series of coordinated forum meetings, where a common understanding of sector’s status quo is worked out, and subsequently a priority list of interventions is developed. Tanzania Dairy Board has a Corporate Strategic Plan (2007-2012) which could provide a valuable foundation for the development of the strategy, however, in the process of elaboration of the final strategy participation of all actors and stakeholders is crucial, therefore such documents can only provide a template for forum discussions.
It needs to be absolutely clear what is the long term goal of the sector, what is the strategy of achieving this goal, and what are the responsibilities of all actors and stakeholders towards that goal.
The aims of the strategy could be: (further aims need to be defined in actors and stakeholders meetings)
− Increase of milk production, promoting intensive dairy production − Increase of the amount collected from traditional farmers (temporary aim) − Increase the speed of milk collection − Processing plants should produce more valuable dairy products
5.2.2 Regular actors and stakeholders meetings
Coordination of the sector and trust level within the sector will improve once stakeholders and actors meet regularly. Regular actors and stakeholders meetings should be an essential component of any value chain related development program. Such meetings are important for the following reasons:
− Exchange of information, networking − Update of the status of achievements of the development strategy, adaptation of the
strategy to new developments; − Sharing of knowledge, skill, expertise and experiences helps in improving the
effectiveness and efficiency; − The program visibility can be increased; − Technology transfer, share and dissemination can be facilitated within the networked
organization; − Co-financing links can be established;
59
− Duplication of funding can be avoided and can be used in a better managed and meaningful way
Such meetings should be organized by actors of the value chain or by supporting agencies; Government bodies should participate in such gatherings but should not play a predominant role.
5.2.3 Web site for information exchange, improvement of transparency in the chain
The aim of the web site is to provide a platform for information and experience exchange of dairy value chain actors and stakeholders in Tanzania. This platform intends to link the existing initiatives in the chain and all the practitioners into a network. Actors and stakeholders should interact towards the aim of continuous improvement of the dairy value chain. The web site should be understood as “work in progress”, which continuously requires hands-on inputs of its users, thus also creating ownership on their side. The page has to be highly interactive.
The web site should be designed to supplement the existing information on the web with practical application data and experience sharing, thus providing assistance to value chain practitioners helping them developing specific approaches for their sphere of influence.
The website should be managed by a body assigned to do it by value chain actors, no government institution should be the owner of the page, but they can support the initiative.
It needs to provide information on prices, innovations, technologies, reports, trainings courses, etc. Some crucial information can even be circulated via sms. Users should sign up for this and pay a users fee.
5.2 Functional Upgrading
5.2.1 Close cooperation with macrolevel stakeholders (advocacy, policy, regulations)
Various policies are under considerations which require exchange of information between value chain actors and stakeholders on the macro level. For example the regulatory bodies are in existence but their responsibilities are partially overlapping. It is crucial that the Government institutions and the activities they carry out or laws and regulations they introduce are not perceived as harmful to the interests of value chain actors. To achieve this regular meetings are required in order to understand the standpoints of both sides and agree on required changes in the value chain which are in the benefit of both sides.
The role of the Government as an enabler of value chain development strategies can be crucial, but it needs to mirror the perspective of chain participants, which can only be incorporated through established and regular networking forums.
Dialog between value chain actors and value chain enablers at macro level will help to
60
develop policies and regulations which are conducive to the development of the chain. The present breakdown of information exchange and low level of trust needs to be improved.For example TFDA’s regulatory intervention is perceived as punishment by some processors, as TFDA cannot control the informal sector, which covers of 97 % of produced milk in the country.
5.2.2 Public Private Partnerships
PPPs are an effective tool to leverage public or project funds. There needs to be a strategy for attracting investors in the sector, and there needs to be clarity which benefits an investor can expect from the public contribution.
Readymade proposals for PPP need to be worked out in order to attract those organisations which are interested in investing into the sector. Additionally, a proactive marketing of those proposals can be carried out in order to attract potential investors into the sector.
5.2.3 Development of new management models (franchising)
In transformation economies entrepreneurs often do not have clear long-term business plans, they exploit the upcoming business possibilities in a flexible manner but do not really develop entrepreneurial abilities in a more structural and strategic way.
Franchising provides a proven business model and also assists franchisees in setting up and running the business. Franchising is a method for risk sharing. The franchisees have an independent business for themselves but they are not left alone. They acquire a whole support package, which significantly reduces their risks.
In business environments where transaction costs are high, customers are oriented towards low price products, value chain is full of mistrust, professional qualifications are low or inadequate, products and services are of low quality, and the administrative structures are unclear franchising is a suitable business model, as it:
− Builds on a proven business model − Provides a comprehensive assistance package in starting and running a business − Has strict control measures − Is an efficient method for risk sharing
Franchising addresses the weaknesses of business environment by orderly setting up the business, it:
− Is clearly defined and is transparent in all of its operations. − Is affordable for small-scale entrepreneurs − Produces products of the same quality. − reduces the vulnerability to the effects of mistrust in relationships − significantly reduces the transaction costs − improves the functionality of value chains − professional and managerial qualifications are improved, without involving staff in
long-term official programmes
61
− provides an umbrella for dealing with support agencies and administration
The idea of rigid management of operations needs to be developed as a tool for implementation on production as well as processing level of the value chain. Small and manageable models for companies on farm level as well as in processing should be developed. People interested in investing funds do not have to invent their business idea, but just buy into the ready made idea. There needs to be a central training facility for franchisees. Input supplies and purchase of end products of such enterprises needs to be streamlined. The entire operations need to be under severe supervision.
5.3 Process Upgrading
5.3.1 Streamlining of raw material exchange processes
Collection of milk as raw material for processing is huge challenge for dairy processors. In some milk producing areas several litres of milk are collected daily from each farmer, but most processors collect just about one litre of milk per farmer per day. Such a system requires a huge logistical effort to function. Besides being not effective and not efficient and not having even the perspective to become competitive by regional standards, the quality in such systems is simply not controllable. One can just ensure the minimum quality requirements, but one will never be able to produce high quality products. However much the system of milk collection from semi-subsistence farmers will be improved, it will remain a system which needs not an overhaul but which needs simply to be abandoned as soon as possible.
The main aim of processors should be to increase the amount of milk collected daily from commercial farms. The average number of litres per farmer needs to increase significantly; this can only be achieved in a more commercial orientation of production. However, before this level is achieved, the present semi-subsistence farming system needs to be improved in order to be eventually abandoned.
There are several excellent examples how processors managed to set up a successful systems of milk collection with a large number of farmers. Such examples need to be studied and replicated in adjusted form for the specific circumstances. Experience from different actors needs to be evaluated and a model needs to be developed how to manage best the process of milk collection.
5.3.2 Introduction of energy saving measures
Milk processing is an energy intensive process. Energy saving measures are not only crucial to reduce costs of processing, but also from the perspective of potential losses of produce or decrease of quality of end products. Electricity costs can easily amount to 10-20 % of variable costs of production. Unreliable electricity can lead to total losses of raw materials, or to decrease of quality such as reduction of shelf live.
Any measures which lead to more reliable supply of energy at a lower cost should be analysed and implemented. The following suggestions can be taken up as initial interventions
62
towards achieving this goal:
− Solar water heaters in processing plants. Simple water heaters can be easily manufactured locally. Any contribution through solar heaters will reduce the amount of required firewood. If properly planned, solar heaters can become the sole source of warm water
− Biogas coolers in collection centres. SNV has some experience with milk cooling facilities based on biogas. This experience needs to be analysed and implemented where appropriate. Thus, collection centres can be set up in areas far away from the electricity grid.
− For bridging short term power cuts generators can be the right equipment, but they need to be of appropriate size, which is surprisingly a big problem in the praxis. Generators are available, but they are too big and too expensive to be utilized.
− There needs to be a forum for exchange of information of energy saving technologies.
5.3.3 Improvement of dairy stock (not in traditional herds)
In subsistence farming systems risk minimization is the main motivation and not maximization of profit. In such systems improvement of animal stocks towards higher milk production levels is only acceptable if it is not on expense of the existent security. This however is not possible. Better performing animals are always demanding towards feeds, medicine, care, etc. With improved animals risks increase, this is mostly not in the interest of farmers.
In semi-subsistence farming systems the balance between risk minimization and profit maximization is shifting towards profits. Here several programme exist to improve the existent stocks, they however do not have a long-term strategy for improvement of animals, but just partial and time bound improvement. Mostly the improvement measures are already in the design of the programme not of sustainable nature. For example, a farmer who gets a mixed breed of heifer with even a better breed of calf will have improved milk production as long as the cow is alive and the farmer manages to keep the cow according to the requirements. Artificial insemination service to gradually improve the herd is close to not existent, mostly local bulls are utilized. All further calves are again degraded. The cow is improved but the step forward to improve the herd can not happen, as all the required services to achieve this improvement are not in place.
Despite several supporting agencies working in the field of improvement of animal stocks for many years the achievements have been low.
In order to really improve the stocks one needs to have a clear breeding strategy which should be followed strictly over decades. Present breeding efforts resemble good social initiative and not breeding programmes.
Dairy industry everywhere in the world is an intensive venture; successful dairy production cannot be extensive. There are various ways of running dairy value chains, there can be dual purpose animals or single purpose animals, various keeping systems (zero-grazing, grazing,
63
etc) but they all have one thing in common, they are always very intensive.
The way present Tanzania dairy value chain is designed, collecting whatever is available not really knowing from whom, each cow producing the lowest possible amount, etc. has no future. One needs to find ways of intensifying the sector. It is suggested to increase the amount of processed milk coming from commercial farms. Improvement of stocks initiative should concentrate on intensive enterprises, where singly purpose high breeds of dairy cattle are introduced.
5.3.4 Skill development scholarships / excellence centres
Respondents clearly expressed that the available skills are not sufficient as compared to the requirements of the value chain. One needs to invest into education of value chain actors and constantly upgrade their level of knowledge if the products of the chain are to be competitive in the long run. To achieve this targeted personnel development on all levels of the chain needs to be established:
− Formal courses on e.g. dairy technologies should be part of curricula of universities or technical colleges.
− Short-term training courses on specific subjects, e.g. cheese making, animal feeds, etc
Introduction of the franchising model can also be a solution as in any franchising model targeted training is precondition of success of the enterprise.
5.3.5 Accounting systems at enterprise level
Most of the interviewed enterprises had accounting systems which were not designed to establish transparency on the cost structure of the firm. Not knowing the costs means that cost saving interventions cannot be carried out. As the chain develops, margins will significantly decrease and the importance of the efficiency along the chain will increasingly become more important. The precondition of any rationalization measure is detailed knowledge of costs and the options of its reduction. To achieve this introduction of an improved accounting system will be absolutely necessary.
5.3.6 Value chain finance
Inflow of financial resources will be required for most value chain development interventions, the following can be suggested:
− Once a clear strategy for development of a specific value chain exists, the probability of finding resources to implement or support such a strategy will be high. Good ideas can easily find support within the development aid community, especially in sectors which are crucial for the development of Tanzanian economy, such as dairy production.
− Financial services need to be analysed and the most appropriate products made
64
available to value chain participants. Possible adjustments of existent financial products or even new products might be developed.
− Provision of financial resources or in kind services through horizontal cooperation needs to be exploited more. Such cooperation can be the formation of a cooperative; there are various types of cooperatives already available in the country, one need to investigate which form is the most appropriate for the purpose of promoting sunflower production.
− Provision of financial resources or in kind services through vertical cooperation. Traders or processors can provide financial or in-kind resources to producers in order to secure their supply with high quality tradable products or raw materials for processing.
5.4 Product Upgrading
Product upgrading interventions are not the most urgent innovations to be implemented. Presently the market absorbs almost any product which is produced. None of the respondents complained generally about the market, just about marketing channels. Nevertheless, product upgrading will be needed, as the produce in its present state is not suitable to capture larger market shares.
5.4.1 Specific products for specific market segments
Consumers have different tastes and different requirements; the market needs to be segmented. Specific products need to be developed for specific market segments, thus increasing the market for processed milk products. To achieve this, the following needs to be carried out:
− Make a market study of consumer preferences − Segmentation of the market − Develop a marketing strategy for specific segments
5.4.2 Improvement of core products
Presently there is no reliable control mechanism to ensure a predictable quality of dairy products in consumer outlets. The official control mechanisms are valuable but they still leave loop holes. Industry internal control combined with branding seems to be the best way to ensure quality standards. Brands will have to control the quality if they do not want to lose customers. In order to achieve this, the following minimum requirements need to be safeguarded:
− Faster collection (time from cow to pasteurization needs to be short) − Strict control measures on quality aspect during collection − Processing technology needs to be fully functional
65
5.4.3 Improvement of packaging, labelling, brand name, quality assurance, etc.
The list of possible improvement options of packaging, labelling, and marketing brands is long. There is a definite need for intervention in this field. However, if there is no defined marketing strategy in order to capture larger market shares with tailor-made products along consumer demand, improvement in this field will not be really necessary as long as market is not a real problem issue.
5.5 Channel Upgrading
5.5.1 Deviating the chain towards high value products
Processors in remote locations should concentrate on “removing water” and making high value products out of it, such as ghee, cheese, butter, etc.
5.5.2 Targeting urban consumers for high value dairy products
Urban consumers constitute the small niche of consumers with the highest purchasing power. They can become the entry point for introduction of quality products into the market, which are then expanded for broader market segments.
Concentration on urban consumers would also lead to a formation of more structured trading procedures, with distributors, wholesalers and retailers. The density of consumers in urban settings is high, thus justifying a more structural approach.
5.5.3 Institutional marketing (HRI)
At present status of product development marketing to institutions is likely to be the right outlet for mass marketing. Institutions do not require high standards of labelling or product packaging. Their requirements are more towards regularity of delivery and pricing, criteria which can easily be fulfilled by the processors on the present level of development.
One needs to develop a strategy how to better supply dairy products to institutional buyers, bulk can be sold there, which can reduce the processing costs per unit.
5.6 Most urgent Interventions
By far the most urgent intervention is the elaboration of a “Sector Development Strategy”. The challenges are significant; they can only be faced effectively by a joint approach of all actors and stakeholders of the value chain. The present situation where a large number of institutions are pursuing different aims cannot lead to significant improvement s of the value chain. Not only harmonization of the existent efforts is required, but more so questioning of the present strategies and defining a new unified strategy.
Development of the sector will require significant financial inflow of whichever kind, PPP, FDI, or local investment. Financial inflows can only be attracted if the sector development strategy
66
is clear and the perspectives of profit generation are predictable. In order to achieve this new predefined management models (franchising) need to be developed, both on production as well as on processing level of the value chain.
Beside the above-mentioned more long-term oriented upgrading interventions, following improvements of the present situation can be implemented, which are described in detailed manner further above in the text:
− Streamlining of raw material exchange processes − Introduction of energy saving measures − Improvement of dairy stock (not in traditional herds) − Skill development – scholarships / excellence centres − Accounting systems at enterprise level
Transformational changes of the value chain will only be achieved if there is a long-term strategic plan for conversion from traditionally based farming system towards a more commercial farming system which is connected to processing industry. Other upgrading options, not focussed on this transformation are beneficial for value chain actors but are not of transformational nature, they provide only gradual and often temporary improvement.