Daily Fixed-Income Insights - MSCI
23
March 24, 2022 (market close) © 2022 MSCI Inc. All rights reserved. Please refer to the disclaimer at the end of this document. Daily Fixed-Income Insights
Transcript of Daily Fixed-Income Insights - MSCI

March 24, 2022 (market close)
© 2022 MSCI Inc. All rights reserved. Please refer to the disclaimer at the end of this document.
Daily Fixed-IncomeInsights

Daily Trends in Yields, Equity Returns, FX
ThuMar 10
Fri Mon Tue Wed ThuMar 17
Fri Mon Tue Wed ThuMar 24
-8.0-6.0-4.0-2.00.02.04.06.08.0Cumulative MSCI Equity Return in USD (%)
USA World ex USA Emerging Markets
ThuMar 10
Fri Mon Tue Wed ThuMar 17
Fri Mon Tue Wed ThuMar 24
-505
1015202530354010-Yr Government Yield: Cumulative Change (bps)
*See Appendix for data sources
US Germany UK Japan
ThuMar 10
Fri Mon Tue Wed ThuMar 17
Fri Mon Tue Wed ThuMar 24
99.00
100.00
101.00
102.00
103.00
104.00
105.00
106.00Strength of USD
vs EUR vs GBP vs JPY vs CNY
−1.50
−1.00
−0.50
0.00
0.50
1.00
1.50
2.00
2.50Equity Return (%)
Nominal Yield MSCI USA
ThuMar 10
Fri Mon Tue Wed ThuMar 17
Fri Mon Tue Wed ThuMar 24
1.96
2.02
2.07
2.13
2.18
2.24
2.29
2.34
2.4010-Yr US Government Yield (%)
2
Monthly Trends in Yields, Equity Returns, FX
Aug2021
Sep Oct Nov Dec Jan Feb Mar*-20.0
-15.0
-10.0
-5.0
0.0
5.0
10.0Cumulative MSCI Equity Return in USD (%)
USA World ex USA Emerging Markets
Aug2021
Sep Oct Nov Dec Jan Feb Mar*-15
0153045607590
10512010-Yr Government Yield: Cumulative Change (bps)
*As of March 24**See Appendix for data sources
US Germany UK Japan
Aug2021
Sep Oct Nov Dec Jan Feb Mar*96.0098.00
100.00102.00104.00106.00108.00110.00112.00Strength of USD
vs EUR vs GBP vs JPY vs CNY
−6.00
−4.00
−2.00
0.00
2.00
4.00
6.00
8.00Equity Return (%)
Nominal Yield MSCI USA
Aug2021
Sep Oct Nov Dec Jan Feb Mar*1.12
1.31
1.50
1.69
1.88
2.07
2.26
2.4510-Yr US Government Yield (%)
3

Government Nominal Yield Curves
1 3 5 7 10 15 20 30Maturity (years)
-1.00-0.500.000.501.001.502.002.503.00US Government Yield Curve (%)
24-Mar 2022 30-Sep 2021 31-Mar 2021
1 3 5 7 10 15 20 30Maturity (years)
-1.00-0.500.000.501.001.502.002.503.00Germany Government Yield Curve (%)
24-Mar 2022 30-Sep 2021 31-Mar 2021
1 3 5 7 10 15 20 30Maturity (years)
-1.00-0.500.000.501.001.502.002.503.00UK Government Yield Curve (%)
*See Appendix for data sources
24-Mar 2022 30-Sep 2021 31-Mar 2021
1 3 5 7 10 15 20 30Maturity (years)
-1.00-0.500.000.501.001.502.002.503.00Japan Government Yield Curve (%)
24-Mar 2022 30-Sep 2021 31-Mar 2021
4

Daily & Monthly US Corporate Spreads vs Equities
ThuMar 10
Fri Mon Tue Wed ThuMar 17
Fri Mon Tue Wed ThuMar 24
-15
-10
-5
0
5
1010-Yr Corporate OAS: Cumulative Change (bps)
*As of March 24**See Appendix for data sources
BBB A AA
Aug2021
Sep Oct Nov Dec Jan Feb Mar*-20-10
01020304050607010-Yr Corporate OAS: Cumulative Change (bps)
BBB A AA
−2.00
−1.00
0.00
1.00
2.00
3.00Equity Return (%)
Option Adjusted Spread MSCI USA
−6.00
−4.00
−2.00
0.00
2.00
4.00
6.00
8.00Equity Return (%)
Option Adjusted Spread MSCI USA
ThuMar 10
Fri Mon Tue Wed ThuMar 17
Fri Mon Tue Wed ThuMar 24
182
186
191
195
199
20410-Yr BBB OAS (bps)
Aug2021
Sep Oct Nov Dec Jan Feb Mar*120
133
145
158
170
183
195
20810-Yr BBB OAS (bps)
5

Euro Corporate and Sovereign Spreads vs Equities
Aug2021
Sep Oct Nov Dec Jan Feb Mar**-10
0102030405060708010-Yr Corporate OAS: Cumulative Change (bps)
**As of March 24***See Appendix for data sources
BBB A AA
Aug2021
Sep Oct Nov Dec Jan Feb Mar**-10
01020304050607010-Yr Sovereign OAS: Cumulative Change (bps)
Italy France Spain
−6.00
−4.00
−2.00
0.00
2.00
4.00
6.00
8.00Equity Return (%)*
Option Adjusted Spread MSCI Europe
−6.00
−4.00
−2.00
0.00
2.00
4.00
6.00
8.00Equity Return (%)*
Italy France Spain MSCI Europe
Aug2021
Sep Oct Nov Dec Jan Feb Mar**107
120
133
146
159
173
186
19910-Yr BBB OAS (bps)*
*Option Adjusted Spread in basis points to German government curve.Equity return expressed in USD
Aug2021
Sep Oct Nov Dec Jan Feb Mar**22
45
68
91
113
136
159
18210-Yr Sovereign OAS (bps)*
*Option Adjusted Spread in basis points to German government curve.Equity return expressed in USD
6

Spread Term Structure: BBB Corporates & Sovereigns
1 3 5 7 10 15 20 30Maturity (years)
0
50
100
150
200
250US BBB OAS (bps)
24-Mar 2022 30-Sep 2021 31-Mar 2021
1 3 5 7 10 15 20 30Maturity (years)
0
50
100
150
200
250Euro BBB OAS (bps)*
*Spread to German government curve
24-Mar 2022 30-Sep 2021 31-Mar 2021
1 3 5 7 10 15 20 30Maturity (years)
0
50
100
150
200
250Euro Sovereign OAS (bps)*
*Spread to German government curve as of March 24**See Appendix for data sources
Italy Spain France
1 3 5 7 10 15 20 30Maturity (years)
0
50
100
150
200
250Italy Sovereign OAS (bps)*
*Spread to German government curve
24-Mar 2022 30-Sep 2021 31-Mar 2021
7

Trends in Government Yields and Actual Inflation
Apr2018
Jan'19
Jul'19
Jan'20
Jul'20
Jan'21
Jul'21
Jan'22
-2.00-1.000.001.002.003.004.005.006.0010-Yr Government Nominal Yields (%)
US Germany UK Japan
Apr2018
Jan'19
Jul'19
Jan'20
Jul'20
Jan'21
Jul'21
Jan'22
-2.00-1.000.001.002.003.004.005.006.00Realized Inflation (12-Month, in %)
*US: PCE ex food/energy; Eurozone: HICP ex food/energy/alcohol/tobaccoUK: CPIH ex food/energy/alcohol/tobacco; Japan: CPI ex food/energy
PolicyTarget
US Eurozone UK Japan
Apr2018
Jan'19
Jul'19
Jan'20
Jul'20
Jan'21
Jul'21
Jan'22
-2.00-1.000.001.002.003.004.005.006.0010-Yr Government Breakeven Inflation Yields (%)
*UK breakeven inflation and real yields are adjusted to reflect historical differences between the Retail Price Index (RPI) and the Consumer Price Index (CPI)**See Appendix for data sources
US Germany UK* Japan
Apr2018
Jan'19
Jul'19
Jan'20
Jul'20
Jan'21
Jul'21
Jan'22
-3.00
-2.00
-1.00
0.00
1.00
2.0010-Yr Government Real Yields (%)
US Germany UK* Japan
8

Spreads on Corporates & Euro / EM Sovereigns
Apr2018
Jan'19
Jul'19
Jan'20
Jul'20
Jan'21
Jul'21
Jan'22
050
10015020025030035040010-Yr US Corporate OAS (bps)
BBB A AA
Apr2018
Jan'19
Jul'19
Jan'20
Jul'20
Jan'21
Jul'21
Jan'22
050
10015020025030035040010-Yr Euro Sovereign OAS (bps)*
*Spread to German government curve
Italy France Spain
Apr2018
Jan'19
Jul'19
Jan'20
Jul'20
Jan'21
Jul'21
Jan'22
050
10015020025030035040010-Yr Euro OAS (bps)*
*Spread to German government curve**See Appendix for data sources
BBB A AA
Apr2018
Jan'19
Jul'19
Jan'20
Jul'20
Jan'21
Jul'21
Jan'22
10020030040050060070080090010-Yr Emerging Markets Sovereign OAS (bps)*
*Spread to US Treasury curve
Mexico Brazil Turkey Indonesia
9

Inflation: US Market Implied (BEI) and Actual CPI / PCE
1 3 5 7 10 15 20 30Maturity (years)
-4.00
-2.00
0.00
2.00
4.00
6.00
8.00US Government Breakeven Inflation Yield Curve (%)
24-Mar 2022 30-Sep 2021 31-Mar 2021
Apr2018
Jan'19
Jul'19
Jan'20
Jul'20
Jan'21
Jul'21
Jan'22
-4.00
-2.00
0.00
2.00
4.00
6.00
8.00US CPI vs Breakeven Inflation Yields (%)
*CPI ex food/energy inflation (yoy) 6.4% as of Feb 2022
CPI ex food/energy 2-yr 5-yr 10-yr
Apr2018
Jan'19
Jul'19
Jan'20
Jul'20
Jan'21
Jul'21
Jan'22
-4.00
-2.00
0.00
2.00
4.00
6.00
8.00US CPI (%)
*CPI all items inflation (yoy) 7.9% as of Feb 2022**See Appendix for data sources
CPI all items CPI ex food/energy
Apr2018
Jan'19
Jul'19
Jan'20
Jul'20
Jan'21
Jul'21
Jan'22
-4.00
-2.00
0.00
2.00
4.00
6.00
8.00US Inflation: CPI vs PCE (%)
*PCE ex food/energy inflation (yoy) 5.2% as of Jan 2022
PCE ex food/energy CPI ex food/energy
10

US Govt Yield Drilldown: Nominal, Real and BEI
ThuMar 10
Fri Mon Tue Wed ThuMar 17
Fri Mon Tue Wed ThuMar 24
-1.00-0.500.000.501.001.502.002.503.0010-Yr US Government Yields (%)
US Nominal US BEI US Real
Aug2021
Sep'21
Oct'21
Nov'21
Dec'21
Jan'22
Feb'22
Mar'22
-1.50-1.00-0.500.000.501.001.502.002.503.0010-Yr US Government Yields (%)
US Nominal US BEI US Real
ThuMar 10
Fri Mon Tue Wed ThuMar 17
Fri Mon Tue Wed ThuMar 24
-20
-10
0
10
20
30
4010-Yr Yields: Cumulative Change (bps)
*See Appendix for data sources
US Nominal US BEI US Real
Aug2021
Sep'21
Oct'21
Nov'21
Dec'21
Jan'22
Feb'22
Mar'22
-150
153045607590
10512010-Yr Yields: Cumulative Change (bps)
US Nominal US BEI US Real
11

China Government Bond Drilldown
1 3 5 7 10 15 20 30Maturity (years)
2.002.252.502.753.003.253.503.754.00China Sovereign (CNY) Yield Curve (%)
24-Mar 2022 30-Sep 2021 31-Mar 2021
Apr2018
Jan'19
Jul'19
Jan'20
Jul'20
Jan'21
Jul'21
Jan'22
0.000.501.001.502.002.503.003.504.004.5010-Yr Yields (%)
***See Appendix for data sources
China Sovereign (CNY)
US Treasury (USD)
US AA Corporate (USD)
China Sovereign (USD)
Apr2018
Jan'19
Jul'19
Jan'20
Jul'20
Jan'21
Jul'21
Jan'22
-1.000.001.002.003.004.005.006.007.008.00Realized Inflation (%)**
**China inflation (yoy) 0.9% as of Feb 2022Inflation measured by All Items CPI includes food and energy prices
China US
−8.00
−6.00
−4.00
−2.00
0.00
2.00
4.00Equity Return (%)*
Yield (CNY) MSCI China
Aug2021
Sep Oct Nov Dec Jan Feb Mar*2.89
2.97
3.04
3.11
3.18
3.26
3.3310-Yr China Sovereign Yield (%)
*As of March 24. Equity return in USD
12
Long-Run Trends in Yields and Inflation
Jun1997
Jan'01
Jan'04
Jan'07
Jan'10
Jan'13
Jan'16
Jan'19
Jan'22
-1.000.001.002.003.004.005.006.007.008.0010-Yr Government Nominal Yields (%)
US Germany UK Japan
Jun1997
Jan'01
Jan'04
Jan'07
Jan'10
Jan'13
Jan'16
Jan'19
Jan'22
-2.00-1.000.001.002.003.004.005.006.00Realized Inflation (12-Month, in %)
*US: PCE ex food/energy; Eurozone: HICP ex food/energy/alcohol/tobaccoUK: CPIH ex food/energy/alcohol/tobacco; Japan: CPI ex food/energy
US Eurozone UK Japan
Jun1997
Jan'01
Jan'04
Jan'07
Jan'10
Jan'13
Jan'16
Jan'19
Jan'22
-3.00-2.00-1.000.001.002.003.004.005.0010-Yr Government Breakeven Inflation Yields (%)
*UK breakeven inflation and real yields are adjusted to reflect historical differences between the Retail Price Index (RPI) and the Consumer Price Index (CPI)**See Appendix for data sources
US Germany UK* Japan
Jun1997
Jan'01
Jan'04
Jan'07
Jan'10
Jan'13
Jan'16
Jan'19
Jan'22
-3.00-2.00-1.000.001.002.003.004.005.0010-Yr Government Real Yields (%)
US Germany UK* Japan
13
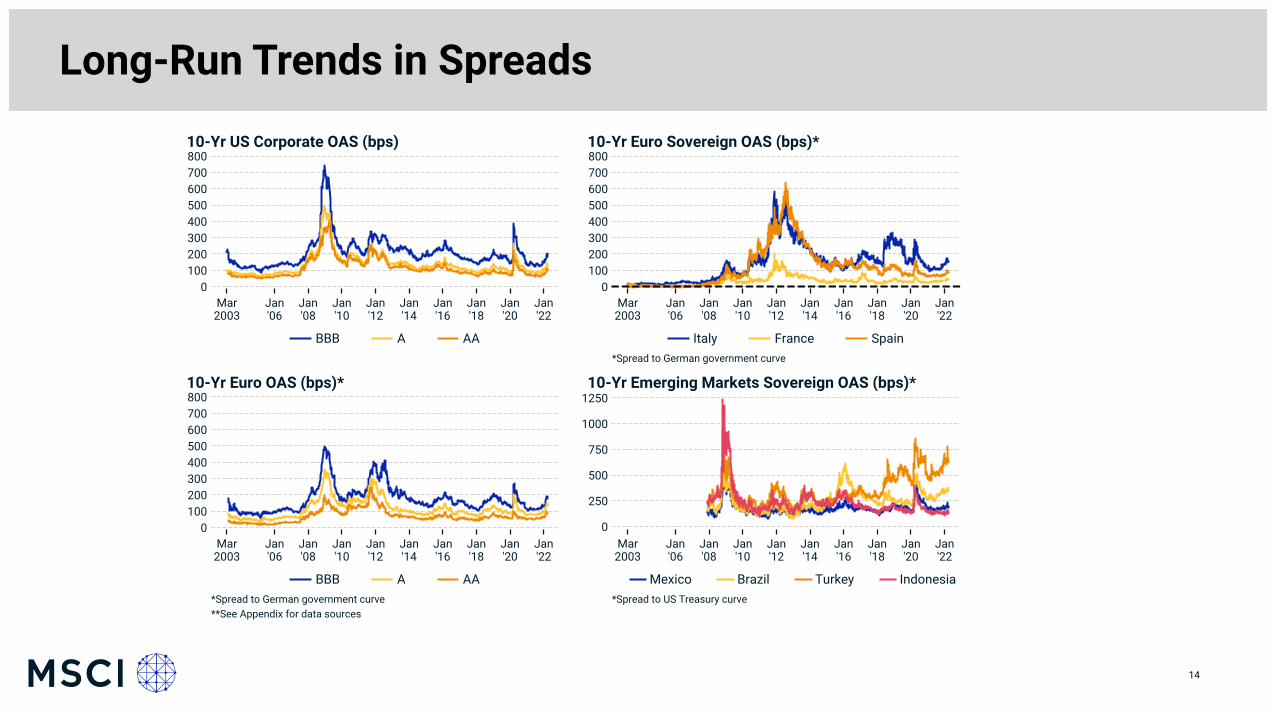
Long-Run Trends in Spreads
Mar2003
Jan'06
Jan'08
Jan'10
Jan'12
Jan'14
Jan'16
Jan'18
Jan'20
Jan'22
010020030040050060070080010-Yr US Corporate OAS (bps)
BBB A AA
Mar2003
Jan'06
Jan'08
Jan'10
Jan'12
Jan'14
Jan'16
Jan'18
Jan'20
Jan'22
010020030040050060070080010-Yr Euro Sovereign OAS (bps)*
*Spread to German government curve
Italy France Spain
Mar2003
Jan'06
Jan'08
Jan'10
Jan'12
Jan'14
Jan'16
Jan'18
Jan'20
Jan'22
010020030040050060070080010-Yr Euro OAS (bps)*
*Spread to German government curve**See Appendix for data sources
BBB A AA
Mar2003
Jan'06
Jan'08
Jan'10
Jan'12
Jan'14
Jan'16
Jan'18
Jan'20
Jan'22
0
250
500
750
1000
125010-Yr Emerging Markets Sovereign OAS (bps)*
*Spread to US Treasury curve
Mexico Brazil Turkey Indonesia
14

Trends in Yield and Return Volatilities
Jan2000
Jan'04
Jan'07
Jan'10
Jan'13
Jan'16
Jan'19
Jan'22
0
50
100
150
20010-Yr Government Nominal Yield Volatility (bps)*
US Germany UK Japan
1 3 5 7 10 15 20 30Maturity (years)
0
50
100
150
200US Nominal Yield Volatility Curve (bps)*
18-Mar 2022 24-Sep 2021 26-Mar 2021
Jan2000
Jan'04
Jan'07
Jan'10
Jan'13
Jan'16
Jan'19
Jan'22
0
50
100
150
20010-Yr US Yield Volatility (bps)*
*Realized volatility using exponential time decay with half life of 18-weeks**See Appendix for data sources
Nominal BEI Real
Jan2000
Jan'04
Jan'07
Jan'10
Jan'13
Jan'16
Jan'19
Jan'22
0
10
20
30
40
50
60Equity and 10-Yr US Government Return Volatility (%)*
US 10-Yr NominalMSCI USA
MSCI World ex USAMSCI Emerging Markets
15

Trends in Correlations and Yield Curve Slope
Jan2000
Jan'04
Jan'07
Jan'10
Jan'13
Jan'16
Jan'19
Jan'22
-0.75
-0.50
-0.25
0.00
0.25
0.50
0.75
1.00Return Correlations: Equities & 10-Yr US Government*
10-Yr Nominal vs: MSCI USAMSCI Emerging Markets
MSCI World ex USA
Jan2000
Jan'04
Jan'07
Jan'10
Jan'13
Jan'16
Jan'19
Jan'22
-0.75
-0.50
-0.25
0.00
0.25
0.50
0.75
1.00Return Correlations: US Equity & 10-Yr US Real, BEI*
MSCI USA vs: 10-Yr Government BEI10-Yr Government Real
Jan2000
Jan'04
Jan'07
Jan'10
Jan'13
Jan'16
Jan'19
Jan'22
-0.75
-0.50
-0.25
0.00
0.25
0.50
0.75
1.00Yield Correlations: 10-Yr US Government*
*Realized correlation using exponential time decay with half life of 2-years**See Appendix for data sources
10-Yr Nominal vs: 10-Yr BEI 10-Yr Real
Jan2000
Jan'04
Jan'07
Jan'10
Jan'13
Jan'16
Jan'19
Jan'22
-200
-100
0
100
200
300
400
500Yield Curve Slope: 10-Yr less 3-Month (bps)
US Germany UK Japan
16

FX Trends
Apr2018
Jan'19
Jul'19
Jan'20
Jul'20
Jan'21
Jul'21
Jan'22
95
100
105
110
115
120
125Strength of US Dollar
vs EUR vs GBP vs JPY vs CNY
Apr2018
Jan'19
Jul'19
Jan'20
Jul'20
Jan'21
Jul'21
Jan'22
90100110120130140150160170180Strength of US Dollar
vs MXN vs BRL vs CAD vs KRW
0 1 2 3 4 5Maturity (years)
85
90
95
100
105FX Forward Curve: Strength of US Dollar*
*As of March 24
***See Appendix for data sources
vs EUR vs GBP vs JPY
Apr2018
Jan'19
Jul'19
Jan'20
Jul'20
Jan'21
Jul'21
Jan'22
0
5
10
15FX Volatility (%)**
**Realized volatility using exponential time decay with half life of 18-weeks
USD/EUR USD/GBP USD/JPY USD/CNY
17

GDP
2020 2021 Q22021
Q3'21
Q4*'21
-10.0
-5.0
0.0
5.0
10.0US GDP (%)
*Most recent quarterly GDP: 1.7
2020 2021 Q22021
Q3'21
Q4*'21
-10.0
-5.0
0.0
5.0
10.0Eurozone GDP (%)
*Most recent quarterly GDP: 0.3
2020 2021 Q22021
Q3'21
Q4*'21
-10.0
-5.0
0.0
5.0
10.0China GDP (%)
*Most recent quarterly GDP: 1.6
2020 2021 Q22021
Q3'21
Q4*'21
-10.0
-5.0
0.0
5.0
10.0Japan GDP (%)
*Most recent quarterly GDP: 1.1
**See Appendix for data sources
2020 2021 Q22021
Q3'21
Q4*'21
-10.0
-5.0
0.0
5.0
10.0UK GDP (%)
*Most recent quarterly GDP: 1.0
2020 2021 Q22021
Q3'21
Q4*'21
-10.0
-5.0
0.0
5.0
10.0Germany GDP (%)
*Most recent quarterly GDP: -0.3
18

© 2022 MSCI Inc. All rights reserved. Please refer to the disclaimer at the end of this document.
Appendix

Data Sources
Yields and Spreads MSCI zero coupon yield and spread curves
Indexes MSCI USA Index, MSCI World ex USA Index, MSCI Europe Index, MSCI China, MSCI Emerging Market Index
Relative Strength of Currencies MSCI
Inflation and GDP OECD, Eurostat, UK Office of National Statistics, Cabinet Office of Japan, US Bureau of Economic Analysis, US Bureau of Labor Statistics, National Bureau of Statistics China
20

About MSCI
MSCI is a leading provider of critical decision support tools and services for theglobal investment community. With over 50 years of expertise in research, data andtechnology, we power better investment decisions by enabling clients tounderstand and analyze key drivers of risk and return and confidently build moreeffective portfolios. We create industry-leading research-enhanced solutions thatclients use to gain insight into and improve transparency across the investmentprocess. To learn more, please visit www.msci.com .
21

Contact us
AMERICAS EUROPE, MIDDLE EAST & AFRICA ASIA PACIFIC
Americas + 1 888 588 4567 *
Atlanta + 1 404 551 3212
Boston + 1 617 532 0920
Chicago + 1 312 675 0545
Monterrey + 52 81 1253 4020
New York + 1 212 804 3901
San Francisco + 1 415 836 8800
São Paulo + 55 11 3706 1360
Toronto + 1 416 628 1007
* = toll free msci.com [email protected] [email protected]
Cape Town + 27 21 673 0100
Frankfurt + 49 69 133 859 00
Geneva + 41 22 817 9777
London + 44 20 7618 2222
Milan + 39 02 5849 0415
Paris 0800 91 59 17 *
China North 10800 852 1032 *
China South 10800 152 1032 *
Hong Kong + 852 2844 9333
Mumbai + 91 22 6784 9160
Seoul 00798 8521 3392 *
Singapore 800 852 3749 *
Sydney + 61 2 9033 9333
Taipei 008 0112 7513 *
Thailand 0018 0015 6207 7181 *
Tokyo + 81 3 5290 1555
The process for submitting a formal index complaint can be found on the index regulation page of MSCI’s website at: https://www.msci.com/index-regulation . 22

Notice & DisclaimerThis document and all of the information contained in it, including without limitation all text, data, graphs, charts (collectively, the “Information”) is the property of MSCI Inc. or its subsidiaries (collectively, “MSCI”), or MSCI’s licensors, direct or indirect suppliers or anythird party involved in making or compiling any Information (collectively, with MSCI, the “Information Providers”) and is provided for informational purposes only. The Information may not be modified, reverse-engineered, reproduced or redisseminated in whole or inpart without prior written permission from MSCI. All rights in the Information are reserved by MSCI and/or its Information Providers.
The Information may not be used to create derivative works or to verify or correct other data or information. For example (but without limitation), the Information may not be used to create indexes, databases, risk models, analytics, software, or in connection with theissuing, offering, sponsoring, managing or marketing of any securities, portfolios, financial products or other investment vehicles utilizing or based on, linked to, tracking or otherwise derived from the Information or any other MSCI data, information, products orservices.
The user of the Information assumes the entire risk of any use it may make or permit to be made of the Information. NONE OF THE INFORMATION PROVIDERS MAKES ANY EXPRESS OR IMPLIED WARRANTIES OR REPRESENTATIONS WITH RESPECT TO THEINFORMATION (OR THE RESULTS TO BE OBTAINED BY THE USE THEREOF), AND TO THE MAXIMUM EXTENT PERMITTED BY APPLICABLE LAW, EACH INFORMATION PROVIDER EXPRESSLY DISCLAIMS ALL IMPLIED WARRANTIES (INCLUDING, WITHOUT LIMITATION,ANY IMPLIED WARRANTIES OF ORIGINALITY, ACCURACY, TIMELINESS, NON-INFRINGEMENT, COMPLETENESS, MERCHANTABILITY AND FITNESS FOR A PARTICULAR PURPOSE) WITH RESPECT TO ANY OF THE INFORMATION.
Without limiting any of the foregoing and to the maximum extent permitted by applicable law, in no event shall any Information Provider have any liability regarding any of the Information for any direct, indirect, special, punitive, consequential (including lost profits) orany other damages even if notified of the possibility of such damages. The foregoing shall not exclude or limit any liability that may not by applicable law be excluded or limited, including without limitation (as applicable), any liability for death or personal injury to theextent that such injury results from the negligence or willful default of itself, its servants, agents or sub-contractors.
Information containing any historical information, data or analysis should not be taken as an indication or guarantee of any future performance, analysis, forecast or prediction. Past performance does not guarantee future results.
The Information should not be relied on and is not a substitute for the skill, judgment and experience of the user, its management, employees, advisors and/or clients when making investment and other business decisions. All Information is impersonal and not tailoredto the needs of any person, entity or group of persons.
None of the Information constitutes an offer to sell (or a solicitation of an offer to buy), any security, financial product or other investment vehicle or any trading strategy.
It is not possible to invest directly in an index. Exposure to an asset class or trading strategy or other category represented by an index is only available through third party investable instruments (if any) based on that index. MSCI does not issue, sponsor, endorse,market, offer, review or otherwise express any opinion regarding any fund, ETF, derivative or other security, investment, financial product or trading strategy that is based on, linked to or seeks to provide an investment return related to the performance of any MSCI index(collectively, “Index Linked Investments”). MSCI makes no assurance that any Index Linked Investments will accurately track index performance or provide positive investment returns. MSCI Inc. is not an investment adviser or fiduciary and MSCI makes norepresentation regarding the advisability of investing in any Index Linked Investments.
Index returns do not represent the results of actual trading of investible assets/securities. MSCI maintains and calculates indexes, but does not manage actual assets. Index returns do not reflect payment of any sales charges or fees an investor may pay to purchasethe securities underlying the index or Index Linked Investments. The imposition of these fees and charges would cause the performance of an Index Linked Investment to be different than the MSCI index performance.
The Information may contain back tested data. Back-tested performance is not actual performance, but is hypothetical. There are frequently material differences between back tested performance results and actual results subsequently achieved by any investmentstrategy.
Constituents of MSCI equity indexes are listed companies, which are included in or excluded from the indexes according to the application of the relevant index methodologies. Accordingly, constituents in MSCI equity indexes may include MSCI Inc., clients of MSCI orsuppliers to MSCI. Inclusion of a security within an MSCI index is not a recommendation by MSCI to buy, sell, or hold such security, nor is it considered to be investment advice.
Data and information produced by various affiliates of MSCI Inc., including MSCI ESG Research LLC and Barra LLC, may be used in calculating certain MSCI indexes. More information can be found in the relevant index methodologies on www.msci.com .
MSCI receives compensation in connection with licensing its indexes to third parties. MSCI Inc.’s revenue includes fees based on assets in Index Linked Investments. Information can be found in MSCI Inc.’s company filings on the Investor Relations section ofwww.msci.com.
MSCI ESG Research LLC is a Registered Investment Adviser under the Investment Advisers Act of 1940 and a subsidiary of MSCI Inc. Except with respect to any applicable products or services from MSCI ESG Research, neither MSCI nor any of its products or servicesrecommends, endorses, approves or otherwise expresses any opinion regarding any issuer, securities, financial products or instruments or trading strategies and MSCI’s products or services are not intended to constitute investment advice or a recommendation tomake (or refrain from making) any kind of investment decision and may not be relied on as such. Issuers mentioned or included in any MSCI ESG Research materials may include MSCI Inc., clients of MSCI or suppliers to MSCI, and may also purchase research or otherproducts or services from MSCI ESG Research. MSCI ESG Research materials, including materials utilized in any MSCI ESG Indexes or other products, have not been submitted to, nor received approval from, the United States Securities and Exchange Commission orany other regulatory body.
Any use of or access to products, services or information of MSCI requires a license from MSCI. MSCI, Barra, RiskMetrics, IPD and other MSCI brands and product names are the trademarks, service marks, or registered trademarks of MSCI or its subsidiaries in theUnited States and other jurisdictions. The Global Industry Classification Standard (GICS) was developed by and is the exclusive property of MSCI and S&P Global Market Intelligence. “Global Industry Classification Standard (GICS)” is a service mark of MSCI and S&PGlobal Market Intelligence.
Privacy notice: For information about how MSCI collects and uses personal data, please refer to our Privacy Notice at https://www.msci.com/privacy-pledge .
23