Dabur India Ltd...Dabur Amla Kids Hair Oil & Shampoo Babool Ayurvedic Toothpaste Real Masala Range...
43
Dabur India Ltd Investor Presentation August 2019
Transcript of Dabur India Ltd...Dabur Amla Kids Hair Oil & Shampoo Babool Ayurvedic Toothpaste Real Masala Range...
Dabur India Ltd
Investor Presentation
August 2019
Agenda
2
1. Dabur – Overview
2. Business Structure
3. India Business
4. International Business
5. The Way Forward
6. Our Capitals
7. Annexure
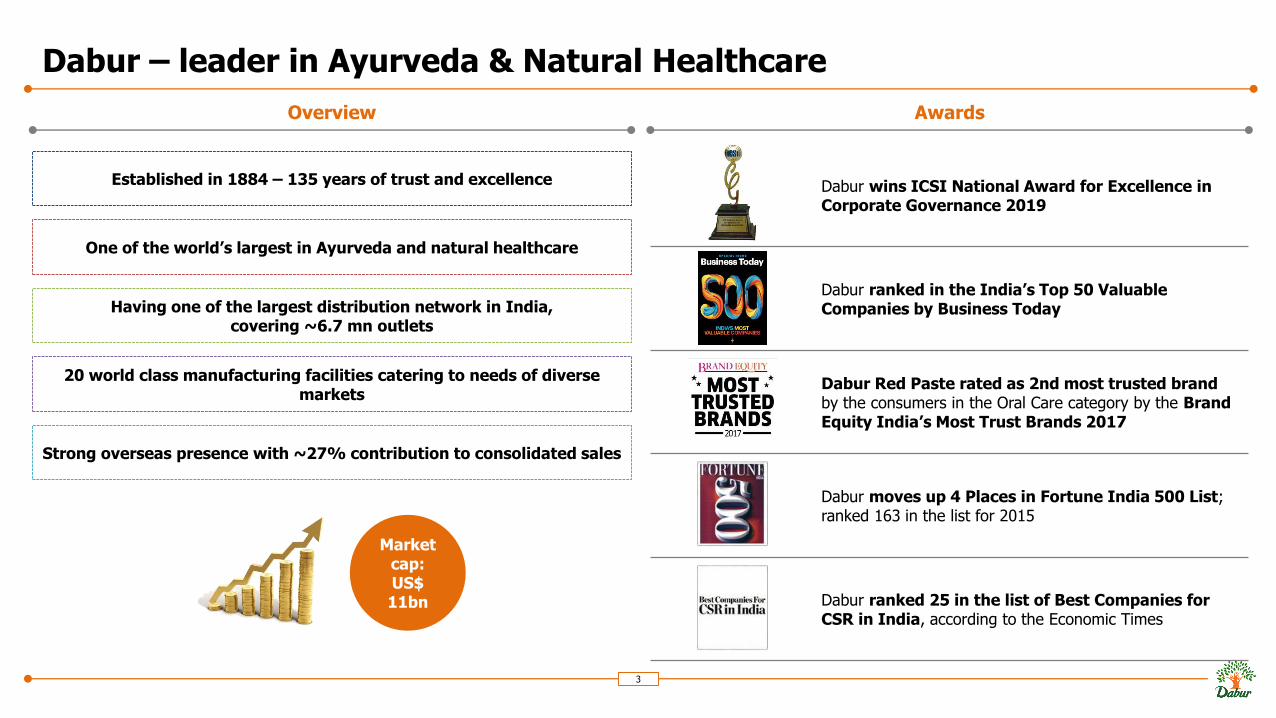
Dabur – leader in Ayurveda & Natural Healthcare
3
Overview Awards
Established in 1884 – 135 years of trust and excellence
One of the world’s largest in Ayurveda and natural healthcare
Having one of the largest distribution network in India, covering ~6.7 mn outlets
20 world class manufacturing facilities catering to needs of diverse markets
Strong overseas presence with ~27% contribution to consolidated sales
Market cap: US$ 11bn
Dabur wins ICSI National Award for Excellence in Corporate Governance 2019
Dabur ranked in the India’s Top 50 Valuable Companies by Business Today
Dabur Red Paste rated as 2nd most trusted brandby the consumers in the Oral Care category by the Brand Equity India’s Most Trust Brands 2017
Dabur moves up 4 Places in Fortune India 500 List; ranked 163 in the list for 2015
Dabur ranked 25 in the list of Best Companies for CSR in India, according to the Economic Times
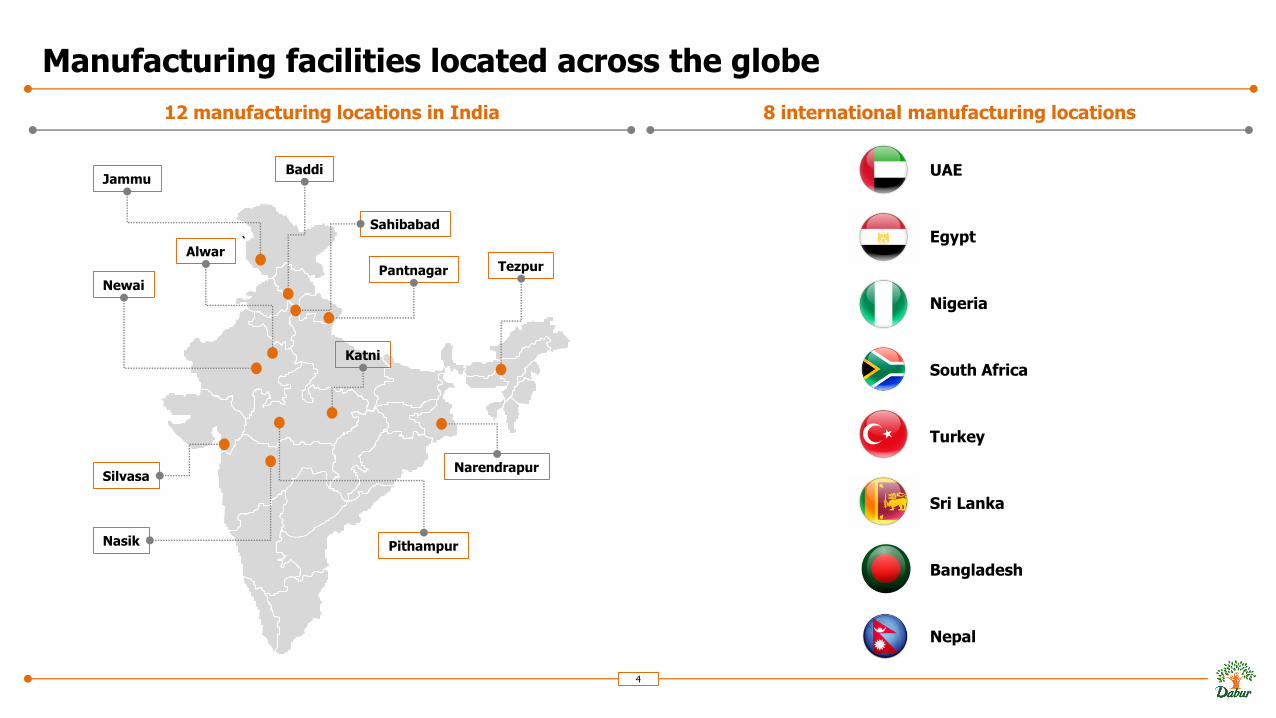
Manufacturing facilities located across the globe
4
12 manufacturing locations in India 8 international manufacturing locations
`
JammuBaddi
Pantnagar
Sahibabad
Tezpur
Nasik
Silvasa
Pithampur
Narendrapur
Katni
Alwar
Newai
Egypt
Nigeria
Turkey
Sri Lanka
Bangladesh
Nepal
South Africa
UAE

One of the largest distribution network in India
5
Urban Rural
Insti Stockist
Wholesaler
GT Stockist
RetailerRetailer
ConsumerConsumerConsumer
Factory
C&F
MT Stockist
Retailer
Consumer
Factory
C&F
Super Stockist
Sub Stockist
Distribution reach of 6.7 mn retail outlets with direct reach of 1.1 mn+
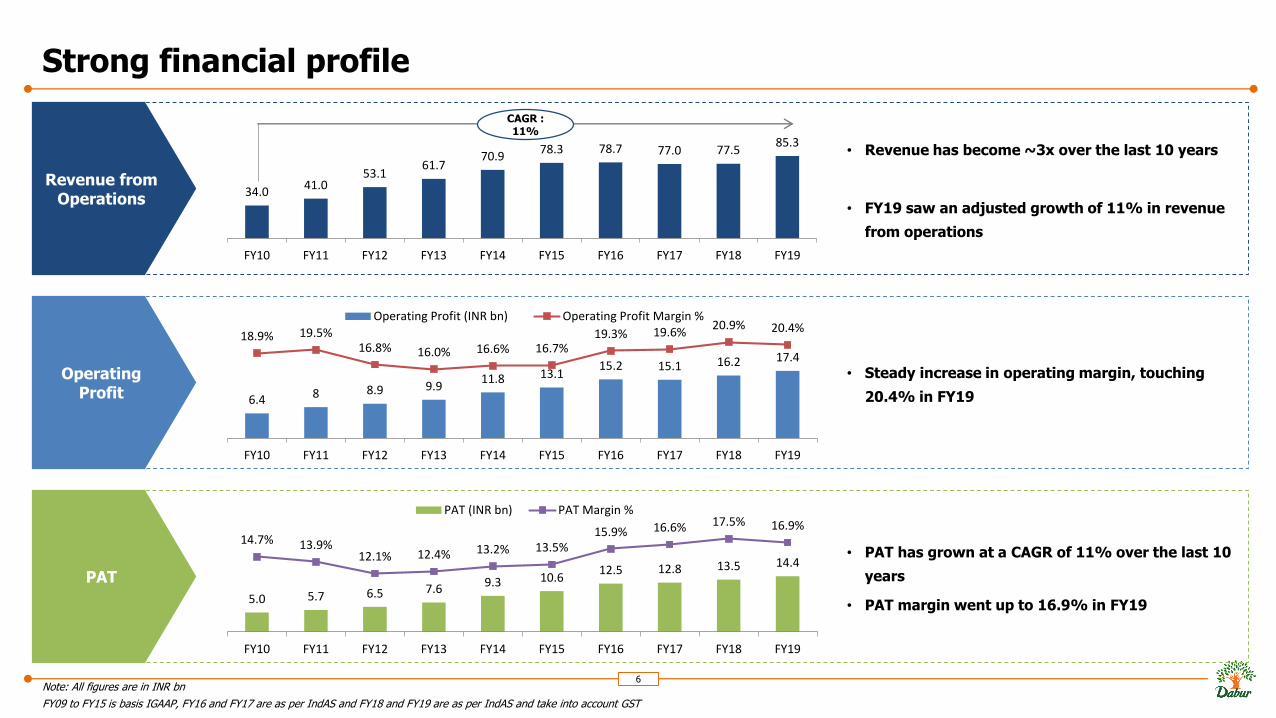
Strong financial profile
6Note: All figures are in INR bn
FY09 to FY15 is basis IGAAP, FY16 and FY17 are as per IndAS and FY18 and FY19 are as per IndAS and take into account GST
• PAT has grown at a CAGR of 11% over the last 10
years
• PAT margin went up to 16.9% in FY19
• Steady increase in operating margin, touching
20.4% in FY19
• Revenue has become ~3x over the last 10 years
• FY19 saw an adjusted growth of 11% in revenue
from operations
Revenue from Operations
Operating Profit
PAT
34.0 41.0
53.1 61.7
70.9 78.3 78.7 77.0 77.5
85.3
FY10 FY11 FY12 FY13 FY14 FY15 FY16 FY17 FY18 FY19
CAGR : 11%
6.4 8 8.9 9.911.8 13.1
15.2 15.1 16.2 17.4
18.9% 19.5%16.8% 16.0% 16.6% 16.7%
19.3% 19.6%20.9% 20.4%
FY10 FY11 FY12 FY13 FY14 FY15 FY16 FY17 FY18 FY19
Operating Profit (INR bn) Operating Profit Margin %
5.0 5.7 6.5 7.6 9.3 10.612.5 12.8 13.5 14.4
14.7% 13.9%12.1% 12.4% 13.2% 13.5%
15.9% 16.6% 17.5% 16.9%
FY10 FY11 FY12 FY13 FY14 FY15 FY16 FY17 FY18 FY19
PAT (INR bn) PAT Margin %
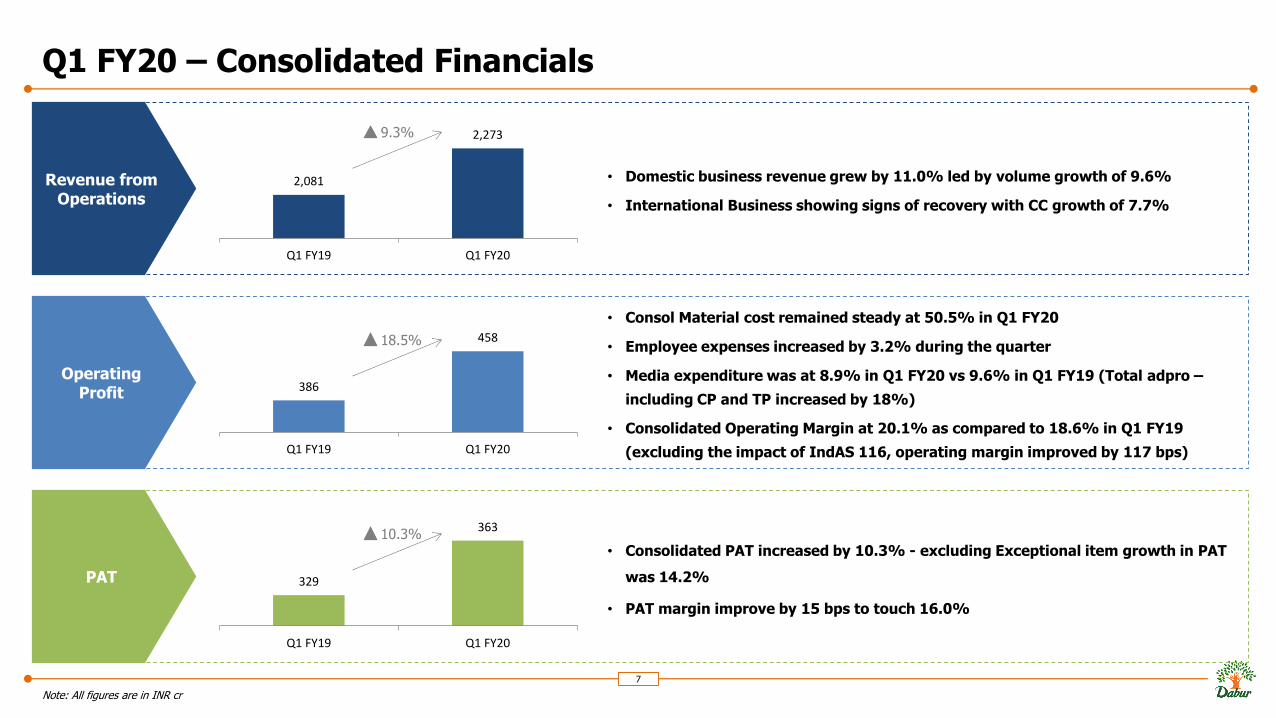
Q1 FY20 – Consolidated Financials
7
Note: All figures are in INR cr
• Consolidated PAT increased by 10.3% - excluding Exceptional item growth in PAT
was 14.2%
• PAT margin improve by 15 bps to touch 16.0%
• Consol Material cost remained steady at 50.5% in Q1 FY20
• Employee expenses increased by 3.2% during the quarter
• Media expenditure was at 8.9% in Q1 FY20 vs 9.6% in Q1 FY19 (Total adpro –
including CP and TP increased by 18%)
• Consolidated Operating Margin at 20.1% as compared to 18.6% in Q1 FY19
(excluding the impact of IndAS 116, operating margin improved by 117 bps)
• Domestic business revenue grew by 11.0% led by volume growth of 9.6%
• International Business showing signs of recovery with CC growth of 7.7%
Revenue from Operations
Operating Profit
PAT
2,081
2,273
Q1 FY19 Q1 FY20
9.3%
386
458
Q1 FY19 Q1 FY20
329
363
Q1 FY19 Q1 FY20
18.5%
10.3%
Agenda
8
1. Dabur – Overview
2. Business Structure
3. India Business
4. International Business
5. The Way Forward
6. Our Capitals
7. Annexure
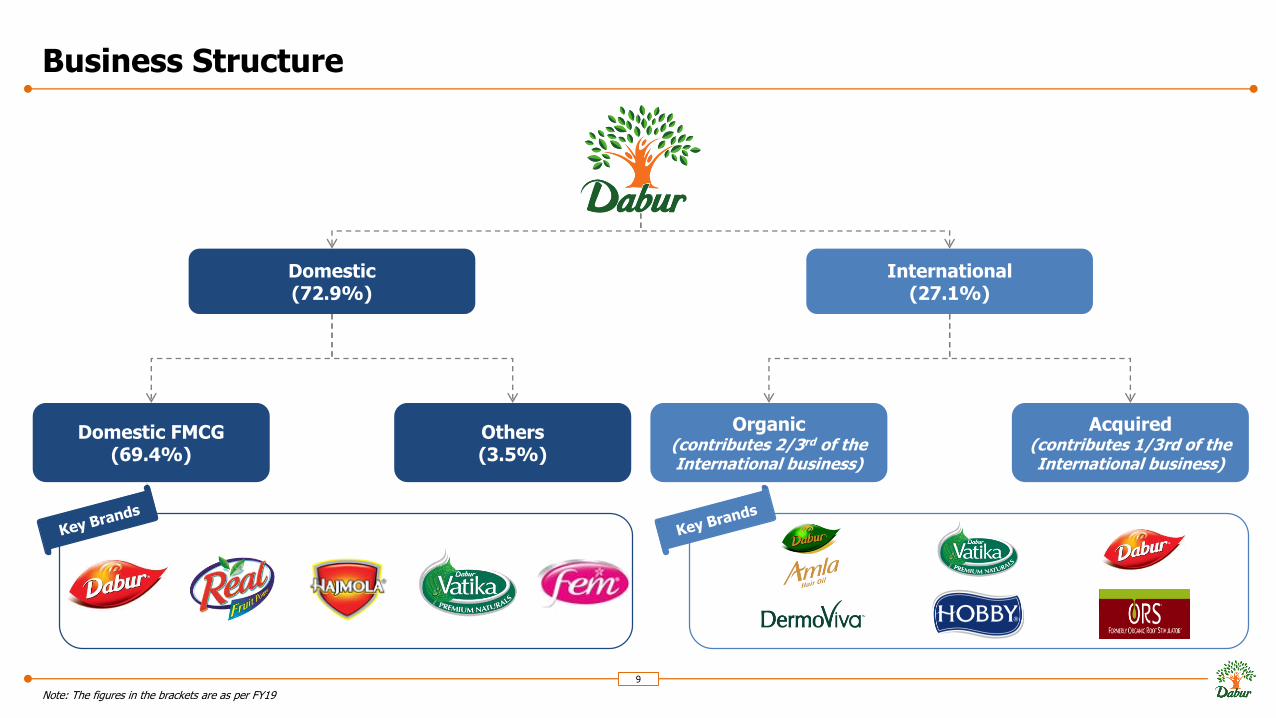
Business Structure
9
Note: The figures in the brackets are as per FY19
Domestic(72.9%)
International(27.1%)
Domestic FMCG(69.4%)
Others(3.5%)
Organic(contributes 2/3rd of the International business)
Acquired(contributes 1/3rd of the International business)
Agenda
10
1. Dabur – Overview
2. Business Structure
3. India Business
4. International Business
5. The Way Forward
6. Our Capitals
7. Annexure
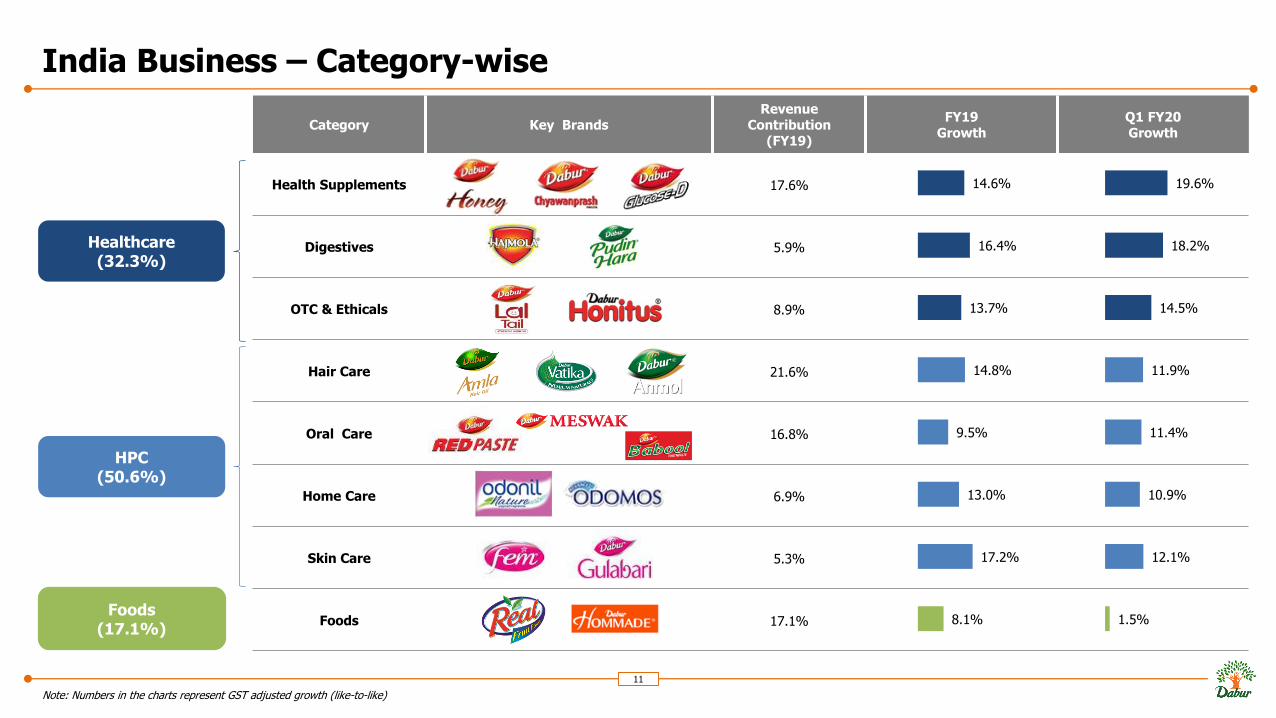
India Business – Category-wise
11
Note: Numbers in the charts represent GST adjusted growth (like-to-like)
Category Key BrandsRevenue
Contribution (FY19)
FY19 Growth
Q1 FY20 Growth
Health Supplements 17.6%
Digestives 5.9%
OTC & Ethicals 8.9%
Hair Care 21.6%
Oral Care 16.8%
Home Care 6.9%
Skin Care 5.3%
Foods 17.1%
14.6%
16.4%
13.7%
14.8%
9.5%
13.0%
17.2%
8.1%
19.6%
18.2%
14.5%
11.9%
11.4%
10.9%
12.1%
1.5%
Healthcare(32.3%)
HPC(50.6%)
Foods(17.1%)
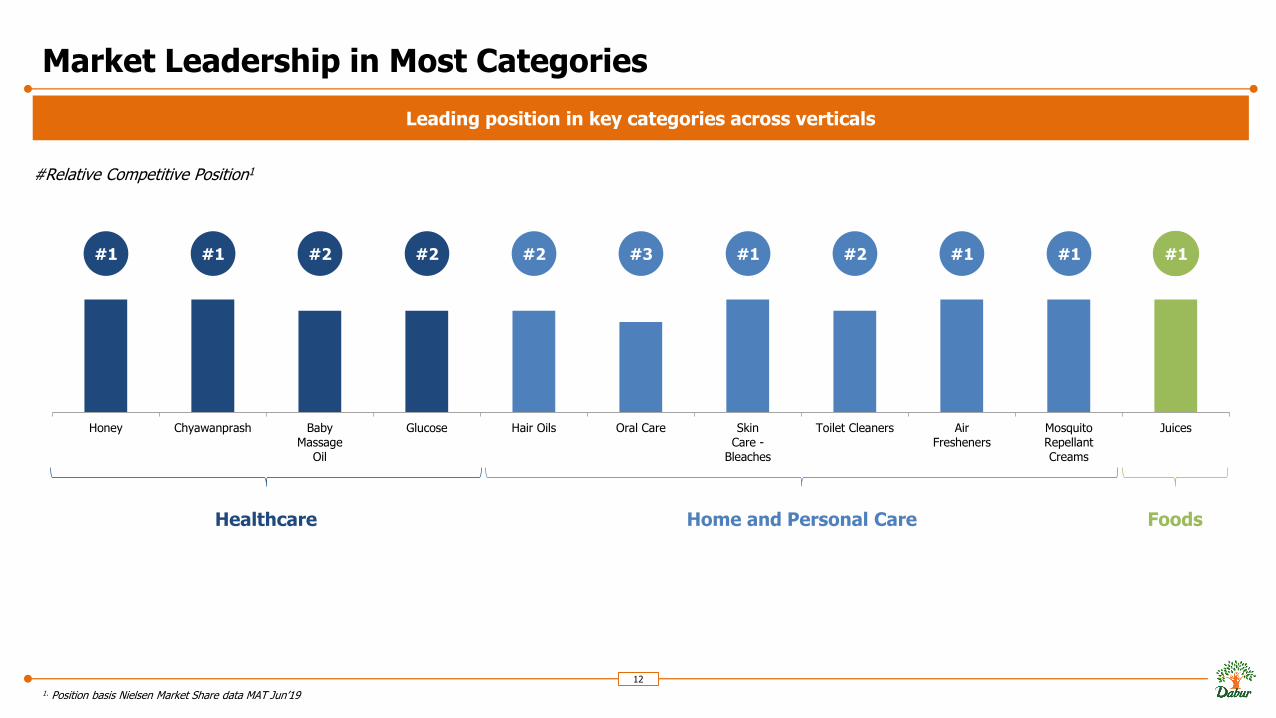
Market Leadership in Most Categories
12
1. Position basis Nielsen Market Share data MAT Jun’19
Honey Chyawanprash BabyMassage
Oil
Glucose Hair Oils Oral Care SkinCare -
Bleaches
Toilet Cleaners AirFresheners
MosquitoRepellantCreams
Juices
#1 #1 #2 #2 #2 #3 #1 #2 #1 #1 #1
#Relative Competitive Position1
Healthcare Home and Personal Care Foods
Leading position in key categories across verticals
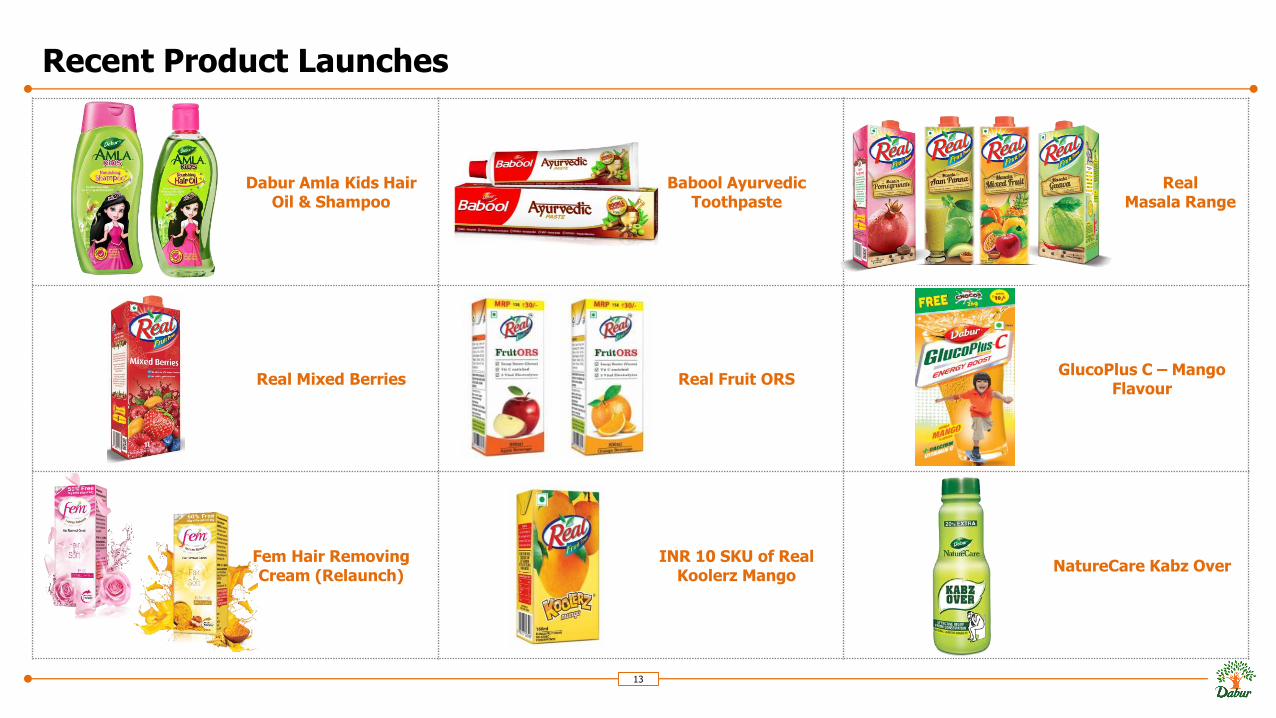
Recent Product Launches
13
Dabur Amla Kids Hair Oil & Shampoo
Babool Ayurvedic Toothpaste
Real Masala Range
Real Mixed Berries Real Fruit ORSGlucoPlus C – Mango
Flavour
Fem Hair Removing Cream (Relaunch)
INR 10 SKU of Real Koolerz Mango
NatureCare Kabz Over
Agenda
14
1. Dabur – Overview
2. Business Structure
3. India Business
4. International Business
5. The Way Forward
6. Our Capitals
7. Annexure
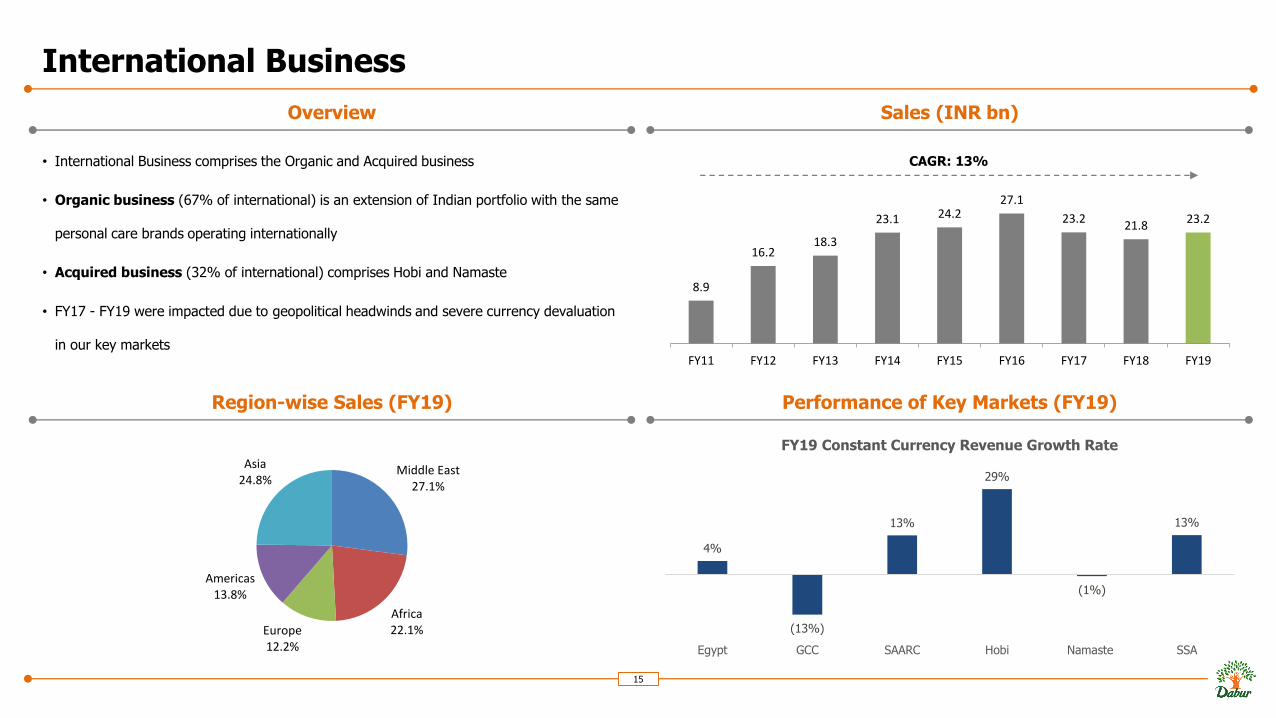
International Business
• International Business comprises the Organic and Acquired business
• Organic business (67% of international) is an extension of Indian portfolio with the same
personal care brands operating internationally
• Acquired business (32% of international) comprises Hobi and Namaste
• FY17 - FY19 were impacted due to geopolitical headwinds and severe currency devaluation
in our key markets
15
Overview Sales (INR bn)
Region-wise Sales (FY19) Performance of Key Markets (FY19)
8.9
16.2 18.3
23.1 24.2 27.1
23.2 21.8
23.2
FY11 FY12 FY13 FY14 FY15 FY16 FY17 FY18 FY19
CAGR: 13%
Middle East27.1%
Africa22.1%Europe
12.2%
Americas13.8%
Asia24.8%
4%
(13%)
13%
29%
(1%)
13%
Egypt GCC SAARC Hobi Namaste SSA
FY19 Constant Currency Revenue Growth Rate
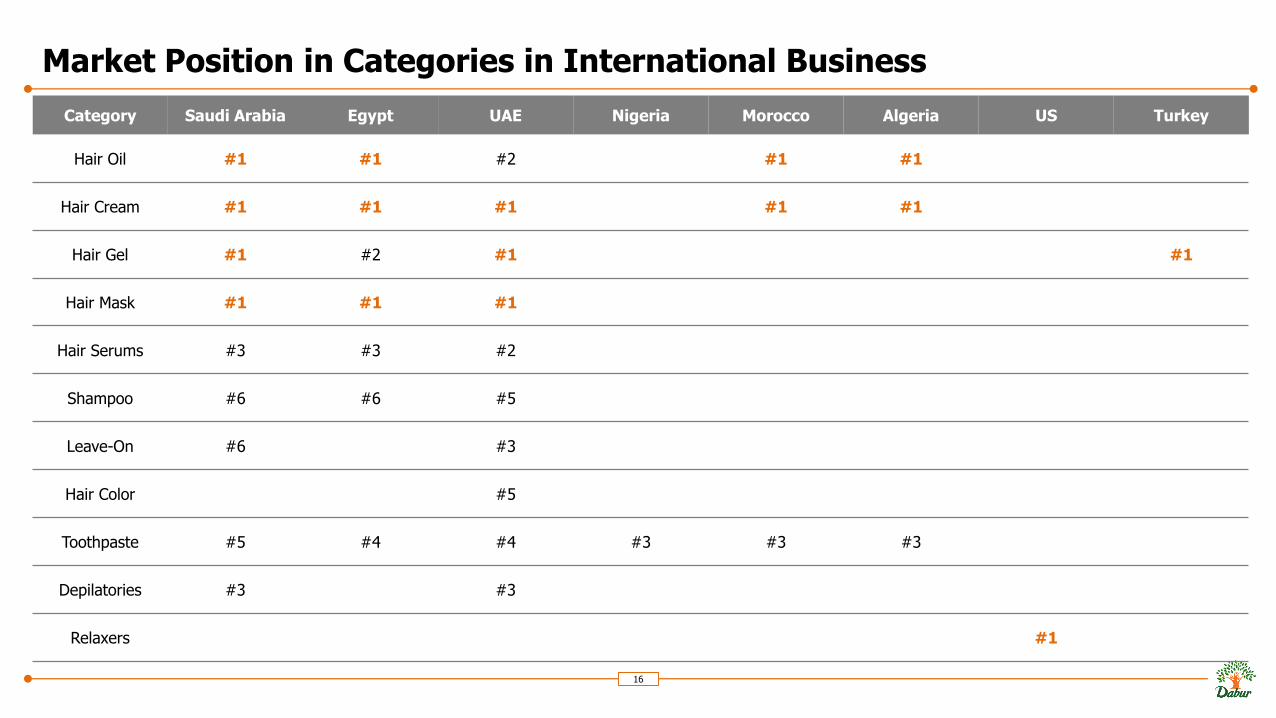
Market Position in Categories in International Business
16
Category Saudi Arabia Egypt UAE Nigeria Morocco Algeria US Turkey
Hair Oil #1 #1 #2 #1 #1
Hair Cream #1 #1 #1 #1 #1
Hair Gel #1 #2 #1 #1
Hair Mask #1 #1 #1
Hair Serums #3 #3 #2
Shampoo #6 #6 #5
Leave-On #6 #3
Hair Color #5
Toothpaste #5 #4 #4 #3 #3 #3
Depilatories #3 #3
Relaxers #1
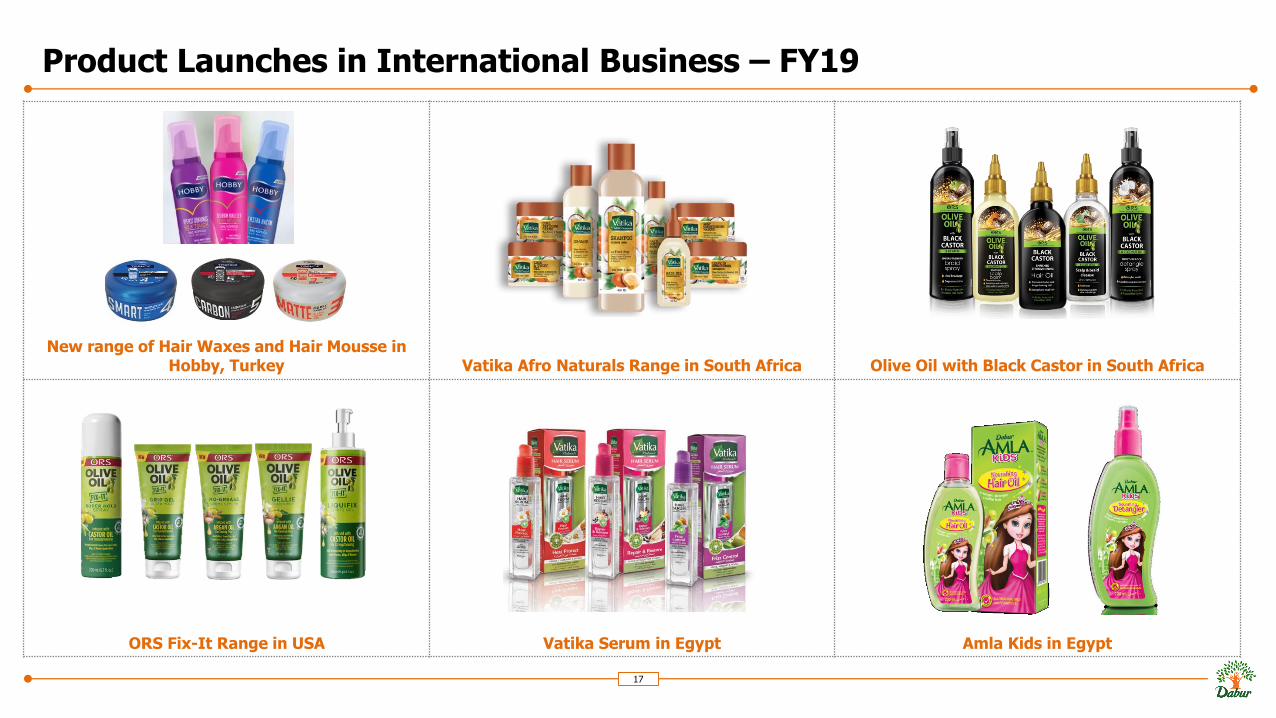
Product Launches in International Business – FY19
17
New range of Hair Waxes and Hair Mousse in Hobby, Turkey Vatika Afro Naturals Range in South Africa Olive Oil with Black Castor in South Africa
ORS Fix-It Range in USA Vatika Serum in Egypt Amla Kids in Egypt
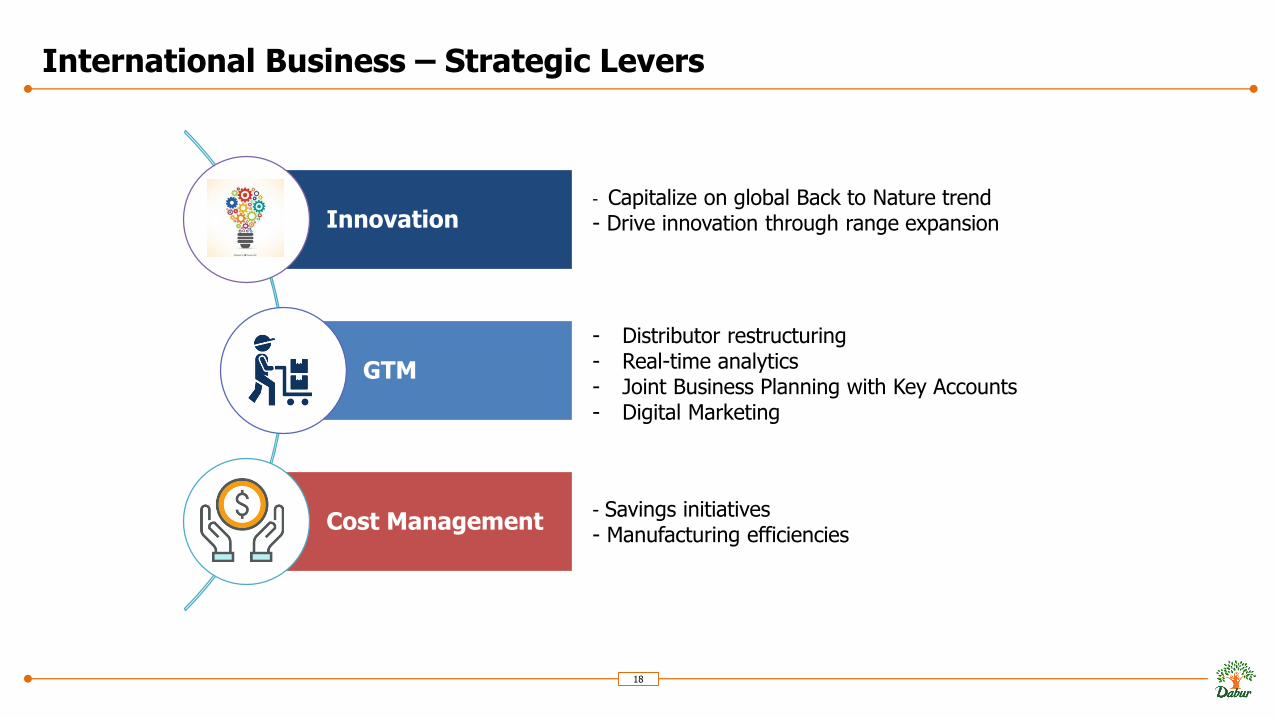
International Business – Strategic Levers
18
Innovation
GTM
Cost Management
- Capitalize on global Back to Nature trend- Drive innovation through range expansion
- Distributor restructuring- Real-time analytics- Joint Business Planning with Key Accounts- Digital Marketing
- Savings initiatives- Manufacturing efficiencies
Agenda
19
1. Dabur – Overview
2. Business Structure
3. India Business
4. International Business
5. The Way Forward
6. Our Capitals
7. Annexure
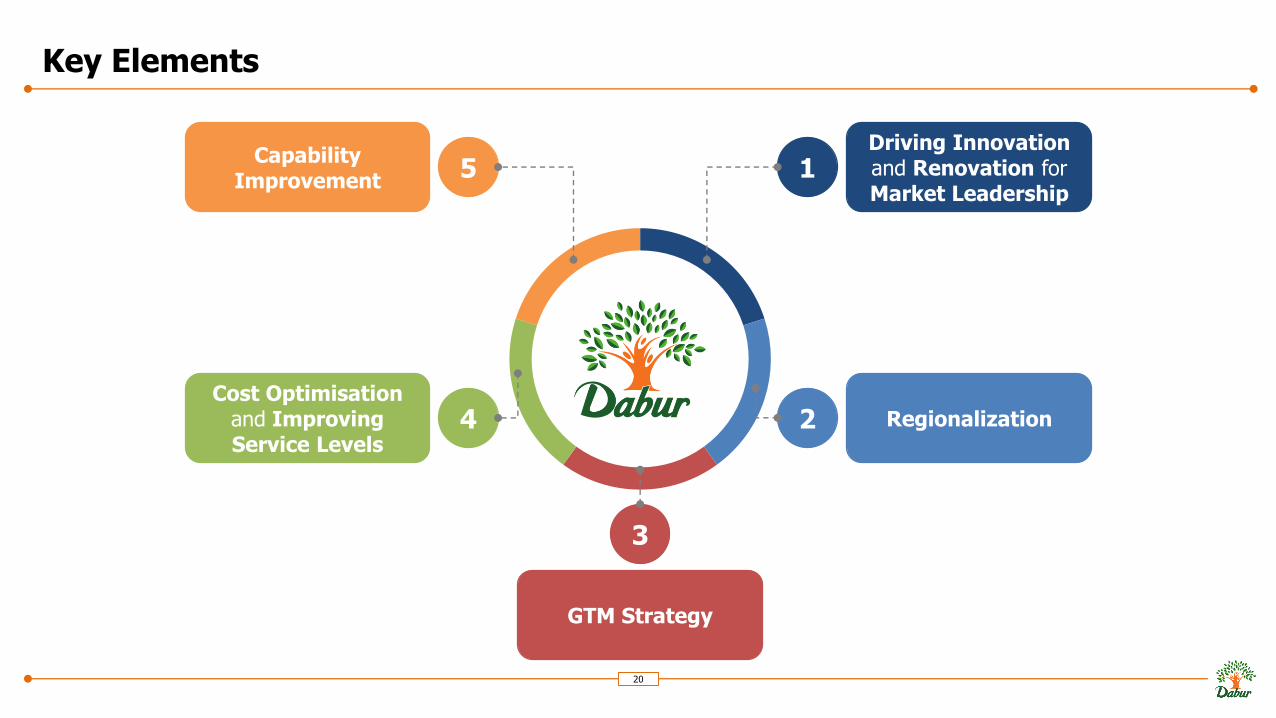
Key Elements
20
Driving Innovationand Renovation for Market Leadership
1
Regionalization2
GTM Strategy
Cost Optimisationand Improving Service Levels
Capability Improvement
5
4
3
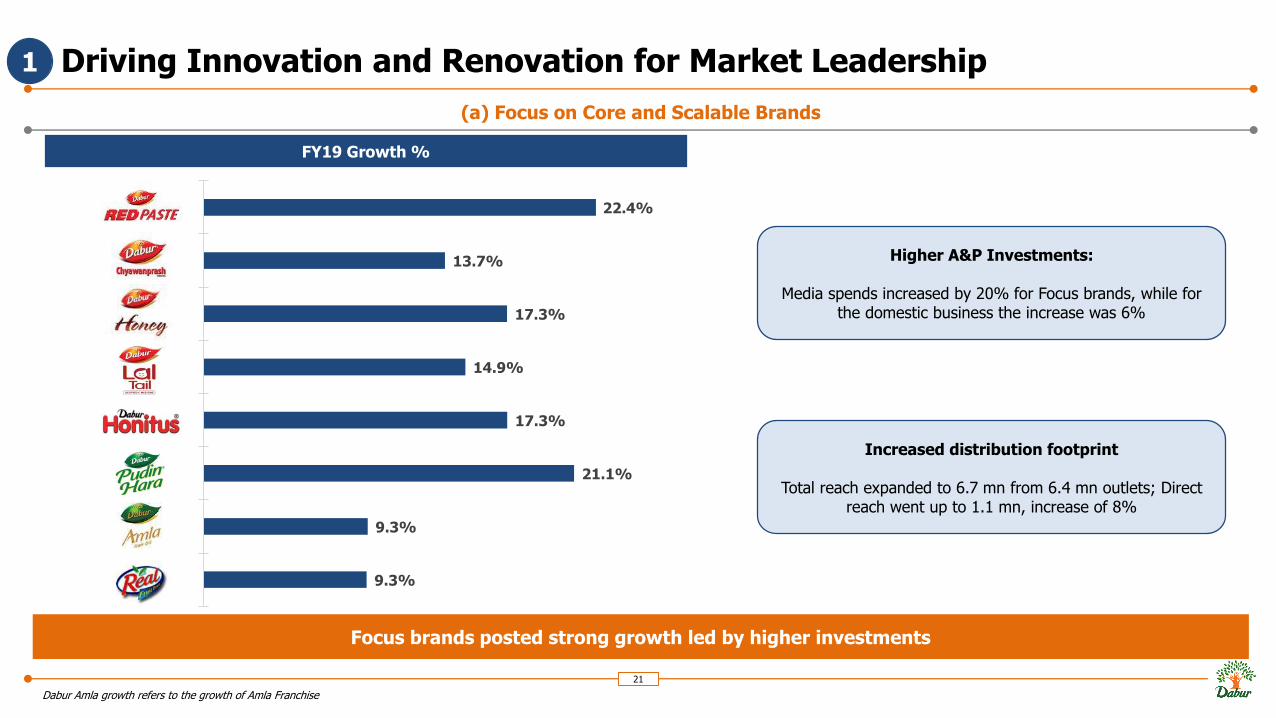
Driving Innovation and Renovation for Market Leadership
21
Dabur Amla growth refers to the growth of Amla Franchise
(a) Focus on Core and Scalable Brands
1
FY19 Growth %
22.4%
13.7%
17.3%
14.9%
17.3%
21.1%
9.3%
9.3%
Higher A&P Investments:
Media spends increased by 20% for Focus brands, while for the domestic business the increase was 6%
Increased distribution footprint
Total reach expanded to 6.7 mn from 6.4 mn outlets; Direct reach went up to 1.1 mn, increase of 8%
Focus brands posted strong growth led by higher investments
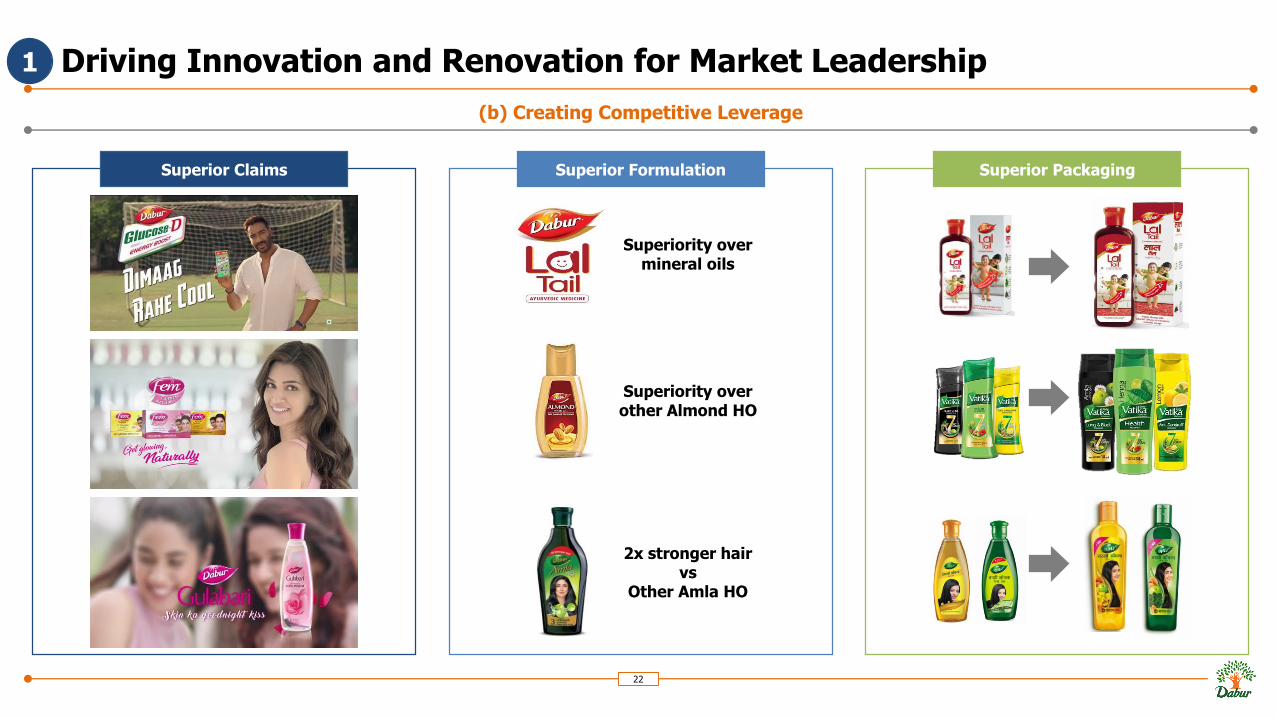
Driving Innovation and Renovation for Market Leadership
22
(b) Creating Competitive Leverage
1
Superior Claims Superior Formulation Superior Packaging
Superiority over mineral oils
Superiority over other Almond HO
2x stronger hair vs
Other Amla HO
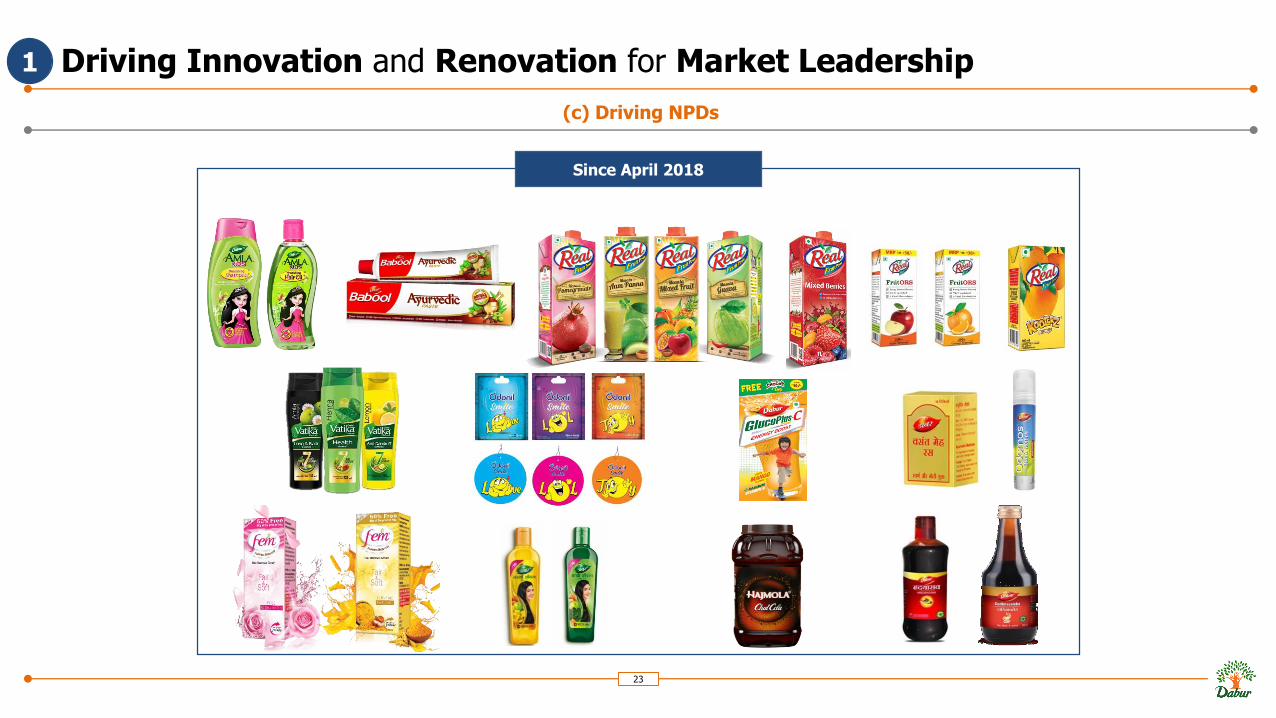
Driving Innovation and Renovation for Market Leadership
23
(c) Driving NPDs
1
Since April 2018
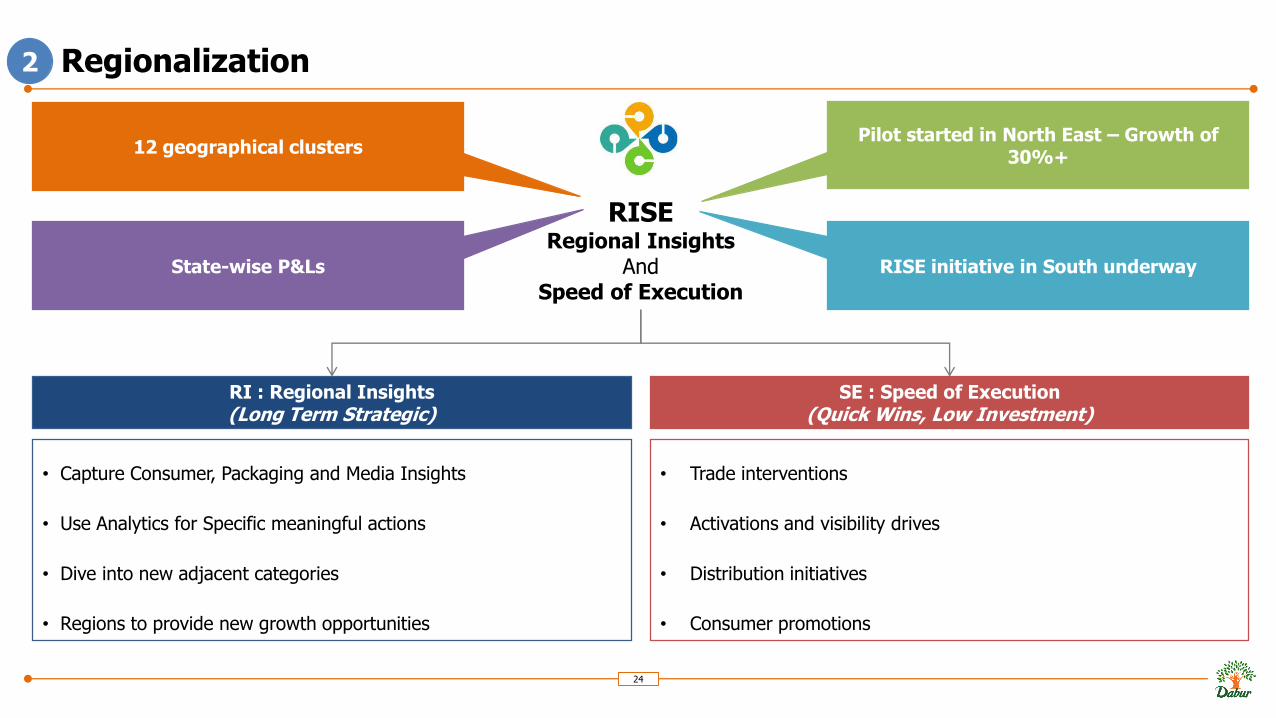
Regionalization
24
2
RI : Regional Insights(Long Term Strategic)
SE : Speed of Execution(Quick Wins, Low Investment)
• Capture Consumer, Packaging and Media Insights
• Use Analytics for Specific meaningful actions
• Dive into new adjacent categories
• Regions to provide new growth opportunities
• Trade interventions
• Activations and visibility drives
• Distribution initiatives
• Consumer promotions
RISERegional Insights
AndSpeed of Execution
12 geographical clustersPilot started in North East – Growth of
30%+
RISE initiative in South underwayState-wise P&Ls
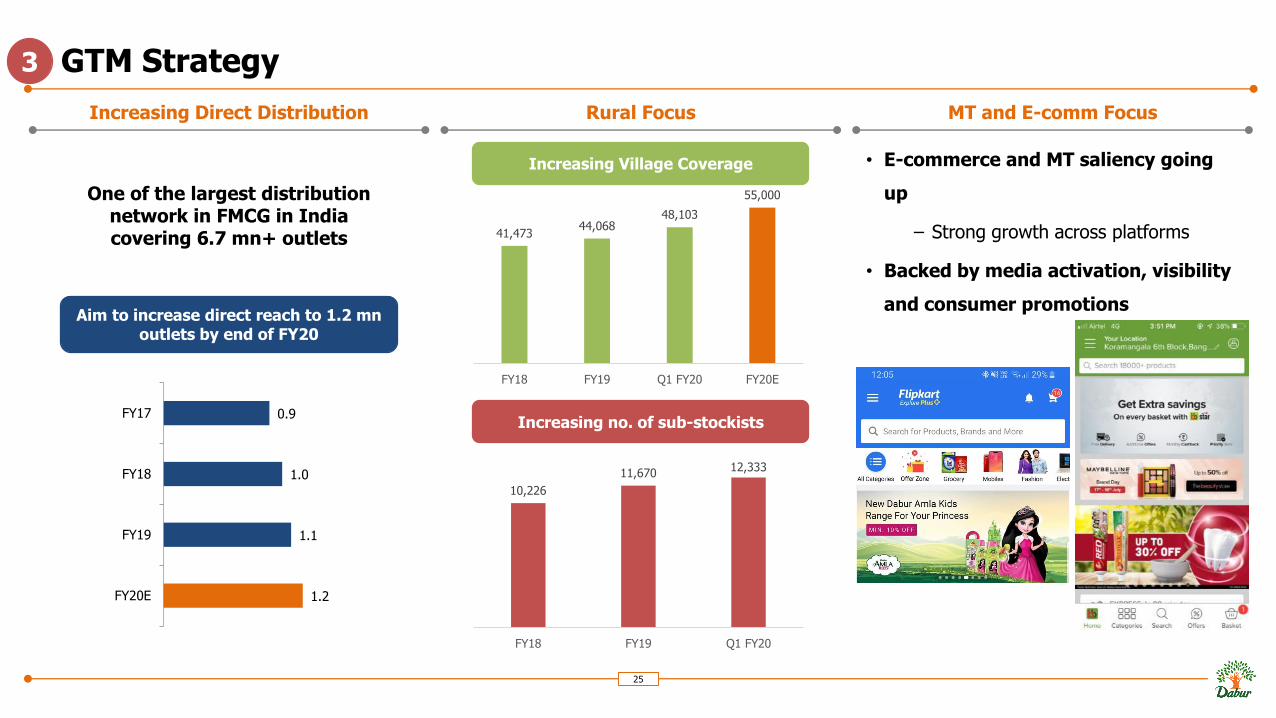
GTM Strategy
25
Increasing Direct Distribution MT and E-comm Focus
• E-commerce and MT saliency going
up
– Strong growth across platforms
• Backed by media activation, visibility
and consumer promotions
Rural Focus
3
One of the largest distributionnetwork in FMCG in India covering 6.7 mn+ outlets
0.9
1.0
1.1
1.2
FY17
FY18
FY19
FY20E
Aim to increase direct reach to 1.2 mnoutlets by end of FY20
Increasing Village Coverage
41,47344,068
48,103
55,000
FY18 FY19 Q1 FY20 FY20E
Increasing no. of sub-stockists
10,226
11,67012,333
FY18 FY19 Q1 FY20
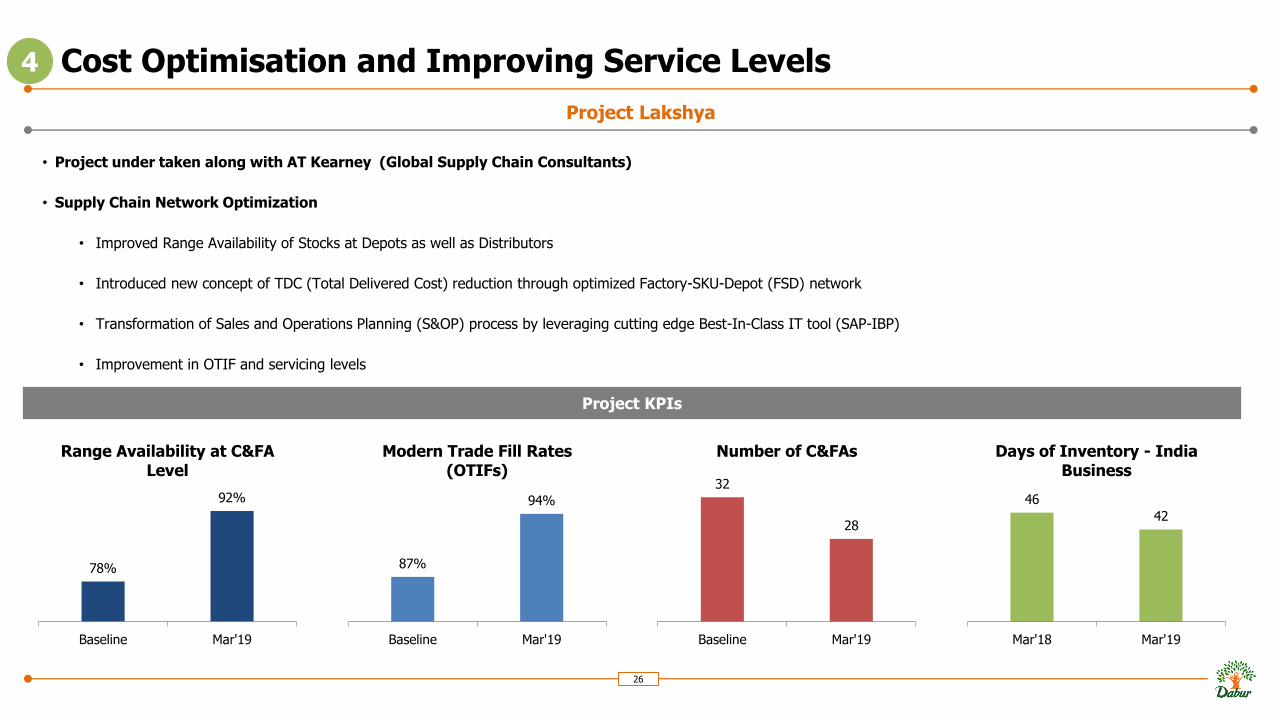
Cost Optimisation and Improving Service Levels
• Project under taken along with AT Kearney (Global Supply Chain Consultants)
• Supply Chain Network Optimization
• Improved Range Availability of Stocks at Depots as well as Distributors
• Introduced new concept of TDC (Total Delivered Cost) reduction through optimized Factory-SKU-Depot (FSD) network
• Transformation of Sales and Operations Planning (S&OP) process by leveraging cutting edge Best-In-Class IT tool (SAP-IBP)
• Improvement in OTIF and servicing levels
26
Project Lakshya
4
Project KPIs
78%
92%
Baseline Mar'19
Range Availability at C&FA Level
87%
94%
Baseline Mar'19
Modern Trade Fill Rates (OTIFs)
32
28
Baseline Mar'19
Number of C&FAs
46
42
Mar'18 Mar'19
Days of Inventory - India Business
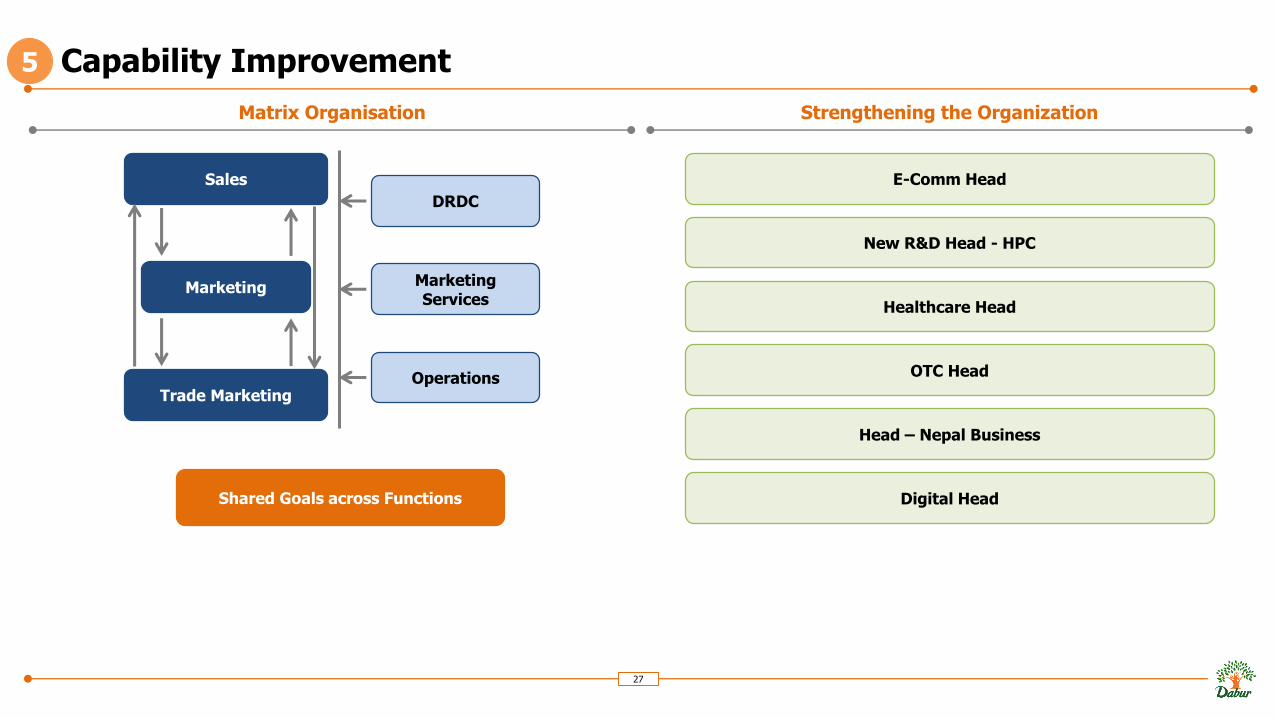
Capability Improvement
27
Matrix Organisation Strengthening the Organization
5
Sales
Marketing
Trade Marketing
DRDC
Marketing Services
Operations
Shared Goals across Functions
E-Comm Head
New R&D Head - HPC
Healthcare Head
OTC Head
Digital Head
Head – Nepal Business
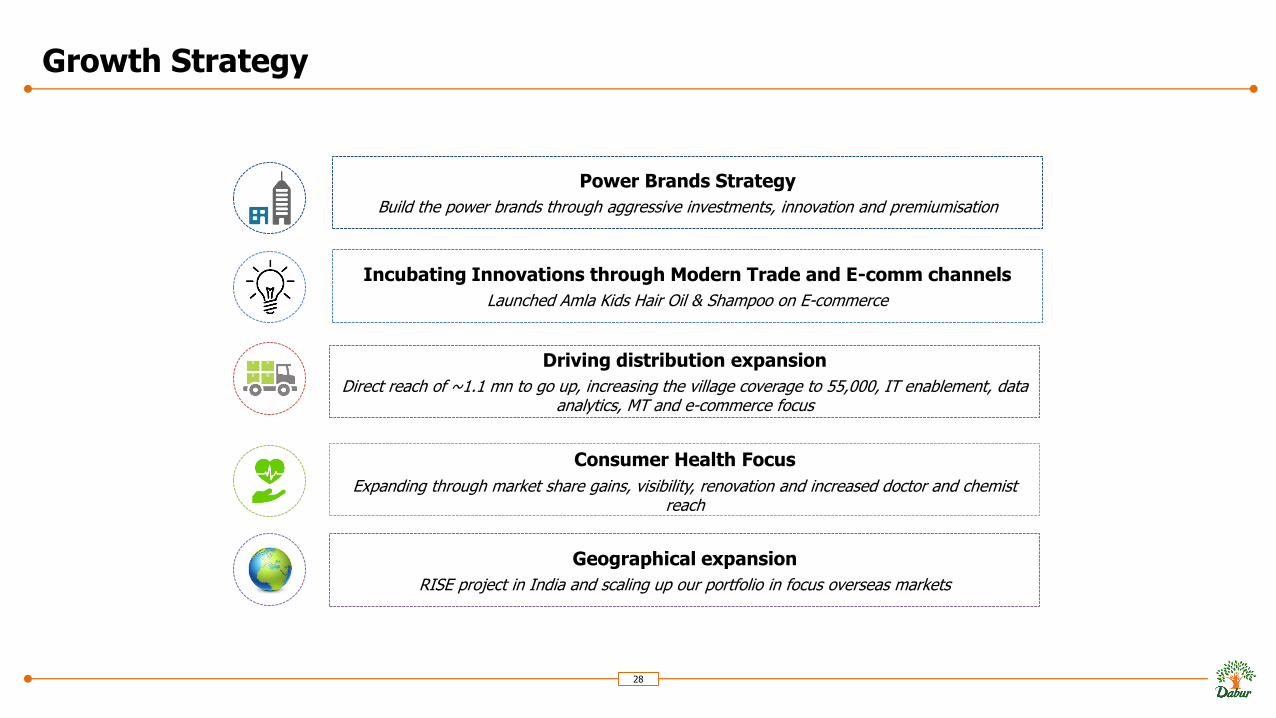
Growth Strategy
28
Power Brands Strategy
Build the power brands through aggressive investments, innovation and premiumisation
Geographical expansion
RISE project in India and scaling up our portfolio in focus overseas markets
Consumer Health Focus
Expanding through market share gains, visibility, renovation and increased doctor and chemist reach
Driving distribution expansion
Direct reach of ~1.1 mn to go up, increasing the village coverage to 55,000, IT enablement, data analytics, MT and e-commerce focus
Incubating Innovations through Modern Trade and E-comm channels
Launched Amla Kids Hair Oil & Shampoo on E-commerce
Agenda
29
1. Dabur – Overview
2. Business Structure
3. India Business
4. International Business
5. The Way Forward
6. Our Capitals
7. Annexure
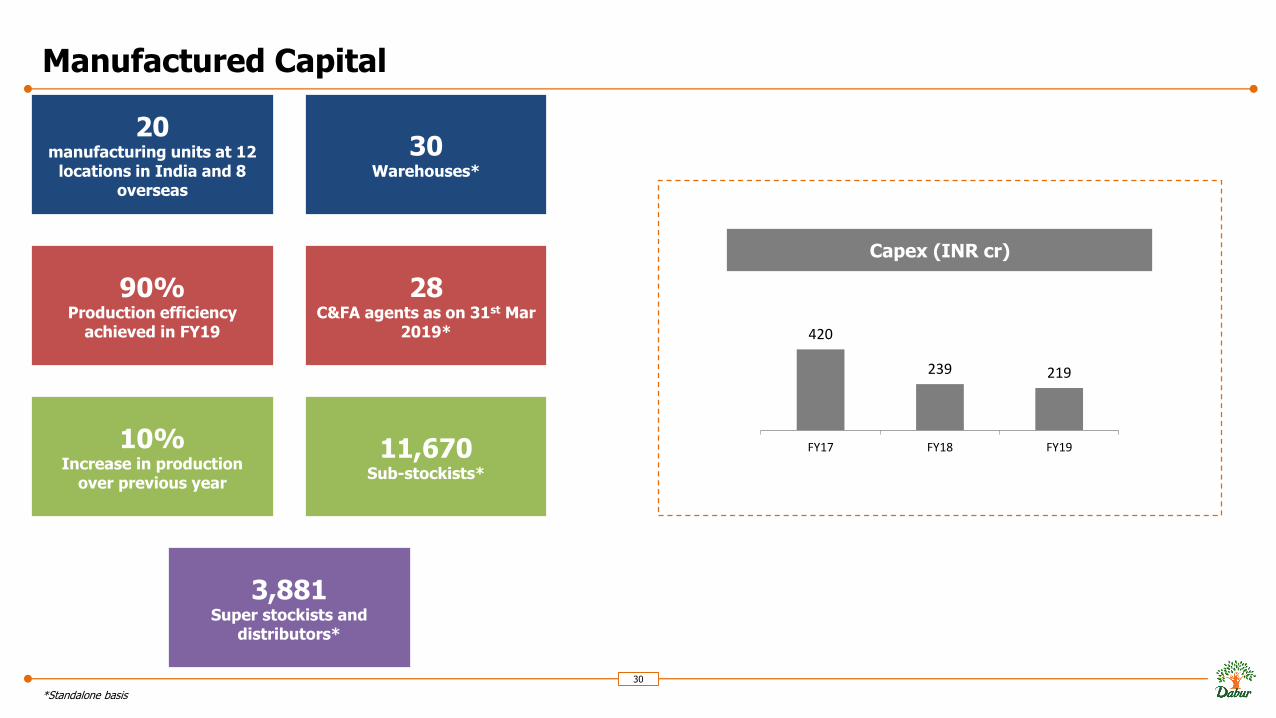
Manufactured Capital
30
*Standalone basis
20manufacturing units at 12
locations in India and 8 overseas
90%Production efficiency
achieved in FY19
10%Increase in production
over previous year
28C&FA agents as on 31st Mar
2019*
30Warehouses*
3,881Super stockists and
distributors*
11,670Sub-stockists*
420
239 219
FY17 FY18 FY19
Capex (INR cr)
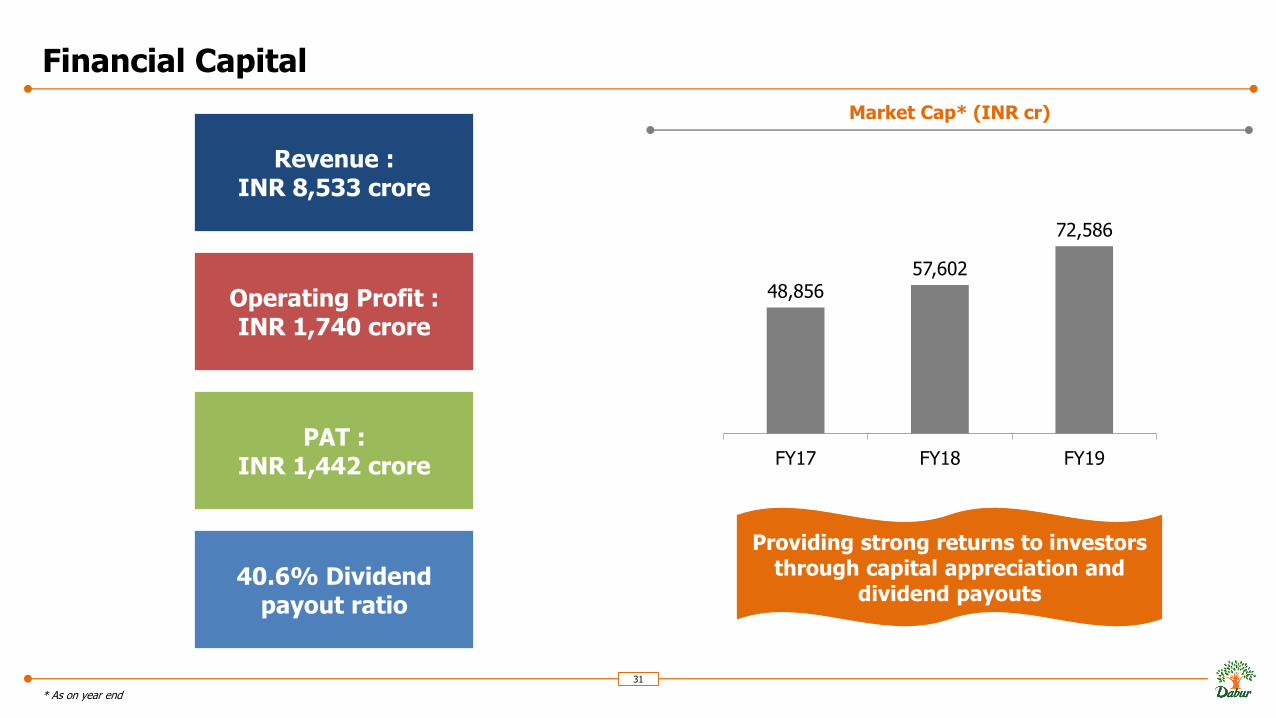
Financial Capital
31
* As on year end
Market Cap* (INR cr)
Revenue :INR 8,533 crore
Operating Profit :INR 1,740 crore
PAT :INR 1,442 crore
48,856 57,602
72,586
FY17 FY18 FY19
Providing strong returns to investors through capital appreciation and
dividend payouts40.6% Dividend
payout ratio
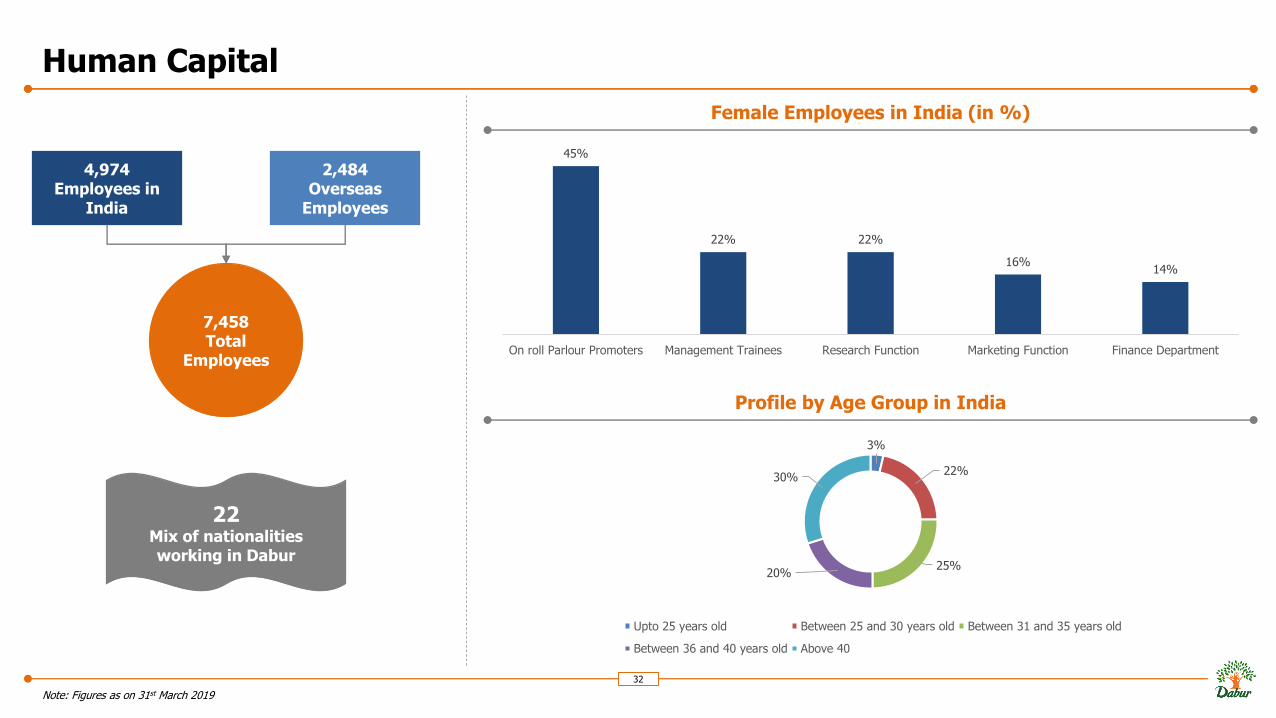
Human Capital
32
Note: Figures as on 31st March 2019
7,458Total
Employees
4,974Employees in
India
2,484Overseas
Employees
22Mix of nationalities working in Dabur
Female Employees in India (in %)
Profile by Age Group in India
3%
22%
25%20%
30%
Upto 25 years old Between 25 and 30 years old Between 31 and 35 years old
Between 36 and 40 years old Above 40
45%
22% 22%
16%14%
On roll Parlour Promoters Management Trainees Research Function Marketing Function Finance Department
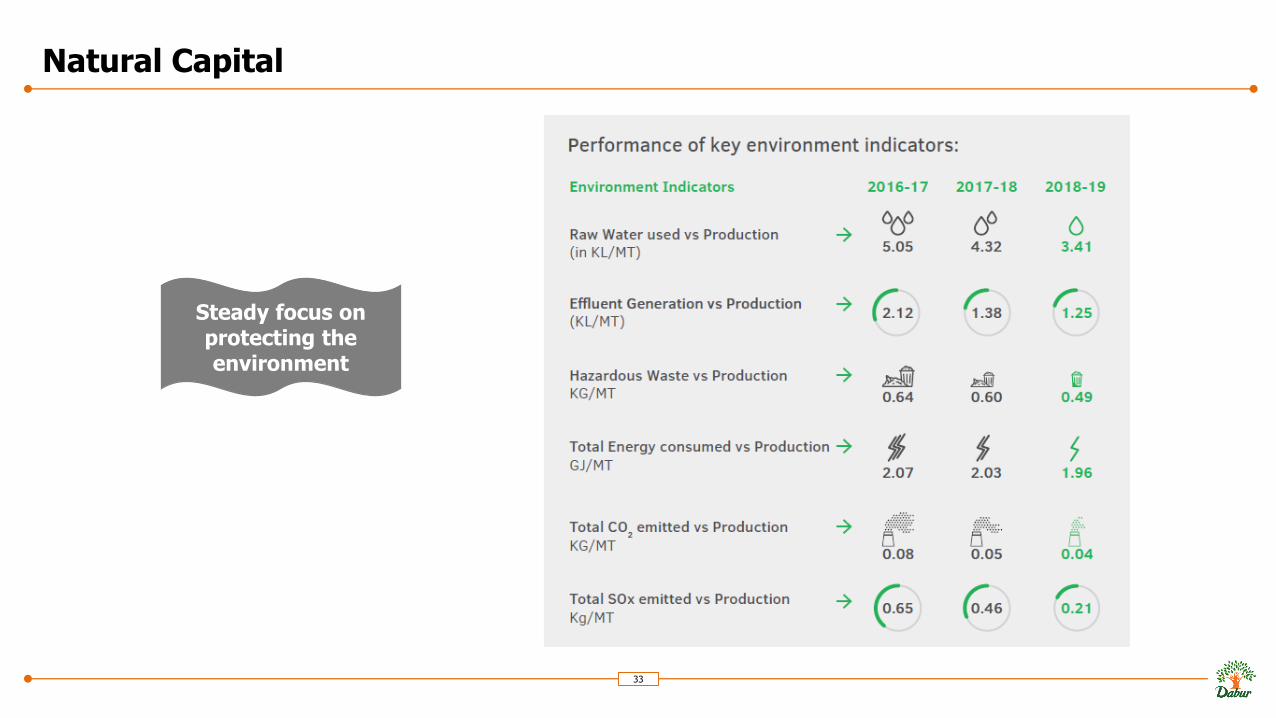
Natural Capital
33
Steady focus on protecting the environment

Natural Capital – Waste Recycling and Management
• Plastic Waste Management
➢ Have initiated different projects pan India in collaboration with different NGOs
and Central Pollution Control Board (CPCB) approved PROs (Producers
Responsible Organisations)
➢ Under our EPR activity, Dabur has collected ~4,000 tonnes of
postconsumer Plastic Waste with the help of around 5,000 local ragpickers
in 45 cities/Talukas of six major states & Union Territories
➢ Dabur is a registered brand-owner with CPCB since November 2018 and is
committed to collect different types of plastic waste
➢ Our efforts have helped divert plastic from landfills to
recycling/processing units, leading to mitigation of ~5,500 MT of CO2
emissions and saving of 97,000 GJ Energy.
34
Our Efforts The Outcomes
20%Plastic waste generated by Dabur
collected and processed/ recycled in FY19. This will be increased to 60% in
FY20 and 100% by FY21
2 MTE-waste disposed to the
approved e-waste recyclers in FY19
0.11 KG/ MT ↆ18% reduction in
hazardous waste generatedsince FY17
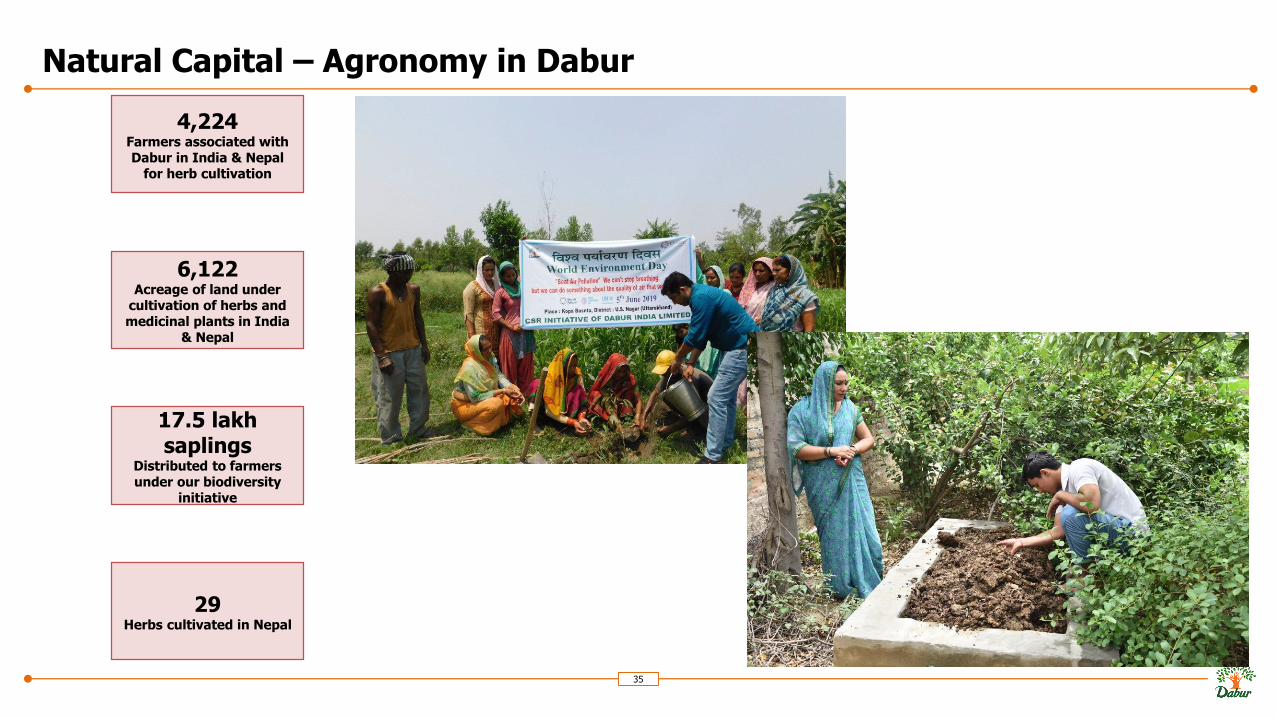
Natural Capital – Agronomy in Dabur
35
4,224Farmers associated with Dabur in India & Nepal
for herb cultivation
6,122Acreage of land under
cultivation of herbs and medicinal plants in India
& Nepal
17.5 lakh saplings
Distributed to farmers under our biodiversity
initiative
29Herbs cultivated in Nepal
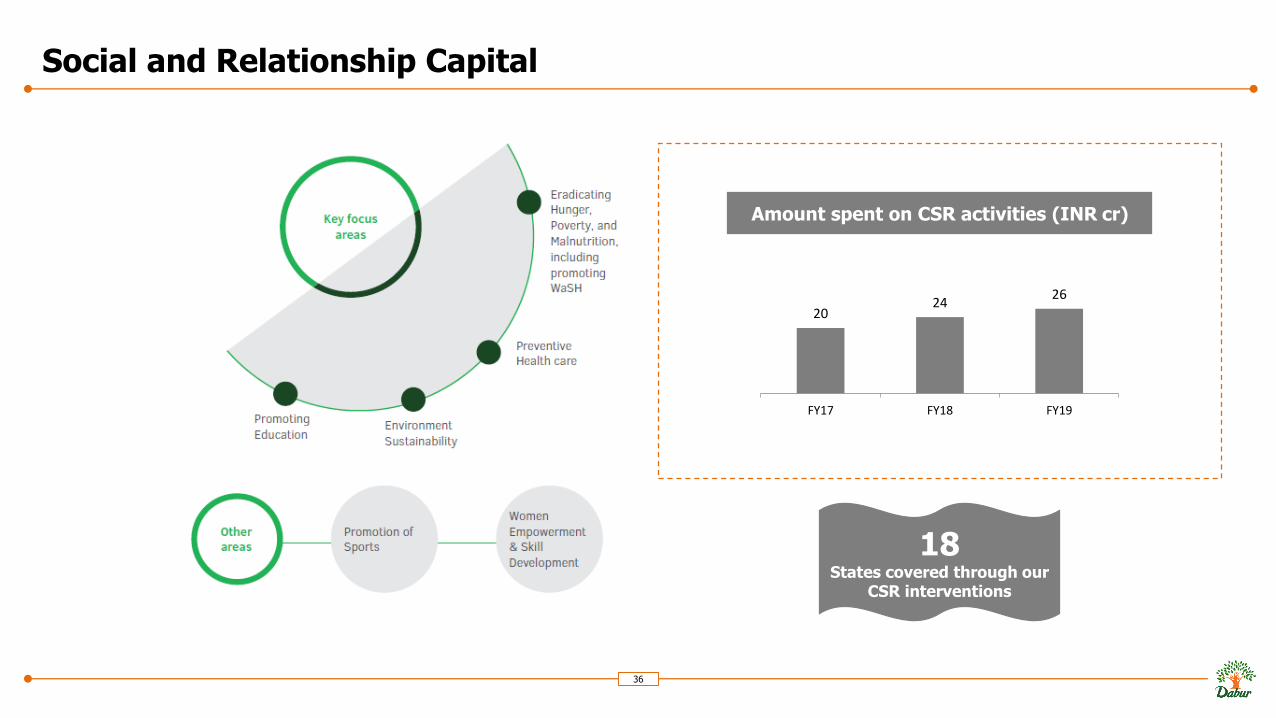
Social and Relationship Capital
36
20 24
26
FY17 FY18 FY19
Amount spent on CSR activities (INR cr)
18States covered through our
CSR interventions
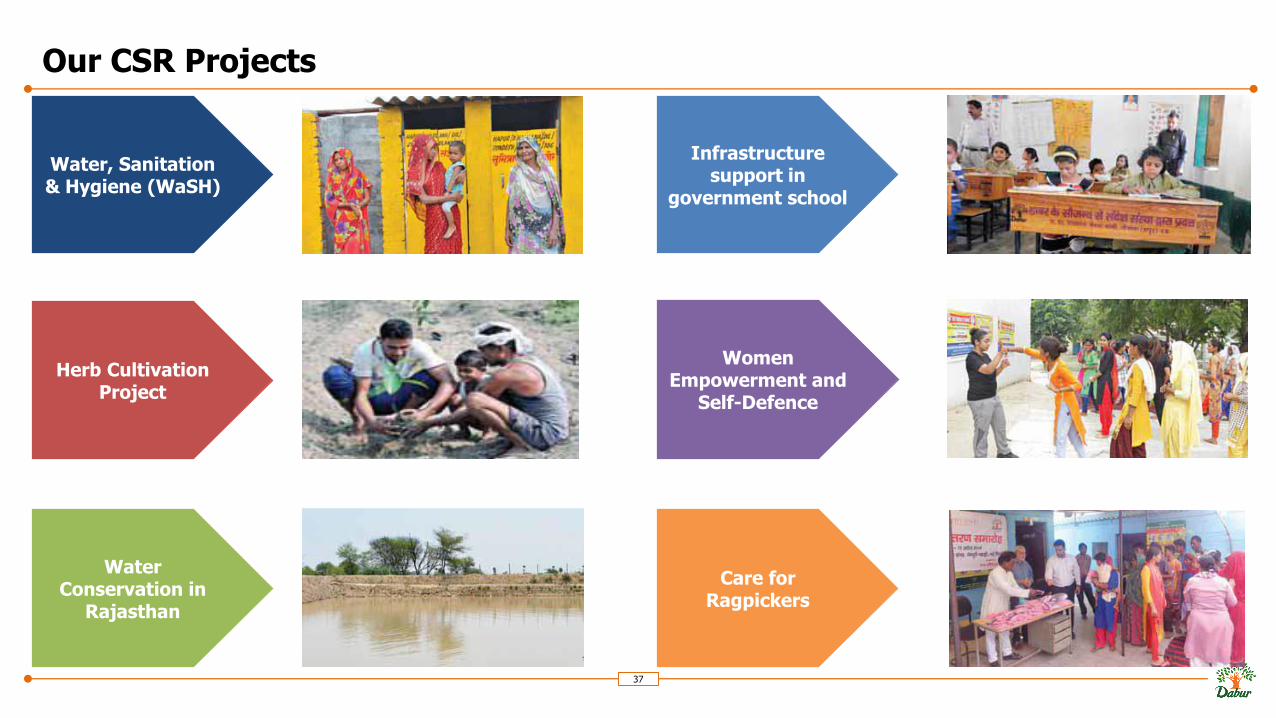
Our CSR Projects
37
Water, Sanitation & Hygiene (WaSH)
Herb Cultivation Project
Water Conservation in
Rajasthan
Infrastructure support in
government school
Women Empowerment and
Self-Defence
Care for Ragpickers
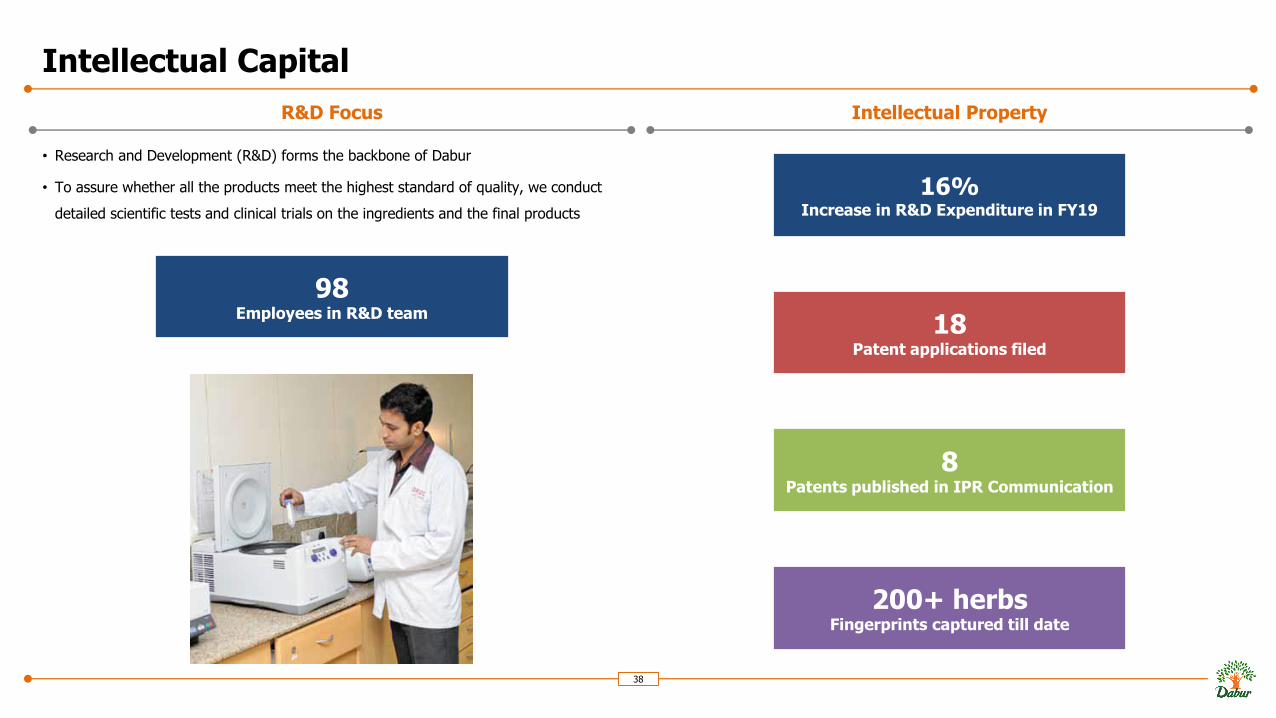
Intellectual Capital
• Research and Development (R&D) forms the backbone of Dabur
• To assure whether all the products meet the highest standard of quality, we conduct
detailed scientific tests and clinical trials on the ingredients and the final products
38
R&D Focus Intellectual Property
98Employees in R&D team
16%Increase in R&D Expenditure in FY19
18Patent applications filed
8Patents published in IPR Communication
200+ herbsFingerprints captured till date
Agenda
39
1. Dabur – Overview
2. Business Structure
3. India Business
4. International Business
5. The Way Forward
6. Our Capitals
7. Annexure
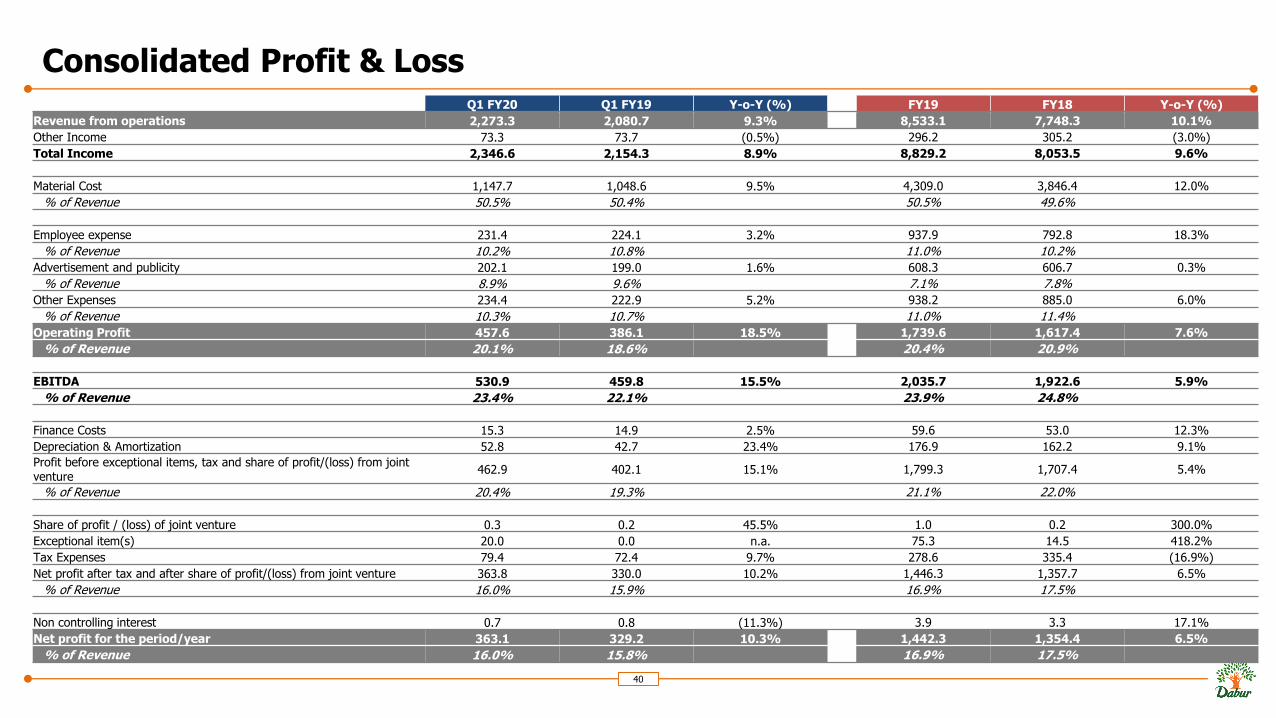
Consolidated Profit & Loss
40
Q1 FY20 Q1 FY19 Y-o-Y (%) FY19 FY18 Y-o-Y (%)
Revenue from operations 2,273.3 2,080.7 9.3% 8,533.1 7,748.3 10.1%
Other Income 73.3 73.7 (0.5%) 296.2 305.2 (3.0%)
Total Income 2,346.6 2,154.3 8.9% 8,829.2 8,053.5 9.6%
Material Cost 1,147.7 1,048.6 9.5% 4,309.0 3,846.4 12.0%
% of Revenue 50.5% 50.4% 50.5% 49.6%
Employee expense 231.4 224.1 3.2% 937.9 792.8 18.3%
% of Revenue 10.2% 10.8% 11.0% 10.2%
Advertisement and publicity 202.1 199.0 1.6% 608.3 606.7 0.3%
% of Revenue 8.9% 9.6% 7.1% 7.8%
Other Expenses 234.4 222.9 5.2% 938.2 885.0 6.0%
% of Revenue 10.3% 10.7% 11.0% 11.4%
Operating Profit 457.6 386.1 18.5% 1,739.6 1,617.4 7.6%
% of Revenue 20.1% 18.6% 20.4% 20.9%
EBITDA 530.9 459.8 15.5% 2,035.7 1,922.6 5.9%
% of Revenue 23.4% 22.1% 23.9% 24.8%
Finance Costs 15.3 14.9 2.5% 59.6 53.0 12.3%
Depreciation & Amortization 52.8 42.7 23.4% 176.9 162.2 9.1%
Profit before exceptional items, tax and share of profit/(loss) from joint venture
462.9 402.1 15.1% 1,799.3 1,707.4 5.4%
% of Revenue 20.4% 19.3% 21.1% 22.0%
Share of profit / (loss) of joint venture 0.3 0.2 45.5% 1.0 0.2 300.0%
Exceptional item(s) 20.0 0.0 n.a. 75.3 14.5 418.2%
Tax Expenses 79.4 72.4 9.7% 278.6 335.4 (16.9%)
Net profit after tax and after share of profit/(loss) from joint venture 363.8 330.0 10.2% 1,446.3 1,357.7 6.5%
% of Revenue 16.0% 15.9% 16.9% 17.5%
Non controlling interest 0.7 0.8 (11.3%) 3.9 3.3 17.1%
Net profit for the period/year 363.1 329.2 10.3% 1,442.3 1,354.4 6.5%
% of Revenue 16.0% 15.8% 16.9% 17.5%
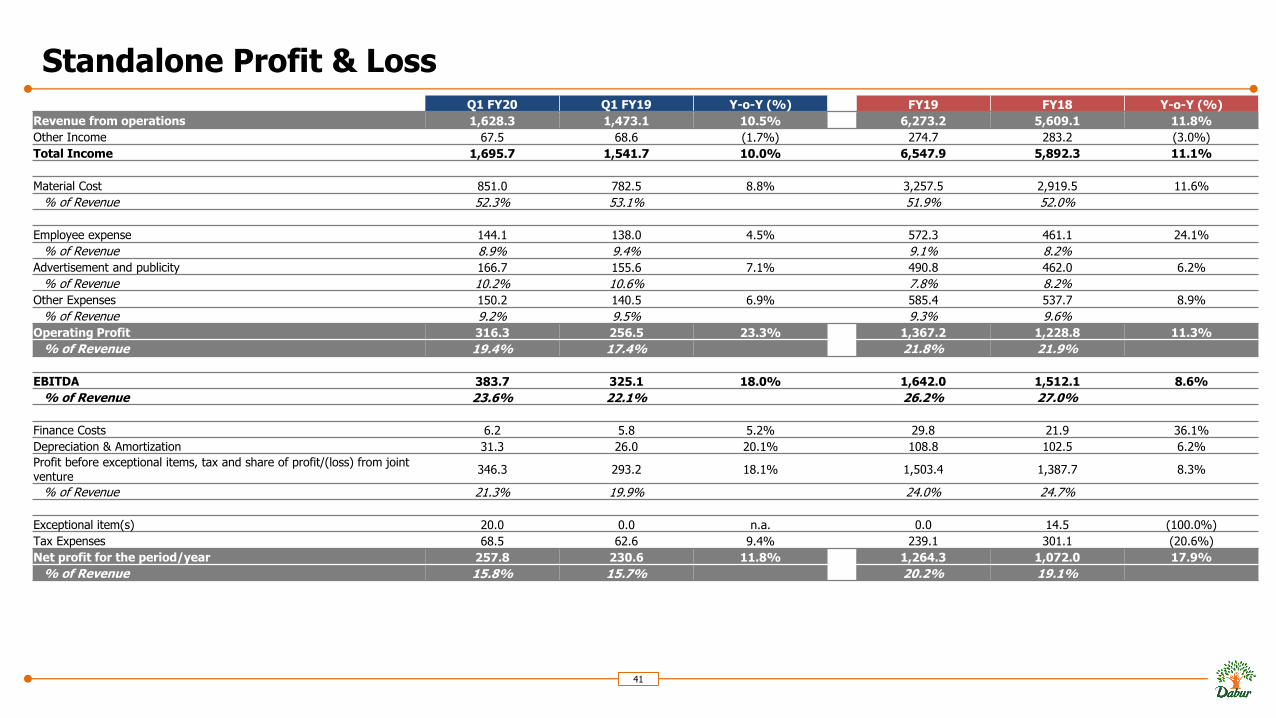
Standalone Profit & Loss
41
Q1 FY20 Q1 FY19 Y-o-Y (%) FY19 FY18 Y-o-Y (%)
Revenue from operations 1,628.3 1,473.1 10.5% 6,273.2 5,609.1 11.8%
Other Income 67.5 68.6 (1.7%) 274.7 283.2 (3.0%)
Total Income 1,695.7 1,541.7 10.0% 6,547.9 5,892.3 11.1%
Material Cost 851.0 782.5 8.8% 3,257.5 2,919.5 11.6%
% of Revenue 52.3% 53.1% 51.9% 52.0%
Employee expense 144.1 138.0 4.5% 572.3 461.1 24.1%
% of Revenue 8.9% 9.4% 9.1% 8.2%
Advertisement and publicity 166.7 155.6 7.1% 490.8 462.0 6.2%
% of Revenue 10.2% 10.6% 7.8% 8.2%
Other Expenses 150.2 140.5 6.9% 585.4 537.7 8.9%
% of Revenue 9.2% 9.5% 9.3% 9.6%
Operating Profit 316.3 256.5 23.3% 1,367.2 1,228.8 11.3%
% of Revenue 19.4% 17.4% 21.8% 21.9%
EBITDA 383.7 325.1 18.0% 1,642.0 1,512.1 8.6%
% of Revenue 23.6% 22.1% 26.2% 27.0%
Finance Costs 6.2 5.8 5.2% 29.8 21.9 36.1%
Depreciation & Amortization 31.3 26.0 20.1% 108.8 102.5 6.2%
Profit before exceptional items, tax and share of profit/(loss) from joint venture
346.3 293.2 18.1% 1,503.4 1,387.7 8.3%
% of Revenue 21.3% 19.9% 24.0% 24.7%
Exceptional item(s) 20.0 0.0 n.a. 0.0 14.5 (100.0%)
Tax Expenses 68.5 62.6 9.4% 239.1 301.1 (20.6%)
Net profit for the period/year 257.8 230.6 11.8% 1,264.3 1,072.0 17.9%
% of Revenue 15.8% 15.7% 20.2% 19.1%
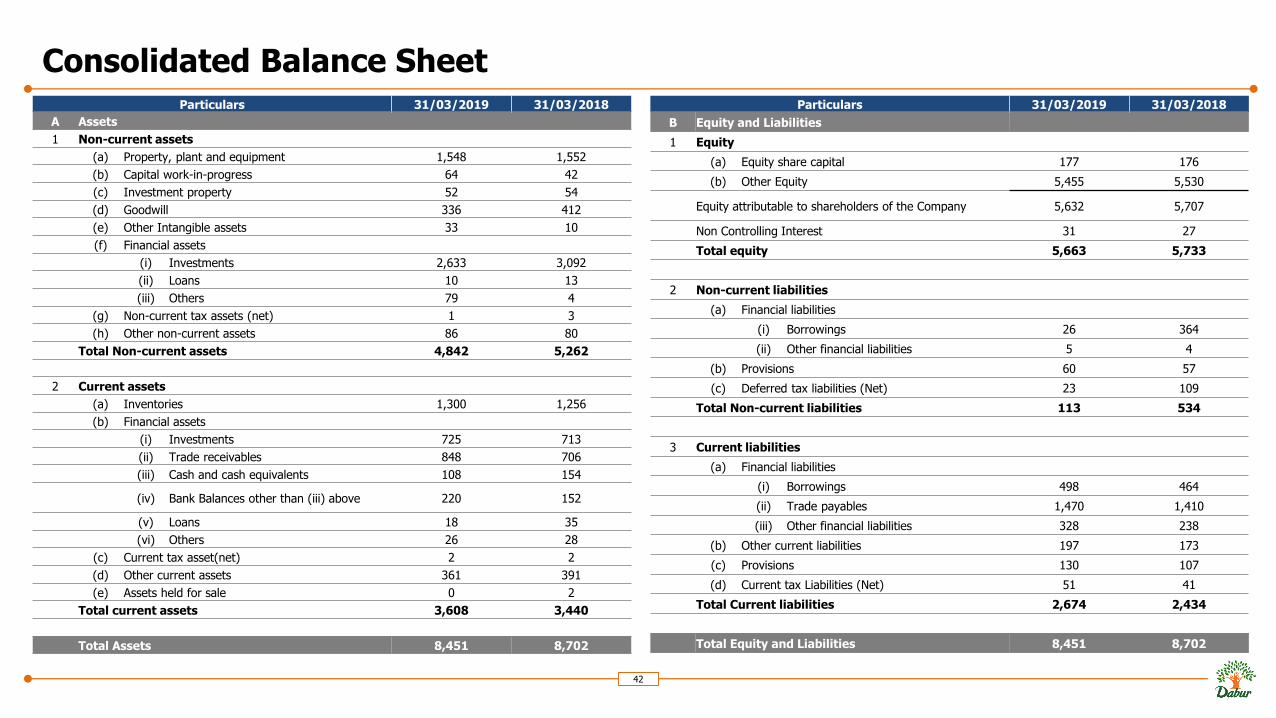
Consolidated Balance Sheet
42
Particulars 31/03/2019 31/03/2018
A Assets
1 Non-current assets
(a) Property, plant and equipment 1,548 1,552
(b) Capital work-in-progress 64 42
(c) Investment property 52 54
(d) Goodwill 336 412
(e) Other Intangible assets 33 10
(f) Financial assets
(i) Investments 2,633 3,092
(ii) Loans 10 13
(iii) Others 79 4
(g) Non-current tax assets (net) 1 3
(h) Other non-current assets 86 80
Total Non-current assets 4,842 5,262
2 Current assets
(a) Inventories 1,300 1,256
(b) Financial assets
(i) Investments 725 713
(ii) Trade receivables 848 706
(iii) Cash and cash equivalents 108 154
(iv) Bank Balances other than (iii) above 220 152
(v) Loans 18 35
(vi) Others 26 28
(c) Current tax asset(net) 2 2
(d) Other current assets 361 391
(e) Assets held for sale 0 2
Total current assets 3,608 3,440
Total Assets 8,451 8,702
Particulars 31/03/2019 31/03/2018
B Equity and Liabilities
1 Equity
(a) Equity share capital 177 176
(b) Other Equity 5,455 5,530
Equity attributable to shareholders of the Company 5,632 5,707
Non Controlling Interest 31 27
Total equity 5,663 5,733
2 Non-current liabilities
(a) Financial liabilities
(i) Borrowings 26 364
(ii) Other financial liabilities 5 4
(b) Provisions 60 57
(c) Deferred tax liabilities (Net) 23 109
Total Non-current liabilities 113 534
3 Current liabilities
(a) Financial liabilities
(i) Borrowings 498 464
(ii) Trade payables 1,470 1,410
(iii) Other financial liabilities 328 238
(b) Other current liabilities 197 173
(c) Provisions 130 107
(d) Current tax Liabilities (Net) 51 41
Total Current liabilities 2,674 2,434
Total Equity and Liabilities 8,451 8,702
For more information & updates,Contact:
Gagan Ahluwalia ([email protected])
Ankit Joshi ([email protected])