D4.2 OXERAM - Role of organic substances - TU Berlin · Eine Methode zur Bestimmung von Bromat...
77
Berlin, Germany 2013 © Copyright 2013 by TU Berlin. All rights including translation into other languages, reserved under the Universal Copyright Convention, the Berne Convention or the Protection of Literacy and Artistic Works, and the International and Pan American Copyright Conventions. Technische Universität Berlin Department of Water Quality Control Straße d. 17. Juni 135, 10623 Berlin, Germany http://www.wrh.tu-berlin.de/wrh/menue/fachgebiet_wasserreinhaltung/ REPORT Contract: 11245 UEP II Final version , Date: 21.08.2013 Role of organic substances in tertiary treatment via oxidation and membrane filtration Project acronym: OXERAM 2 by Manuel Godehardt, Geert Aschermann and Prof. Dr.-Ing. Martin Jekel Technische Universität Berlin Department of Water Quality Control Straße d. 17. Juni 135, 10623 Berlin, Germany Email: [email protected], Tel. ++49 (0)30-314-25368 for Kompetenzzentrum Wasser Berlin gGmbH Preparation of this report was financed through funds provided by Berliner Wasserbetriebe, Veolia Water and Berlin Environmental Relief Programme (ERP)
Transcript of D4.2 OXERAM - Role of organic substances - TU Berlin · Eine Methode zur Bestimmung von Bromat...

Berlin, Germany 2013
© Copyright 2013 by TU Berlin. All rights including translation into other languages, reserved under the Universal Copyright Convention, the Berne Convention or the Protection of Literacy and Artistic Works, and the International and Pan American Copyright Conventions.
Technische Universität Berlin Department of Water Quality Control Straße d. 17. Juni 135, 10623 Berlin, Germany http://www.wrh.tu-berlin.de/wrh/menue/fachgebiet_wasserreinhaltung/
REPORT
Contract: 11245 UEP II Final vers ion , Date: 21.08.2013
Role of organic substances in tertiary treatment
via oxidation and membrane filtration
Project acronym: OXERAM 2
by
Manuel Godehardt, Geert Aschermann and Prof. Dr.-Ing. Martin Jekel
Technische Universität Berlin
Department of Water Quality Control
Straße d. 17. Juni 135, 10623 Berlin, Germany
Email: [email protected], Tel. ++49 (0)30-314-25368
for
Kompetenzzentrum Wasser Berlin gGmbH
Preparation of this report was financed through funds provided by Berliner
Wasserbetriebe, Veolia Water and Berlin Environmental Relief Programme (ERP)


Colophon
I
Important Legal Notice Disclaimer: The information in this publication was considered technically sound by the consensus of persons engaged in the development and approval of the document at the time it was developed. TU Berlin disclaims liability to the full extent for any personal injury, property, or other damages of any nature whatsoever, whether special, indirect, consequential, or compensatory, directly or indirectly resulting from the publication, use of application, or reliance on this document. TU Berlin disclaims and makes no guaranty or warranty, expressed or implied, as to the accuracy or completeness of any information published herein. It is expressly pointed out that the information and results given in this publication may be out of date due to subsequent modifications. In addition, TU Berlin disclaims and makes no warranty that the information in this document will fulfill any of your particular purposes or needs. The disclaimer on hand neither seeks to restrict nor to exclude TU Berlin’s liability against all relevant national statutory provisions. Wichtiger rechtlicher Hinweis Haftungsausschluss: Die in dieser Publikation bereitgestellte Information wurde zum Zeitpunkt der Erstellung im Konsens mit den bei Entwicklung und Anfertigung des Dokumentes beteiligten Personen als technisch einwandfrei befunden. TU Berlin schließt vollumfänglich die Haftung für jegliche Personen-, Sach- oder sonstige Schäden aus, ungeachtet ob diese speziell, indirekt, nachfolgend oder kompensatorisch, mittelbar oder unmittelbar sind oder direkt oder indirekt von dieser Publikation, einer Anwendung oder dem Vertrauen in dieses Dokument herrühren. Die TU Berlin übernimmt keine Garantie und macht keine Zusicherungen ausdrücklicher oder stillschweigender Art bezüglich der Richtigkeit oder Vollständigkeit jeglicher Information hierin. Es wird ausdrücklich darauf hingewiesen, dass die in der Publikation gegebenen Informationen und Ergebnisse aufgrund nachfolgender Änderungen nicht mehr aktuell sein können. Weiterhin lehnt die TU Berlin die Haftung ab und übernimmt keine Garantie, dass die in diesem Dokument enthaltenen Informationen der Erfüllung Ihrer besonderen Zwecke oder Ansprüche dienlich sind. Mit der vorliegenden Haftungsausschlussklausel wird weder bezweckt, die Haftung der TU Berlin entgegen den einschlägigen nationalen Rechtsvorschriften einzuschränken noch sie in Fällen auszuschließen, in denen ein Ausschluss nach diesen Rechtsvorschriften nicht möglich ist.

Colophon
II
Colophon Present report was developed in compliance with the requirements of the quality management system DIN EN ISO 9001:2008
Title Role of organic substances in tertiary treatment via oxidation and membrane filtration – Final report OXERAM II
Authors Manuel Godehardt, FG Wasserreinhaltung, TU Berlin
Geert Aschermann, FG Wasserreinhaltung, TU Berlin
Martin Jekel, FG Wasserreinhaltung, TU Berlin
Quality Assurance Martin Jekel, FG Wasserreinhaltung, TU Berlin
Ulf Miehe, Kompetenzzentrum Wasser Berlin gGmbH
Publication / Dissemination approved by technical committee members: C. Bourdon, Veolia
A. Tazi-Pain, Veolia
C. Bartholomäus, Berliner Wasserbetriebe
R. Gnirß, Berliner Wasserbetriebe
A. Peter-Fröhlich, Berliner Wasserbetriebe
M. Jekel, FG Wasserreinhaltung, TU Berlin
A. Hartmann, Kompetenzzentrum Wasser Berlin gGmbH
Deliverable number D 4.2
Final version Date: 21.08.2013

Abstract (English)
III
Abstract (English)
In work package 4 the influence of different treatments (ozonation, coagulation) on
macromolecular organic substances (biopolymers) in secondary effluent and the effects on
subsequent ultrafiltration were investigated at lab-scale. Furthermore, fouling mechanisms
were intensively investigated and an analytical method was developed to observe the
formation of ozonation by-products.
Analyses with LC-OCD showed a significant reduction of major organic foulants
(biopolymers) for coagulation while ozonation appears to transform macromolecules into
compounds smaller than approx. 50 nm. With ultrafiltration tests (PES membranes) it could
be shown that coagulation is capable to reduce total fouling resistance to some extent and
additional ozonation can further enhance the membrane filtration process. However
ozonation as a pretreatment step caused more irreversible fouling. The lowest irreversible
fouling was achieved with coagulation. LC-OCD analyses showed that the transformation of
organic matter by ozonation is mainly responsible for the observed increased irreversible
fouling of ultrafiltration membranes. Tests with different membranes showed comparable
results for pretreated secondary effluent concerning total fouling resistance. Total fouling
resistance was reduced with additional ozonation compared to coagulation without
ozonation. In contrast to the observations with all tested UF membranes, for the tested
microfiltration membranes irreversible fouling was reduced with additional ozonation. In
general, the pore size seems to be strongly influencing irreversible fouling if ozonation is
used for pretreatment of membrane filtration.
Intensive investigations of fouling mechanisms using filtration laws identified cake filtration
as the dominant filtration process for coagulation while additional ozonation leads to
increased pore blocking/in pore fouling.
Experiments with secondary effluents from different sewage treatment plants in Berlin
showed comparable fouling behavior for all observed pretreatments. Thus membrane
filtration results generated with samples from WWTP Ruhleben seem to be transferable to
other WWTPs in Berlin.
MALDI-TOF-MS analyses of secondary effluent were not suitable to identify major organic
foulants, neither in solution nor on top of the membrane after filtration. Consequently,
MALDI-TOF-MS was primarily used for investigations of theoretical aspects of fouling by
using model fouling substances.
An analytical procedure for bromate was successfully developed with LC-MS/MS at TUB.
With the procedure it was possible to quantify samples up to a limit of quantification of
0.5 µg bromate per liter. Higher concentrations of bromate (> 10 µg/L) were produced only
at specific ozone consumptions higher than 0.9 mgO3/mgDOC0.

Abstract (Deutsch)
IV
Abstract (Deutsch)
Im Arbeitspaket 4 (AP4) wurde der Einfluss verschiedener Verfahrensschritte (Ozonung,
Flockung) auf makromolekulare organische Substanzen (Biopolymere) im Ablauf
kommunaler Kläranlagen und die Effekte auf eine nachgeschaltete Ultrafiltration in
Laborversuchen untersucht. Darüber hinaus wurden die auftretenden Foulingmechanismen
durch Modellrechnungen bestimmt und eine Analysemethode zur Bestimmung von
Oxidationsnebenprodukte entwickelt.
Mit Hilfe der LC-OCD Analytik konnte eine deutliche Entfernung der Biopolymere durch eine
Flockung festgestellt werden. Hingegen werden bei der Ozonung die Makromoleküle in
Stoffe kleiner als ~50 nm zerlegt. Durch Ultrafiltrationsexperimente mit Membranen aus
Polyethersulfon (PES) konnte gezeigt werden, dass eine Flockung vor der Filtration den
Gesamtfoulingwiderstand signifikant verringert und eine zusätzliche Ozonung die Filtrations-
eigenschaften weiter verbessert. Das geringste irreversible Fouling wurde durch eine
Flockung erreicht, währenddessen die Vorozonung verstärktes irreversibles Fouling
verursachte. Die LC-OCD Analyse zeigte, dass die Transformation der organischen
Makromoleküle hauptsächlich für das erhöhte irreversible Fouling der Ultrafiltrations-
membranen verantwortlich ist. Untersuchungen mit verschiedenen Niederdruckmembranen
zeigten vergleichbare Ergebnisse im Hinblick auf den Gesamtfoulingwiderstand. Durch die
Ozonung konnte der Gesamtfoulingwiderstand im Vergleich zur alleinigen Flockung stärker
reduziert werden. Im Gegensatz zu den Ultrafiltrationsmembranen wurde das irreversible
Fouling durch eine Ozonung bei der getesteten Mikrofiltrationsmembran zusätzlich
reduziert. Generell kann die Porengröße einer Membran als entscheidender Faktor für die
Vorozonung und das irreversible Fouling der Membranen gesehen werden.
Mit Hilfe von Modellrechnungen konnten die Foulingmechanismen näher beschrieben
werden. Nach der Flockung konnte eine Kuchenfiltration und bei zusätzlicher Ozonung eine
Porenverblockung bzw. In-Pore-Fouling als vorherrschender Foulingmechanismus ermittelt
werden.
Versuche mit Abläufen verschiedener Kläranlagen zeigten vergleichbare Filtrations-
eigenschaften durch die untersuchten Vorbehandlungsschritte. Folglich können die
Ergebnisse der umfassenden Experimente mit Proben aus der KA Ruhleben weitestgehend
auf die anderen Berliner Kläranlagen übertragen werden.
Mittels MALDI-TOF-MS konnten die organischen Makromoleküle weder in Lösung noch auf
der Membranoberfläche bestimmt werden. Folglich wurde das MALDI-TOF-MS
hauptsächlich zur Untersuchung theoretischer Aspekte des Foulings durch Einsatz von
Modellösungen verwendet.
Eine Methode zur Bestimmung von Bromat mittels LC-MS/MS wurde erfolgreich an der TU
Berlin entwickelt. Mit dieser Methode ist es möglich Bromat bis zu einer Bestimmungsgrenze
von 0,5 µg/L zu quantifizieren. Erhöhte Bromatkonzentrationen (>10 µg/L) wurden nur bei
spezifischen Ozondosen von mehr als 0,9 mgO3/mgDOC0 im Kläranlagenablauf gebildet.

Acknowledgments
V
Acknowledgments
The project team is grateful to BWB and Veolia for sponsoring and co-financing by Senate of
Berlin and the European union of the OXERAM II-project. We thank all involved persons at
the lab and research department (WRH) and the OXERAM team at KWB as well as the
technical committee for the valuable discussions and provided information.
Thank you!

Table of contents
VI
Table of contents
COLOFON II
ABSTRACT (ENGLISH) III
ABSTRACT (DEUTSCH) IV
ACKNOWLEDGMENTS V
TABLE OF CONTENTS VI
LIST OF FIGURES IX
LIST OF TABLES XI
ABBREVIATIONS & QUANTITIES XII
1 INTRODUCTION 1
1.1 Background 1
1.2 Aim of the project 2
2 EXPERIMENTAL 3
2.1 Water samples and pretreatment 3
2.1.1 Secondary effluent 3
2.1.2 Pretreatment of secondary effluent in the lab 3
2.1.3 Treated effluent samples from the pilot plant (Ruhleben) 4
2.1.4 Model solutions 4
2.2 Lab membrane filtration units 5
2.2.1 Type 1: Amicon® 5
2.2.2 Type 2: Semi-automatic Siemens® (Memcor) 6
2.2.3 Type 3: Inge® “PUE10” 8
2.2.4 Overview of the used membrane filtration units 9
2.3 Analyses 9
2.3.1 Bulk parameter 9
2.3.2 LC-OCD 10
2.3.3 Particle analyses with Nanoparticle Tracking Analysis (NTA) 12
2.3.4 Direct analysis of membranes with MALDI-TOF-MS 13
Table of contents
VII
2.4 Methods 14
2.4.1 Calculations for fouling analyses 14
2.4.2 Data evaluation 18
3 THE ROLE OF ORGANIC SUBSTANCES IN FOULING OF LOW PRESSURE MEMBRANES 19
3.1 Biopolymers as major organic foulants 19
3.2 Influence of different pretreatments on biopolymers 20
3.2.1 Ozonation 20
3.2.2 Biopolymer removal with coagulation 22
3.2.3 Ozonation with subsequent coagulation 23
3.3 Amicon® filtration tests 25
3.3.1 Influence of the pretreatment on membrane filtration 25
3.3.2 Treated effluent samples from the pilot 31
3.3.3 Further tests with different membranes 32
3.3.4 Fouling mechanisms 34
3.3.5 Character of the fouling layer 36
3.3.6 Comparison of different WWTP effluents 39
3.4 Siemens® Memcor 42
3.4.1 Setup 42
3.4.2 Results 42
3.4.3 Permeate filtration 44
3.5 Inge® “PUE10” 45
3.5.1 Setup 45
3.5.2 Results 46
4 FOULING ANALYSES WITH MALDI-TOF-MS 48
4.1 Setup 48
4.2 Results 49
5 OXIDATION BY-PRODUCTS 51
5.1 Bromate 51
5.1.1 Analytical setup 51
5.1.2 Bromate formation 52
5.1.3 Monitoring 53
5.2 N-Dimethylnitrosamine (NDMA) 54
5.2.1 NDMA formation 54
6 CONCLUSIONS 56

Table of contents
VIII
6.1 Influence of ozonation and coagulation on biopolymers as major organic foulants 56
6.2 Influence of the different pretreatments on low pressure membrane filtration 56
6.3 Fouling analyses with MALDI-TOF-MS 57
6.4 Formation of oxidation by-products 58
REFERENCES 59
APPENDIX I

List of figures
IX
List of figures
Figure 2.1: Schematic illustration of the Amicon® filtration unit............................................... 5
Figure 2.2: Flow scheme of semi-automatic Siemens® (Memcor) filtration unit ..................... 7
Figure 2.3: Flowchart of INGE® filtration unit ............................................................................ 8
Figure 2.4: Comparison of WWTP effluent LC-OCD chromatograms ...................................... 11
Figure 2.5: Membrane preparation on MALDI-TOF-MS target plate ....................................... 13
Figure 3.1: Exemplary LC-OCD chromatograms of secondary effluent and ultrafiltration
permeate and correlation between total fouling resistance and biopolymer
concentration ........................................................................................................ 20
Figure 3.2: Transformation of biopolymers for different ozone dosages ................................ 21
Figure 3.3: Transformation of the DOC by ozone with and without pre-filtration .................. 22
Figure 3.4: Removal of biopolymers and the DOC (without biopolymers) for different
coagulants and coagulant dosages ........................................................................ 23
Figure 3.5: Removal and transformation of biopolymers by different pretreatments ........... 24
Figure 3.6: Influence of coagulation on total and irreversible fouling resistance ................... 26
Figure 3.7: Influence of different pretreatments on total and irreversible fouling resistance 27
Figure 3.8: Boxplots of total and irreversible fouling resistance for different pretreatments 28
Figure 3.9: Rejection of biopolymers by ultrafiltration and permeate biopolymer
concentration for different pretreatments ........................................................... 29
Figure 3.10: Backwash water analyzes for ultrafiltration after different pretreatments ........ 30
Figure 3.11: Fouling resistance for water samples from different sampling points of the pilot
plant ....................................................................................................................... 32
Figure 3.12: Fouling resistance for different membranes and coagulation and ozonation with
subsequent coagulation as pretreatments ........................................................... 33
Figure 3.13: Filtration coefficient over filtration time for different pretreatments ................ 35
Figure 3.14: Fouling resistance for different pretreatment and different TMPs ..................... 36
Figure 3.15: Fouling layer characteristics for different pretreatments ................................... 37
Figure 3.16: Compressibility of the fouling layer and specific fouling resistance for different
pretreatments ....................................................................................................... 38
Figure 3.17: Biopolymer and particle concentrations of different WWTP effluents for
different pretreatments ........................................................................................ 40
Figure 3.18: Fouling characteristics of different WWTP effluents for different pretreatments
............................................................................................................................... 41

List of figures
X
Figure 3.19: Fouling resistance of the semi-automatic lab filtration unit (SIEMENS®) for
different pretreatments ........................................................................................ 43
Figure 3.20: Total and irreversible fouling resistance for filtration of Siemens Memcor
permeate samples ................................................................................................. 44
Figure 3.21: Exemplary LC-OCD chromatograms of MF and UF permeate samples for
different pretreatments ........................................................................................ 46
Figure 4.1: MALDI-TOF mass spectra of BSA on the membrane before backwash under the
presence of humic substance and without humic substances ............................. 49
Figure 5.1: Calibration of bromate in effluent and ultra pure water ....................................... 51
Figure 5.2: Formation of bromate in secondary effluent and surface water .......................... 52
Figure 5.3: Bromate formation during the experimental phase in the lab and at the pilot
plants for different ozone consumptions .............................................................. 53
Figure 5.4: Formation of NDMA at the pilot plant ................................................................... 54

List of tables
XI
List of tables
Table 2.1: Sampling points at the pilot plant ............................................................................. 4
Table 2.2: Membrane characteristics and corresponding TMPs for Amicon® filtration tests ... 6
Table 2.3: Summary of the experimental filtration units and corresponding operational
parameters .............................................................................................................. 9
Table 2.4: Retention time of biopolymers and selected organic molecule sizes for different
SEC columns ........................................................................................................... 12

Abbreviations & quantities
XII
Abbreviations & quantities
Abbreviations
AU area unit
BP biopolymer
DOC dissolved organic carbon
Fe iron
FeCl3 iron(III) trichloride
H2O water
LC liquid chromatography
LMH liter per square meter per hour
MW molecular weight
MWCO molecular weight cutoff
OCD organic carbon detection
OND organic nitrogen detection
PES polyethersulfone
PVDF polyvinylidene fluoride
R2 coefficient of determination
SEC size exclusion chromatography
SI international system of units
TMP trans-membrane pressure
Quantities
Greek symbols
α specific resistance [m · kg-1
]
α0 specific resistance at reference pressure [m · kg-1
]
αi specific resistance at pressure i [m · kg-1
]
Δp trans membrane pressure [N · m-2
]
Δpi trans membrane pressure i [N · m-2
]
κ conductivity [µS · cm-1
]
η dynamic viscosity [N · s · m-2
]
σ standard deviation
Latin symbols
A area [m2]
c concentration [mg · L-1
]
ci concentration in entity i [kg · m-3
]
cfeed concentration in feed [mg · L-1
]
cperm concentration in permeate [mg · L-1
]
dh hydrodynamic diameter [nm]
η dynamic viscosity [N · s · m-2
]
J flux [m · s-1
]
JM measured flux [m · s-1
]
J0 pure water flux [m · s-1
]

Abbreviations & quantities
XIII
JS standardized flux [m · s-1
]
k filtration coefficient, units depending on filtration exponent n
m mass [kg]
mi mass in entity i [kg]
M molecular weight, equivalent to Da (dalton) [g · mol-1
]
n filtration exponent, dimensionless
p pressure, also given in bar [105 · N · m
-2] [N · m
-2]
R resistance [m-1
]
Rm resistance by membrane [m-1
]
Rf,rev resistance by reversible fouling [m-1
]
Rf,irr resistance by irreversible fouling [m-1
]
s compressibility, dimensionless
t time [s]
T temperature [°C]
TM measured temperature [°C]
TS standardized temperature [°C]
V volume [L]
Vi volume of entity i [m3]
Z specific ozone consumption [mgO3/mgDOC0]

Introduction
1
1 Introduction
1.1 Background
There are especially two new regulations which lead to a new challenge for environmental
agencies and water disposal companies. One the one hand, the European Water Framework
Directive demands a “good” ecological and chemical status for all artificial and natural water
bodies. On the other hand, the European Bathing Water Framework specifies minimum
requirements for official bathing areas especially concerning their microbial status.
In particular, it is the discharge of treated waste water from municipal sewage plants which
has strong negative effects on the quality of surface waters and, thus, endangers the
sufficient implementation of these regulations. This leads to considerations of an upgrade of
municipal sewage plants with a tertiary treatment step in Berlin. This should improve
effluent quality and reduce negative impacts on surface waters. Concerning these new
challenges mentioned above the main goals of a possible tertiary treatment are the
reduction of phosphorus to avoid eutrophication and the disinfection to reduce microbial
contamination in the receiving water bodies.
To reach these goals there are, in general, different treatment processes available, which are
appropriate for tertiary treatment. One possibility is the implementation of a low pressure
membrane filtration system. Due to its pore size it is able to retain and reduce
microorganisms. In combination with a pre-flocculation it is also an appropriate process to
remove phosphorus.
One important weak point of this process is the fouling of the membrane which leads to a
lower efficiency, higher downtimes, higher operational costs and shorter lifetimes of the
membranes. Previous studies indicate that it is the fraction of so-called biopolymers which
are mainly relevant for fouling of secondary effluent [Haberkamp 2008; Zheng 2010].
Nevertheless, the effects of fouling are have not been investigated in a sufficient way so that
fouling is the main inhabitation of a stronger implementation of membrane systems.
Additionally to flocculation, pre-ozonation is another promising pretreatment step for
membrane processes. Previous studies indicated a reduction of fouling after such a
pretreatment [Genz et al. 2011; Van Geluwe et al. 2011] and an increase of filtration
efficiency.
At the same time, ozonation can cause high concentrations of harmful oxidation-by-products
like bromate or N-Nitrosodimethylamine (NDMA). Thus, there is a need for detailed and
comprehensive investigations of this possible pretreatment step.

Introduction
2
1.2 Aim of the project
A main objective of the OXERAM project is the comparison of different pretreatment and
filtration processes as tertiary treatment step in the sewage plant and the evaluation of their
ecological and economical impacts. Especially a possible implementation of a low pressure
membrane system should be investigated.
Besides pilot plant investigations at wastewater treatment plant Ruhleben, which are
implemented in work package 2, lab experiments and analyses at TU Berlin should be
conducted to get more precise information about the phenomenon of fouling and the
effects of different pretreatments. The main objectives of work package 4 include the
following main aspects and questions:
• Further identification and characterization of substances in secondary effluent
causing fouling during low pressure membrane filtration.
• Effects of pretreatment by flocculation, ozonation and flocculation with subsequent
ozonation on these substances.
• Effects of these pretreatment procedures on filtration performance of low pressure
membranes.
• Investigations on fouling mechanisms.
• Influence of membrane material and pore size on fouling and filtration performance.
Furthermore, work package 4 includes analyses and assessment of formation of oxidation-
by-products by ozonation of secondary effluent. In the following report results and
conclusions of the conducted investigations in work package 4 are presented.

Experimental
3
2 Experimental
2.1 Water samples and pretreatment
2.1.1 Secondary effluent
Secondary effluent samples were obtained from effluent of the wastewater treatment plant
(WWTP) Ruhleben, Berlin. The plant has a capacity of about 2.5 · 105 m
3/d (dry weather) and
is equipped with mechanical/biological treatment steps (sedimentation,
denitrification/nitrification and secondary sedimentation). In general, for each performed
experiment new secondary effluent water samples were collected from the WWTP at the
same day of the experiments. Before pretreatment/filtration experiments the samples were
tempered (18 – 22 °C) to have comparable conditions.
For comparison of different secondary effluents samples from four different wastewater
treatment plants in Berlin (Ruhleben; Muenchehofe; Wassmansdorf; Schoenerlinde) were
taken at the same time after 3 days of dry weather and used for these specific experiments.
2.1.2 Pretreatment of secondary effluent in the lab
Ozonation
The ozonation of the water in the lab was performed using an ozonation unit that produces
gaseous ozone from pure oxygen by an ozone generator from WEDECO (type Modular 8HC,
ITT WEDECO GmbH, Germany). The gaseous oxygen/ozone-mixture was directly introduced
into a 4-L-semi-batch stirred tank reactor filled with the water sample and stirred at
500 rpm. In-gas and off-gas ozone concentration, dissolved ozone and gas flow rate were
measured continuously and recorded by a computer. Ozone dosage/consumption of the
water samples was automatically calculated by the computer (mass balance of ozone) and
specific ozone consumption was calculated manually after dissolved organic carbon (DOC)
measurement.
Coagulation
Coagulation was performed according to DVGW worksheet W 218 (DVGW, 1998) in the
same 4-L stirred tank reactor as used for ozonation. The coagulant was introduced directly
into the batch and mixed for 10 seconds at 500 rpm (G = 1580 s-1
) followed by 5 min stirring
at 60 rpm (G = 70 s-1
).

Experimental
4
Pre-ozonation with subsequent coagulation
For combination of ozonation and coagulation the same 4-L stirred tank reactor was used.
Right after the ozonation process the coagulant was dosed direct into the reactor followed
by mixing according to DVGW worksheet W 218.
2.1.3 Treated effluent samples from the pilot plant (Ruhleben)
Besides ozonation and coagulation in the lab, pretreated samples from the pilot plant at the
WWTP Ruhleben were obtained for batch filtration experiments. In general, samples were
taken at different sampling points of the treatment process for further experiments in the
lab. Table 2.1 summarizes the sampling points at the pilot plant in Ruhleben.
Table 2.1: Sampling points at the pilot plant.
Sampling point Treatment
1 Pre-filtration (300 µm)
2 Ozonation
3 Coagulation
4 Ozonation with subsequent coagulation
5 Permeate after microfiltration
6 Permeate after ultrafiltration
Further details of the different treatment units (ozonation/coagulation unit and membrane
filtration pilots) you can find in the report of Johan Stueber (KWB; Deliverable 2.2).
2.1.4 Model solutions
Model solutions were prepared using as protein bovine serum albumin (BSA, MW ~67 kDa,
Sigma-Aldrich, USA) and as humic matter Suwannee River NOM from RO isolation
(International Humic Substances Society, USA). Concentrations of 5 mg/L (BSA) and 2 mg/L
(humic matter) were spiked into a salt solution that was made solving calcium dichloride
dihydrate (CaCl2 · 2 H2O) and sodium chloride (NaCl) in ultrapure water. Concentrations were
411 mg/L CaCl2 · 2 H2O and 316 mg/L NaCl, which resulted in a conductivity similar to the
one of effluent from the WWTP Ruhleben (∼ 1200 µS/cm). pH was adjusted before the
filtration using sodium hydroxide (NaOH) and/or hydrochloric acid (HCl) to 3 (pH < IEP
(isoelectronic point) of BSA) and 7 (pH > IEP of BSA).

Experimental
5
2.2 Lab membrane filtration units
2.2.1 Type 1: Amicon®
Setup
Figure 2.1 shows a scheme of the experimental setup used for Amicon® filtration tests. A
feed water reservoir (5) is pressurized using nitrogen (1). The outlet of the feed water tank is
connected to a filtration cell (6) with the membrane positioned at the bottom of the cell.
Permeate leaves the cell at its bottom, dripping into a beaker/bottle (7) on an electronic
scale (8). The scale is connected to a computer (9) that periodically (every 20 seconds)
records the weight on the scale. Flux can then be obtained by subtracting a value from its
successor. The model of the used filtration cell was Amicon® Stirred Cell 8200 (Millipore,
USA) with a volume of 200 mL and an effective filtration area of 2.87 · 10-3
m2.
Figure 2.1: Schematic illustration of the Amicon® filtration unit.
Procedure
All feed waters were adjusted to room temperature before starting an experiment (18 –
22 °C). A filtration cycle comprised filtration of 500 mL feed water, backwash with 50 mL
permeate and flux measurement with ~200 mL ultrapure water. The reference pressure for
filtration and backwash was 1 bar. For some filtration tests (compressibility tests, membrane
comparison, etc.) the pressure was modified for the different approaches.
1
23
4
5
6
7
9
1 Pressurized nitrogen bottle
2 Pressure regulator
3 Manometer
4 Valve
5 Feed water tank (V = 4L)
6 Cell with flat-sheet membrane (V = 200 mL)
7 Permeate tank
8 Electronic balance
9 Computer with weight-recording software
8

Experimental
6
Membranes
The membranes used in all Amicon® filtration tests were taken from flat sheets and stamped
using a custom die cutter fitted for the applied filtration cells. For storage the membranes
were stored at least 24 h in ultra pure water at < 6 °C and not longer than 14 days. All
membrane slices were rinsed with 2 L ultra pure water prior to any experiment to remove
production remainders. [Jermann et al. 2007; Zheng 2010]
The membrane type generally applied was UP 150 (MWCO of ~150 kDa, Microdyn Nadir
GmbH, Germany) made of hydrophilized polyethersulfone (PES). For membrane comparison
experiments further membranes were used. Some membrane types were not able to
operate at reference transmembrane pressure (TMP; 1 bar) so that the TMP had to be
modified. For all conducted experiments a backwash pressure of 1 bar was used. Table 2.2
summarizes the membranes and applied TMPs that were used in the Amicon® filtration
experiments.
Table 2.2: Membrane characteristics and corresponding TMPs for Amicon® filtration tests;
PES = polyethersulfone, PVDF = polyvinylidene fluoride; * = manufactors data, ** = calculated, *** = average
experimental data.
Parameter Unit UP150 MP005 UV150 MVT020
Membrane material [-] hydrophilized PES hydrophilized PES PVDF PVDF
MWCO* [kDa] 150 600 150 -
Pore size** [µm] 0.026 0.05 0.026 0.2
TMP [mbar] 1000 / 500 1000 / 500 1000 / 500 500
Permeability (20 °C)*** [L m-2
h-1
bar-1
] 930 1080 510 4200
2.2.2 Type 2: Semi-automatic Siemens® (Memcor)
Setup
A membrane unit for bench-scale filtration tests using outside-in polyvinylidene fluoride
(PVDF) hollow-fibre membranes (max. pore size = 100 nm) by Memcor (Memcor/Siemens®
Water Technologies, Windsor, NSW, Australia) developed by Haberkamp [2011] was
modified for dead-end filtration tests within this project. Figure 2.2 shows the flow scheme
of the semiautomatic membrane filtration unit.
The feed water tank is equipped with a static mixer (1) to avoid sedimentation of particulate
water constituents. An adjustable gear pump (2) operates as filtration pump and also as
backwash pump (produced permeate is used as backwash water). The membrane fibres are
potted into plexiglas mountings and fixed in a membrane module (4). The filtration plant
could be operated with one or optional with two membrane modules. The permeate flux
was continuously measured by an electronic balance (10).

Experimental
7
Figure 2.2: Flow scheme of semi-automatic Siemens® (Memcor) filtration unit.
Permeate (12) and backwash water (7) is collected separately in different beakers. Data
recording (temperature, pressure, flux) and operational control (valve and pump controlling)
is carried out by a computer (13) equipped with self programmed controlling software on
LabView basis. Temperature correction for flux measurement and calculation of filtration
resistance is done online additionally by the software.
Procedure
For all trials the same membrane fibres were used. Prior to each test, the membrane fibres
were chemically cleaned with sodium hypochlorite (5%) and rinsed afterwards with
ultrapure water. The cleaning procedure was repeated until the initial ultrapure water
permeability was reached to have comparable initial conditions. The initial permeate flux J0
of the membrane module was determined immediately before starting the test using
ultrapure water.
For all trials pretreated effluent from the pilot plant in Ruhleben was obtained (see chapter
2.1.3) on the day of the experiments. During the tests, the filtration cycles consisted of 1 L of
feed water filtration at a TMP of 0.5 bar, followed by 0.2 L of permeate backwashing at a
TMP of 1 bar.
FI
VALVE 1
VALVE 2
VALVE 3
VALVE 4
13
1 Feed tank with mixer (V = 50 L)
2 Gear pump
3 Thermometer
4 Membrane modules
5 Pressure gauge
6 Rotameter
7 Tank for backwash water
8 Backwash pressure gauge
9 Permeate buffer
10 Electronic scale
11 Hose pump
12 Permeate tank
13 Computer
1
2
3
4
56
7 8
9
10
11
12

Experimental
8
2.2.3 Type 3: Inge® “PUE10”
Within the “OXERAM II” project a lab/pilot membrane filtration unit was built up. The
filtration unit is nearly completely comparable to the UF membrane pilot plants at WWTP
Ruhleben according to operation, controlling software, membrane module, etc..The major
difference is the smaller membrane area of the used membrane modules resulting in lower
flow rates at comparable fluxes.
Setup
Figure 2.3 shows the flowchart of the filtration pilot plant (PUE10). The feed water tank (1,
V = 100 L) is equipped with a static mixer for continuous mixing of the feed water to avoid
sedimentation of particulate water constituents. A feed pump (2) supplies the membrane
module (4; A = 0.2 m2) with feed water. Permeate is collected in a separate permeate tank
(8; 15 L) for backwash carried out with a backwash pump (7).
Figure 2.3: Flowchart of INGE® filtration unit.
Besides hydraulic backwash the system is equipped for chemical enhanced backwash (CEB)
procedures. The chemical dosing systems (6) consists of different chemicals like NaOCl,
NaOH, HCl, and H2SO4, which can additionally be dosed into permeate before backwash.
Procedure
Two different membrane modules were tested during the experimental phase. Both
membranes are made of hydrophilized PES material and have different maximal pore sizes
(20 nm vs. 150 nm). Prior the filtration test the membrane modules were cleaned until the
initial pure water permeability was reached to have comparable start conditions. For all
trials pretreated effluent from the pilot plant in Ruhleben was obtained (see chapter 2.1.3)
on the day of the experiments.
Retentate
1 Feed tank with mixer (V = 100 L)
2 Feed pump
3 Filtration valves
4 Membrane module
1
2
3
34
3
5
5
6
7
8
5 Backwash valves
6 Chemicals for CEB
7 Backwash pump
8 Permeate tank (V = 15 L)

Experimental
9
All experiments were performed at a constant flux of 60 LMH (L*m-2
*h-1
). Each filtration
cycle consisted of 30 min filtration and mechanical backwash for 30 seconds with permeate
and a flux of 250 LMH. Alternating the filtration of the feed water was from the top followed
by the bottom.
2.2.4 Overview of the used membrane filtration units
The following Table 2.3 summarizes the used membrane filtration units and the
corresponding operational parameters.
Table 2.3: Summary of the experimental filtration units and corresponding operational parameters.
Parameter Unit AMICON®
SIEMENS®/MEMCOR INGE®
“Besenstil”
Configuration [-] flat sheet hollow fiber
(outside-in)
hollow fiber
(inside-out)
Operation [-] constant pressure
(1 bar)
constant pressure
(0.5 bar)
constant flux
(60 L*m-2
*h-1
)
Backwash [-] 1 bar 1 bar 250 L*m-2
*h-1
Flow regime [-] dead-end dead-end dead-end
Membrane module [-] AMICON®-cell self-made dizzer
Membrane area [m2] 2.87 · 10
-3 2 x 0.02 0.2
Application [-] lab-scale lab-scale lab/pilot-scale
Pretreatment [-] lab/pilot pilot pilot
2.3 Analyses
2.3.1 Bulk parameter
Turbidity, pH and temperature
For turbidity detection a Hach 2100N IS Turbidimeter (Hach Lange GmbH, Germany) was
used. Temperature and pH were measured using a pH 537 Microprocessor pH Meter (WTW
Wissenschaftlich-Technische Werkstätten GmbH, Germany).

Experimental
10
Suspended solids (SS)
Suspended solids were measured according to the standard weight method. The weight of
flushed and dried (105 °C) cellulose nitrate filters (Stedim Biotech GmbH, Germany; pore
size = 0.45 µm) was determined after conditioning at room temperature in the desiccator. A
defined volume of the sample was then filtered onto the filter. After repeating the drying
and conditioning protocol the filters were weight once again. Suspended solids were then
calculated by weight difference.
Pre-filtration and storage
After the determination of raw water characteristics water samples were pre-filtered by
0.45 µm (cellulose nitrate) prior to further analysis and stored at 4 °C until measurement.
Dissolved organic carbon (DOC)
DOC was measured using a thermal catalytic oxidation followed by infrared (IR) detection of
carbon dioxide. The device in use was a Vario TOC CUBE (Elementar Analysensysteme GmbH,
Germany). The method purges inorganic carbon out of the previously acidified (80 µL of
3-molar HCl) sample. The remaining organic carbon is then combusted (catalyzed-oxidized)
and can be referred to as DOC because the sample was pre-filtered by 0.45 µm. DOC of any
sample was measured in triplicate.
Ultraviolet (UV) absorption
UV absorption at 254 and 436 nm of water samples (0.45 µm pre-filtered) was analyzed
using a UV-vis spectrometer Lambda 12 (Perkin-Elmer, USA), using quartz Spurasil 10 mm
cuvettes (Type No. 100-QS, Hellma GmbH & Co. KG, Germany). All measurements were done
in triplicate.
2.3.2 LC-OCD
Water sample constituent fractionation and analysis were conducted using a liquid
chromatography (LC) with a size exclusion chromatography column (SEC,
HW50S/HW55S/HW65S, Alltech-GROM GmbH, Germany), followed by a detector for
ultraviolet absorption at 254 nm (UV, Smartline UV Detector 200, Knauer, Germany), and a
Grätzel thin-film reactor for dissolved organic carbon oxidation, with a subsequent infrared
detector for carbon dioxide (Ultramat 6, Siemens, Germany). Parts of the sample are sent to
a nitrogen oxidation reactor, followed by a UV detector for nitrate (WellChrom K2001 Filter
Photometer with 220 nm filter, Knauer, Germany), without entering the Gräntzel reactor. In
addition to the chromatographic separation, a part of the water sample is directly sent to
the detector, bypassing the chromatography column to measure dissolved organic carbon
Experimental
11
(DOC), UV and dissolved organic nitrogen (DON) of the full sample. Samples were 0.45 µm
pre-filtered and diluted (in general 1:4) with ultra pure water to obtain DOC concentrations
in the range of 2 – 5 mg/L.
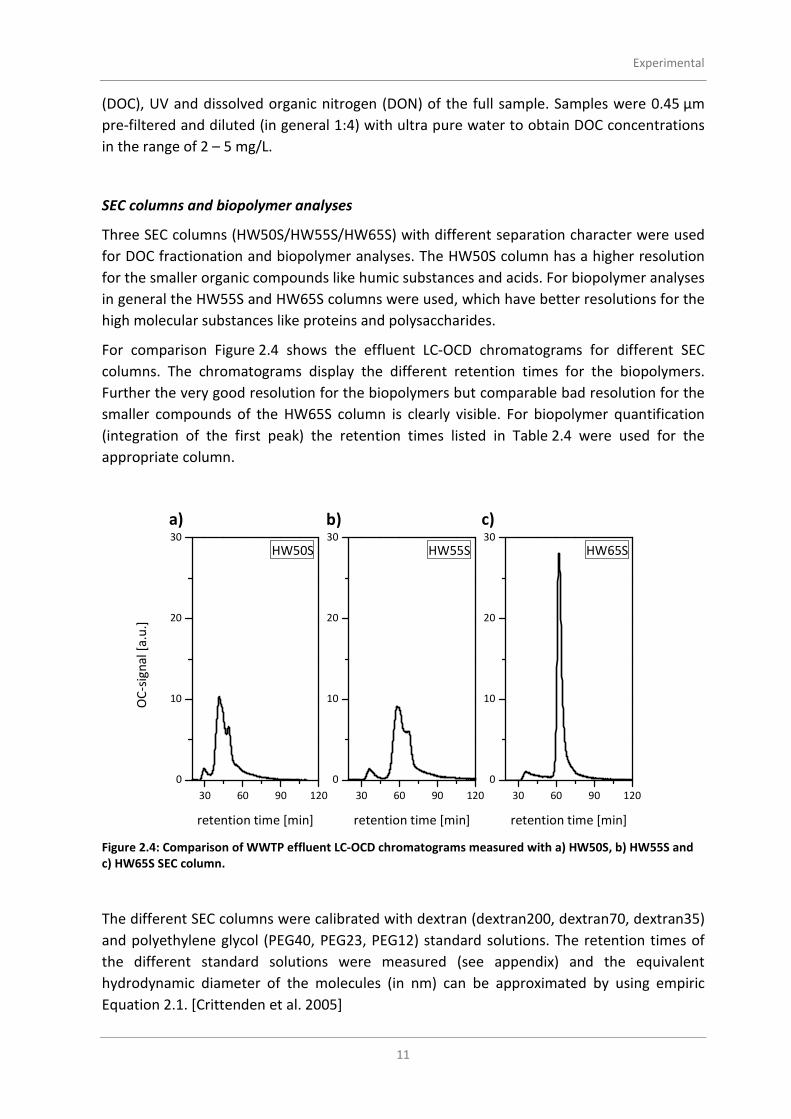
SEC columns and biopolymer analyses
Three SEC columns (HW50S/HW55S/HW65S) with different separation character were used
for DOC fractionation and biopolymer analyses. The HW50S column has a higher resolution
for the smaller organic compounds like humic substances and acids. For biopolymer analyses
in general the HW55S and HW65S columns were used, which have better resolutions for the
high molecular substances like proteins and polysaccharides.
For comparison Figure 2.4 shows the effluent LC-OCD chromatograms for different SEC
columns. The chromatograms display the different retention times for the biopolymers.
Further the very good resolution for the biopolymers but comparable bad resolution for the
smaller compounds of the HW65S column is clearly visible. For biopolymer quantification
(integration of the first peak) the retention times listed in Table 2.4 were used for the
appropriate column.
Figure 2.4: Comparison of WWTP effluent LC-OCD chromatograms measured with a) HW50S, b) HW55S and
c) HW65S SEC column.
The different SEC columns were calibrated with dextran (dextran200, dextran70, dextran35)
and polyethylene glycol (PEG40, PEG23, PEG12) standard solutions. The retention times of
the different standard solutions were measured (see appendix) and the equivalent
hydrodynamic diameter of the molecules (in nm) can be approximated by using empiric
Equation 2.1. [Crittenden et al. 2005]
30 60 90 120
0
10
20
30
30 60 90 120
0
10
20
30
30 60 90 120
0
10
20
30
OC
-sig
na
l [a
.u.]
retention time [min]
HW50S
retention time [min]
HW55S
c)
retention time [min]
HW65S
a) b)

Experimental
12
46.0
h M11.0d ⋅= Equation 2.1
where
dh = hydrodynamic diameter of dextran molecule [nm]
M = molar mass [g · mol-1
]
The following Table 2.4 summarizes the retention times for biopolymers and respective
molecule sizes for the used SEC columns.
Table 2.4: Retention time of biopolymers and selected organic
molecule sizes for different SEC columns.
SEC
column
Retention time
for biopolymers
[min]
Retention time for different molecule sizes [min]
30 nm 20 nm 15 nm 10 nm
HW50S 25 - 35 30.5 31.0 34.0 38.0
HW55S 30 - 50 40.0 42.5 45.0 51.0
HW65S 30 - 60 50.0 53.0 54.5 57.0
2.3.3 Particle analyses with Nanoparticle Tracking Analysis (NTA)
The method applied for submicron particle measurement is Nanoparticle Tracking Analysis
(NTA) with the Nanosight NS500 (UK). It uses a laser light source to illuminate nano-scale
particles. Particles appear individually as point-scatters, moving under Brownian motion. The
motion is visualized via a microscope objective with 20-fold magnification mounted on a
camera. 500 µl of sample of suitable concentration (107 – 10
10 particles/mL) are introduced
into the viewing unit by a peristaltic pump. After capturing a video of the sample, the
average distance covered by each particle is automatically calculated by image analysis
software and, knowing the temperature and viscosity of the sample, the hydrodynamic
diameter is calculated by the program.
Pre-filtration (5 µm) of the sample is necessary to remove larger particles, otherwise they
would disturb the measurement of submicron particles (below 1 µm).

Experimental
13
2.3.4 Direct analysis of membranes with MALDI-TOF-MS
The analysis of membranes after filtration of model solution was done with
matrix-assisted-laser-desorption-ionization time-of-flight mass-spectrometry
(MALDI-TOF-MS) after preparation of the membranes direct on the MALDI-TOF-MS target
plate.
Preparation method
The MALDI-TOF-MS preparation method used in this work is a modification of the dried
droplet method introduced by Karas and Hillenkamp [1988] and the so-called redissolution
sample preparation method developed by Leize et al. [1999]. Similar methods have been
used by Chan et al. [2002] and Petrus et al. [2008].
3,5-Dimethoxy-4-hydroxycinnamic acid (Fluka, Switzerland), also referred to as sinapinic acid
(SA), was used as matrix, oversaturated in a 1:2 mixture of acetonitrile (Fisher, USA) and
0.1 % trifluoroacetic acid (Merck, Germany). SA was stored in vials at -18 ℃. On the day of
the preparation, it was defrosted at room temperature and thoroughly vortexed.
Before MALDI-TOF-MS analysis, the membranes have to be stored for conditioning after
filtration in a desiccator for at least 12 h. SA was then pipetted on the membrane in 2 µL
spots; six spots were placed in a row. After crystallization at room temperature the
membrane was cut with a scalpel and fixed with adhesive tape on the MALDI-TOF-MS target
plate. Figure 2.5 shows the preparation of the membrane on the MALDI-TOF-MS target
plate.
Figure 2.5: Membrane preparation on MALDI-TOF-MS target plate.
MALDI-TOF-MS
After preparation of the membranes on the target plate they were analyzed with a MALDI-
TOF-MS. The MALDI-TOF-MS used was an autoflex III smartbeam (Bruker Daltonics, USA)
equipped with an additional HM2 high mass detector (CovalX AG, Switzerland). The device
operates with a neodymium-doped yttrium aluminum garnet (Nd:YAG) laser emitting a
wavelength of 355 nm for desorption-ionization process [Holle et al. 2006]. Detection was

Experimental
14
done in positive-ion and linear TOF mode. Laser power of 55 % was selected for all
experiments. Analysis of the membrane and acquisition of the mass spectra were carried out
using flexControl software version 3.0 (Bruker Daltonics, USA).
Via a built-in camera, the crystallized spots on the membrane could be observed. The laser
was operated manually to identify sweet spots with ideal crystallization and the sample was
shot at 1000 times with a frequency of 100 Hz. This was done several times on all spots, and
in each case the spectra with the highest intensities were selected for further evaluation.
2.4 Methods
2.4.1 Calculations for fouling analyses
Flux
Flux through the membrane is dependent on TMP, viscosity of solvent (water in the case of
water treatment) and resistance of filtration. It can be derived from the Darcy-Law, written
in the form of Equation 2.2. [Haberkamp 2008; Zheng 2010]
R
p∆J
⋅η= Equation 2.2
where
J = flux [m3 · m
-2 · s
-1] or [m · s
-1]
Δp = TMP [N · m-2
] or [Pa]
η = dynamic viscosity of solvent [N · s · m-2
]
R = resistance of filtration [m-1
]
Permeability of a membrane is flux per pressure. The dynamic viscosity of water at a given
temperature can be calculated with the empirical Equation 2.3. [Roorda 2004; Haberkamp
2008; Zheng 2010]
( ) 5.15.42T
497.0
+=η Equation 2.3
where
η = dynamic viscosity of solvent [N · s · m-2
]
T = given temperature of water [°C]

Experimental
15
The flux was measured with an electronic scale (Amicon® and Siemens®) or with a flowmeter
(Inge®). Viscosity of water affects flux and itself is affected by temperature. Therefore the
empirical formula in Equation 2.4 was applied to correct flux to 20 °C. [Crittenden et al.
2005]
( ) MS TT
MS 03.1JJ−
= Equation 2.4
where
JS = standardized Flux [m · s-1
]
JM = measured Flux [m · s-1
]
TS = standard Temperature [°C], 20 °C in the current case
TM = measured Temperature [°C]
Resistance
Resistance is defined as the counteracting of the membrane and the fouling against feed
water flux. Total resistance includes membrane resistance, reversible fouling resistance and
irreversible fouling resistance and was calculated according to Darcy´s law (see
Equation 2.2).
Total fouling resistance occurs at the end of a filtration cycle, when the initial membrane
resistance (determined by filtration of pure water through the clean membrane) is
subtracted. It encompasses reversible and irreversible fouling resistance; they are measured
by determination of pure water flux after backwashing: Irreversible fouling resistance is the
remainder of total fouling resistance after backwashing the membrane; accordingly it
describes resistance of fouling that is irreversibly attached to the membrane.
Rejection
Rejection was calculated for biopolymers and represents the part of biopolymers that are
removed from the feed water by the membrane during filtration. It is expressed as the
difference between biopolymer concentrations of feed water and permeate, divided by feed
water concentration, see Equation 2.5.
feed
perm
feed
permfeed
c
c1
c
ccR −=
−= Equation 2.5
where
R = rejection
cfeed = concentration of substance in feed [mg · L-1
]
cperm = concentration of substance in permeate [mg · L-1
]

Experimental
16
Specific resistance
Specific resistance is a measure for resistance per mass of foulant and area in the fouling
layer on the membrane. Dry mass of foulants in the fouling layer can be calculated using a
mass balance of feed water foulant inflow, permeate foulant outflow and retentate foulant
concentration, according to Equation 2.6. In the present study, the mass of the biopolymer
fraction and the suspended solids (SS) will be accounted for in the calculation of specific
resistance.
rrppffrpfl VcVcVcmmmm ⋅−⋅−⋅=−−= Equation 2.6
where
mi = dry mass of foulants in entity i [kg]
ci = foulant concentration in entity i [kg · m-3
]
Vi = volume of entity i [m3]
indices: l: layer (fouling layer), f: feed water, p: permeate, r: retentate
Fouling resistance of the gel/cake layer can be calculated using Equation 2.7:
A
mαR
⋅= Equation 2.7
where
R = resistance of the fouling layer [m-1
]
α = specific fouling resistance at experiment pressure [m · kg-1
]
m = mass of dry foulants in the fouling layer [kg]
A = membrane filtration area [m2]
Note that this parameter can be calculated if the mass of foulants of feed, permeate and
retentate are known. Thus it depends on the measurement used for foulant determination.
Specific resistance is thus barely comparable between studies that apply different methods
for foulant detection which are not comparable.
Compressibility
Equation 2.7 can be solved for specific resistance α, since resistance of the fouling layer (R),
dry mass of foulants in the fouling layer (m), and membrane filtration area (A) are
determinable parameters. Specific fouling resistance is a measure of resistance of the fouling
layer per unit of mass and unit of area.

Experimental
17
At a given pressure it can be calculated according to Equation 2.8:
sp∆0
⋅α=α Equation 2.8
where
α = specific fouling resistance at given pressure [m · kg-1
]
α0 = specific fouling resistance at reference pressure [m · kg-1
]
Δp = TMP [N · m-2
] (unit omitted when raised to the power of s)
s = compressibility, dimensionless
Influence of pressure difference is rising with compressibility s. As specific resistance is
determinable at different operating pressures and pressure difference results from these,
compressibility can be calculated using Equation 2.9:
010110
010110
p∆logp∆log
loglogs
−
α−α= Equation 2.9
where
s = compressibility, dimensionless
αi = specific fouling resistance at TMP i [m · kg-1
]
Δpi = TMP i [N · m-2
] (unit omitted when logarithmized)
Note that compressibility calculation relies on specific resistance. The latter is not
comparable between studies that use different methods of foulant detection.
Fouling mechanisms
For constant pressure filtration in dead-end mode fouling mechanisms could be analyzed
according to the filtration blocking laws postulated by [Hermia 1982]. He demonstrated that
different fouling mechanisms can be assessed by Equation 2.10:
ϕ
⋅=
Vd
tdk
Vd
td2
2
Equation 2.10
where
t = time [s]
V = volume [L]
k = filtration coefficient
φ = filtration exponent, dimensionless

Experimental
18
The time and the associated volume increase were recorded by the flux analyzing software.
The recorded time difference (dt) was divided by the corresponding volume increase (dV) for
subsequent pairs. This results in the terms dt/dV, which were subtracted and divided by the
appropriate volume increase dV. The terms dt/dV and d2t/dV
2 were logarithmized to the
basis 10 and could be plotted on abscissa and ordinate, respectively. The resulting slope of
the curve is expressed by the filtration exponent φ representing the predominant fouling
mechanism:
• φ = 2.0: complete pore blocking
• φ = 1.5: pore narrowing, pore constriction
• φ = 1.0: pore sealing with superposition (intermediate blocking)
• φ = 0.0: cake filtration
The change of the slope during ongoing filtration accounts for different mechanisms with
changing time. Additionally, there always is an overlapping of different mechanisms.
2.4.2 Data evaluation
LC-OCD
LC-OCD measurement data were analyzed using the software Fiffikus/ChromCalc (DOC-Labor
Dr. Huber, Germany) and the different DOC fractions were quantified by manually
integration. Plotting of chromatograms was done after baseline subtraction and
normalization with OriginPro 8.5 software (OriginLab Corporation, USA).
MALDI-TOF spectra
The spectra were analyzed and background-substracted using flexAnalysis software (Bruker
Daltonics, USA). For further processing of the spectra, OriginPro 8.5 was used. The mass
spectra were smoothed by a Savitzky-Golay algorithm [Savitzky et al. 1964].

The role of organic substances in fouling of low pressure membranes
19
3 The role of organic substances in fouling
of low pressure membranes
3.1 Biopolymers as major organic foulants
In previous studies the impact of organic substances in fouling processes of UF membranes
was intensively investigated. Haberkamp [2008], Zheng [2010] and Tian et al. [2013] studied
the strong role of biopolymers in the process of fouling. Especially Zheng [2010] showed a
significant impact of biopolymers in secondary effluent on UF performance by illustrating
high total fouling resistance of this fraction. In comparison, the proportion of larger colloids
(> 0.45 µm) and particles (> 1.2 µm) as well as smaller compounds (smaller than the pore
size of the membrane) on total fouling resistance is lower. Further he showed that lower
biopolymer concentrations result in lower total fouling resistances. Thus, a removal of
biopolymers can affect improved UF performance.
Biopolymer fouling
The conducted experiments within the OXERAM II project certify the results of Haberkamp
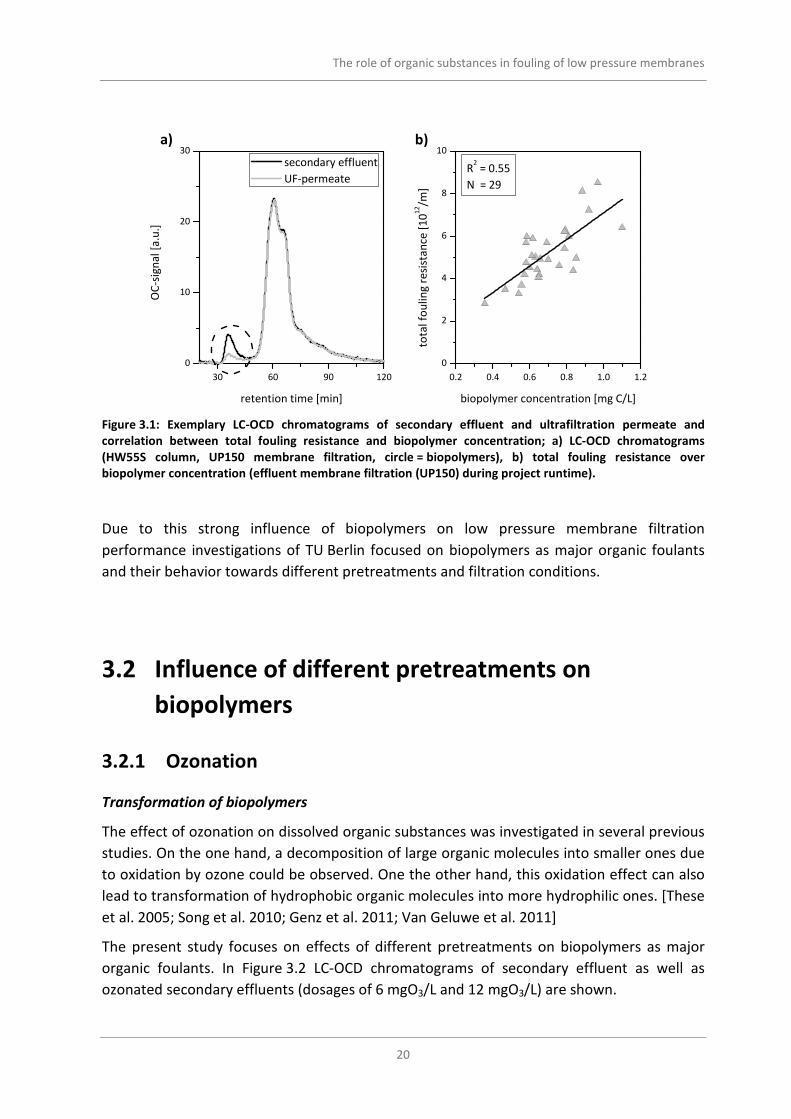
[2008], Zheng [2010] and Tian et al. [2013]. Figure 3.1a) shows exemplary LC-OCD
chromatograms of a secondary effluent from WWTP Ruhleben and the corresponding
permeate after ultrafiltration.
Nearly no difference between the chromatograms concerning humic substances and lower
molecular weight substances is visible whereas the biopolymer concentration in permeate is
significantly lower as in secondary effluent (see circle in Figure 3.1a). This indicates very low
permeation of biopolymers through the membrane but a high deposition on or in the
membrane which can cause membrane fouling.
The effect of this deposition is shown in Figure 3.1b) which displays total fouling resistance
in relation to biopolymer concentration of secondary effluent for all effluent filtration
experiments carried out during project runtime. A correlation between these two
parameters is clearly visible. The higher biopolymer concentration the higher is the total
fouling resistance. Concentrations of biopolymers in secondary effluent of WWTP Berlin are
in the range between 0.4 – 1.0 mgC/L (see Figure 3.1).
These results are similar to Zheng (2010). In comparison to his investigations there was no
pre-filtration (0.45 µm) of feed samples before membrane filtration in the current research
which leads to a lower coefficient of determination but respects synergetic effects of
particular matter and dissolved organic matter.
The role of organic substances in fouling of low pressure membranes
20
Figure 3.1: Exemplary LC-OCD chromatograms of secondary effluent and ultrafiltration permeate and
correlation between total fouling resistance and biopolymer concentration; a) LC-OCD chromatograms
(HW55S column, UP150 membrane filtration, circle = biopolymers), b) total fouling resistance over
biopolymer concentration (effluent membrane filtration (UP150) during project runtime).
Due to this strong influence of biopolymers on low pressure membrane filtration
performance investigations of TU Berlin focused on biopolymers as major organic foulants
and their behavior towards different pretreatments and filtration conditions.
3.2 Influence of different pretreatments on
biopolymers
3.2.1 Ozonation
Transformation of biopolymers
The effect of ozonation on dissolved organic substances was investigated in several previous
studies. On the one hand, a decomposition of large organic molecules into smaller ones due
to oxidation by ozone could be observed. One the other hand, this oxidation effect can also
lead to transformation of hydrophobic organic molecules into more hydrophilic ones. [These
et al. 2005; Song et al. 2010; Genz et al. 2011; Van Geluwe et al. 2011]
The present study focuses on effects of different pretreatments on biopolymers as major
organic foulants. In Figure 3.2 LC-OCD chromatograms of secondary effluent as well as
ozonated secondary effluents (dosages of 6 mgO3/L and 12 mgO3/L) are shown.
30 60 90 120
0
10
20
30
0.2 0.4 0.6 0.8 1.0 1.2
0
2
4
6
8
10b)
OC
-sig
na
l [a
.u.]
retention time [min]
secondary effluent
UF-permeate
a)
tota
l fo
uli
ng
re
sist
an
ce [
10
12/m
]
biopolymer concentration [mg C/L]
R2 = 0.55
N = 29

The role of organic substances in fouling of low pressure membranes
21
Figure 3.2: Transformation of biopolymers for different ozone dosages; (exemplary LC-OCD chromatograms,
column HW65S, focus on biopolymers).
A detailed view on biopolymer peak shows that ozonation affects a transformation of this
fraction resulting in a shift of molecular size. It can be seen that in comparison to untreated
secondary effluent there is a decrease of biopolymers in the range of 450 nm to
approximately 50 nm after ozonation. At the same time there is an increase of substances in
the range of 50 nm to 15 nm due to ozonation. This leads to the presumption that
biopolymers react with ozone and get partly decomposed into smaller molecules. This effect
depends on ozone dosages. The higher the ozone dosage the higher is the transformation of
large biopolymers into smaller compounds.
Transformation of particulate matter
Due to the observation of transformation of biopolymers it was investigated if there are
further shifts in molecular size of secondary effluent compounds by ozonation and if there
are also reactions with particulate matter.
For these investigations two ozonated samples of the same secondary effluent were
analyzed. One was pre-filtrated (0.45 µm, particle free) before ozonation, the other one was
not pre-filtrated (with particles). Figure 3.3a) shows the LC-OCD chromatograms of
untreated secondary effluent, ozonated secondary effluent and pre-filtrated ozonated
secondary effluent (HW50S columm).
In comparison to untreated secondary effluent a decrease of biopolymer concentration of
pre-filtered ozonated secondary effluent and an increase of humic and low molecular
substances in this chromatogram (below 10 nm) are visible. It indicates that without
particles ozone induces a transformation of biopolymers into substances smaller than 10
nm. DOC analyses for both samples (pre-filtered secondary effluent DOC = 12.2 mg/L and
DOC = 12.0 mg/L after additional ozonation) confirm that ozone induces only minor
30 40 50 60
0
1
2
effluent
6 mg O3/L
12 mg O3/L
450 101520
size [nm]
OC
-sig
na
l [a
.u.]
retention time [min]
30

The role of organic substances in fouling of low pressure membranes
22
mineralization of dissolved compounds but transformation into smaller substances < 10 nm
as visible in the LC-OCD chromatograms (Figure 3.3).
Figure 3.3: Transformation of the DOC by ozone with and without pre-filtration; a) HW50S column, b) HW65S
column (focus on biopolymers) for untreated effluent and after a dosage of 12 mg O3/L with and without
filtration (0.45 µm) prior ozonation.
Comparing chromatograms of the pre-filtrated sample (light-grey line) and the sample
without any pre-filtration prior ozonation (dark-grey line) with focus on biopolymers (see
Figure 3.3b)) a similar trend but higher concentrations of compounds between 450 nm and
10 nm for the sample without pre-filtration prior ozonation are clearly visible. This leads to
the presumption that biopolymers, especially in the range between 50 nm and 10 nm are
formed by transformation of particulate matter due to interactions with ozone.
The transformation by particulate matter > 450 nm into dissolved compounds < 450 nm is
supplementary confirmed by DOC analyses. The sample without pre-filtration has a higher
DOC (DOC = 12.9 mg/L) after ozonation than untreated secondary effluent
(DOC = 12.2 mg/L) which indicates a formation of dissolved organic substances out of
particular matter by ozonation.
3.2.2 Biopolymer removal with coagulation
Coagulation experiments with secondary effluent were carried out using three different
common coagulants (FeCl3, AlCl3, PACl) at comparable dosages and afterwards analyzed with
LC-OCD to investigate the removal of biopolymers by coagulation. In Figure 3.4a) the
30 40 50 60
0
5
10
15
30 40 50 60
0
1
21015 8
size [nm]
OC
-sig
na
l [a
.u.]
retention time [min]
untreated effluent
12 mg O3
/L
12 mg O3
/L (0.45 µm)
30450a) b)
450 1020
size [nm]
retention time [min]
30

The role of organic substances in fouling of low pressure membranes
23
removal of biopolymers and b) for the low molecular substances (humics, acids, etc.) is
shown for different dosages of the three investigated coagulants.
Figure 3.4: Removal of biopolymers and the DOC (without biopolymers) for different coagulants and
coagulant dosages; a) removal of biopolymers, b) removal of DOC without biopolymers (other fractions like
humics or organic acids).
Coagulation leads to a significant decrease of biopolymers. The rate of removal depends on
coagulant dosage. The higher the dosage the higher is the removal, even comparable low
coagulant dosages remove more than 30% of the biopolymers. Further there is nearly no
difference between coagulation with ferric, aluminum and poly-aluminum. Thus, the
removal of biopolymers is independent from the used coagulant.
The removal of smaller compounds (approximately compounds below 10 nm like humic,
building block, acids, etc.) of the DOC by coagulation is shown in Figure 3.4b). The
percentage removal is comparable low so that even high coagulant dosages achieve only a
small percentage removal (below 10%) of these low molecular weight substances.
3.2.3 Ozonation with subsequent coagulation
There are several studies, which investigated the effect of pre-ozonation and subsequent
coagulation on water quality. With focus on particle removal a multitude of these studies
showed a synergetic effect of this combination which leads to a higher removal of particles
respectively a lower necessary coagulant dosage due to pre-ozonation. [Jekel 1983; Jekel et
al. 2007]
Ozonation and coagulation experiments at the TUB lab investigated the effect of this
pretreatment on the main organic foulants by analyzing biopolymers with LC-OCD after
treatment. Figure 3.5a) summarizes the biopolymer removal rates for the different
34
40
48
3539
46
34
42
48
3 3
8
26
1 3
0.036 0.072 0.143
0
20
40
60
80
100
bio
po
lym
er
rem
ov
al
[%]
coagulant dosage [mmol Me3+
/L]
0.018 mmol Fe3+
/L = 1 mg Fe3+
/L
0.036 0.072 0.143
0
20
40
60
80
100
DO
C (
w/o
BP
) re
mo
va
l [%
]
coagulant dosage [mmol Me3+
/L]
Fe3+
Al3+
PACl
a) b)

The role of organic substances in fouling of low pressure membranes
24
pretreatments for the experiments carried out during the project runtime. Ozonation
indicates removal of the biopolymers but detailed LC-OCD analyses (see chapter 3.2.1) show
rather a transformation of the macromolecules into smaller organic compounds than a
removal of the biopolymers by ozonation. A clear removal of the biopolymers could be
achieved by coagulation (around 40%). The combination of ozonation and coagulation leads
to a lower biopolymer removal compared to coagulation without pre-ozonation.
Figure 3.5: Removal and transformation of biopolymers by different pretreatments; a) removal (mean values
with standard deviation for all pretreatment experiments carried out during project runtime) of biopolymers
by ozonation (Zspez = 0.4 - 1.6 mgO3/DOC0), by coagulation (0.036 - 0.216 mmol Me3+
/L), by combination of
pre-ozonation and coagulation (Zspez = 0.4 - 1.6 mgO3/DOC0 and 0.036 - 0.216 mmol Me3+
/L) and b) exemplary
LC-OCD chromatograms (HW55S column, focus on biopolymers) for the pretreatments.
Figure 3.5b) displays a detailed view of biopolymer removal in LC-OCD chromatograms for
the different pretreatments compared to the untreated secondary effluent (black line).
Coagulation shows nearly a parallel shift of biopolymers to lower concentrations over the
whole range with relatively high removal in the range between 450 and 30 nm. Exactly this
part of the biopolymers and additional the particulate matter (see chapter 3.2.1) is
decomposed into compounds smaller than 20 nm during the ozonation process (compare
black and dark-grey line).
Coagulation after ozonation is not completely capable to remove the DOC fraction produced
by ozonation (compare dark-grey and light-grey line between 50 and 10 nm in Figure 3.5b)).
Consequently ozonation of secondary effluent produces a fraction of organic compounds
between 50 and 10 nm which could be removed only to a certain amount by subsequent
coagulation resulting in lower overall removal of biopolymers compared to coagulation as a
single treatment step.
30 40 50 60
0
1
2
0
20
40
60
80
100
ozonation +
coagulation
coagulation
bio
po
lym
er
rem
ova
l [%
]
pretreatment
ozonation
n = 20 - 38
a) b)450 8101520
size [nm]
OC
-sig
na
l [a
.u.]
retention time [min]
effluent
ozonation
coagulation
ozonation + coagulation
30

The role of organic substances in fouling of low pressure membranes
25
3.3 Amicon® filtration tests
The results in this chapter (chapter 3.3) were done all with the Amicon® filtration unit and
UP 150 membranes (PES, MWCO = 150 kDa, pore size = 26 nm, comparable to the UF
membranes at the pilot plant in Ruhleben) except for chapter 3.3.3 where further
membranes with different character were tested.
3.3.1 Influence of the pretreatment on membrane filtration
Ozonation
Filtration experiments with ozonated secondary effluent were carried out for several times
during the project runtime. In general, ozonation showed only minor improvement for the
membrane filtration process and further the irreversible fouling resistance rises
tremendously compared to the untreated effluent. A possible explanation is the formation
of polar organic substances by ozonation (see chapter 3.2.1) which are in the range of
membrane pore size and finally lead to enhanced irreversible fouling. As a consequence,
ozonation as a single pretreatment step should not be considered for pretreatment of the
ultrafiltration process.
Summary
• Biopolymers are identified as major organic foulants with high impact on total
fouling resistance.
• Ozonation leads to a transformation of biopolymers into compounds smaller
than approx. 50 nm.
• Ozonation decomposes particular matter which leads to additional formation
of compounds within the biopolymer fraction.
• Coagulation significantly reduces biopolymers independent of the used
coagulation agent and shows only minor removal of compounds smaller than
10 nm.
• Even with low dosages of 0.036 mmol Me3+
/L over 30% of the biopolymers are
removed by coagulation.
• Ozonation with subsequent coagulation has no synergetic effect on biopolymer
removal.
• Compounds with a size between approx. 50 and 10 nm produced by ozonation
could not significantly be removed by subsequent coagulation.
The role of organic substances in fouling of low pressure membranes
26
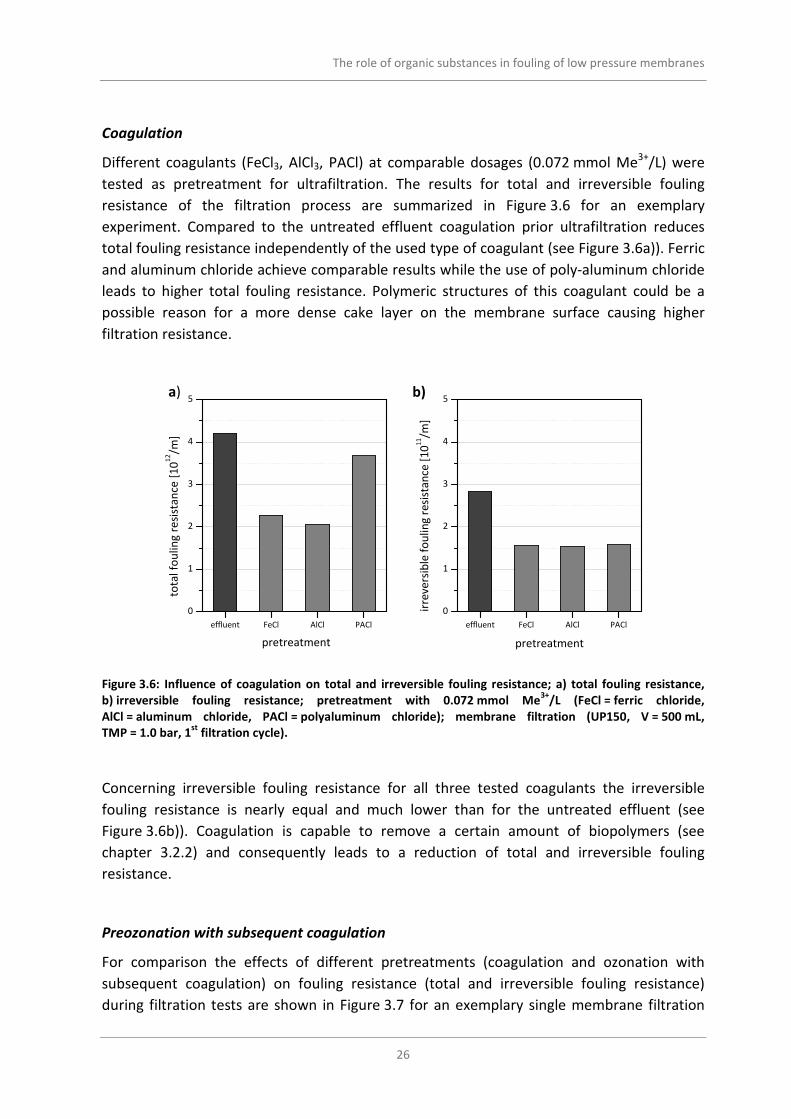
Coagulation
Different coagulants (FeCl3, AlCl3, PACl) at comparable dosages (0.072 mmol Me3+
/L) were
tested as pretreatment for ultrafiltration. The results for total and irreversible fouling
resistance of the filtration process are summarized in Figure 3.6 for an exemplary
experiment. Compared to the untreated effluent coagulation prior ultrafiltration reduces
total fouling resistance independently of the used type of coagulant (see Figure 3.6a)). Ferric
and aluminum chloride achieve comparable results while the use of poly-aluminum chloride
leads to higher total fouling resistance. Polymeric structures of this coagulant could be a
possible reason for a more dense cake layer on the membrane surface causing higher
filtration resistance.
Figure 3.6: Influence of coagulation on total and irreversible fouling resistance; a) total fouling resistance,
b) irreversible fouling resistance; pretreatment with 0.072 mmol Me3+
/L (FeCl = ferric chloride,
AlCl = aluminum chloride, PACl = polyaluminum chloride); membrane filtration (UP150, V = 500 mL,
TMP = 1.0 bar, 1st
filtration cycle).
Concerning irreversible fouling resistance for all three tested coagulants the irreversible
fouling resistance is nearly equal and much lower than for the untreated effluent (see
Figure 3.6b)). Coagulation is capable to remove a certain amount of biopolymers (see
chapter 3.2.2) and consequently leads to a reduction of total and irreversible fouling
resistance.
Preozonation with subsequent coagulation
For comparison the effects of different pretreatments (coagulation and ozonation with
subsequent coagulation) on fouling resistance (total and irreversible fouling resistance)
during filtration tests are shown in Figure 3.7 for an exemplary single membrane filtration
effluent FeCl AlCl PACl
0
1
2
3
4
5b)
pretreatment
tota
l fo
uli
ng
re
sist
an
ce [
10
12/m
]
a)
effluent FeCl AlCl PACl
0
1
2
3
4
5
pretreatment
irre
ve
rsib
le f
ou
lin
g r
esi
sta
nce
[1
01
1/m
]

The role of organic substances in fouling of low pressure membranes
27
experiment. Coagulation can reduce up to 50% of total fouling resistance compared to the
untreated effluent (see also Figure 3.6a)). This effect is enhanced if ozone is applied to the
secondary effluent before coagulation, especially for the very high ozone dosage of
15 mgO3/L.
Figure 3.7: Influence of different pretreatments on total and irreversible fouling resistance; a) total fouling
resistance, b) irreversible fouling resistance; membrane filtration (UP150, V = 500 mL, TMP = 1.0 bar, 1st
filtration cycle).
In contrast to the total fouling resistance the irreversible fouling resistance rises with
ozonation. Comparable results were also achieved by Genz et al. [2011] during the Oxeram I
project.
Ozonation without coagulation produces the highest irreversible fouling resistance (data not
shown) indicating a production of organic compounds by ozonation which interact
specifically with the membrane or are in the range of the pore size of the membrane (see
chapter 3.2.1). Coagulation can compensate this effect only to a certain extent (compare
also Figure 3.5b)). Coagulation without pre-ozonation results in the lowest irreversible
fouling resistance of all investigated samples (see Figure 3.7b)).
As mentioned above the data in Figure 3.7 are results from an exemplary single experiment.
During the project runtime further filtration experiment were done with different dosages of
coagulant and different dosages of ozone. The results of these experiments are shown as
boxplots in Figure 3.8.
The trends of all filtration experiments (see Figure 3.8) are the same as for the exemplary
single filtration experiment (see Figure 3.7). The lowest total fouling resistance could be
achieved with ozonation and subsequent coagulation (see Figure 3.8a)). Unfortunately, this
combination produces the highest irreversible fouling resistance, even higher than the
irreversible fouling resistance of the untreated effluent (see Figure 3.8b)).
effluent 0 mg O3/L
4 mg Fe3+
/L
6 mg O3/L
4 mg Fe3+
/L
15 mg O3/L
4 mg Fe3+
/L
0
1
2
3
4
5b)
pretreatment
tota
l fo
uli
ng
re
sist
an
ce [
10
12/m
]
a)
effluent 0 mg O3/L
4 mg Fe3+
/L
6 mg O3/L
4 mg Fe3+
/L
15 mg O3/L
4 mg Fe3+
/L
0
1
2
3
4
5
pretreatment
irre
ve
rsib
le f
ou
lin
g r
esi
sta
nce
[1
01
1/m
]

The role of organic substances in fouling of low pressure membranes
28
Figure 3.8: Boxplots of total and irreversible fouling resistance for different pretreatments; coagulation
(0.072 - 0.216 mmol Me3+
/L), combination of pre-ozonation and coagulation (Zspez = 0.2 - 1.6 mgO3/DOC0 and
0.072 - 0.216 mmol Me3+
/L); results for all membrane filtration experiments carried out during project
runtime (UP150, V = 500 mL, TMP = 1.0 bar, 1st
filtration cycle).
As a consequence the highest removal of biopolymers by coagulation (see Figure 3.5a))
results also in lowest irreversible fouling resistance while the transformation of the
biopolymers by ozone leads to lowest total fouling resistance but highest irreversible fouling
resistance.
A possible explanation for this phenomenon could be a better passage of biopolymers
through the membrane after ozonation. Transformation of biopolymers into smaller
compounds (see chapter 3.2.1 and 3.2.3) which are in the pore size range of the membrane
(26 nm) can pass the membrane more easily and as a consequence decrease total fouling
resistance. Contrary an improved passage means the compounds could enter the pores of
the membrane which means they are also able to block the pores and finally are able to
produce higher irreversible fouling resistance.
Rejection and biopolymer concentration in the permeate
Measuring the concentration of biopolymers in feed and permeate allows the calculation of
biopolymer rejection by membrane filtration. Low rejection of biopolymers symbolizes a
good passage of the biopolymers through the membrane and results in higher permeate
concentrations of biopolymers. Figure 3.9 summarizes the biopolymer rejection by
ultrafiltration and the permeate concentration of the biopolymers for all membrane
filtration experiments (UP150 membrane; coagulation and ozonation + coagulation as
pretreatments) during the project runtime.
0
2
4
6
8
10 b)
pretreatment
tota
l fo
uli
ng
re
sist
an
ce [
10
12/m
]
a)
0
1
2
3
4
5
ozonation +
coagulation
coagulation
pretreatment
irre
ve
rsib
le f
ou
lin
g r
esi
sta
nce
[1
01
1/m
]
effluent effluent coagulation ozonation +
coagulation
N = 35 - 49

The role of organic substances in fouling of low pressure membranes
29
Figure 3.9: Rejection of biopolymers by ultrafiltration and permeate biopolymer concentration for different
pretreatments; coagulation (0.072 - 0.216 mmol Me3+
/L), combination of pre-ozonation and coagulation
(Zspez = 0.4 - 1.6 mgO3/DOC0 and 0.072 - 0.216 mmol Me3+
/L); results for all membrane filtration experiments
carried out during project runtime (UP150, V = 500 mL, TMP = 1.0 bar, 1st
filtration cycle).
In general, permeate concentrations of the biopolymers are higher (implies lower
percentage rejection) if additional ozone was applied before membrane filtration compared
to coagulation without ozonation. These findings once again indicate an improved passage
of organic foulants through the membrane resulting in the observed lower total fouling
resistance (compare Figure 3.7 and Figure 3.8).
Higher passage of foulants necessarily means movement of substances through or into the
membrane pores. During this process they could interact with the membrane surface and
finally are not completely removable with hydraulic backwash procedures leading to
increasing irreversible fouling resistance.
LC-OCD analyses of the backwash water
The backwash water of Amicon filtration tests was analyzed with LC-OCD to gather further
information of the organic fouling causing substances. Backwash water generally comprises
high amounts of (reversible) fouling substances compared to feed water. Figure 3.10 shows
the chromatograms of the backwash water for membrane filtration experiments with
different pretreatment.
0.0
0.2
0.4
0.6
0.8
1.0b)
pretreatment
reje
ctio
n o
f B
Ps
by u
ltra
filt
rati
on
aft
er
pre
tre
atm
en
t [
- ]
a)
0.0
0.1
0.2
0.3
0.4
0.5
ozonation +
coagulation
coagulation
pretreatment
UF p
erm
ea
te B
Ps
con
cen
tra
tio
n [
mg
C/L
]
effluent effluent coagulation ozonation +
coagulation
N = 29 - 43

The role of organic substances in fouling of low pressure membranes
30
Figure 3.10: Backwash water analyzes for ultrafiltration after different pretreatments; untreated effluent,
coagulation (4 mgFe3+
/L), ozonation + coagulation (12 mgO3/L + 4 mgFe3+
/L); LC-OCD column HW65S, focus
on biopolymers.
Backwash water analyses of the untreated secondary effluent shows a qualitative similar
composition of water constituents in comparison to the feed water sample (compare
Figure 3.5), but in contrast higher concentrations of biopolymers. There is especially a high
concentration of substances in the range of ~50 to 450 nm. Having a bigger size than the
membrane pores, it can be expected, that they form a dense cake layer on the membrane
which causes a high total fouling resistance. A high concentration indicates that this cake
layer is easily removable by backwash which results in low irreversible fouling resistance (see
Figure 3.7).
The backwash water after filtration of coagulated secondary effluent shows very low
concentration of biopolymers over the whole range of molecular sizes. In combination with
the chromatogram of the feed sample (see Figure 3.5) it can be assumed that a high
percentage of biopolymers are bound in the particulate flocks (bigger than 450 nm) during
filtration and thus not able to attach to the membrane. Therefore only low concentrations of
(dissolved) biopolymers are in feed as well as in backwash water resulting in lowest total
fouling resistance and, especially, lowest irreversible fouling resistance.
As discussed above in chapter 3.3.1 pre-ozonation leads to a transformation of high
molecular substances into compounds within the range of 10 to 50 nm, which are only
marginal removable by coagulation. Especially a comparably high concentration of
biopolymers in the range of the membrane MWCO around 15 to 30 nm could be analyzed.
Concerning that ozonated samples produce highest irreversible fouling resistance it can be
assumed that biopolymers in this range are partly removable by backwash, but certain
amounts of these compounds still block pores after backwash and produce irreversible
fouling.
The backwash water analyses for different treatments confirm the findings and assumptions
previously discussed and show the high impact of transformed biopolymers by ozonation on
fouling during ultrafiltration.
30 40 50 60
0
4
8450 101520
size [nm]
OC
-sig
na
l [a
.u.]
retention time [min]
30
effluent
coagulation
ozonation + coagulation

The role of organic substances in fouling of low pressure membranes
31
Summary
• Ozonation as a single pretreatment step is inappropriate for ultrafiltration.
• Coagulation is capable to reduce total fouling resistance up to 50% and shows
lowest values for irreversible fouling resistance.
• Additional pre-ozonation leads to further reduction of total fouling resistance
but causes higher irreversible fouling resistance.
• Higher ozone dosages increase the upper described effect.
• Rejection and permeate concentrations of biopolymers point to an increased
passage of biopolymers for ozone treated secondary effluent.
• Analyses of the backwash water show a different composition for the observed
pretreatments and confirm the high impact of transformed biopolymers by
ozonation on irreversible fouling.
3.3.2 Treated effluent samples from the pilot
During the project runtime water samples at different sampling points were taken at the
pilot plant and were further used for filtration experiments at the lab. Consequently, in this
case the pretreatment was not conducted in the lab. In addition to the pretreatments
(coagulation, ozonation and ozonation with subsequent coagulation) permeate samples
from the pilot membrane filtration units were taken. The following figure (Figure 3.11)
shows exemplary the results of the lab membrane filtration test for one sampling day in
October 2011. In this case the pilot membrane filtration units were operated as follows: the
pretreatment for the ultrafiltration (polymeric membrane, pore size = 20 nm) was
coagulation (dosage of 4 mgFe3+
/L) and for microfiltration (ceramic membrane, pore
size = 100 nm) ozonation (15 mgO3/L) with subsequent coagulation (4 mgFe3+
/L).
Generally, the results confirm the findings generated with the pretreatment in the lab
(compare chapter 3.3.1). The lowest total fouling resistance could be achieved by a
pretreatment with ozonation and subsequent coagulation and the lowest irreversible fouling
is produced with coagulation (except for the filtration of membrane permeates). Ozonation
(as a single pretreatment step) reduces only a small amount of total fouling resistance but
produces the highest irreversible fouling resistance.

The role of organic substances in fouling of low pressure membranes
32
Figure 3.11: Fouling resistance for water samples from different sampling points of the pilot plant; a) total
and irreversible fouling resistance, b) amount of irreversible on total fouling resistance; membrane filtration
(UP150, V = 500 mL, TMP = 1.0 bar, 1st
filtration cycle); MF permeate = ceramic membrane (pore
size = 100 nm), UF permeate = PES membrane (pore size = 20 nm), * = reliable values were not possible
because only negligible decrease of flux was analyzed after filtration of 500 ml.
Figure 3.11b) shows the amount of irreversible fouling on total fouling resistance for the
different samples. For the three samples that were treated with ozone the amount of
irreversible fouling in total fouling resistance is comparably high. For the microfiltration
permeate nearly 100 percent of the produced fouling resistance during filtration process is
not reversible by backwash procedures.
The filtration of the MF permeate confirm that during the ozonation process organic
compounds were produced which can pass the microfiltration membrane but cause high
irreversible fouling at subsequent ultrafiltration. This is further confirmed by LC-OCD analysis
discussed in chapter 3.2.1 and 3.2.3 that show a production of compounds especially below
50 nm if ozone was applied to secondary effluent.
3.3.3 Further tests with different membranes
To get a more detailed understanding of the effects of different pretreatments on foulants
and interactions between foulants and membrane, Amicon filtration experiments with
different membranes were conducted. On the one hand, the used membranes differ in
material and, thus, in their hydrophilic character. PES membranes are more hydrophilic than
the ones made of PVDF (see pure water permeability Table 2.2). On the other hand, the
investigated membranes have different pore sizes: 26 and 50 nm (calculated by MWCO),
which are typical UF pores sizes, as well as 200 nm, which is more in the range of
microfiltration.
efflu
ent
4 m
g Fe
3+ /L
15 m
g O 3
/L
15 m
g O 3
/L
4 m
g Fe
3+ /LM
F per
mea
teU
F per
mea
te
0
2
4
b)
pretreatment
tota
l fo
uli
ng
re
sist
an
ce [
10
12/m
]
total
irreversible
a)
*
efflu
ent
4 m
g Fe
3+ /L
15 m
g O 3
/L
15 m
g O 3
/L
4 m
g Fe
3+ /LM
F per
mea
teU
F per
mea
te
0
20
40
60
80
100
*
pretreatment
irre
ve
rsib
le /
to
tal fo
uli
ng
re
sist
an
ce [
%]

The role of organic substances in fouling of low pressure membranes
33
Figure 3.12 shows total and irreversible fouling resistance of filtration tests with pretreated
secondary effluent (coagulation and ozonation with subsequent coagulation) for the
different membranes that were tested in Amicon filtration tests.
Figure 3.12: Fouling resistance for different membranes and coagulation and ozonation with subsequent
coagulation as pretreatments; a) total fouling resistance, b) irreversible fouling resistance; pretreatment:
coagulation (8 mg Fe3+
/L), ozonation + coagultation (15 mg O3/L + 8 mg Fe3+
/L); membrane filtration
(V = 300 mL, TMP = 0.5 bar, 1st
filtration cycle).
Comparing fouling resistance of the two PES membranes having different pore sizes it can be
seen that they are very similar for samples after coagulation as well as after ozonation with
subsequent coagulation. Additional ozonation reduces total fouling resistance but produces
higher irreversible fouling resistance. The small difference in pore size (26 vs. 50 nm) seems
to have no meaningful effect on fouling behavior.
Comparing membranes with same pore size (26 nm) but different material (PES and PVDF),
the same effect of pretreatment is visible. In both cases ozonation with subsequent
coagulation leads to a lower total, but a higher irreversible fouling resistance in comparison
to samples after sole coagulation. But in general, PVDF membrane excites higher total and
irreversible fouling than PES. This leads to the presumption that foulants in (pretreated)
secondary effluent have stronger interactions with PVDF than with PES and, thus, has a
lower suitability for ultrafiltration of secondary effluent concerning fouling due to higher
fouling effects.
Considering microfiltration membrane with a pore size of 200 nm, the tendency in total
fouling resistance is similar as before. Ozonation with subsequent coagulation leads to best
results. But in contrast to all other membranes with smaller pores sizes, ozonated sample
also shows better results concerning irreversible fouling than sample after sole coagulation.
This indicates that irreversible fouling is a matter, which strongly depends in membrane pore
size. This can be illustrated with the effects of pretreatments on biopolymers. Ozone leads to
PES 26 n
m
(modifi
ed)
PVDF 26 n
m
PES 50 n
m
PVDF 200 n
m
0
1
2
3
4
5
tota
l fo
uli
ng
re
sist
an
ce [
10
12/m
]
PES 26 n
m
(modifi
ed)
PVDF 26 n
m
PES 50 n
m
PVDF 200 n
m
0
2
4
6
8
10b)
irre
ve
rsib
le f
ou
lin
g r
esi
sta
nce
[1
01
1/m
] coagulation
ozonation + coagulation
a)
The role of organic substances in fouling of low pressure membranes
34
a shift of molecular sizes and a transformation of compounds bigger than 50 nm into
compounds between 50 to 10 nm (compare Figure 3.2). In ultrafiltration these substances
have a similar size as membrane pores so they are able to block them, partly irreversibly.
Due to the transformation of biopolymers during ozonation, concentration of substances
bigger than 50 nm decreases (compare Figure 3.2). This may lead to lower irreversible
fouling of ozonated samples in microfiltration because lower concentrations of substances
which are able to block the pores are present after ozonation. Samples after sole
coagulation have comparable higher concentration of compounds bigger than 50 nm (see
Figure 3.5b)) leading to higher irreversible fouling due to possibly increased pore blocking.
Summary
• Pretreated samples from the pilot plant show comparable membrane filtration
behavior like the pretreatment in the lab.
• Ozonated samples produce highest irreversible fouling.
• The amount of irreversible in total fouling resistance is nearly 90% for the
filtration of microfiltration permeate.
• Ozonation products are able to pass the ceramic microfiltration membrane of
the pilot plant and lead to enhanced irreversible fouling at further
ultrafiltration.
• Tests with different membranes show comparable result for pretreated
secondary effluent concerning total fouling resistance.
• In general, PES membranes are more suitable for the filtration of secondary
effluent than PVDF membranes.
• For membranes with a pore size smaller than 200 nm the irreversible fouling is
enhanced after ozonation.
• For the tested microfiltration membrane total and also irreversible fouling is
reduced with additional ozonation.
3.3.4 Fouling mechanisms
The transformation of biopolymers by ozonation seems to be a possible reason for increased
irreversible fouling of ultrafiltration membranes during filtration of secondary effluent. To
gather further information of the fouling process, fouling mechanisms were investigated
with the help of filtration laws described by Hermia [1982].
Fouling mechanisms for different pretreatments and ultrafiltration (UP150 membrane) were
investigated using the filtration blocking laws [Hermia 1982]. With the help of this law
filtration coefficients could be calculated to describe the fouling mechanisms for the

The role of organic substances in fouling of low pressure membranes
35
membrane filtration of the different water samples. In Figure 3.13 the filtration coefficient is
plotted against filtration time for the different water samples and consequently the graph
describes the development of the filtration mechanisms over filtration time. The initial
phase of the filtration process is the point of interest because usually every filtration process
ends up with cake filtration. Consequently only the first 10 minutes of the filtration are
plotted in the graph.
Figure 3.13: Filtration coefficient over filtration time for different pretreatments; membrane filtration
(UP150, V = 500 mL, TMP = 1.0 bar, 1st
filtration cycle).
Untreated secondary effluent initially tends to cause in-pore fouling changing to cake
filtration during ongoing filtration. Effluent water constituents enter the membrane pores at
the start of the filtration process and finally form a cake layer. Coagulation prior to
membrane filtration immediately leads to the formation of a cake layer by the flocs and
accordingly, the dominant filtration mechanism is cake filtration. For the combination of
ozonation and coagulation the initial fouling mechanism is pore blocking, changing to
in-pore fouling which remains the dominant fouling process for a comparatively long
filtration time. For a higher ozone dosage (15 mgO3/L) before coagulation the observed
effect is enhanced.
The analyses of the fouling mechanisms confirm the assumption of the previous chapters
concerning the influence of different pretreatments on membrane filtration. Additional
ozonation before coagulation results in enhanced in pore fouling during membrane filtration
(confirmed by the filtration laws) which causes an increase of irreversible fouling (see
chapter 3.3.1).
0 2 4 6 8 10
0
1
2
3
4
cake filtration
filt
rati
on
co
eff
icie
nt
φ [
]
filtration time [min]
secondary effluent
0 mg O3/L + 4 mg Fe
3+
6 mg O3/L + 4 mg Fe
3+
15 mg O3/L + 4 mg Fe
3+
pore blocking /
inpore fouling

The role of organic substances in fouling of low pressure membranes
36
3.3.5 Character of the fouling layer
Different filtration experiments were carried out to characterize the fouling layer and the
influence of ozonation/coagulation on the character of fouling layer. The influence of the
transmembrane pressure and parameters like specific fouling resistance and compressibility
of the fouling layer was determined for the different pretreatments (no treatment,
coagulation and ozonation with subsequent coagulation).
Influence of the TMP on the filtration process
To test the influence of the TMP on the filtration process two membrane filtration
experiments were done parallel with same water samples but with different filtration
pressure. One with a TMP of 1 bar and the other one with a TMP of 0.5 bar. Backwash was
done with a TMP of 1 bar in both experiments. After filtration the total and the irreversible
fouling resistance was analyzed. Figure 3.14 shows the results of this filtration experiment.
In general the previous observed trends for the different pretreatments could be observed
for both TMPs. The combination of ozonation and coagulation achieves lowest total fouling
resistance but highest irreversible fouling resistance independent of the TMP. The
comparison of the results for the different TMPs shows especially for coagulation and the
combination of ozonation and coagulation slightly lower total fouling resistances at a TMP of
0.5 bar. A possible explanation is the compressibility of the fouling layer. If the cake layer is
compressible then higher pressure forms a denser fouling layer which is less porous resulting
in higher filtration resistance.
Figure 3.14: Fouling resistance for different pretreatment and different TMPs; a) total and b) irreversible
fouling resistance; membrane filtration (UP150, V = 500 mL, TMP = 0.5 and 1.0 bar, 1st
filtration cycle).
In contrast to total fouling resistance the irreversible fouling resistance is slightly lower for
the filtration at a higher TMP. The faster formation of a cake layer at higher fluxes (higher
effluent
(untreated)
0 mg O3/L
4 mg Fe3+
/L
6 mg O3/L
4 mg Fe3+
/L
0
2
4
6
8
10
pretreatment
tota
l fo
uli
ng
re
sist
an
ce [
10
12/m
]
TMP = 0.5 bar
TMP = 1.0 bar
a) b)
effluent
(untreated)
0 mg O3/L
4 mg Fe3+
/L
6 mg O3/L
4 mg Fe3+
/L
0
1
2
3
pretreatment
irre
ve
rsib
le f
ou
lin
g r
esi
sta
nce
[1
01
1/m
]

The role of organic substances in fouling of low pressure membranes
37
TMP results in higher fluxes and higher load of foulants per time onto the membrane) might
reduce enhanced in pore fouling.
In conclusion the differences in the fouling behavior between filtration with a TMP of 0.5 bar
and 1.0 bar are nearly negligible and consequently the filtration at 1.0 bar (reference TMP;
filtration TMP for most of the filtration experiments carried out at TU Berlin) is a good
compromise to generate results within a short time at the lab.
Specific fouling resistance
To gather additional information of the fouling layer specific fouling resistance was analyzed
for different pretreatments during the project time. Specific fouling resistance gives
information about the fouling resistance per mass of foulant and area in the fouling layer on
the membrane. In this study foulants were measured by LC-OCD (dissolved organic
foulants = biopolymers) and suspended solids (particulate matter, coagulation flocs).
Figure 3.15a) shows the mass of foulants on the membrane for the different pretreatments
as boxplots (note: constant coagulant dosage). The mass of foulants on the membrane is
higher after coagulation because besides the foulants of the untreated effluent
(biopolymers + suspended solids/particulate matter) the flocs of the coagulation process are
in the fouling layer as well. In comparison, with ozonation and subsequent coagulation a
minor mass of foulants on the membrane could be observed. This is probably due to
improved passage of biopolymers through the membrane after ozonation (compare chapter
3.3.1).
Figure 3.15: Fouling layer characteristics for different pretreatments; a) mass of foulants in the layer, b)
specific fouling resistance; pretreatment: coagulation (0.072 mmol Me3+
/L), combination of pre-ozonation
and coagulation (Zspez = 0.3 – 0.6 mgO3/DOC0 and 0.072 mmol Me3+
/L); results for all membrane filtration
experiments carried out during project runtime (UP150, V = 500 mL, TMP = 1.0 bar, 1st
filtration cycle).
For the untreated effluent a comparable small amount of foulants produces a high filtration
resistance resulting in a very high specific fouling resistance (see Figure 3.15). Pore blocking
0
5
10
15
ma
ss o
f fo
ula
nts
in
la
ye
r [m
g]
0.0
0.2
0.4
0.6
0.8
1.0
spe
cifi
c fo
uli
ng
re
sist
an
ce [
10
16m
/kg
]
N = 14 - 27
pretreatment
ozonation +
coagulation
coagulation
pretreatment
effluent effluent coagulation ozonation +
coagulation
a) b)
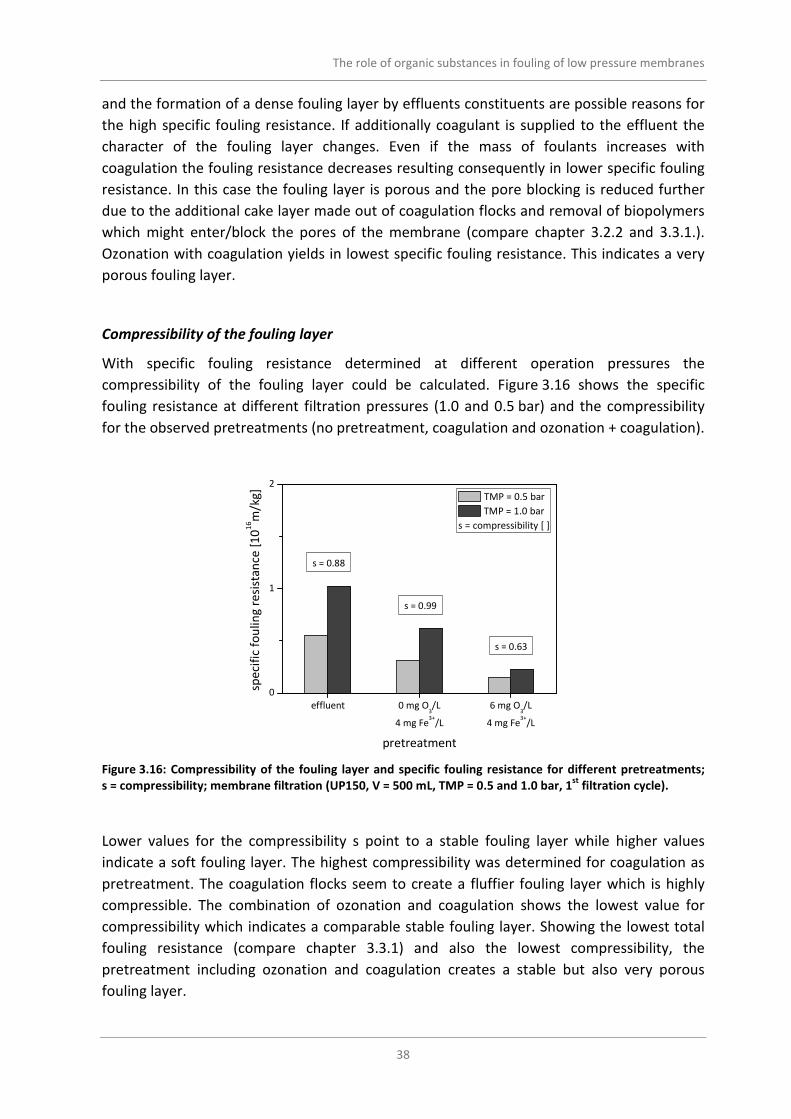
The role of organic substances in fouling of low pressure membranes
38
and the formation of a dense fouling layer by effluents constituents are possible reasons for
the high specific fouling resistance. If additionally coagulant is supplied to the effluent the
character of the fouling layer changes. Even if the mass of foulants increases with
coagulation the fouling resistance decreases resulting consequently in lower specific fouling
resistance. In this case the fouling layer is porous and the pore blocking is reduced further
due to the additional cake layer made out of coagulation flocks and removal of biopolymers
which might enter/block the pores of the membrane (compare chapter 3.2.2 and 3.3.1.).
Ozonation with coagulation yields in lowest specific fouling resistance. This indicates a very
porous fouling layer.
Compressibility of the fouling layer
With specific fouling resistance determined at different operation pressures the
compressibility of the fouling layer could be calculated. Figure 3.16 shows the specific
fouling resistance at different filtration pressures (1.0 and 0.5 bar) and the compressibility
for the observed pretreatments (no pretreatment, coagulation and ozonation + coagulation).
Figure 3.16: Compressibility of the fouling layer and specific fouling resistance for different pretreatments;
s = compressibility; membrane filtration (UP150, V = 500 mL, TMP = 0.5 and 1.0 bar, 1st
filtration cycle).
Lower values for the compressibility s point to a stable fouling layer while higher values
indicate a soft fouling layer. The highest compressibility was determined for coagulation as
pretreatment. The coagulation flocks seem to create a fluffier fouling layer which is highly
compressible. The combination of ozonation and coagulation shows the lowest value for
compressibility which indicates a comparable stable fouling layer. Showing the lowest total
fouling resistance (compare chapter 3.3.1) and also the lowest compressibility, the
pretreatment including ozonation and coagulation creates a stable but also very porous
fouling layer.
effluent 0 mg O3/L
4 mg Fe3+
/L
6 mg O3/L
4 mg Fe3+
/L
0
1
2
s = 0.63
s = 0.99
pretreatment
spe
cifi
c fo
uli
ng
re
sist
an
ce [
10
16m
/kg
]
TMP = 0.5 bar
TMP = 1.0 bar
s = compressibility [ ]
s = 0.88

The role of organic substances in fouling of low pressure membranes
39
Summary
• Cake filtration is the dominant filtration process for coagulation while
additional pre-ozonation leads to increased pore blocking/in pore fouling.
• The filtration TMP has only minor effects on the fouling behavior of pretreated
secondary effluent.
• Coagulation creates a very fluffy cake layer while ozonation + coagulation lead
to a stable but also very porous fouling layer.
3.3.6 Comparison of different WWTP effluents
In previous parts of this report detailed effects of pretreatments on composition and
filtration behavior of secondary effluent from WWTP Ruhleben were shown and discussed
(compare chapter 3.2 and 3.3.1). For assessment of the transferability of these findings on
other effluent water samples similar experiments were conducted with effluents from three
additional WWTP in the Berlin area. These investigated WWTP were Schoenerlinde (SCH),
Muenchehofe (MUE) and Wassmannsdorf (WAS).
In Figure 3.17 fouling relevant parameters like biopolymers and in this case also the particle
concentration (for particles between 100 and 200 nm) of the four samples are shown. In
Figure 3.17a) biopolymer concentration of untreated samples as well as after coagulation
and coagulation with pre-ozonation are illustrated. Comparing biopolymers of the untreated
secondary effluents Wassmannsdorf shows highest concentration whereas Schoenerlinde
has the lowest. This order is also the same after every of the two pretreatment procedures.
Thus, pretreatment has a similar effect on every of these secondary effluents. At the same
time the observed effect of coagulation as well as coagulation with pre-ozonation is the
same for every single effluent: coagulation results in a significant removal of biopolymers
whereas additional pre-ozonation does not cause an additional removal compared to single
coagulation (see also chapter 3.2).

The role of organic substances in fouling of low pressure membranes
40
Figure 3.17: Biopolymer and particle concentrations of different WWTP effluents for different
pretreatments; a) biopolymer concentration, b) particle concentration (fraction between 100 – 200 nm);
pretreatment: coagulation (4 mg Fe3+
/L), ozonation + coagultation (6 mg O3/L + 4 mg Fe3+
/L).
A similar trend for particles between 100 and 200 nm shown in Figure 3.17b) is visible. Also
in this case Wassmannsdorf shows highest, Schoenerlinde lowest values. After coagulation
there is a decrease of these particles for every sample. In contrast to biopolymers
pre-ozonation leads to an additional removal of particles for all investigated effluents.
In Figure 3.18 filtration parameters of these samples are shown. Values in total fouling
resistance (Figure 3.18a)) show a parallel trend to biopolymer concentration. Secondary
effluent from Wassmannsdorf shows highest resistance, without pre-treatment as well as
after pretreatment procedures. At the same time effluent from Schoenerlinde shows lowest
resistances in all of the three cases. This indicates once again the role of biopolymers as
major organic foulants. Besides this there is a very good correlation between particle
concentration (100 – 200 nm) and total fouling resistance (compare Figure 3.17a) and
Figure 3.18a)). This effect was previously shown by Schulz [2012] for the effluent of Berlin
Ruhleben.
effluent coagulation ozonation +
coagulation
0.0
0.2
0.4
0.6
0.8
1.0
pretreatment
bio
po
lym
er
con
cen
tra
tio
n [
mg
C/L
]
effluent coagulation ozonation +
coagulation
0
1
2
3
4
5
6
pretreatment
pa
rtic
le c
on
c. (
10
0-2
00
nm
) [E
8/m
L]
RUH
MUE
WAS
SCH
a) b)

The role of organic substances in fouling of low pressure membranes
41
Figure 3.18: Fouling characteristics of different WWTP effluents for different pretreatments; a) total fouling
resistance, b) irreversible fouling resistance; pretreatment: coagulation (4 mg Fe3+
/L), ozonation +
coagultation (6 mg O3/L + 4 mg Fe3+
/L); membrane filtration (UP150, V = 500 mL, TMP = 1.0 bar, 1st
filtration
cycle).
Pretreatment for all observed effluents results in a similar effect on membrane filtration that
was already described in previous parts for the effluent of Berlin Ruhleben (compare chapter
3.3.1). Coagulation leads to a significant decrease of total fouling resistance. Additional pre-
ozonation shows even lower values.
For irreversible fouling resistance (Figure 3.18b)) it can be seen that for all of the four
effluent samples the irreversible fouling resistance increases after ozonation with
subsequent coagulation resulting in highest overall values. Thus, the effect of ozone is the
same that was already observed in previous experiments with secondary effluent from
Ruhleben.
In summary, investigations with different secondary effluents show the same fouling
behavior that was already observed with samples from WWTP Ruhleben. On the one hand, it
is shown that biopolymer concentration significantly affects fouling behavior of a secondary
effluent. On the other hand, in all cases ozonation results in low total, but significantly high
irreversible fouling. The parallel trend of all samples indicates that the results with samples
from WWTP Ruhleben, shown in this work, are also transferable to other WWTP in Berlin.
Summary
• Different secondary effluents from sewage treatment plants in Berlin show
comparable fouling behavior for all observed pretreatments.
• Membrane filtration results generated with samples from WWTP Ruhleben are
transferable to other WWTPs in Berlin.
effluent coagulation ozonation +
coagulation
0
1
2
3
4
12
pretreatment
tota
l fo
uli
ng
re
sist
an
ce [
10
12/m
]
effluent coagulation ozonation +
coagulation
0
1
2
3
pretreatment
irre
ve
rsib
le f
ou
lin
g r
esi
sta
nce
[1
01
1/m
] RUH WAS
MUE SCH
a) b)

The role of organic substances in fouling of low pressure membranes
42
3.4 Siemens® Memcor
A semi-automatic membrane unit for bench-scale filtration tests using outside-in
polyvinylidene fluoride (PVDF) hollow-fibre membranes (max. pore size = 100 nm) was
modified for dead-end filtration tests to gather additional information of fouling.
3.4.1 Setup
Filtration experiments with Siemens® Memcor lab filtration unit were conducted with three
different feed samples: untreated secondary effluent, secondary effluent after coagulation,
secondary effluent after ozonation and subsequent coagulation. Experiments were repeated
four times at different days but with same dosages of ozone/coagulant. The experiments
were carried out as semi-batch experiments (pretreatment at the pilot plants and
membrane filtration in the lab).
3.4.2 Results
Figure 3.19 shows total and irreversible fouling resistance for the three different samples
after every filtration circle. The illustrated values are mean values of the four repetitions of
the experiment.
For total fouling resistance in Figure 3.19a) independently from pretreatment an increase
from one circle to the next is clearly visible. Comparing the different pretreatments it is
obvious that untreated secondary effluent induces the highest total fouling resistance
whereas coagulation and, more largely, ozonation with subsequent coagulation affect a
strong decrease of this parameter. This positive effect of pretreatment is similar to the one
observed in lab filtration tests with Amicon filtration unit and a PES membrane with a pore
size of 26 nm. (compare chapter 3.3.1).
In Figure 3.19b) mean values for irreversible fouling resistance are plotted for the different
pretreated samples. The comparison of pretreatment procedures shows a parallel trend to
total fouling resistance. Pretreatment by ozonation with subsequent coagulation induces
best results due to lowest irreversible fouling resistance. Compared to results of Amicon
filtration tests there is an opposite trend visible. In Amicon filtration tests ozonated samples
show the highest irreversible fouling resistance and, thus, a completely different fouling
behavior.
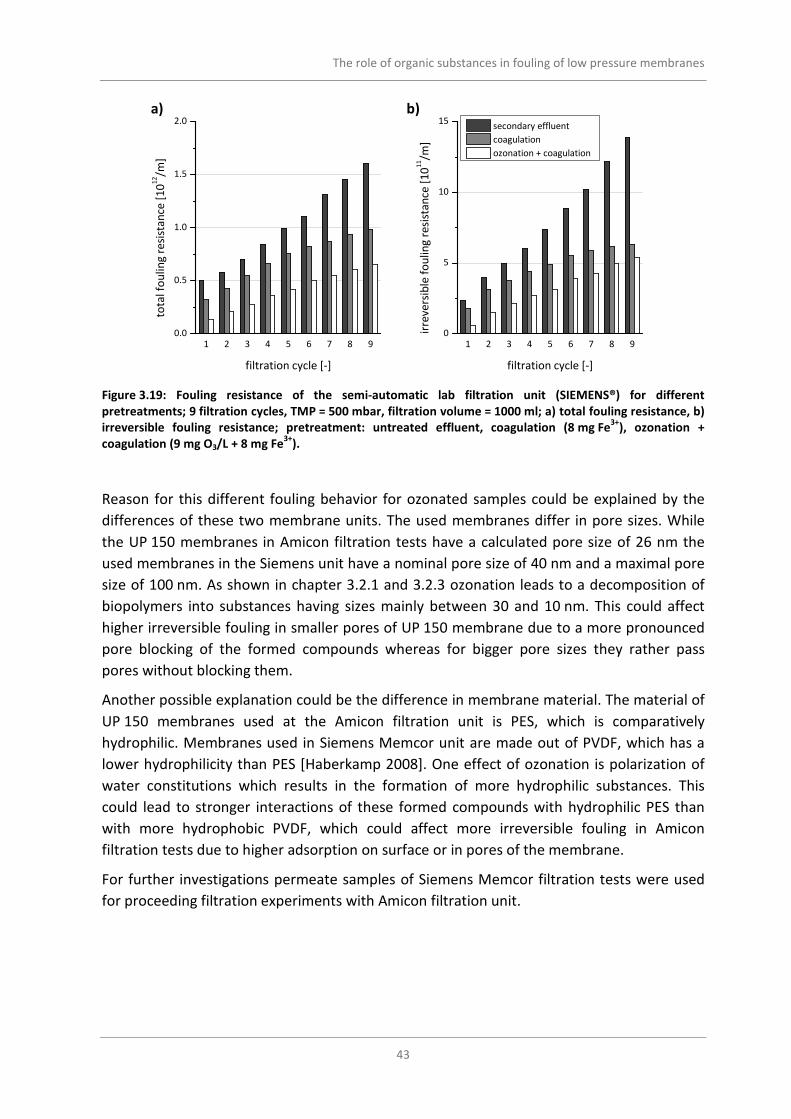
The role of organic substances in fouling of low pressure membranes
43
Figure 3.19: Fouling resistance of the semi-automatic lab filtration unit (SIEMENS®) for different
pretreatments; 9 filtration cycles, TMP = 500 mbar, filtration volume = 1000 ml; a) total fouling resistance, b)
irreversible fouling resistance; pretreatment: untreated effluent, coagulation (8 mg Fe3+
), ozonation +
coagulation (9 mg O3/L + 8 mg Fe3+
).
Reason for this different fouling behavior for ozonated samples could be explained by the
differences of these two membrane units. The used membranes differ in pore sizes. While
the UP 150 membranes in Amicon filtration tests have a calculated pore size of 26 nm the
used membranes in the Siemens unit have a nominal pore size of 40 nm and a maximal pore
size of 100 nm. As shown in chapter 3.2.1 and 3.2.3 ozonation leads to a decomposition of
biopolymers into substances having sizes mainly between 30 and 10 nm. This could affect
higher irreversible fouling in smaller pores of UP 150 membrane due to a more pronounced
pore blocking of the formed compounds whereas for bigger pore sizes they rather pass
pores without blocking them.
Another possible explanation could be the difference in membrane material. The material of
UP 150 membranes used at the Amicon filtration unit is PES, which is comparatively
hydrophilic. Membranes used in Siemens Memcor unit are made out of PVDF, which has a
lower hydrophilicity than PES [Haberkamp 2008]. One effect of ozonation is polarization of
water constitutions which results in the formation of more hydrophilic substances. This
could lead to stronger interactions of these formed compounds with hydrophilic PES than
with more hydrophobic PVDF, which could affect more irreversible fouling in Amicon
filtration tests due to higher adsorption on surface or in pores of the membrane.
For further investigations permeate samples of Siemens Memcor filtration tests were used
for proceeding filtration experiments with Amicon filtration unit.
1 2 3 4 5 6 7 8 90.0
0.5
1.0
1.5
2.0
filtration cycle [-]
tota
l fo
uli
ng
re
sist
an
ce [
10
12/m
]
1 2 3 4 5 6 7 8 90
5
10
15b)
filtration cycle [-]
irre
ve
rsib
le f
ou
lin
g r
esi
sta
nce
[1
01
1/m
]
secondary effluent
coagulation
ozonation + coagulation
a)

The role of organic substances in fouling of low pressure membranes
44
3.4.3 Permeate filtration
For filtration of permeate of Siemens Memcor filtration experiments with Amicon filtration
unit a UVT 150 flat sheet membrane was used. The membrane is also made out of PVDF, but
has a MWCO of 150 kDa, which is according to a calculated pore size of 26 nm and, thus,
smaller than the pore size of the membrane used in the Siemens Memcor filtration system.
In Figure 3.20 total and irreversible fouling resistance for permeate filtration tests are
shown. In comparison to Figure 3.19 the trend in total fouling resistance is the same.
Pretreated samples show lower values than untreated sample. Comparing irreversible
fouling resistance both figures differ. Filtration of permeate after ozonation and subsequent
coagulation with Amicon filtration unit show highest irreversible fouling resistance after it
showed the lowest value for filtration with Siemens Memcor filtration unit. This indicates
that permeate (respectively feed for Amicon filtration unit) after ozonation contains
substances which lead to strong irreversible fouling at Amicon filtration unit whereas they
did not do at Siemens Memcor filtration unit. This irreversible characteristic of ozonated
samples was also observed with PES membranes of the same MWCO. This indicates that
irreversible fouling of ozonated samples is not a question of membrane material. If it would
be like this, experiments with ozonated samples at Amicon filtration unit should also show
lowest irreversible fouling resistance like they did at Siemens Memcor filtration unit with the
same membrane material.
Figure 3.20: Total and irreversible fouling resistance for filtration of Siemens Memcor permeate samples;
a) total fouling resistance, b) irreversible fouling resistance.
It shows on the other hand, that irreversible fouling by ozonation is probably a question of
pore size due to pore blocking of formed substances. Like written before, ozonation of
secondary effluent leads to a significant formation of compounds in the range of 10 to
30 nm in comparison to untreated respectively coagulated samples. Results indicate that
10
1
2
3
4
5
irre
ve
rsib
le f
ou
lin
g r
esi
sta
nce
[1
01
1/m
]
filtration cycle [-]
tota
l fo
uli
ng
re
sist
an
ce [
10
12/m
]
10
2
4
6
8
10b)
filtration cycle [-]
secondary effluent coagulation ozonation + coagulation
a)

The role of organic substances in fouling of low pressure membranes
45
these formed substances are able to pass the bigger pores of Siemens Memcor filtration unit
largely without blocking so that they end up in permeate. Filtration of permeate with
UVT 150 membrane results in stronger irreversible fouling, which leads to the presumption,
that these substances, which passed bigger pores, now block the smaller pores of this
membrane.
Summary
• A semi-automatic membrane unit for bench-scale filtration tests including a
PVDF membrane (max. pore size = 100 nm) was successfully modified for dead
end filtration test.
• Filtration tests show the same trend like previously observed in Amicon
filtration tests for the different pretreatments concerning total fouling
resistance.
• Ozonation + coagulation results in lowest total and also irreversible fouling
resistance.
• Additional permeate filtration test with a PVDF membrane (pore size = 26 nm)
confirm a passage of products produced by ozonation through the membrane
with bigger pore sizes (100 nm).
• Irreversible fouling by ozonation is probably a question of pore size.
3.5 Inge® “PUE10”
During the project a lab/pilot membrane filtration unit was successfully constructed, which
is nearly completely comparable to the UF membrane pilot plants at WWTP Ruhleben
according to operation, controlling software, membrane module, etc.. The major difference
is the smaller membrane area of the used membrane modules resulting in lower flow rates
at comparable fluxes.
3.5.1 Setup
After some test procedures after construction of the filtration unit two different membrane
modules were tested during the experimental phase. Both membranes are made of
hydrophilized PES material but have different maximal pore sizes (20 nm (UF) vs. 150 nm
(MF)). For all trials (batch experiments) pretreated effluent (coagulation and
ozonation + coagulation) from the pilot plant in Ruhleben was obtained (see chapter 2.1.3)
on the day of the experiments. With a sample volume of 80 liters it was possible to perform
5 filtration cycles.

The role of organic substances in fouling of low pressure membranes
46
3.5.2 Results
Fouling resistance
The conducted experiments with pretreated secondary effluent showed a comparable trend
concerning total fouling resistance for both membranes (UF and MF). Additional ozonation
results in lower total fouling compared to coagulation as a single pretreatment (data not
shown). For irreversible fouling no clear trend could be observed with the short term lab
trails. Within 5 filtration cycles the effects for irreversible fouling of both membranes were
only negligible. Long term experiments (filtration for 1 or 2 days) are necessary to achieve
trustworthy results in the context of irreversible fouling.
LC-OCD
Nevertheless LC-OCD analyses of feed and permeate of the UF and MF membrane predict a
different fouling behavior. The results of the LC-OCD analyses are plotted in Figure 3.21 for
coagulation and ozonation with subsequent coagulation.
Figure 3.21: Exemplary LC-OCD chromatograms of MF and UF permeate samples for different pretreatments;
LC-OCD: HW65S column, focus on biopolymers; a) pretreatment coagulation, b) pretreatment ozonation +
coagulation.
In general, no difference of feed and permeate samples is visible for the microfiltration
process independently of the pretreatment. This indicates a good passage of the foulants
through the MF membrane. The membrane pore size seems to be big enough and only small
interaction between ozonation products and the membrane could be expected. If this
results in lower irreversible fouling has to be verified in long term experiments.
In contrast the UF membrane (calculated pore size = 20 nm) rejects nearly everything above
30 nm. In long term experiments enhanced irreversible fouling could be expected for the
30 40 50 60
0
1
30 40 50 60
0
1
b)
ozonation +
coagulation
effluent
after pretreatment
MF permeate
UF permeate
450 1020
size [nm]
OC
-sig
na
l [a
.u.]
retention time [min]
30
coagulation
450 1020
size [nm]
OC
-sig
na
l [a
.u.]
retention time [min]
30a)

The role of organic substances in fouling of low pressure membranes
47
combination of ozonation + coagulation pretreatment and ultrafiltration because a certain
amount of ozonation products are in the pore size range of the membrane and could
therefore block or enter the pores which consequently results in irreversible fouling like
Amicon filtration tests showed previously.
In conclusion the experiments carried out within the project time point to the same trend
observed in the upper experiments. For verification the experiments with Inge lab unit
should be repeated in long term experiments.
Summary
• A small lab/pilot membrane filtration unit was successfully constructed which is
comparable to the UF membrane pilot plants at WWTP Ruhleben.
• Total fouling resistance could be reduced with additional ozonation for both
observed membrane modules having different pore sizes (20 nm and 150 nm).
• To generate reliable results for irreversible fouling of this filtration unit long
term experiments are necessary.
• LC-OCD analyses indicate a lower interaction of ozonation products and the
observed microfiltration membrane.

Fouling analyses with MALDI-TOF-MS
48
4 Fouling analyses with MALDI-TOF-MS
With the aim of a more detailed mass fingerprint MALDI-TOF mass spectrometry was used
to analyze fouling affecting substances. In general, MALDI-TOF-MS is capable to analyze high
molecular organic substance like proteins and polysaccharides. Therefore, two experimental
methods were conducted: analysis of solutions as well as direct analysis of fouled
membranes after filtration of solutions.
MALDI-TOF-MS analyses of secondary effluent did not show any evaluable signals, neither in
solution nor on membrane after filtration (data not shown). Different cleaning and
enrichment procedures of the fouling causing DOC fraction were tested without any success.
In the end it can be surmised that due to a high diversity of the biopolymer fraction single
substances are present in a concentration, which is below detection limit of MALDI-TOF-MS.
Another reason is the high sensitivity of this method regarding matrix effects. It could be
shown that humic and low molecular substances as well as macromolecular substances of
secondary effluent have a strong negative effect on MALDI-TOF analyses (data not shown).
Accordingly, also analyses of extracted biopolymers of secondary effluent did not show any
evaluable signals.
Thus, MALDI-TOF-MS was primarily used for investigations of theoretical aspects of fouling
by using model fouling substances (see chapter 2.1.4). Fouling behavior of single protein
solutions under different conditions was investigated by direct analyses of membranes
before and after backwash.
4.1 Setup
To compare the state of a membrane before and after backwash each experiment consisted
of two parallel filtrations of the same model solution and resulted in two membranes, of
which one was backwashed and the other one was not. Both of them were analyzed with
MALDI-TOF-MS.

Fouling analyses with MALDI-TOF-MS
49
4.2 Results
Using this method, the influence of different solution parameters (e.g. pH, humics and Ca2+
concentration) on fouling of several proteins was investigated. In the following part the
influence of humic substances on fouling of BSA is presented exemplary.
In Figure 4.1a) the spectrum of BSA on UF membrane (UP150) after filtration of a BSA salt
solution before backwash is shown. Several peaks are visible. The highest peak at m/z of
around 67k represents the single charged BSA molecule. With rising m/z oligomer peaks of
BSA at m/z of 135k and 200k are present. This presence of oligomeres illustrates the
aggregation of protein molecules on the membrane.
The mass spectrum after backwash (data not shown) shows the presence of the monomer
peak but the absence of oligomer peaks. Consequently proteins can affect fouling in two
ways. On the one hand they can produce mechanically reversible fouling by aggregation on
the membrane. On the other hand they interact as monomers with the membrane which is
mechanically irreversible.
Figure 4.1: MALDI-TOF mass spectra of BSA on the membrane before backwash under the presence of humic
substance and without humic substances; a) BSA in salt solution, b) BSA in salt solution with addional humic
substances; filtration on UP150 membrane.
Figure 4.1b) shows the mass spectrum of a similar filtration test. In this case humic
substances were added to the solution used in Figure 4.1a). This results in a similar mass
spectrum. In comparison to figure a) especially the oligomer peaks are broadened to higher
m/z. This leads to the assumption that there is an additional aggregation of humic
100k 200k 300k
0
2000
4000
6000
8000
100k 200k 300k
0
2000
4000
6000
8000b)
Na
+/C
a2
+
Inte
nsi
ty [
A.
U.]
[BSA+H]+
[2 BSA+H]+
[3 BSA+H]+
[4 BSA+H]+
a)
Na
+/C
a2
+ +
HS
Inte
nsi
ty [
A.
U.]
m/z
[BSA+H]+
[2 BSA+H]+
[3 BSA+H]+
[4 BSA+H]+

Fouling analyses with MALDI-TOF-MS
50
substances and proteins. This results in a lower filterability but also in a lower irreversible
fouling resistance in comparison to filtration test without humic substances (data not
shown). One possible explanation could be that humic substances support formation of a
cake layer (lower filterability) and avoid interaction between membrane and proteins (lower
irreversible fouling resistance).
Summary
• Due to matrix effects and high diversity of fouling substances direct
MALDI-TOF-MS analyses of secondary effluent were not successful.
• With model solutions and direct analyzes of membranes MALDI-TOF-MS is able
to show the state of foulants directly on the membrane even at comparatively
low concentrations.
• Effects of different chemical conditions on fouling behavior of model
substances can be shown.
• High potential in further investigations of theoretical aspects of fouling
formation.

Oxidation by-products
51
5 Oxidation by-products
A major drawback of applications with ozone is the formation of oxidation by-products. The
most discussed by-products from ozonation are bromate and N-nitroso-dimethylamine
(NDMA). One aim of the OXERAM II project was the development of reliable analytical
procedures for bromate and NDMA to analyze the formation of these oxidation by-products
and further to monitor the ozonation pilot unit in Berlin Ruhleben.
5.1 Bromate
5.1.1 Analytical setup
The oxidation by-product bromate was analyzed using the HPLC-MS/MS method described
by Snyder et. al [2005]. All samples were measured after filtration with a 0.45 µm cellulose
nitrate filter. No additional cleanup was applied before analysis for bromate. Analysis was
conducted using a TSQ-Vantage LC-MS/MS from Thermo Fisher Scientific. As internal
standard Br18
O3 was used. Identification and quantification was accomplished using m/z of
110.9 and 112.9 (loss of one oxygen atom).
Figure 5.1: Calibration of bromate in effluent and ultra pure water.
Figure 5.1 shows very good calibration curves (R2 = 0.99) of bromate in ultrapure water and
in effluent. Even at very low concentrations (< 5 µg/L) the curves show a linear correlation
0 20 40 60 80 100
0
50000
100000
150000
0 5 10 15 200
10000
20000
30000
Are
a [
AU
]
BrO3
- concentration [µg/L]
effluent
ultrapure water
R2 = 0.999
Are
a [
AU
]
BrO3
- concentration [µg/L]

Oxidation by-products
52
between concentration and area. Additionally, only minor signal suppression could be
observed in the matrix of the effluent. In conclusion, a limit of quantification at a
concentration of 0.5 µg/L bromate could be determined by direct analysis without any
further pretreatment of the samples.
5.1.2 Bromate formation
To analyze the formation of bromate ozonation batch experiments were done with
secondary effluent and increasing ozone dosages. The following Figure 5.2 shows the results
of these experiments and additionally the data for the formation of bromate in surface
water are plotted into the graph.
Figure 5.2: Formation of bromate in secondary effluent and surface water; (data for surface water were
generated within the OXIRED II project [2011]).
According to Figure 5.2 in both waters the concentration of bromate increases with higher
specific ozone consumption. In untreated samples (without ozone) bromate was not
detectable and with rising specific ozone consumption higher bromate concentrations were
analyzed (up to 180 µg/L for Z = 2.5 mgO3/mgDOC0).
Bromate is declared as a potential human carcinogen [von Gunten 2003] and a limit value of
10 µg/L is set in the German drinking water directive. To avoid the formation of bromate in
concentrations above the limit value of 10 µg/L water (secondary effluent and surface
water) should be ozonated with specific ozone consumption below 0.9 – 1.0 mgO3/mgDOC0.
0.0 0.5 1.0 1.5 2.0 2.5 3.0
0
20
40
60
80
150
200
secondary effluent (DOC = 13 mg/L)
surface water (DOC = 8 mg/L)
BrO
3
- [µ
g/L
]
Z [mg O3/mg DOC]
limit for drinking water = 10µg/L

Oxidation by-products
53
5.1.3 Monitoring
Besides batch ozonation experiments in the lab the ozonation pilot unit in Berlin Ruhleben
was monitored for bromate during the operational time ones a week. Figure 5.3 summarizes
the bromate formation for different applied ozone concentrations at the pilot plant and for
the lab experiments during the experimental phase (March 2011 – December 2012).
Figure 5.3: Bromate formation during the experimental phase in the lab and at the pilot plants for different
ozone consumptions; experimental phase from March 2011 – December 2012; specific ozone consumption is
calculated for DOC = 13 mg/L.
The boxplots of the bromate monitoring in Figure 5.3 show the same trend like in the single
ozonation batch experiments (see chapter 5.1.2). Only for applied ozone concentration
above 10 mgO3/L (Z ~ 0.8 mgO3/mgDOC0) bromate concentrations > 10 µg/L could be
observed.
However, the formation of bromate is influenced by many parameters, such as natural
organic matter, bromide concentration, ammonium concentration or temperature [von
Gunten 2003a; Legube et al. 2004]. This could be a possible explanation for the slight higher
formation of bromate during the long experimental phase compared to the single batch
experiment (see chapter 5.1.2, for Z = 0.9 – 1.0 mgO3/mgDOC0 bromate concentration
> 10 µg/L).
2 6 7.5 9 10 12 15
0
10
20
30
40
50
60
70
limit for drinking water = 10µg/L
applied ozone concentration [mgO3/L]
BrO
3
- [µ
g/L
]
lab (n = 6 - 48)
pilot (n = 11 - 62)
DOC = 13 mg/L
0.15 0.46 0.58 0.7 0.77 0.92 1.15
Z [mgO3/mgDOC
0]
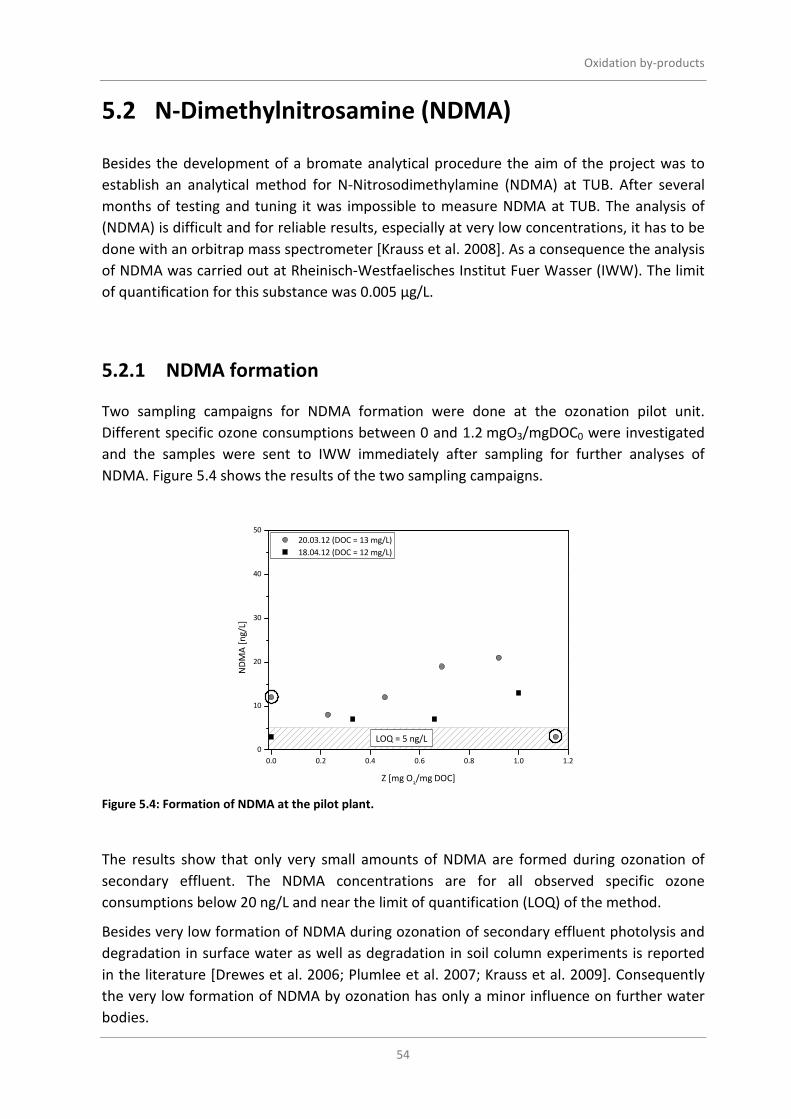
Oxidation by-products
54
5.2 N-Dimethylnitrosamine (NDMA)
Besides the development of a bromate analytical procedure the aim of the project was to
establish an analytical method for N-Nitrosodimethylamine (NDMA) at TUB. After several
months of testing and tuning it was impossible to measure NDMA at TUB. The analysis of
(NDMA) is difficult and for reliable results, especially at very low concentrations, it has to be
done with an orbitrap mass spectrometer [Krauss et al. 2008]. As a consequence the analysis
of NDMA was carried out at Rheinisch-Westfaelisches Institut Fuer Wasser (IWW). The limit
of quantification for this substance was 0.005 µg/L.
5.2.1 NDMA formation
Two sampling campaigns for NDMA formation were done at the ozonation pilot unit.
Different specific ozone consumptions between 0 and 1.2 mgO3/mgDOC0 were investigated
and the samples were sent to IWW immediately after sampling for further analyses of
NDMA. Figure 5.4 shows the results of the two sampling campaigns.
Figure 5.4: Formation of NDMA at the pilot plant.
The results show that only very small amounts of NDMA are formed during ozonation of
secondary effluent. The NDMA concentrations are for all observed specific ozone
consumptions below 20 ng/L and near the limit of quantification (LOQ) of the method.
Besides very low formation of NDMA during ozonation of secondary effluent photolysis and
degradation in surface water as well as degradation in soil column experiments is reported
in the literature [Drewes et al. 2006; Plumlee et al. 2007; Krauss et al. 2009]. Consequently
the very low formation of NDMA by ozonation has only a minor influence on further water
bodies.
0.0 0.2 0.4 0.6 0.8 1.0 1.2
0
10
20
30
40
50
20.03.12 (DOC = 13 mg/L)
18.04.12 (DOC = 12 mg/L)
ND
MA
[n
g/L
]
Z [mg O3/mg DOC]
LOQ = 5 ng/L

Oxidation by-products
55
Summary
• Successful development of an analytical procedure for bromate leading to a
LOQ = 0.5 µg/L without any further pretreatment of the samples.
• Lab experiments and monitoring of the pilot plant shows a formation of
bromate during ozonation of secondary effluent below 10 µg/L with specific
ozone consumption of less than 0.9 mgO3/mgDOC0.
• Formation of NDMA during ozonation of secondary effluent was very low
(< 20 ng/L) for all observed specific ozone consumptions.

Conclusions
56
6 Conclusions
6.1 Influence of ozonation and coagulation on
biopolymers as major organic foulants
The important role of biopolymers in low pressure membrane fouling was investigated in
different studies (Haberkamp [2008], Zheng [2010], Tian et al. [2013]) and could be
confirmed within the OXERAM II project. In lab scale membrane filtration experiments a
clear correlation between biopolymer concentration of the secondary effluent and total
fouling resistance of the ultrafiltration process could be observed.
As a consequence the influence of ozonation and coagulation on biopolymers was analyzed.
LC-OCD measurements pointed to a transformation of biopolymers into compounds smaller
than approx. 50 nm by ozonation. Further the presence of particular matter results in
additional formation of compounds within the biopolymer fraction. Coagulation experiments
showed a significant reduction (up to 50%) of biopolymers independent of the used
coagulation agent while only minor removal of compounds smaller than 10 nm could be
achieved. Even with low dosages of 0.036 mmol Me3+
/L over 30% of the biopolymers were
removed by coagulation. The combination of ozonation and subsequent coagulation showed
no synergetic effect on biopolymer removal and LC-OCD analyzes indicated that compounds
with a size between approx. 50 and 10 nm produced by ozonation could not significantly be
removed by subsequent coagulation.
6.2 Influence of the different pretreatments on low
pressure membrane filtration
The ultrafiltration membrane tests at the TUB lab (PES membrane, pore size = 26 nm)
showed that ozonation as a single pretreatment step is inappropriate for ultrafiltration. With
coagulation up to 50% of total fouling resistance could be reduced. Coagulation with
additional pre-ozonation showed further reduction of total fouling resistance compared to
coagulation without any pre-ozonation. With higher ozone dosages this effect could be
increased furthermore.
Despite the good results that were achieved with the combination of ozonation prior
coagulation for total fouling resistance the irreversible fouling resistance was enhanced and
Conclusions
57
even higher as for the untreated effluent. With coagulation the lowest irreversible fouling
for ultrafiltration could be achieved.
Intensive investigations of the fouling mechanisms indicate cake filtration as the dominant
filtration process for coagulation while additional pre-ozonation leads to increased pore
blocking/in pore fouling. With compressibility test it could be shown that coagulation
creates a very fluffy cake layer whereas ozonation + coagulation leads to a stable but also
very porous fouling layer.
Experiments with different secondary effluents from sewage treatment plants in Berlin
showed comparable fouling behavior for all observed pretreatments. Membrane filtration
results generated with samples from WWTP Ruhleben seemed to be transferable to other
WWTPs in Berlin.
Tests with different membranes showed comparable results for pretreated secondary
effluent concerning total fouling resistance. Total fouling resistance was reduced with
additional ozonation compared to coagulation without ozonation. In contrast to the
observed UF membranes for the tested PVDF microfiltration membrane (pore size = 200 nm)
irreversible fouling was reduced with additional ozonation.
A semi automatic membrane unit for bench-scale filtration tests including a PVDF membrane
(max. pore size = 100 nm) was successfully modified for dead end filtration test and filtration
tests showed the same trend like previously observed in Amicon filtration tests for the
different pretreatments concerning total fouling resistance. In contrast, ozonation with
coagulation resulted in lowest total but also in lowest irreversible fouling.
LC-OCD analyses showed that the transformation of organic matter by ozonation is mainly
responsible for enhanced irreversible fouling of ultrafiltration membranes. In general, the
pore size seems to be a crucial factor if ozonation is used for pretreatment of membrane
filtration.
6.3 Fouling analyses with MALDI-TOF-MS
MALDI-TOF-MS is capable to analyze high molecular organic substances like proteins and
polysaccharides and the idea within the OXERAM II project was to use it as a tool to have a
more detailed mass fingerprint of the fouling affecting substances.
It can be concluded that MALDI-TOF-MS analyses of secondary effluent did not show any
evaluable signals, neither in solution nor on membrane after filtration. Due to a high
diversity of the biopolymer fraction the concentration of single substances is below the
detection limit of the MALDI-TOF-MS. Another drawback is the high sensitivity of the
analytic regarding matrix effects. Humic and low molecular substances as well as
macromolecular substances of secondary effluent showed a strong negative effect on

Conclusions
58
MALDI-TOF analyses. Accordingly, also analyses of extracted biopolymers of secondary
effluent did not show any evaluable signals.
Consequently, MALDI-TOF-MS was primarily used for investigations of theoretical aspects of
fouling by using model fouling substances. With model solutions and direct analyzes of
membranes MALDI-TOF-MS is able to show the state of foulants directly on the membrane
even at comparable low concentrations and further effects of different chemical conditions
on fouling behavior of model substances can be shown. In conclusion, MALDI-TOF-MS has a
high potential in further investigations of theoretical aspects of fouling formation.
6.4 Formation of oxidation by-products
A major drawback of applications with ozone is the formation of oxidation by-products. A
task of the OXERAM II project was the development of reliable analytical procedures for
bromate and NDMA to analyze the formation of these oxidation by-products and further to
monitor the ozonation pilot unit in Berlin Ruhleben.
On the one hand an analytical procedure for bromate was successful developed with
LC-MS/MS at TUB. With the procedure it is possible to quantified samples without any
further pretreatment. The limit of quantification for this procedure is 0.5 µg bromate per
liter. On the other hand it was not possible to setup an analytical method for NDMA with the
LC-MS/MS at TUB. For reliable results and quantification of very low concentrations, this has
to be done with an orbitrap mass spectrometer. As a consequence the analysis of NDMA
was carried out at Rheinisch-Westfaelisches Institut Fuer Wasser (IWW).
Lab experiments and further the monitoring of the pilot plant in Ruhleben during the project
runtime showed a formation of bromate during ozonation of secondary effluent. Higher
concentrations of bromate (above 10 µg/L; limit value in the drinking water directive) were
produced only at specific ozone consumptions higher than 0.9 mgO3/mgDOC0. To avoid the
formation of bromate in concentrations above the limit value secondary effluent and also
surface water should be ozonated with specific ozone consumptions below 0.9 –
1.0 mgO3/mgDOC0.
Only very small amounts of NDMA are formed during ozonation of secondary effluent. The
NDMA concentrations are for all observed specific ozone consumptions below 20 ng/L and
near the limit of quantification (LOQ) of the method.
References
59
References
Chan, R., V. Chen and M. P. Bucknall (2002). "Ultrafiltration of protein mixtures:
measurement of apparent critical flux, rejection performance, and identification of
protein deposition." Desalination 146(1-3): 83-90.
Crittenden, J. C., R. R. Trussell, D. W. Hand and M. W. Harza (2005). Water treatment:
principles and design. New Jersey, U.S.A., John Wiley & Sons.
Drewes, J. E., C. Hoppe and T. Jennings (2006). "Fate and transport of N-nitrosamines under
conditions simulating full-scale groundwater recharge operations." Water
Environment Research 78(13): 2466-2473.
Genz, C., U. Miehe, R. Gnirss and M. Jekel (2011). "The effect of pre-ozonation and
subsequent coagulation on the filtration of WWTP effluent with low-pressure
membranes." Water Science and Technology 64(6): 1270-1276.
Haberkamp, J. (2008). Organisches Membranfouling bei der Ultrafiltration kommunaler
Kläranlagenabläufe: Ursachen, Mechanismen und Maßnahmen zur Verringerung. (In
German.). Chair of Water Quality Control, Technische Universität Berlin, Doctoral
dissertation, ITU-Schriftenreihe, ISBN 978-3-89720-553-6.
Haberkamp, J., M. Ernst, H. Paar, D. Pallischeck, G. Amy and M. Jekel (2011). "Impact of
organic fractions identified by SEC and fluorescence EEM on the hydraulic
reversibility of ultrafiltration membrane fouling by secondary effluents." Desalination
and Water Treatment 29(1-3): 73-86.
Hermia, J. (1982). "Constant Pressure Blocking Filtration Laws - Application to Power-Law
Non-Newtonian Fluids." Transactions of the Institution of Chemical Engineers 60(3):
183-187.
Holle, A., A. Haase, M. Kayser and J. Hohndorf (2006). "Optimizing UV laser focus profiles for
improved MALDI performance." Journal of Mass Spectrometry 41(6): 705-716.
Huebner, U., J. Sammet, T. Grummt and M. Jekel (2011). Final Report of OXIRED – Phase 2:
Optimisation of organic compound removal in artificial recharge systems by redox
control and enhanced oxidation. Berlin.
Jekel, M., C. Gottschalk, J. A. Libra and A. Saupe (2007). Full-Scale Applications. Ozonation of
Water and Waste Water, Wiley-VCH Verlag GmbH: 21-36.
Jekel, M. R. (1983). "The Benefits of Ozone Treatment Prior to Flocculation Processes."
Ozone-Science & Engineering 5(1): 21-35.
Jermann, D., W. Pronk, S. Meylan and M. Boller (2007). "Interplay of different NOM fouling
mechanisms during ultrafiltration for drinking water production." Water Research
41(8): 1713-1722.

References
60
Karas, M. and F. Hillenkamp (1988). "Laser Desorption Ionization of Proteins with Molecular
Masses Exceeding 10000 Daltons." Analytical Chemistry 60(20): 2299-2301.
Krauss, M. and J. Hollender (2008). "Analysis of nitrosamines in wastewater: Exploring the
trace level quantification capabilities of a hybrid linear ion trap/orbitrap mass
spectrometer." Analytical Chemistry 80(3): 834-842.
Krauss, M., P. Longree, F. Dorusch, C. Ort and J. Hollender (2009). "Occurrence and removal
of N-nitrosamines in wastewater treatment plants." Water Research 43(17): 4381-
4391.
Legube, B., B. Parinet, K. Gelinet, F. Berne and J. P. Croue (2004). "Modeling of bromate
formation by ozonation of surface waters in drinking water treatment." Water
Research 38(8): 2185-2195.
Leize, E. M., E. J. Leize, M. C. Leize, J. C. Voegel and A. Van Dorsselaer (1999). "Matrix-
assisted laser desorption ionization mass spectrometry: A new tool for probing
interactions between proteins and metal surfaces - Use in dental implantology."
Analytical Biochemistry 272(1): 19-25.
Petrus, H. B., H. Li, V. Chen and N. Norazman (2008). "Enzymatic cleaning of ultrafiltration
membranes fouled by protein mixture solutions." Journal of Membrane Science
325(2): 783-792.
Plumlee, M. H. and M. Reinhard (2007). "Photochemical attenuation of N-
nitrosodimethylamine (NDMA) and other Nitrosamines in surface water."
Environmental Science & Technology 41(17): 6170-6176.
Roorda, J. H. (2004). Filtration Characteristics in Dead-End Ultrafiltration of Wwtp-Effluent.,
Doctoral dissertation, Delft University of Technology, Delft.
Savitzky, A. and M. J. E. Golay (1964). "Smoothing + Differentiation of Data by Simplified
Least Squares Procedures." Analytical Chemistry 36(8): 1627-&.
Schulz, M. (2012). Submicron particle analysis to characterize fouling in tertiary membrane
filtration. Chair of Water Quality Control. Berlin, Technische Universität Berlin,
Diploma thesis.
Snyder, S. A., B. J. Vanderford and D. J. Rexing (2005). "Trace analysis of bromate, chlorate,
iodate, and perchlorate in natural and bottled waters." Environmental Science &
Technology 39(12): 4586-4593.
Song, Y. L., B. Z. Dong, N. Y. Gao and S. J. Xia (2010). "Huangpu River water treatment by
microfiltration with ozone pretreatment." Desalination 250(1): 71-75.
These, A. and T. Reemtsma (2005). "Structure-dependent reactivity of low molecular weight
fulvic acid molecules during ozonation." Environmental Science & Technology 39(21):
8382-8387.
Tian, J.-y., M. Ernst, F. Cui and M. Jekel (2013). "Correlations of relevant membrane foulants
with UF membrane fouling in different waters." Water Research 47(3): 1218-1228.

References
61
Van Geluwe, S., L. Braeken and B. Van der Bruggen (2011). "Ozone oxidation for the
alleviation of membrane fouling by natural organic matter: A review." Water
Research 45(12): 3551-3570.
von Gunten, U. (2003). "Ozonation of drinking water: Part I. Oxidation kinetics and product
formation." Water Research 37(7): 1443-1467.
von Gunten, U. (2003a). "Ozonation of drinking water: Part II. Disinfection and by-product
formation in presence of bromide, iodide or chlorine." Water Research 37(7): 1469-
1487.
Zheng, X. (2010). Major Organic Foulants in Ultrafiltration of Treated Domestic Wastewater
and their Removal by Bio-filtration as Pre-treatment. Chair of Water Quality Control,
Technische Universität Berlin, Doctoral dissertation, ITU-Schriftenreihe, ISBN 978-3-
89720-557-4.

Appendix
i
Appendix
30 40 50 60
0
10
20
30
30 40 50 60
0
10
20
30
30 40 50 60 70
0
10
20
30c)
b)
1015 8
size [nm]
OC
-sig
na
l [a
.u.]
retention time [min]
HW50S
Dextran 200
Dextran 70
Dextran 35
PEG 40
PEG 23
PEG 12
30a)
8101520
size [nm]
OC
-sig
na
l [a
.u.]
retention time [min]
HW55S
Dextran 200
Dextran 70
Dextran 35
PEG 23
PEG 12
30
101520
size [nm]
OC
-sig
na
l [a
.u.]
retention time [min]
HW65S
Dextran 200
Dextran 70
Dextran 35
PEG 40
PEG 23
PEG 12
30