D3.2 Local Energy Architecture Description
57
ERA-Net Smart Energy Systems This project has received funding in the framework of the joint programming initiative ERA-Net Smart Energy Systems, with support from the European Union’s Horizon 2020 research and innovation programme. D3.2 LOCAL ENERGY COMMUNITY ARCHITECTURE DESCRIPTION VERSION 1.0 31 May 2021
Transcript of D3.2 Local Energy Architecture Description

ERA-Net Smart Energy Systems
This project has received funding in the framework of the joint programming
initiative ERA-Net Smart Energy Systems, with support from the European
Union’s Horizon 2020 research and innovation programme.
D3.2 LOCAL ENERGY COMMUNITY
ARCHITECTURE DESCRIPTION
VERSION 1.0
31 May 2021

Deliverable No. 3.2 | Local Energy Community Architecture Description
- 2 -
INTERNAL REFERENCE
Deliverable No.: D 3.2
Deliverable Name: LOCAL ENERGY COMMUNITY ARCHITECTURE DESCRIPTION
Lead Participant: Offshore Renewable Energy Catapult (Scotland UK)
Work Package No.: 3
Task No. & Name: T 3.2
Document (File): D3.2 Local Energy Community Architecture Description
Issue (Save) Date: 2021- 05-31
DOCUMENT STATUS
Date Person(s) Organisation
Author(s) 2021-05-31 John Nwobu ORE Catapult (Lead)
Tanja Tötzer
Sebastian
Stortecky
Kazmi Jawad
Oliver Jung
Austrian Institute of Technology
Peder Berne
John Hallbeck
Jenny Palm
e.on Sweden
City of Malmö
Lund University
Sebastian Goelz Fraunhofer ISE
Approval by 2021-06-01 Mark Stefan Austrian Institute of Technology
DOCUMENT SENSITIVITY
☐ Not Sensitive Contains only factual or background information; contains no new
or additional analysis, recommendations or policy-relevant
statements ☒ Moderately
Sensitive
Contains some analysis or interpretation of results; contains no
recommendations or policy-relevant statements
☐ Sensitive Contains analysis or interpretation of results with policy-relevance
and/or recommendations or policy-relevant statements
☐ Highly Sensitive
Confidential
Contains significant analysis or interpretation of results with major
policy-relevance or implications, contains extensive
recommendations or policy-relevant statements, and/or contain
policy-prescriptive statements. This sensitivity requires SB decision.
Deliverable No. 3.2 | Local Energy Community Architecture Description
- 3 -
TABLE OF CONTENT
LIST OF FIGURES.................................................................................................................. 5
LIST OF TABLES ................................................................................................................... 6
LIST OF ABBREVIATIONS .................................................................................................... 7
EXECUTIVE SUMMARY ........................................................................................................ 8
1 INTRODUCTION ....................................................................................................... 11
1.1 Definitions ........................................................................................................................... 12
2 REFERENCE ARCHITECTURE .................................................................................... 13
2.1 NIST Framework and Roadmap for Smart Grid Interoperability Standards
4.0 ......................................................................................................................................... 14
2.1.1 Distribution Domain ........................................................................................................................ 15
2.1.2 Generation including DER Domain ................................................................................................ 15
2.1.3 Customer Domain ............................................................................................................................ 16
2.1.4 Service Provider Domain................................................................................................................. 16
2.1.5 Transmission Domain...................................................................................................................... 16
2.1.6 Markets Domain ............................................................................................................................... 16
2.1.7 Operations Domain ......................................................................................................................... 17
2.2 Smart Grid Architecture Model (SGAM) ............................................................................ 17
2.3 NIST Logical Reference Model (LRM) ................................................................................ 18
2.4 Architecture Development Methodology ........................................................................ 19
2.4.1 Phase I: Context identification ....................................................................................................... 20
2.4.2 Phase II: Characterisation & Goals................................................................................................. 20
2.5 CLUE Reference Architecture ............................................................................................ 21
3 STAKEHOLDER ANALYSIS ........................................................................................ 27
3.1 Stakeholders and Scope Identification ............................................................................ 27
3.2 Austria ................................................................................................................................. 29
3.2.1 Stakeholder mapping in Southern Burgenland ........................................................................... 30
3.2.2 Stakeholder mapping in Gasen ...................................................................................................... 33
3.3 Sweden ................................................................................................................................. 36

Deliverable No. 3.2 | Local Energy Community Architecture Description
- 4 -
3.4 Germany .............................................................................................................................. 39
3.5 Scotland ............................................................................................................................... 42
3.6 Cross-country comparison ................................................................................................. 46
REFERENCES ...................................................................................................................... 48
APPENDIX .......................................................................................................................... 49
Disclaimer
The content and views expressed in this material are those of the authors and do
not necessarily reflect the views or opinion of the ERA-Net SES initiative. Any
reference given does not necessarily imply the endorsement by ERA-Net SES.
About ERA-Net Smart Energy Systems
ERA-Net Smart Energy Systems (ERA-Net SES) is a transnational joint programming
platform of 30 national and regional funding partners for initiating co-creation and
promoting energy system innovation. The network of owners and managers of
national and regional public funding programs along the innovation chain provides
a sustainable and service oriented joint programming platform to finance projects
in thematic areas like Smart Power Grids, Regional and Local Energy Systems,
Heating and Cooling Networks, Digital Energy and Smart Services, etc.
Co-creating with partners that help to understand the needs of relevant
stakeholders, we team up with intermediaries to provide an innovation eco-system
supporting consortia for research, innovation, technical development, piloting and
demonstration activities. These co-operations pave the way towards
implementation in real-life environments and market introduction.
Beyond that, ERA-Net SES provides a Knowledge Community, involving key demo
projects and experts from all over Europe, to facilitate learning between projects
and programs from the local level up to the European level.
www.eranet-smartenergysystems.eu

Deliverable No. 3.2 | Local Energy Community Architecture Description
- 5 -
LIST OF FIGURES
Figure 2-1: NIST Smart Grid Conceptual Model [1] ................................................................. 14
Figure 2-2: Smart Grid Architecture Model (SGAM) [2] .......................................................... 18
Figure 2-3: NIST Logical Reference Model [2] ............................................................................... 19
Figure 2-4: An overview of the developed methodology ....................................................... 20
Figure 2-5: A mapping of NIST Smart Grid Actors to an SGAM Plane [3] ................................... 21
Figure 2-6: CLUE Reference Architecture. ................................................................................ 23
Figure 3-1-: Overview of CLUE project stakeholders when mapped on various life-cycle
phases. ........................................................................................................................................... 28
Figure 3-2: Position and roles of the stakeholders in the region of the Southern
Burgenland .................................................................................................................................... 31
Figure 3-3: Roles of the stakeholders in the Southern Burgenland ............................................ 32
Figure 3-4: Stakeholder mapping in Southern Burgenland ........................................................ 33
Figure 3-5: Position and roles of the stakeholders in the municipality of the Gasen ................ 34
Figure 3-6: Roles of the stakeholders in the municipality of Gasen ............................................ 35
Figure 3-7: Role analysis of the stakeholders in the municipality of Gasen ............................... 36
Figure 3-8: Position and roles of the stakeholders in Sweden .................................................... 37
Figure 3-9: Roles of the stakeholders in Sweden.......................................................................... 38
Figure 3-10: Stakeholder mapping in Sweden ............................................................................. 39
Figure 3-11: Position and roles of the stakeholders in Herne-Shamrockpark (Germany)......... 40
Figure 3-12: Roles of the stakeholders in Herne-Shamrockpark (Germany) .............................. 41
Figure 3-13: Position and roles of the stakeholders in Scotland ................................................ 43
Figure 3-14: Roles of the stakeholders in Scotland ...................................................................... 44
Figure 3-15: Stakeholder mapping in Scotland............................................................................ 45
Figure 3-16: Role analysis of the stakeholders in Scotland ......................................................... 45

Deliverable No. 3.2 | Local Energy Community Architecture Description
- 6 -
LIST OF TABLES
Table 2-1: Summary of outcome from Phase I.1 .................................................................... 22
Table 2-2: List of identified NIST Smart Grid Actors ............................................................... 24
Table 3-1: Cross-country comparison- stakeholder mapping in Austria, Sweden, Germany,
and Scotland .................................................................................................................................. 46

Deliverable No. 3.2 | Local Energy Community Architecture Description
- 7 -
LIST OF ABBREVIATIONS
SGAM Smart Grid Architecture Model
NIST National Institute of Standards and Technology
NIST LRM NIST Logical Reference Model
LECs Local Energy Communities
ICT Information and Communication Technology
CLUE Concepts, Planning, Demonstration and Replication of Local User-
friendly Energy Communities

Deliverable No. 3.2 | Local Energy Community Architecture Description
- 8 -
EXECUTIVE SUMMARY
The energy systems landscape is continuously evolving, and over the past decades
has seen an acceleration in clean energy alternatives. With the rise in renewable
energy and smart electricity grid initiatives, the future energy systems landscape
must now be transformed from the traditional methods of generating, transmitting,
and distributing electricity.
Local Energy Communities (LECs) will be an essential element of this future energy
system and are a concept of enabling communities to be directly involved in the
decision-making of how local energy generation, demand and distribution is used
within their environment.
Despite efforts to date on LEC’s, there are no established tools to manage the system
operation across a range of different environments and the development and
utilisation of such tools is essential in progressing the establishment of LEC’s as part
of the future energy system. The ERA Net project CLUE (Concepts, Planning,
Demonstration and Replication of Local User-friendly Energy Communities) sets out
to acquire knowledge of building such tools on optimized design, planning and
operation of Local Energy Communities (LECs). This is executed by leading European
research institutes, industry, and local partners, working together in five demo sites
in four countries (Austria, Sweden, Germany, and Scotland).
In this deliverable, we have explored two aspects which are required in enabling
future interactions in LEC’s and the surrounding energy system:
• The development of a local energy community reference ICT
architecture (CLUE reference architecture)
• The understanding of the role of stakeholders within local energy
communities
In the development of the CLUE reference architecture, we conducted a series of
workshops to analyse and understand the required framework for future LEC
concepts. This was done through cross collaboration with partners.
A reference architecture based on international standards was developed to provide
a common foundation for the CLUE use cases across the different demonstration
sites in the project. In order to achieve this, certain steps were taken.
First, a mission statement for the project was derived from the workshops. These
statements focused on achieving the high-level objectives of local energy sharing,
local grid security, local market/regulation and stakeholder harmonisation.
Next, an architecture methodology was developed. This was done by first
understanding the system requirements and then building this on the sound
foundations of the NIST Logical Reference Model and the SGAM model. The
methodology consisted of two phases: the context identification phase; and the
characterisation and goals phase. The context identification phase is the most

Deliverable No. 3.2 | Local Energy Community Architecture Description
- 9 -
critical step of the methodology that identifies and determines the solution for the
environment where the system will be working and interacting. This identified the
relevant domains within the CLUE project from the NIST Smart Grid Conceptual
model and identified relevant actors from the NIST Smart Grid actors (NISTIR 7628).
Once the domains had been identified, the characterisation and goals phase
classified each of the actors (in NISTIR 7628) according to their roles in SGAM.
Finally, the CLUE reference architecture was developed. This was done through a
detailed study conducted through a series of workshops with partners to first
identify the context and later extract the requirements for a use case definition.
There were five domains identified that were relevant to the solution in the CLUE
project (customers, distribution, operations, service providers, and market). Two
domains, transmission and generation including distributed energy resources (DER),
were identified as not relevant during the analysis. The actors within these domains
were further analysed and categorised based on: if they were relevant within the
CLUE project: if they were primary secondary or supporting actors: and their ICT and
electrical flows.
In understanding the wider role of stakeholders in the energy community, it was
necessary to develop a good overview of the relevant stakeholders and a
comprehensive understanding of which stakeholders are most crucial in
establishing the future of LEC’s. A regional stakeholder mapping exercise using the
PESTLE analysis was conducted to explore stakeholders based on their political,
economic, social, technical, legal and environmental (PESTLE) interests, their
awareness of LEC’s and if their existing roles need to be strengthened.
In Austria, the municipality of Gasen and the region of Southern Burgenland were
analysed. In Southern Burgenland, 48 stakeholders were identified with their roles
mostly economic (40%), with political (21%) and technological (13%) stakeholders.
Most of the stakeholders had a role in a specific sector, district, or area (69%) and
some stakeholder roles have to be strengthened (23%); these are the governance
stakeholders, the social stakeholders and two technological stakeholders. In Gasen,
25 stakeholders in total were identified with their roles mostly social (60%),
economic (16%) and legal (12%) stakeholders. Most of the stakeholders are already
aware and active (56%), 32% of the stakeholder roles should be strengthened and
there were no stakeholders who are required but not yet active.
In Sweden, there were a total of 16 stakeholders identified with their roles mostly
technological/energy stakeholders (37%) and spatial-economic stakeholders (25%).
The highest number of stakeholders in Sweden have a role in a specific sector and/or
in a specific district/area (56%) and have a role on the entire city level/considering
large scale or impact (31%).
In Germany, a total of 10 stakeholders were identified with the social stakeholders
(media and tenants) having a key role in Herne-Shamrockpark. The stakeholders of
Germany have different roles, which are mostly technological (33%), social (17%) and
other (17%). The findings from the stakeholder mapping is that all the stakeholders
in Herne-Shamrockpark are already aware and active.

Deliverable No. 3.2 | Local Energy Community Architecture Description
- 10 -
In Scotland, a total of 48 stakeholders were identified with the social stakeholders
having a key role. The stakeholders of Scotland hold different roles, who are mostly
economic (38%), technological (33%), social (11%) and legal (10%) stakeholders. The
role analysis of Scotland shows that most of the stakeholder roles (31%) have to be
strengthened. 13 of total 48 stakeholders are already aware and active, and a
quarter of the stakeholders are required but not yet active. All in all, about 50% of
the Scottish stakeholders have to be strengthened in more than one role.
The regional stakeholder analysis showed that the main role of the stakeholders in
each country is different. In all cases social and technological stakeholders are
strongly represented and social stakeholders are mainly the “driving” stakeholders,
which illustrates their importance in the CLUE project. Most of the stakeholders
were shown to be already aware and active, which shows high ambitions of the
stakeholders in each country within the CLUE project. Only in the Scottish case, some
stakeholders (25%) are required but not yet active. This illustrates that the topic of
energy communities still needs further awareness raising and mobilisation of
stakeholders.

Deliverable No. 3.2 | Local Energy Community Architecture Description
- 11 -
1 INTRODUCTION
Local Energy Communities (LECs) as mentioned in the Clean Energy for All European
package of the European Commission will become an important pillar of the new
energy system architecture. Until now, LEC planners have not had the sufficient
tools to design LEC energy systems and these tools are required to identify the
optimal operation of LECs in order to realize their inherent benefits for
communities.
The ERA-Net project CLUE (Concepts, Planning, Demonstration and Replication of Local
User-friendly Energy Communities) was set up to progress the development of these
tools for successful replication and upscaling of LECs and aims to acquire knowledge
on optimal design, planning and operation.
The project consortium consists of leading European research institutes, industry,
and local partners, working together to progress the agenda of local energy
communities through cross-country analysis and by validating meaningful proof-of-
concepts through pilot demonstration projects. There are five demo sites within the
project, two in Austria and three others in Sweden, Germany, and Scotland) working
on different technological and market solutions for their respective countries.
The objectives and goals of the project are;
1) To learn from the range of different challenges, prerequisites, and
approaches of developing local energy communities (LECs) understanding
the potential and flexibilities across the five demonstration sites, their
integration into ICT architecture, and the interaction with surrounding energy
systems.
2) To develop and validate tools supporting the creation and operation of
sustainable local energy systems and to close the gap of missing tools,
considering sector coupling, flexibilities, local and coordinating cloud
functionalities.
3) To derive tailor-made transition paths for selected groups of LECs through
stakeholder interaction in workshops to identify relevant drivers, success
factors, and barriers.
This deliverable addresses the areas of developing a reference ICT architecture and
understanding the roles of stakeholders within LEC’s. This is looks at:
• The development of a reference ICT architecture through a study of grid
organisation concepts and concepts for flexible interaction.
• The analysis of CLUE stakeholders within LEC’s with relation to understanding
the current state of their roles and suggest where these can be improved.
Section 2 details the development of the CLUE reference ICT architecture for the
project based on a framework that consolidates the NIST Logical Reference Model
(NIST LRM) and Smart Grid Architecture Model (SGAM).

Deliverable No. 3.2 | Local Energy Community Architecture Description
- 12 -
Section 3 shows a stakeholder analysis conducted using the PESTLE methodology
to the CLUE explore stakeholders based on their political, economic, social,
technical, legal and environmental (PESTLE) interests, their awareness of LEC’s and
state of their existing in LECs.
1.1 Definitions
Use case: A use case defines the relations between the components and users and
their interaction within a system to attain particular goals, primarily from a
technical/energy (and not from a commercial) perspective.
Actors: NISTIR 7628 Guidelines for Smart Grid Cyber Security is another well-known
standard from the NIST. In addition to providing the detailed cyber security mapping
and recommendation with the Smart Grid, this standard also provides a list of actors
in each of the NIST domains. (See Appendix)
Context: is defined as the environment where the system will be working and
interacting. The environment can consist of individuals, systems, sub-systems,
processes, documents, etc.
Stakeholders: individuals, groups or organizations that are involved, concerned or
affected by the actions or decisions made within the use case. This comprises not
only the members (both prosumers and consumers) of the community, but also
further parties as the local DSO, energy suppliers, local authorities, municipalities
and companies. In the context of business model development for EC, primary
stakeholders are all parties for whom value should be created to ensure economic
sustainability.

Deliverable No. 3.2 | Local Energy Community Architecture Description
- 13 -
2 REFERENCE ARCHITECTURE
A common definition of use cases and business models and the characterisation of
the demo sites for the CLUE project have been provided in the previous deliverable
No D3.11. This section builds upon previous work in developing a reference
architecture.
A reference architecture based on international standards is established to provide
a common foundation for the CLUE use cases throughout the project's involved
countries and regions. The CLUE reference architectural definition aids in the
development of a shared understanding as well as the enhancement of
communication with a shared set of actors and interfaces. This will make it easier,
for example, to compare the various pilot use cases and identify commonalities and
differences.
The mission statement for the project directs the identification of the context2, the
selection of the actors, and their goals. The mission statement is created from the
project proposal's inputs and then refined during the consortium's numerous
architecture workshops. The following is the finalized mission statement:
“Generation and consumption of energy, mostly from renewable energy resources, as
locally as possible.”
Based on the mission statements above, this is focused on achieving the high-level
objectives including:
S# Area/Focus Objective
R1 Local energy sharing Local loads should be satisfied using local
generation
R2 Local grid security Specifically using smart
grid/control/monitoring to optimally
control the grid to eliminate the need for
grid reinforcement
R3 Local market/regulation Regulations related to all actors involved in
the energy community
1 D 3.1: High Level Description of Use Cases and Business Models Link
2 Context is defined as the environment where the system will be working and interacting.
The environment can consist of individuals, systems, sub-systems, processes,
documents, etc.

Deliverable No. 3.2 | Local Energy Community Architecture Description
- 14 -
R4 Stakeholder
harmonization
Identifying and taking into consideration all
the stakeholders when designing and
implementing strategies for local energy
communities in respective regions and
countries
Numerous European and international Smart Grid roadmaps and reference models
give a systematic way to analysing the criteria for defining the boundaries of a
solution. Using such standards has the advantage of having a common vocabulary
that can enhance communication. NIST Framework and Roadmap for Smart Grid
Interoperability Standards 4.0, NISTIR7628 also known as NIST Logical Reference
Model (NIST LRM), and Smart Grid Architectural Model (SGAM) are among the
standards used for defining a reference architecture for CLUE. Below is a brief
description of each of these standards.
2.1 NIST Framework and Roadmap for Smart Grid Interoperability Standards
4.0
The NIST Framework and Roadmap for Smart Grid Interoperability Standards [1],
Release 4.0, is a comprehensive standard that covers various Smart Grid roadmaps
and guidelines. It provides, for example, interoperability suggestions/guidelines as
well as a cybersecurity solution for minimizing threats and allowing communication.
This is the newest standard released in 2021 as a continuation of the previous such
standards including the widely used and accepted Release 3.0 released in 2010.
Figure 2-1: NIST Smart Grid Conceptual Model [1]

Deliverable No. 3.2 | Local Energy Community Architecture Description
- 15 -
A variety of models were also covered in this standard. One of these is the Smart
Grid Conceptual Model. An overview of this conceptual model is presented in Figure
2-1.
The general structure and implementations of electric grid networks are depicted in
this model. This approach is designed to provide a high level of abstraction,
providing for a comprehensive view of the Smart Grid. In terms of having a shared
interpretation that can be understood, a high-level view like this is often
advantageous.
As can be seen, this model provides a high-level view of the whole Smart Grid
spectrum dividing it into seven major domains. These domains include:
2.1.1 Distribution Domain
As per the standard, this domain
represents the entities that supply and
receive electricity from consumers.
Some of these entities may be able to
store and/or generate electricity as well.
2.1.2 Generation including DER Domain
As per the standard, the traditional
generation sources, as well as distributed
energy resources, are represented by this
domain. In general, these sources refer to
electricity producers who may also store
energy for later distribution. On a logical
level, generation refers to larger-scale
technologies that are typically connected
to the transmission grid, such as classical
thermal power, large-scale hydropower,
and utility-scale renewable projects. In
the customer and distribution sectors, DER is linked to generating, storage, and
demand response.

Deliverable No. 3.2 | Local Energy Community Architecture Description
- 16 -
2.1.3 Customer Domain
As per the standard, the
Customers/consumers of energy are
represented by this domain. These
consumers can generate, store, and
manage energy. Residential,
commercial, and industrial customers
have historically been separated into
three categories, each with its sub-
domains.
2.1.4 Service Provider Domain
As per the standards, this domain
represents the
companies/organizations/entities that
provide services to electricity
consumers, utilities, and/or customers.
2.1.5 Transmission Domain
As per the standards, this domain mainly
represents the long-distance high-
voltage electricity carriers.
2.1.6 Markets Domain
As per the standard, this domain
represents the facilitators and players
in electricity markets and other
economic processes that drive
behaviour and optimize system
outcomes.

Deliverable No. 3.2 | Local Energy Community Architecture Description
- 17 -
2.1.7 Operations Domain
As per the standards, this domain
represents the process and activities
concerning the movement of electricity
from generation to consumption.
2.2 Smart Grid Architecture Model (SGAM)
The widely used Smart Grid Architecture Model (SGAM) (CEN-CENELEC-ETSI Smart
Grid Architecture Model) was chosen as the architecture framework for the
development in the CLUE project as shown in Figure 2‑2.
In its three-dimensional representation, SGAM groups functions into zones,
domains and interoperability levels, with the zones representing the hierarchical
management of power grids (Process, Field, Station, Operation, Enterprise, Market).
Electricity distribution is divided into different domains (Generation, Transmission,
Distribution, Distributed Energy Resources (DER) and Customer). The vertical
interoperability layers represent the categories in which interoperability must be
ensured (components, communication, information, functionality, and business).
The SGAM model is primarily used to structure and visualise Smart Grid applications.
The aim is to be applicable to as many use cases as possible and to serve as a guide
for identifying interoperability gaps. It does not contain any information about the
technologies or protocols used.

Deliverable No. 3.2 | Local Energy Community Architecture Description
- 18 -
Figure 2-2: Smart Grid Architecture Model (SGAM) [2]
2.3 NIST Logical Reference Model (LRM)
The NIST Logical Reference Model (NIST LRM) depicted in Figure 2-3 constitutes a
major contribution to the development of Smart Grid reference architectures. It is
part of NIST 7628 Guidelines for Smart Grid Cybersecurity [1]. For developing the
NIST LRM various use case were analysed and consolidated. Thus, the LRM includes
the communication connections required to implement the use cases considered
during the development phase. However, in the future new use cases might come
up that require additional actors and interfaces.

Deliverable No. 3.2 | Local Energy Community Architecture Description
- 19 -
Figure 2-3: NIST Logical Reference Model [2]
The NIST LRM includes the smart grid domains, the actors that are part of these
domains, and the interfaces between them. Moreover, each interface is assigned a
category with a set of associated security requirements.
Like the Smart Grid Architecture Model (SGAM) that will be described in section 2.1,
the origin of the NIST LRM is the NIST Domain Model. The individual actors can in
principle be easily mapped to SGAM. One exception is the actor Customer
Distributed Energy Resources (DER) which is assigned to the customer premises in
the NIST LRM.
2.4 Architecture Development Methodology
Designing and creating a complex system like CLUE is a difficult endeavour that
necessitates establishing and implementing a properly constructed methodology to
fulfil the system's objectives. It should also be noted that building any new system
necessitates a reasonable understanding of first the system's requirements. Since
the requirements exist in a context3, this comprehension necessitates that
significant effort is expended in clearly identifying the context of such a system. As
a result, a methodology with two major phases for defining a reference architecture
is defined. The methodology is based on NIST Smart Grid Conceptual model, NIST
LRM, and SGAM standards. The methodology is practical and based on sound
3 Context is defined as the environment where the system will be working and interacting.
The environment can consist of individuals, systems, sub-systems, processes,
documents, etc.

Deliverable No. 3.2 | Local Energy Community Architecture Description
- 20 -
foundations. The NIST Logical Reference Model and the SGAM model have been
used already earlier to develop e.g., the Austrian Smart Grid reference architecture
[3].
An overview of the methodology is presented in Figure 2-4. As can be seen, the
methodology consists of two phases. It should however be noted that the first phase
helps in extracting the reference architecture while the second phase is dedicated
to extracting the requirements that lead to use case development. Below, a short
description of the two phases is presented.
Figure 2-4: An overview of the developed methodology
2.4.1 Phase I: Context identification
This is the first and most critical step in the methodology. The objective of this phase
is to identify and determine the context of the CLUE solution. The context provides
valuable insights into the expected interactions and surrounding entities and helps
in defining the solution boundaries. The outcome of this phase is a conceptual
model. This phase includes two sub-phases:
1. Identification of the relevant domains from the NIST Smart Grid Conceptual
model
2. Identification of the relevant actors from NIST Smart Grid actors (NISTIR
7628) for the selected domains
2.4.2 Phase II: Characterisation & Goals
Once the domains and actors have been identified, this phase looks at each of the
actors, classifies it according to its role. Later, based on the classification, possible
goals are brainstormed to access the requirements for the features and services
that would be needed from the CLUE solutions so that the goals can be achieved.
At the use case level, both NIST and SGAM are significant and widely utilized for
Smart Grid application planning and analysis. The mapping of the NIST Smart Grid
actors, as presented in NISTIR 7628 and used in phase I above, can be mapped to
the SGAM plan. One such mapping is presented in [3] and used in this methodology

Deliverable No. 3.2 | Local Energy Community Architecture Description
- 21 -
for later development. An overview of this mapping is presented in Figure 2-5. The
actors here are identified with their ID, as mentioned in the standard. Seven
different colours are used to represent the seven domains.
In the first step, both SGAM and NIST LRM are consolidated. For this purpose, the
actors of the NIST model are mapped to the corresponding SGAM zones, domains,
and interoperability as shown in Figure 2-5. In order to develop an architecture for
a concrete use case, first, the use case needs to be analysed including the
identification of relevant actors, diagrams, and requirements. The information
about actors as specified in the NIST LRM is in the next step used to define the actual
components. Business layer information like business objectives or economic
constraints can be derived from the use case analysis. The functional layer
represents the different functionalities required for implementing the use. The
functionality can also be described using sequence diagrams which can be found in
D3.1. The information layer defines the information objects that need to be
exchanged between the different actors to realize the use case. On the
communication finally, the protocols are defined for supporting the information
exchange between actors.
Figure 2-5: A mapping of NIST Smart Grid Actors to an SGAM Plane [3]
2.5 CLUE Reference Architecture
Following the methodology, briefed in the previous section, a detailed study is
conducted to find first the context and later extract the requirements for use case

Deliverable No. 3.2 | Local Energy Community Architecture Description
- 22 -
definition. Table 2-1 presents a summary of the outcome from applying the sub-
phase 1 of Phase I from the methodology. As can be seen, five out of seven domains
from NIST Smart Grid Conceptual domains are identified as relevant for CLUE.
Table 2-1: Summary of outcome from Phase I.1
Domain Relevance Flow Type
Direct Indirect N/A Electrical ICT
Customer ✓ ✓ ✓
Distribution ✓ ✓ ✓
Operations ✓ ✓ ✓
Service Provider ✓ ✓
Market ✓ ✓
Transmission ✓
Generation including DER ✓
A graphical representation of the outcome is shown in Figure 2-6. As evident from
the graphic, there are five domains (customers, distribution, operations, service
providers, and market) that have direct interaction with the CLUE solution. Two
domains; transmission and generation including DER are identified as not relevant
during the analysis as these domains do not exist for LEC’s in the CLUE project. Both
the ICT and electrical flows between the CLUE solution and respective domains are
also identified and highlighted with blue and yellow lines.

Deliverable No. 3.2 | Local Energy Community Architecture Description
- 23 -
Figure 2-6: CLUE Reference Architecture.
Table 2-2 presents the analysis conducted on the NIST Smart Grid Actors. Since the con-
text has already been identified previously, the focus here is only the actor in the five
domains. Each actor is identified with a unique ID, the domain it belongs to, and the name
is given. A more detailed description of all NIST Smart Grid Actors can be seen in the Ap-
pendix4.
For each of the actors, there are three main categories of questions that are answered.
The first of them is a yes/no question about the actor’s relevance to CLUE. The answer to
this question determines if further analysis is needed or not. The next question tries to
find the right classification for the actor under analysis. An actor can take one of the three
possible classification types5. The third category of questions is about the types of flows
that could be envisioned between this actor and the CLUE solution. These flows are di-
vided into two types: electrical and ICT. The electrical flow further classifies if the actor is
a consumer or producer of the electricity. While the ICT flow tries to identify if this actor
is originating communication being a source or it is a receiver or both.
4 See Appendix A2
5 See Appendix A3

ERA-Net Smart Energy Systems
This project has received funding in the framework of the joint programming initiative ERA-Net Smart Energy
Systems, with support from the European Union’s Horizon 2020 research and innovation programme.
Table 2-2: List of identified NIST Smart Grid Actors
ID Domain Name Relevant Classification Electrical Flow ICT Flow
Primary Secondary Supporting Consumer Producer Source Sink
2 Customer Customer Yes Yes Yes Yes Yes Yes
3 Customer Customer Appliances and Equipment
Yes Yes Yes Yes Yes
4 Customer Customer Distributed En-ergy Resources: Genera-tion and Storage
Yes Yes Yes Yes Yes Yes
5 Customer Customer Energy Man-agement System
Yes Yes Yes Yes
6 Customer Electric Vehicle Service El-ement/Plug-in Electric Vehicle
Yes Yes Yes Yes Yes
7 Customer Home Area Network Gateway
Yes Yes Yes Yes
8 Customer Meter Yes Yes Yes
9 Customer Customer Premise Display No
10 Customer Sub-Meter – Energy Usage Metering Device
Yes Yes Yes
11 Customer Water/Gas Metering No
12 Distribution Distribution Data Collec-tor
No
13 Distribution Distribution Intelligence Capabilities
Yes Yes Yes Yes
14 Distribution Distribution Automation Field Devices
No

Deliverable No. 3.2 | Local Energy Community Architecture Description - 25 -
ID Domain Name Relevant Classification Electrical Flow ICT Flow
Primary Secondary Supporting Consumer Producer Source Sink
15 Distribution Distribution Remote Ter-minal Unit/Intelligent Electronic Device
Yes Yes Yes Yes
16 Distribution Field Crew Tools No
17 Distribution Geographic Information System
No
18 Distribution Distribution Sensor No
19 Market Energy Market Clearing-house
No
Market P2P market Yes Yes Yes Yes
20 Market
Independent System Op-erator/Regional Transmis-sion Organization Whole-sale Market
No
21 Operations Advanced Metering Infra-structure Headend
22 Operations Bulk Storage Manage-ment
No
23 Operations Customer Information System
No
24 Operations Customer Service Repre-sentative
No
25 Operations Distributed Generation and Storage Management
Yes Yes Yes Yes Yes Yes
26 Operations Distribution Engineering No
27 Operations Distribution Management Systems
Yes Yes No No Yes Yes
28 Operations Distribution Operator Yes Yes Yes Yes Yes Yes

Deliverable No. 3.2 | Local Energy Community Architecture Description - 26 -
ID Domain Name Relevant Classification Electrical Flow ICT Flow
Primary Secondary Supporting Consumer Producer Source Sink
29 Operations Distribution Supervisory Control and Data Acquisi-tion
Yes Yes No No Yes Yes
30 Operations Energy Management Sys-tem
Yes Yes No No Yes Yes
31 Operations ISO/RTO Operations No
32 Operations Load Management Sys-tems/Demand Response Management System
Yes Yes Yes Yes
33 Operations Meter Data Management System
Yes Yes Yes Yes
34 Operations Metering/Billing/Utility Back Office
No
36 Operations Outage Management Sys-tem
No
37 Operations Transmission SCADA No
38 Operations Customer Portal Yes Yes Yes Yes
39 Operations Wide Area Measurement System
No
40 Operations Work Management Sys-tem
No
41 Service Pro-vider
Aggregator/Retail Energy Provider
Yes Yes Yes Yes
42 Service Pro-vider
Billing No
43 Service Pro-vider
Energy Service Provider Yes Yes Yes Yes Yes
44 Service Pro-vider
Third Party No

ERA-Net Smart Energy Systems
This project has received funding in the framework of the joint programming
initiative ERA-Net Smart Energy Systems, with support from the European
Union’s Horizon 2020 research and innovation programme.
3 STAKEHOLDER ANALYSIS
Establishing energy communities in an existing energy system is a complex and
multifaceted challenge that requires a holistic approach and the consideration of
numerous stakeholders with a different set of objectives and priorities [4], [5], [6].
Thus, for setting up an energy community, it is necessary to develop a good overview
of the relevant stakeholders and a comprehensive understanding of who is a driving
stakeholder for taking decisions and actions, who has the power to influence the set
up and running of an energy community and who would have an essential role but
is not aware or active yet.
A stakeholder mapping can be an effective approach to reveal the positions, roles,
and relationships between relevant stakeholders [5], [7]. This is an important step
for identifying potentials and gaps in the stakeholder constellation and for activating
and strengthening stakeholders who have a key role but are not active yet or even
aware of the possibilities and their role.
3.1 Stakeholders and Scope Identification
People, groups, and/or organizations, companies, governments, and legal entities,
among others, who may have a positive or negative impact on the project are
referred to as project stakeholders. Such entities should be identified, their
objectives and expectations analysed, and an effective management and
engagement plan designed so that these stakeholders may be engaged in various
life cycles of project development and execution is critical to the project's success.

Deliverable No. 3.2 | Local Energy Community Architecture Description
- 28 -
Figure 3-1-: Overview of CLUE project stakeholders when mapped on various life-cycle
phases.
A simple model for stakeholders’ identification is used where first the major life cycle
phases are identified. Figure 3-1-: present the populated model with four project life
cycle phases and seven classes of stakeholders. Below a brief description of the
phase, stakeholders, and scope making is presented.
The chosen life-cycle phases cover the overall project. These phases include:
1. Planning
2. Designing and Development
3. Deploying
4. Operating
Then major classes of stakeholders are identified, that are:
1. Users: class of stakeholder that will operate the system
2. Customer: class of stakeholder that will use the system
3. CLUE Consortium and funding agencies (including expected investors) :
a class of stakeholders that would like to invest in the system.
4. Laws and authorities of the land: a class of stakeholders that set the laws
and have jurisdiction on the land where the system will be used.

Deliverable No. 3.2 | Local Energy Community Architecture Description
- 29 -
5. Acceptance and fitness testers: a class of stakeholders that may include
the representatives from customer and user as well as regulators that certify
that the developed system is as per user requirement and that it also obeys
the set regulations for its operations.
6. Regulators: a class of stakeholders that govern the laws for operating a
system.
7. Negative stakeholders: a class of stakeholders that are affected negatively
by the system and would not be happy about the change.
A simple stakeholder classification method is introduced with three scope levels:
Project scope: these stakeholders and their expectations remain the same
throughout the project life cycle and implementation region. The stakeholders in
this scope are marked with a green circle.
Regional scope: these stakeholders have differing expectations based on the region
of implementation. The stakeholders in this scope are marked with a red circle.
Hybrid (project/region): these stakeholders may or may not have different
expectations based on the region of implementation. The stakeholders in this scope
are marked with a yellow circle.
Since CLUE is a multi-national project, there is a possibility that many of these
stakeholders may differ on their expectations. Also, there could be a possibility of
adopting the different engagement methods. In this task, we decided to focus on
understanding political, economic, social, technological, legal and environmental
interests of regional stakeholders in the countries involved in the project. The
chosen approach was a conducting a stakeholder mapping using PESTLE analysis in
order to explore and group the stakeholders into representatives of political,
economic, social, technical, legal and environmental (PESTLE) interests.
PESTLE analyses have already been conducted on a range of different energy topics
[8], [9], [10] and are particularly useful for exploring issues that are mainly
qualitative in nature and for analysing problems holistically [9]. We applied a
simplified version of the PESTLE analysis and focusses mainly on the stakeholder
setting and their roles. The subsequent sections give an overview of the PESTLE
analysis for the different countries involved in the CLUE project.
3.2 Austria
In Austria, the municipality of Gasen and the region of Southern Burgenland are part
of the CLUE project.
The municipality of Gasen is located in Styria, which is one of the nine provinces in
Austria, and has in total about 900 inhabitants. The total area of Gasen is about 34
km² and has about 284 households (Naturparkgemeinde Gasen, s.a.).

Deliverable No. 3.2 | Local Energy Community Architecture Description
- 30 -
The region of the Innovation lab act4.energy is located in the south of Burgenland,
which is like Styria one province in eastern Austria. The region of the innovation lab
includes 10 municipalities, where the municipality of Oberwart and municipality of
Stegersbach have the highest number of inhabitants. All in the region of Southern
Burgenland has a total number of inhabitants of about 20,000 and has a total area
of about 195 km² (Statistik Austria, 2019).
3.2.1 Stakeholder mapping in Southern Burgenland
In the region of Southern Burgenland, there were a total 48 stakeholders identified.
Figure 3-2 shows all stakeholders with their roles and position in the CLUE project.
The positioning of the stakeholders was determined according to their importance
in the project and also according to their spatial scale, whereby those stakeholders
with the most decisive role on local scale were positioned in the core (lowest shell)
of the bubble.

ERA-Net Smart Energy Systems
This project has received funding in the framework of the joint programming initiative ERA-Net Smart Energy
Systems, with support from the European Union’s Horizon 2020 research and innovation programme.
Figure 3-2: Position and roles of the stakeholders in the region of the Southern Burgenland

ERA-Net Smart Energy Systems
This project has received funding in the framework of the joint programming
initiative ERA-Net Smart Energy Systems, with support from the European
Union’s Horizon 2020 research and innovation programme.
As in Figure 3-2 pictured, the 10 municipalities play a key role in the CLUE-project in
the region of Southern Burgenland. Moreover, the stakeholders in the Southern
Burgenland have different roles, which are mostly economic (40%), political (21%)
and technological (13%) stakeholders (see Figure 3-3).
Figure 3-3: Roles of the stakeholders in the Southern Burgenland
In case of the Southern Burgenland the 10 municipalities are the political
stakeholders. The governance stakeholders include two departments of the
governance of the province Burgenland and two departments of the district
authority of the municipality of Oberwart.
Furthermore, the stakeholders of Southern Burgenland are mapped in 5 categories
based on their roles within the CLUE project:
• Stakeholder 1: role on the entire city level/considering large scale or impact.
• Stakeholder 2: role in a specific sector and/or in a specific district/area
• Stakeholder 3: required in his role/"driving" stakeholder.
• Stakeholder 4: role has to be strengthened. with regards to local energy
communities.
• Stakeholder 5: small role
10; 21%
6; 13%
19; 40%
5; 10%
4; 8%
4; 8%
Stakeholder mapping- Southern Burgenland
Political Stakeholder Technological/Energy Stakeholder
Economic Stakeholder Social Stakeholder
Governance Other Stakeholder
Deliverable No. 3.2 | Local Energy Community Architecture Description
- 33 -
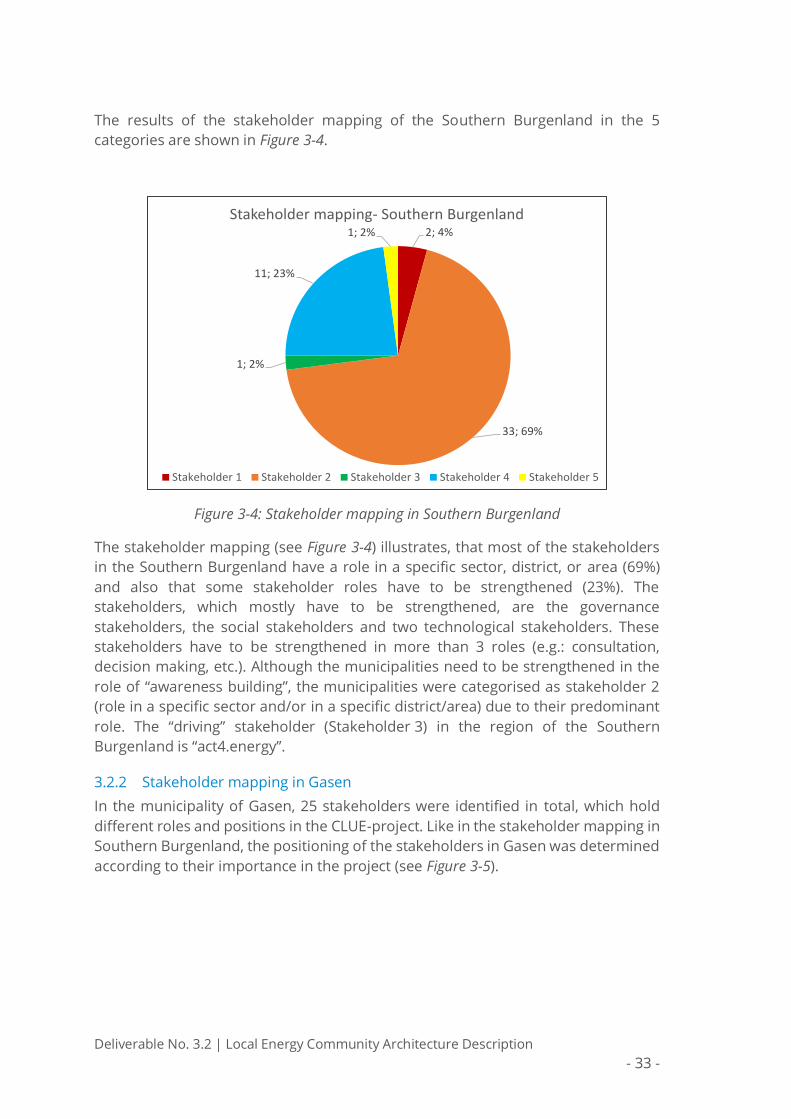
The results of the stakeholder mapping of the Southern Burgenland in the 5
categories are shown in Figure 3-4.
Figure 3-4: Stakeholder mapping in Southern Burgenland
The stakeholder mapping (see Figure 3-4) illustrates, that most of the stakeholders
in the Southern Burgenland have a role in a specific sector, district, or area (69%)
and also that some stakeholder roles have to be strengthened (23%). The
stakeholders, which mostly have to be strengthened, are the governance
stakeholders, the social stakeholders and two technological stakeholders. These
stakeholders have to be strengthened in more than 3 roles (e.g.: consultation,
decision making, etc.). Although the municipalities need to be strengthened in the
role of “awareness building”, the municipalities were categorised as stakeholder 2
(role in a specific sector and/or in a specific district/area) due to their predominant
role. The “driving” stakeholder (Stakeholder 3) in the region of the Southern
Burgenland is “act4.energy”.
3.2.2 Stakeholder mapping in Gasen
In the municipality of Gasen, 25 stakeholders were identified in total, which hold
different roles and positions in the CLUE-project. Like in the stakeholder mapping in
Southern Burgenland, the positioning of the stakeholders in Gasen was determined
according to their importance in the project (see Figure 3-5).
2; 4%
33; 69%
1; 2%
11; 23%
1; 2%
Stakeholder mapping- Southern Burgenland
Stakeholder 1 Stakeholder 2 Stakeholder 3 Stakeholder 4 Stakeholder 5

ERA-Net Smart Energy Systems
This project has received funding in the framework of the joint programming initiative ERA-Net Smart Energy
Systems, with support from the European Union’s Horizon 2020 research and innovation programme.
Figure 3-5: Position and roles of the stakeholders in the municipality of the Gasen
ERA-Net Smart Energy Systems
This project has received funding in the framework of the joint programming
initiative ERA-Net Smart Energy Systems, with support from the European
Union’s Horizon 2020 research and innovation programme.
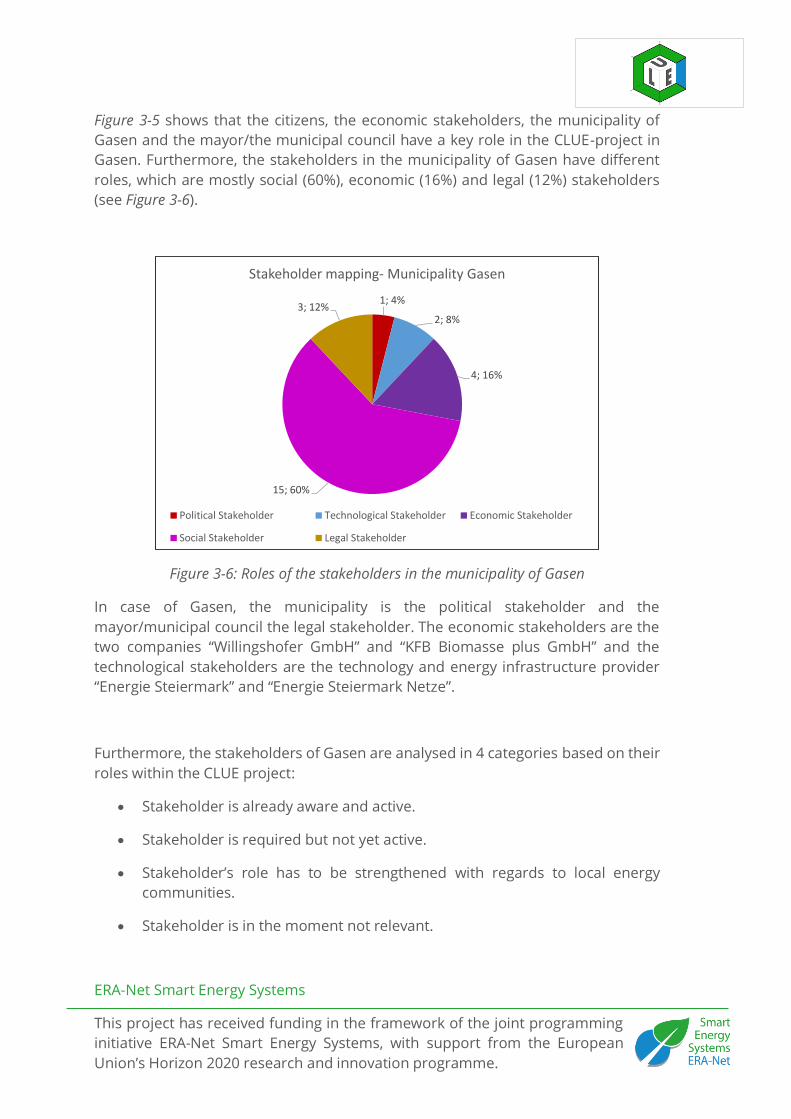
Figure 3-5 shows that the citizens, the economic stakeholders, the municipality of
Gasen and the mayor/the municipal council have a key role in the CLUE-project in
Gasen. Furthermore, the stakeholders in the municipality of Gasen have different
roles, which are mostly social (60%), economic (16%) and legal (12%) stakeholders
(see Figure 3-6).
Figure 3-6: Roles of the stakeholders in the municipality of Gasen
In case of Gasen, the municipality is the political stakeholder and the
mayor/municipal council the legal stakeholder. The economic stakeholders are the
two companies “Willingshofer GmbH” and “KFB Biomasse plus GmbH” and the
technological stakeholders are the technology and energy infrastructure provider
“Energie Steiermark” and “Energie Steiermark Netze”.
Furthermore, the stakeholders of Gasen are analysed in 4 categories based on their
roles within the CLUE project:
• Stakeholder is already aware and active.
• Stakeholder is required but not yet active.
• Stakeholder’s role has to be strengthened with regards to local energy
communities.
• Stakeholder is in the moment not relevant.
1; 4%
2; 8%
4; 16%
15; 60%
3; 12%
Stakeholder mapping- Municipality Gasen
Political Stakeholder Technological Stakeholder Economic Stakeholder
Social Stakeholder Legal Stakeholder

Deliverable No. 3.2 | Local Energy Community Architecture Description
- 36 -
In the municipality of Gasen, most of the stakeholders are already aware and active
(56%) and that shows high ambitions from them. The high ambitions of Gasen are
also proven, that there are no stakeholders, who are required but not yet active.
32% of the stakeholder roles, which are seven social stakeholders and one economic
stakeholder, should be strengthened in Gasen. This high number of stakeholders
demonstrates, that even in the municipality of Gasen, a support in case of
strengthening of the stakeholder roles is necessary. 12% of the stakeholders in the
municipality of Gasen are in the moment not relevant. The result of the stakeholder
mapping of the municipality of Gasen is shown in Figure 3-7.
Figure 3-7: Role analysis of the stakeholders in the municipality of Gasen
3.3 Sweden
In case of Sweden, there are in total 16 stakeholders identified in the CLUE project.
Figure 3-8 shows all stakeholders with their roles and position in the CLUE project.
The positioning of the stakeholders was like in the case of Austria determined
according to their importance in the project.
14; 56%
0; 0%
8; 32%
3; 12%
Stakeholder mapping- Municipality Gasen
already aware and active required but not yet activerole has to be strengthened in the moment not relevant

ERA-Net Smart Energy Systems
This project has received funding in the framework of the joint programming initiative ERA-Net Smart Energy
Systems, with support from the European Union’s Horizon 2020 research and innovation programme.
Figure 3-8: Position and roles of the stakeholders in Sweden

ERA-Net Smart Energy Systems
This project has received funding in the framework of the joint programming
initiative ERA-Net Smart Energy Systems, with support from the European
Union’s Horizon 2020 research and innovation programme.
The stakeholders of Sweden are mostly technological/energy stakeholders (37%)
and spatial-economic stakeholders (25%). The technological/energy stakeholders
provide the energy infrastructure, e.g.: energy solution providers, software provider
and software provider. As spatial-economic stakeholders, there are on the one hand
municipal companies, who host the demonstration of local balancing and host the
demonstration of smart charging. On the other hand, the construction and
development company “Serneke Group AB” and the real estate company
“Vasakronan AB” were also mapped as spatial-economic stakeholders. In case of
Sweden, the governance stakeholders (12%) are two departments (environment and
city development department) of the city of Malmö and the other stakeholders are
two research institutes. The social stakeholders are the electric car users and the
tenants/residents. The mapping of the roles of the stakeholders in Sweden are
shown in Figure 3-9.
Figure 3-9: Roles of the stakeholders in Sweden
Moreover, the stakeholders of Sweden are mapped in 3 categories based on their
roles within the CLUE project (see Figure 3-10)
• Stakeholder 1: role on the entire city level/considering large scale or impact.
• Stakeholder 2: role in a specific sector and/or in a specific district/area
• Stakeholder 3: small role
2; 12%
6; 37%
4; 25%
2; 13%
2; 13%
Stakeholder mapping- Sweden
Governance/Political Stakeholder Technological/Energy Stakeholder
Spatial Stakeholder Social Stakeholder
Other Stakeholder

Deliverable No. 3.2 | Local Energy Community Architecture Description
- 39 -
Figure 3-10: Stakeholder mapping in Sweden
The highest number of stakeholders in Sweden have a role in a specific sector and/or
in a specific district/area (56%) and have a role on the entire city level/considering
large scale or impact (31%). The two technological stakeholder “Virta” (software
provider) and “Elvaco AB” (Metering service provider) have a small role in the CLUE-
project of Sweden.
3.4 Germany
In Herne-Shamrockpark (Germany), there are in total 12 stakeholders identified,
which hold different roles and positions in the CLUE-project. The positioning of the
stakeholders was determined according to their importance in the project and to
their spatial scale (state-district-local), whereby those stakeholders with the most
decisive role and on local scale were positioned in the core of the bubble (see Figure
3-11).
5; 31%
9; 56%
2; 13%
Stakeholder mapping- Sweden
Stakeholder 1 Stakeholder 2 Stakeholder 3

ERA-Net Smart Energy Systems
This project has received funding in the framework of the joint programming initiative ERA-Net Smart Energy
Systems, with support from the European Union’s Horizon 2020 research and innovation programme.
Figure 3-11: Position and roles of the stakeholders in Herne-Shamrockpark (Germany)

ERA-Net Smart Energy Systems
This project has received funding in the framework of the joint programming
initiative ERA-Net Smart Energy Systems, with support from the European
Union’s Horizon 2020 research and innovation programme.
Figure 3-11 shows that the social stakeholders (Media and tenants) have a key role
in the CLUE-project in Herne-Shamrockpark. Furthermore, the stakeholders of
Germany have different roles, which are mostly technological (33%), social (17%) and
other (17%) stakeholders. Additionally, two legal stakeholders (BDEW
Bundesverband der Energie- und Wasserwirtschaft e.V. and ERA-Net Smart Grids
Plus) were part of the CLUE-project of Herne-Shamrockpark (see Figure 3-12).
Figure 3-12: Roles of the stakeholders in Herne-Shamrockpark (Germany)
Furthermore, the stakeholders of Herne-Shamrockpark are mapped in 4 categories
based on their roles within the CLUE project:
• Stakeholder is already aware and active.
• Stakeholder is required but not yet active.
• Stakeholder’s role has to be strengthened with regards to local energy
communities.
• Stakeholder is in the moment not relevant.
The result of the stakeholder mapping is that all the stakeholders in Herne-
Shamrockpark are already aware and active.
1; 8%
1; 8%
2; 17%
4; 33%
2; 17%
2; 17%
Stakeholder mapping- Herne-Shamrockpark
Political stakeholder Economic stakeholder Social stakeholder
Technological stakeholder Legal stakeholder Other stakeholder

Deliverable No. 3.2 | Local Energy Community Architecture Description
- 42 -
3.5 Scotland
In case of Scotland, 48 stakeholders were identified in the CLUE project. Figure 3-13
shows all stakeholders with their roles and positions in the CLUE project. The
positioning of the stakeholders was like in the case of Austria, Sweden and Germany
determined according to their importance in the project, at the same time reflecting
the spatial scale.

ERA-Net Smart Energy Systems
This project has received funding in the framework of the joint programming initiative ERA-Net Smart Energy
Systems, with support from the European Union’s Horizon 2020 research and innovation programme.
Figure 3-13: Position and roles of the stakeholders in Scotland

ERA-Net Smart Energy Systems
This project has received funding in the framework of the joint programming
initiative ERA-Net Smart Energy Systems, with support from the European
Union’s Horizon 2020 research and innovation programme.
Figure 3-13 illustrates, that the social stakeholders have a key role in the CLUE-
project in Scotland. Furthermore, the stakeholders of Scotland hold different roles,
who are mostly economic (38%), technological (33%), social (11%) and legal (10%)
stakeholders (see Figure 3-14).
Figure 3-14: Roles of the stakeholders in Scotland
The stakeholders of Scotland are mapped in 5 categories (see Figure 3-15)
• Stakeholder 1: role on the entire city level/considering large scale or impact.
• Stakeholder 2: role in a specific sector and/or in a specific district/area
• Stakeholder 3: required in his role/"Driving" stakeholder.
• Stakeholder 4: small role
• Stakeholder 5: another role
4; 8%
16; 33%
18; 38%
5; 11%
5; 10%
Stakeholder mapping- Scotland
Political Stakeholder Technological/Energy Stakeholder
Economic Stakeholder Social Stakeholder
Legal Stakeholder

Deliverable No. 3.2 | Local Energy Community Architecture Description
- 45 -
Figure 3-15: Stakeholder mapping in Scotland
Furthermore, all of the roles of the stakeholders in Scotland were analysed if they
are already active and if their roles should be strengthened (see Figure 3-16).
Figure 3-16: Role analysis of the stakeholders in Scotland
The role analysis of Scotland illustrates, that most of the stakeholder roles (31%)
have to be strengthened. 13 of total 48 stakeholders are already aware and active,
and a quarter of the stakeholders are required but not yet active. 17 % of the Scottish
stakeholders are already active, but also have to be strengthened in their role. All in
all, about 50% of the Scottish stakeholders have to be strengthened in more than
one role.
4; 8%
34; 71%
1; 2%
1; 2%
8; 17%
Stakeholder mapping- Scotland
Stakeholder 1 Stakeholder 2 Stakeholder 3 Stakeholder 4 Stakeholder 5
13; 27%
12; 25%
15; 31%
8; 17%
Role analysis- Scotland
already aware and active required but not yet active
role has to be strengthened already active and role has to be strengthened

Deliverable No. 3.2 | Local Energy Community Architecture Description
- 46 -
3.6 Cross-country comparison
The stakeholders in the countries Austria, Sweden, Germany, and Scotland have
different roles and are also mapped in different categories. The cross-country
comparison in Table 3-1 highlights the main results of the stakeholder mapping in
each country.
Table 3-1: Cross-country comparison- stakeholder mapping in Austria, Sweden, Germany,
and Scotland
Result
Austria
(S.Burg.
/Gasen)
Sweden Germany Scotland
Role of the stakeholders
Political
St./Governance 21% / 4% 12% 8% 8%
Technological St. 13% / 8% 37% 33% 33%
Economic St. 40% / 16% - 8% 38%
Social Stakeholder 10% / 60% 13% 17% 11%
Role analysis of the stakeholders
St.- role has to be
strengthened 23% / 32% n.a. - 48%
St.- already aware
and active n.a. / 56% n.a. 100% 44%
St.- required but not
yet active n.a./- n.a. - 25%
Mapping categories of the stakeholders
St. role on the entire
city level 4% / n.a. 31% n.a. 8%
St.- role in a specific
sector/district/area 69% / n.a. 56% n.a. 71%
St.- "Driving"
stakeholder 2% / n.a. - n.a. 2%
Role of the “Driving"
stakeholder
Social
stakeholder - -
Social
stakeholder
St.- small role 2% / n.a. 13% n.a. 2%

Deliverable No. 3.2 | Local Energy Community Architecture Description
- 47 -
Table 3-1 shows, that the main role of the stakeholders in each country is different.
But in all the cases, social and technological stakeholders are strongly represented.
Moreover, the social stakeholders are mainly the “driving” stakeholders, which
illustrates their importance in the CLUE-project.
Referring to the role analysis of the stakeholders, in each country most of the
stakeholder are already aware and active, which shows high ambitions of the
stakeholders in each country. Only in the Scottish case, some stakeholders (25 %)
are required but not yet active. However, even though there are many stakeholders
already aware or active (as in the cases of Austria and Scotland), their role has still
to be strengthened, which demonstrates that further support of many stakeholders
is necessary.
Moreover, the stakeholder mapping in the countries Austria, Sweden, Germany, and
Scotland shows that the stakeholder roles in the CLUE-project are mostly in a
specific sector and/or in a specific area/district. It is noticeable, that more than the
quarter of the stakeholders in Sweden have a role on the entire city level.
Furthermore, with a maximum amount of 2 % of all stakeholders the number of
“driving” stakeholders is very low. This illustrates that the topic of energy
communities still needs further awareness raising and mobilisation of stakeholders
in order to support the small number of “driving” stakeholders or even to increase
the number of ambitious front runners

Deliverable No. 3.2 | Local Energy Community Architecture Description
- 48 -
REFERENCES
1. NIST, „NIST IR 7628 - Guidelines for Smart Grid Cyber Security - Volume 1 - Smart Grid
Cybersecurity Strategy, Architecture, and High-Level Requirements“, 2014
2. NIST - National Institute of Standards and Technology, „NISTIR 7628 Guidelines for
Smart Grid Cyber Security“, NIST, 2014.
3. M. Meisel u. a., „Methodical Reference Architecture Development Progress“, in 5th
DA-CH+ Energy Informatics Conference in conjunction with 7th Symposium on
Communications for Energy Systems (ComForEn), 2016, S. 40.
4. Ferretti, Valentina (2016). From stakeholders analysis to cognitive mapping and multi-
attribute value theory: An integrated approach for policy support. European Journal
of Operational Research, 253(2), 524–541.
5. Guðlaugsson, Bjarnhéðinn, Fazeli, Reza, Gunnarsdóttir, Ingunn, Davidsdottir,
Brynhildur, Stefansson, Gunnar (2020). Classification of stakeholders of sustainable
energy development in Iceland: Utilizing a power-interest matrix and fuzzy logic
theory. Energy for Sustainable Development, 57 (2020), 168-188
6. Hanssen, Frank, May, Roel, van Dijk, Jiska, & Rød, Jan Ketil (2018). Spatial multi-criteria
decision analysis tool suite for consensus-based siting of renewable energy
structures. Journal of Environmental Assessment Policy and Management, 20(03),
1840003
7. Aly, Ahmed, Moner-Girona, Magda, Szabó, Sándor, Pedersen, Anders Branth, &
Jensen, Steen Solvang (2019). Barriers to large-scale solar power in Tanzania. Energy
for Sustainable Development, 48(February), 43–58.
8. Kolios, Athanasios and Read, George (2013) A Political, Economic, Social, Technology,
Legal and environmental (PESTLE) approach for risk identification of the tidal industry
in the United Kingdom. Energies, 6 (2013), 5023-5045.
9. Thomas, P.J.M., Sandwell, P. , Williamson, S.J. , Harper, P.W. (2021) A PESTLE analysis
of solar home systems in refugee camps in Rwanda. Renewable and Sustainable
Energy Reviews 143 (2021) 110872
10. Zalengera, Collen, Blanchard, Richard E., Eames, Philip C., Juma, Alnord M.,
Chitawo, Maxon L., Gondwe Kondwani T. (2014) Overview of the Malawi energy
situation and A PESTLE analysis for sustainable development of renewable energy.
Renew Sustain Energy Rev, 38 (2014), 335-347.

Deliverable No. 3.2 | Local Energy Community Architecture Description
- 49 -
APPENDIX
A1: NISTIR 7628 Actors
NISTIR 7628 Guidelines for Smart Grid Cyber Security is another well-known standard from the NIST.
In addition to providing the detailed cyber security mapping and recommendation with the Smart
Grid, this standard also provides a list of actors in each of the NIST domains. A high-level view of
these actors is provided in the figure below while a description of individual actors is presented in the
table.
A2: Description of the Actors in NIST domains
S# Actor Num-ber
Domain Actor Acronym Description
1 1 Bulk Genera-tion
Plant Control System – Distributed Control System
DCS A local control system at a bulk generation plant. This is sometimes called a Distributed Control System (DCS).
2 2 Customer Customer An entity that pays for electrical goods or services. A customer of a utility, including customers who provide more power than they con-sume.
3 3 Customer Customer Appliances and Equipment
A device or instrument designed to perform a specific function, espe-cially an electrical device, such as a toaster, for household use. An elec-tric appliance or machinery that

Deliverable No. 3.2 | Local Energy Community Architecture Description
- 50 -
may have the ability to be moni-tored, controlled, and/or displayed.
4 4 Customer Customer Distributed Energy Resources: Generation and Stor-age
DER Energy generation resources, such as solar or wind, used to generate and store energy (located on a cus-tomer site) to interface to the con-troller (HAN/BAN) to perform an energy-related activity.
5 5 Customer Customer Energy Man-agement System
EMS An application service or device that communicates with devices in the home. The application service or device may have interfaces to the meter to read usage data or to the operations domain to get pric-ing or other information to make automated or manual decisions to control energy consumption more efficiently. The EMS may be a utility subscription service, a third party-offered service, a consumer-speci-fied policy, a consumer-owned de-vice, or a manual control by the utility or consumer.
6 6 Customer Electric Vehicle Service Element/Plug-in Elec-tric Vehicle
EVSE/PEV A vehicle driven primarily by an electric motor powered by a re-chargeable battery that may be re-charged by plugging into the grid or by recharging from a gasoline-driven alternator.
7 7 Customer Home Area Network Gateway
HAN Gate-way
An interface between the distribu-tion, operations, service provider, and customer domains and the de-vices within the customer domain.
8 8 Customer Meter Point of sale device used for the transfer of product and measuring usage from one domain/system to another.
9 9 Customer Customer Premise Dis-play
This device will enable customers to view their usage and cost data within their home or business.
10 10 Customer Sub-Meter – Energy Usage Metering Device
EUMD A meter connected after the main billing meter. It may or may not be a billing meter and is typically used for information-monitoring pur-poses.
11 11 Customer Water/Gas Metering Point of sale device used for the transfer of product (water and gas) and measuring usage from one do-main/system to another.
12 12 Distribution Distribution Data Col-lector
A data concentrator collecting data from multiple sources and modify-ing/transforming it into different form factors.

Deliverable No. 3.2 | Local Energy Community Architecture Description
- 51 -
13 13 Distribution Distributed Intelli-gence Capabilities
Advanced automated/intelligence application that operates in a nor-mally autonomous mode from the centralized control system to in-crease reliability and responsive-ness.
14 14 Distribution Distribution Automa-tion Field Devices
Multifeatured installations meeting a broad range of control, opera-tions, measurements for planning, and system performance reports for the utility personnel.
15 15 Distribution Distribution Remote Terminal Unit/Intelli-gent Electronic Device
RTUs or IEDs
Receive data from sensors and power equipment, and can issue control commands, such as tripping circuit breakers, if they sense volt-age, current, or frequency anoma-lies, or raise/lower voltage levels in order to maintain the desired level.
16 16 Distribution Field Crew Tools A field engineering and mainte-nance tool set that includes any mobile computing and handheld devices.
17 17 Distribution Geographic Infor-mation System
GIS A spatial asset management system that provides utilities with asset in-formation and network connectivity for advanced applications.
18 18 Distribution Distribution Sensor A device that measures a physical quantity and converts it into a sig-nal which can be read by an ob-server or by an instrument.
18 19 Marketing Energy Market Clear-inghouse
Wide-area energy market operation system providing high-level market signals for distribution companies (ISO/RTO and Utility Operations). The control is a financial system, not in the sense of SCADA.
20 20 Marketing Independent System Operator/Regional Transmission Organiza-tion Wholesale Market
ISO/RTO An ISO/RTO control center that par-ticipates in the market and does not operate the market. From the Electric Power Supply Association (EPSA) Web site, “The electric wholesale market is open to any-one who, after securing the neces-sary approvals, can generate power, connect to the grid and find a counterparty willing to buy their output. These include competitive suppliers and marketers that are af-filiated with utilities, independent power producers (IPPs) not affili-ated with a utility, as well as some excess generation sold by tradi-tional vertically integrated utilities.

Deliverable No. 3.2 | Local Energy Community Architecture Description
- 52 -
All these market participants com-pete with each other on the whole-sale market.”15
21 21 Operations Advanced Metering In-frastructure Headend
AMI This system manages the infor-mation exchanges between third-party systems or systems not con-sidered headend, such as the Meter Data Management System (MDMS) and the AMI network.16
22 22 Operations Bulk Storage Manage-ment
Energy storage connected to the bulk power system.
23 23 Operations Customer Information System
CIS Enterprise-wide software applica-tions that allow companies to man-age aspects of their relationship with a customer.
24 24 Operations Customer Service Rep-resentative
CSR Customer service provided by a person (e.g., sales and service rep-resentative) or by automated means called self-service (e.g., In-teractive Voice Response [IVR]).
25 25 Operations Distributed Generation and Storage Manage-ment
Distributed generation is also re-ferred to as on-site generation, dis-persed generation, embedded gen-eration, decentralized generation, decentralized energy, or distributed energy. This process generates electricity from many small energy sources for use or storage on dis-persed, small devices or systems. This approach reduces the amount of energy lost in transmitting elec-tricity because the electricity is gen-erated very near where it is used, perhaps even in the same building.
26 26 Operations Distribution Engineer-ing
A technical function of planning or managing the design or upgrade of the distribution system. For exam-ple:
The addition of new customers, The build out for new load, The configuration and/or capital in-vestments for improving system re-liability.
27 27 Operations Distribution Manage-ment Systems
DMS A suite of application software that supports electric system opera-tions. Example applications include topology processor, online three-phase unbalanced distribution power flow, contingency analysis, study mode analysis, switch order management, short-circuit analysis, volt/VAR management, and loss analysis. These applications provide operations staff and engineering

Deliverable No. 3.2 | Local Energy Community Architecture Description
- 53 -
personnel additional information and tools to help accomplish their objectives.
28 28 Operations Distribution Operator Person operating the distribution system.
29 29 Operations Distribution Supervi-sory Control and Data Acquisition
SCADA A type of control system that trans-mits individual device status, man-ages energy consumption by con-trolling compliant devices, and al-lows operators to directly control power system equipment.
30 30 Operations Energy Management System
EMS A system of computer-aided tools used by operators of electric utility grids to monitor, controls, and opti-mize the performance of the gener-ation and/or transmission system. The monitor and control functions are known as SCADA; the optimiza-tion packages are often referred to as "advanced applications." (Note: Gas and water could be separate from or integrated within the EMS.)
31 31 Operations ISO/RTO Operations Wide-area power system control center providing high-level load management and security analysis for the transmission grid, typically using an EMS with generation appli-cations and network analysis appli-cations.
32 32 Operations Load Management Systems/Demand Re-sponse Management System
LMS/DRMS An LMS issues load management commands to appliances or equip-ment at customer locations in order to decrease load during peak or emergency situations. The DRMS is-sues pricing or other signals to ap-pliances and equipment at cus-tomer locations in order to request customers (or their prepro-grammed systems) to decrease or increase their loads in response to the signals.
33 33 Operations Meter Data Manage-ment System
MDMS System that stores meter data (e.g., energy usage, energy generation, meter logs, meter test results) and makes data available to authorized systems. This system is a compo-nent of the customer communica-tion system. This may also be re-ferred to as a 'billing meter.'
34 34 Operations Metering/Billing/Utility Back Office
Back office utility systems for me-tering and billing.
35 36 Operations Outage Management System
OMS An OMS is a computer system used by operators of electric distribution

Deliverable No. 3.2 | Local Energy Community Architecture Description
- 54 -
systems to assist in outage identifi-cation and restoration of power.
Major functions usually found in an OMS include:
• Listing all customers who have outages.
• Prediction of location of fuse or breaker that opened upon failure.
• Prioritizing restoration efforts and managing resources based upon criteria such as location of emer-gency facilities, size of outages, and duration of outages.
• Providing information on extent of outages and number of custom-ers impacted to management, me-dia, and regulators.
• Estimation of restoration time.
• Management of crews assisting in restoration.
• Calculation of crews required for restoration.
36 37 Operations Transmission SCADA Transmits individual device status, manages energy consumption by controlling compliant devices, and allowing operators to directly con-trol power system equipment.
37 38 Operations Customer Portal A computer or service that makes available Web pages. Typical ser-vices may include customer viewing of their energy and cost infor-mation online, enrollment in pre-payment electric services, and ena-blement of third-party monitoring and control of customer equip-ment.
38 39 Operations Wide Area Measure-ment System
WAMS Communication system that moni-tors all phase measurements and substation equipment over a large geographical base that can use vis-ual modeling and other techniques to provide system information to power system operators.
39 40 Operations Work Management System
WMS A system that provides project de-tails and schedules for work crews to construct and maintain the power system infrastructure.
40 41 Service Pro-vider
Aggregator/Retail En-ergy Provider
Any marketer, broker, public agency, city, county, or special dis-trict that combines the loads of multiple end-use customers in facil-itating the sale and purchase of electric energy, transmission, and

Deliverable No. 3.2 | Local Energy Community Architecture Description
- 55 -
other services on behalf of these customers.
41 42 Service Pro-vider
Billing Process of generating an invoice to obtain reimbursement from the customer.
42 43 Service Pro-vider
Energy Service Pro-vider
ESP Provides retail electricity, natural gas, and clean energy options, along with energy efficiency prod-ucts and services.
43 44 Service Pro-vider
Third Party A third party providing a business function outside of the utility.
44 45 Transmission Phasor Measurement Unit
PMU Measures the electrical parameters of an electricity grid with respect to universal time (UTC) such as phase angle, amplitude, and frequency to determine the state of the system.
45 46 Transmission Transmission IED IEDs receive data from sensors and power equipment and can issue control commands, such as tripping circuit breakers if they sense volt-age, current, or frequency anoma-lies, or raise/lower voltage levels in order to maintain the desired level. A device that sends data to a data concentrator for potential refor-matting.
46 47 Transmission Transmission RTU RTUs pass status and measurement information from a substation or feeder equipment to a SCADA sys-tem and transmit control com-mands from the SCADA system to the field equipment.
47 49 Transmission Transmission Engineer-ing
Equipment designed for more than 345,000 volts between conductors.

Deliverable No. 3.2 | Local Energy Community Architecture Description
- 56 -
A3: Actor Classification

© Copyright 2019 – ERA-Net SES
FUNDING
This document was created as part of the ERA-Net Smart Energy Systems project
CLUE, funded from the European Union’s Horizon 2020 research and innovation
programme under grant agreement no. 775970 (RegSys).