D1.3 Burkhard Sanner, Luca Angelino 3 Edition, June...
15
Analysis of Market for Shallow Geothermal Energy D1.3 Burkhard Sanner, Luca Angelino 3 rd Edition, June 2015
Transcript of D1.3 Burkhard Sanner, Luca Angelino 3 Edition, June...
Analysis of Market for
Shallow Geothermal Energy
in the EU
D1.3
Burkhard Sanner, Luca Angelino
3rd Edition, June 2015
1
Table of Contents
Introduction ..................................................................................................................... 2
Evolution of renewable heat from shallow geothermal in project countries ....................... 3
Methodology and statistical assessment ........................................................................... 5
Market development in project countries ....................................................................... 10
Conclusions .................................................................................................................... 14
Literature: ...................................................................................................................... 14
2
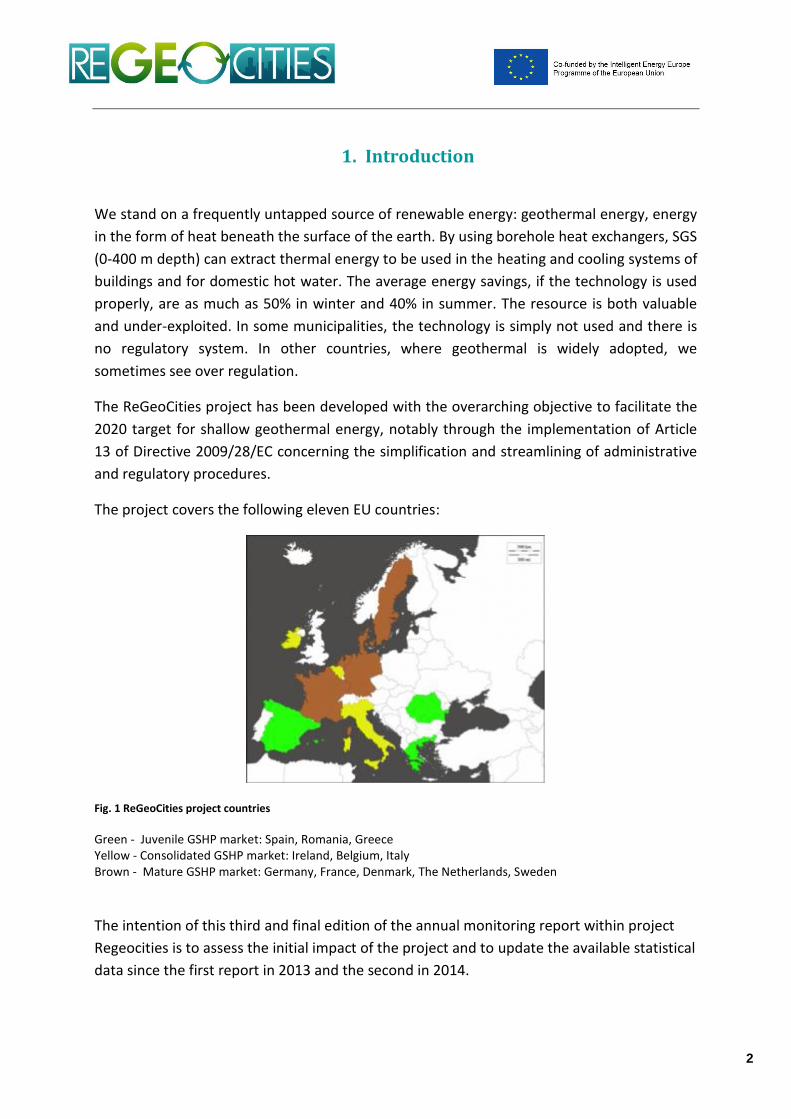
1. Introduction
We stand on a frequently untapped source of renewable energy: geothermal energy, energy
in the form of heat beneath the surface of the earth. By using borehole heat exchangers, SGS
(0-400 m depth) can extract thermal energy to be used in the heating and cooling systems of
buildings and for domestic hot water. The average energy savings, if the technology is used
properly, are as much as 50% in winter and 40% in summer. The resource is both valuable
and under-exploited. In some municipalities, the technology is simply not used and there is
no regulatory system. In other countries, where geothermal is widely adopted, we
sometimes see over regulation.
The ReGeoCities project has been developed with the overarching objective to facilitate the
2020 target for shallow geothermal energy, notably through the implementation of Article
13 of Directive 2009/28/EC concerning the simplification and streamlining of administrative
and regulatory procedures.
The project covers the following eleven EU countries:
Fig. 1 ReGeoCities project countries
Green - Juvenile GSHP market: Spain, Romania, Greece Yellow - Consolidated GSHP market: Ireland, Belgium, Italy Brown - Mature GSHP market: Germany, France, Denmark, The Netherlands, Sweden
The intention of this third and final edition of the annual monitoring report within project
Regeocities is to assess the initial impact of the project and to update the available statistical
data since the first report in 2013 and the second in 2014.
3
2. Evolution of renewable heat from shallow geothermal in project
countries
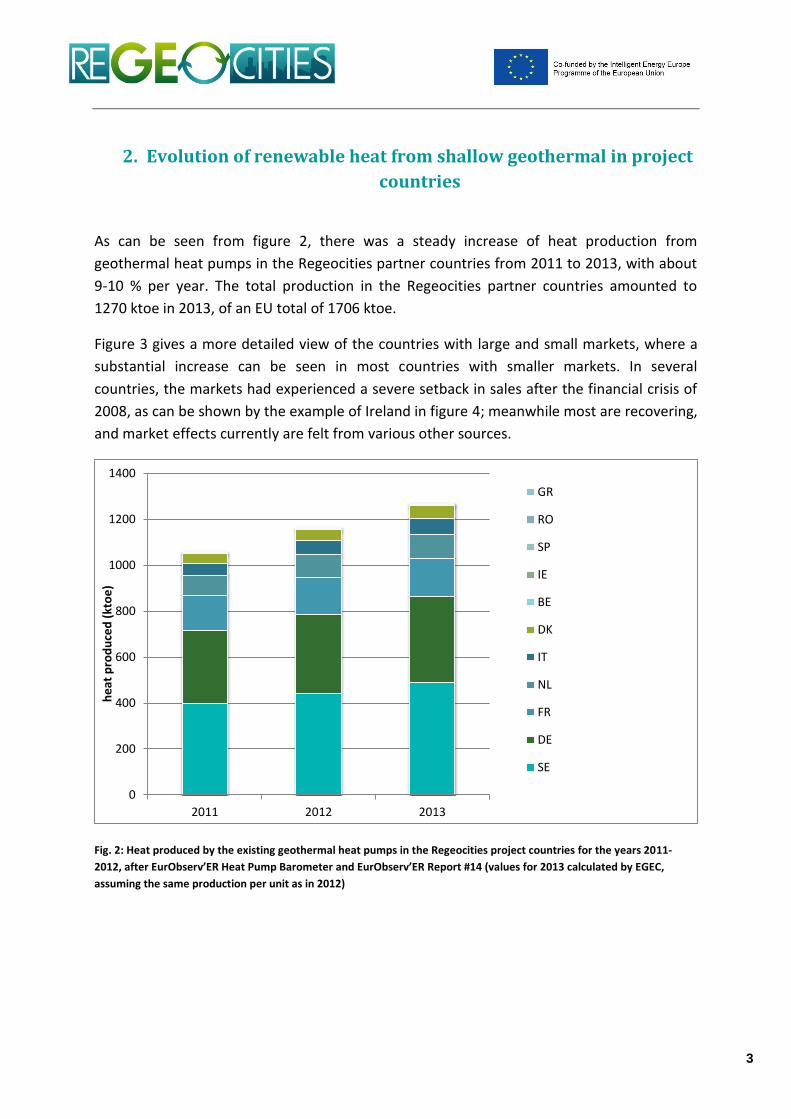
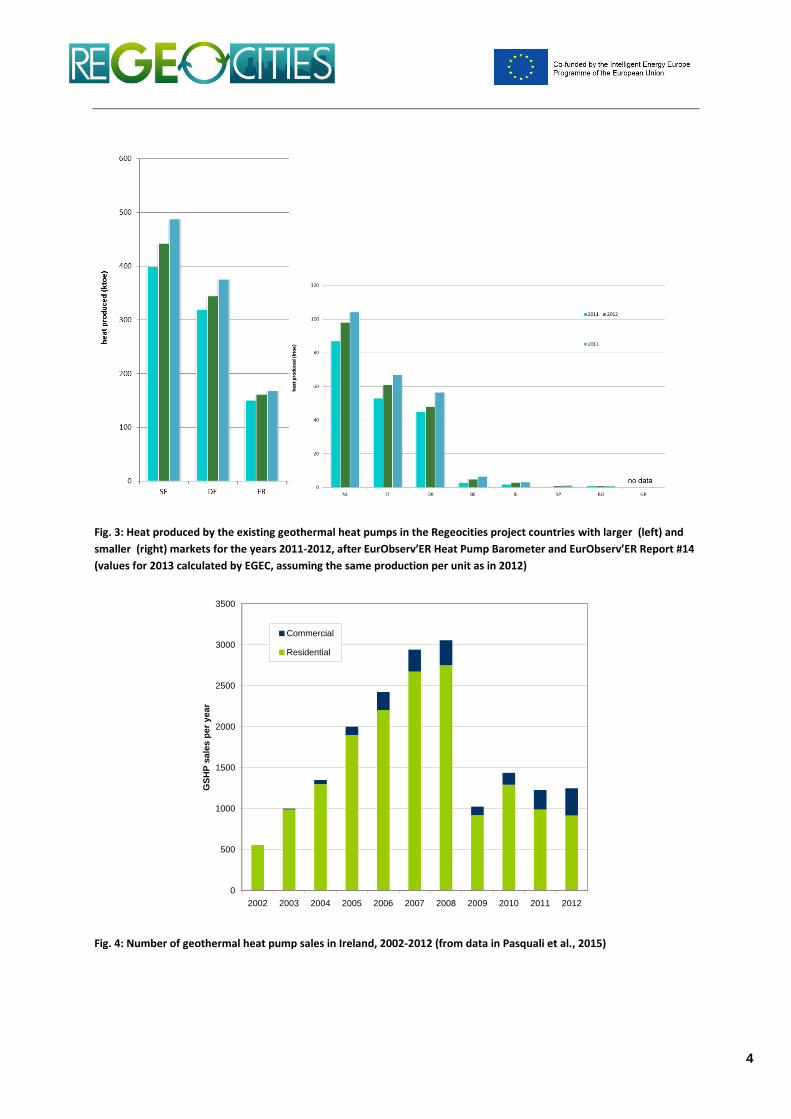
As can be seen from figure 2, there was a steady increase of heat production from
geothermal heat pumps in the Regeocities partner countries from 2011 to 2013, with about
9-10 % per year. The total production in the Regeocities partner countries amounted to
1270 ktoe in 2013, of an EU total of 1706 ktoe.
Figure 3 gives a more detailed view of the countries with large and small markets, where a
substantial increase can be seen in most countries with smaller markets. In several
countries, the markets had experienced a severe setback in sales after the financial crisis of
2008, as can be shown by the example of Ireland in figure 4; meanwhile most are recovering,
and market effects currently are felt from various other sources.
Fig. 2: Heat produced by the existing geothermal heat pumps in the Regeocities project countries for the years 2011-
2012, after EurObserv’ER Heat Pump Barometer and EurObserv’ER Report #14 (values for 2013 calculated by EGEC,
assuming the same production per unit as in 2012)
0
200
400
600
800
1000
1200
1400
2011 2012 2013
he
at p
rod
uce
d (
kto
e)
GR
RO
SP
IE
BE
DK
IT
NL
FR
DE
SE
4
Fig. 3: Heat produced by the existing geothermal heat pumps in the Regeocities project countries with larger (left) and
smaller (right) markets for the years 2011-2012, after EurObserv’ER Heat Pump Barometer and EurObserv’ER Report #14
(values for 2013 calculated by EGEC, assuming the same production per unit as in 2012)
Fig. 4: Number of geothermal heat pump sales in Ireland, 2002-2012 (from data in Pasquali et al., 2015)
0
500
1000
1500
2000
2500
3000
3500
2002 2003 2004 2005 2006 2007 2008 2009 2010 2011 2012
GS
HP
sa
les
pe
r y
ea
r
Commercial
Residential
5
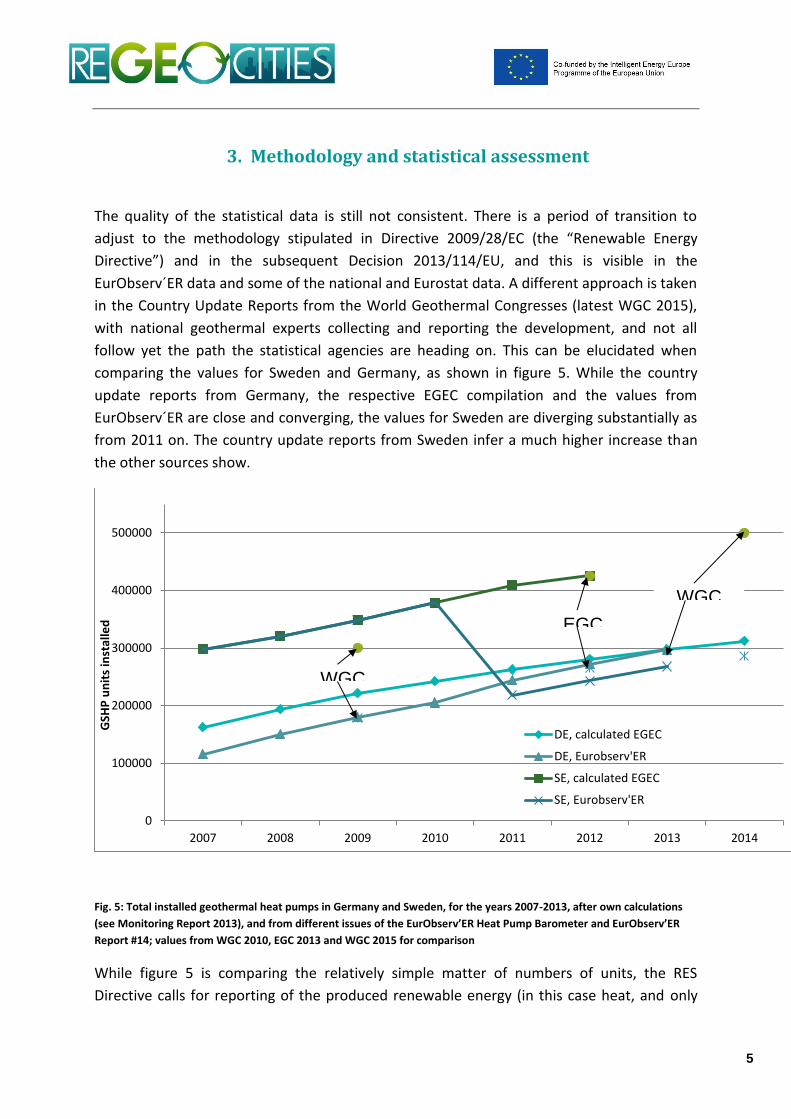
3. Methodology and statistical assessment
The quality of the statistical data is still not consistent. There is a period of transition to
adjust to the methodology stipulated in Directive 2009/28/EC (the “Renewable Energy
Directive”) and in the subsequent Decision 2013/114/EU, and this is visible in the
EurObserv´ER data and some of the national and Eurostat data. A different approach is taken
in the Country Update Reports from the World Geothermal Congresses (latest WGC 2015),
with national geothermal experts collecting and reporting the development, and not all
follow yet the path the statistical agencies are heading on. This can be elucidated when
comparing the values for Sweden and Germany, as shown in figure 5. While the country
update reports from Germany, the respective EGEC compilation and the values from
EurObserv´ER are close and converging, the values for Sweden are diverging substantially as
from 2011 on. The country update reports from Sweden infer a much higher increase than
the other sources show.
Fig. 5: Total installed geothermal heat pumps in Germany and Sweden, for the years 2007-2013, after own calculations
(see Monitoring Report 2013), and from different issues of the EurObserv’ER Heat Pump Barometer and EurObserv’ER
Report #14; values from WGC 2010, EGC 2013 and WGC 2015 for comparison
While figure 5 is comparing the relatively simple matter of numbers of units, the RES
Directive calls for reporting of the produced renewable energy (in this case heat, and only
0
100000
200000
300000
400000
500000
2007 2008 2009 2010 2011 2012 2013 2014
GSH
P u
nit
s in
stal
led
DE, calculated EGEC
DE, Eurobserv'ER
SE, calculated EGEC
SE, Eurobserv'ER
EGC
WGC
WGC
6
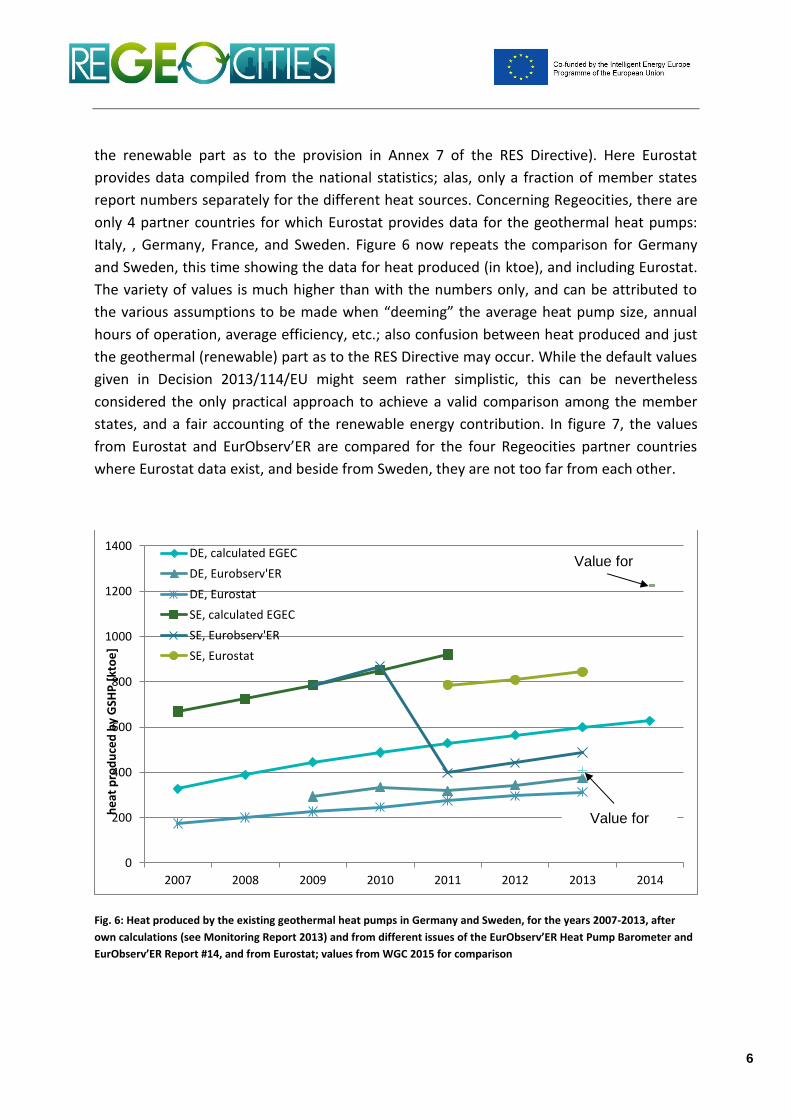
the renewable part as to the provision in Annex 7 of the RES Directive). Here Eurostat
provides data compiled from the national statistics; alas, only a fraction of member states
report numbers separately for the different heat sources. Concerning Regeocities, there are
only 4 partner countries for which Eurostat provides data for the geothermal heat pumps:
Italy, , Germany, France, and Sweden. Figure 6 now repeats the comparison for Germany
and Sweden, this time showing the data for heat produced (in ktoe), and including Eurostat.
The variety of values is much higher than with the numbers only, and can be attributed to
the various assumptions to be made when “deeming” the average heat pump size, annual
hours of operation, average efficiency, etc.; also confusion between heat produced and just
the geothermal (renewable) part as to the RES Directive may occur. While the default values
given in Decision 2013/114/EU might seem rather simplistic, this can be nevertheless
considered the only practical approach to achieve a valid comparison among the member
states, and a fair accounting of the renewable energy contribution. In figure 7, the values
from Eurostat and EurObserv’ER are compared for the four Regeocities partner countries
where Eurostat data exist, and beside from Sweden, they are not too far from each other.
Fig. 6: Heat produced by the existing geothermal heat pumps in Germany and Sweden, for the years 2007-2013, after
own calculations (see Monitoring Report 2013) and from different issues of the EurObserv’ER Heat Pump Barometer and
EurObserv’ER Report #14, and from Eurostat; values from WGC 2015 for comparison
0
200
400
600
800
1000
1200
1400
2007 2008 2009 2010 2011 2012 2013 2014
he
at p
rod
uce
d b
y G
SHP
[kt
oe
]
DE, calculated EGEC
DE, Eurobserv'ER
DE, Eurostat
SE, calculated EGEC
SE, Eurobserv'ER
SE, Eurostat
Value for
Value for
7
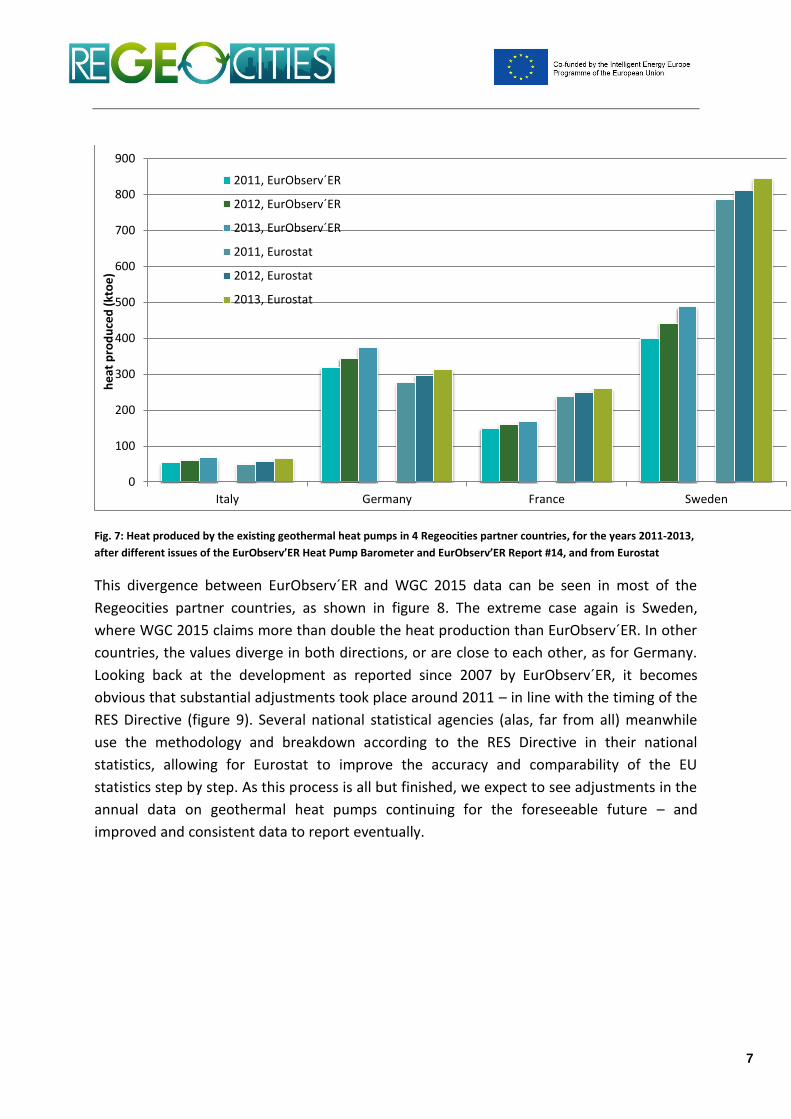
Fig. 7: Heat produced by the existing geothermal heat pumps in 4 Regeocities partner countries, for the years 2011-2013,
after different issues of the EurObserv’ER Heat Pump Barometer and EurObserv’ER Report #14, and from Eurostat
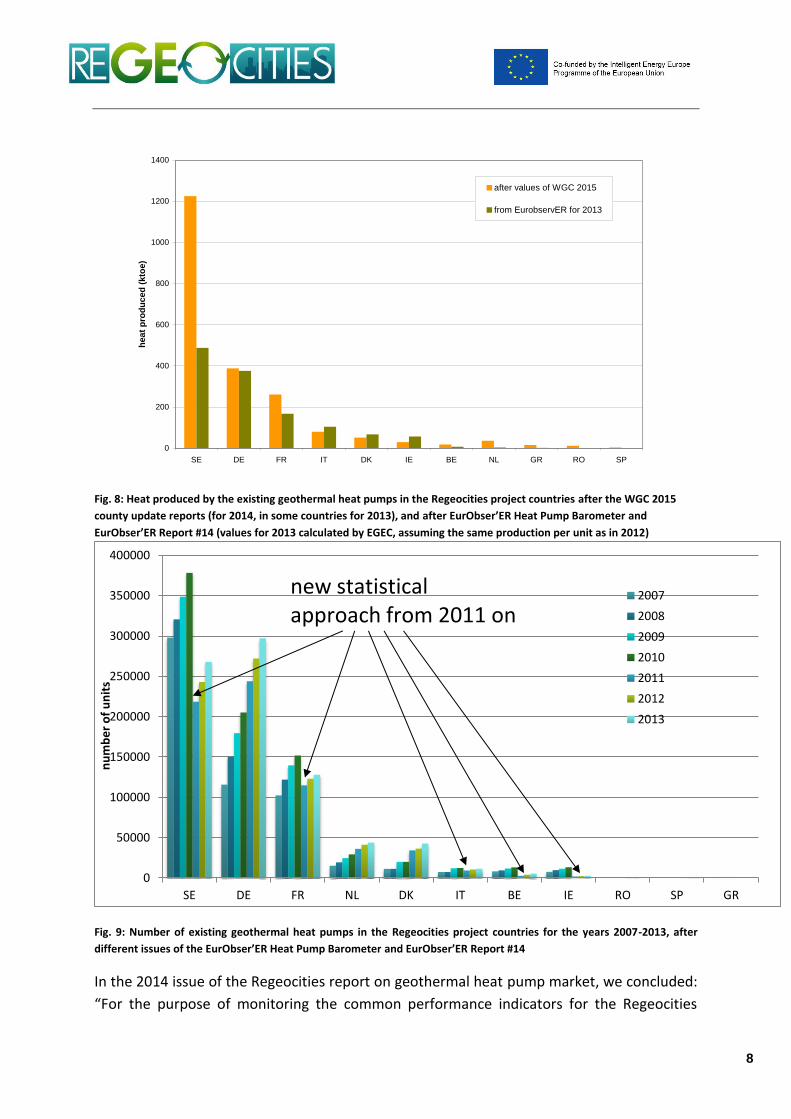
This divergence between EurObserv´ER and WGC 2015 data can be seen in most of the
Regeocities partner countries, as shown in figure 8. The extreme case again is Sweden,
where WGC 2015 claims more than double the heat production than EurObserv´ER. In other
countries, the values diverge in both directions, or are close to each other, as for Germany.
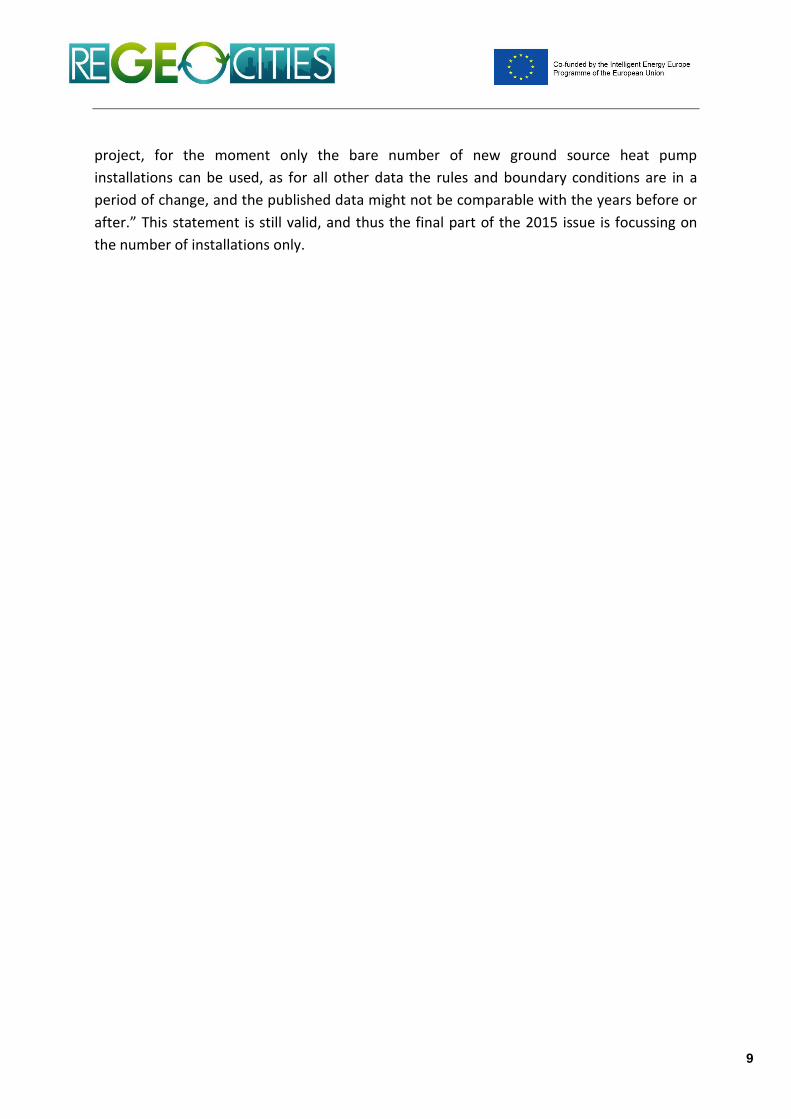
Looking back at the development as reported since 2007 by EurObserv´ER, it becomes
obvious that substantial adjustments took place around 2011 – in line with the timing of the
RES Directive (figure 9). Several national statistical agencies (alas, far from all) meanwhile
use the methodology and breakdown according to the RES Directive in their national
statistics, allowing for Eurostat to improve the accuracy and comparability of the EU
statistics step by step. As this process is all but finished, we expect to see adjustments in the
annual data on geothermal heat pumps continuing for the foreseeable future – and
improved and consistent data to report eventually.
0
100
200
300
400
500
600
700
800
900
Italy Germany France Sweden
he
at p
rod
uce
d (
kto
e)
2011, EurObserv´ER
2012, EurObserv´ER
2013, EurObserv´ER
2011, Eurostat
2012, Eurostat
2013, Eurostat
8
Fig. 8: Heat produced by the existing geothermal heat pumps in the Regeocities project countries after the WGC 2015
county update reports (for 2014, in some countries for 2013), and after EurObser’ER Heat Pump Barometer and
EurObser’ER Report #14 (values for 2013 calculated by EGEC, assuming the same production per unit as in 2012)
Fig. 9: Number of existing geothermal heat pumps in the Regeocities project countries for the years 2007-2013, after
different issues of the EurObser’ER Heat Pump Barometer and EurObser’ER Report #14
In the 2014 issue of the Regeocities report on geothermal heat pump market, we concluded:
“For the purpose of monitoring the common performance indicators for the Regeocities
0
200
400
600
800
1000
1200
1400
SE DE FR IT DK IE BE NL GR RO SP
he
at
pro
du
ce
d (
kto
e)
after values of WGC 2015
from EurobservER for 2013
0
50000
100000
150000
200000
250000
300000
350000
400000
SE DE FR NL DK IT BE IE RO SP GR
nu
mb
er
of
un
its
2007
2008
2009
2010
2011
2012
2013
new statistical approach from 2011 on
9
project, for the moment only the bare number of new ground source heat pump
installations can be used, as for all other data the rules and boundary conditions are in a
period of change, and the published data might not be comparable with the years before or
after.” This statement is still valid, and thus the final part of the 2015 issue is focussing on
the number of installations only.
10
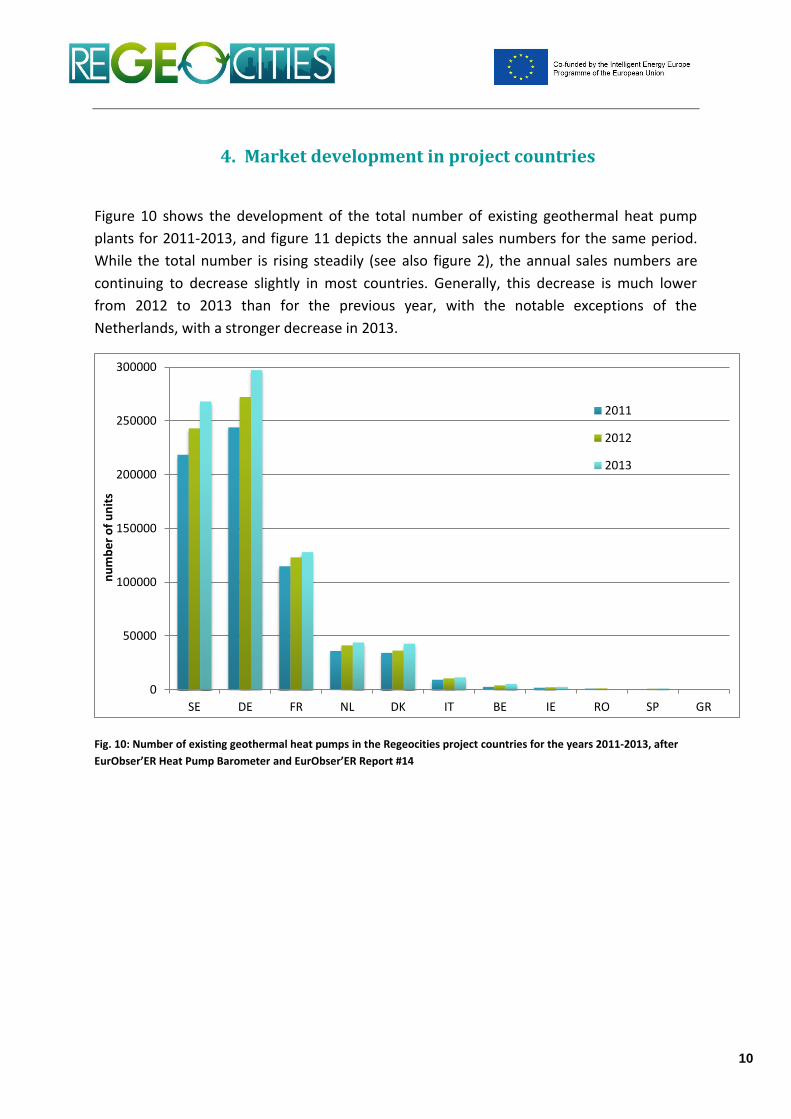
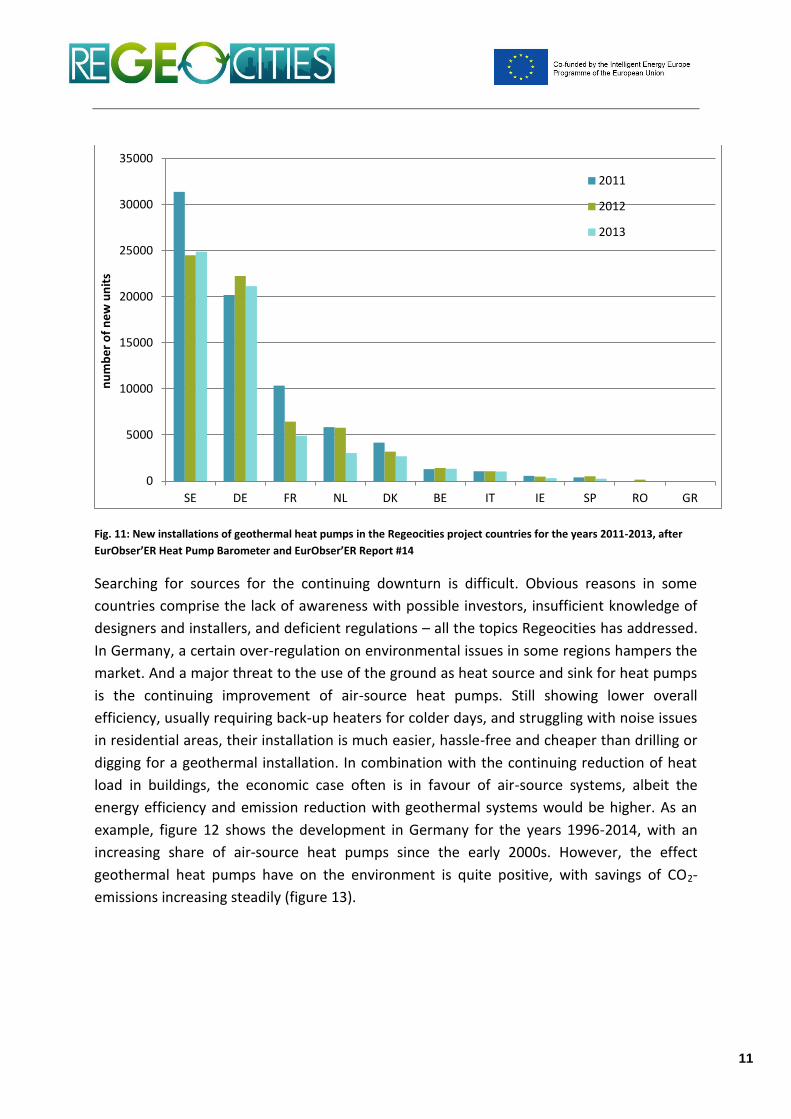
4. Market development in project countries
Figure 10 shows the development of the total number of existing geothermal heat pump
plants for 2011-2013, and figure 11 depicts the annual sales numbers for the same period.
While the total number is rising steadily (see also figure 2), the annual sales numbers are
continuing to decrease slightly in most countries. Generally, this decrease is much lower
from 2012 to 2013 than for the previous year, with the notable exceptions of the
Netherlands, with a stronger decrease in 2013.
Fig. 10: Number of existing geothermal heat pumps in the Regeocities project countries for the years 2011-2013, after
EurObser’ER Heat Pump Barometer and EurObser’ER Report #14
0
50000
100000
150000
200000
250000
300000
SE DE FR NL DK IT BE IE RO SP GR
nu
mb
er
of
un
its
2011
2012
2013
11
Fig. 11: New installations of geothermal heat pumps in the Regeocities project countries for the years 2011-2013, after
EurObser’ER Heat Pump Barometer and EurObser’ER Report #14
Searching for sources for the continuing downturn is difficult. Obvious reasons in some
countries comprise the lack of awareness with possible investors, insufficient knowledge of
designers and installers, and deficient regulations – all the topics Regeocities has addressed.
In Germany, a certain over-regulation on environmental issues in some regions hampers the
market. And a major threat to the use of the ground as heat source and sink for heat pumps
is the continuing improvement of air-source heat pumps. Still showing lower overall
efficiency, usually requiring back-up heaters for colder days, and struggling with noise issues
in residential areas, their installation is much easier, hassle-free and cheaper than drilling or
digging for a geothermal installation. In combination with the continuing reduction of heat
load in buildings, the economic case often is in favour of air-source systems, albeit the
energy efficiency and emission reduction with geothermal systems would be higher. As an
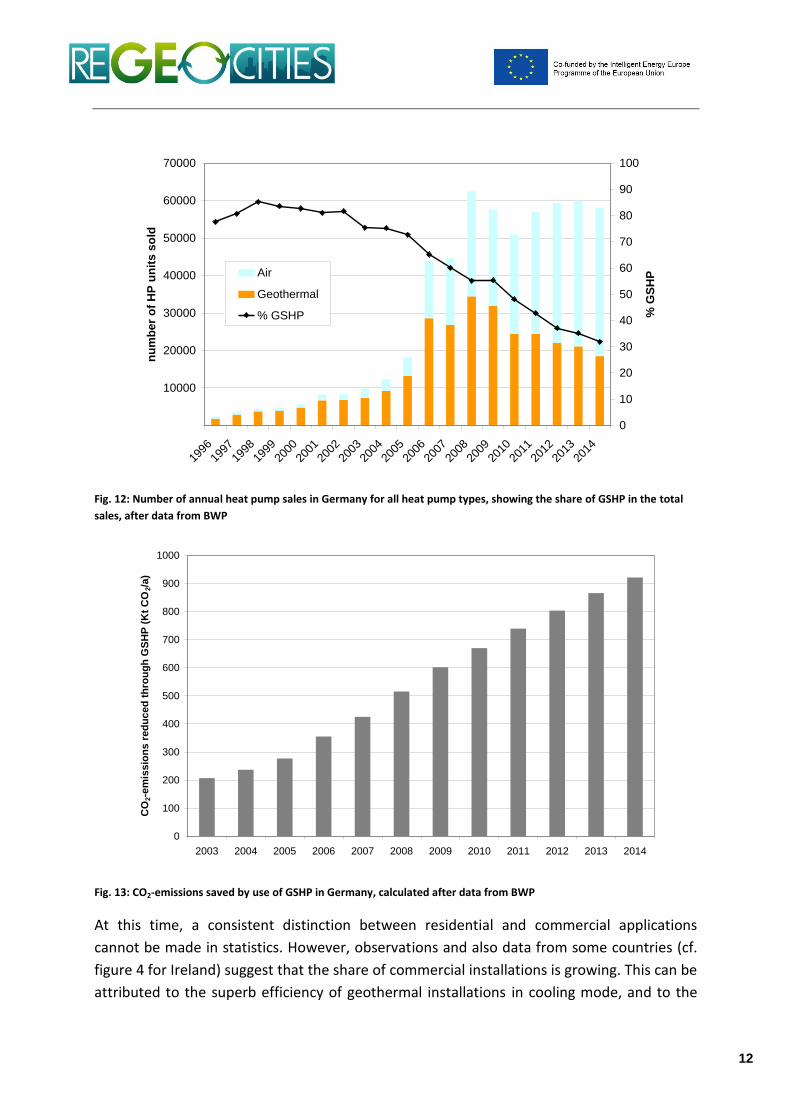
example, figure 12 shows the development in Germany for the years 1996-2014, with an
increasing share of air-source heat pumps since the early 2000s. However, the effect
geothermal heat pumps have on the environment is quite positive, with savings of CO2-
emissions increasing steadily (figure 13).
0
5000
10000
15000
20000
25000
30000
35000
SE DE FR NL DK BE IT IE SP RO GR
nu
mb
er
of
ne
w u
nit
s
2011
2012
2013
12
Fig. 12: Number of annual heat pump sales in Germany for all heat pump types, showing the share of GSHP in the total
sales, after data from BWP
Fig. 13: CO2-emissions saved by use of GSHP in Germany, calculated after data from BWP
At this time, a consistent distinction between residential and commercial applications
cannot be made in statistics. However, observations and also data from some countries (cf.
figure 4 for Ireland) suggest that the share of commercial installations is growing. This can be
attributed to the superb efficiency of geothermal installations in cooling mode, and to the
10000
20000
30000
40000
50000
60000
70000
1996
1997
1998
1999
2000
2001
2002
2003
2004
2005
2006
2007
2008
2009
2010
2011
2012
2013
2014
nu
mb
er
of
HP
un
its
so
ld
0
10
20
30
40
50
60
70
80
90
100
% G
SH
PAir
Geothermal
% GSHP
0
100
200
300
400
500
600
700
800
900
1000
2003 2004 2005 2006 2007 2008 2009 2010 2011 2012 2013 2014
CO
2-e
mis
sio
ns r
ed
uced
th
rou
gh
GS
HP
(K
t C
O2/a
)
13
fact that the savings in a larger installation can more easily return the higher investment
cost. Thus the future is bright for geothermal heat pumps in the commercial sector. The
business case is given, and the deficiencies in investor awareness and installer skills can be
overcome by respective campaigns.
A response to the development towards air-source heat pumps in the residential sector is
more difficult. Beside information and training activities, further R&D is required to adapt
the geothermal installation to lower heat loads (near-zero-energy buildings), to simplify
installation and to provide standard, of-the-shelf solutions with reduced cost. Two related
projects to be funded within Horizon 2020 are expected to start soon, but more effort and
development work by industry is required.
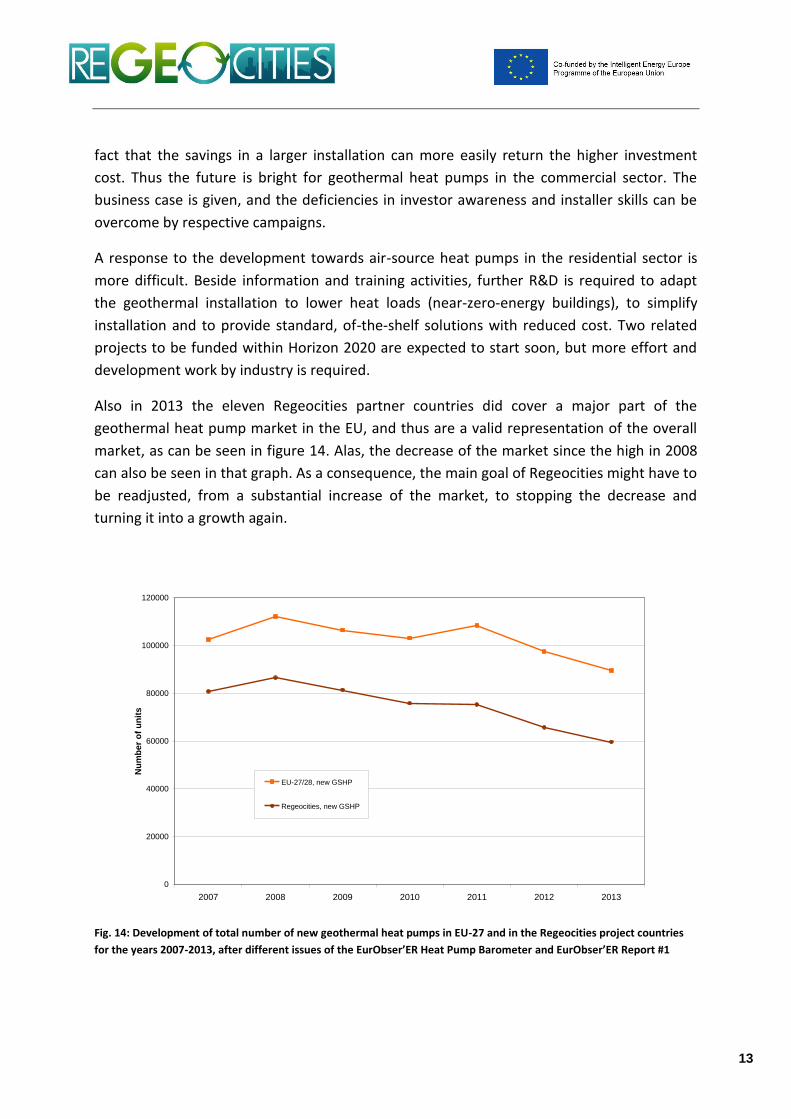
Also in 2013 the eleven Regeocities partner countries did cover a major part of the
geothermal heat pump market in the EU, and thus are a valid representation of the overall
market, as can be seen in figure 14. Alas, the decrease of the market since the high in 2008
can also be seen in that graph. As a consequence, the main goal of Regeocities might have to
be readjusted, from a substantial increase of the market, to stopping the decrease and
turning it into a growth again.
Fig. 14: Development of total number of new geothermal heat pumps in EU-27 and in the Regeocities project countries
for the years 2007-2013, after different issues of the EurObser’ER Heat Pump Barometer and EurObser’ER Report #1
0
20000
40000
60000
80000
100000
120000
2007 2008 2009 2010 2011 2012 2013
Nu
mb
er
of
un
its
EU-27/28, new GSHP
Regeocities, new GSHP
14
Conclusions
For the purpose of monitoring the common performance indicators for the Regeocities
project, at the time of writing (June 2015) the number of new units installed was available
only until end of 2013. Therefore, an impact of the project (started in 2012) in terms of
triggered investments, renewable energy production, primary energy savings, and
greenhouse gas emissions reduction cannot yet be seen in the statistics. As stated above, a
stopping of the market decrease could be considered a success already under the current
circumstances.
Literature: Country Update Reports from WGC 2015 (selected papers for Europe) – Proc. WGC 2015 Melbourne EurObserv´ER Heat Pump Barometer, 20 p, October 2009 EurObserv´ER Ground-Source Heat Pump Barometer, 20 p, September 2011 EurObserv´ER Heat Pumps Barometer, 9 p, October 2013 Eurostat, values from SHARES 2013 Pasquali, R., Allen, A., Burgess, J., Jones, G.L. & Hunter Williams, T. (2015): Geothermal Energy Utilisation - Ireland Country Update – Proc. WGC 2015 Melbourne, 10 p, paper # 01043 The state of Renewable Energies in Europe – edition 2014, 14th EurObserv´ER report, pp 39-43