D. Prahl and M. Shaffer IBACOS, Inc. · Moisture Risk in Unvented Attics Due to Air Leakage Paths...
37
Moisture Risk in Unvented Attics Due to Air Leakage Paths D. Prahl and M. Shaffer IBACOS, Inc. November 2014
-
Upload
nguyenphuc -
Category
Documents
-
view
219 -
download
3
Transcript of D. Prahl and M. Shaffer IBACOS, Inc. · Moisture Risk in Unvented Attics Due to Air Leakage Paths...

Moisture Risk in Unvented Attics Due to Air Leakage Paths
D. Prahl and M. Shaffer IBACOS, Inc.
November 2014

NOTICE
This report was prepared as an account of work sponsored by an agency of the United States government. Neither the United States government nor any agency thereof, nor any of their employees, subcontractors, or affiliated partners makes any warranty, express or implied, or assumes any legal liability or responsibility for the accuracy, completeness, or usefulness of any information, apparatus, product, or process disclosed, or represents that its use would not infringe privately owned rights. Reference herein to any specific commercial product, process, or service by trade name, trademark, manufacturer, or otherwise does not necessarily constitute or imply its endorsement, recommendation, or favoring by the United States government or any agency thereof. The views and opinions of authors expressed herein do not necessarily state or reflect those of the United States government or any agency thereof.
Available electronically at www.osti.gov/scitech
Available for a processing fee to U.S. Department of Energy and its contractors, in paper, from:
U.S. Department of Energy Office of Scientific and Technical Information P.O. Box 62 Oak Ridge, TN 37831-0062 phone: 865.576.8401 fax: 865.576.5728 email: mailto:[email protected]
Available for sale to the public, in paper, from:
U.S. Department of Commerce National Technical Information Service 5285 Port Royal Road Springfield, VA 22161 phone: 800.553.6847 fax: 703.605.6900 email: [email protected] online ordering: www.ntis.gov/ordering.htm
iii
Moisture Risk in Unvented Attics Due to Air Leakage Paths
Prepared for:
The National Renewable Energy Laboratory
On behalf of the U.S. Department of Energy’s Building America Program
Office of Energy Efficiency and Renewable Energy
15013 Denver West Parkway
Golden, CO 80401
NREL Contract No. DE-AC36-08GO28308
Prepared by:
D. Prahl and M. Shaffer
IBACOS, Inc.
2214 Liberty Avenue
Pittsburgh, Pennsylvania 15222
NREL Technical Monitor: Stacey Rothgeb
Prepared under Subcontract No. KNDJ-0-40341-04
November 2014

iv
The work presented in this report does not represent performance of any product relative to regulated minimum efficiency requirements.
The laboratory and/or field sites used for this work are not certified rating test facilities. The conditions and methods under which products were characterized for this work differ from standard rating conditions, as described.
Because the methods and conditions differ, the reported results are not comparable to rated product performance and should only be used to estimate performance under the measured conditions.

v
Contents List of Figures ............................................................................................................................................ vi List of Tables .............................................................................................................................................. vi Definitions .................................................................................................................................................. vii Acknowledgments ................................................................................................................................... viii Executive Summary ................................................................................................................................... ix 1 Introduction ........................................................................................................................................... 1 2 Project Background ............................................................................................................................. 2
2.1 Vented and Unvented Attics ............................................................................................................ 3 2.2 Energy Savings of Unvented Attics ................................................................................................. 4 2.3 Attic Moisture-Related Issues .......................................................................................................... 4 2.4 Airflow-Induced Forces ................................................................................................................... 5
3 Research Questions ............................................................................................................................. 6 4 Technical Approach ............................................................................................................................. 7
4.1 Scope of Study ................................................................................................................................. 7 4.2 Field Data ......................................................................................................................................... 8
4.2.1 Attic Airflow Path (Crack) Types ....................................................................................... 8 4.2.2 Unvented Attic Air Leakage Rates ..................................................................................... 8
4.3 Modeling Effort ............................................................................................................................... 8 5 Results and Discussion ..................................................................................................................... 10
5.1 Field Data ....................................................................................................................................... 10 5.1.1 Attic Airflow Path (Crack) Types ..................................................................................... 10 5.1.2 Discussion of Attic Airflow Path (Crack) Types .............................................................. 13 5.1.3 Unvented Attic Air Leakage Rates ................................................................................... 13 5.1.4 Discussion of Field Data ................................................................................................... 14
5.2 Computational Fluid Dynamics—Airflow Rates for Airflow Paths .............................................. 15 5.2.1 Discussion of the Computational Fluid Dynamics Analysis ............................................ 15
5.3 CONTAM—Airflow Rates for Unvented Attics ........................................................................... 15 5.3.1 Discussion of CONTAM .................................................................................................. 17
5.4 Mass Flow Rate of Water Vapor ................................................................................................... 17 5.4.1 Discussion of Mass Flow Rate of Water Vapor ................................................................ 19
5.5 Hygrothermal Analysis—Moisture Content .................................................................................. 19 5.5.1 Discussion of Hygrothermal Analysis .............................................................................. 23
6 Conclusions ........................................................................................................................................ 24 6.1 Future Research ............................................................................................................................. 24
References ................................................................................................................................................. 26

vi
List of Figures Figure 1. Airflow paths for (left) a vented (conventional) attic and (right) an unvented
(cathedralized) attic .............................................................................................................................. 4 Figure 2. The study workflow..................................................................................................................... 7 Figure 3. Plumbing vent penetrations ..................................................................................................... 10 Figure 4. Delaminating ccSPF airflow path ............................................................................................ 10 Figure 5. Ridge vent opening ................................................................................................................... 11 Figure 6. Surface area openings at the roof sheathing ......................................................................... 11 Figure 7. Plumbing, bath fan venting, or flue vent airflow path ........................................................... 12 Figure 8. Surface area airflow path at the face of a roof rafter ............................................................. 12 Figure 9. Ridge vent airflow path with delamination at the face of a roof rafter and ridge ............... 13 Figure 10. Pre-retrofit (vented) and post-retrofit (ccSPF-insulated unvented) attic airflow and
pressure curves .................................................................................................................................. 14 Figure 11. Location of attic airflow paths on the CONTAM model....................................................... 16 Figure 12. Airflow pressure relationship (between attic interior and exterior) for the family of
airflow paths input into CONTAM ..................................................................................................... 16 Figure 13. Histogram of CONTAM simulated hourly exfiltration and infiltration airflow rates
through a ccSPF-insulated unvented attic in Minneapolis, Minnesota. Negative values indicate outdoor air flowing into the attic space. ............................................................................ 17
Figure 14. CONTAM attic airflow rates determined for Minneapolis, Minnesota. The shaded regions indicate instances when the outdoor temperature was lower than the dew point of the airflow moving through the attic cracks. .............................................................................. 18
Figure 15. Histogram of the number of continuous hours that airflow is moving through attic airflow paths and condensation could occur .................................................................................. 19
Figure 16. Schematic view of the WUFI 2D model for the plumbing airflow path .............................. 20 Figure 17. WUFI representation of the airflow path ............................................................................... 20 Figure 18. Hygrothermal results indicating the OSB moisture content at various distances
from the edge of the airflow path ...................................................................................................... 21 Figure 19. Hygrothermal results for plumbing airflow path with 0 and 0.25 CFM airflow ................. 22 Figure 20. Hygrothermal results for plumbing airflow path with 2.5 and 12.5 CFM airflow .............. 22
Unless otherwise noted, all figures were created by IBACOS.
List of Tables Table 1. Data Collected for Three Attics* ................................................................................................ 14 Table 2. Airflow Characteristics Relating Airflow Rate to Pressure .................................................... 15 Table 3. Airflow Path Type, Number, and Airflow at 4 Pa for Each Airflow Path and the Total ........ 15
Unless otherwise noted, all tables were created by IBACOS.

vii
Definitions
2D Two-Dimensional
3D Three-Dimensional
ACH Air Changes per Hour
BEopt™ Building Energy Optimization (software)
ccSPF Closed-Cell Spray Polyurethane Foam
CFD Computational Fluid Dynamics
OSB Oriented Strand Board
TMY3 Typical Meteorological Year 3
WUFI Wärme und Feuchte instationär (software)
viii
Acknowledgments
This report was prepared for the U.S. Department of Energy Building America program. Funding for this work was provided by the National Renewable Energy Laboratory under Subcontract No. KNDJ-0-40341-04.
The authors acknowledge Building Science Laboratories, Building Science Corporation, and Steven Winter Associates for their technical assistance with this research.

ix
Executive Summary
IBACOS completed an initial analysis of moisture damage potential in an unvented attic insulated with closed-cell spray polyurethane foam. To complete this analysis, the research team collected field data, used computational fluid dynamics to quantify the airflow rates through individual airflow (crack) paths, simulated hourly flow rates through the leakage paths with CONTAM software, correlated the CONTAM flow rates with indoor humidity ratios from Building Energy Optimization software, and used Wärme und Feuchte instationär Pro two-dimensional modeling to determine the moisture content of the building materials surrounding the cracks.
Given the number of simplifying assumptions and numerical models associated with this analysis, the results indicate that localized damage due to high moisture content of the roof sheathing is possible under very low airflow rates. Reducing the number of assumptions and approximations through field studies and laboratory experiments would be valuable to understand the real-world moisture damage potential in unvented attics.

1
1 Introduction
This report investigates moisture risk in unvented (cathedralized) attics in cold climates resulting from airflow paths (cracks) from the unvented attic to the outdoors. The analysis uses attic leakage rates for existing houses, although the results are applicable to new construction if the leakage in the new construction is similar (i.e., similar airflow path geometry, airflow magnitude, location of leaks) to that discussed in this report. Specifically, this report investigates, through numerical simulations calibrated against measured data, the moisture potential of a two-story, 2,050-ft2 house located in Minneapolis, Minnesota, in an unvented attic insulated with closed-cell spray polyurethane foam (ccSPF) at the roof deck. In this house, the attic temperature and relative humidity are equal to those of the living space (this was modeled via an open attic hatch), and the enclosure leakage is 5 air changes per hour at 50 Pa (ACH50). Note that in this report, the attic leakage was included in the envelope leakage; however, the volume of the attic was not used to determine the air changes per hour due to the fact that the attic will not be used as a living space. This report also presents field-recorded attic leakage rates of three existing houses where ccSPF was applied at the roof deck to houses retrofitted from vented to unvented attics. At two of those three houses, the attic leakage was recorded before the vented attic was retrofitted to an unvented attic.
The purpose of this study is to investigate the hypothesis that ccSPF unvented attics have some moisture damage risk due to airflow paths between the ccSPF and attic building materials, at connections between building materials (e.g., wood-to-wood connections), or at other typical roof penetrations (e.g., plumbing or flue stack). To investigate this question, the IBACOS research team first worked to understand the airflow paths through ccSPF-insulated unvented attics and then to evaluate the moisture risks associated with the airflow paths. Because the intent was to understand the risks, the scope of this report was limited to worst-case scenarios; conservative assumptions were made that maximized the water vapor available for condensation and the environment for condensation.
The focus of this study is heating climates (climate zones 6 and 7) where condensation will occur on the roof sheathing due to low outdoor temperatures. Although moisture deposition may also occur during space cooling periods (where condensation is most likely to occur on cold space conditioning equipment surfaces), it is not the primary risk in a heating-dominant environment. In a heating-dominant climate, the indoor air is warmer and has more moisture than the outdoor air and thus has lower density. Lower density air moves to the highest point (i.e., the attic) and travels through attic cracks to the outdoors.
2
2 Project Background
In 2011, a spray foam manufacturer approached IBACOS to discuss moisture-related risks associated with retrofitting vented to unvented attics with ccSPF. The manufacturer’s primary concern with unvented attics was the potential risk of condensation at the interior surface of the ccSPF at the roof deck when fiberglass batt insulation was installed on the attic floor. The research team made two primary assumptions:
1. The temperature and humidity ratio of the living space and the attic air were not in equilibrium. A small amount of living space air leaked into the attic, and no air leaked from the attic to the exterior.
2. The attic floor fiberglass batt insulation (i.e., thermal barrier) restricted the heat flow into the attic space, resulting in an intermediate thermal zone between indoor and outdoor temperatures. This condition reduces the temperature of the downward-facing ccSPF at the roof deck, creating a scenario where the dew point of the attic air could more easily be achieved on the ccSPF surface.
Results of this work indicated that if the spray foam at the underside of the roof deck was an air barrier preventing leakage to the outside, if there was series leakage between the attic and the conditioned space below, and if there was insulation at the attic floor, then there can be a risk of condensation on the underside of the foam. Although many other factors (e.g., daily solar loading, night sky radiation, snow accumulation on the roof, condition of the existing attic floor insulation) are involved, this risk is conservatively dependent on inside temperature and relative humidity, average annual winter outdoor temperature, and, most importantly, the relative R-value of the insulation on the attic floor. In effect, insulation at the attic floor prevents the surface materials in the attic space from becoming warm enough to prevent condensation when air from the living space leaks into the attic.
The analysis discussed above did not consider the air leakage from the attic to the exterior, although it is known that some leakage does occur, because the complexity of the problem makes solutions highly uncertain. The analysis in this report focuses on airflow paths and condensation that can result in the airflow paths.
To begin this project, the research team completed a “back-of-the-envelope” calculation (Equation 1) to evaluate the mass of water vapor moving through airflow paths of an attic:
, yr
day365dayhr24
hrmin60
yrlb
%30&70@%30&70@vaporOH2 ∗∗∗∗∗= RHFRHFavgCFM rω (1)
where
CFM = airflow rate (cubic feet of air per minute)
ω = humidity ratio (pounds of moisture per pound of dry air)
ρ = density of air (pound of dry air per cubic foot of air)

3
70F&30%RH = 70°F at 30% relative humidity
Assuming 140 CFM, an air density of 0.0741 lb of dry air per cubic foot, and 0.0046 lb of moisture per pound of dry air, Equation 1 becomes
yr
lb25,000
yr
day365dayhr24
hrmin60
ft
lb0741.0
lb
lb0046.0
minft140
yr
lb
vaporOH
3airdry
airdry
OH3
vaporOH
2
22
=
∗∗∗∗∗=
The result of the back-of-the-envelope calculation indicates that approximately 25,000 lb of water vapor flow through attic airflow paths during a year. This also assumes that the air pressure in the attic is greater than the outdoor air pressure all year, which is not actually the case, but is a steady-state assumption.
Next, the research team determined the number of hours that the temperature of the outdoor air was at or below the dew point of the attic air; for Minneapolis, there are 3,500 h when the outdoor temperature is below the dew point of air at 70°F and 30% RH (approximately 40% of the year). Multiplying the mass flow rate (approximated with Equation 1) by the percentage results in approximately 9,900 lb of water vapor flowing through attic cracks when condensation conditions are present. In reality, only a minor amount of the air that flows through attic cracks will come into contact with the building materials due to air films at the crack edges. Even if 15% of the mass flow rate is used, approximately 1,500 lb of water vapor potentially could condense in the cracks. This simple calculation indicates that an environment exists for liquid water deposition or very high moisture content in moisture-sensitive attic building materials.
Although many homes are being built or retrofitted with unvented attics, the field performance of ccSPF installed as an air barrier in unvented attics is not well documented. This study is a first attempt at developing an understanding of airflow paths in ccSPF-insulated unvented attics and investigates the moisture risk associated with these airflow paths.
The following subsections provide both a conceptual background and a summary of previously completed work related to this study.
2.1 Vented and Unvented Attics A vented (conventional) attic has insulation placed on the attic floor and has intentional air venting to the exterior. An unvented (cathedralized) attic has insulation placed at the roof deck, with no intentional venting to the exterior. Also, in most houses that are retrofitted from vented to unvented attics, the pre-retrofitted attic insulation is allowed to remain on the attic floor.
As Figure 1 illustrates, a vented attic allows air to move through the attic space. One disadvantage of a vented attic space that also houses space conditioning equipment and ducts is that the temperature of the attic can become hot during summer and correspondingly cold in winter. If an air handler unit and/or ducts are located within that vented attic, the hot or cold attic air will increase the space conditioning load on the house.
Dew point: The temperature at which water vapor in air
condenses into liquid water.

4
Figure 1. Airflow paths for (left) a vented (conventional) attic and
(right) an unvented (cathedralized) attic
2.2 Energy Savings of Unvented Attics Unvented attics are considered semi-conditioned spaces. Studies have shown that, although an unvented attic is not designed to distribute conditioned air into the attic space, a natural air exchange occurs between the living space and the unvented attic. For example, Rudd (2005) compared the envelope pressurization test results of 10 newly built houses with unvented attics in Banning, California. Envelope pressure tests were completed with the attic hatch open and closed. The results indicate that the CFM50 airflow was reduced an average of 15% when the attic hatch was closed. This indicates that the living space and the unvented attic are communicating. The study also monitored the temperatures of the attic and the living space. The monitoring results indicated that there was little temperature difference between the attic and the living space.
Because the temperature of an unvented attic approaches the temperature of the living space, air handling equipment and ducts placed in an unvented attic are conceptually located in conditioned space. A 9% cooling energy savings was measured by Parker et al. (2001) in a side-by-side roof research test in Florida. Rudd et al. (2000) completed side-by-side research of vented and unvented attics in homes in Las Vegas, Nevada, and Tucson, Arizona, and they found a 5% cooling energy savings. These savings are influenced by the leakiness of the ducts; the leakier the ducts, the greater the potential energy savings because the conditioned air leakage is lost into the vented attic as opposed to the unvented attic. Research indicates that unvented attics offer energy savings in both heating and cooling climates.
2.3 Attic Moisture-Related Issues Moisture in an attic space related to attic ventilation was first studied by Rowley et al. (1939). Several studies of vented attics indicated that in heating climates, attic ventilation reduced the risk of condensation, whereas ventilation contributed to the risk of condensation in southern humid climates (Rudd and Lstiburek 1998; Lstiburek 1993; TenWolde and Rose 1999).
Studies of moisture damage in unvented attics have been completed for dense pack cellulose by Fitzgerald (2010) and indicate that 20% of incorrectly installed (i.e., no air rafter ventilation built into the assembly to dry materials) dense pack cathedralized attics failed within the first 10 years of installation. Schumacher and Lepage (2012) authored Guideline for Moisture Control in
5
Dense-Packed Assemblies, which provides guidance for the use of dense pack cellulose in cathedralized unvented attics. Four strategies are recommended in the guideline, including the use of ccSPF on the underside of the roof deck with cellulose below it. The report indicates that unvented attics that have correctly installed ccSPF offer the following benefits for both heating and cooling climates:
• In heating climates, the ccSPF insulation creates a thermal barrier that prevents the living space air, which is warm and moist, from contacting building materials that are at a temperature equal to or lower than the dew point of the living space air.
• In cooling climates, the ccSPF insulation creates an air barrier that prevents outdoor air, which is warm and humid, from entering the attic space.
Work by Straube et al. (2010) used Wärme und Feuchte instationär (WUFI) Pro Version 5.01 software to analyze various combinations of air-impermeable insulation (spray foam) and air-permeable insulations (fiberglass and cellulose), and they drew conclusions about appropriate R-values and vapor control strategies. In particular, Straube et al. (2010, p. 8) state:
For the roofs insulated with partial-depth spray foam fills, air leakage through the insulation is effectively stopped, as the foam seals all the joints and cracks in the roof deck. It cannot seal the airflow through wood-to-wood joints: these require alternate air sealing treatment and are not considered by the analysis in this paper.
Grin et al. (2013) studied the unvented attic moisture risk resulting from bulk water transport due to precipitation through damaged roofs. They concluded that an unvented attic can adequately withstand a water leakage event from rain without damage to the building materials.
2.4 Airflow-Induced Forces The two methods that create a pressure differential that results in airflow from the building interior to the exterior through attic cracks are (1) stack effect and (2) wind-induced pressure differentials (Walker 1989). In this study, the research team used CONTAM2 Version 3.1 software to simulate the dynamic nature of stack effect and wind-induced pressure effect in an unvented attic. CONTAM has been used in numerous studies because of its ability to model the multizone relationship of airflow in houses (Emmerich et al. 2003; Emmerich 2001; Nirvan et al. 2012). Although studies using CONTAM often are related to contaminant transport, the physics of air movement is the same.
1 Fraunhofer Institute for Building Physics, Stuttgart, Germany. www.wufi.de/index_e.html. 2 www.nist.gov/el/building_environment/contam_software.cfm.

6
3 Research Questions
This project sought to answer the following research questions for existing houses in cold climates:
1. Does air leakage between an attic and the outdoors occur after the application of ccSPF?
2. For Question 1, what is the magnitude of air leakage rates?
3. If there is air leakage in ccSPF attic assemblies, what is the potential moisture accumulation on the roof sheathing at possible air leakage pathways?

7
4 Technical Approach
To investigate the moisture impact of air leakage through attic airflow paths found in ccSPF-insulated unvented attics, the research team gathered field data to understand leakage rates and used numerical models to simulate physical phenomena. Figure 2 illustrates the project workflow, showing that the study workflow combined field measurements with multiple numerical models to assess moisture-related risk in ccSPF-insulated unvented attics.
Figure 2. The study workflow3
The following sections detail the technical approach used in this project, beginning with the documentation of the scope of the study.
4.1 Scope of Study This study is intended to be a first-pass analysis of the moisture potential in a ccSPF-insulated attic due to airflow paths through the unvented attic of an existing home. The study relies on numerical models and field data to gain a better understanding of how moisture moves through attic airflow paths and the potential risk of moisture accumulation in building materials. Future work in unvented roof assemblies should be targeted at collecting field data to more accurately document gross attic air leakage, commonly found individual airflow paths, and moisture content of building materials at known airflow paths.
The first step of the project was to identify airflow paths. To accomplish this, the project team reviewed photos of air leakage paths and made 3D models of the airflow paths to be used in the CFD analysis. The next step was to use the CFD analysis to characterize the pressure/airflow relationship and to enter that into CONTAM. The CONTAM model was trued up using field data of attic leakage rates. Then the CONTAM data were merged with BEopt-produced indoor temperature and relative humidity data to determine the mass flow rate of water vapor through the individual airflow paths. Finally, the team used WUFI to determine the moisture content of the building materials using the water vapor flow rate through the crack and the Typical Meteorological Year 3 (TMY3) weather file for Minneapolis, Minnesota.
3 3D is three-dimensional. CFD is computational fluid dynamics. BEopt™ is Building Energy Optimization software, Version 2.1.0.2, http://beopt.nrel.gov/.

8
4.2 Field Data To simulate the leakage rate of ccSPF insulation on the roof decks of unvented attics, the research team needed first to characterize the airflow paths and then to quantify the gross unvented attic air leakage rates. The following two sections describe the approach the team used to gather and analyze the field data.
4.2.1 Attic Airflow Path (Crack) Types The researchers reviewed in-house photographs collected from past building quality inspections done in-house and by others. After reviewing the photographs, the team determined that several types of attic airflow paths might be found in a ccSPF-insulated unvented attic. The categories were determined to be as follows: (1) plumbing penetrations, (2) spray foam delamination, (3) framing intersections, and (4) ridge vent sealing. Another category that exists but was not used in this report is poor sealing of soffit vents in existing houses. These vents are sealed during the application of the ccSPF when a house is retrofitted from a vented to unvented attic. These types of airflow paths have a large amount of variation, and further work is needed to develop a characterization of these airflow paths.
Once the airflow paths were identified, the research team used Rhinoceros4 Version 5 software to create 3D solid models of the cracks.
4.2.2 Unvented Attic Air Leakage Rates Air leakage rates for unvented attics are not well documented; thus, the research team completed three field tests to gain a better understanding of gross leakage rates of unvented attics. The method used was a multipoint guarded blower door test. A guarded blower door test uses two blower door assemblies. One blower door pressurizes the house, and a second blower door is located in the attic access opening, where it is brought to the same pressure as the house to isolate the house leakage from the attic leakage. Once the multipoint leakage rates were recorded, the team used regression analysis via ASTM E779 methods (ASTM 2010) to determine a mathematical relationship between the gross airflow out of the attic and the pressure differential between the interior and exterior.
4.3 Modeling Effort As illustrated in Figure 2, the modeling effort required the use of four different modeling programs: ANSYS CFD Version 15.05, CONTAM Version 3.1, BEopt Version 2.1.0.2, and WUFI Pro Version 5.0. First, 3D models of the cracks, as discussed in Section 4.2.1, were input into ANSYS. ANSYS then was driven at steady state with approximately five different mass flow rates, and the pressure differentials between the interior and exterior of the crack were recorded. The research team used Equation 2 to develop the mathematical description of each airflow path (ASHRAE 2005, Chapter 27.12, Equation 32).
4 www.rhino3d.com/. 5 ANSYS, Inc., Canonsburg, PA: www.ansys.com/Products/Simulation+Technology/Fluid+Dynamics.

9
,nPCq ∆= (2) where
q = airflow rate (CFM)
C = leakage flow coefficient (CFM/(Pa)n)
ΔP = pressure difference across the leak (Pa)
n = flow exponent (dimensionless)
C and n were determined using ASTM E779 methods (ASTM 2010). The power law equation (Equation 2) is a continuous representation of the airflow rate as a function of pressure across a crack.
Once the flow rate for each crack type was characterized mathematically, the flow parameters (C and n) for each crack type were entered into the CONTAM model to determine the hourly flow rate through each of the attic leakage paths. The CONTAM model was driven with TMY3 weather data. The building enclosure leakage, including the attic leakage, of the CONTAM model was 5 ACH50, where the air change per hour does not include the attic volume.
Next, a BEopt Version 2.1.0.2 model, which was equivalent to the CONTAM model geometrically and in enclosure tightness, was used to simulate the hourly indoor temperature and humidity ratio. Note that the BEopt model does not account for leakage from the house into the attic space. The hourly CONTAM airflow rates were matched with the hourly temperature and humidity ratio from the BEopt model to determine the hourly mass flow rate of water vapor through the attic cracks.
The hourly mass flow rate of water vapor through the plumbing airflow path (the largest crack) was input into WUFI (numerical hygrothermal analysis software) to determine the moisture absorption and desorption in the attic materials. Hygrothermal analysis is used to study the durability of building enclosure components. Generally, hygrothermal analysis quantifies the wetting and drying of building materials based on moisture available to the material at the current time step as a function of the moisture content of the material at the previous time step, plus the addition or removal of moisture due to the conditions of the materials and air surrounding the crack. The strength of hygrothermal analysis is the ability to look at the wetting and drying cycles of building materials to generalize the moisture content of building materials based on indoor, outdoor, and initial conditions. The disadvantage of hygrothermal analysis is that it is highly subject to the assumptions and parameters input into the model and, when used to investigate a specific condition, can lead to wrong answers. It is a useful tool to develop an understanding of physical phenomena, but the results should be considered in light of the capabilities of the model.
10
5 Results and Discussion
The following sections describe the analysis and include a short discussion of the results.
5.1 Field Data The field data recorded for this project are presented in the following four sections.
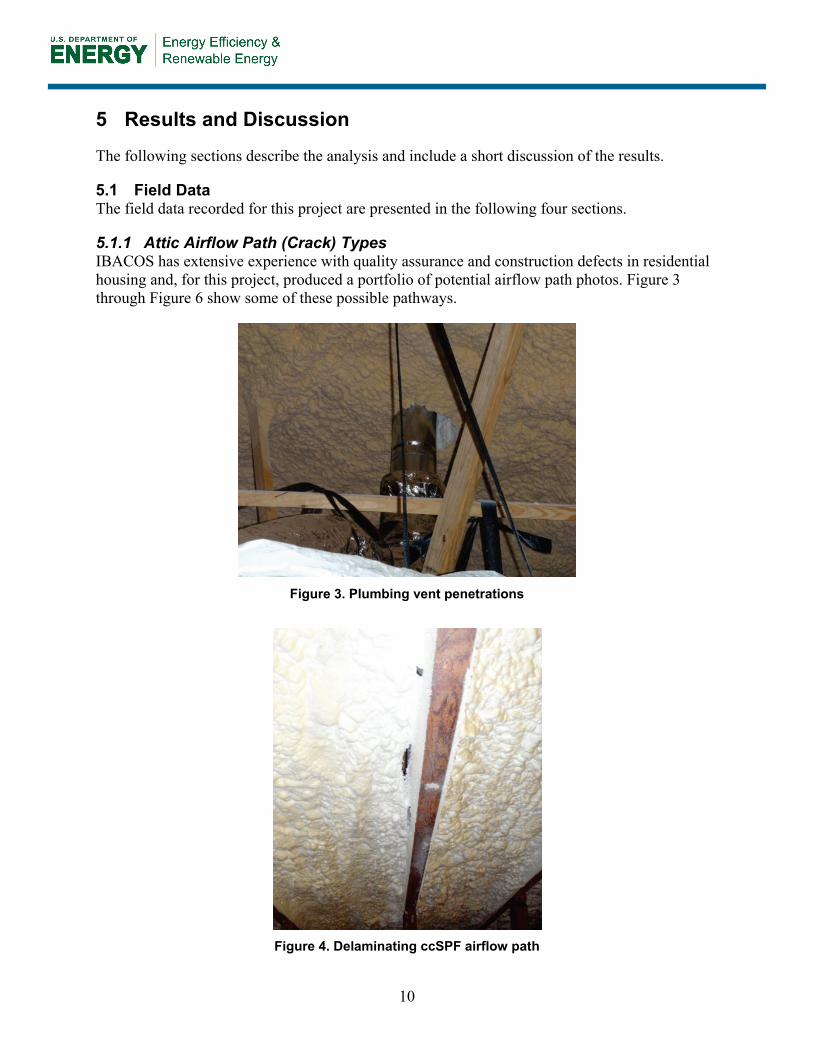
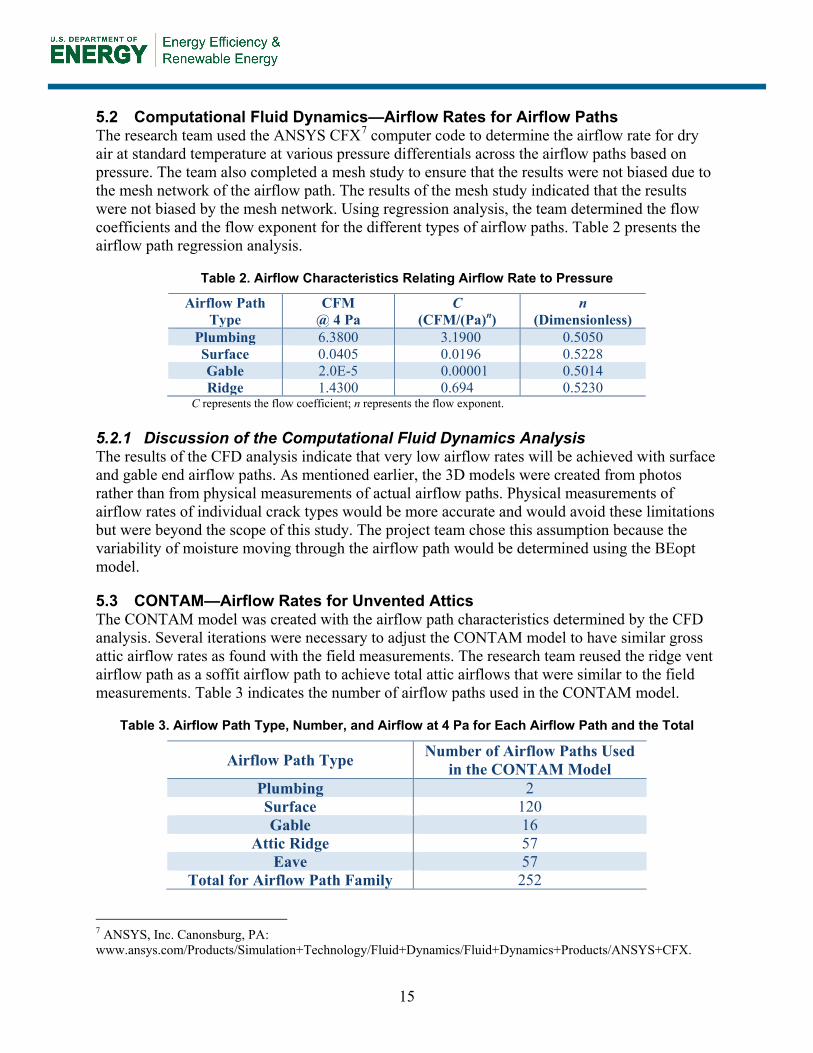
5.1.1 Attic Airflow Path (Crack) Types IBACOS has extensive experience with quality assurance and construction defects in residential housing and, for this project, produced a portfolio of potential airflow path photos. Figure 3 through Figure 6 show some of these possible pathways.
Figure 3. Plumbing vent penetrations
Figure 4. Delaminating ccSPF airflow path

11
Figure 5. Ridge vent opening
Figure 6. Surface area openings at the roof sheathing
The research team then used the photos to make 3D models of the airflow paths. The arrows in Figure 7 through Figure 9 illustrate the direction of airflow out of the attic space. The assumption at both the surface and ridge vent cracks was that the ccSPF would delaminate from the wood framing (as illustrated in Figure 4) and that the preexisting opening was not completely sealed with foam. Delamination of ccSPF can occur due to improper ccSPF installation practices.

12
Figure 7. Plumbing, bath fan venting, or flue vent airflow path
Figure 8. Surface area airflow path at the face of a roof rafter

13
Figure 9. Ridge vent airflow path with delamination at the face of a roof rafter and ridge
5.1.2 Discussion of Attic Airflow Path (Crack) Types Figure 3 through Figure 9 illustrate that some of the building materials (e.g., shingles) are not present in the model. The research team chose to complete the analysis without some of the building materials because the restriction of a properly installed roof system would have very little air leakage, yet the field measurements presented in this report indicate otherwise. This assumption provides a starting point to help understand the potential airflow from a family of defined airflow paths. A more accurate method would be to quantify the actual air leakage at identified leakage pathways in a statistically significant number of houses in multiple climate zones, which is beyond the scope of this project.
5.1.3 Unvented Attic Air Leakage Rates The research team identified two homeowners who were retrofitting their homes from vented to unvented attics with ccSPF insulation during the time span of this study. The envelope and attic leakage for each of these two homes (House 1 and House 2) were recorded prior to each retrofit, and once the ccSPF was installed, both houses were tested again. An additional homeowner was found who had already upgraded their attic from a vented to unvented attic (House 3), and the leakage in that home was recorded. The research team analyzed the test results using TecTite 4.0 software6 to determine airflow rates as a function of pressure.
Table 1 presents the results of the analysis. Figure 10 represents the graphical form of the values presented in Table 1.
6 The Energy Conservatory, www.energyconservatory.com/blower-door-test-software.

14
Table 1. Data Collected for Three Attics*
Leakage Metric
House 1 – Attic House 2 – Attic House 3 – Attic Pre-
Retrofit Post-
Retrofit Pre-
Retrofit Post-
Retrofit Pre-
Retrofit Post-
Retrofit
C (CFM/(Pa)n) 196 ± 6.0%
91 ± 5.6%
186 ± 14.7%
53 ± 5.7%
Not available
126 ± 33.9%
n (Dimensionless)
0.632 ± 0.016
0.493 ± 0.015
0.690 ± 0.045
0.660 ± 0.015
0.650 ± 0.097
Leakage @ 4 Pa
471 ± 39 CFM
180 ± 14 CFM
484 ± 107 CFM
132 ± 10 CFM
310 ± 165 CFM
R-Squared 0.998 0.997 0.996 0.995 0.999 *At House 1 and House 2, the attic airflow was recorded before and after the ccSPF-insulated unvented attic was installed. C represents the flow coefficient (CFM/(Pa)n), and n (dimensionless) represents the flow exponent.
Figure 10. Pre-retrofit (vented) and post-retrofit (ccSPF-insulated unvented)
attic airflow and pressure curves
5.1.4 Discussion of Field Data The results shown in Table 1 are interesting because the attic leakage was reduced approximately 65% for House 1 and House 2. The ccSPF was installed by a competent installation team. Although there are only two data points, the results indicate that the retrofit unvented attics are still reasonably leaky. The calculated total attic leakage at 4 Pa in Table 1 was used to assist in the development of CFD and CONTAM models as discussed in Sections 5.2 and 5.3.
0
500
1,000
1,500
2,000
2,500
3,000
0 2 4 6 8 10 12 14 16 18 20 22 24 26 28 30 32 34 36 38 40 42 44 46 48 50
Airf
low
(CFM
)
Pressure Differential Between Attic and Exterior (Pa)
House 1-pre House 1-post House 2-pre
House 2-post House 3-post
15
5.2 Computational Fluid Dynamics—Airflow Rates for Airflow Paths The research team used the ANSYS CFX7 computer code to determine the airflow rate for dry air at standard temperature at various pressure differentials across the airflow paths based on pressure. The team also completed a mesh study to ensure that the results were not biased due to the mesh network of the airflow path. The results of the mesh study indicated that the results were not biased by the mesh network. Using regression analysis, the team determined the flow coefficients and the flow exponent for the different types of airflow paths. Table 2 presents the airflow path regression analysis.
Table 2. Airflow Characteristics Relating Airflow Rate to Pressure
Airflow Path Type
CFM @ 4 Pa
C (CFM/(Pa)n)
n (Dimensionless)
Plumbing 6.3800 3.1900 0.5050 Surface 0.0405 0.0196 0.5228 Gable 2.0E-5 0.00001 0.5014 Ridge 1.4300 0.694 0.5230
C represents the flow coefficient; n represents the flow exponent. 5.2.1 Discussion of the Computational Fluid Dynamics Analysis The results of the CFD analysis indicate that very low airflow rates will be achieved with surface and gable end airflow paths. As mentioned earlier, the 3D models were created from photos rather than from physical measurements of actual airflow paths. Physical measurements of airflow rates of individual crack types would be more accurate and would avoid these limitations but were beyond the scope of this study. The project team chose this assumption because the variability of moisture moving through the airflow path would be determined using the BEopt model.
5.3 CONTAM—Airflow Rates for Unvented Attics The CONTAM model was created with the airflow path characteristics determined by the CFD analysis. Several iterations were necessary to adjust the CONTAM model to have similar gross attic airflow rates as found with the field measurements. The research team reused the ridge vent airflow path as a soffit airflow path to achieve total attic airflows that were similar to the field measurements. Table 3 indicates the number of airflow paths used in the CONTAM model.
Table 3. Airflow Path Type, Number, and Airflow at 4 Pa for Each Airflow Path and the Total
Airflow Path Type Number of Airflow Paths Used in the CONTAM Model
Plumbing 2 Surface 120 Gable 16
Attic Ridge 57 Eave 57
Total for Airflow Path Family 252 7 ANSYS, Inc. Canonsburg, PA: www.ansys.com/Products/Simulation+Technology/Fluid+Dynamics/Fluid+Dynamics+Products/ANSYS+CFX.

16
The number of cracks indicated in Table 3 represents a surface crack at every roof sheathing intersection and rafter interface. Attic ridge and eave cracks were added at every rafter. Two plumbing cracks were included, and 16 gable cracks were included. Figure 11 illustrates the general crack locations for a few of the airflow paths.
Figure 11. Location of attic airflow paths on the CONTAM model
Once the cracks were added to the CONTAM model, the research team evaluated the airflow rate and pressure relationship curve by driving CONTAM with a range of interior pressures inside the house to simulate a multipoint blower door test without wind. Figure 12 illustrates the resulting airflow as a function of pressure curve for the family of airflow paths added to the CONTAM model. The flow coefficient and exponent are 90.3 CFM/Pan and 0.5214 dimensionless.
Figure 12. Airflow pressure relationship (between attic interior and exterior)
for the family of airflow paths input into CONTAM

17
Once IBACOS was comfortable with the air leakage rates of the family of airflow paths input into the CONTAM model, the team simulated the air leakage of the attic using a TMY3 weather file for Minneapolis, Minnesota, and a constant indoor temperature of 70°F and no airborne water vapor to produce hourly air leakage rates. Figure 13 presents the airflow rates through the family of airflow paths simulated with the CONTAM model and their frequency of occurrence.
Figure 13. Histogram of CONTAM simulated hourly exfiltration and infiltration
airflow rates through a ccSPF-insulated unvented attic in Minneapolis, Minnesota. Negative values indicate outdoor air flowing into the attic space.
5.3.1 Discussion of CONTAM The histogram shown in Figure 13 indicates that the cumulative airflow entering the attic (the sum of all negative airflows) occurs less than 2% of the year. This is due to the dominant stack effect found in a two-story house in a cold climate that essentially produces a constant airflow out of the attic. The average airflow rate is 185 CFM, which is approximately equal to the family of the airflow paths when experiencing 4 Pa pressure differential. The upper tail of the histogram, approximately the 95th percentile, has an airflow rate of 310 CFM; using the airflow pressure relationship presented in Figure 12, the differential pressure is approximately 11 Pa. Based on this analysis, the CONTAM model produces results that are comparable to the field data.
5.4 Mass Flow Rate of Water Vapor The research team then combined the hourly CONTAM airflow rates with the indoor temperature and humidity ratio from a BEopt model. The BEopt model was geometrically identical to the CONTAM model and used Building America House Simulation Protocols (Hendron and Engebrecht 2010) for occupancy, latent loads, and temperature set points (68°F heating and 71°F cooling). Each airflow rate was converted to a mass flow rate of water vapor using an hourly version of Equation 1. The mass flow rate of water vapor passing through the attic airflow paths was calculated to be approximately 36,000 lb of water vapor per year.
0%
2%
4%
6%
8%
10%
12%
-120 -90
-70
-50
-30
-10 20 40 60 80 110
130
150
170
200
220
240
260
290
310
330
350
380
400
420
440
470
490
510
530
Fre
qu
ency
of
Occ
urr
ence
Airflow Between Attic and Outdoors (CFM)
18
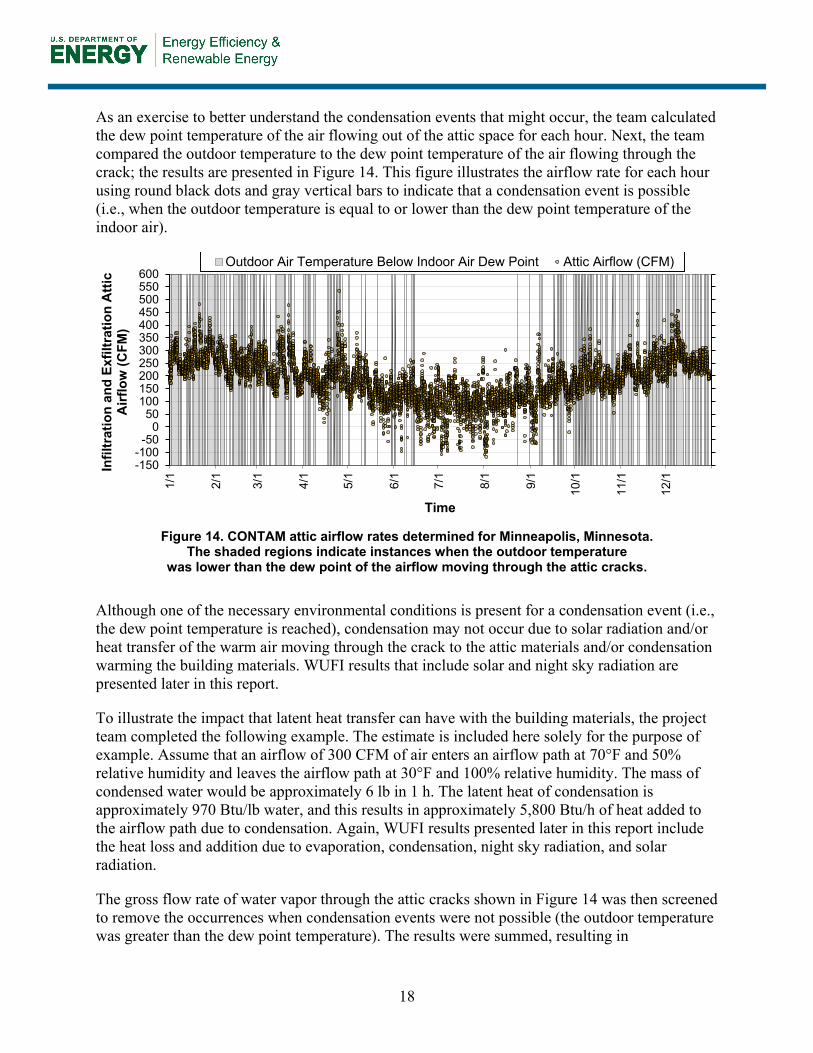
As an exercise to better understand the condensation events that might occur, the team calculated the dew point temperature of the air flowing out of the attic space for each hour. Next, the team compared the outdoor temperature to the dew point temperature of the air flowing through the crack; the results are presented in Figure 14. This figure illustrates the airflow rate for each hour using round black dots and gray vertical bars to indicate that a condensation event is possible (i.e., when the outdoor temperature is equal to or lower than the dew point temperature of the indoor air).
Figure 14. CONTAM attic airflow rates determined for Minneapolis, Minnesota.
The shaded regions indicate instances when the outdoor temperature was lower than the dew point of the airflow moving through the attic cracks.
Although one of the necessary environmental conditions is present for a condensation event (i.e., the dew point temperature is reached), condensation may not occur due to solar radiation and/or heat transfer of the warm air moving through the crack to the attic materials and/or condensation warming the building materials. WUFI results that include solar and night sky radiation are presented later in this report.
To illustrate the impact that latent heat transfer can have with the building materials, the project team completed the following example. The estimate is included here solely for the purpose of example. Assume that an airflow of 300 CFM of air enters an airflow path at 70°F and 50% relative humidity and leaves the airflow path at 30°F and 100% relative humidity. The mass of condensed water would be approximately 6 lb in 1 h. The latent heat of condensation is approximately 970 Btu/lb water, and this results in approximately 5,800 Btu/h of heat added to the airflow path due to condensation. Again, WUFI results presented later in this report include the heat loss and addition due to evaporation, condensation, night sky radiation, and solar radiation.
The gross flow rate of water vapor through the attic cracks shown in Figure 14 was then screened to remove the occurrences when condensation events were not possible (the outdoor temperature was greater than the dew point temperature). The results were summed, resulting in
-150-100-50
050
100150200250300350400450500550600
1/1
2/1
3/1
4/1
5/1
6/1
7/1
8/1
9/1
10/1
11/1
12/1
Time
Infil
trat
ion
and
Exfil
trat
ion
Atti
c A
irflo
w (C
FM)
Outdoor Air Temperature Below Indoor Air Dew Point Attic Airflow (CFM)

19
approximately 9,230 lb of water vapor flowing through the attic airflow paths when condensation events were possible. For this spreadsheet analysis, there were 2,364 h when a condensation event was possible, approximately 27% of the year.
The project team analyzed the data presented in Figure 14 to determine the number of continuous hours that a condensation event might occur. Figure 15 presents the results of that analysis.
Figure 15. Histogram of the number of continuous hours that airflow is
moving through attic airflow paths and condensation could occur
5.4.1 Discussion of Mass Flow Rate of Water Vapor The spreadsheet analysis presented above indicates that condensation events are possible. Figure 15 indicates that 16% of the time, a continuous moisture event potentially occurred between 4 and 8 h. The result of this analysis is that the potential exists for a condensation event to occur and that the duration is long enough that there could be continuous wetting. This analysis does not consider the heat transfer that occurs as air flows through the airflow path, potentially warming the surface, or the condensation warming. However, it does provide insight into the environmental conditions needed for a moisture event to occur in an attic airflow path.
5.5 Hygrothermal Analysis—Moisture Content The research team used WUFI modeling to calculate the moisture content of the building materials using the surface area of the cracks, the water vapor flowing through the cracks, and the TMY3 outdoor weather file. The condition of the air flowing through the airflow path was determined, as stated above, by merging the CONTAM mass flow rate with the BEopt-simulated indoor air conditions.
WUFI two-dimensional (2D) modeling was used to simulate the moisture content of the building material surrounding the airflow path. The airflow path selected for analysis was the plumbing vent. The plumbing vent was presented above and included a small airflow path along the round plumbing vent that allowed air to flow over the building materials (the foam and roof sheathing). Figure 16 is an image of the 2D model and indicates the materials used in the simulation.
0%2%4%6%8%
10%12%14%16%18%20%22%24%
4 8 12 16 20 24 28 32 36 40 44 48 52 56 60 64 68 72 76 80 84 88 92 96 100
104
108
112
116Fr
eque
ncy
of O
ccur
renc
e
Continuous Condensation Event (h)
20
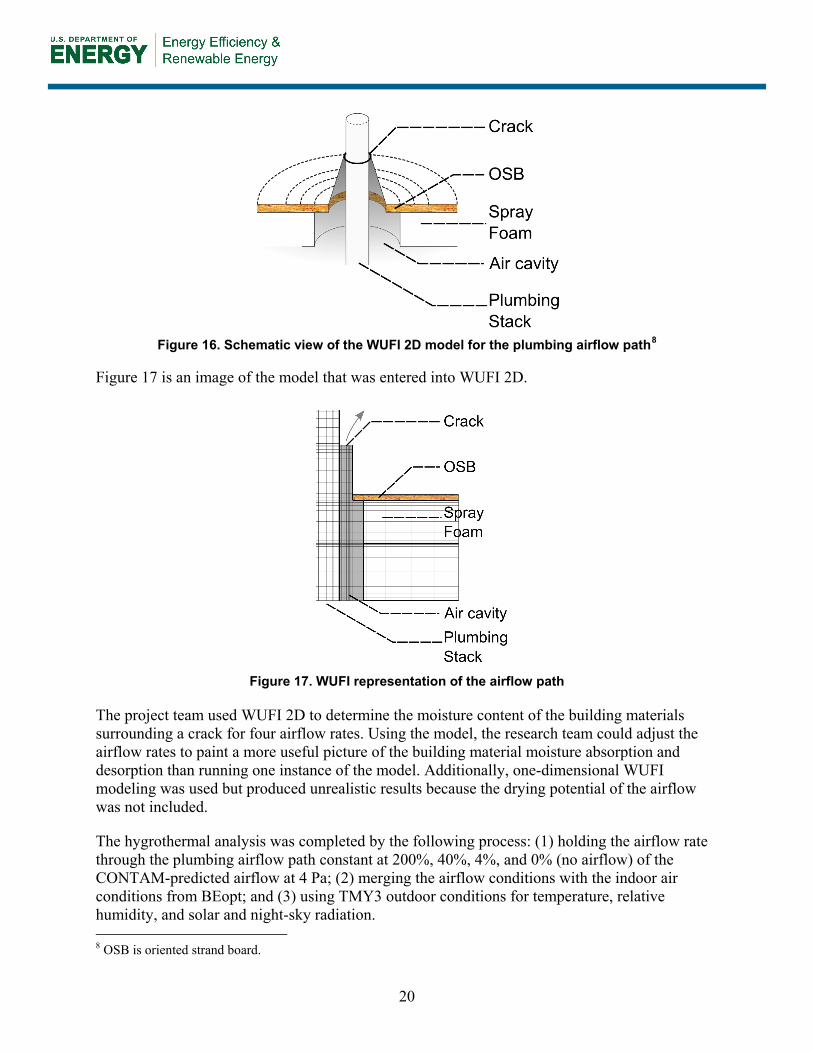
Figure 16. Schematic view of the WUFI 2D model for the plumbing airflow path8
Figure 17 is an image of the model that was entered into WUFI 2D.
Figure 17. WUFI representation of the airflow path
The project team used WUFI 2D to determine the moisture content of the building materials surrounding a crack for four airflow rates. Using the model, the research team could adjust the airflow rates to paint a more useful picture of the building material moisture absorption and desorption than running one instance of the model. Additionally, one-dimensional WUFI modeling was used but produced unrealistic results because the drying potential of the airflow was not included.
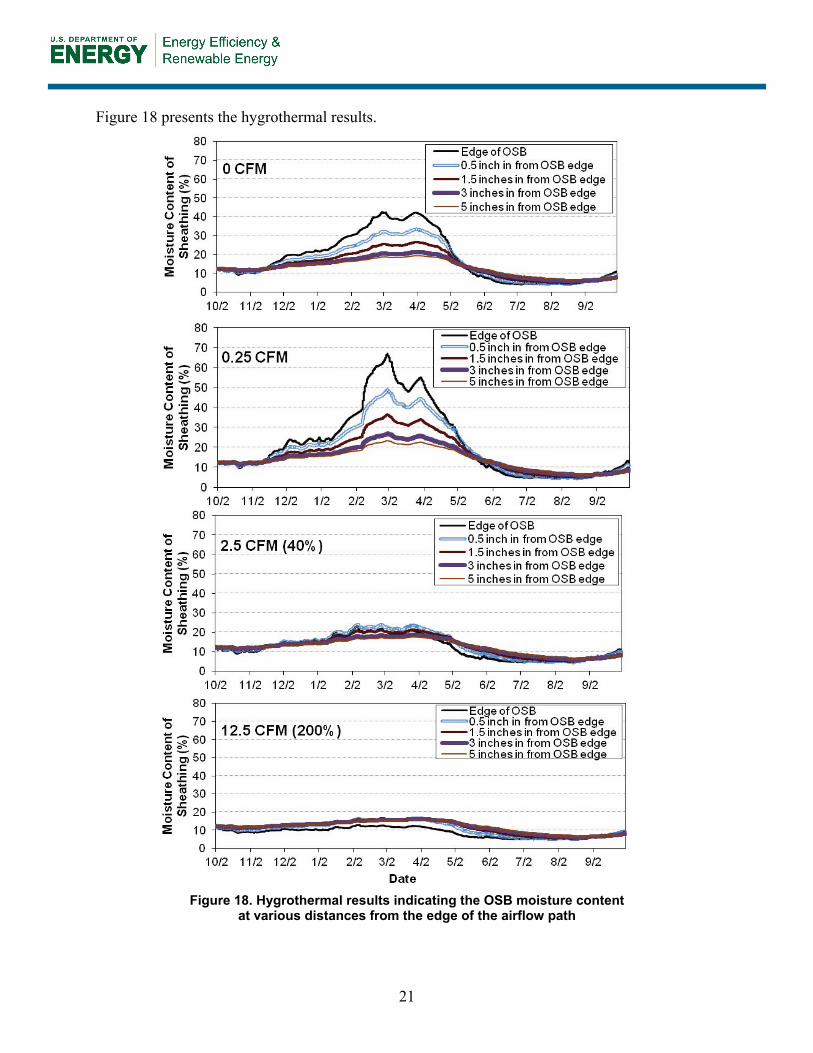
The hygrothermal analysis was completed by the following process: (1) holding the airflow rate through the plumbing airflow path constant at 200%, 40%, 4%, and 0% (no airflow) of the CONTAM-predicted airflow at 4 Pa; (2) merging the airflow conditions with the indoor air conditions from BEopt; and (3) using TMY3 outdoor conditions for temperature, relative humidity, and solar and night-sky radiation. 8 OSB is oriented strand board.
21
Figure 18 presents the hygrothermal results.
Figure 18. Hygrothermal results indicating the OSB moisture content
at various distances from the edge of the airflow path

22
A spatial/temporal representation of the moisture content in the OSB sheathing was made and is provided in Figure 19 and Figure 20. In these figures, the red shaded areas show moisture content in the OSB above 20%; the axis moving toward the reader from the page indicates the time of year, and the horizontal axis indicates the distance away from the edge of the air leakage pathway.
Figure 19. Hygrothermal results for plumbing airflow path with 0 and 0.25 CFM airflow
Figure 20. Hygrothermal results for plumbing airflow path with 2.5 and 12.5 CFM airflow
23
5.5.1 Discussion of Hygrothermal Analysis The 2D WUFI results indicate that drying occurs at higher airflow rates and that high moisture content in the sheathing is localized at the crack location. Based on the 2D analysis of a very low airflow rate, the area surrounding the plumbing penetration would have enough moisture to cause damage at a distance of 1.5 in. into the OSB sheathing. At higher airflow rates, the moisture risk lessens due to the drying nature of the heat energy in air moving through the crack. The results indicate that small-magnitude airflow paths may have higher risk than large-magnitude airflow paths. The results for the scenario with no airflow indicate that moisture risk occurs, although this may be unrealistic because WUFI is seeing the air moisture of a dynamic airflow although the condition is static; the air in the crack will be stagnant and will not have the same properties as the dynamic airflows calculated with CONTAM and BEopt.

24
6 Conclusions
Two recent trends in the residential housing industry are to install unvented attics in new homes and to retrofit existing homes from vented to unvented attics. The purpose of this study was to investigate the moisture risk due to airflow paths out of unvented attics that use ccSPF at the roof deck. The results of the study and answers to the research questions are detailed below.
1. Does air leakage between an attic and the outdoors occur after the application of ccSPF?
The results of this study indicate that there is air leakage from an unvented attic to the outdoors. The data were collected at three houses that were being retrofitted from vented to unvented attics.
2. For Question 1, what is the magnitude of air leakage rates?
The average leakage of the three houses retrofitted from vented to unvented attics was 207 CFM at 4 Pa of pressure.
3. If there is air leakage in ccSPF attic assemblies, what is the potential moisture accumulation on the roof sheathing at possible air leakage pathways?
There is potential moisture accumulation in building materials surrounding air leakage paths that have low airflow. The results from the hygrothermal analysis indicate that moisture accumulation is localized to an area 5 in. from the crack and dries before the next winter.
The modeling performed by the research team indicates that for a typical meteorological climate year in Minneapolis, Minnesota, airflow paths with low airflow rates will result in sheathing moisture contents above 20% for most of the winter and spring. This could result in localized damage of building materials. Higher airflow rates do not have as much moisture accumulation during winter due to the drying potential of the airflow across the crack actually warming the sheathing and eliminating it as a condensing surface. Because ccSPF reduces the airflow from an attic, converting a vented attic to an unvented attic may result in reduced airflow through leakage pathways and could result in localized damage.
6.1 Future Research Results in this report are based on many simplifying assumptions, and future work should be undertaken to improve on this analysis and to expand the industry’s knowledge of actual air leakage characteristics in unvented roof assemblies. Future analyses could include the following:
• Collection of more field data to identify gross attic leakage rates in new and retrofitted homes
• Collection of field data to understand the types of leaks (airflow paths) that are present
• Laboratory measurements to characterize the flow and pressure relationship at attic leakage pathways

25
• Laboratory measurements to provide an understanding of the transport and accumulation of moisture in ccSPF roof systems where steady-state or hourly predicted airflow with water vapor is present and the outdoor conditions are simulated in several climate zones
• The use of accelerated weathering to determine how moisture is transported in ccSPF assemblies when there is a constant airflow and humidity ratio.
Finally, the authors would like to stress that the results presented in this report are based on numerical models that should be used only to guide decision making. These results indicate that moisture risk could happen in unvented attics, given very small leakage paths. To better understand the moisture risk in unvented attics, decision makers should collect actual field data.

26
References
ASHRAE (2005). Fundamentals—Ventilation and Infiltration. Chapter 27.12, Equation 32. Atlanta, GA: ASHRAE.
ASTM (2010). ASTM E779, “Standard Test Method for Determining Air Leakage Rate by Fan Pressurization.” West Conshohocken, PA: ASTM.
Emmerich, S.J. (2001). “Validation of Multizone IAG Modeling of Residential-scale Buildings: A Review.” ASHRAE Transactions, Vol. 107.2. Atlanta, GA: ASHRAE.
Emmerich, S.J.; Nabinger, S.J.; Gupte, A.; Howard-Reed, C. (2003). “Validation of CONTAM Predictions for Tracer Gas in a Townhouse.” 8th International IBPSA Conference, Eindhoven, Netherlands, August 11–14, 2003. www.ibpsa.org/%5Cproceedings%5CBS2003%5CBS03_0299_306.pdf.
Fitzgerald, J. (2010). Personal communication, reported in Schumacher, C. and Lepage, R. (2012). Guideline for Moisture Control in Dense-Packed Assemblies. Golden, CO: National Renewable Energy Laboratory.
Grin, A.; Smegal, J.; Lstiburek, J. (2013). Application of Spray Foam Insulation Under Plywood and Oriented Strand Roof Sheathing. Golden, CO: National Renewable Energy Laboratory.
Hendron, R.; Engebrecht, C. (2010). Building America House Simulation Protocols. Golden, CO: National Renewable Energy Laboratory, NREL/TP-550-49426.
Lstiburek, J.W. (1993). “Humidity Control in the Humid South.” Workshop Proceedings: Bugs, Mold and Rot II, Building Environment and Thermal Envelope Council, Washington, D.C., November 16–17, 1993. Washington, D.C.: National Institute of Building Sciences.
Nirvan, G.; Haghighat, F.; Wang, L.; Akbari, H. (2012). “Contaminant Transport Through the Garage—House Interface Leakage.” Building and Environment, Vol. 56, October 2012, pp. 176–183. www.sciencedirect.com/science/article/pii/S0360132312000753.
Parker, D.S.; Sherwin, J.R.; Anello, M.T. (2001). FPC Residential Monitoring Project: New Technology Development—Radiant Barrier Pilot Project. Contract Report FSEC-CR-1231-01. Cocoa, FL: Florida Solar Energy Center. www.radiantbarrierdoneright.com/FSEC.pdf.
Rowley, F.B.; Algren, A.B.; Lund, C.E. (1939). “Condensation of Moisture and Its Relation to Building Construction and Operation.” ASHVE Transactions, Vol. 44, No. 1115. Pittsburgh, PA: American Society of Heating and Ventilating Engineers.
Rudd, A. (2005). “Field Performance of Unvented Cathedralized (UC) Attics in the USA.” Journal of Building Physics 29, p. 145. www.buildingscience.com/documents/published-articles/pa-field-performance-unvented-cathedralized-attics.

27
Rudd, A.F; Lstiburek, J.W. (1998). “Vented and Sealed Attics in Hot Climates.” ASHRAE Transactions, Vol. 104, Part 2, 1998. http://builditgreendallas.org/sites/builditgreendallas.org/ files/www/files/rr-9801_vented_sealed_attics.pdf.
Rudd, A.F., Lstiburek, J.W.; Ueno, K. (2000). “Unvented-Cathedralized Attics: Where We’ve Been and Where We’re Going.” Proceedings of the 2000 ACEEE Summer Study on Energy Efficiency in Buildings.
Schumacher, C.; Lepage, R. (2012). Guideline for Moisture Control in Dense-Packed Assemblies. Golden, CO: National Renewable Energy Laboratory. www.buildingscience.com/documents/bareports/ba-1308-moisture-control-dense-packed-roof-assemblies-cold-climates.
Straube, J.; Smegel, J.; Smith, J. (2010). Research Report—1001 Moisture-Safe Unvented Wood Roof Systems. Summerville, MA: Building Science Press. www.buildingscience.com/documents/reports/rr-1001-moisture-safe-unvented-wood-roof-systems/view.
TenWolde, A.; Rose, W.B. (1999). “Issues Related to Venting of Attics and Cathedral Ceilings,” ASHRAE Transactions, CH-99-11-4, pp. 851–857. Atlanta, GA: ASHRAE.
Walker, I.S. (1989). Single Zone Air Infiltration Modelling. M.Sc. Thesis, Department of Mechanical Engineering. Edmonton, Canada: University of Alberta.

DOE/GO-102014-4526 ▪ November 2014
buildingamerica.gov