d Original Contribution - Columbia...
11
d Original Contribution ELECTROMECHANICALWAVE IMAGING OF BIOLOGICALLYAND ELECTRICALLY PACED CANINE HEARTS IN VIVO ALEXANDRE COSTET ,* JEAN PROVOST ,* ALOK GAMBHIR, y YEVGENIY BOBKOV , z PETER DANILO,JR., z GERARD J. J. BOINK, zxk MICHAEL R. ROSEN, z and ELISA E. KONOFAGOU* { *Department of Biomedical Engineering, Columbia University, New York, New York, USA; y Department of Medicine—Cardiology, Columbia University, New York, New York, USA; z Department of Pharmacology, Columbia University, New York, New York, USA; x Interuniversity Cardiology Institute of the Netherlands (ICIN), Utrecht, The Netherlands; k Heart Failure Research Center, Academic Medical Center, University of Amsterdam, Amsterdam, The Netherlands; and { Department of Radiology, Columbia University, New York, New York, USA (Received 17 April 2013; revised 20 August 2013; in final form 26 August 2013) Abstract—Electromechanical Wave Imaging (EWI) has been show capable of directly and entirely non-invasively mapping the trans mural electromechanical activation in all four cardiac chambers in vivo. In this study, we as- sessed EWI repeatability and reproducibility, as well as its capability of localizing electronic and, for the first time, biological pacing locations in closed-chest, conscious canines. Electromechanical activation was obtained in six conscious animals during normal sinus rhythm (NSR) and idioventricular rhythms occurring in dogs with complete heart block instrumented with electronic and biologic pacemakers (EPM and BPM respectively). After atrioventricular node ablation, dogs were implanted with an EPM in the right ventricular (RV) endocardial apex (n 5 4) and two additionally received a BPM at the left ventricular (LV) epicardial base (n 5 2). EWI was performed trans thoracically during NSR, BPM and EPM pacing, in conscious dogs, using an unfocused transmit sequence at 2000 frames/s. During NSR, the EW originated at the right atrium (RA), propagated to the left atrium (LA) and emerged from multiple sources in both ventricles. During EPM, the EW originated at the RV apex and propagated throughout both ventricles. During BPM, the EW originated from the LV basal lateral wall and subse- quently propagated throughout the ventricles. EWI differentiated BPM from EPM and NSR and identified the distinct pacing origins. Isochrone comparison indicated that EWI was repeatable and reliable. These findings thus indicate the potential for EWI to serve as a simple, non-invasive and direct imaging technology for mapping and characterizing arrhythmias as well as the treatments thereof. (E-mail: [email protected]) Ó 2014 World Federation for Ultrasound in Medicine & Biology. Key Words: Electrical activation sequence, Electromechanical wave imaging, Echocardiography, Imaging, Biological pacemakers. INTRODUCTION Safe and real-time non-invasive imaging of cardiac elec- trical activation has been a long-term goal of clinicians and laboratory investigators. Standard methods currently employed in the clinic are all catheter-based, resulting in ionizing exposure and prolonged sedation or anesthesia, and are limited to epicardial or endocardial activation sequences. They are also time consuming and costly. A major recent advance is electrocardiographic imaging (Ramanathan et al. 2004; Zhang et al. 2005), which reconstructs action potentials based on body surface potential measurements, but is limited to the epicardium and is dependent on patient-specific modeling derived from X-ray computed tomography or magnetic resonance imaging scans. Electromechanical wave imaging (EWI) is a non- ionizing, ultrasound-based imaging modality that non- invasively maps the electromechanical activity of the heart, in all four chambers (Provost et al. 2011b) at very high spatial and temporal resolution (0.5–3.0 ms) (Wang et al. 2008) and with real-time feedback capabil- ities (Luo and Konofagou 2010; Provost et al. 2012). EWI tracks the electromechanical wave (EW), which denotes the spatial and temporal progression of the transient deformations of the myocardium after local electrical activation. Because the electrical activation lasts 60 to 100 ms in the heart, tracking the EW requires Address correspondence to: Elisa Konofagou, ET351, MC 8904, 1210 Amsterdam Avenue, New York, NY 10027, USA. E-mail: [email protected] 177 Ultrasound in Med. & Biol., Vol. 40, No. 1, pp. 177–187, 2014 Copyright Ó 2014 World Federation for Ultrasound in Medicine & Biology Printed in the USA. All rights reserved 0301-5629/$ - see front matter http://dx.doi.org/10.1016/j.ultrasmedbio.2013.08.019
Transcript of d Original Contribution - Columbia...

Ultrasound in Med. & Biol., Vol. 40, No. 1, pp. 177–187, 2014Copyright � 2014 World Federation for Ultrasound in Medicine & Biology
Printed in the USA. All rights reserved0301-5629/$ - see front matter
/j.ultrasmedbio.2013.08.019
http://dx.doi.org/10.1016d Original Contribution
ELECTROMECHANICALWAVE IMAGING OF BIOLOGICALLYANDELECTRICALLY PACED CANINE HEARTS IN VIVO
ALEXANDRE COSTET,* JEAN PROVOST,* ALOK GAMBHIR,y YEVGENIY BOBKOV,z PETER DANILO, JR.,z
GERARD J. J. BOINK,zxk MICHAEL R. ROSEN,z and ELISA E. KONOFAGOU*{
*Department of Biomedical Engineering, Columbia University, New York, New York, USA; yDepartment ofMedicine—Cardiology, Columbia University, New York, New York, USA; zDepartment of Pharmacology, ColumbiaUniversity, New York, New York, USA; x Interuniversity Cardiology Institute of the Netherlands (ICIN), Utrecht, TheNetherlands; kHeart Failure Research Center, Academic Medical Center, University of Amsterdam, Amsterdam, The
Netherlands; and {Department of Radiology, Columbia University, New York, New York, USA
(Received 17 April 2013; revised 20 August 2013; in final form 26 August 2013)
A1210ek2191
Abstract—Electromechanical Wave Imaging (EWI) has been show capable of directly and entirely non-invasivelymapping the trans mural electromechanical activation in all four cardiac chambers in vivo. In this study, we as-sessed EWI repeatability and reproducibility, as well as its capability of localizing electronic and, for the firsttime, biological pacing locations in closed-chest, conscious canines. Electromechanical activation was obtainedin six conscious animals during normal sinus rhythm (NSR) and idioventricular rhythms occurring in dogswith complete heart block instrumented with electronic and biologic pacemakers (EPM and BPM respectively).After atrioventricular node ablation, dogs were implanted with an EPM in the right ventricular (RV) endocardialapex (n 5 4) and two additionally received a BPM at the left ventricular (LV) epicardial base (n 5 2). EWI wasperformed trans thoracically during NSR, BPM and EPM pacing, in conscious dogs, using an unfocused transmitsequence at 2000 frames/s. During NSR, the EWoriginated at the right atrium (RA), propagated to the left atrium(LA) and emerged from multiple sources in both ventricles. During EPM, the EW originated at the RV apex andpropagated throughout both ventricles. During BPM, the EWoriginated from the LV basal lateral wall and subse-quently propagated throughout the ventricles. EWI differentiated BPM from EPM and NSR and identified thedistinct pacing origins. Isochrone comparison indicated that EWI was repeatable and reliable. These findingsthus indicate the potential for EWI to serve as a simple, non-invasive and direct imaging technology for mappingand characterizing arrhythmias as well as the treatments thereof. (E-mail: [email protected]) � 2014World Federation for Ultrasound in Medicine & Biology.
Key Words: Electrical activation sequence, Electromechanical wave imaging, Echocardiography, Imaging,Biological pacemakers.
INTRODUCTION
Safe and real-time non-invasive imaging of cardiac elec-trical activation has been a long-term goal of cliniciansand laboratory investigators. Standard methods currentlyemployed in the clinic are all catheter-based, resulting inionizing exposure and prolonged sedation or anesthesia,and are limited to epicardial or endocardial activationsequences. They are also time consuming and costly. Amajor recent advance is electrocardiographic imaging(Ramanathan et al. 2004; Zhang et al. 2005), whichreconstructs action potentials based on body surface
ddress correspondence to: Elisa Konofagou, ET351, MC 8904,Amsterdam Avenue, New York, NY 10027, USA. E-mail:@columbia.edu
177
potential measurements, but is limited to the epicardiumand is dependent on patient-specific modeling derivedfromX-ray computed tomography or magnetic resonanceimaging scans.
Electromechanical wave imaging (EWI) is a non-ionizing, ultrasound-based imaging modality that non-invasively maps the electromechanical activity of theheart, in all four chambers (Provost et al. 2011b) at veryhigh spatial and temporal resolution (�0.5–3.0 ms)(Wang et al. 2008) and with real-time feedback capabil-ities (Luo and Konofagou 2010; Provost et al. 2012).EWI tracks the electromechanical wave (EW), whichdenotes the spatial and temporal progression of thetransient deformations of the myocardium after localelectrical activation. Because the electrical activationlasts 60 to 100 ms in the heart, tracking the EW requires
178 Ultrasound in Medicine and Biology Volume 40, Number 1, 2014
a temporal resolution of 2–5 ms or less. Imaging the heartat such high frame rates also allows, perhaps moreimportantly, a 5-fold improvement in the signal-to-noiseratio of cardiac motion and deformation mapping(Provost et al. 2012) when using RF cross-correlation.We previously found that the EW correlates highly withthe underlying electrical activation of the myocardiumin normal canine hearts during sinus rhythm and variouselectronic pacing protocols in vivo (Provost et al. 2011b)and in silico (Provost et al. 2011a) in accordance withearlier studies based on invasive methods (Badke et al.1980; Wyman et al. 1999). We also reported that EWI iscapable of mapping trans mural activation (Provost et al.2011b), and by introducing novel acquisition sequences,we found that EWI is capable of providing full-viewmapping of small, transient inter-frame strains at a veryhigh frame rate (�0.075% at 2000 Hz) in a single heart-beat and during free breathing, both in humans (Provostet al. 2011b) and in dogs (Provost et al. 2011c).
In this study, our aim was to quantify the repro-ducibility and repeatability of EWI in closed-chest, con-scious canines and, for the first time, to demonstratethe feasibility of EWI during biological pacing. To reachour goal, we availed ourselves of a canine heart-blockmodel in which sinus rhythm and normal ventricular acti-vation can be recorded before inducing complete heartblock. During heart block, two different rhythms can becreated in the ventricle via implantation of a right ventric-ular endocardial electronic pacemaker (EPM) and aleft ventricular epicardial biological pacemaker (BPM).During normal sinus rhythm (NSR), we show that theelectrical activation sequence depicted by EWI followsthe expected electrical activation. During pacing, weshow that EWI correctly detects the pacing origins ofboth types of pacemakers (EPM and BPM). Then, bycomparing isochrones obtained from consecutive heartcycles in the same animal during NSR and electronicpacing, we show that EWI is repeatable. Therefore,EWI can trans thoracically and non-invasively mapthe electrical activation of the hearts of conscious, free-breathing canines during a wide array of rhythms,whether of electrical or biological, endocardial or epicar-dial origin, and arising in the atria or either ventricle ofthe heart, thus suggesting that EWI has the potential tobe used not only in longitudinal animal studies, but alsoto map a wide variety of arrhythmias.
METHODS
Experimental protocolThis study conformed to the Public Health Service
Policy on Humane Care and Use of Laboratory Animalsand was approved by the Institutional Animal Care andUse Committee of Columbia University. We performed
data acquisition on six male mongrels ranging from 25to 30 kg in weight. Of the six, two were implanted duringopen-chest surgery with an EPM whose lead was locatedat the endocardial apex of the right ventricle (RV); andanother two were implanted during open-chest surgerywith both a BPM in the left ventricle (LV) basal epicar-dium and an EPMwhose lead was located at the RVendo-cardial apex. The lead implanted was an endocardialCapSureFix magnetic resonance imaging SureScan lead(Medtronic, Fridley, MN, USA), and the electronic pace-maker implanted was a single-channel single chamberventricular pacemaker (Discovery II, Guidant, BostonScientific, Natick, MA, USA) set at 35 bpm. Duringopen-chest surgery, radiofrequency ablation of the atrio-ventricular node was performed to induce complete heartblock and permit the emergence of rhythms initiatedby the biologic or electronic pacemaker (Bucchi et al.2006). Electrocardiography (ECG) monitoring andrecording were obtained from standard surface limbleads. EWI was performed on all six dogs pre-surgery(for NSR) and on the four implanted dogs 7 d post-surgery (for BPM and EPM). During data acquisition,the animals were fully conscious and were positionedon their left side on a standard examination table.
Biological pacemakersBPMs aim at overcoming the limitations of their
electronic counterparts, such as sub-optimal sensitivity toautonomic modulation, and have the potential to curerather than merely palliate (Rosen 2005; Rosen et al.2004). The pacemaker current (or ‘‘funny’’ current If)contributes to diastolic depolarization and autonomicmodulation of cardiac rhythm (Barbuti et al. 2007). Thisinward current slowly activates on hyperpolarization and,thus, facilitates activation during diastole. In addition, Ifis directly modulated by cAMP, making it sensitive toadrenergic andmuscarinicmodulation, leading to a respec-tive acceleration or deceleration in rate (DiFrancesco andTromba 1988; DiFrancesco et al. 1986).
The BPMs used in this study seek to exploit thepacemaker current If to induce pacemaker activity in nor-mally silent tissue. To this end, we used adenovirus-mediated transduction to overexpress HCN2 in normallyquiescent ventricular myocytes. The HCN2 gene ispart of the HCN (hyperpolarization-activated, cyclicnucleotide-gated) family of genes that encodes the Ifchannel (Plotnikov et al. 2004; Qu et al. 2003).Adenoviral constructs incorporating cytomegalovirus-driven expression of green fluorescent protein and murineHCN2 were prepared as described previously (Qu et al.2001). We prepared 3 3 1010 fluorescence focus-forming units of one vector and mixed this with an equalamount of the other vector in a total volume of 700 mL.This mixture was subsequently injected sub-epicardially
Electromechanical wave imaging of biologically paced canine hearts d A. COSTET et al. 179
into three adjacent sites of the anterobasal left ventricularfree wall in two (n 5 2) animals. After ablation of theatrioventricular node and implantation of the BPM, theventricles are driven solely by the newly implanted pace-maker as it overrides the intrinsic ventricular rhythm ofthe heart. As a result, the rates of the BPM cannot be ex-ternally controlled in the same way the rates of EPMsare controlled, because BPMs operate by facilitatingdepolarization and only respond to the autonomicnervous system.
Electromechanical wave imagingEWI was performed in four- and two-chamber echo-
cardiographic views during NSR, before surgery and 7 dafter, during biological pacing (resting rhythm) andthen during electronic pacing. An unfocused transmitsequence (Provost et al. 2011c) was developed and imple-mented on a Verasonics system (Verasonics, Redmond,
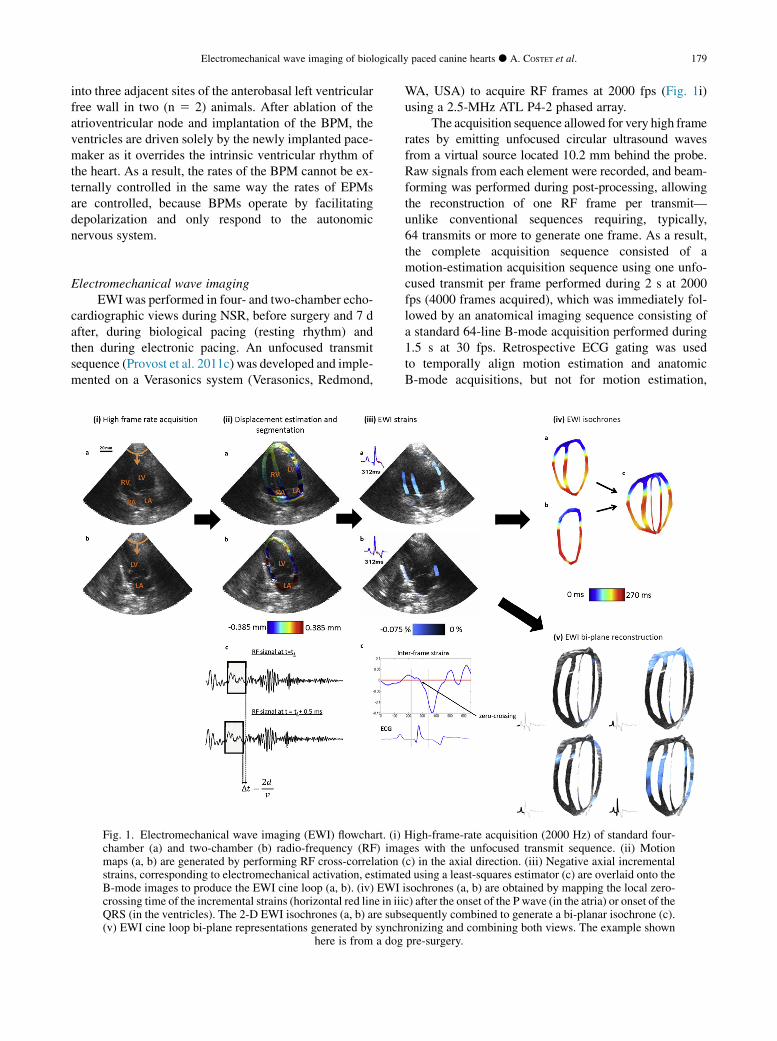
Fig. 1. Electromechanical wave imaging (EWI) flowchart. (i)chamber (a) and two-chamber (b) radio-frequency (RF) imamaps (a, b) are generated by performing RF cross-correlationstrains, corresponding to electromechanical activation, estimateB-mode images to produce the EWI cine loop (a, b). (iv) EWIcrossing time of the incremental strains (horizontal red line in iiiQRS (in the ventricles). The 2-D EWI isochrones (a, b) are subs(v) EWI cine loop bi-plane representations generated by synch
here is from a dog
WA, USA) to acquire RF frames at 2000 fps (Fig. 1i)using a 2.5-MHz ATL P4-2 phased array.
The acquisition sequence allowed for very high framerates by emitting unfocused circular ultrasound wavesfrom a virtual source located 10.2 mm behind the probe.Raw signals from each element were recorded, and beam-forming was performed during post-processing, allowingthe reconstruction of one RF frame per transmit—unlike conventional sequences requiring, typically,64 transmits or more to generate one frame. As a result,the complete acquisition sequence consisted of amotion-estimation acquisition sequence using one unfo-cused transmit per frame performed during 2 s at 2000fps (4000 frames acquired), which was immediately fol-lowed by an anatomical imaging sequence consisting ofa standard 64-line B-mode acquisition performed during1.5 s at 30 fps. Retrospective ECG gating was usedto temporally align motion estimation and anatomicB-mode acquisitions, but not for motion estimation,
High-frame-rate acquisition (2000 Hz) of standard four-ges with the unfocused transmit sequence. (ii) Motion(c) in the axial direction. (iii) Negative axial incrementald using a least-squares estimator (c) are overlaid onto theisochrones (a, b) are obtained by mapping the local zero-c) after the onset of the P wave (in the atria) or onset of theequently combined to generate a bi-planar isochrone (c).ronizing and combining both views. The example shownpre-surgery.
180 Ultrasound in Medicine and Biology Volume 40, Number 1, 2014
unlike previous approaches (Provost et al. 2011b) asno sub-sectors were used. One cardiac cycle was consid-ered for each data set and, more specifically, the data cor-responding to electrical activation. This was done byselecting one P wave and QRS complex on the electrocar-diogram. Data segmentation was then performed on thealigned B-mode images. Beamforming was conductedusing a delay-and-sum algorithm to reconstruct the RFframes for the motion-estimation sequence by generating128 lines in the direction orthogonal to the ultrasoundwavefront propagation with a reconstructed samplingfrequency of 20 MHz (axial sampling of 0.0385 mm)(Provost et al. 2011c). The motion-estimation andmotion-sampling rates (Provost et al. 2012) were bothequal to 2000 fps. We estimated axial displacements usinga fast 1-D cross-correlation algorithm (Luo andKonofagou2010) with overlapping 9.2 mm axial windows (15 wave-lengths) and a 0.385 mm window shift (95.8% overlap)(Fig. 1ii-c). Axial displacement was within 60.0385mm. At a frame rate of 2000 fps, this corresponds to veloc-ities of 67.7 cm/s, which are consistent with previousstudies using tissue Doppler (Uematsu et al. 1995;Urheim et al. 2000). The axial incremental strains (i.e.,inter-frame strains in the axial direction) were estimatedusing a least-squares estimator (Kallel and Ophir 1997)with a 5-mm 1-D kernel (Fig. 1iii–c). We then applieda moving-average spatial filter of a 12-mmwindow axiallyby 10 lines laterally and a temporal low-pass filter witha 125-Hz cut-off frequency to the strain estimates to filterout the high-frequency noise and ensure continuity of thestrains. Because we used overlapping windows, the axialsampling for both displacement and strain was determinedby the window shift, in this case 0.385 mm (Righetti et al.2002). The myocardium was manually segmented on thefirst anatomical B-mode frame, and the myocardial con-tour was then tracked throughout the cardiac cycle usingan automated contour tracking technique based on the esti-mated displacements (Luo and Konofagou 2008). Electro-mechanical activation was defined as the time at which theincremental strain value changes from positive (length-ening in the axial direction) to negative (shortening orcontraction in the axial direction), that is, crosses zero.To simplify visualization, only the strains correspondingto the electromechanical activation were overlaid ontothe corresponding B-mode images to generate EWI cineloops (i.e., negative strains in apical views) (Fig. 1iii-a, b). Based on this definition of the electromechanicalactivation, we subsequently generated isochrones bymapping the first occurrence of the incremental straincrossing zero (positive to negative values, i.e., onset ofcontraction) after either the P wave in the atria or theQ wave in the ventricles (Provost et al. 2011b)(Fig. 1iv). The zero-crossing timings were manually ob-tained in up to a hundred randomly and automatically
selected regions, and regions with noisy strain curveswhere positive-to-negative zero-crossing times could notbe determined were excluded. Criteria for exclusion ofnoisy strain curves included: only negative-to-positivezero crossing, no zero crossing discernible (all negativeor all positive strains) or discontinuities in the incrementalstrain curves. Noisy strain curves were mostly located atthe border of the segmented regions, where pointscan go in and out of the mask. Typically, when thesegmentation is performed accurately, the prevalence ofpoor-quality strain curves is less than 5%. Sub-sampleresolution was obtained through cubic spline interpola-tion, and smooth continuous isochronal maps were thengenerated through Delaunay triangulation-based cubicinterpolation. Finally, four-chamber and two-chamberviews were co-registered in Amira 4.1 (Visage Imaging,Chelmsford, MA, USA), both temporally (using ECG)and spatially (using B-mode anatomical landmarks suchas the position of the valves and apex), to construct bi-planar EWI cine loops and isochrones (Fig. 1v). Beam-forming, motion estimation, strain estimation, spatialmoving-average of the strains, temporal moving-average filtering of strains and the automated contourtracking technique were performed off-line, on a TeslaGPU (NVIDIA, Santa Clara, CA, USA) and the MAT-LAB parallel processing toolbox (The Mathworks, Na-tick, MA, USA) at a computing speed of 2.4 fps.Because only data corresponding to electrical activation(i.e., one P wave and/or QRS complex, which corre-sponds to 800 frames or 400 ms) were processed ineach case, processing time for strain estimation andEWI video generation was roughly 5 min per data set.In addition, the isochrone computation time varied bet-ween 2 and 5 min depending on how many regionswere excluded because of poor strain estimation andhow many new points had to be manually selected tosufficiently cover the chambers for subsequent interpola-tion. Thus, the maximum total time for processing onedata set was 10 min.
RESULTS
In this study, acquisition in six (n 5 6) malemongrels ranging from 25 to 30 kg in weight to quantifythe reproducibility and repeatability of EWI in closed-chest, conscious canines and, for the first time, to demon-strate the feasibility of EWI during biological pacing.Heart rates during NSR were in the range 75 to 90 bpm.During EPM pacing, the heart rate depended on thepacing and was either 35 or 60 bpm. During BPM pacing,the heart rate was between 30 and 45 bpm. ECG QRSdurations during NSR varied between 60 and 100 ms.During EPM and BPM pacing, the QRS duration stayedwithin the range 118–123 ms, and QRS morphologies

Electromechanical wave imaging of biologically paced canine hearts d A. COSTET et al. 181
were typical of left and right bundle-branch block duringEPM and BPM pacing, respectively.
Normal sinus rhythmThe bi-planar isochrones of the normal electrome-
chanical activation of the heart during NSR in fourdogs, before implantation of a pacemaker, are shown inFigure 2 (Supplementary Video 1 shows the correspond-ing EWI cine loops). The origin of the isochrones corre-sponds to the onset of the P wave. In all four (n5 4) dogs,the EWoriginated from the right atrium (RA) and propa-gated toward the left atrium (LA) during the P wave.During the QRS complex, the EW propagated in theventricles from multiple locations. Figure 2(e and f) illus-trates the electromechanical activation of the atria and theventricles, respectively, in one animal (Fig. 2b) in moredetail. In the atria (Fig. 2e), the EW originated in theRA near the atrial septum and propagated toward the
Fig. 2. Electromechanical wave imaging (EWI) isochrones oborigins of all isochrones correspond to the onset of the P wave.inated from the RA and propagated to the LA. In the ventriclesmagnification of EWI isochrones for dog 2 in the two- and fouactivation sequence started from the RA and propagated in the Lrior wall prior to the posterior wall. (f) In the ventricles, arrowsthe septum near the apex; in the LV near the base in the anterior
apex of the RV. LA 5 left atrium, LV 5 left ventri
lateral wall of the RA and the LA. The origin of theEW in the atria is in accordance with the expected loca-tion of the sino-atrial node. In the two-chamber view(Fig. 2e), which depicts the LA and LV, the EWoriginatedin the anterior wall and propagated toward the posteriorwall. After a delay similar to the PR segment, the ventri-cles were activated from four main origins located nearthe apex in the lateral wall of the RV, in the apical regionof the septum, near the apex in the posterior wall of theLV and near the base of the anterior wall of the LV(Fig. 2f).
Biological pacemakersFigure 3 depicts the isochrones obtained in two dogs
during biologic pacing from the anterobasal epicardialLV (Supplementary Video 2 shows the correspondingEWI cine loops). In all isochrones, 0 ms corresponds tothe onset of the QRS. In both dogs, the EW originated
tained from four dogs before surgery during NSR. The(a–d) Dogs 1–4 respectively. Activation in the atria orig-, arrows indicate the sites of early activation. (e, f) Timer-chamber views. (e) In the four-chamber view, the atrialA. In the two-chamber view, activation reached the ante-indicate the sites of early activation, which are located inwall and near the apex in the posterior wall; and near thecle, RA 5 right atrium, RV 5 right ventricle.

Fig. 3. Ventricular electromechanical wave imaging (EWI) isochrones during BPM pacing. The origins of the isochronescorrespond to the onset of the QRS. (a, b) Dogs 2 and 5, respectively. During BPM pacing, early activation is seen in thebasal region of the lateral wall in the left ventricle LV. Early sites of activation are also seen in the septum and at the apex
of the right ventricle RV. BPM 5 biological pacemaker, LV 5 left ventricle, RV 5 right ventricle.
182 Ultrasound in Medicine and Biology Volume 40, Number 1, 2014
at the base of the lateral wall in the LV (Fig. 3a, b). In thefirst case, the EW then propagated near the base of the LV,reached the basal anterior and posterior walls nearlysimultaneously and reached the septum at approximately70 ms (Fig. 3a). In the second case, the EW propagated inthe basal region of the LV, but the anterior wall was acti-vated prior to both the posterior wall and the septum.Simultaneously, the EW propagated toward the apexalong the LV lateral wall. The time difference betweenactivation of the anterior wall and activation of the poste-rior wall was 20 ms (Fig. 3b). In both cases, the RV pre-sented two earlier sites of activation: at the RVapex, andeither in the mid-septum (Fig. 3b) or the basal region ofthe septum (Fig. 3a).
Electronic pacingFigure 4 depicts the isochrones obtained in four dogs
during pacing by the EPM. The origin of the isochronescorresponds to the onset of the QRS (SupplementaryVideo 3 shows the corresponding EWI cine loops). Thepacing rate was set to override the idioventricular rhythmand ranged from 35 to 60 bpm. In all cases, the EPM leadwas implanted at the endocardial RVapex. In three cases,the EWoriginated from the RVapex (Fig. 4a–c), whereasin one case, the origin of the EW was located near theseptum at the LV apex. Figure 4a shows the EW propa-gating from the RVapical septum to the RVapical lateralwall, the basal septum and the mid-posterior wall of theLV before reaching the mid-lateral wall of the LV at40ms. The EW then propagated toward the basal anterior,posterior and lateral walls of the LV, which were activatedat 60 to 70 ms. Finally, at 120 ms, the EW reached the RVlateral wall as well as the posterior and anterior walls ofthe LV. In Figure 4b, electromechanical activation startedat the RV apical septum and traveled down both the
septum and the RV lateral wall. The EW then propagatedtoward the mid-lateral wall of the LV via the apical regionand a small mid-region of the anterior wall. The LVmid-lateral wall was reached at 40 to 50 ms. The EWthen propagated downward toward the basolateral wallof the LV before eventually reaching all regions of theLV. Total activation of the LV was observed at 120 ms.In Figure 4c, the EW originated in the RV apex, propa-gated toward the apical and basal anterior and posteriorwalls and reached the LV mid-lateral wall at 40 to50 ms. The remaining regions of the RV (mid- and basalregions of the septum and lateral walls) were activatednext, at approximately 70 ms. Finally, the mid-anteriorand posterior walls, as well as the rest of the lateral wallof the LV, were activated at 110 to 120 ms. In Figure 4d,the EW appeared to originate from the LV apical septumregion. Activation of the mid- to basal anterior and lateralLV walls, corresponding to the site of implantation of theBPM, followed shortly after at 40 to 50 ms. The RV wasthen activated as the EW propagated from the anteriorpart of the LV back to the RV (80 to 90ms after initial acti-vation) and eventually reached the RVapex as well as theposterior wall of the LV at 120 ms.
RepeatabilityFigures 5 and 6 illustrate EWI repeatability in consec-
utive cardiac cycles during both NSR (Fig. 5) and EPMpacing (Fig. 6). Origins of the isochrones correspond tothe onset of the P wave (Fig. 5a, d) or onset of the QRS(Fig. 6a, d). Figures 5(b, e) and 6(b, e) are differencemaps created by displaying the absolute difference inactivation time between two consecutive isochrones, andFigures 5(c, f) and 6(c, f) are histograms of the absolutevalues of the difference in activation time for pixels ofthe corresponding difference map.

Fig. 4. Ventricular electromechanical wave imaging (EWI) isochrones of four dogs during EPM pacing. The origins ofthe isochrones correspond to the onset of the QRS. (a–d) During EPM pacing, early activation is seen near the apex of theRV (dogs 1, 6 and 5 [a, b and c, respectively]) or at the LVapex near the septum and near the RV lateral wall apex (dog 2
[d]). EPM 5 electronic pacemaker, LV 5 left ventricle, RV 5 right ventricle.
Electromechanical wave imaging of biologically paced canine hearts d A. COSTET et al. 183
Figure 5(a and d, respectively) depicts the four-chamber and two-chamber isochrones generated fromdata acquired from consecutive cardiac cycles duringNSR. For the four-chamber view, we show that 70% ofthe differences in activation time between the isochronesfrom consecutive cardiac cycles are below 10 ms, and80% are below 20 ms (Fig. 5c). Qualitatively, mostregions on the difference map present small differencesin activation time (dark blue). However a few regions inthe difference map show an important difference in acti-vation time (orange red): in the mid-lateral wall of the LV,in the apical region of the septum toward the RV and ina small region in the mid-septum. We also observedregions of moderate difference in the RA and basal regionof the lateral wall of the RV (green yellow). In the two-chamber view, 53% of the differences in activation timesare below 10 ms, 73% are below 20 ms and 90% arebelow 30 ms (Fig. 5f). On the difference map, a smallregion near the epicardium in the RA, as well as a regionnear the apex, present important differences in activationtime (Fig. 5e).
During electronic pacing (Fig. 6), the four-chamberview presents 57% of the differences in activation timebetween the isochrones from consecutive cardiac cyclesbelow 10 ms and 82% below 20 ms (Fig. 6c). On the
difference map, regions of important difference betweenactivation times (red) are detected at the apex and on thelateral wall of the LV near the base. Moderate differences(light blue) are depicted near the base of the lateral wall ofthe RVand in the septum, as well as in the mid-region ofthe lateral wall of the LV (Fig. 6b). In the two-chamberview, 33% of the differences in activation time are below10 ms, 68% are below 20 ms and 82% are below 30 ms(Fig. 6f). On the difference map, regions of moderatedifference (light blue) can be seen near the apex towardthe anterior wall, as well as in the posterior wall nearthe base and in the mid-region (Fig. 6e).
DISCUSSION
In this study, we used EWI to trans thoracicallyimage the heart of conscious, free-breathing dogs duringNSR, EPM and BPM pacing. The objectives were toassess reproducibility and quantify repeatability innumerous closed-chest, conscious dogs and, for the firsttime, to demonstrate the feasibility of EWI during bio-logic pacing. Testing reproducibility in numerousanimals and across a wide array of electrical and biologicrhythms establishes the potential of EWI for longitudinal

Fig. 5. Electromechanical wave imaging (EWI) repeatability during NSR. The origins of the isochrones correspond to theonset of the P wave. (a) Four-chamber view EWI isochrones for two consecutive heart cycles. (b, c) Difference map (b)and histogram (c) of the absolute activation time difference between the two four-chamber isochrones. (d) Two-chamberview EWI isochrones for two consecutive heart cycles. (e, f) Difference map (e) and histogram (f) of the absolute acti-vation time difference between the two two-chamber isochrones. NSR 5 normal sinus rhythm, LA 5 left atrium,
LV 5 left ventricle, RA 5 right atrium, RV 5 right ventricle.
184 Ultrasound in Medicine and Biology Volume 40, Number 1, 2014
animal studies, as well for mapping a wide variety ofarrhythmias.
EWI depicts propagation of the electromechanicalwavefront that occurs in the cardiac muscle followingelectrical activation following a delay of a few millisec-onds (Bers 2002; Cordeiro et al. 2004). In this study,reproducibility was assessed during NSR and duringBPM and EPM pacing. Because we performed EWIon the heart of six different animals, identicalisochrones were not expected. Indeed, each heartpresents its own electromechanical characteristics and,for those that underwent surgery, its own remodelingprocesses.
We confirmed that during NSR (Fig. 2), the EWpropagated in both the atria (during the P wave) and theventricles (during the QRS complex) following an ex-pected pattern described in previous literature (Durreret al. 1970; Lewis and Rothschild 1915; Lewis et al.1914; Scher and Young 1956).
During biologic pacing from the basal LV epicar-dium (Fig. 3), EWI mapped the electrical activation and
determined a pacing origin in the basolateral LV wall.The location is within the site of implantation of theBPM. There are three possible reasons for the variancein activation along the walls. First, we hypothesize thatthe Purkinje network might have been recruited duringbiologic pacing, resulting in early activated points inthe walls at the mid-septum and near the apex of theRV. Second, tethering may be responsible for the variancein activation: indeed there might be a longer lag in someregions between electrical and electromechanical activa-tion because of the myocardium having to contractagainst earlier-activated regions. Third, because we areperforming 2-D imaging of a 3-D propagation pattern,the variance in activation might appear larger than it isin reality.
In Figure 4 we characterized the propagation froman EPM and, more importantly, confirmed the originsof paced beats. In three of the dogs, the origin wascorrectly detected at the endocardial RV apex. In thefourth dog, pacing appeared to originate from the para-septal LV apex. We attribute this to the pacemaker

Fig. 6. Electromechanical wave imaging (EWI) repeatability during EPM pacing. The origins of the isochrones corre-spond to the onset of the QRS. (a) Four-chamber view EWI isochrones for two consecutive heart cycles. (b, c) Differencemap (b) and histogram (c) of the absolute activation time difference between the two four-chamber isochrones. (d) Two-chamber view EWI isochrones for two consecutive heart cycles. (e, f) Difference map (e) and histogram (f) of the absoluteactivation time difference between the two two-chamber isochrones. EPM 5 electronic pacemaker, LV5 left ventricle,
RV 5 right ventricle.
Electromechanical wave imaging of biologically paced canine hearts d A. COSTET et al. 185
lead being located anteriorly to the four-chamber-viewimaging plane. This is confirmed by the bi-planar view,in which the two-chamber view shows an early activationlocation at the anterior apex. In addition, the basal lateraland anterior walls of the LVare activated within 40 ms ofthe origin, suggesting that the BPM might not have beencompletely overridden by the EPM pacing. The differ-ences in activation patterns observed in this figure maybe attributed to inherent differences in anatomy and elec-trical activation between dogs. Furthermore, becauseEWI is currently performed in two dimensions insteadof three dimensions, the isochrones presented here mightnot correspond to the exact same plane in all of the dogs.
We demonstrated EWI repeatability within a singleheart for consecutive cardiac cycles during bothNSR and EPM pacing (Figs. 5 and 6). According to thedifference maps and the histograms of the difference inactivation times, more than 80% of the pixels havea difference in activation time below 20 ms for thefour-chamber views or below 30 ms for the two-chamber views. The regions depicted on the differencemap with higher differences in activation times (in
orange red) are small and centered on a few specificlocations. The high values found at or near the apexmightbe the result of suboptimal incremental strain estima-tions caused by the limited contraction of the apex aswell as its fiber orientation, which differs from theorientation in the rest of the myocardium. Indeed, theapex has a more complex myocardial fiber architecture(Greenbaum et al. 1981) that could result in the discrep-ancy found. Other discrepancies near the base and at thejunction between atria and ventricles could be explainedby tethering of the myocardium during the P wave and/orthe QRS. Finally, because the regions of high differencesare mostly limited in space, errors might also be the resultof occasional errors in the manual selection of thehundreds of regions necessary to generate the isochrones.
In the past, our group has reported EWI strains tobe reliable for a wide array of cardiac conditions andgeometries (Provost et al. 2010, 2011b, 2011c, 2012).The novel unfocused transmit sequence (Provost et al.2011c) we used in this study mitigates the standard strainmapping method limitation of simultaneously achievinghigh frame rate and high accuracy in a large field of
186 Ultrasound in Medicine and Biology Volume 40, Number 1, 2014
view. Indeed, EWI non-invasively mapped the electrome-chanical activation at high frame rates (2000 Hz) and highaccuracy (0.385-mm axial resolution) in a full view of theheart and using ultrasound systems similar to those avail-able in cardiology suites. The processing of the EWI data(RF reconstruction, displacement and strain estimation,EWI cine loop and isochrone generation), as describedin Figure 1, can be performed within minutes of acquisi-tion with the Tesla GPU and suggests that EWI could bereadily used in real time in a clinical setting.
There are several limitations to this study. A limita-tion of the current implementation of EWI is that it esti-mates strain in only one direction. As a result, in regionsof the heart where the ultrasound beam is not clearlyaligned with the cardiac longitudinal direction, interpre-tation of the axial incremental strains becomes morecomplex because the assumption that the axial directionmatches or has the largest projection component in thelongitudinal direction may not hold. In the apical views,such regions include apical and basal regions of the ante-rior and lateral walls in the four- and two-chamber views,respectively. Because EWI does not rely on the magni-tude of the strains to detect electromechanical activation,as long as the ultrasound beam is oriented such that thelargest projection of the desired strain component is inthe axial direction, the zero crossings of the incrementalstrain correspond to a change in mechanical functionfrom relaxation to contraction. Indeed, previous studieshave indicated that the relationship between electricaland electromechanical activation is maintained atdifferent insonification angles (Provost et al. 2011a). Asolution would be to estimate strains in two dimensions.Such estimation can be more sensitive to noise and is thesubject of ongoing studies (Lee et al. 2007; Luo andKonofagou 2009; Okrasinski et al. 2012).
A main limitation lies in the fact that 2-D imaging ofa 3-D propagation pattern is performed. Indeed, althoughthe electromechanical wave is a 3-D phenomenon propa-gating throughout the heart during the cardiac cycle,imaging through standard 2-D echocardiography apicalimaging planes was performed in this study. We believethis limitation explains the discrepancy between detectedand expected pacing origins in the EPM case. Because weuse 2-D echocardiographic views, the imaging planeselected might not include the pacing electrode location,and as a result, the 3-D propagation of the electromechan-ical activation may result in the earliest activation beingdetected in neighboring locations on the selected echo-cardiographic view. This limitation could be mitigatedby acquiring a larger number of views (e.g., two-chamber, four-chamber, three-chamber and a fourthview located between the two- and four-chamber views)while also performing 3-D registration and reconstruction(Provost 2012). Three-dimensional ultrasound in a single
cardiac cycle would also be advantageous and is theoret-ically possible, but new hardware and processingmethods need to be developed. For example, high framerates and high signal-to-noise ratios are essential for reli-able displacement and strain estimates and, in our case,were achieved by developing a new acquisition methodinvolving the emission of one unfocused circular waveper frame. This constitutes a topic of ongoing researchby our group.
Another limitation lies with the semi-automatedgeneration of isochrones. Indeed, in order to discardnoisy strain curves characterized by either incrementalaxial strain negative-to-positive zero crossings, no strainzero crossing (all negative or all positive strains) ordiscontinuities in the incremental strain curves, manualselection of zero-crossing timings for up to a hundredrandomly and automatically selected regions is per-formed. To reduce operator bias, our group is currentlydeveloping a new processing algorithm that combinesmanual initialization followed by full automatization ofisochrone generation.
Previous studies have indicated that the delaybetween electrical activation and electromechanical acti-vation, defined here as the onset of axial shortening, mayvary throughout the heart, especially in diseased statessuch as left bundle-branch block (Faris et al. 2003;Gurev et al. 2010; Russell et al. 2011). Because the EWresults from myocardial electromechanical coupling,EWI does not directly track electrical activation.However, our group previously reported that there isa strong correlation between electrical activation andthe EW in normal dogs, as well as during EPM pacing,where the electromechanical pattern is a delayedversion of the electrical one (Provost et al. 2011a,2011b, 2011c). The correlation between the EW and theunderlying electrical activation during BPM pacing wasnot validated in this study, but is currently beinginvestigated in ongoing studies.
CONCLUSION
Our study found that EWI can trans thoracically andnon-invasively map the electrical activation of the heartsof conscious, free-breathing canines during a wide arrayof rhythms, whether of electrical or biological, endocar-dial or epicardial origin, and arising in the atria or eitherventricle of the heart. It also found that EWI is reproduc-ible not only within the same heart, but also acrossdifferent hearts, thus indicating that EWI has the potentialto not only be used in longitudinal animal studies, but alsoto map a wide variety of arrhythmias and their treatment.
Acknowledgments—This study was supported in part by the NationalInstitutes of Health (R01 EB006042, R01 HL114358 and R01-HL67101). Gerard Boink received grant support from the Netherlands

Electromechanical wave imaging of biologically paced canine hearts d A. COSTET et al. 187
Foundation for Cardiovascular Excellence (NFCVE), the NetherlandsHeart Foundation, the Dr. Saal van Zwanenberg Foundation and theInteruniversity Cardiology Institute of the Netherlands. The authorswant to thank Stanley J. Okrasinski and Ethan Bunting in the groupfor the helpful discussions and their assistance with data acquisition;EugeneA. Sosunov for his help during data acquisition; and Ira S. Cohenand Richard B. Robinson for their help in making the biologic pace-makers used in this paper.
SUPPLEMENTARY DATA
Supplementary data related to this article can be found online athttp://dx.doi.org/10.1016/j.ultrasmedbio.2013.08.019.
REFERENCES
Badke FR, Boinay P, Covell JW. Effects of ventricular pacing onregional left ventricular performance in the dog. Am J Physiol1980;238:H858–H867.
Barbuti A, Baruscotti M, Difrancesco D. The pacemaker current: Frombasics to the clinics. J Cardiovasc Electrophysiol 2007;18:342–347.
Bers DM. Cardiac excitation-contraction coupling. Nature 2002;415:198–205.
Bucchi A, Plotnikov AN, Shlapakova I, Danilo P, Kryukova Y, Qu J,Lu Z, Liu H, Pan Z, Potapova I, Knight BK, Girouard S,Cohen IS, Brink PR, Robinson RB, Rosen MR. Wild-type andmutant HCN channels in a tandem biological-electronic cardiacpacemaker. Circulation 2006;114:992–999.
Cordeiro JM, Greene L, Heilmann C, Antzelevitch D, Antzelevitch C.Transmural heterogeneity of calcium activity and mechanicalfunction in the canine left ventricle. Am J Physiol 2004;286:H1471–H1479.
DiFrancesco D, Ferroni A, Mazzanti M, Tromba C. Properties of thehyperpolarizing-activated current (if) in cells isolated from therabbit sino-atrial node. J Physiol 1986;377:61–88.
DiFrancesco D, Tromba C. Muscarinic control of the hyperpolarization-activated current (if) in rabbit sino-atrial node myocytes. J Physiol1988;405:493–510.
Durrer D, Dam V, Th R, Freud GE, Janse MJ, Meijler FL,Arzbaecher RC. Total excitation of the isolated human heart. Circu-lation 1970;41:899–912.
Faris OP, Evans FJ, Ennis DB, Helm PA, Taylor JL, Chesnick AS,Guttman MA, Ozturk C, McVeigh ER. Novel technique for cardiacelectromechanical mapping with magnetic resonance imagingtagging and an epicardial electrode sock. Ann Biomed Eng 2003;31:430–440.
Greenbaum RA, Ho SY, Gibson DG, Becker AE, Anderson RH. Leftventricular fibre architecture in man. Br Heart J 1981;45:248–263.
Gurev V, Constantino J, Rice JJ, Trayanova NA. Distribution of electro-mechanical delay in the heart: Insights from a three-dimensionalelectromechanical model. Biophys J 2010;99:745–754.
Kallel F, Ophir J. A least-squares strain estimator for elastography.Ultrason Imaging 1997;19:195–208.
Lee WN, Ingrassia CM, Fung-Kee-Fung SD, Costa KD, Holmes JW,Konofagou EE. Theoretical quality assessment of myocardial elas-tography with in vivo validation. IEEE Trans Ultrason FerroelectrFreq Control 2007;54:2233–2245.
Lewis T, Meakins J,White PD. The excitatory process in the dog’s heart:Part I. The auricles. PhilosTrans R Soc Lond Ser B 1914;205:375–420.
Lewis T, Rothschild MA. The excitatory process in the dog’s heart. PartII. The ventricles. Philos Trans R Soc Lond Ser B 1915;206:181–226.
Luo J,KonofagouEE.High-frame rate, full-viewmyocardial elastographywith automated contour tracking inmurine left ventricles invivo. IEEETrans Ultrason Ferroelectr Freq Control 2008;55:240–248.
Luo J, Konofagou EE. Effects of various parameters on lateral displace-ment estimation in ultrasound elastography. Ultrasound Med Biol2009;35:1352–1366.
Luo J, Konofagou E. A fast normalized cross-correlation calculationmethod for motion estimation. IEEE Trans Ultrason FerroelectrFreq Control 2010;57:1347–1357.
Okrasinski SJ, Ramachandran B, Konofagou EE. Assessment ofmyocardial elastography performance in phantoms under combinedphysiologic motion configurations with preliminary in vivo feasi-bility. Phys Med Biol 2012;57:5633.
Plotnikov AN, Sosunov EA, Qu J, Shlapakova IN, Anyukhovsky EP,Liu L, Janse MJ, Brink PR, Cohen IS, Robinson RB, Danilo P Jr,Rosen MR. Biological pacemaker implanted in canine left bundlebranch provides ventricular escape rhythms that have physiologi-cally acceptable rates. Circulation 2004;109:506–512.
Provost J. Electromechanical wave imaging. PhD dissertation. Disserta-tion Abstr Int 2012;73(11).
Provost J, Gurev V, Trayanova N, Konofagou EE. Mapping of cardiacelectrical activation with electromechanical wave imaging: An insilico–in vivo reciprocity study. Heart Rhythm 2011a;8:752–759.
Provost J, Lee WN, Fujikura K, Konofagou EE. Electromechanicalwave imaging of normal and ischemic hearts in vivo. IEEE TransMed Imaging 2010;29:625–635.
Provost J, Lee WN, Fujikura K, Konofagou EE. Imaging the electrome-chanical activity of the heart in vivo. ProcNatl Acad Sci USA 2011b;108:8565–8570.
Provost J, Nguyen VT-H, Legrand D, Okrasinski S, Costet A,Gambhir A, Garan H, Konofagou EE. Electromechanical waveimaging for arrhythmias. Phys Med Biol 2011c;56:L1–L11.
Provost J, Thi�ebaut S, Luo J, Konofagou EE. Single-heartbeat electro-mechanical wave imaging with optimal strain estimation usingtemporally unequispaced acquisition sequences. Phys Med Biol2012;57:1095–1112.
Qu J, Barbuti A, Protas L, Santoro B, Cohen IS, Robinson RB. HCN2Overexpression in newborn and adult ventricular myocytes: Distincteffects on gating and excitability. Circ Res 2001;89:e8–e14.
Qu J, Plotnikov AN, Danilo P, Shlapakova I, Cohen IS, Robinson RB,Rosen MR. Expression and function of a biological pacemaker incanine heart. Circulation 2003;107:1106–1109.
Ramanathan C, GhanemRN, Jia P, Ryu K, RudyY. Noninvasive electro-cardiographic imaging for cardiac electrophysiology andarrhythmia. Nature Med 2004;10:422–428.
Righetti R, Ophir J, Ktonas P. Axial resolution in elastography. Ultra-sound Med Biol 2002;28:101–113.
Rosen MR. Biological pacemaking: In our lifetime? Heart Rhythm2005;2:418–428.
Rosen MR, Brink PR, Cohen IS, Robinson RB. Genes, stem cells andbiological pacemakers. Cardiovasc Res 2004;64:12–23.
Russell K, Smiseth OA, Gjesdal O, Qvigstad E, Norseng PA,Sjaastad I, Opdahl A, Skulstad H, Edvardsen T, Remme EW.Mechanism of prolonged electromechanical delay in late activatedmyocardium during left bundle branch block. Am J Physiol 2011;301:H2334–H2343.
Scher AM, Young AC. The pathway of ventricular depolarization in thedog. Circ Res 1956;4:461–469.
Uematsu M, Miyatake K, Tanaka N, Matsuda H, Sano A, Yamazaki N,Hirama M, Yamagishi M. Myocardial velocity gradient as a newindicator of regional left ventricular contraction: Detection bya two-dimensional tissue Doppler imaging technique. J Am CollCardiol 1995;26:217–223.
Urheim S, Edvardsen T, Torp H, Angelsen B, Smiseth OA. MyocardialstrainbyDoppler echocardiographyvalidationof anewmethod toquan-tify regional myocardial function. Circulation 2000;102:1158–1164.
Wang S, Lee W, Provost J, Luo J, Konofagou EE. A composite high-frame-rate system for clinical cardiovascular imaging. IEEE TransUltrason Ferroelectr Freq Control 2008;55:2221–2233.
Wyman BT, Hunter WC, Prinzen FW, McVeigh ER. Mapping propaga-tion of mechanical activation in the paced heart with MRI tagging.Am J Physiology 1999;276:H881–H891.
Zhang X, Ramachandra I, Liu Z, Muneer B, Pogwizd SM, He B.Noninvasive three-dimensional electrocardiographic imaging ofventricular activation sequence. Am J Physiol 2005;289:H2724–H2732.