![APCS 練習環境測試說明...Ubuntu Desktop APCS [Running] 19:59 Left APCS Oracle VM VirtualBox APCS Ubuntu (64-bit) APCS 2048 MB VT-WAMD-V, 12 MB CoreAudio ICH AC97 IDE IDE IDE](https://static.fdocuments.net/doc/165x107/5f5c55fa6574850b0820235f/apcs-cccfee-ubuntu-desktop-apcs-running-1959-left-apcs.jpg)
D mTOR regulates metabolic adaptation of APCs in the lung...
9
RESEARCH ARTICLE ◥ INFLAMMATION mTOR regulates metabolic adaptation of APCs in the lung and controls the outcome of allergic inflammation Charles Sinclair, 1 *† Gayathri Bommakanti, 1 * Luiz Gardinassi, 2 Jens Loebbermann, 1 Matthew Joseph Johnson, 1,3 Paul Hakimpour, 1 Thomas Hagan, 1 Lydia Benitez, 1 Andrei Todor, 2 Deepa Machiah, 4 Timothy Oriss, 5 Anuradha Ray, 5 Steven Bosinger, 6 Rajesh Ravindran, 1 ‡ Shuzhao Li, 2 Bali Pulendran 1,7,8 § Antigen-presenting cells (APCs) occupy diverse anatomical tissues, but their tissue- restricted homeostasis remains poorly understood. Here, working with mouse models of inflammation, we found that mechanistic target of rapamycin (mTOR)–dependent metabolic adaptation was required at discrete locations. mTOR was dispensable for dendritic cell (DC) homeostasis in secondary lymphoid tissues but necessary to regulate cellular metabolism and accumulation of CD103 + DCs and alveolar macrophages in lung. Moreover, while numbers of mTOR-deficient lung CD11b + DCs were not changed, they were metabolically reprogrammed to skew allergic inflammation from eosinophilic T helper cell 2 (T H 2) to neutrophilic T H 17 polarity. The mechanism for this change was independent of translational control but dependent on inflammatory DCs, which produced interleukin-23 and increased fatty acid oxidation. mTOR therefore mediates metabolic adaptation of APCs in distinct tissues, influencing the immunological character of allergic inflammation. A fundamental property of the immune sys- tem is its ability to sense pathogens through pattern recognition receptors. Emerging evidence demonstrates that immune cells also sense environmental perturbations that induce cellular stress and metabolic changes (1, 2). However, the mechanisms underlying such environmental sensing are poorly understood. The amino acid sensor GCN2 plays a role in programming dendritic cells (DCs) to respond to viral vaccination (3, 4) and controls intestinal inflammation by suppressing inflammasome ac- tivation in the gut (5). In addition to GCN2, the mechanistic target of rapamycin (mTOR), a cen- tral orchestrator of cellular metabolism, regu- lates DC function (6). mTOR functions in two supramolecular com- plexes termed mTORC1 and mTORC2, engaged to differing degrees by diverse stimuli, including Toll-like receptor signaling, growth factors, and nutrient availability. mTOR signaling affects di- verse downstream cellular processes, including cell cycle progression, cell growth, differentia- tion, survival, and metabolism (7). Although mTOR is required for effector T cell expansion (8) and germinal center B cell responses (9), it restrains T memory generation (10). Within DCs, mTOR promotes type I interferon production by plasmacytoid DCs (11, 12) but limits proinflam- matory cytokine production by classical DCs (13). Moreover, mTOR promotes steady-state DC ac- cumulation downstream of homeostatic cytokine signaling (14–16). The precise functions of mTOR have been proposed to be DC subset dependent (17), but the consequence of mTOR signaling in DCs and the effect on immune responses in vivo are poorly understood. Results mTOR promotes lung APC homeostasis in vivo We bred mice bearing floxed Mtor with a CD11c- Cre deleter strain (mTOR DAPC ), resulting in spe- cific genetic ablation, reduced protein abundance, and loss of mTOR pathway activity in CD11c + cells (fig. S1, A to D). mTOR inhibition augments DC proinflammatory cytokine production (13, 17), which we observed in mTOR DAPC bone marrow (BM)–derived DCs and primary splenic DCs (fig. S1E), confirming functional deletion of mTOR. DCs can be subdivided into CD8a + /CD103 + and CD11b + subsets. Globally, DCs require Flt3L and granulocyte macrophage colony–stimulating factor (GM-CSF) signals for homeostatic main- tenance (18, 19), both of which activate mTOR (14). In addition, antigen-presenting cells (APCs) occupy distinct microenvironments where mTOR may exhibit site-specific functions (15, 20). mTOR DAPC ablation did not exert global effects on APCs but instead revealed defects in APC accumulation at specific anatomical sites. There was negligible requirement for cell-intrinsic mTOR in most tissues examined; however, splenic CD11b + DCs were modestly reduced and there was a skewed ratio of CD103 + to CD11b + DCs in thymus (fig. S2). We also confirmed a substan- tial reduction in Langerhans cell frequency (15) (fig. S3). However, the most striking effect of mTOR DAPC deletion was observed in the lung. Here, CD103 + DC and CD11c + alveolar macro- phage (AM) populations were significantly re- duced (Fig. 1A). Mixed BM chimeras showed that homeostatic defects were cell intrinsic and additionally revealed a minor impairment in CD11b + lung DC accumulation (Fig. 1B). mTOR may simply regulate numerical accu- mulation of APCs or, alternatively, may be central to controlling lung APC programming. Transcrip- tomes derived from mTOR DAPC lung APCs ver- sus wild-type (WT) controls clustered distinctly by principal components analysis (PCA), whereas mTOR DAPC splenic populations clustered closely with their WT counterparts (fig. S4). Previous studies have identified core sets of lineage-specifying genes, enriched in either CD11b + lung APCs or AMs, relative to other APC subsets (21, 22). mTOR DAPC AMs exhibited a broad loss of AM molecular identity (fig. S5A). Rather than disrupt- ing the CD11b + APC cellular identity, mTOR ab- lation skewed the balance of CD11c + CD11b + lung APCs toward a macrophage/monocytic composi- tion (fig. S5B) (22), typified by reduced heat-stable antigen (HSA), Flt3, and a trend of lower Irf4 expression, with elevated MerTK and CD64 tran- scription (Fig. 1C). Using an alternative gating scheme (22), we found that CD11c + MHC-II + Sirpa + HSA + DCs were reduced in mTOR DAPC mice (Fig. 1D) due to cell-intrinsic defects in accumulation (Fig. 1E). Thus, mTOR plays a central, cell-intrinsic role in APC homeostatic accumulation and subset composition in the lung. Steady-state DC homeostasis depends on cell development, proliferation, migration, and death rates. Ablation or inhibition of mTOR increased death rates of lung APCs (Fig. 2A and fig. S6, A and B), whereas precursor frequency, prolifera- tion rates, and migration were unaffected (fig. S6, C to G). There was no evidence that GM-CSF, M-CSF, or Flt3L expression was perturbed in mTOR DAPC mice, excluding a role for other cell-extrinsic ho- meostatic factors (fig. S6H). mTOR associates with RESEARCH Sinclair et al., Science 357, 1014–1021 (2017) 8 September 2017 1 of 8 1 Emory Vaccine Center, Emory University, 954 Gatewood Road NE, Atlanta, GA 30329, USA. 2 Department of Medicine, Emory University, Atlanta, GA 30329, USA. 3 Department of Pediatrics, University of Minnesota, Minneapolis, MN 55455, USA. 4 Yerkes Molecular Pathology Core Laboratory, Yerkes National Primate Research Center, 954 Gatewood Road NE, Atlanta, GA 30329, USA. 5 Division of Pulmonary, Allergy and Critical Care Medicine, Department of Immunology, University of Pittsburgh Asthma Institute at University of Pittsburgh Medical Center (UPMC), University of Pittsburgh School of Medicine, Pittsburgh, PA, USA. 6 Primate Genomics Core, Yerkes National Primate Research Center, 954 Gatewood Road NE, Atlanta, GA 30329, USA. 7 Department of Pathology and Laboratory Medicine, Emory University, Atlanta, GA, USA. 8 Institute for Immunity, Transplantation and Infection, Department of Pathology, Department of Microbiology and Immunology, Stanford University, Stanford, CA 94305, USA. *These authors contributed equally to this work. †Present address: AstraZeneca, Cancer Research UK (CRUK) Cambridge Institute, Li Ka Shing Center, University of Cambridge, Robinson Way, Cambridge CB2 0RE, UK. ‡Present address: Genomics Institute of the Novartis Research Foundation, 10675 John Jay Hopkins Drive, San Diego, CA 92121, USA. §Corresponding author. Email: [email protected]; [email protected] on March 6, 2019 http://science.sciencemag.org/ Downloaded from
-
Upload
nguyenkiet -
Category
Documents
-
view
228 -
download
0
Transcript of D mTOR regulates metabolic adaptation of APCs in the lung...

RESEARCH ARTICLE◥
INFLAMMATION
mTOR regulates metabolic adaptationof APCs in the lung and controls theoutcome of allergic inflammationCharles Sinclair,1*† Gayathri Bommakanti,1* Luiz Gardinassi,2 Jens Loebbermann,1
Matthew Joseph Johnson,1,3 Paul Hakimpour,1 Thomas Hagan,1
Lydia Benitez,1 Andrei Todor,2 Deepa Machiah,4 Timothy Oriss,5 Anuradha Ray,5
Steven Bosinger,6 Rajesh Ravindran,1‡ Shuzhao Li,2 Bali Pulendran1,7,8§
Antigen-presenting cells (APCs) occupy diverse anatomical tissues, but their tissue-restricted homeostasis remains poorly understood. Here, working with mouse models ofinflammation, we found that mechanistic target of rapamycin (mTOR)–dependentmetabolic adaptation was required at discrete locations. mTOR was dispensable fordendritic cell (DC) homeostasis in secondary lymphoid tissues but necessary to regulatecellular metabolism and accumulation of CD103+ DCs and alveolar macrophages in lung.Moreover, while numbers of mTOR-deficient lung CD11b+ DCs were not changed, they weremetabolically reprogrammed to skew allergic inflammation from eosinophilic T helpercell 2 (TH2) to neutrophilic TH17 polarity. The mechanism for this change wasindependent of translational control but dependent on inflammatory DCs, whichproduced interleukin-23 and increased fatty acid oxidation. mTOR therefore mediatesmetabolic adaptation of APCs in distinct tissues, influencing the immunologicalcharacter of allergic inflammation.
Afundamental property of the immune sys-tem is its ability to sense pathogens throughpattern recognition receptors. Emergingevidence demonstrates that immune cellsalso sense environmental perturbations that
induce cellular stress and metabolic changes(1, 2). However, the mechanisms underlying suchenvironmental sensing are poorly understood.The amino acid sensor GCN2 plays a role inprogramming dendritic cells (DCs) to respondto viral vaccination (3, 4) and controls intestinal
inflammation by suppressing inflammasome ac-tivation in the gut (5). In addition to GCN2, themechanistic target of rapamycin (mTOR), a cen-tral orchestrator of cellular metabolism, regu-lates DC function (6).mTOR functions in two supramolecular com-
plexes termed mTORC1 and mTORC2, engagedto differing degrees by diverse stimuli, includingToll-like receptor signaling, growth factors, andnutrient availability. mTOR signaling affects di-verse downstream cellular processes, includingcell cycle progression, cell growth, differentia-tion, survival, and metabolism (7). AlthoughmTOR is required for effector T cell expansion(8) and germinal center B cell responses (9), itrestrains T memory generation (10). Within DCs,mTOR promotes type I interferon production byplasmacytoid DCs (11, 12) but limits proinflam-matory cytokine production by classical DCs (13).Moreover, mTOR promotes steady-state DC ac-cumulation downstream of homeostatic cytokinesignaling (14–16). The precise functions of mTORhave been proposed to be DC subset dependent(17), but the consequence of mTOR signaling inDCs and the effect on immune responses in vivoare poorly understood.
ResultsmTOR promotes lung APC homeostasisin vivo
We bred mice bearing floxedMtor with a CD11c-Cre deleter strain (mTORDAPC), resulting in spe-cific genetic ablation, reduced protein abundance,
and loss ofmTOR pathway activity in CD11c+ cells(fig. S1, A to D). mTOR inhibition augments DCproinflammatory cytokine production (13, 17),which we observed in mTORDAPC bone marrow(BM)–derived DCs and primary splenic DCs (fig.S1E), confirming functional deletion of mTOR.DCs can be subdivided into CD8a+/CD103+
and CD11b+ subsets. Globally, DCs require Flt3Land granulocyte macrophage colony–stimulatingfactor (GM-CSF) signals for homeostatic main-tenance (18, 19), both of which activate mTOR(14). In addition, antigen-presenting cells (APCs)occupy distinct microenvironments wheremTORmay exhibit site-specific functions (15, 20).mTORDAPC ablation did not exert global effectson APCs but instead revealed defects in APCaccumulation at specific anatomical sites. Therewas negligible requirement for cell-intrinsicmTOR in most tissues examined; however, splenicCD11b+ DCs were modestly reduced and therewas a skewed ratio of CD103+ to CD11b+ DCs inthymus (fig. S2). We also confirmed a substan-tial reduction in Langerhans cell frequency (15)(fig. S3). However, the most striking effect ofmTORDAPC deletion was observed in the lung.Here, CD103+ DC and CD11c+ alveolar macro-phage (AM) populations were significantly re-duced (Fig. 1A). Mixed BM chimeras showedthat homeostatic defects were cell intrinsic andadditionally revealed a minor impairment inCD11b+ lung DC accumulation (Fig. 1B).mTOR may simply regulate numerical accu-
mulation of APCs or, alternatively, may be centralto controlling lung APC programming. Transcrip-tomes derived from mTORDAPC lung APCs ver-sus wild-type (WT) controls clustered distinctlyby principal components analysis (PCA), whereasmTORDAPC splenic populations clustered closelywith theirWTcounterparts (fig. S4). Previous studieshave identified core sets of lineage-specifyinggenes, enriched in either CD11b+ lung APCs orAMs, relative to other APC subsets (21, 22).mTORDAPC AMs exhibited a broad loss of AMmolecular identity (fig. S5A). Rather than disrupt-ing the CD11b+ APC cellular identity, mTOR ab-lation skewed the balance of CD11c+CD11b+ lungAPCs toward a macrophage/monocytic composi-tion (fig. S5B) (22), typified by reduced heat-stableantigen (HSA), Flt3, and a trend of lower Irf4expression, with elevatedMerTK and CD64 tran-scription (Fig. 1C). Using an alternative gatingscheme (22), we found that CD11c+MHC-II+Sirpa+
HSA+ DCs were reduced in mTORDAPC mice (Fig.1D) due to cell-intrinsic defects in accumulation(Fig. 1E). Thus,mTORplays a central, cell-intrinsicrole in APC homeostatic accumulation and subsetcomposition in the lung.Steady-state DC homeostasis depends on cell
development, proliferation,migration, and deathrates. Ablation or inhibition of mTOR increaseddeath rates of lung APCs (Fig. 2A and fig. S6, Aand B), whereas precursor frequency, prolifera-tion rates, andmigrationwere unaffected (fig. S6, Cto G). There was no evidence that GM-CSF,M-CSF,or Flt3L expression was perturbed in mTORDAPC
mice, excluding a role for other cell-extrinsic ho-meostatic factors (fig. S6H). mTOR associates with
RESEARCH
Sinclair et al., Science 357, 1014–1021 (2017) 8 September 2017 1 of 8
1Emory Vaccine Center, Emory University, 954 GatewoodRoad NE, Atlanta, GA 30329, USA. 2Department of Medicine,Emory University, Atlanta, GA 30329, USA. 3Department ofPediatrics, University of Minnesota, Minneapolis, MN 55455,USA. 4Yerkes Molecular Pathology Core Laboratory, YerkesNational Primate Research Center, 954 Gatewood Road NE,Atlanta, GA 30329, USA. 5Division of Pulmonary, Allergy andCritical Care Medicine, Department of Immunology,University of Pittsburgh Asthma Institute at University ofPittsburgh Medical Center (UPMC), University of PittsburghSchool of Medicine, Pittsburgh, PA, USA. 6Primate GenomicsCore, Yerkes National Primate Research Center, 954Gatewood Road NE, Atlanta, GA 30329, USA. 7Department ofPathology and Laboratory Medicine, Emory University,Atlanta, GA, USA. 8Institute for Immunity, Transplantationand Infection, Department of Pathology, Department ofMicrobiology and Immunology, Stanford University, Stanford,CA 94305, USA.*These authors contributed equally to this work. †Present address:AstraZeneca, Cancer Research UK (CRUK) Cambridge Institute, Li KaShing Center, University of Cambridge, Robinson Way, CambridgeCB2 0RE, UK. ‡Present address: Genomics Institute of the NovartisResearch Foundation, 10675 John Jay Hopkins Drive, San Diego, CA92121, USA. §Corresponding author. Email: [email protected];[email protected]
on March 6, 2019
http://science.sciencem
ag.org/D
ownloaded from

two molecular complexes (mTORC1/2). Whereasmice lacking the critical mTORC1 protein Raptorphenocopiedhomeostatic defects seen inmTORDAPC
lung, APCs were unaffected in mTORC2-deficientRictorDAPC mice (fig. S7A). mTORC1 signaling tar-gets the translational regulator S6K1/2 and deac-tivates the translational repressor 4E-BP1/2 (fig.S7, B and C) (7). Curiously, S6k1−/−S6k2−/− miceexhibited normal lung APC homeostasis, and ge-netic deletion of 4ebp1/2 did not rescue the sur-vival of mTORDAPC DCs (fig. S7, D and E). Thus,mTORC1 controls APC cell survival through atranslation-independent mechanism.
APCs in the lung display a distinctivemTOR-dependent metabolic signature
The pronounced phenotype of APCs in mTORDAPC
lung relative to other tissues was striking, partic-ularly considering that development of CD103+
DCs in both lung and other tissues is regulatedby the common transcription factor Batf3 (23).We hypothesized that the lung microenviron-mentmay imprint a distinctivemetabolic pheno-typewith heightened sensitivity tomTORablation.To investigate this, comprehensivemetabolic pro-filing was performed on lung and splenic APCsfrom WT mice. Lung and spleen APCs weremetabolically distinct (Fig. 2B), exhibiting dif-
ferences in amino acid and nucleic acid meta-bolic intermediates (fig. S8, A and B), which werealso reflected within observed transcriptionalsignatures (fig. S8, C and D). We next examinedmTORDAPCmetabolomes, and the degree ofmeta-bolic perturbation inmTOR-deficientAPC subsetscorrelated with the extent of their homeostaticdisruption (Fig. 2C). Despite the skewing in thephenotypic composition of the lung CD11b+ DCs(Fig. 1D), there was a minor perturbation in themetabolome (Fig. 2C). Pathway analysis of dif-ferentially abundant metabolites revealed thatseveral amino acid metabolic pathways weredisrupted in mTORDAPC APCs (Fig. 2, D and E).mTORDAPC AMs also exhibited alterations inlipid metabolite expression and correspondingchanges in expression of the sterol regulatorybinding protein (Srebp1/2) target genes (24)(fig. S9). Srebp1 orchestrates lipid anabolismand is a downstream target of mTOR, whichdirectly links mTOR deficiency and metabolicperturbations in lung APCs (25, 26). To test thisexperimentally, we administered the Srebp1/2inhibitor fatostatin, which substantially decreasedAM frequency, a phenotype that was recapitu-lated by rapamycin treatment (fig. S10A). How-ever, CD103+ DCs remained unaltered by eitherinhibitor, suggesting that inhibitor administration
was insufficient to entirely phenocopy mTORDAPC
mice, or that the Srebppathways are not critical forCD103DC survival. Finally,we investigated the roleof another mTOR target, the glycolytic regulatorHif1a, observing that lung APC homeostasis wasindependent of Hif1a (fig. S10B). Thus, lung APCshave distinct mTOR-dependent metabolic sig-natures, and there appears to be a direct linkbetweenmTORand Srebp-dependent lipidmetab-olism in AMs.
Ablation of mTOR in APCs reprogramsallergic inflammation in the lung
Wenext investigatedwhether lung immunity wasfunctionally affected in mTORDAPC mice. Micewere intranasally challenged with house dust mite(HDM) allergen, which is an established murinemodel for asthma (27, 28) (Fig. 3A). Despite re-duced frequencies of select lung APC subsets,humoral responses in mTORDAPC mice were un-expectedly increased (Fig. 3B and fig. S11A). Sur-prisingly, we observed a striking reduction in Thelper cell 2 (TH2) cells producing interleukin-4
+
(IL-4+) and IL-5+/IL-13+ and enhanced frequen-cies of TH17 cells in the lung and bronchoalveolarlavage (BAL) (Fig. 3C and fig. S11B).TH2-polarized allergy is typified by robust
recruitment of eosinophils, whereas IL-17 can
Sinclair et al., Science 357, 1014–1021 (2017) 8 September 2017 2 of 8
Fig. 1. Critical require-ment for mTOR signalingto maintain lung innateimmune homeostasis.Lungs from naïve WT(black) and mTORDAPC (red)mice were analyzed by flowcytometry. (A) Bar chartsshow mean frequencies ±SEM of indicated lung APCpopulations; contour plotsshow representative flowcytometric data. Red arrowsindicate gating hierarchies.(B) Mixed chimeras wereestablished by reconstitutingB6 CD45.1+/CD45.2+ hostswith donor mTORDAPC
(CD45.2) and B6 CD45.1 BMat a ~3:1 ratio. Bar chartshows the percentage con-tribution to chimerism ofmTORDAPC-derived donorcells after exclusion ofresidual host cells. Gray barsindicate control (CD11c–
populations); red bars indi-cate CD11c+ APCs. (C) Barcharts show normalized readcount for indicated genes inWT (black) and mTORDAPC
(red) within the CD11c+CD11b+
lung DC population.(D) Contour plot showsexpression of Sirpa and HSA.Pie chart shows average fre-quencies of indicated populations from one representative experiment (n = 4). (E) Bar chart shows the chimeric contribution of mTORDAPC-derived donor cells.Gray bars denote control CD11c– populations; red bars indicate CD11c+ APCs. Data represent three or more independent experiments.
0
500
1000
1500
2000
0
200
400
600
800
0
500
1000
1500
2000
0
1000
2000
3000
4000
0
500
1000
1500
B-cell
s
CD11c-C
D11b+
CD11b+ D
C
CD103+ D
C AM0
20
40
60
80
100
CD
11c
MHC-IIC
D11
c
Siglec-F
CD45+
(AM excluded)
CD11chi
MHC-II+
CD45+
WT mTOR APC
% C
him
eris
m
Lung
CD
103
CD11b
9.1 1.8
98.090.8
1.0 1.1
31.4 9.1
63.7 81.2
WTmTOR APC
Alveolarmacrophage
0
5
10
15
% o
f CD
45
+
0.0
0.1
0.2
0.3
0.4
CD103 + DC0.0
0.5
1.0
1.5
2.0
CD11b + DC
*******
****
********
Sirp
HSA
WT mTOR APC
24.5 5.7
38.5 27.131.2 62.1
Sirp +HSA-
Sirp +HSA+
Sirp -HSA+
B-cell
s
HSA-Sirp
a+
HSA+Sirp
a+
HSA+Sirp
a-0
20
40
60
80
100
****
***
n.s.
% C
him
eris
m
**
MerTK CD64HSA Flt3 Irf4
Nor
mal
ized
re
ads
*
n.s.**p=0.5
RESEARCH | RESEARCH ARTICLEon M
arch 6, 2019
http://science.sciencemag.org/
Dow
nloaded from
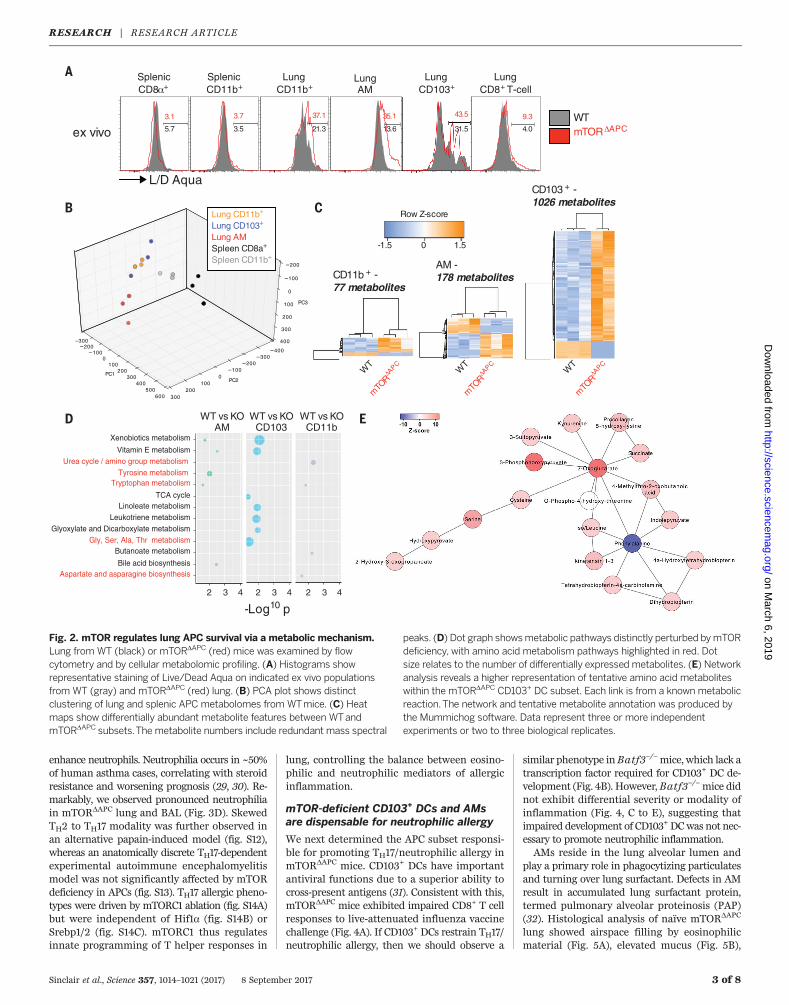
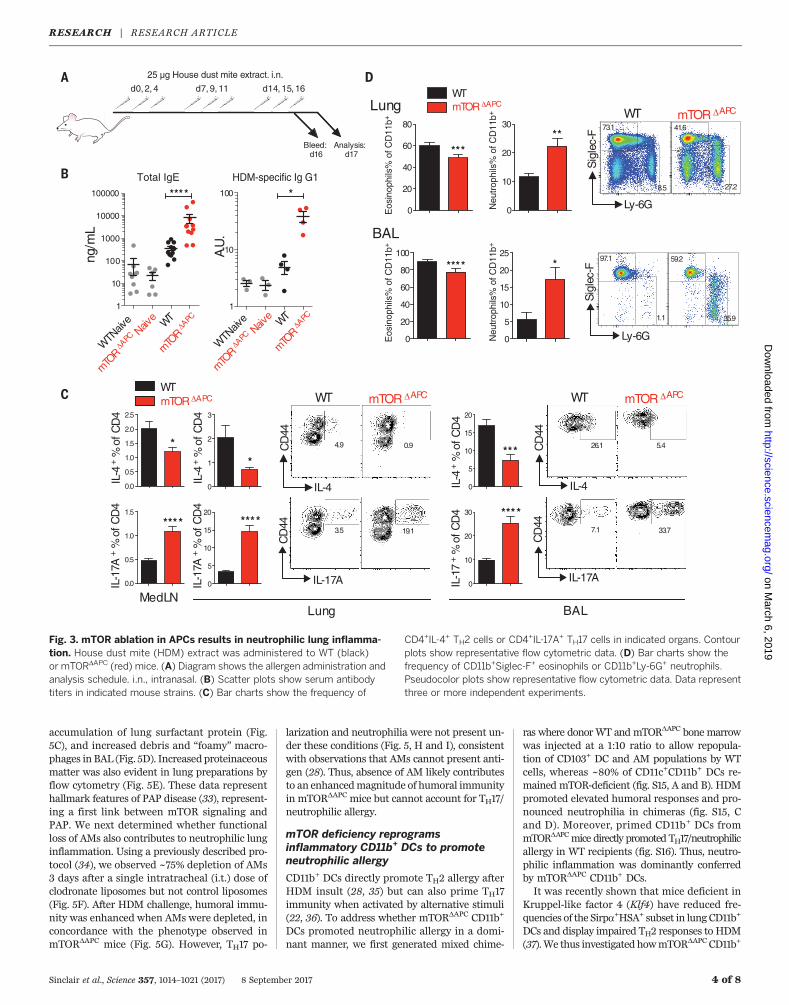
enhance neutrophils. Neutrophilia occurs in ~50%of human asthma cases, correlating with steroidresistance and worsening prognosis (29, 30). Re-markably, we observed pronounced neutrophiliain mTORDAPC lung and BAL (Fig. 3D). SkewedTH2 to TH17 modality was further observed inan alternative papain-induced model (fig. S12),whereas an anatomically discrete TH17-dependentexperimental autoimmune encephalomyelitismodel was not significantly affected by mTORdeficiency in APCs (fig. S13). TH17 allergic pheno-types were driven by mTORC1 ablation (fig. S14A)but were independent of Hif1a (fig. S14B) orSrebp1/2 (fig. S14C). mTORC1 thus regulatesinnate programming of T helper responses in
lung, controlling the balance between eosino-philic and neutrophilic mediators of allergicinflammation.
mTOR-deficient CD103+ DCs and AMsare dispensable for neutrophilic allergy
We next determined the APC subset responsi-ble for promoting TH17/neutrophilic allergy inmTORDAPC mice. CD103+ DCs have importantantiviral functions due to a superior ability tocross-present antigens (31). Consistent with this,mTORDAPC mice exhibited impaired CD8+ T cellresponses to live-attenuated influenza vaccinechallenge (Fig. 4A). If CD103+ DCs restrain TH17/neutrophilic allergy, then we should observe a
similar phenotype inBatf3−/−mice, which lack atranscription factor required for CD103+ DC de-velopment (Fig. 4B). However, Batf3−/−mice didnot exhibit differential severity or modality ofinflammation (Fig. 4, C to E), suggesting thatimpaired development of CD103+ DCwas not nec-essary to promote neutrophilic inflammation.AMs reside in the lung alveolar lumen and
play a primary role in phagocytizing particulatesand turning over lung surfactant. Defects in AMresult in accumulated lung surfactant protein,termed pulmonary alveolar proteinosis (PAP)(32). Histological analysis of naïve mTORDAPC
lung showed airspace filling by eosinophilicmaterial (Fig. 5A), elevated mucus (Fig. 5B),
Sinclair et al., Science 357, 1014–1021 (2017) 8 September 2017 3 of 8
PC1
–300200
1000
100200
300400
500600
PC2
400300
200100
0100
200300
PC3
200
100
0
100
200
300
400
*+,-."1##8 2 34566,."1##8 2
CD11b + - 77 metabolites
CD103 + - 1026 metabolites
Xenobiotics metabolism
Vitamin E metabolismUrea cycle / amino group metabolism
Tyrosine metabolism Tryptophan metabolism
Linoleate metabolismLeukotriene metabolism
Glyoxylate and Dicarboxylate metabolismGly, Ser, Ala, Thr metabolism
Butanoate metabolism
Bile acid biosynthesisAspartate and asparagine biosynthesis
TCA cycle
WT
mTO
RAPC
WT
mTO
RAPC
WT
mTO
RAPC
WT vs KOCD11b
WT vs KOCD103
WT vs KOAM
Lung CD11b+
Lung CD103+
Lung AMSpleen CD8a+
Spleen CD11b+
2 3 4 2 3 4 2 3 4
-Log10 p
WTmTOR APC5.7 3.5
3.7
21.3
37.1
31.5
43.5
13.6
35.13.1
LungCD8+ T-cell
ex vivo
Splenic CD8 +
Splenic CD11b+
LungCD11b+
LungCD103+
LungAM
4.0
9.3
L/D Aqua
-1.5 1.50
Row Z-score
AM - 178 metabolites
Fig. 2. mTOR regulates lung APC survival via a metabolic mechanism.Lung from WT (black) or mTORDAPC (red) mice was examined by flowcytometry and by cellular metabolomic profiling. (A) Histograms showrepresentative staining of Live/Dead Aqua on indicated ex vivo populationsfrom WT (gray) and mTORDAPC (red) lung. (B) PCA plot shows distinctclustering of lung and splenic APC metabolomes from WTmice. (C) Heatmaps show differentially abundant metabolite features between WTandmTORDAPC subsets.The metabolite numbers include redundant mass spectral
peaks. (D) Dot graph showsmetabolic pathways distinctly perturbed bymTORdeficiency, with amino acid metabolism pathways highlighted in red. Dotsize relates to the number of differentially expressed metabolites. (E) Networkanalysis reveals a higher representation of tentative amino acid metaboliteswithin the mTORDAPC CD103+ DC subset. Each link is from a known metabolicreaction.The network and tentative metabolite annotation was produced bythe Mummichog software. Data represent three or more independentexperiments or two to three biological replicates.
RESEARCH | RESEARCH ARTICLEon M
arch 6, 2019
http://science.sciencemag.org/
Dow
nloaded from
accumulation of lung surfactant protein (Fig.5C), and increased debris and “foamy” macro-phages in BAL (Fig. 5D). Increasedproteinaceousmatter was also evident in lung preparations byflow cytometry (Fig. 5E). These data representhallmark features of PAP disease (33), represent-ing a first link between mTOR signaling andPAP. We next determined whether functionalloss of AMs also contributes to neutrophilic lunginflammation. Using a previously described pro-tocol (34), we observed ~75% depletion of AMs3 days after a single intratracheal (i.t.) dose ofclodronate liposomes but not control liposomes(Fig. 5F). After HDM challenge, humoral immu-nity was enhanced when AMs were depleted, inconcordance with the phenotype observed inmTORDAPC mice (Fig. 5G). However, TH17 po-
larization and neutrophilia were not present un-der these conditions (Fig. 5, H and I), consistentwith observations that AMs cannot present anti-gen (28). Thus, absence of AM likely contributesto an enhancedmagnitude of humoral immunityin mTORDAPC mice but cannot account for TH17/neutrophilic allergy.
mTOR deficiency reprogramsinflammatory CD11b+ DCs to promoteneutrophilic allergy
CD11b+ DCs directly promote TH2 allergy afterHDM insult (28, 35) but can also prime TH17immunity when activated by alternative stimuli(22, 36). To address whether mTORDAPC CD11b+
DCs promoted neutrophilic allergy in a domi-nant manner, we first generated mixed chime-
ras where donor WT andmTORDAPC bone marrowwas injected at a 1:10 ratio to allow repopula-tion of CD103+ DC and AM populations by WTcells, whereas ~80% of CD11c+CD11b+ DCs re-mained mTOR-deficient (fig. S15, A and B). HDMpromoted elevated humoral responses and pro-nounced neutrophilia in chimeras (fig. S15, Cand D). Moreover, primed CD11b+ DCs frommTORDAPCmice directly promoted TH17/neutrophilicallergy in WT recipients (fig. S16). Thus, neutro-philic inflammation was dominantly conferredby mTORDAPC CD11b+ DCs.It was recently shown that mice deficient in
Kruppel-like factor 4 (Klf4) have reduced fre-quencies of the Sirpa+HSA+ subset in lung CD11b+
DCs and display impaired TH2 responses to HDM(37).We thus investigated howmTORDAPC CD11b+
Sinclair et al., Science 357, 1014–1021 (2017) 8 September 2017 4 of 8
d0, 2, 4 d7, 9, 11 d14, 15, 16
Bleed:d16
Analysis:d17
1
10
100
1000
10000
100000
1
10
100
WTN
aive
mTOR
APCNaiv
eWT
mTOR
APC
HDM-specific Ig G1
A.U
.
ng/m
L
Total IgE
0.0
0.5
1.0
1.5
2.0
2.5
0.0
0.5
1.0
1.5
MedLN
IL-1
7A+
%of
CD
4
0
1
2
3
Lung
0
5
10
15
20
0
5
10
15
20
0
10
20
30
IL-4
+%
of C
D4
IL-1
7A+
%of
CD
4IL
-4+
%of
CD
4
IL-1
7+
%of
CD
4IL
-4+
%of
CD
4
CD
44
IL-4
4.9
WT mTOR APC
0.9
CD
44
IL-17A
3.5 19.1
BAL
CD
44
IL-4
WT mTOR APC
CD
44
IL-17A
26.1 5.4
7.1 33.7
WT
WTmTOR APC
mTOR APC
WTN
aive
mTOR
APCNaiv
eWT
mTOR
APC
0
20
40
60
80
0
10
20
30
Sig
lec-
F
Ly-6G
73.1
WT mTOR APC
41.6
Lung
BAL
0
20
40
60
80
100
Eos
inop
hils
% o
f CD
11b+
Eos
inop
hils
% o
f CD
11b+
Neu
trop
hils
% o
f CD
11b+
Neu
trop
hils
% o
f CD
11b+
0
5
10
15
20
25
Sig
lec-
F
Ly-6G
8.5 27.2
97.1
1.1
59.2
35.9
**** *
*
****
*
****
***
****
*****
**** *
25 µg House dust mite extract. i.n.
Fig. 3. mTOR ablation in APCs results in neutrophilic lung inflamma-tion. House dust mite (HDM) extract was administered to WT (black)or mTORDAPC (red) mice. (A) Diagram shows the allergen administration andanalysis schedule. i.n., intranasal. (B) Scatter plots show serum antibodytiters in indicated mouse strains. (C) Bar charts show the frequency of
CD4+IL-4+ TH2 cells or CD4+IL-17A+ TH17 cells in indicated organs. Contourplots show representative flow cytometric data. (D) Bar charts show thefrequency of CD11b+Siglec-F+ eosinophils or CD11b+Ly-6G+ neutrophils.Pseudocolor plots show representative flow cytometric data. Data representthree or more independent experiments.
RESEARCH | RESEARCH ARTICLEon M
arch 6, 2019
http://science.sciencemag.org/
Dow
nloaded from

lung DCs differentially responded to allergy.HDMwas instilled i.t., andmice were examinedafter 3 days. mTORDAPC CD11b+ migratory DCsaccumulated with enhanced frequency in medias-tinal lymph node (MedLN) (fig. S17A), and cellularinflammationwas enhanced in the lung (fig. S17B).During allergic airway inflammation, a distinctCD11b+ Csf-1–dependent inflammatory DC popu-lation develops from monocytes (28, 38). Inflam-
matory DCs could be identified in allergic lungbased on their surface CD11c+MHC-II+CD11b+
phenotype and Csf1 dependence (fig. S18, A andB) (28) andwere elevated inmTORDAPCmice (Fig.6A). Lung inflammatory DCs were confirmed tobe distinct from lung-resident interstitial macro-phages, AMs, and classical DCs. They exhibitedlower expression of F4/80, higher expression ofMHC-II and CD11c compared to interstitial mac-
rophages (fig. S18C), lower Siglec-F expression thanAMs (fig. S18D), and high expression of CD64 andLy6C relative to resident CD11b+ DCs (fig. S18E).ComparedwithWT,mTORDAPC inflammatoryDCshad higher expression of lineage-associatedmarkers CD64 and Ly6C and elevated CD80and CD86 costimulatorymolecule expression (fig.S18, E and F), consistent with a more progressivedifferentiation/activation status. To directly testthe requirement for inflammatory DCs in TH17/neutrophilic inflammation, we ablated this pop-ulation by administering aCsf1r neutralizing anti-bodies, which reverted mTORDAPC allergy to TH2/eosinophilic modality (Fig. 6B and fig. S19).Given the observed mTOR-dependent meta-
bolic phenotypes in steady-state lung APCs, weasked whether there was a metabolic basis forthe TH17 allergic phenotype. Despite minimaldifferences between resting classical CD11b+ DCsin lungs of WT and mTORDAPC mice, there was astriking perturbation in the metabolome of in-flammatory DCs (fig. S20). In addition to differ-ences in amino acid metabolism found in otherDC subsets, we detected elevated fatty acid (FA)metabolites (Fig. 6C). mTOR inhibition in BMDCscan enhance fatty acid oxidation (FAO) and there-by regulate DC life-span/cytokine expression pro-files (39, 40). However, a physiological role forthis mechanism in primary DCs has not beendescribed. To directly investigate whether ele-vated FAO underlies enhanced inflammatoryDC activity, we treated mTORDAPC mice withetomoxir, an inhibitor of the rate-limiting FAOenzyme carnitine palmitoyltransferase 1 (Cpt1)(41). Etomoxir significantly reduced the activa-tion phenotype of mTORDAPC inflammatory DCswithout affecting WT (Fig. 6D) and also reducedTH17 polarization in mTORDAPC lung (Fig. 6E).These observations are consistent with a modelin which mTOR deletion in inflammatory lungDCs increases FAO to promote TH17-polarizingactivity.Finally, we investigated whether dysregulated
cytokine production by inflammatory DCs influ-ences allergic polarity. The proinflammatory cy-tokines IL-6 and IL-1b function upstream of IL-23to promote a TH17-polarizing cascade. Analysisof CD11b+ DCs in lung and MedLN 3 days afteradministration of HDM revealed evidence ofelevated IL-12/23p40, IL-6, and IL-1b, all ofwhich are associated with TH17 polarization andneutrophilia (fig. S21, A and B) (29). IL-23 neu-tralization reverted lung neutrophilia toward aneosinophilic phenotype (Fig. 6F), concomitantwith restoration in T cells of TH2 polarity (fig.S21C), identifying this cytokine as a key immu-nological player in mTORDAPC-dependent neu-trophilic inflammation.
Discussion
Here, we demonstrate a striking heterogeneity inthe metabolic profiles of APCs in distinct tissuesand reveal a key role for mTOR in programmingthe homeostasis and function of APC subsets inthe lung. In the steady state, mTORDAPC miceexhibited tissue-dependent phenotypes with re-duced numbers of AMs and CD103 DCs in the
Sinclair et al., Science 357, 1014–1021 (2017) 8 September 2017 5 of 8
WTBatf3-/-
IFN
+ %
of C
D8+
PMA + Ionomycin
NP366-374
MedLN Lung
IFN
+ %
of C
D8+
WT mTOR APCMedLN Lung
CD
44
IFN
18.8
WT mTOR APC
22.013.3 12.4
CD
44
IFN
0.1 1.3<0.1 0.5
****
0
5
10
15
20
25
MedLN
****
0
5
10
15
20
25
Lung
0.0
0.5
1.0
1.5
0
0
1
1
0.0
0.5
1.0
1.5
*
*ns
1
10
100
1000
10000
100000
0.1
1
10
100
WT
Batf3-/-
WT
Batf3-/-
A.U
.
ng/m
L
0
2
4
6
8
IL-1
7A+ %
of C
D4
WT Batf3-/-
CD
103
CD11b
CD
8
CD11b
Lung
Spleen
6.3
69.1
0.7
79.0
23.7 6.0
67.3 86.6
0.0
0.5
1.0
1.5
2.0
2.5
IL-4
+ %
of C
D4
Lung
BAL
0
20
40
60
80
0
10
20
30
0
20
40
60
80
100
0
5
10
15
20
25
Eos
inop
hils
%
of C
D11
b+
Neu
troph
ils
% o
f CD
11b+
Eos
inop
hils
%
of C
D11
b+
Neu
troph
ils
% o
f CD
11b+
IL-1
7A+ %
of C
D4
IL-4
+ %
of C
D4
0
10
20
30
0
5
10
15
HDM-specific IgG1Total IgE
*
Fig. 4. mTOR-dependent CD103+ DCs are dispensable for neutrophilic lung inflammation butrequired for antiviral immunity. (A) Flumist Quadrivalent vaccine (25 mL) was administeredintranasally to WT (black) or mTORDAPC mice (red). Vaccine response was examined 7 days afterinfection. Bar charts show the frequency of CD8+IFNg+ cells in indicated organs. Contour plotsshow representative flow cytometric data. (B to E) HDM was chronically administered to WT(black) and Batf3−/− (gray) mice. (B) Contour plots show the absence of CD103+ and CD8a+ DCsin lung and spleen of Batf3−/− mice. (C) Serum enzyme-linked immunosorbent assays (ELISAs)showing total IgE or HDM-specific IgG1 antibody titers. (D) Bar charts show TH2 (IL-4+) andTH17 (IL-17A+) frequencies in lung and BAL. (E) Bar charts show frequencies of eosinophils andneutrophils in lung and BAL. (A) Data represent three or more independent experiments. [(B) to(E)] n = 5 mice per group.
RESEARCH | RESEARCH ARTICLEon M
arch 6, 2019
http://science.sciencemag.org/
Dow
nloaded from

lung and skin, but not elsewhere, unlike moreglobal phenotypes observed when GM-CSF orFlt3l signaling is impaired (14, 18, 38). Theseeffects were mediated by Raptor-dependentmTORC1 signaling but, surprisingly, were inde-pendent of translational regulation of mRNA, thecanonical signaling pathway downstream ofmTOR. Instead, our data reveal a role for Srebp1/2 signaling downstream of mTOR in homeosta-sis of lung APCs in the steady state (fig. S10). Theselective effects of mTOR deficiency in CD103DCs in the lung and skinwere surprising, becausethe development of this DC subset in diverse tis-sues is controlled by the transcription factor Batf3.Thus, these results suggest that the homeostasis
of DCs in tissues is orchestrated by the superim-position of ametabolic programon the transcrip-tional network that regulates development.In addition to these effects in the steady state,
mTOR deficiency also altered the character ofallergic inflammation induced by lung CD11b+
DCs, skewing it toward the TH17/neutrophilicphenotype. This phenotype closely parallels as-pects of human disease, in which neutrophiliaassociates with higher clinical severity andworseprognosis in asthma (29). Interestingly, the al-lergic phenotype observed in mTORDAPC micewas associated with elevated immunoglobulinE (IgE). Such elevation in serum IgE is alsoobserved in neutrophilic asthma patients (42)
and can be enhanced by IL-23 (43), which isconsistent with the IL-23 dependence of themTORDAPC neutrophilic inflammation pheno-type. In normal circumstances, mTOR signal-ing in activated BMDCs suppresses oxidativephosphorylation and is in part responsible for aswitch to glycolytic metabolism, which rapidlydepletes intracellular energy reserves and as-sociates with a shortened cellular life span (1).In contrast, mTOR inhibition allows BMDCs tosupply their energetic demands through a combi-nation of glycolysis and FAO, increasing cellsurvival and proinflammatory phenotypes (39).We observed elevated FAO and increased pro-duction of several proinflammatory cytokines in
Sinclair et al., Science 357, 1014–1021 (2017) 8 September 2017 6 of 8
Fig. 5. mTOR ablation inAMs results in PAP andenhances the antibodymagnitude but not modal-ity of allergy. (A toC) Images show histo-pathological sections of WTor mTORDAPC lung stainedwith (A) hematoxylin andeosin, (B) PAS, (C) immuno-histochemical antibodiesagainst surfactant protein D.(D) BAL cellular fractionswere prepared by cytospinand analyzed after Diff-Quikstaining. Slides are shown at[(A) to (C)] x200 magnifica-tion, where scale bars repre-sent 100 mm and (D) x400magnification, where scalebars represent 50 mm.(E) Pseudocolor plots showthe frequency of Live/DeadAqua+ FSClo (dead cell/debris) events as determinedby flow cytometry. (F toI) HDM was administered toindicated groups for 17 days.Mice were treated with indi-cated clodronate or controlliposome on days –3, 3, and10. (F) AM frequency on day0 before HDM administration.(G) Serum ELISAs showingtotal IgE or HDM-specific IgG1antibody titers. (H) Barcharts show the frequency ofIL-4+ and IL-17+ T cells inindicated groups and organs.(I) Bar charts show the fre-quency of eosinophils andneutrophils in indicatedgroups and organs; pseudo-color plots show representa-tive data. Data represent[(A) to (D)] three or moreslides from two or morebiological replicates, [(E) to(I)] two or more representa-tive experiments.
WT mTOR APCL/
D A
qua
FSC
24.7 52.8
WT mTOR APC
0
2
4
6
8
WT
WT
+ Con
trol
WT
+ Clod
.
**
WT mTOR APC
AM
% C
D45
+
WT + Control WT + ClodronatemTORAPC
0.0
0.1
0.2
0.3
0.4
0.5
Lung
BAL
IL-4
+ %
of C
D4
IL-4
+ %
of C
D4
0
10
20
30
40
*******
0
5
10
15
20
IL-1
7+ %
of C
D4
IL-1
7+ %
of C
D4
0
10
20
30
40
*** **
* *
0
20
40
60
Eos
inop
hils
% C
D11
b+
0
20
40
60
80
100 *** ***
0
10
20
30
40
Neu
trop
hils
% C
D11
b+N
eutr
ophi
ls %
CD
11b+
0
10
20
30
40
50
** ***
Eos
inop
hils
% C
D11
b+
******
Sig
lec-
F
Ly-6G
mTOR APC WT + Clod.
Sig
lec-
F
Ly-6G
11.4
18.6
30.9
32.0
74.3
5.3
23.6
7.9
100
1000
10000
100000
1
10
100
ng/m
L
AU
Total IgE HDM-specific IgG1
WT
+ Con
trol
WT
+ Clod
.
WT
+ Con
trol
WT
+ Clod
.
***
**
***
RESEARCH | RESEARCH ARTICLEon M
arch 6, 2019
http://science.sciencemag.org/
Dow
nloaded from

mTORDAPC lung. Indeed one of these cytokines,IL-23, plays an obligate role in TH17/neutrophilicinflammation. Together, our study reveals a keyrole for mTOR in programming the homeostasisand function of APCs in the lung. In the steadystate, mTOR supports accumulation of lung sub-sets by promoting lipid synthesis (anabolism)(fig. S22A). In the context of allergic inflamma-tion, mTOR restrains catabolic processes suchas FAO, preventing excessive inflammation (fig.S22B). The results herein identify tissue-restrictedmetabolic adaptations of APCs as a critical deter-minant of immune regulation, raising the prospectof metabolic reprogramming of such tissue-resident APCs for therapeutic benefit in variousinflammatory disorders.
REFERENCES AND NOTES
1. E. J. Pearce, B. Everts, Nat. Rev. Immunol. 15, 18–29(2015).
2. B. Pulendran, Annu. Rev. Immunol. 33, 563–606 (2015).3. T. D. Querec et al., Nat. Immunol. 10, 116–125 (2009).4. R. Ravindran et al., Science 343, 313–317 (2014).5. R. Ravindran et al., Nature 531, 523–527 (2016).6. N. Sukhbaatar, M. Hengstschläger, T. Weichhart, Trends
Immunol. 37, 778–789 (2016).7. M. Laplante, D. M. Sabatini, Cell 149, 274–293 (2012).8. F. J. Dumont, M. J. Staruch, S. L. Koprak, M. R. Melino,
N. H. Sigal, J. Immunol. 144, 251–258 (1990).9. R. Keating et al., Nat. Immunol. 14, 1266–1276 (2013).10. K. Araki et al., Nature 460, 108–112 (2009).11. R. Colina et al., Nature 452, 323–328 (2008).12. W. Cao et al., Nat. Immunol. 9, 1157–1164 (2008).13. T. Weichhart et al., Immunity 29, 565–577 (2008).14. T. Sathaliyawala et al., Immunity 33, 597–606 (2010).15. B. Kellersch, T. Brocker, Blood 121, 298–307 (2013).16. S. P. Nobs et al., Immunity 43, 674–689 (2015).17. M. Haidinger et al., J. Immunol. 185, 3919–3931 (2010).18. H. J. McKenna et al., Blood 95, 3489–3497 (2000).19. D. Vremec et al., Eur. J. Immunol. 27, 40–44 (1997).20. S. P. Nobs et al., Immunity 43, 674–689 (2015).21. E. L. Gautier et al., Nat. Immunol. 13, 1118–1128 (2012).22. A. Schlitzer et al., Immunity 38, 970–983 (2013).23. B. T. Edelson et al., J. Exp. Med. 207, 823–836 (2010).24. D. Eberlé, B. Hegarty, P. Bossard, P. Ferré, F. Foufelle,
Biochimie 86, 839–848 (2004).25. T. Porstmann et al., Cell Metab. 8, 224–236 (2008).26. M. Laplante, D. M. Sabatini, Curr. Biol. 19, R1046–R1052
(2009).27. S. Saglani et al., Am. J. Respir. Cell Mol. Biol. 41, 281–289
(2009).28. M. Plantinga et al., Immunity 38, 322–335 (2013).29. J. F. Alcorn, C. R. Crowe, J. K. Kolls, Annu. Rev. Physiol. 72,
495–516 (2010).30. J. Douwes, P. Gibson, J. Pekkanen, N. Pearce, Thorax 57,
643–648 (2002).31. J. Helft et al., J. Clin. Invest. 122, 4037–4047 (2012).32. J. F. Seymour, J. J. Presneill, Am. J. Respir. Crit. Care Med. 166,
215–235 (2002).33. P. L. Shah, D. Hansell, P. R. Lawson, K. B. Reid, C. Morgan,
Thorax 55, 67–77 (2000).34. S. A. Mathie et al., Allergy 70, 80–89 (2015).35. Y. Gao et al., Immunity 39, 722–732 (2013).36. E. K. Persson et al., Immunity 38, 958–969 (2013).37. R. Tussiwand et al., Immunity 42, 916–928 (2015).38. M. Greter et al., Immunity 36, 1031–1046 (2012).39. E. Amiel et al., J. Immunol. 193, 2821–2830 (2014).40. E. Amiel et al., J. Immunol. 189, 2151–2158 (2012).41. S. M. Houten, R. J. Wanders, J. Inherit. Metab. Dis. 33,
469–477 (2010).42. M. Milovanovic, G. Drozdenko, C. Weise, M. Babina, M. Worm,
J. Invest. Dermatol. 130, 2621–2628 (2010).43. J. Peng, X. O. Yang, S. H. Chang, J. Yang, C. Dong, Cell Res. 20,
62–71 (2010).
ACKNOWLEDGMENTS
We thank V. Bliss and P. Sharma for histological support, G. Tharpand N. Patel for genomics analysis, V. Tran for metabolomics,B. Cervasi and K. Gill for fluorescence-activated cell sorting
Sinclair et al., Science 357, 1014–1021 (2017) 8 September 2017 7 of 8
0
2000
4000
6000
8000
Lung
CD
86 M
FI
CD86
**
Saturated fatty acids beta-oxidation
Purine metabolism
Omega-3 fatty acid metabolism
Unsaturated fatty acid -oxidation
Met, Cys metabolism
Linoleate metabolism
Gly, Ser, Ala, Thr metabolism
Fatty acid oxidation
De Novo fatty acid synthesis
Carnitine shuttle
Arg, Pro metabolism
0
10
20
30
40
Infla
mm
ator
y D
C
% o
f C
D45
+
***
WT
mTOR
APC
WT
naive
0
10
20
30
40
BALLung
0
20
40
60
80
100
0
10
20
30
40
0
50
100
Neu
troph
ils %
of C
D11
b+
Eos
inop
hils
% o
f CD
11b+
Neu
troph
ils %
of C
D11
b+
mTOR APC + Isotype
*****
****
mTOR APC + CSF1r
Tetradecanoyl–CoA
Lauroyl–CoA
3–Oxotetradecanoyl–CoA
trans-Tetradec–2–enoyl–CoA
Palmitoylcarnitine
−! " !#$%&'−()$*+
Metabolite WT mTORΔAPC
Urea group/amino group metabolism
+ +
mTOR APC
7.317.3
Lung
Control Etomoxir
CD
44
IL-17A
0
5
10
15
20
*
Inflammatory DC
n.s.
2 3 4Log10 p
Eos
inop
hils
% o
f CD
11b+
0
10
20
30
40
50
BAL
Lung
0
20
40
60
80
0
10
20
30
40
0
50
100
Eos
inop
hils
%
of C
D11
b+
Neu
troph
ils
% o
f CD
11b+
mTOR APC + IL-12p70
***
***
***
**
mTOR APC + IL-12/23p40
Eos
inop
hils
%
of C
D11
b+
Neu
troph
ils
% o
f CD
11b+
Inflammatory DCWT vs mTOR APC
mTOR APC
mTOR APC + EtxrWT+EtxrWT
IL-1
7A%
of C
D4
Fig. 6. CD11b+-intrinsic mTOR signaling restrains TH17/neutrophilic polarized HDM allergic responses.HDM (75 mg) was administered i.t. to WTand mTORDAPC mice on days 0 and 2. Lungs were analyzed onday 3. (A) Bar chart shows total inflammatory DC cells in lung. (B) HDMwas administered tomTORDAPCmicefor 3 weeks, along with aCsf1r neutralizing monoclonal antibody or control. Bar charts show the frequencyof eosinophils or neutrophils in lung or BAL. (C) Dot graph shows significantly altered metabolic pathwaysbetween WTand mTORDAPC inflammatory DCs, with amino acid pathways highlighted in red and fatty acidmetabolism pathways highlighted in blue. Dot size corresponds to the number of differentially expressedmetabolites for a given pathway.The x axis shows the log10P value. Heatmap shows the relative abundanceof metabolites involved in FAO pathways, based on tentative annotations produced by the Mummichogsoftware. (D)WTandmTORDAPCmicewere treatedwith etomoxir (etxr) andHDM for 3 days. Bar chart showsCD86mean fluorescence intensity (MFI); histogramshows representative flowcytometrydata. (E)mTORDAPC
mice were treated with the Cpt1 inhibitor etomoxir and HDM for 17 days. Bar chart shows expressionof IL-17A+ Tcells in lung; contour plots show representative flow cytometric data. (F) HDM was chronicallyadministered to mTORDAPC mice for 3 weeks, along with IL-12p70 control (gray) or IL-12/23p40 (blue)neutralizing antibodies. Bar charts show the frequency of eosinophils or neutrophils in lung or BAL. Datarepresent two or more independent experiments.
RESEARCH | RESEARCH ARTICLEon M
arch 6, 2019
http://science.sciencemag.org/
Dow
nloaded from

(FACS), and H. Hartweger (The Rockefeller University) andE. Schweighoffer (Francis Crick Institute) for advice on B cell FACSstaining. We also thank C. Wongtrakool for advice and discussionon lung inflammation models and readouts. Finally, we thankPulendran laboratory members for discussion and M. Sinclair forproofreading the manuscript. This work was supported by fundingfrom Action Cycling Atlanta and from the People Programme(Marie Curie Actions) of the European Union’s Seventh FrameworkProgramme (FP7/2007-2013) (C.S.) and from the U.S. National
Institutes of Health (grants R37 DK057665, R37 AI048638, U19AI090023, and U19 AI057266) (B.P.). We are not aware of anyconflicts of interest. Additional data presented in this manuscriptare available in the supplementary materials.
SUPPLEMENTARY MATERIALS
www.sciencemag.org/content/357/6355/1014/suppl/DC1Materials and Methods
Figs. S1 to S22Table S1References (44–58)
14 September 2016; resubmitted 29 March 2017Accepted 22 June 2017Published online 10 August 201710.1126/science.aaj2155
Sinclair et al., Science 357, 1014–1021 (2017) 8 September 2017 8 of 8
RESEARCH | RESEARCH ARTICLEon M
arch 6, 2019
http://science.sciencemag.org/
Dow
nloaded from
allergic inflammationmTOR regulates metabolic adaptation of APCs in the lung and controls the outcome of
Ravindran, Shuzhao Li and Bali PulendranThomas Hagan, Lydia Benitez, Andrei Todor, Deepa Machiah, Timothy Oriss, Anuradha Ray, Steven Bosinger, Rajesh Charles Sinclair, Gayathri Bommakanti, Luiz Gardinassi, Jens Loebbermann, Matthew Joseph Johnson, Paul Hakimpour,
originally published online August 10, 2017DOI: 10.1126/science.aaj2155 (6355), 1014-1021.357Science
, this issue p. 1014; see also p. 973Sciencemetabolic characteristics that control APC development and function.influencing the immunological character of allergic inflammation. Thus, tissues endow resident APCs with distinctiveauthors identified a central role for mTOR in mediating the metabolic adaptation of such tissue-resident APCs by by their transcriptional program, but also by their metabolic state (see the Perspective by Wiesner and Klein). Thesites have distinctive metabolic signatures and that the development and function of these cells are determined not only
demonstrate that APCs at differentet al.pathogen entry, where they act as sentinels of the immune system. Sinclair Antigen-presenting cells (APCs) are scattered throughout the body in lymphoid organs and at the portals of
Metabolic programming of tissue APCs
ARTICLE TOOLS http://science.sciencemag.org/content/357/6355/1014
MATERIALSSUPPLEMENTARY http://science.sciencemag.org/content/suppl/2017/08/09/science.aaj2155.DC1
CONTENTRELATED
http://stm.sciencemag.org/content/scitransmed/9/401/eaam9171.fullhttp://stm.sciencemag.org/content/scitransmed/8/359/359ra131.fullhttp://stm.sciencemag.org/content/scitransmed/8/359/359ra132.fullhttp://stm.sciencemag.org/content/scitransmed/8/362/362ra143.fullhttp://science.sciencemag.org/content/sci/357/6355/973.full
REFERENCES
http://science.sciencemag.org/content/357/6355/1014#BIBLThis article cites 58 articles, 20 of which you can access for free
PERMISSIONS http://www.sciencemag.org/help/reprints-and-permissions
Terms of ServiceUse of this article is subject to the
is a registered trademark of AAAS.Sciencelicensee American Association for the Advancement of Science. No claim to original U.S. Government Works. The title Science, 1200 New York Avenue NW, Washington, DC 20005. 2017 © The Authors, some rights reserved; exclusive
(print ISSN 0036-8075; online ISSN 1095-9203) is published by the American Association for the Advancement ofScience
on March 6, 2019
http://science.sciencem
ag.org/D
ownloaded from


![Intestinal mTOR regulates GLP-1 production in mouse L cells · by enzyme immunoassay and radioimmunoassay, respectively. ... by tissue-specific post-translational processing [1].](https://static.fdocuments.net/doc/165x107/5f0df8b97e708231d43cfca0/intestinal-mtor-regulates-glp-1-production-in-mouse-l-cells-by-enzyme-immunoassay.jpg)