D J INDEXES EPTEMBER CHINA STOCK MARKET IN A GLOBAL PERSPECTIVE
48
Research Report by Sheldon Gao, PhD. Senior Director, Dow Jones Indexes 609-520-4114 [email protected] D OW J ONES I NDEXES CHINA STOCK MARKET IN A GLOBAL PERSPECTIVE S EPTEMBER 2002 Executive Summary China’s stock market has experienced amazing growth since establishing its two exchanges in 1990, although the growth has been uneven and irregular, and the market remains in the early stages of its development. This report seeks to identify the key characteristics of China’s market and how they combine to form the most dynamic and intriguing developing market in the world. The current structure of China’s market is one of its key obstacles to further develop- ment. There are very few stocks that would fit the definition of “blue-chip” trad- ing on China’s mainland exchanges. Whereas most developed markets are domi- nated by a limited number of large-cap stocks, China’s market is cramped by a multitude of small-cap stocks. This feature allows for increased speculation and higher turnover for both investors and indexes, among other problems. A related matter is the reliance of China’s market on external expansion, that is, expansion through the issuance of new shares rather than the appreciation in value of existing stocks. Since these shares generally do not experience sustained growth, often because of market manipulation, they contribute to the dominance of smaller size stocks in China’s market. Ultimately, the current structure is a major obstacle to the creation of viable index-related products in China. Another issue is the fact that, despite the tremendous growth of the stock market, China’s companies are not operating at a high level of profitability. They are plagued by poor earnings and low dividend yields. China’s companies need to increase their profitability if they are to compete in global markets. Finally, government seems to have too much influence on the market. It keeps a tight control on the issuance of IPOs, and, as a result of widespread government hold- ings, many listed companies in China have very low free-float ratios. Meanwhile, due at least in part to the unusual market structure, market manipulation and speculation are common. The solution is simply a matter of strengthening controls in certain areas while relaxing them in others in order to foster an environment in which China’s stock market can continue to thrive.
Transcript of D J INDEXES EPTEMBER CHINA STOCK MARKET IN A GLOBAL PERSPECTIVE
Research Report bySheldon Gao, PhD.Senior Director, Dow [email protected]
DO W JO N E S IN D E X E S
CHINA STOCK MARKET IN A GLOBAL PERSPECTIVE
SE P T E M B E R 2002
Execut ive Summary
China’s stock market has experienced amazing growth since establishing its twoexchanges in 1990, although the growth has been uneven and irregular, and themarket remains in the early stages of its development. This report seeks to identifythe key characteristics of China’s market and how they combine to form the mostdynamic and intriguing developing market in the world.
The current structure of China’s market is one of its key obstacles to further develop-ment. There are very few stocks that would fit the definition of “blue-chip” trad-ing on China’s mainland exchanges. Whereas most developed markets are domi-nated by a limited number of large-cap stocks, China’s market is cramped by amultitude of small-cap stocks. This feature allows for increased speculation andhigher turnover for both investors and indexes, among other problems.
A related matter is the reliance of China’s market on external expansion, that is,expansion through the issuance of new shares rather than the appreciation invalue of existing stocks. Since these shares generally do not experience sustainedgrowth, often because of market manipulation, they contribute to the dominanceof smaller size stocks in China’s market. Ultimately, the current structure is amajor obstacle to the creation of viable index-related products in China.
Another issue is the fact that, despite the tremendous growth of the stock market,China’s companies are not operating at a high level of profitability. They areplagued by poor earnings and low dividend yields. China’s companies need toincrease their profitability if they are to compete in global markets.
Finally, government seems to have too much influence on the market. It keeps a tightcontrol on the issuance of IPOs, and, as a result of widespread government hold-ings, many listed companies in China have very low free-float ratios. Meanwhile,due at least in part to the unusual market structure, market manipulation andspeculation are common. The solution is simply a matter of strengthening controlsin certain areas while relaxing them in others in order to foster an environment inwhich China’s stock market can continue to thrive.
DO W JO N E S IN D E X E S
China Stock Market in a Global Perspective
September 2002
2
CON
TEN
TSCH
ARTS
AND
TAB
LES
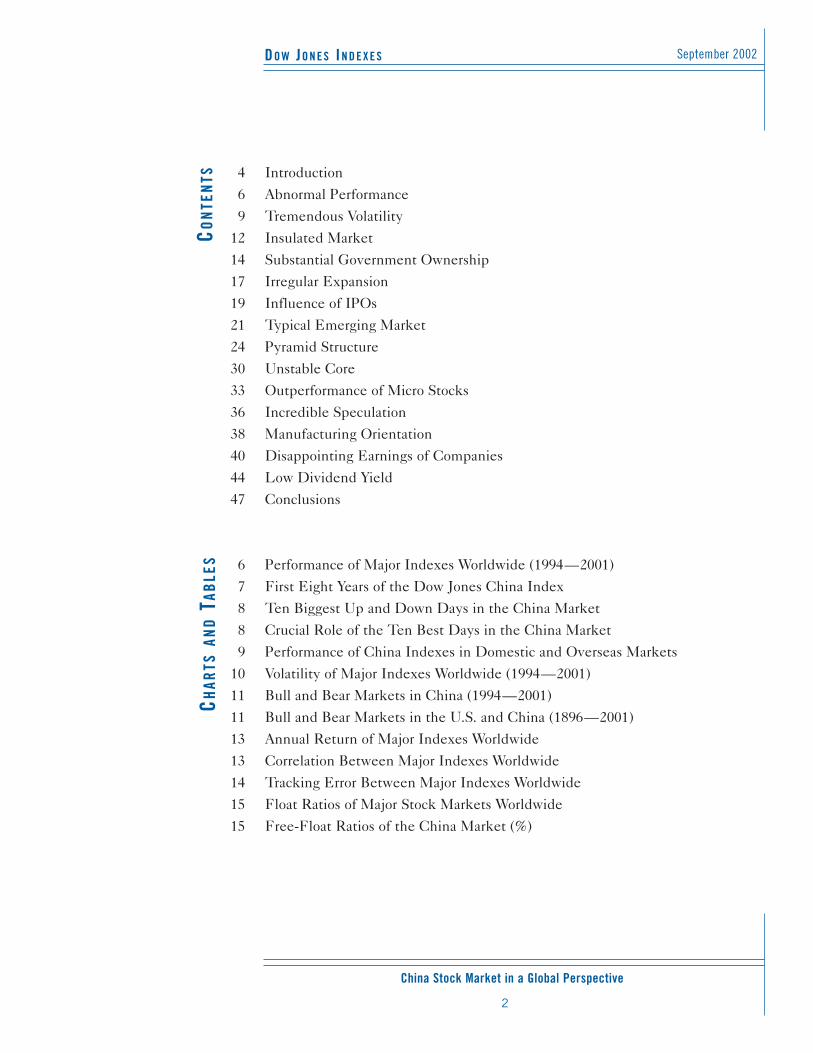
4 Introduction6 Abnormal Performance9 Tremendous Volatility
12 Insulated Market 14 Substantial Government Ownership 17 Irregular Expansion 19 Influence of IPOs 21 Typical Emerging Market24 Pyramid Structure30 Unstable Core33 Outperformance of Micro Stocks36 Incredible Speculation38 Manufacturing Orientation40 Disappointing Earnings of Companies44 Low Dividend Yield47 Conclusions
6 Performance of Major Indexes Worldwide (1994—2001)7 First Eight Years of the Dow Jones China Index8 Ten Biggest Up and Down Days in the China Market 8 Crucial Role of the Ten Best Days in the China Market9 Performance of China Indexes in Domestic and Overseas Markets
10 Volatility of Major Indexes Worldwide (1994—2001)11 Bull and Bear Markets in China (1994—2001)11 Bull and Bear Markets in the U.S. and China (1896—2001)13 Annual Return of Major Indexes Worldwide 13 Correlation Between Major Indexes Worldwide14 Tracking Error Between Major Indexes Worldwide15 Float Ratios of Major Stock Markets Worldwide15 Free-Float Ratios of the China Market (%)
DO W JO N E S IN D E X E S
China Stock Market in a Global Perspective
September, 2002
3
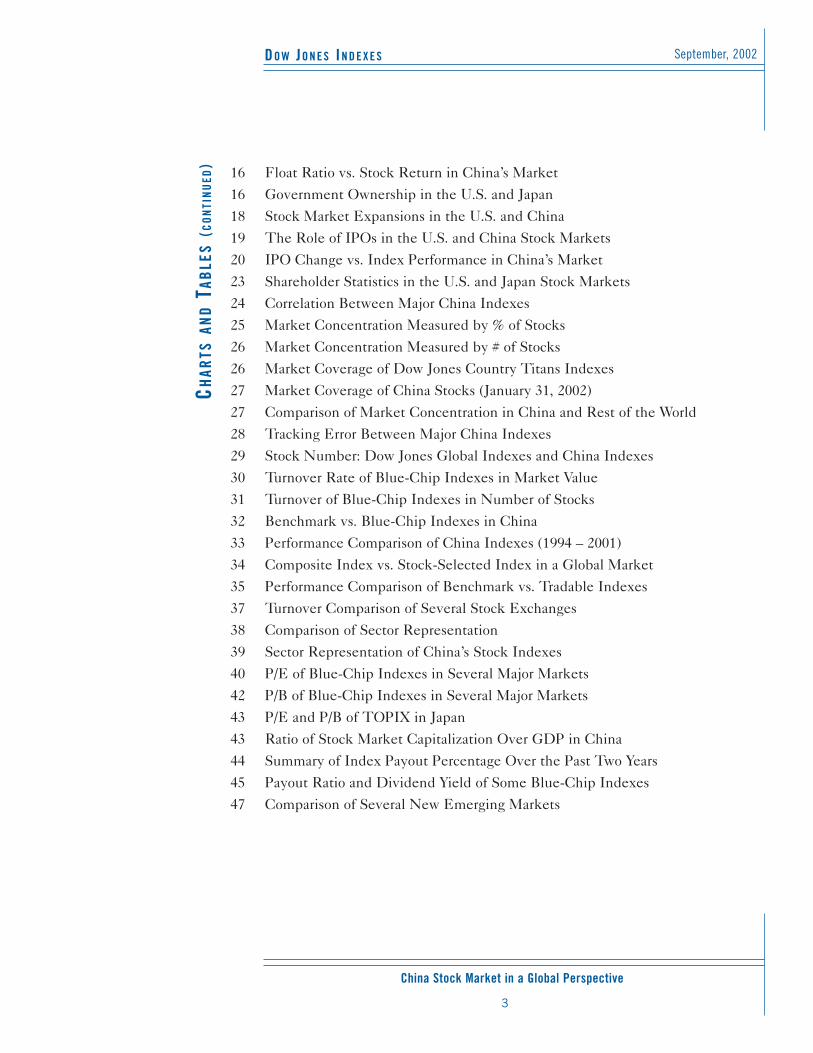
16 Float Ratio vs. Stock Return in China’s Market16 Government Ownership in the U.S. and Japan 18 Stock Market Expansions in the U.S. and China 19 The Role of IPOs in the U.S. and China Stock Markets20 IPO Change vs. Index Performance in China’s Market23 Shareholder Statistics in the U.S. and Japan Stock Markets24 Correlation Between Major China Indexes25 Market Concentration Measured by % of Stocks 26 Market Concentration Measured by # of Stocks 26 Market Coverage of Dow Jones Country Titans Indexes 27 Market Coverage of China Stocks (January 31, 2002)27 Comparison of Market Concentration in China and Rest of the World28 Tracking Error Between Major China Indexes29 Stock Number: Dow Jones Global Indexes and China Indexes30 Turnover Rate of Blue-Chip Indexes in Market Value 31 Turnover of Blue-Chip Indexes in Number of Stocks 32 Benchmark vs. Blue-Chip Indexes in China 33 Performance Comparison of China Indexes (1994 – 2001)34 Composite Index vs. Stock-Selected Index in a Global Market35 Performance Comparison of Benchmark vs. Tradable Indexes37 Turnover Comparison of Several Stock Exchanges 38 Comparison of Sector Representation 39 Sector Representation of China’s Stock Indexes40 P/E of Blue-Chip Indexes in Several Major Markets42 P/B of Blue-Chip Indexes in Several Major Markets43 P/E and P/B of TOPIX in Japan43 Ratio of Stock Market Capitalization Over GDP in China44 Summary of Index Payout Percentage Over the Past Two Years45 Payout Ratio and Dividend Yield of Some Blue-Chip Indexes47 Comparison of Several New Emerging Markets
CHAR
TSAN
DTA
BLE
S(C
ON
TIN
UED
)
DO W JO N E S IN D E X E S
China Stock Market in a Global Perspective
September 2002
4
IntroductionChina’s stock market has experienced tremendous growth and developmentin the ten years since the inceptions of the Shanghai Stock Exchange(December 19, 1990) and the Shenzhen Stock Exchange (December 1, 1990).The number of listed companies reached 1,160 at the end of 2001 — up fromonly 10 companies in the early 1990s — with a total market capitalization of525.6 billion USD. In addition, more than 65 million investment accounts areon record as of the end of 2001.
However, two sets of phenomena have been identified in media reports. Oneis the rapid growth of the stock market: almost 1,200 listed companies,swelling numbers of stock investors and the generally upward trend of thelocal stock indexes all indicate that the basic shape of a large country’s stockmarket has formed. The other set of phenomena also deserves the sameattention: an incomplete corporate-governance structure, inadequate regula-tory capacity, intrinsic structural defects of the market, ferocious marketmanipulators and all kinds of traps. In other words, China’s market is still inthe early stages of development. Building a solid foundation and appropriatestructure is pivotal to the consistent long-term growth of China’s financialmarket.
People have been trying to understand this paradox, but have failed to figureout precisely the growth and decline of these two components. This hasmade it difficult to unravel the mystery of China’s stock market. For instance,how high is the price-to-earning ratio (P/E) in China’s market and what kindof stocks have been the driving power of the market? Furthermore, is China’smarket ready for financial derivative products?
On May 26, 1996, the one-hundredth anniversary of the Dow Jones IndustrialAverage (DJIA), Dow Jones & Company introduced its China index series.The first China index series developed by a global index provider, it consistsof four indexes. The Dow Jones Shanghai and Shenzhen Indexes cover about80% of the market capitalization of the Shanghai and Shenzhen Stockexchanges, respectively. The Dow Jones China Index, the composite of theDow Jones Shanghai and Shenzhen indexes, tracks the general trends inChina’s stock market. The Dow Jones China 88 Index, a tradable indexdesigned specifically for investment products and derivatives, is made up ofthe 88 largest and most liquid stocks. With a base value of 100 as of the basedate of December 31, 1993, for each of its indexes, the series includes onlyclass A shares, which are restricted to domestic Chinese investors.
China’s stock market has grownwith amazing rapidity since the
establishment of its two exchangesin 1990. However, that growth has
been extremely irregular and hasnot followed traditional models of
stock-market development. In manyways, it is still in the early stages
of development.
DO W JO N E S IN D E X E S
China Stock Market in a Global Perspective
September, 2002
5
Since the Dow Jones China index series is constructed according to the samerules and concepts as the Dow Jones Global Indexes (DJGI), it provides aunique platform from which to make a direct comparison between China’smarket and major developed markets worldwide.
Using the DJGI and the Dow Jones China Index series as tools, this articlescrutinizes China’s stock market from a global perspective by comparing itsstructural characteristics and movement patterns with those of other marketsaround the world.
DO W JO N E S IN D E X E S
China Stock Market in a Global Perspective
September 2002
6
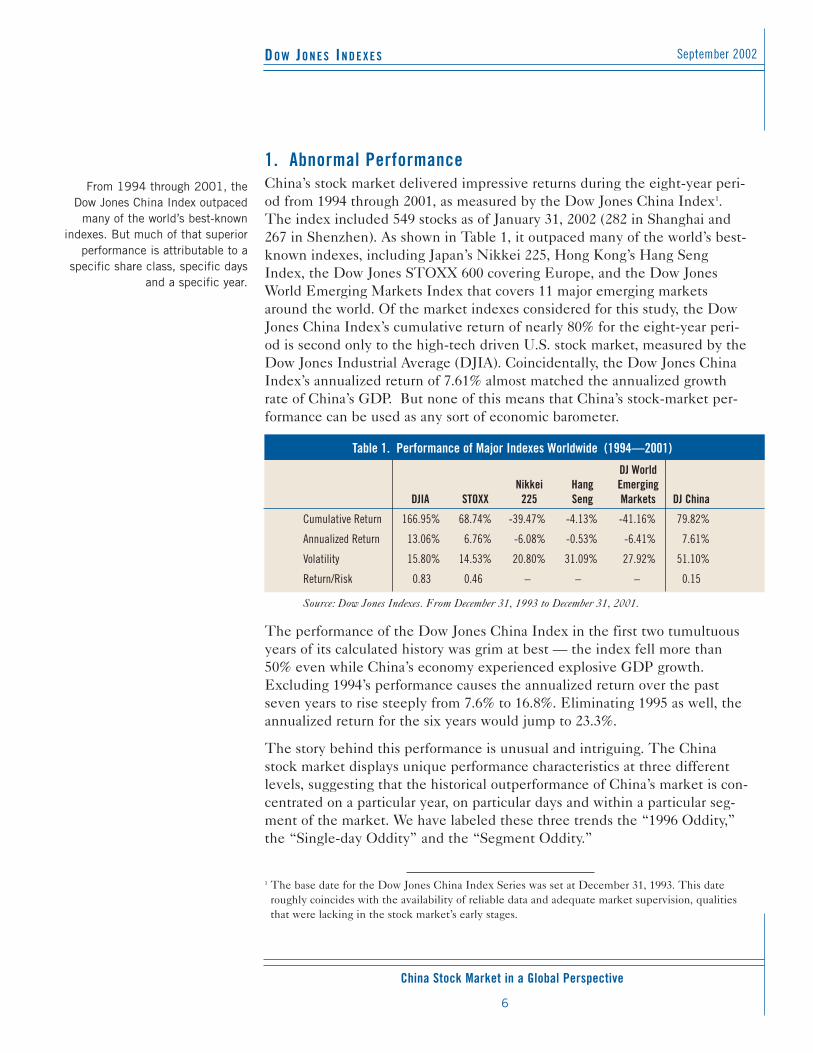
1. Abnormal PerformanceChina’s stock market delivered impressive returns during the eight-year peri-od from 1994 through 2001, as measured by the Dow Jones China Index1.The index included 549 stocks as of January 31, 2002 (282 in Shanghai and267 in Shenzhen). As shown in Table 1, it outpaced many of the world’s best-known indexes, including Japan’s Nikkei 225, Hong Kong’s Hang SengIndex, the Dow Jones STOXX 600 covering Europe, and the Dow JonesWorld Emerging Markets Index that covers 11 major emerging marketsaround the world. Of the market indexes considered for this study, the DowJones China Index’s cumulative return of nearly 80% for the eight-year peri-od is second only to the high-tech driven U.S. stock market, measured by theDow Jones Industrial Average (DJIA). Coincidentally, the Dow Jones ChinaIndex’s annualized return of 7.61% almost matched the annualized growthrate of China’s GDP. But none of this means that China’s stock-market per-formance can be used as any sort of economic barometer.
The performance of the Dow Jones China Index in the first two tumultuousyears of its calculated history was grim at best — the index fell more than50% even while China’s economy experienced explosive GDP growth.Excluding 1994’s performance causes the annualized return over the pastseven years to rise steeply from 7.6% to 16.8%. Eliminating 1995 as well, theannualized return for the six years would jump to 23.3%.
The story behind this performance is unusual and intriguing. The Chinastock market displays unique performance characteristics at three differentlevels, suggesting that the historical outperformance of China’s market is con-centrated on a particular year, on particular days and within a particular seg-ment of the market. We have labeled these three trends the “1996 Oddity,”the “Single-day Oddity” and the “Segment Oddity.”
From 1994 through 2001, the Dow Jones China Index outpaced
many of the world’s best-knownindexes. But much of that superior
performance is attributable to aspecific share class, specific days
and a specific year.
Table 1. Performance of Major Indexes Worldwide (1994—2001)
DJ WorldNikkei Hang Emerging
DJIA STOXX 225 Seng Markets DJ China
Cumulative Return 166.95% 68.74% -39.47% -4.13% -41.16% 79.82%
Annualized Return 13.06% 6.76% -6.08% -0.53% -6.41% 7.61%
Volatility 15.80% 14.53% 20.80% 31.09% 27.92% 51.10%
Return/Risk 0.83 0.46 – – – 0.15
Source: Dow Jones Indexes. From December 31, 1993 to December 31, 2001.
1 The base date for the Dow Jones China Index Series was set at December 31, 1993. This dateroughly coincides with the availability of reliable data and adequate market supervision, qualitiesthat were lacking in the stock market’s early stages.
DO W JO N E S IN D E X E S
China Stock Market in a Global Perspective
September, 2002
7
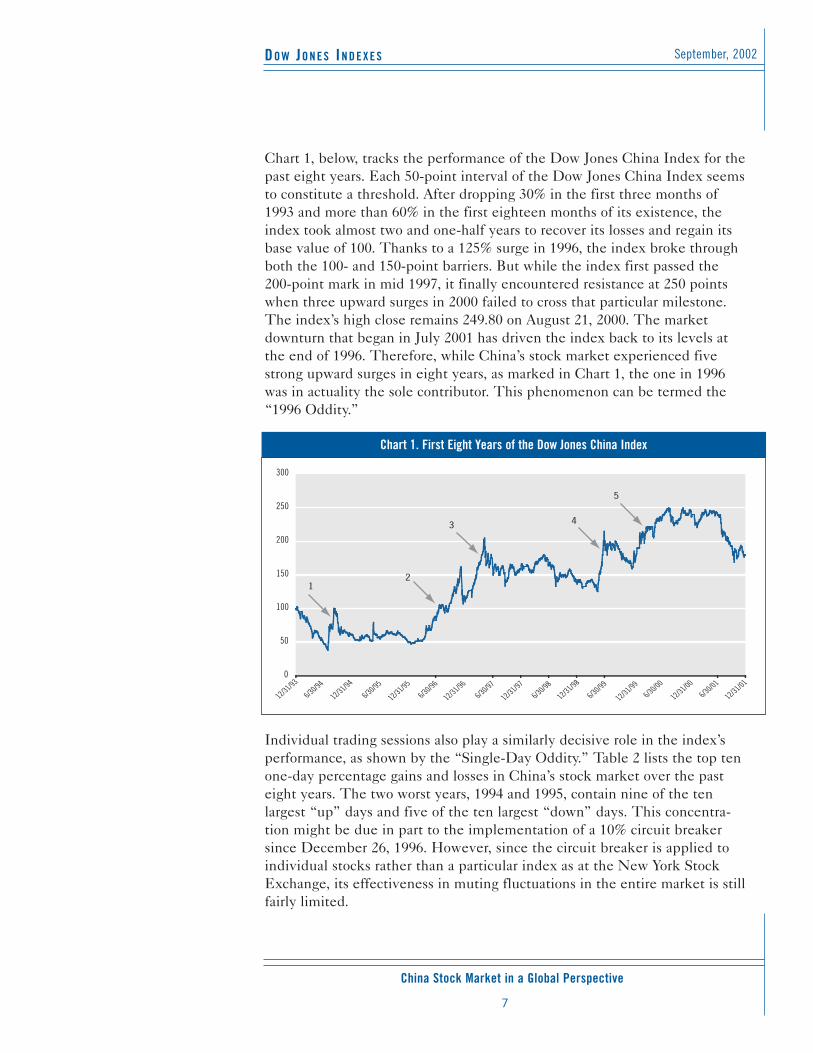
Chart 1, below, tracks the performance of the Dow Jones China Index for thepast eight years. Each 50-point interval of the Dow Jones China Index seemsto constitute a threshold. After dropping 30% in the first three months of1993 and more than 60% in the first eighteen months of its existence, theindex took almost two and one-half years to recover its losses and regain itsbase value of 100. Thanks to a 125% surge in 1996, the index broke throughboth the 100- and 150-point barriers. But while the index first passed the200-point mark in mid 1997, it finally encountered resistance at 250 pointswhen three upward surges in 2000 failed to cross that particular milestone.The index’s high close remains 249.80 on August 21, 2000. The marketdownturn that began in July 2001 has driven the index back to its levels atthe end of 1996. Therefore, while China’s stock market experienced fivestrong upward surges in eight years, as marked in Chart 1, the one in 1996was in actuality the sole contributor. This phenomenon can be termed the“1996 Oddity.”
Individual trading sessions also play a similarly decisive role in the index’sperformance, as shown by the “Single-Day Oddity.” Table 2 lists the top tenone-day percentage gains and losses in China’s stock market over the pasteight years. The two worst years, 1994 and 1995, contain nine of the tenlargest “up” days and five of the ten largest “down” days. This concentra-tion might be due in part to the implementation of a 10% circuit breakersince December 26, 1996. However, since the circuit breaker is applied toindividual stocks rather than a particular index as at the New York StockExchange, its effectiveness in muting fluctuations in the entire market is stillfairly limited.
0
50
100
150
200
250
300
12
5
3 4
12/31/93
6/30/94
12/31/94
6/30/95
6/30/96
6/30/97
6/30/98
12/31/99
12/31/00
12/31/95
12/31/96
12/31/97
12/31/98
6/30/996/30/00
6/30/01
12/31/01
Chart 1. First Eight Years of the Dow Jones China Index
DO W JO N E S IN D E X E S
China Stock Market in a Global Perspective
September 2002
8
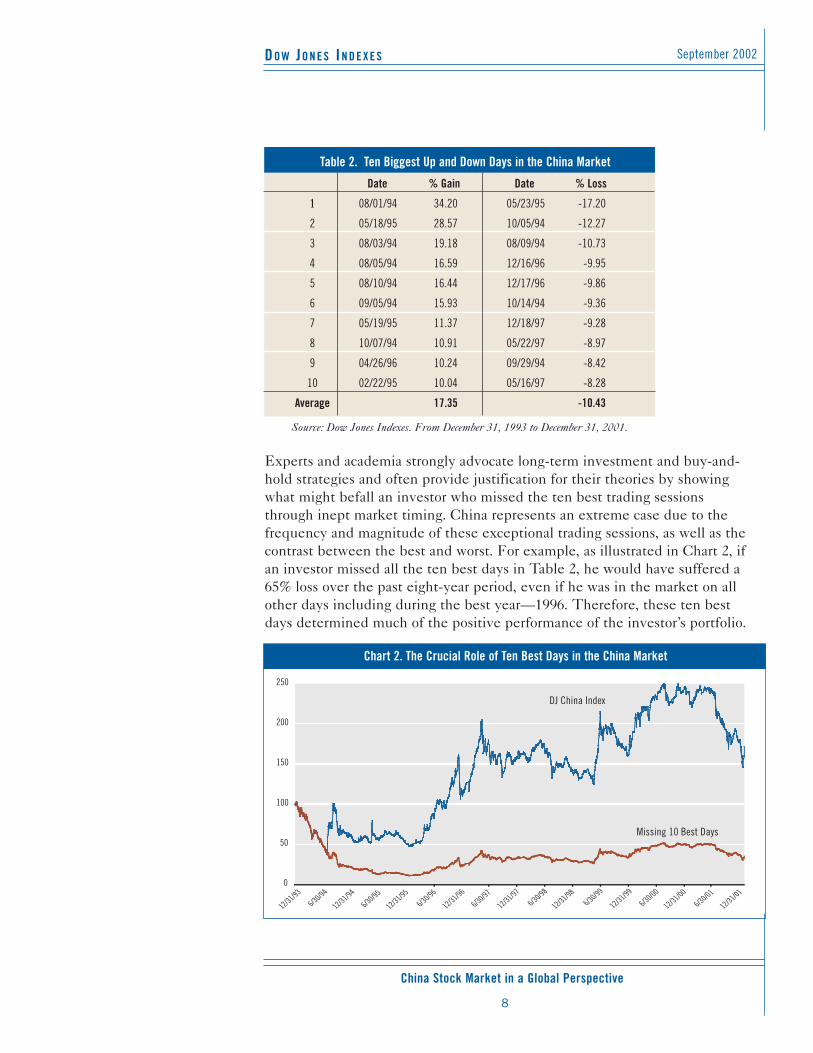
Experts and academia strongly advocate long-term investment and buy-and-hold strategies and often provide justification for their theories by showingwhat might befall an investor who missed the ten best trading sessionsthrough inept market timing. China represents an extreme case due to thefrequency and magnitude of these exceptional trading sessions, as well as thecontrast between the best and worst. For example, as illustrated in Chart 2, ifan investor missed all the ten best days in Table 2, he would have suffered a65% loss over the past eight-year period, even if he was in the market on allother days including during the best year—1996. Therefore, these ten bestdays determined much of the positive performance of the investor’s portfolio.
0
50
100
150
200
250
Missing 10 Best Days
DJ China Index
12/31/93
6/30/94
12/31/94
6/30/956/30/96
6/30/976/30/98
6/30/99
6/30/00
6/30/01
12/31/95
12/31/96
12/31/97
12/31/98
12/31/99
12/31/00
12/31/01
Chart 2. The Crucial Role of Ten Best Days in the China Market
Table 2. Ten Biggest Up and Down Days in the China Market
Date % Gain Date % Loss
1 08/01/94 34.20 05/23/95 -17.20
2 05/18/95 28.57 10/05/94 -12.27
3 08/03/94 19.18 08/09/94 -10.73
4 08/05/94 16.59 12/16/96 -9.95
5 08/10/94 16.44 12/17/96 -9.86
6 09/05/94 15.93 10/14/94 -9.36
7 05/19/95 11.37 12/18/97 -9.28
8 10/07/94 10.91 05/22/97 -8.97
9 04/26/96 10.24 09/29/94 -8.42
10 02/22/95 10.04 05/16/97 -8.28
Average 17.35 -10.43
Source: Dow Jones Indexes. From December 31, 1993 to December 31, 2001.
DO W JO N E S IN D E X E S
China Stock Market in a Global Perspective
September, 2002
9
China’s stock market displayedextreme volatility during the eight
years from 1994 through 2001: anaverage of 51.10% for the Dow
Jones China Index versus 15.80%for the Dow Jones IndustrialAverage. Bear markets also
occurred much more frequently inthe Dow Jones China Index but
were of shorter duration than thoseregistered by the DJIA.
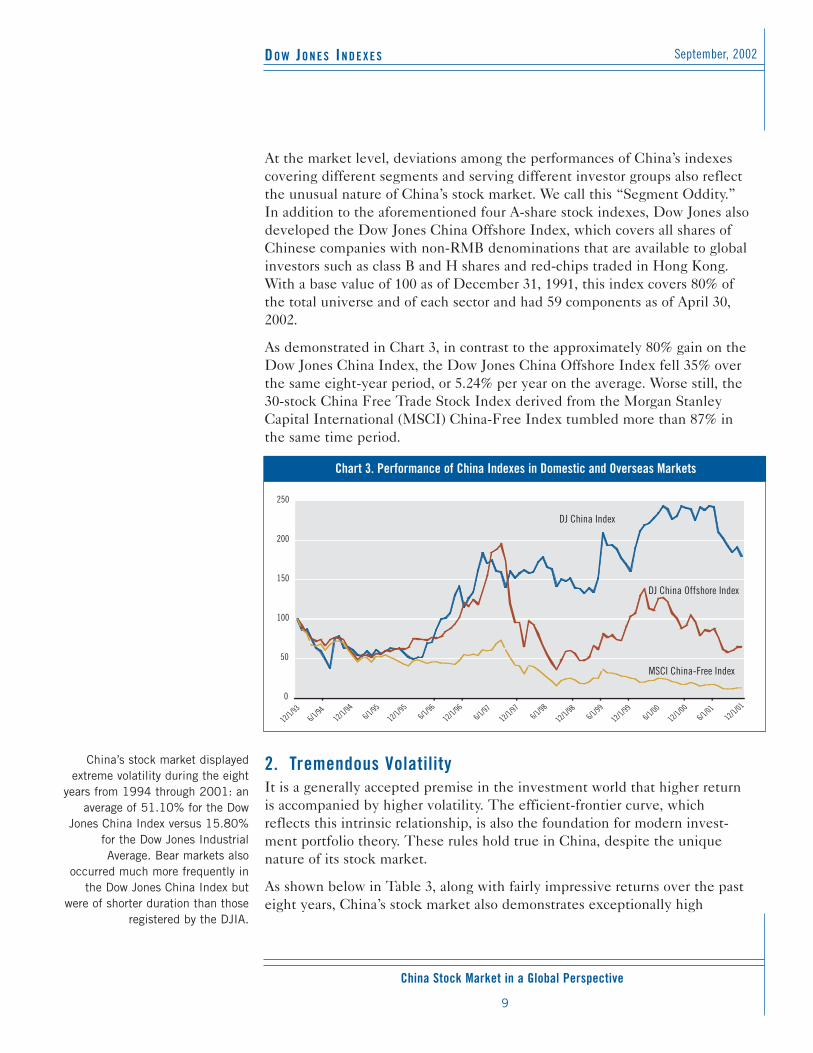
At the market level, deviations among the performances of China’s indexescovering different segments and serving different investor groups also reflectthe unusual nature of China’s stock market. We call this “Segment Oddity.”In addition to the aforementioned four A-share stock indexes, Dow Jones alsodeveloped the Dow Jones China Offshore Index, which covers all shares ofChinese companies with non-RMB denominations that are available to globalinvestors such as class B and H shares and red-chips traded in Hong Kong.With a base value of 100 as of December 31, 1991, this index covers 80% ofthe total universe and of each sector and had 59 components as of April 30,2002.
As demonstrated in Chart 3, in contrast to the approximately 80% gain on theDow Jones China Index, the Dow Jones China Offshore Index fell 35% overthe same eight-year period, or 5.24% per year on the average. Worse still, the30-stock China Free Trade Stock Index derived from the Morgan StanleyCapital International (MSCI) China-Free Index tumbled more than 87% inthe same time period.
2. Tremendous Volatility It is a generally accepted premise in the investment world that higher returnis accompanied by higher volatility. The efficient-frontier curve, whichreflects this intrinsic relationship, is also the foundation for modern invest-ment portfolio theory. These rules hold true in China, despite the uniquenature of its stock market.
As shown below in Table 3, along with fairly impressive returns over the pasteight years, China’s stock market also demonstrates exceptionally high
12/1/936/1/94
12/1/946/1/95
6/1/966/1/97
6/1/98
6/1/996/1/00
6/1/0112/1/95
12/1/96
12/1/97
12/1/98
12/1/99
12/1/0012/1/01
0
50
100
150
200
250
DJ China Index
MSCI China-Free Index
DJ China Offshore Index
Chart 3. Performance of China Indexes in Domestic and Overseas Markets
DO W JO N E S IN D E X E S
China Stock Market in a Global Perspective
September 2002
10
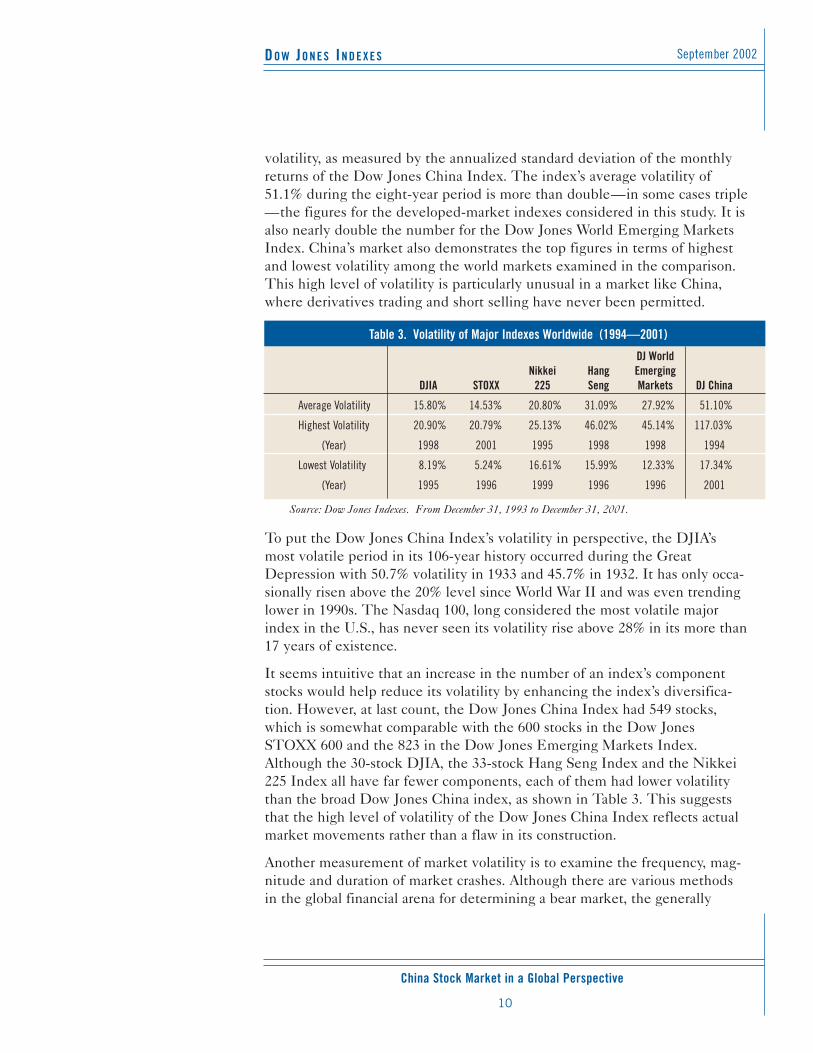
volatility, as measured by the annualized standard deviation of the monthlyreturns of the Dow Jones China Index. The index’s average volatility of51.1% during the eight-year period is more than double—in some cases triple—the figures for the developed-market indexes considered in this study. It isalso nearly double the number for the Dow Jones World Emerging MarketsIndex. China’s market also demonstrates the top figures in terms of highestand lowest volatility among the world markets examined in the comparison.This high level of volatility is particularly unusual in a market like China,where derivatives trading and short selling have never been permitted.
To put the Dow Jones China Index’s volatility in perspective, the DJIA’smost volatile period in its 106-year history occurred during the GreatDepression with 50.7% volatility in 1933 and 45.7% in 1932. It has only occa-sionally risen above the 20% level since World War II and was even trendinglower in 1990s. The Nasdaq 100, long considered the most volatile majorindex in the U.S., has never seen its volatility rise above 28% in its more than17 years of existence.
It seems intuitive that an increase in the number of an index’s componentstocks would help reduce its volatility by enhancing the index’s diversifica-tion. However, at last count, the Dow Jones China Index had 549 stocks,which is somewhat comparable with the 600 stocks in the Dow JonesSTOXX 600 and the 823 in the Dow Jones Emerging Markets Index.Although the 30-stock DJIA, the 33-stock Hang Seng Index and the Nikkei225 Index all have far fewer components, each of them had lower volatilitythan the broad Dow Jones China index, as shown in Table 3. This suggeststhat the high level of volatility of the Dow Jones China Index reflects actualmarket movements rather than a flaw in its construction.
Another measurement of market volatility is to examine the frequency, mag-nitude and duration of market crashes. Although there are various methodsin the global financial arena for determining a bear market, the generally
Table 3. Volatility of Major Indexes Worldwide (1994—2001)
DJ WorldNikkei Hang Emerging
DJIA STOXX 225 Seng Markets DJ China
Average Volatility 15.80% 14.53% 20.80% 31.09% 27.92% 51.10%
Highest Volatility 20.90% 20.79% 25.13% 46.02% 45.14% 117.03%
(Year) 1998 2001 1995 1998 1998 1994
Lowest Volatility 8.19% 5.24% 16.61% 15.99% 12.33% 17.34%
(Year) 1995 1996 1999 1996 1996 2001
Source: Dow Jones Indexes. From December 31, 1993 to December 31, 2001.
DO W JO N E S IN D E X E S
China Stock Market in a Global Perspective
September, 2002
11
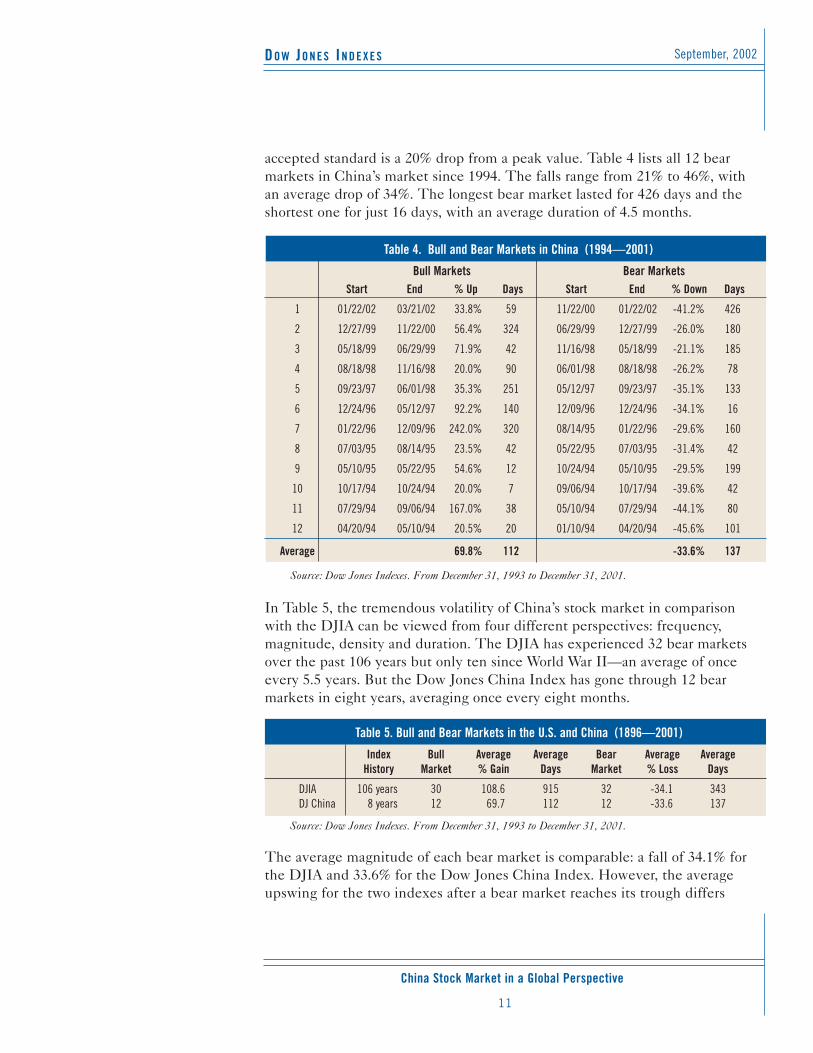
accepted standard is a 20% drop from a peak value. Table 4 lists all 12 bearmarkets in China’s market since 1994. The falls range from 21% to 46%, withan average drop of 34%. The longest bear market lasted for 426 days and theshortest one for just 16 days, with an average duration of 4.5 months.
In Table 5, the tremendous volatility of China’s stock market in comparisonwith the DJIA can be viewed from four different perspectives: frequency,magnitude, density and duration. The DJIA has experienced 32 bear marketsover the past 106 years but only ten since World War II—an average of onceevery 5.5 years. But the Dow Jones China Index has gone through 12 bearmarkets in eight years, averaging once every eight months.
The average magnitude of each bear market is comparable: a fall of 34.1% forthe DJIA and 33.6% for the Dow Jones China Index. However, the averageupswing for the two indexes after a bear market reaches its trough differs
Table 4. Bull and Bear Markets in China (1994—2001)
Bull Markets Bear MarketsStart End % Up Days Start End % Down Days
1 01/22/02 03/21/02 33.8% 59 11/22/00 01/22/02 -41.2% 426
2 12/27/99 11/22/00 56.4% 324 06/29/99 12/27/99 -26.0% 180
3 05/18/99 06/29/99 71.9% 42 11/16/98 05/18/99 -21.1% 185
4 08/18/98 11/16/98 20.0% 90 06/01/98 08/18/98 -26.2% 78
5 09/23/97 06/01/98 35.3% 251 05/12/97 09/23/97 -35.1% 133
6 12/24/96 05/12/97 92.2% 140 12/09/96 12/24/96 -34.1% 16
7 01/22/96 12/09/96 242.0% 320 08/14/95 01/22/96 -29.6% 160
8 07/03/95 08/14/95 23.5% 42 05/22/95 07/03/95 -31.4% 42
9 05/10/95 05/22/95 54.6% 12 10/24/94 05/10/95 -29.5% 199
10 10/17/94 10/24/94 20.0% 7 09/06/94 10/17/94 -39.6% 42
11 07/29/94 09/06/94 167.0% 38 05/10/94 07/29/94 -44.1% 80
12 04/20/94 05/10/94 20.5% 20 01/10/94 04/20/94 -45.6% 101
Average 69.8% 112 -33.6% 137
Source: Dow Jones Indexes. From December 31, 1993 to December 31, 2001.
Table 5. Bull and Bear Markets in the U.S. and China (1896—2001)
Index Bull Average Average Bear Average AverageHistory Market % Gain Days Market % Loss Days
DJIA 106 years 30 108.6 915 32 -34.1 343DJ China 8 years 12 69.7 112 12 -33.6 137
Source: Dow Jones Indexes. From December 31, 1993 to December 31, 2001.
DO W JO N E S IN D E X E S
China Stock Market in a Global Perspective
September 2002
12
The isolation of China’s stock market can be attributed to the
government’s currency shield andthe existence of separate share
classes for foreign and domesticinvestors. In comparison with othermarkets, China displays low corre-
lation and high tracking error.
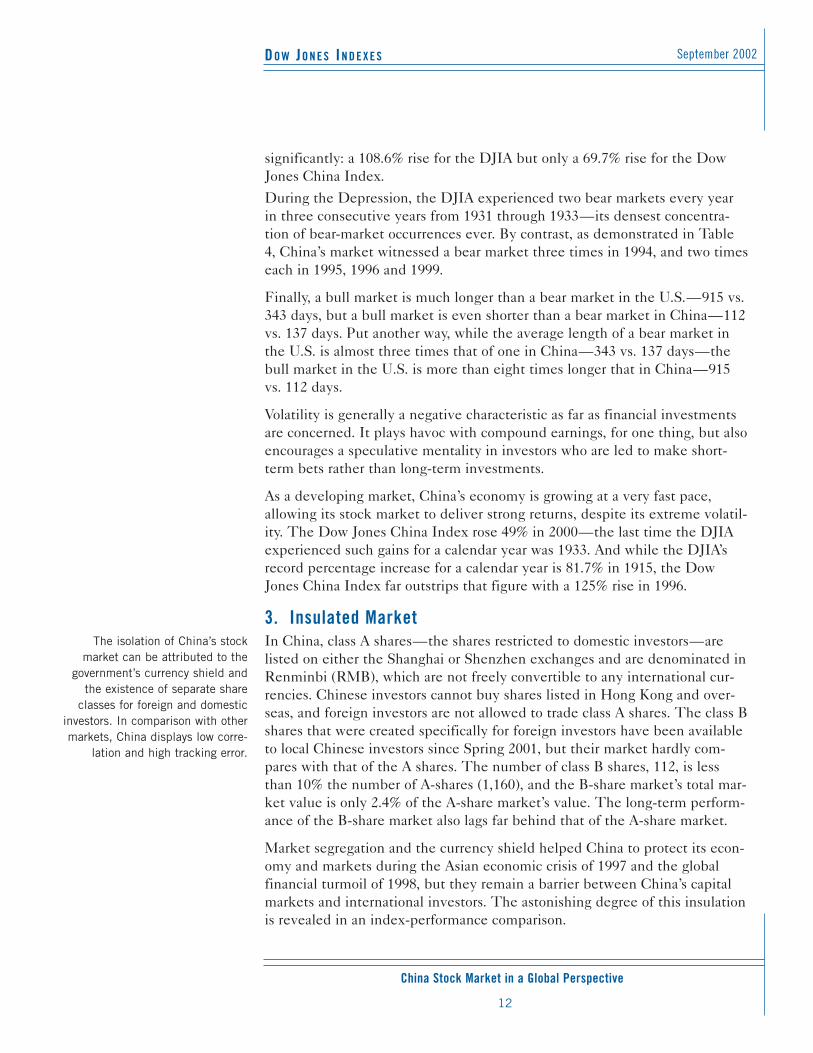
significantly: a 108.6% rise for the DJIA but only a 69.7% rise for the DowJones China Index. During the Depression, the DJIA experienced two bear markets every yearin three consecutive years from 1931 through 1933—its densest concentra-tion of bear-market occurrences ever. By contrast, as demonstrated in Table4, China’s market witnessed a bear market three times in 1994, and two timeseach in 1995, 1996 and 1999.
Finally, a bull market is much longer than a bear market in the U.S.—915 vs.343 days, but a bull market is even shorter than a bear market in China—112vs. 137 days. Put another way, while the average length of a bear market inthe U.S. is almost three times that of one in China—343 vs. 137 days—thebull market in the U.S. is more than eight times longer that in China—915vs. 112 days.
Volatility is generally a negative characteristic as far as financial investmentsare concerned. It plays havoc with compound earnings, for one thing, but alsoencourages a speculative mentality in investors who are led to make short-term bets rather than long-term investments.
As a developing market, China’s economy is growing at a very fast pace,allowing its stock market to deliver strong returns, despite its extreme volatil-ity. The Dow Jones China Index rose 49% in 2000—the last time the DJIAexperienced such gains for a calendar year was 1933. And while the DJIA’srecord percentage increase for a calendar year is 81.7% in 1915, the DowJones China Index far outstrips that figure with a 125% rise in 1996.
3. Insulated Market In China, class A shares—the shares restricted to domestic investors—arelisted on either the Shanghai or Shenzhen exchanges and are denominated inRenminbi (RMB), which are not freely convertible to any international cur-rencies. Chinese investors cannot buy shares listed in Hong Kong and over-seas, and foreign investors are not allowed to trade class A shares. The class Bshares that were created specifically for foreign investors have been availableto local Chinese investors since Spring 2001, but their market hardly com-pares with that of the A shares. The number of class B shares, 112, is lessthan 10% the number of A-shares (1,160), and the B-share market’s total mar-ket value is only 2.4% of the A-share market’s value. The long-term perform-ance of the B-share market also lags far behind that of the A-share market.
Market segregation and the currency shield helped China to protect its econ-omy and markets during the Asian economic crisis of 1997 and the globalfinancial turmoil of 1998, but they remain a barrier between China’s capitalmarkets and international investors. The astonishing degree of this insulationis revealed in an index-performance comparison.
DO W JO N E S IN D E X E S
China Stock Market in a Global Perspective
September, 2002
13
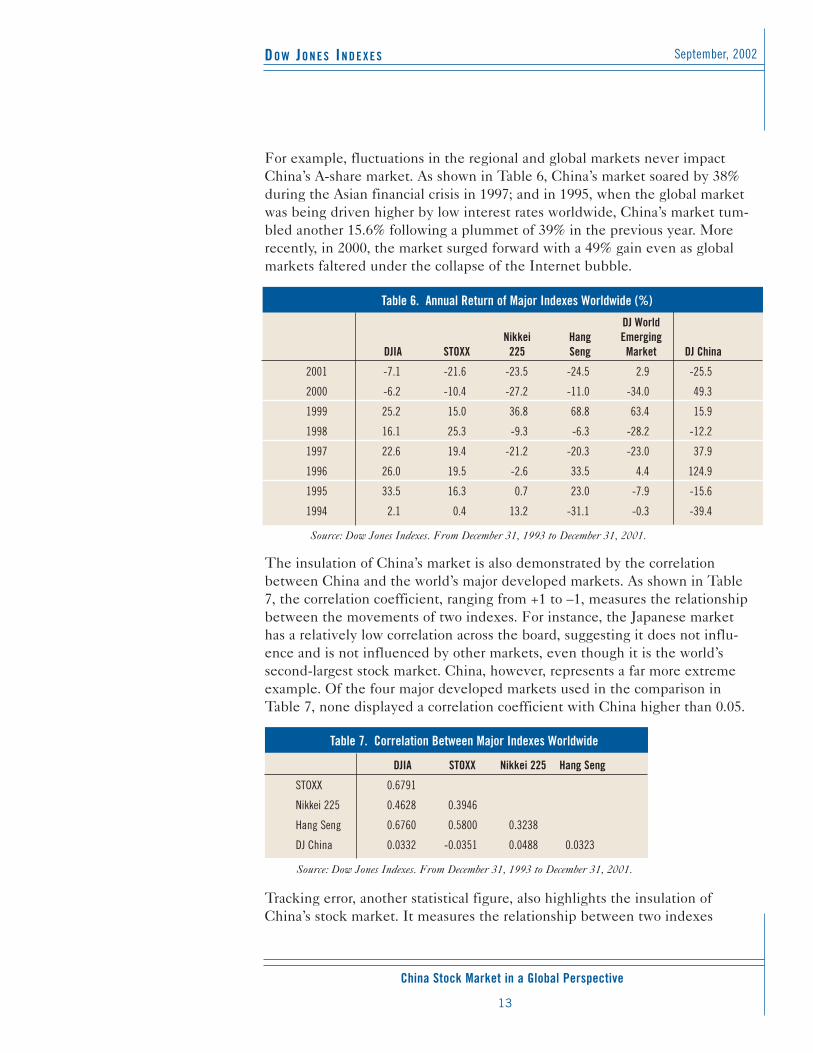
For example, fluctuations in the regional and global markets never impactChina’s A-share market. As shown in Table 6, China’s market soared by 38%during the Asian financial crisis in 1997; and in 1995, when the global marketwas being driven higher by low interest rates worldwide, China’s market tum-bled another 15.6% following a plummet of 39% in the previous year. Morerecently, in 2000, the market surged forward with a 49% gain even as globalmarkets faltered under the collapse of the Internet bubble.
The insulation of China’s market is also demonstrated by the correlationbetween China and the world’s major developed markets. As shown in Table7, the correlation coefficient, ranging from +1 to –1, measures the relationshipbetween the movements of two indexes. For instance, the Japanese markethas a relatively low correlation across the board, suggesting it does not influ-ence and is not influenced by other markets, even though it is the world’ssecond-largest stock market. China, however, represents a far more extremeexample. Of the four major developed markets used in the comparison inTable 7, none displayed a correlation coefficient with China higher than 0.05.
Tracking error, another statistical figure, also highlights the insulation ofChina’s stock market. It measures the relationship between two indexes
Table 6. Annual Return of Major Indexes Worldwide (%)
DJ WorldNikkei Hang Emerging
DJIA STOXX 225 Seng Market DJ China
2001 -7.1 -21.6 -23.5 -24.5 2.9 -25.5
2000 -6.2 -10.4 -27.2 -11.0 -34.0 49.3
1999 25.2 15.0 36.8 68.8 63.4 15.9
1998 16.1 25.3 -9.3 -6.3 -28.2 -12.2
1997 22.6 19.4 -21.2 -20.3 -23.0 37.9
1996 26.0 19.5 -2.6 33.5 4.4 124.9
1995 33.5 16.3 0.7 23.0 -7.9 -15.6
1994 2.1 0.4 13.2 -31.1 -0.3 -39.4
Source: Dow Jones Indexes. From December 31, 1993 to December 31, 2001.
Table 7. Correlation Between Major Indexes Worldwide
DJIA STOXX Nikkei 225 Hang Seng
STOXX 0.6791
Nikkei 225 0.4628 0.3946
Hang Seng 0.6760 0.5800 0.3238
DJ China 0.0332 -0.0351 0.0488 0.0323
Source: Dow Jones Indexes. From December 31, 1993 to December 31, 2001.
DO W JO N E S IN D E X E S
China Stock Market in a Global Perspective
September 2002
14
Due to widespread governmentownership, China has a very lowfloat ratio, averaging just under30% from 1993 through 2001.
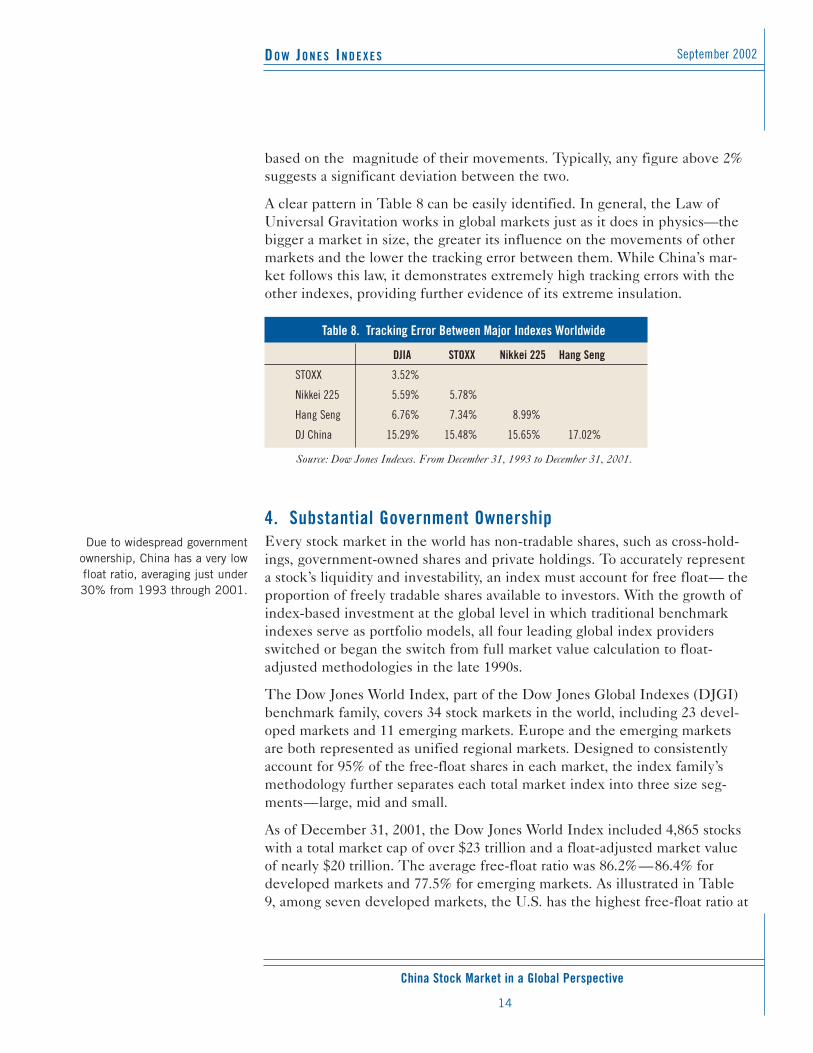
based on the magnitude of their movements. Typically, any figure above 2%suggests a significant deviation between the two.
A clear pattern in Table 8 can be easily identified. In general, the Law ofUniversal Gravitation works in global markets just as it does in physics—thebigger a market in size, the greater its influence on the movements of othermarkets and the lower the tracking error between them. While China’s mar-ket follows this law, it demonstrates extremely high tracking errors with theother indexes, providing further evidence of its extreme insulation.
4. Substantial Government Ownership Every stock market in the world has non-tradable shares, such as cross-hold-ings, government-owned shares and private holdings. To accurately representa stock’s liquidity and investability, an index must account for free float— theproportion of freely tradable shares available to investors. With the growth ofindex-based investment at the global level in which traditional benchmarkindexes serve as portfolio models, all four leading global index providersswitched or began the switch from full market value calculation to float-adjusted methodologies in the late 1990s.
The Dow Jones World Index, part of the Dow Jones Global Indexes (DJGI)benchmark family, covers 34 stock markets in the world, including 23 devel-oped markets and 11 emerging markets. Europe and the emerging marketsare both represented as unified regional markets. Designed to consistentlyaccount for 95% of the free-float shares in each market, the index family’smethodology further separates each total market index into three size seg-ments—large, mid and small.
As of December 31, 2001, the Dow Jones World Index included 4,865 stockswith a total market cap of over $23 trillion and a float-adjusted market valueof nearly $20 trillion. The average free-float ratio was 86.2%—86.4% fordeveloped markets and 77.5% for emerging markets. As illustrated in Table9, among seven developed markets, the U.S. has the highest free-float ratio at
Table 8. Tracking Error Between Major Indexes Worldwide
DJIA STOXX Nikkei 225 Hang Seng
STOXX 3.52%
Nikkei 225 5.59% 5.78%
Hang Seng 6.76% 7.34% 8.99%
DJ China 15.29% 15.48% 15.65% 17.02%
Source: Dow Jones Indexes. From December 31, 1993 to December 31, 2001.
DO W JO N E S IN D E X E S
China Stock Market in a Global Perspective
September, 2002
15
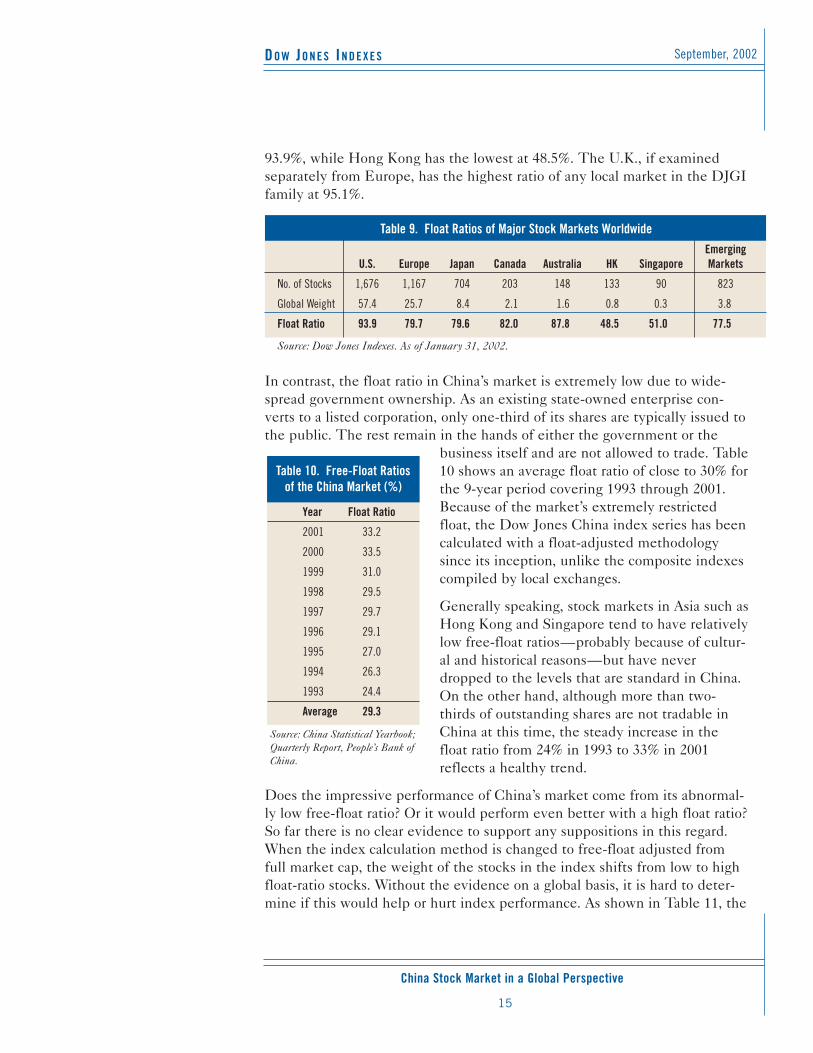
93.9%, while Hong Kong has the lowest at 48.5%. The U.K., if examinedseparately from Europe, has the highest ratio of any local market in the DJGIfamily at 95.1%.
In contrast, the float ratio in China’s market is extremely low due to wide-spread government ownership. As an existing state-owned enterprise con-verts to a listed corporation, only one-third of its shares are typically issued tothe public. The rest remain in the hands of either the government or the
business itself and are not allowed to trade. Table10 shows an average float ratio of close to 30% forthe 9-year period covering 1993 through 2001.Because of the market’s extremely restrictedfloat, the Dow Jones China index series has beencalculated with a float-adjusted methodologysince its inception, unlike the composite indexescompiled by local exchanges.
Generally speaking, stock markets in Asia such asHong Kong and Singapore tend to have relativelylow free-float ratios—probably because of cultur-al and historical reasons—but have neverdropped to the levels that are standard in China.On the other hand, although more than two-thirds of outstanding shares are not tradable inChina at this time, the steady increase in thefloat ratio from 24% in 1993 to 33% in 2001reflects a healthy trend.
Does the impressive performance of China’s market come from its abnormal-ly low free-float ratio? Or it would perform even better with a high float ratio?So far there is no clear evidence to support any suppositions in this regard.When the index calculation method is changed to free-float adjusted fromfull market cap, the weight of the stocks in the index shifts from low to highfloat-ratio stocks. Without the evidence on a global basis, it is hard to deter-mine if this would help or hurt index performance. As shown in Table 11, the
Table 9. Float Ratios of Major Stock Markets WorldwideEmerging
U.S. Europe Japan Canada Australia HK Singapore Markets
No. of Stocks 1,676 1,167 704 203 148 133 90 823
Global Weight 57.4 25.7 8.4 2.1 1.6 0.8 0.3 3.8
Float Ratio 93.9 79.7 79.6 82.0 87.8 48.5 51.0 77.5
Source: Dow Jones Indexes. As of January 31, 2002.
Year Float Ratio
2001 33.2
2000 33.5
1999 31.0
1998 29.5
1997 29.7
1996 29.1
1995 27.0
1994 26.3
1993 24.4
Average 29.3
Table 10. Free-Float Ratios of the China Market (%)
Source: China Statistical Yearbook; Quarterly Report, People’s Bank ofChina.
DO W JO N E S IN D E X E S
China Stock Market in a Global Perspective
September 2002
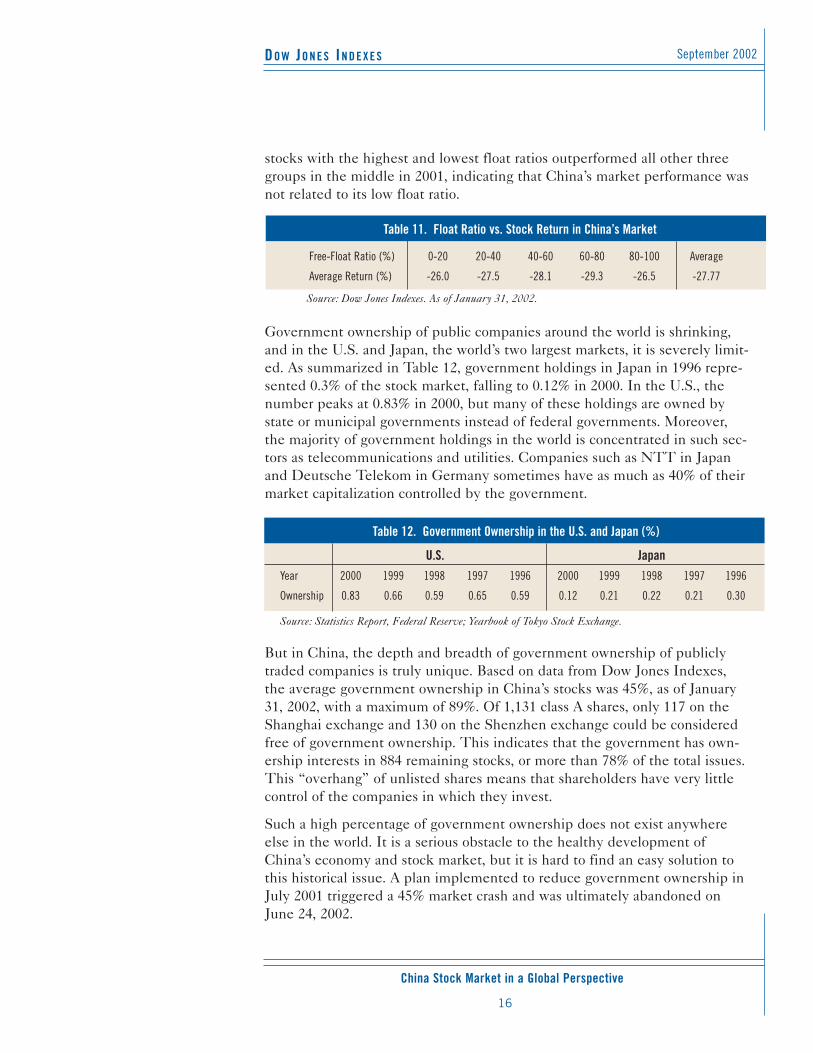
16
stocks with the highest and lowest float ratios outperformed all other threegroups in the middle in 2001, indicating that China’s market performance wasnot related to its low float ratio.
Government ownership of public companies around the world is shrinking,and in the U.S. and Japan, the world’s two largest markets, it is severely limit-ed. As summarized in Table 12, government holdings in Japan in 1996 repre-sented 0.3% of the stock market, falling to 0.12% in 2000. In the U.S., thenumber peaks at 0.83% in 2000, but many of these holdings are owned bystate or municipal governments instead of federal governments. Moreover,the majority of government holdings in the world is concentrated in such sec-tors as telecommunications and utilities. Companies such as NTT in Japanand Deutsche Telekom in Germany sometimes have as much as 40% of theirmarket capitalization controlled by the government.
But in China, the depth and breadth of government ownership of publiclytraded companies is truly unique. Based on data from Dow Jones Indexes,the average government ownership in China’s stocks was 45%, as of January31, 2002, with a maximum of 89%. Of 1,131 class A shares, only 117 on theShanghai exchange and 130 on the Shenzhen exchange could be consideredfree of government ownership. This indicates that the government has own-ership interests in 884 remaining stocks, or more than 78% of the total issues.This “overhang” of unlisted shares means that shareholders have very littlecontrol of the companies in which they invest.
Such a high percentage of government ownership does not exist anywhereelse in the world. It is a serious obstacle to the healthy development ofChina’s economy and stock market, but it is hard to find an easy solution tothis historical issue. A plan implemented to reduce government ownership inJuly 2001 triggered a 45% market crash and was ultimately abandoned onJune 24, 2002.
Table 11. Float Ratio vs. Stock Return in China’s Market
Free-Float Ratio (%) 0-20 20-40 40-60 60-80 80-100 Average
Average Return (%) -26.0 -27.5 -28.1 -29.3 -26.5 -27.77
Source: Dow Jones Indexes. As of January 31, 2002.
Table 12. Government Ownership in the U.S. and Japan (%)
U.S. JapanYear 2000 1999 1998 1997 1996 2000 1999 1998 1997 1996
Ownership 0.83 0.66 0.59 0.65 0.59 0.12 0.21 0.22 0.21 0.30
Source: Statistics Report, Federal Reserve; Yearbook of Tokyo Stock Exchange.
DO W JO N E S IN D E X E S
China Stock Market in a Global Perspective
September, 2002
17
While most stock markets grow primarily through the appreciation
of stock values, China’s marketgrowth mainly has been the result
of new share issuances, or externalexpansion.
Like all other economic phenomena, the valuation of a stock market isdependent on the equilibrium of supply and demand. A sudden boom insupply—in this case, the availability of stocks for trading—inevitably leads toa market drop if demand fails to increase accordingly. There is the possibilitythat a shift from full market-cap weighting to float-adjusted weighting by anindex provider could cause a disturbance in the marketplace by flooding themarket with shares as investors shift their portfolios to reflect the indexes.Faced with an explosion of available shares, any market would be at risk of acollapse. For example, if all family-owned shares were put on the market inHong Kong, float shares would almost double, an effect the Hong Kong mar-ket would find hard to bear. A case in point is the Tracker Fund of HongKong, the first exchange-traded fund (ETF) in the Asia Pacific. It was origi-nally created as a vehicle for the Hong Kong government to unload theshares it bought during the financial turmoil in 1998 to maintain market sta-bility. Since its launch in November 1999, the Hong Kong market has alwaysdropped significantly before its quarterly issuance.
5. Irregular Expansion There are only two modes for the growth of stock market size. One is theissuance of new shares such as IPOs, secondary offerings and follow-up offer-ings, and the other is the appreciation of existing stocks. The former is con-sidered external expansion, while the latter is viewed as internal growth.While both are driving factors for the growth of any stock market, the rapidgrowth of China’s market primarily has relied on external expansion. In mostcases worldwide, the opposite has been the true.
Every index has a divisor, which can be adjusted to filter out the impact fromcomponent changes and corporate actions such as stock splits and spin-offs inorder to maintain the continuity and consistency of the index. With a divisorin position, the performance of a benchmark index that covers a consistentportion of a market—say 80%—can be used as an indicator of the market’sinternal growth; the growth difference between the index and the total valueof the stock market measures the market’s external expansion. Since IPOsare not immediately included in stock indexes, their value would be includedin the value of the entire stock market but not in the value of the index.However, external expansion does not necessarily mean that market itself hasexpanded in size. Often the introduction of new IPOs just means more stockscompeting for the same amount of money, while a lot of mergers and acquisi-tions might cause the market’s size to contract even as more IPOs are issued.
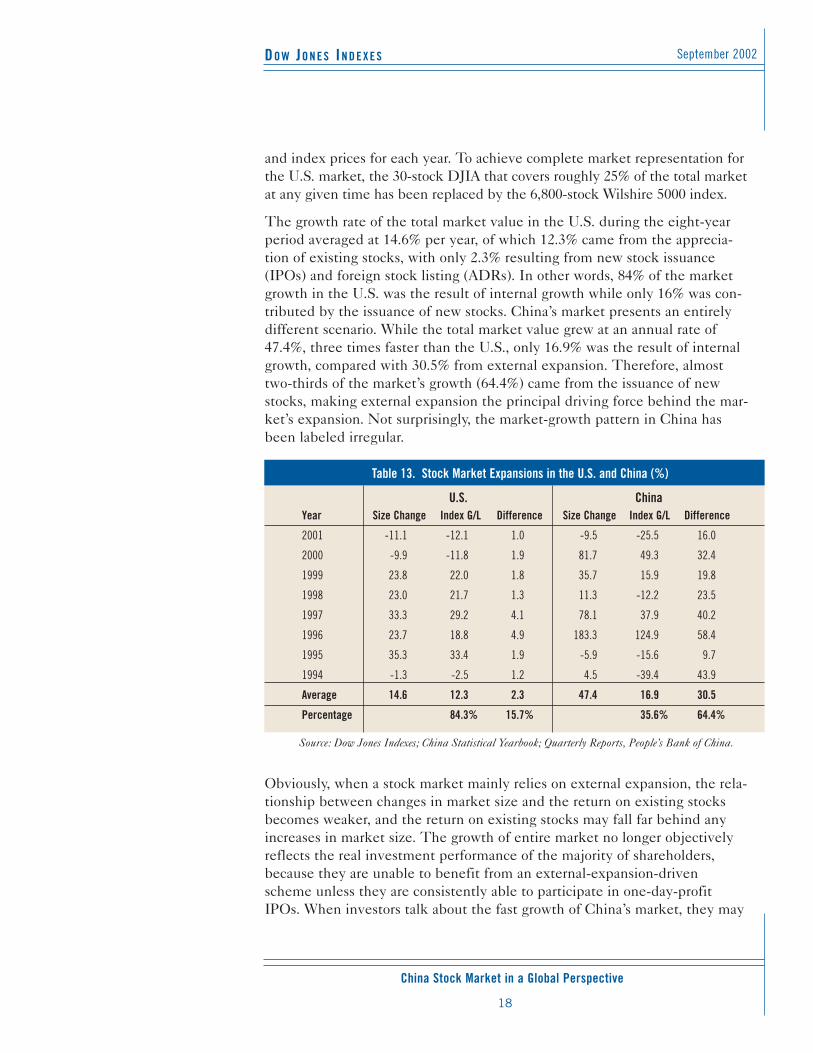
Table 13 compares the internal growth and external expansion of the U.S.and China markets during an eight-year period. The “Size Change” and“Index Gain/Loss” represent the changes in the total market capitalization
DO W JO N E S IN D E X E S
China Stock Market in a Global Perspective
September 2002
18
and index prices for each year. To achieve complete market representation forthe U.S. market, the 30-stock DJIA that covers roughly 25% of the total marketat any given time has been replaced by the 6,800-stock Wilshire 5000 index.
The growth rate of the total market value in the U.S. during the eight-yearperiod averaged at 14.6% per year, of which 12.3% came from the apprecia-tion of existing stocks, with only 2.3% resulting from new stock issuance(IPOs) and foreign stock listing (ADRs). In other words, 84% of the marketgrowth in the U.S. was the result of internal growth while only 16% was con-tributed by the issuance of new stocks. China’s market presents an entirelydifferent scenario. While the total market value grew at an annual rate of47.4%, three times faster than the U.S., only 16.9% was the result of internalgrowth, compared with 30.5% from external expansion. Therefore, almosttwo-thirds of the market’s growth (64.4%) came from the issuance of newstocks, making external expansion the principal driving force behind the mar-ket’s expansion. Not surprisingly, the market-growth pattern in China hasbeen labeled irregular.
Obviously, when a stock market mainly relies on external expansion, the rela-tionship between changes in market size and the return on existing stocksbecomes weaker, and the return on existing stocks may fall far behind anyincreases in market size. The growth of entire market no longer objectivelyreflects the real investment performance of the majority of shareholders,because they are unable to benefit from an external-expansion-drivenscheme unless they are consistently able to participate in one-day-profitIPOs. When investors talk about the fast growth of China’s market, they may
Table 13. Stock Market Expansions in the U.S. and China (%)
U.S. ChinaYear Size Change Index G/L Difference Size Change Index G/L Difference
2001 -11.1 -12.1 1.0 -9.5 -25.5 16.0
2000 -9.9 -11.8 1.9 81.7 49.3 32.4
1999 23.8 22.0 1.8 35.7 15.9 19.8
1998 23.0 21.7 1.3 11.3 -12.2 23.5
1997 33.3 29.2 4.1 78.1 37.9 40.2
1996 23.7 18.8 4.9 183.3 124.9 58.4
1995 35.3 33.4 1.9 -5.9 -15.6 9.7
1994 -1.3 -2.5 1.2 4.5 -39.4 43.9
Average 14.6 12.3 2.3 47.4 16.9 30.5
Percentage 84.3% 15.7% 35.6% 64.4%
Source: Dow Jones Indexes; China Statistical Yearbook; Quarterly Reports, People’s Bank of China.
DO W JO N E S IN D E X E S
China Stock Market in a Global Perspective
September, 2002
19
IPOs represent a larger proportionof the market capitalization of
China’s stock market than in otherworld markets. The direction of the
stock market in any given yearseems to be closely linked to
whether the number of IPOs in thatyear has increased or decreased
from the previous year. An increasein IPOs is accompanied by a rise in
the index and vice versa.
be focusing on the change of its total market value but ignoring the means bywhich it has grown. In reality, extreme external expansion distorts percep-tions of a marketplace because it has little relation to the actual investmentreturns of long-term shareholders.
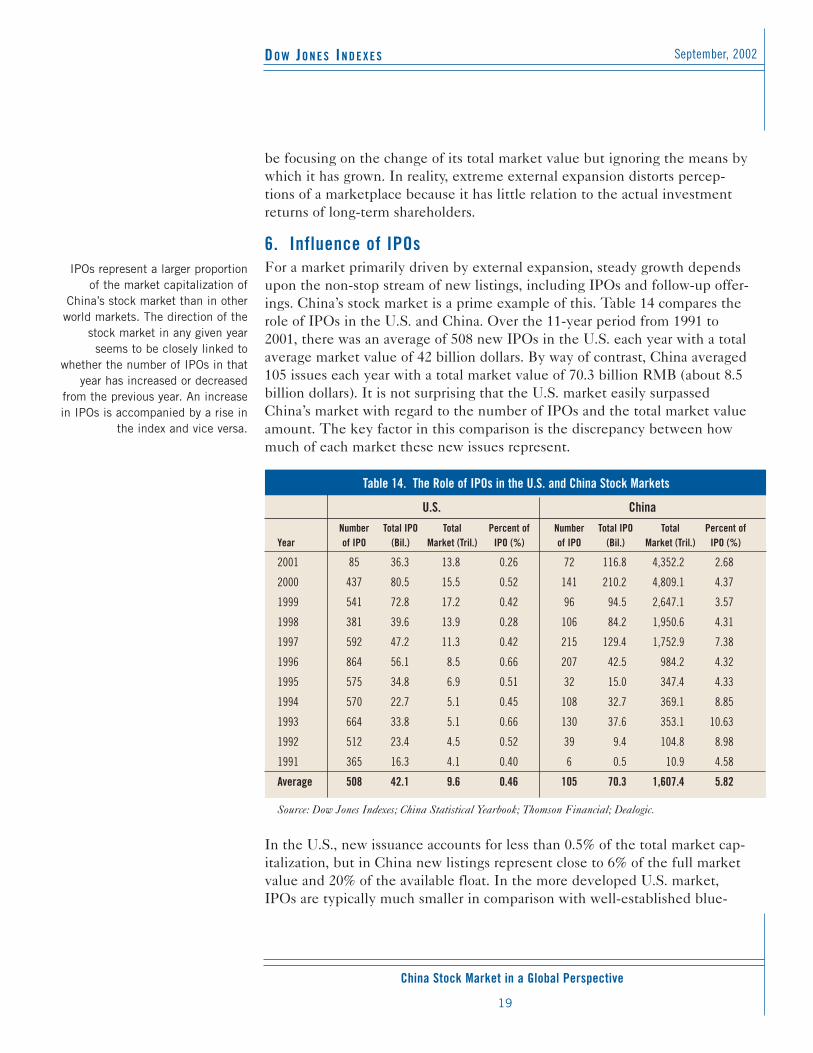
6. Influence of IPOs For a market primarily driven by external expansion, steady growth dependsupon the non-stop stream of new listings, including IPOs and follow-up offer-ings. China’s stock market is a prime example of this. Table 14 compares therole of IPOs in the U.S. and China. Over the 11-year period from 1991 to2001, there was an average of 508 new IPOs in the U.S. each year with a totalaverage market value of 42 billion dollars. By way of contrast, China averaged105 issues each year with a total market value of 70.3 billion RMB (about 8.5billion dollars). It is not surprising that the U.S. market easily surpassedChina’s market with regard to the number of IPOs and the total market valueamount. The key factor in this comparison is the discrepancy between howmuch of each market these new issues represent.
In the U.S., new issuance accounts for less than 0.5% of the total market cap-italization, but in China new listings represent close to 6% of the full marketvalue and 20% of the available float. In the more developed U.S. market,IPOs are typically much smaller in comparison with well-established blue-
Table 14. The Role of IPOs in the U.S. and China Stock Markets
U.S. ChinaNumber Total IPO Total Percent of Number Total IPO Total Percent of
Year of IPO (Bil.) Market (Tril.) IPO (%) of IPO (Bil.) Market (Tril.) IPO (%)
2001 85 36.3 13.8 0.26 72 116.8 4,352.2 2.68
2000 437 80.5 15.5 0.52 141 210.2 4,809.1 4.37
1999 541 72.8 17.2 0.42 96 94.5 2,647.1 3.57
1998 381 39.6 13.9 0.28 106 84.2 1,950.6 4.31
1997 592 47.2 11.3 0.42 215 129.4 1,752.9 7.38
1996 864 56.1 8.5 0.66 207 42.5 984.2 4.32
1995 575 34.8 6.9 0.51 32 15.0 347.4 4.33
1994 570 22.7 5.1 0.45 108 32.7 369.1 8.85
1993 664 33.8 5.1 0.66 130 37.6 353.1 10.63
1992 512 23.4 4.5 0.52 39 9.4 104.8 8.98
1991 365 16.3 4.1 0.40 6 0.5 10.9 4.58
Average 508 42.1 9.6 0.46 105 70.3 1,607.4 5.82
Source: Dow Jones Indexes; China Statistical Yearbook; Thomson Financial; Dealogic.
DO W JO N E S IN D E X E S
China Stock Market in a Global Perspective
September 2002
20
chip companies. However, in the still-developing China market, companieslaunching IPOs can be significantly larger than many that have been tradingfor some time. This is partly due to the fact that currently China’s marketlacks a stable core of blue-chip companies.
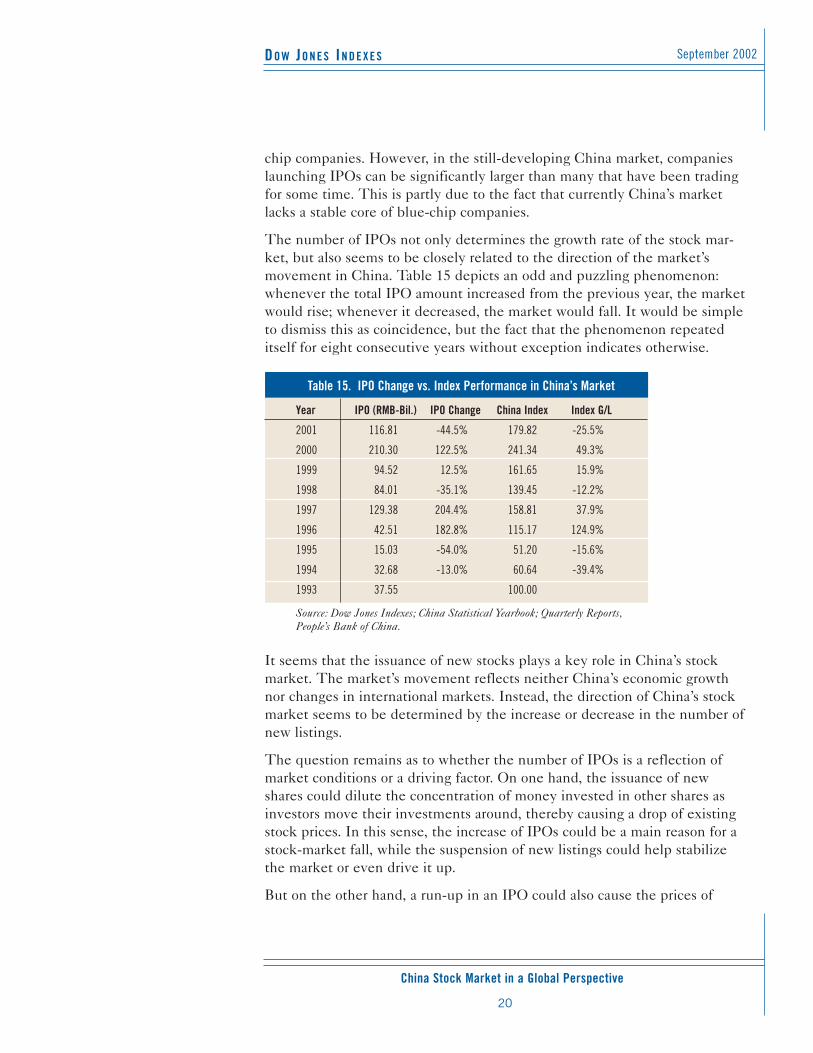
The number of IPOs not only determines the growth rate of the stock mar-ket, but also seems to be closely related to the direction of the market’smovement in China. Table 15 depicts an odd and puzzling phenomenon:whenever the total IPO amount increased from the previous year, the marketwould rise; whenever it decreased, the market would fall. It would be simpleto dismiss this as coincidence, but the fact that the phenomenon repeateditself for eight consecutive years without exception indicates otherwise.
It seems that the issuance of new stocks plays a key role in China’s stockmarket. The market’s movement reflects neither China’s economic growthnor changes in international markets. Instead, the direction of China’s stockmarket seems to be determined by the increase or decrease in the number ofnew listings.
The question remains as to whether the number of IPOs is a reflection ofmarket conditions or a driving factor. On one hand, the issuance of newshares could dilute the concentration of money invested in other shares asinvestors move their investments around, thereby causing a drop of existingstock prices. In this sense, the increase of IPOs could be a main reason for astock-market fall, while the suspension of new listings could help stabilizethe market or even drive it up.
But on the other hand, a run-up in an IPO could also cause the prices of
Table 15. IPO Change vs. Index Performance in China’s Market
Year IPO (RMB-Bil.) IPO Change China Index Index G/L
2001 116.81 -44.5% 179.82 -25.5%
2000 210.30 122.5% 241.34 49.3%
1999 94.52 12.5% 161.65 15.9%
1998 84.01 -35.1% 139.45 -12.2%
1997 129.38 204.4% 158.81 37.9%
1996 42.51 182.8% 115.17 124.9%
1995 15.03 -54.0% 51.20 -15.6%
1994 32.68 -13.0% 60.64 -39.4%
1993 37.55 100.00
Source: Dow Jones Indexes; China Statistical Yearbook; Quarterly Reports,People’s Bank of China.
DO W JO N E S IN D E X E S
China Stock Market in a Global Perspective
September, 2002
21
China is a typical emerging marketin many ways, including its large
number of small-cap stocks, itslarge number of share classes, the
dominance of retail investors, itstwo-exchange structure and thestrict regulation of IPOs by the
government.
other related stocks to be pulled along as well, because price rallies in IPOsare usually not limited to the first trading session but can last for severalweeks or even months. In the case of a very large IPO that gains immediateadmission to the index, the adjustment of the divisor on the first trading daycan certainly filter out its impact on the index, but continuous price increasesduring the following days will inevitably push the index up. In addition, theIPO effect may also have some positive impact on existing stock prices—arise in the tide lifts every boat in the sea. From this perspective, an increasein the number of IPOs may help boost an index.
Whatever the answer, nowhere else is this correlation between the number ofIPOs and market movements so sharply defined. The effect of IPOs onChina’s stock market mainly depends on if IPOs effectively attract assets tothe stock market or if they are competing with existing stocks for limitedcapital. In the case of the former, the stock market would be stimulated bythe new listings, but if the IPOs are competing for limited capital, the marketwould suffer as a result. In truth, the reality probably lies somewherebetween these two extreme examples, but the question remains as towhether the market is stimulated by new listings or whether the new listingsare the result of an invigorated stock market.
7. Typical Emerging MarketBoth of China’s exchanges are recent creations established in December1990. There were no laws to govern corporations until 1994, and there wereno laws to regulate securities until 1999. Open-ended mutual funds were cre-ated as recently as 2000, and a draft of investment company law is not sched-uled to be submitted to Congress until 2003. Not surprisingly, China demon-strates many of the features that are characteristic of emerging markets. Theyare not only seen in the primary IPO market for public offerings but also inthe secondary stock-trading market. These features can be summarized intofive major points.
First, there is an overwhelming number of share classes to confuse investors.Besides class A shares, which are restricted to domestic investors, and the Bshares trading in China for foreign investors, there are several additionalclasses available to global investors and denominated in hard currencies. The H, N, L and S shares are listed in Hong Kong, New York, London andSingapore, respectively. If foreign-currency financing is the sole purpose,ADRs or GDRs can be readily created, even if the RMB is non-convertible.They are simpler and more flexible and effective in terms of raising capital inhard currencies. Also, they put domestic and international investors on thesame platform, thus eliminating differences between them. The DeutscheBank and the United Bank of Switzerland (UBS) even created another brand-
DO W JO N E S IN D E X E S
China Stock Market in a Global Perspective
September 2002
22
new share class in 2001 by issuing “global shares” denominated in multiplecurrencies.
Many of China’s blue-chip companies are listed only on overseas exchangesand are not available to local investors. Although foreign listing is a common-ly chosen option for companies in countries such as South Africa and Israel,China’s implementation of this practice far outstrips that of any other country.China Mobile, China Unicom, CNOOC, and Legend are all leading Chinesecompanies as well as components of the Hang Seng Index. But while main-land Chinese are the customers, suppliers, producers and even employees ofthese companies, they are unable to invest in them. As can be seen later, thisstrange issue creates many structural drawbacks for China’s stock market.
Secondly, the Chinese government strictly regulates initial public offerings.While regulations and government supervision are necessary for the success-ful and fair operation of any stock market, China represents an extreme case.The government sets the quota for new listings each year, selects the quali-fied companies based on provincial and sector allocation, and — until 2001 —even determined where the new stocks would list. China is the only countryin which the government completely controls the size of the stock market,the pace of issue and the allocation of resources. Also, under current laws inChina, no company is allowed to list without three years of continuous prof-itability. As a result, only a few of the listed companies in China are youngand dynamic enterprises. This has led to the criticism that the stock marketfavors state-owned companies over entrepreneurial ventures.
Another consequence of the overseas listing of China’s large companies is thepredominance of small-cap stocks, in both absolute size and in relation to therest of the world. The low free-float ratio in China makes the situation evenworse. For instance, the Dow Jones Emerging Market Index includes 12 mar-kets—South Korea, Taiwan, Malaysia, Indonesia, the Philippines, Thailand,South Africa, Mexico, Brazil, Chile, Colombia and Venezuela—and covers95% of the combined market value. According to the parameters of thisindex, the cutoff lines between large and mid-cap, and mid and small-capstocks are 1.2 billion and 210 million dollars respectively, as of December 31,2001. Based upon this standard, only one company listed in China can beclassified as a large stock—Shenzhen Development Bank (Sinopec andChina Merchants Bank have big full but limited float market capitalization),and 130 qualify as mid-cap stocks. The remaining 1,000-plus companies, or88% of the total number, are small-cap or micro-cap companies.
The dominance of small stocks in China also can be measured by the averagetrading price of all stocks. As of February 28, 2002, 326 stocks, or 9%, of the3,3736 stocks trading on the Nasdaq stock market had a closing price under
DO W JO N E S IN D E X E S
China Stock Market in a Global Perspective
September, 2002
23
$1, meeting the definition of a “junk stock.” At the same time, China’s mar-ket had a total of 521.8 billion shares outstanding with a full market value of$525.6 billion dollars. This translates into an average price of $1.007 dollarper share, compared with $34 and $23 at the NYSE and Nasdaq, respectively.
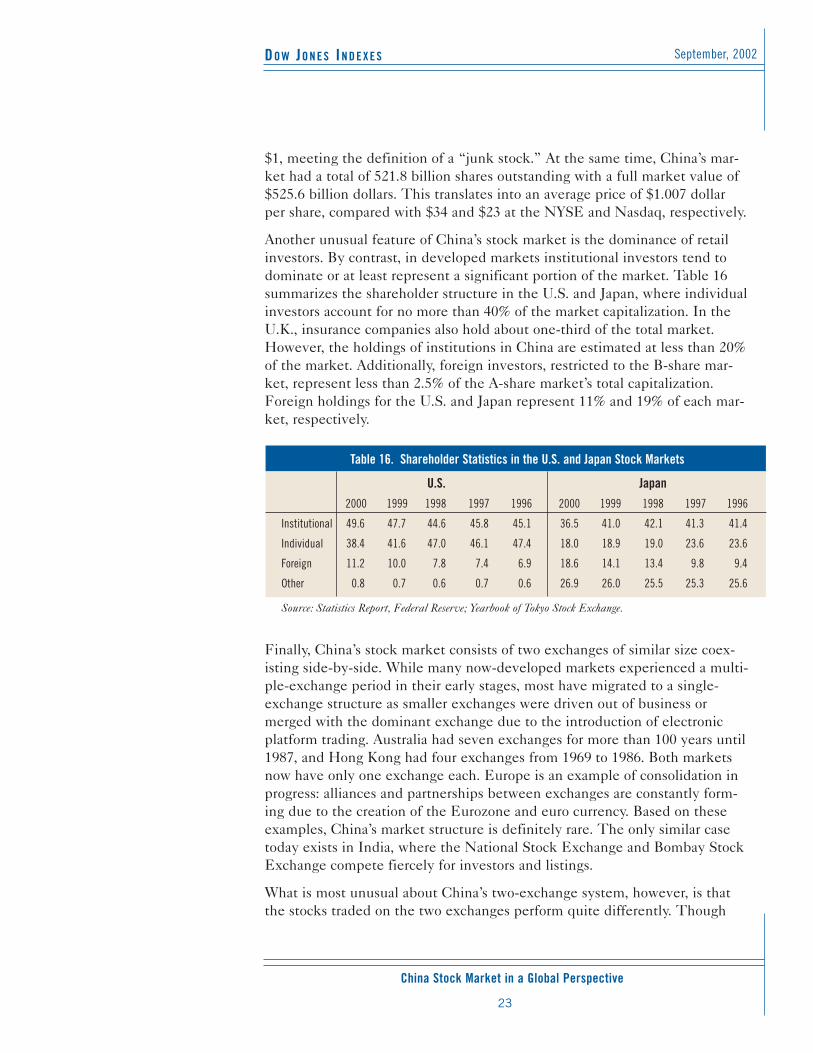
Another unusual feature of China’s stock market is the dominance of retailinvestors. By contrast, in developed markets institutional investors tend todominate or at least represent a significant portion of the market. Table 16summarizes the shareholder structure in the U.S. and Japan, where individualinvestors account for no more than 40% of the market capitalization. In theU.K., insurance companies also hold about one-third of the total market.However, the holdings of institutions in China are estimated at less than 20%of the market. Additionally, foreign investors, restricted to the B-share mar-ket, represent less than 2.5% of the A-share market’s total capitalization.Foreign holdings for the U.S. and Japan represent 11% and 19% of each mar-ket, respectively.
Finally, China’s stock market consists of two exchanges of similar size coex-isting side-by-side. While many now-developed markets experienced a multi-ple-exchange period in their early stages, most have migrated to a single-exchange structure as smaller exchanges were driven out of business ormerged with the dominant exchange due to the introduction of electronicplatform trading. Australia had seven exchanges for more than 100 years until1987, and Hong Kong had four exchanges from 1969 to 1986. Both marketsnow have only one exchange each. Europe is an example of consolidation inprogress: alliances and partnerships between exchanges are constantly form-ing due to the creation of the Eurozone and euro currency. Based on theseexamples, China’s market structure is definitely rare. The only similar casetoday exists in India, where the National Stock Exchange and Bombay StockExchange compete fiercely for investors and listings.
What is most unusual about China’s two-exchange system, however, is thatthe stocks traded on the two exchanges perform quite differently. Though
Table 16. Shareholder Statistics in the U.S. and Japan Stock Markets
U.S. Japan2000 1999 1998 1997 1996 2000 1999 1998 1997 1996
Institutional 49.6 47.7 44.6 45.8 45.1 36.5 41.0 42.1 41.3 41.4
Individual 38.4 41.6 47.0 46.1 47.4 18.0 18.9 19.0 23.6 23.6
Foreign 11.2 10.0 7.8 7.4 6.9 18.6 14.1 13.4 9.8 9.4
Other 0.8 0.7 0.6 0.7 0.6 26.9 26.0 25.5 25.3 25.6
Source: Statistics Report, Federal Reserve; Yearbook of Tokyo Stock Exchange.
DO W JO N E S IN D E X E S
China Stock Market in a Global Perspective
September 2002
24
China’s stock market lacks trulyblue-chip stocks and so is
dominated by a large number ofsmaller capitalization stocks, givingit a pyramid structure. By contrast,developed markets tend to be dom-
inated by a small number of largeblue-chip stocks, giving them a
funnel-shaped structure.
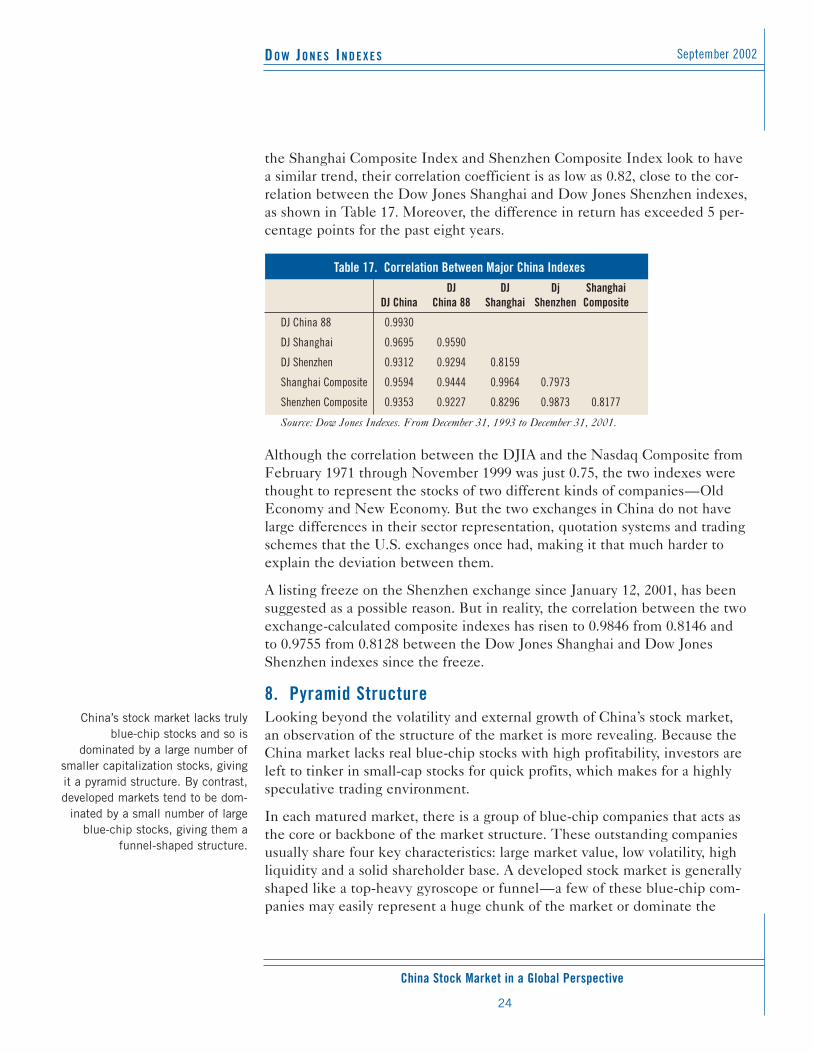
the Shanghai Composite Index and Shenzhen Composite Index look to havea similar trend, their correlation coefficient is as low as 0.82, close to the cor-relation between the Dow Jones Shanghai and Dow Jones Shenzhen indexes,as shown in Table 17. Moreover, the difference in return has exceeded 5 per-centage points for the past eight years.
Although the correlation between the DJIA and the Nasdaq Composite fromFebruary 1971 through November 1999 was just 0.75, the two indexes werethought to represent the stocks of two different kinds of companies—OldEconomy and New Economy. But the two exchanges in China do not havelarge differences in their sector representation, quotation systems and tradingschemes that the U.S. exchanges once had, making it that much harder toexplain the deviation between them.
A listing freeze on the Shenzhen exchange since January 12, 2001, has beensuggested as a possible reason. But in reality, the correlation between the twoexchange-calculated composite indexes has risen to 0.9846 from 0.8146 andto 0.9755 from 0.8128 between the Dow Jones Shanghai and Dow JonesShenzhen indexes since the freeze.
8. Pyramid StructureLooking beyond the volatility and external growth of China’s stock market,an observation of the structure of the market is more revealing. Because theChina market lacks real blue-chip stocks with high profitability, investors areleft to tinker in small-cap stocks for quick profits, which makes for a highlyspeculative trading environment.
In each matured market, there is a group of blue-chip companies that acts asthe core or backbone of the market structure. These outstanding companiesusually share four key characteristics: large market value, low volatility, highliquidity and a solid shareholder base. A developed stock market is generallyshaped like a top-heavy gyroscope or funnel—a few of these blue-chip com-panies may easily represent a huge chunk of the market or dominate the
Table 17. Correlation Between Major China IndexesDJ DJ Dj Shanghai
DJ China China 88 Shanghai Shenzhen Composite
DJ China 88 0.9930
DJ Shanghai 0.9695 0.9590
DJ Shenzhen 0.9312 0.9294 0.8159
Shanghai Composite 0.9594 0.9444 0.9964 0.7973
Shenzhen Composite 0.9353 0.9227 0.8296 0.9873 0.8177
Source: Dow Jones Indexes. From December 31, 1993 to December 31, 2001.
DO W JO N E S IN D E X E S
China Stock Market in a Global Perspective
September, 2002
25
benchmark index’s movement. Meanwhile, the numerous small-cap compa-nies at the bottom are relatively insignificant. A typical example is Nokia. Asingle company represents roughly 73% of Finland’s total market value. InHong Kong, HSBC and China Mobile, combined, account for almost half ofthe Hang Seng Index. But such is not the case in China. Without true blue-chip companies in the A-share market, the market structure resembles a pyra-mid, and with the increasing number of listed companies, the aggregate mar-ket value accumulates slowly as more shares compete for a limited amount ofmoney.
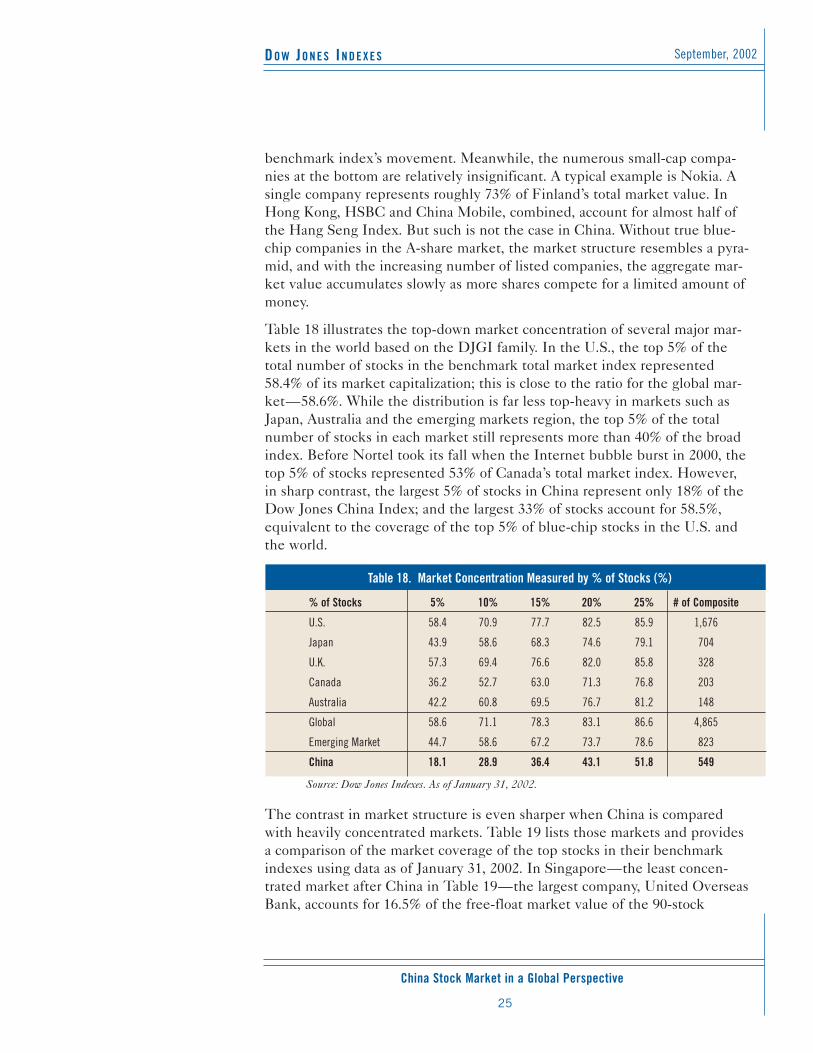
Table 18 illustrates the top-down market concentration of several major mar-kets in the world based on the DJGI family. In the U.S., the top 5% of thetotal number of stocks in the benchmark total market index represented58.4% of its market capitalization; this is close to the ratio for the global mar-ket—58.6%. While the distribution is far less top-heavy in markets such asJapan, Australia and the emerging markets region, the top 5% of the totalnumber of stocks in each market still represents more than 40% of the broadindex. Before Nortel took its fall when the Internet bubble burst in 2000, thetop 5% of stocks represented 53% of Canada’s total market index. However,in sharp contrast, the largest 5% of stocks in China represent only 18% of theDow Jones China Index; and the largest 33% of stocks account for 58.5%,equivalent to the coverage of the top 5% of blue-chip stocks in the U.S. andthe world.
The contrast in market structure is even sharper when China is comparedwith heavily concentrated markets. Table 19 lists those markets and providesa comparison of the market coverage of the top stocks in their benchmarkindexes using data as of January 31, 2002. In Singapore—the least concen-trated market after China in Table 19—the largest company, United OverseasBank, accounts for 16.5% of the free-float market value of the 90-stock
Table 18. Market Concentration Measured by % of Stocks (%)
% of Stocks 5% 10% 15% 20% 25% # of Composite
U.S. 58.4 70.9 77.7 82.5 85.9 1,676
Japan 43.9 58.6 68.3 74.6 79.1 704
U.K. 57.3 69.4 76.6 82.0 85.8 328
Canada 36.2 52.7 63.0 71.3 76.8 203
Australia 42.2 60.8 69.5 76.7 81.2 148
Global 58.6 71.1 78.3 83.1 86.6 4,865
Emerging Market 44.7 58.6 67.2 73.7 78.6 823
China 18.1 28.9 36.4 43.1 51.8 549
Source: Dow Jones Indexes. As of January 31, 2002.
DO W JO N E S IN D E X E S
China Stock Market in a Global Perspective
September 2002
26
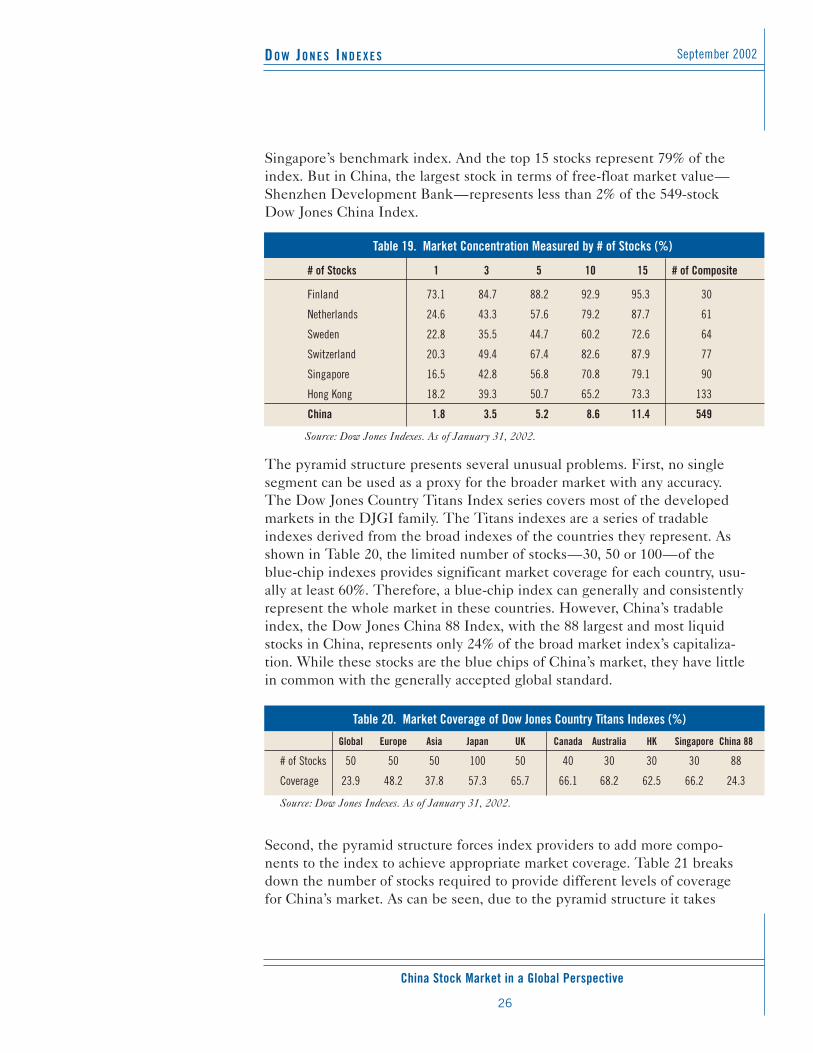
Singapore’s benchmark index. And the top 15 stocks represent 79% of theindex. But in China, the largest stock in terms of free-float market value—Shenzhen Development Bank—represents less than 2% of the 549-stockDow Jones China Index.
The pyramid structure presents several unusual problems. First, no singlesegment can be used as a proxy for the broader market with any accuracy.The Dow Jones Country Titans Index series covers most of the developedmarkets in the DJGI family. The Titans indexes are a series of tradableindexes derived from the broad indexes of the countries they represent. Asshown in Table 20, the limited number of stocks—30, 50 or 100—of theblue-chip indexes provides significant market coverage for each country, usu-ally at least 60%. Therefore, a blue-chip index can generally and consistentlyrepresent the whole market in these countries. However, China’s tradableindex, the Dow Jones China 88 Index, with the 88 largest and most liquidstocks in China, represents only 24% of the broad market index’s capitaliza-tion. While these stocks are the blue chips of China’s market, they have littlein common with the generally accepted global standard.
Second, the pyramid structure forces index providers to add more compo-nents to the index to achieve appropriate market coverage. Table 21 breaksdown the number of stocks required to provide different levels of coveragefor China’s market. As can be seen, due to the pyramid structure it takes
Table 20. Market Coverage of Dow Jones Country Titans Indexes (%)
Global Europe Asia Japan UK Canada Australia HK Singapore China 88
# of Stocks 50 50 50 100 50 40 30 30 30 88
Coverage 23.9 48.2 37.8 57.3 65.7 66.1 68.2 62.5 66.2 24.3
Source: Dow Jones Indexes. As of January 31, 2002.
Table 19. Market Concentration Measured by # of Stocks (%)
# of Stocks 1 3 5 10 15 # of Composite
Finland 73.1 84.7 88.2 92.9 95.3 30
Netherlands 24.6 43.3 57.6 79.2 87.7 61
Sweden 22.8 35.5 44.7 60.2 72.6 64
Switzerland 20.3 49.4 67.4 82.6 87.9 77
Singapore 16.5 42.8 56.8 70.8 79.1 90
Hong Kong 18.2 39.3 50.7 65.2 73.3 133
China 1.8 3.5 5.2 8.6 11.4 549
Source: Dow Jones Indexes. As of January 31, 2002.
DO W JO N E S IN D E X E S
China Stock Market in a Global Perspective
September, 2002
27
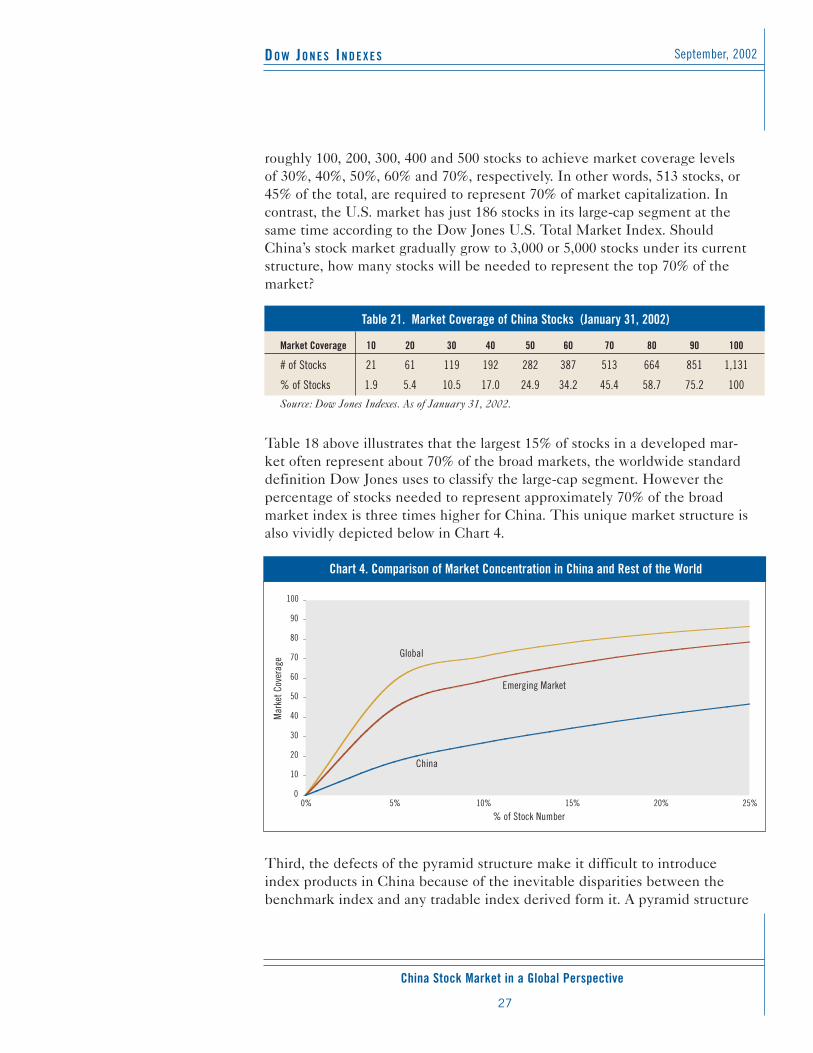
roughly 100, 200, 300, 400 and 500 stocks to achieve market coverage levelsof 30%, 40%, 50%, 60% and 70%, respectively. In other words, 513 stocks, or45% of the total, are required to represent 70% of market capitalization. Incontrast, the U.S. market has just 186 stocks in its large-cap segment at thesame time according to the Dow Jones U.S. Total Market Index. ShouldChina’s stock market gradually grow to 3,000 or 5,000 stocks under its currentstructure, how many stocks will be needed to represent the top 70% of themarket?
Table 18 above illustrates that the largest 15% of stocks in a developed mar-ket often represent about 70% of the broad markets, the worldwide standarddefinition Dow Jones uses to classify the large-cap segment. However thepercentage of stocks needed to represent approximately 70% of the broadmarket index is three times higher for China. This unique market structure isalso vividly depicted below in Chart 4.
Third, the defects of the pyramid structure make it difficult to introduceindex products in China because of the inevitable disparities between thebenchmark index and any tradable index derived form it. A pyramid structure
Table 21. Market Coverage of China Stocks (January 31, 2002)
Market Coverage 10 20 30 40 50 60 70 80 90 100
# of Stocks 21 61 119 192 282 387 513 664 851 1,131
% of Stocks 1.9 5.4 10.5 17.0 24.9 34.2 45.4 58.7 75.2 100
Source: Dow Jones Indexes. As of January 31, 2002.
0
10
20
30
40
50
60
70
80
90
100
0% 5% 10% 15% 20% 25%
% of Stock Number
Mar
ket C
over
age Global
Emerging Market
China
Chart 4. Comparison of Market Concentration in China and Rest of the World
DO W JO N E S IN D E X E S
China Stock Market in a Global Perspective
September 2002
28
increases the likelihood that these indexes will diverge from each other sig-nificantly because the blue-chip stocks that generally dictate the direction ofthese indexes are simply not present.
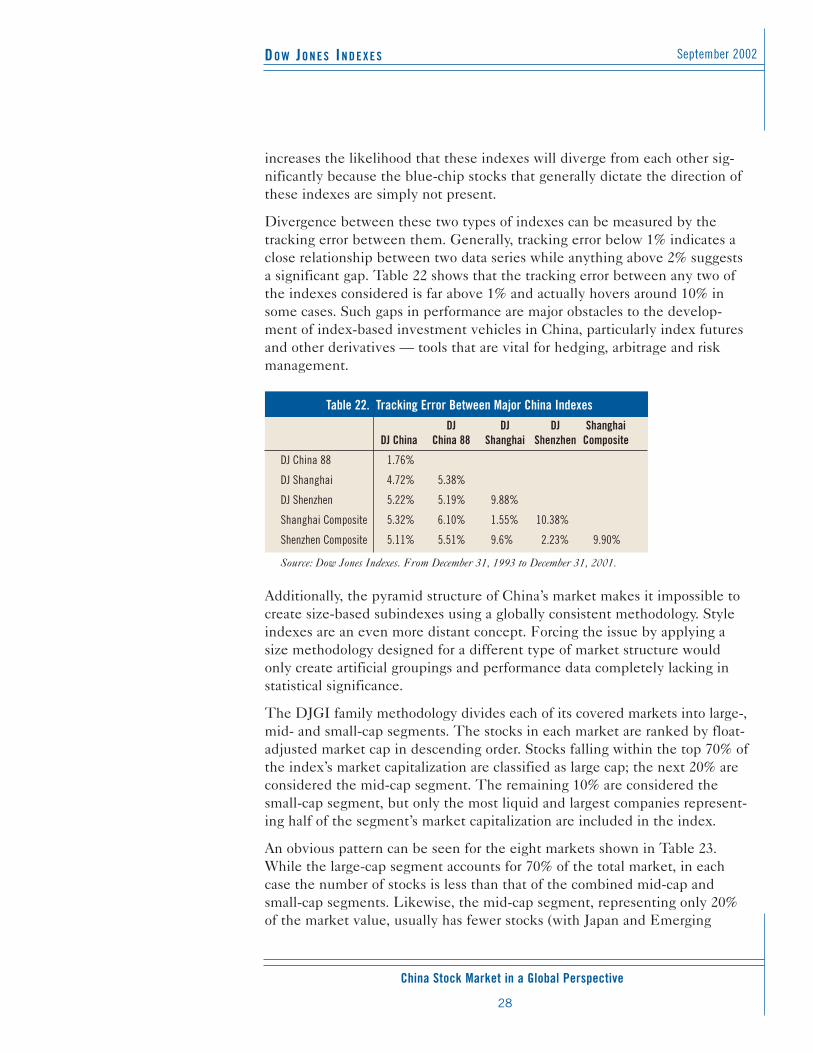
Divergence between these two types of indexes can be measured by thetracking error between them. Generally, tracking error below 1% indicates aclose relationship between two data series while anything above 2% suggestsa significant gap. Table 22 shows that the tracking error between any two ofthe indexes considered is far above 1% and actually hovers around 10% insome cases. Such gaps in performance are major obstacles to the develop-ment of index-based investment vehicles in China, particularly index futuresand other derivatives — tools that are vital for hedging, arbitrage and riskmanagement.
Additionally, the pyramid structure of China’s market makes it impossible tocreate size-based subindexes using a globally consistent methodology. Styleindexes are an even more distant concept. Forcing the issue by applying asize methodology designed for a different type of market structure wouldonly create artificial groupings and performance data completely lacking instatistical significance.
The DJGI family methodology divides each of its covered markets into large-,mid- and small-cap segments. The stocks in each market are ranked by float-adjusted market cap in descending order. Stocks falling within the top 70% ofthe index’s market capitalization are classified as large cap; the next 20% areconsidered the mid-cap segment. The remaining 10% are considered thesmall-cap segment, but only the most liquid and largest companies represent-ing half of the segment’s market capitalization are included in the index.
An obvious pattern can be seen for the eight markets shown in Table 23.While the large-cap segment accounts for 70% of the total market, in eachcase the number of stocks is less than that of the combined mid-cap andsmall-cap segments. Likewise, the mid-cap segment, representing only 20%of the market value, usually has fewer stocks (with Japan and Emerging
Table 22. Tracking Error Between Major China IndexesDJ DJ DJ Shanghai
DJ China China 88 Shanghai Shenzhen Composite
DJ China 88 1.76%
DJ Shanghai 4.72% 5.38%
DJ Shenzhen 5.22% 5.19% 9.88%
Shanghai Composite 5.32% 6.10% 1.55% 10.38%
Shenzhen Composite 5.11% 5.51% 9.6% 2.23% 9.90%
Source: Dow Jones Indexes. From December 31, 1993 to December 31, 2001.
DO W JO N E S IN D E X E S
China Stock Market in a Global Perspective
September, 2002
29
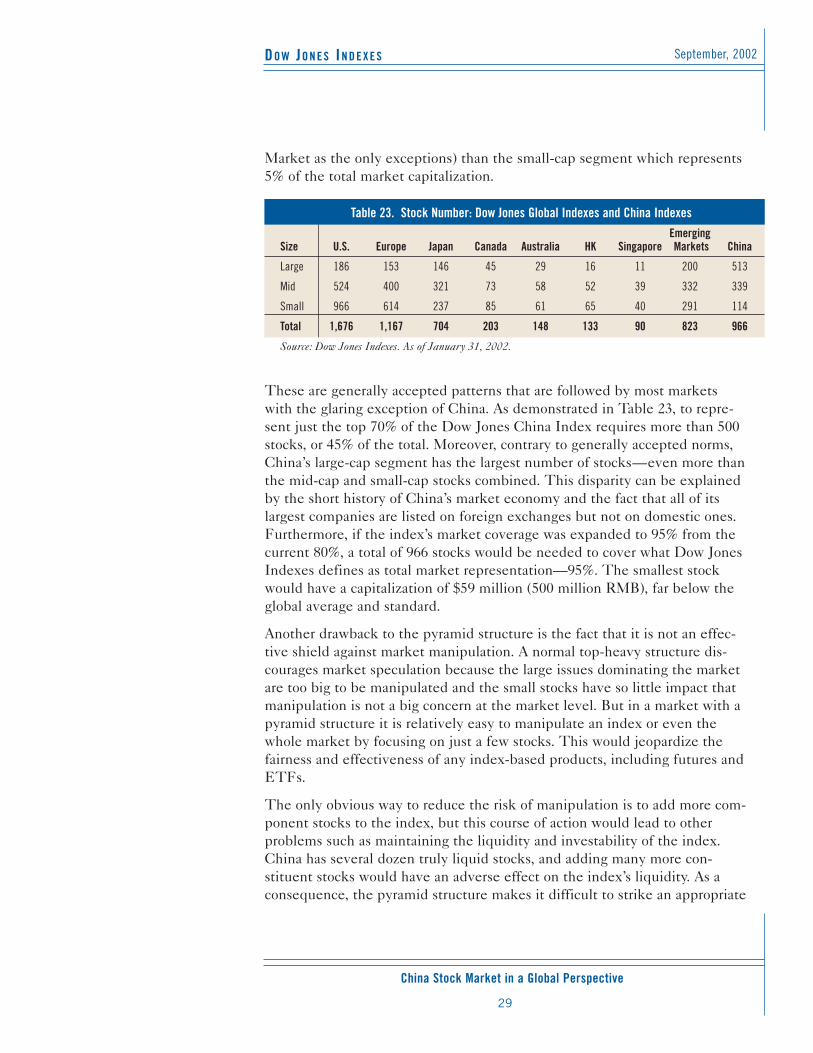
Market as the only exceptions) than the small-cap segment which represents5% of the total market capitalization.
These are generally accepted patterns that are followed by most marketswith the glaring exception of China. As demonstrated in Table 23, to repre-sent just the top 70% of the Dow Jones China Index requires more than 500stocks, or 45% of the total. Moreover, contrary to generally accepted norms,China’s large-cap segment has the largest number of stocks—even more thanthe mid-cap and small-cap stocks combined. This disparity can be explainedby the short history of China’s market economy and the fact that all of itslargest companies are listed on foreign exchanges but not on domestic ones.Furthermore, if the index’s market coverage was expanded to 95% from thecurrent 80%, a total of 966 stocks would be needed to cover what Dow JonesIndexes defines as total market representation—95%. The smallest stockwould have a capitalization of $59 million (500 million RMB), far below theglobal average and standard.
Another drawback to the pyramid structure is the fact that it is not an effec-tive shield against market manipulation. A normal top-heavy structure dis-courages market speculation because the large issues dominating the marketare too big to be manipulated and the small stocks have so little impact thatmanipulation is not a big concern at the market level. But in a market with apyramid structure it is relatively easy to manipulate an index or even thewhole market by focusing on just a few stocks. This would jeopardize thefairness and effectiveness of any index-based products, including futures andETFs.
The only obvious way to reduce the risk of manipulation is to add more com-ponent stocks to the index, but this course of action would lead to otherproblems such as maintaining the liquidity and investability of the index.China has several dozen truly liquid stocks, and adding many more con-stituent stocks would have an adverse effect on the index’s liquidity. As aconsequence, the pyramid structure makes it difficult to strike an appropriate
Table 23. Stock Number: Dow Jones Global Indexes and China IndexesEmerging
Size U.S. Europe Japan Canada Australia HK Singapore Markets China
Large 186 153 146 45 29 16 11 200 513
Mid 524 400 321 73 58 52 39 332 339
Small 966 614 237 85 61 65 40 291 114
Total 1,676 1,167 704 203 148 133 90 823 966
Source: Dow Jones Indexes. As of January 31, 2002.
DO W JO N E S IN D E X E S
China Stock Market in a Global Perspective
September 2002
30
China’s stock market lacks a dominant core of blue-chip stocks.
This problem is closely linked tohigh turnover in market indexes
and rampant market speculation.These factors are serious obstacles
to the creation of viable index-based products.
balance between market coverage and stock liquidity.
Finally, the pyramid structure also makes index-based investing particularlydifficult in China. With limited capital and assets under management, mostmutual funds and other institutional investors in China do not have enoughmoney or resources to hold the vast number of stocks required for indexreplication over a long period of time. Accordingly, the creation of ETFsremains a distant possibility as long as only a few financial institutions canafford a large basket of stocks.
9. Unstable CoreThe “core-satellite” structure is another model that is typical of the world’sstock markets. In this construct, the core of the index is composed of blue-chip stocks with long histories of performance that seldom experience anydramatic changes. The satellites are those companies sliding in and out of theindex because of insufficient size or liquidity and poor or unstable fundamen-tals.
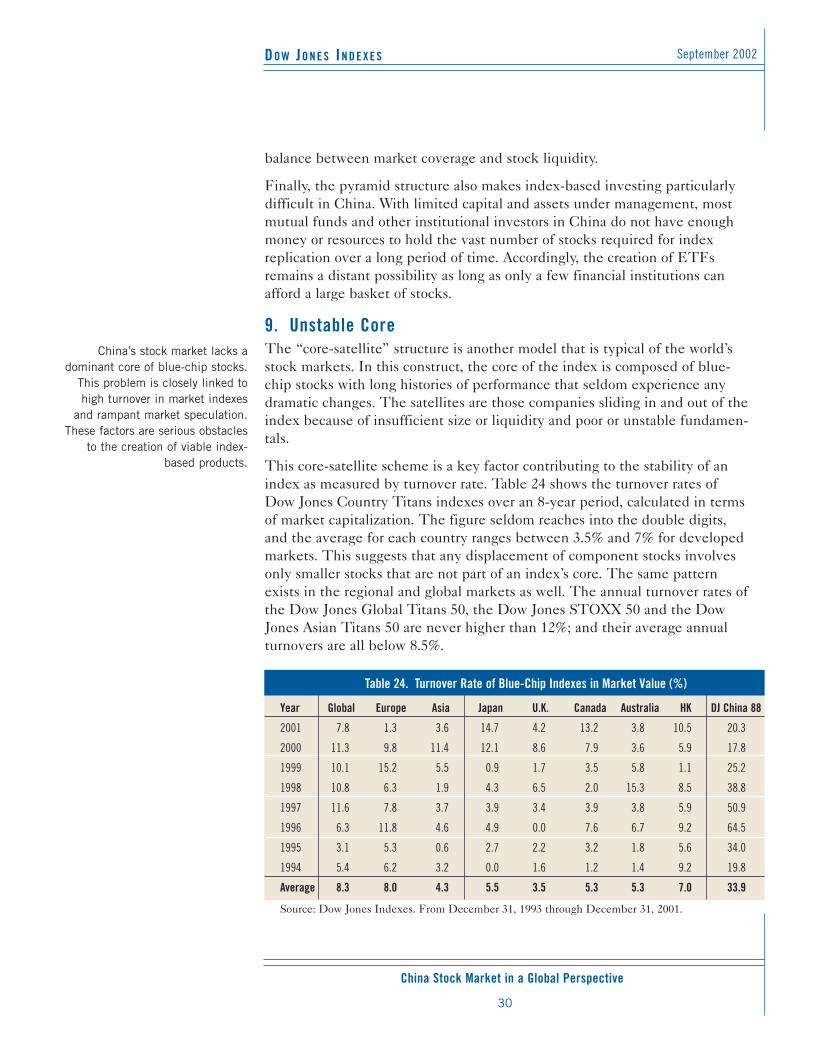
This core-satellite scheme is a key factor contributing to the stability of anindex as measured by turnover rate. Table 24 shows the turnover rates ofDow Jones Country Titans indexes over an 8-year period, calculated in termsof market capitalization. The figure seldom reaches into the double digits,and the average for each country ranges between 3.5% and 7% for developedmarkets. This suggests that any displacement of component stocks involvesonly smaller stocks that are not part of an index’s core. The same patternexists in the regional and global markets as well. The annual turnover rates ofthe Dow Jones Global Titans 50, the Dow Jones STOXX 50 and the DowJones Asian Titans 50 are never higher than 12%; and their average annualturnovers are all below 8.5%.
Table 24. Turnover Rate of Blue-Chip Indexes in Market Value (%)
Year Global Europe Asia Japan U.K. Canada Australia HK DJ China 88
2001 7.8 1.3 3.6 14.7 4.2 13.2 3.8 10.5 20.3
2000 11.3 9.8 11.4 12.1 8.6 7.9 3.6 5.9 17.8
1999 10.1 15.2 5.5 0.9 1.7 3.5 5.8 1.1 25.2
1998 10.8 6.3 1.9 4.3 6.5 2.0 15.3 8.5 38.8
1997 11.6 7.8 3.7 3.9 3.4 3.9 3.8 5.9 50.9
1996 6.3 11.8 4.6 4.9 0.0 7.6 6.7 9.2 64.5
1995 3.1 5.3 0.6 2.7 2.2 3.2 1.8 5.6 34.0
1994 5.4 6.2 3.2 0.0 1.6 1.2 1.4 9.2 19.8
Average 8.3 8.0 4.3 5.5 3.5 5.3 5.3 7.0 33.9
Source: Dow Jones Indexes. From December 31, 1993 through December 31, 2001.
DO W JO N E S IN D E X E S
China Stock Market in a Global Perspective
September, 2002
31
However, this pattern does not manifest in China because there is no blue-chip core—unless it is a highly unstable one—that can provide a focus pointfor medium and small stocks. As shown in Table 24, the average annualturnover rate in China during this eight-year period was nearly 34% with alow of 17.8% in 2000. That low is still higher than the highest turnover levelfor any of the other markets used in the comparison. This high turnover can-not be explained by the replacement of small-cap satellite stocks but rathermust involve the replacement of what would normally be considered corestocks if China had a standard market structure.
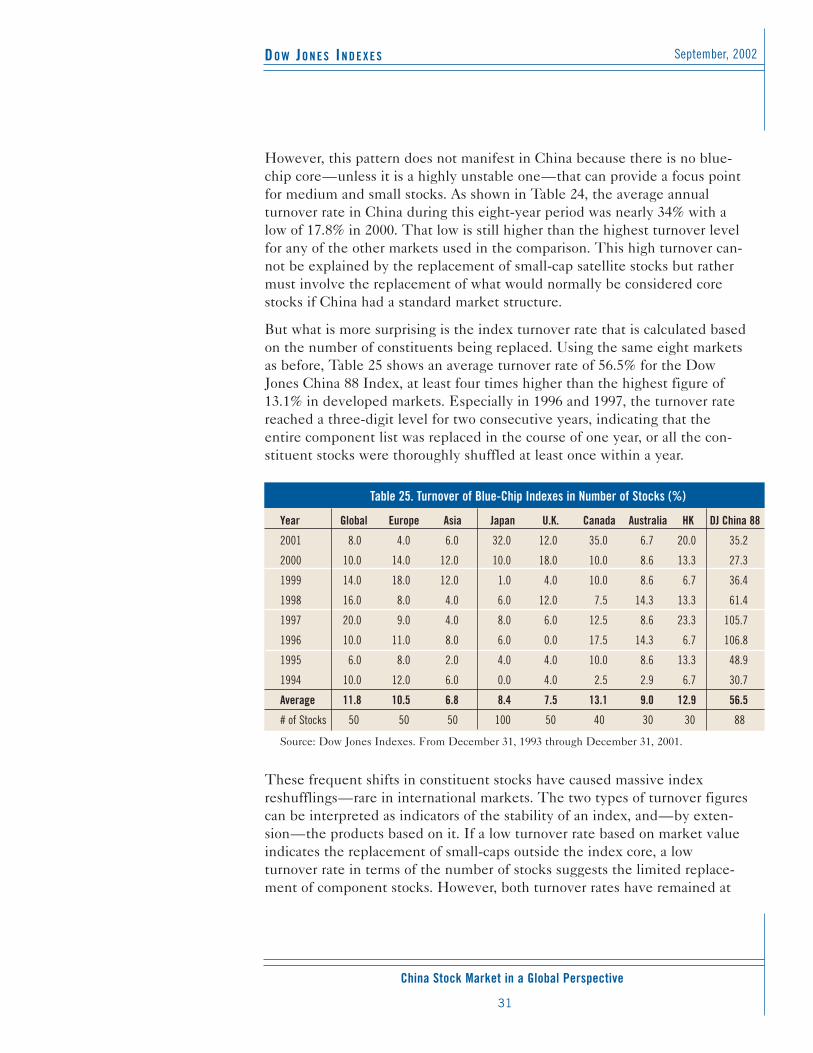
But what is more surprising is the index turnover rate that is calculated basedon the number of constituents being replaced. Using the same eight marketsas before, Table 25 shows an average turnover rate of 56.5% for the DowJones China 88 Index, at least four times higher than the highest figure of13.1% in developed markets. Especially in 1996 and 1997, the turnover ratereached a three-digit level for two consecutive years, indicating that theentire component list was replaced in the course of one year, or all the con-stituent stocks were thoroughly shuffled at least once within a year.
These frequent shifts in constituent stocks have caused massive indexreshufflings—rare in international markets. The two types of turnover figurescan be interpreted as indicators of the stability of an index, and—by exten-sion—the products based on it. If a low turnover rate based on market valueindicates the replacement of small-caps outside the index core, a lowturnover rate in terms of the number of stocks suggests the limited replace-ment of component stocks. However, both turnover rates have remained at
Table 25. Turnover of Blue-Chip Indexes in Number of Stocks (%)
Year Global Europe Asia Japan U.K. Canada Australia HK DJ China 88
2001 8.0 4.0 6.0 32.0 12.0 35.0 6.7 20.0 35.2
2000 10.0 14.0 12.0 10.0 18.0 10.0 8.6 13.3 27.3
1999 14.0 18.0 12.0 1.0 4.0 10.0 8.6 6.7 36.4
1998 16.0 8.0 4.0 6.0 12.0 7.5 14.3 13.3 61.4
1997 20.0 9.0 4.0 8.0 6.0 12.5 8.6 23.3 105.7
1996 10.0 11.0 8.0 6.0 0.0 17.5 14.3 6.7 106.8
1995 6.0 8.0 2.0 4.0 4.0 10.0 8.6 13.3 48.9
1994 10.0 12.0 6.0 0.0 4.0 2.5 2.9 6.7 30.7
Average 11.8 10.5 6.8 8.4 7.5 13.1 9.0 12.9 56.5
# of Stocks 50 50 50 100 50 40 30 30 88
Source: Dow Jones Indexes. From December 31, 1993 through December 31, 2001.
DO W JO N E S IN D E X E S
China Stock Market in a Global Perspective
September 2002
32
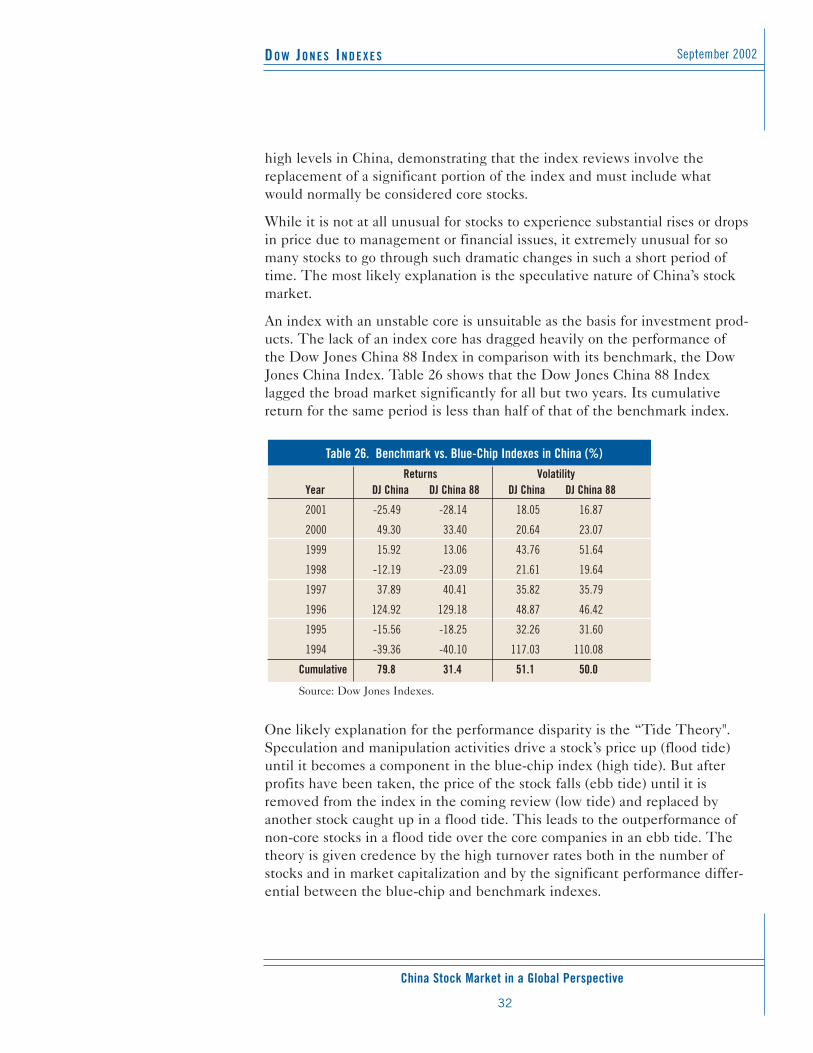
high levels in China, demonstrating that the index reviews involve thereplacement of a significant portion of the index and must include whatwould normally be considered core stocks.
While it is not at all unusual for stocks to experience substantial rises or dropsin price due to management or financial issues, it extremely unusual for somany stocks to go through such dramatic changes in such a short period oftime. The most likely explanation is the speculative nature of China’s stockmarket.
An index with an unstable core is unsuitable as the basis for investment prod-ucts. The lack of an index core has dragged heavily on the performance ofthe Dow Jones China 88 Index in comparison with its benchmark, the DowJones China Index. Table 26 shows that the Dow Jones China 88 Indexlagged the broad market significantly for all but two years. Its cumulativereturn for the same period is less than half of that of the benchmark index.
One likely explanation for the performance disparity is the “Tide Theory".Speculation and manipulation activities drive a stock’s price up (flood tide)until it becomes a component in the blue-chip index (high tide). But afterprofits have been taken, the price of the stock falls (ebb tide) until it isremoved from the index in the coming review (low tide) and replaced byanother stock caught up in a flood tide. This leads to the outperformance ofnon-core stocks in a flood tide over the core companies in an ebb tide. Thetheory is given credence by the high turnover rates both in the number ofstocks and in market capitalization and by the significant performance differ-ential between the blue-chip and benchmark indexes.
Table 26. Benchmark vs. Blue-Chip Indexes in China (%)Returns Volatility
Year DJ China DJ China 88 DJ China DJ China 88
2001 -25.49 -28.14 18.05 16.87
2000 49.30 33.40 20.64 23.07
1999 15.92 13.06 43.76 51.64
1998 -12.19 -23.09 21.61 19.64
1997 37.89 40.41 35.82 35.79
1996 124.92 129.18 48.87 46.42
1995 -15.56 -18.25 32.26 31.60
1994 -39.36 -40.10 117.03 110.08
Cumulative 79.8 31.4 51.1 50.0
Source: Dow Jones Indexes.
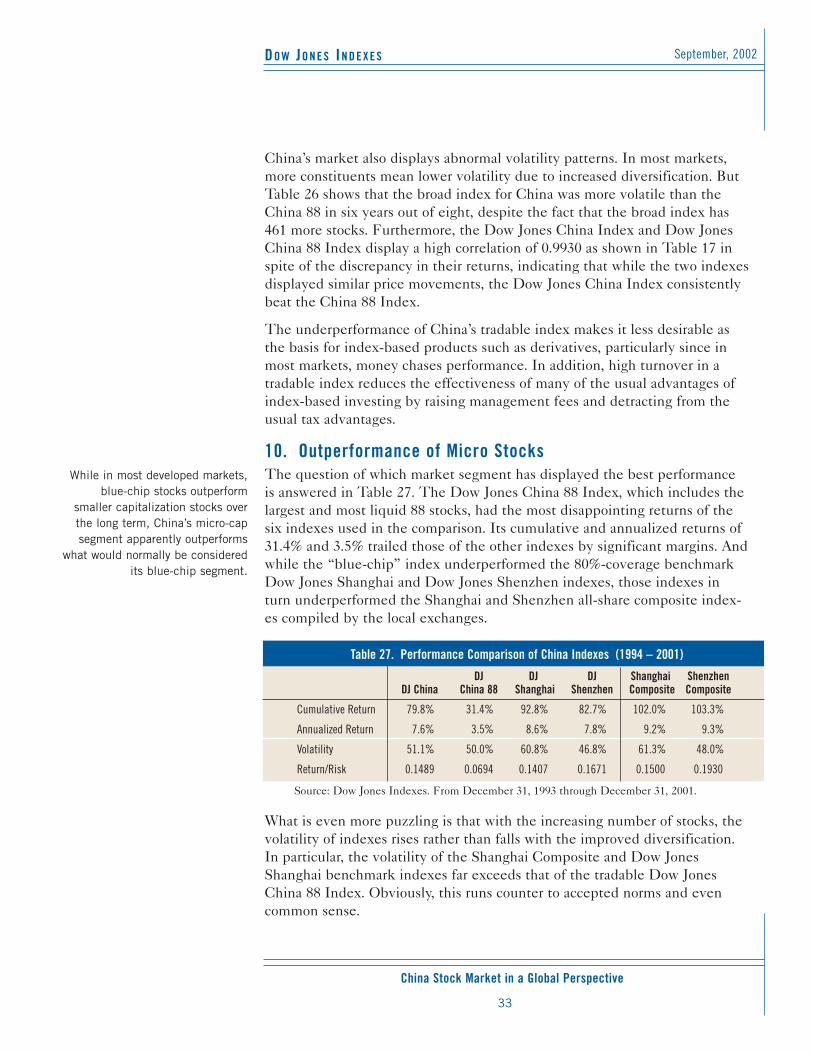
DO W JO N E S IN D E X E S
China Stock Market in a Global Perspective
September, 2002
33
While in most developed markets,blue-chip stocks outperform
smaller capitalization stocks overthe long term, China’s micro-capsegment apparently outperforms
what would normally be consideredits blue-chip segment.
China’s market also displays abnormal volatility patterns. In most markets,more constituents mean lower volatility due to increased diversification. ButTable 26 shows that the broad index for China was more volatile than theChina 88 in six years out of eight, despite the fact that the broad index has461 more stocks. Furthermore, the Dow Jones China Index and Dow JonesChina 88 Index display a high correlation of 0.9930 as shown in Table 17 inspite of the discrepancy in their returns, indicating that while the two indexesdisplayed similar price movements, the Dow Jones China Index consistentlybeat the China 88 Index.
The underperformance of China’s tradable index makes it less desirable asthe basis for index-based products such as derivatives, particularly since inmost markets, money chases performance. In addition, high turnover in atradable index reduces the effectiveness of many of the usual advantages ofindex-based investing by raising management fees and detracting from theusual tax advantages.
10. Outperformance of Micro StocksThe question of which market segment has displayed the best performanceis answered in Table 27. The Dow Jones China 88 Index, which includes thelargest and most liquid 88 stocks, had the most disappointing returns of thesix indexes used in the comparison. Its cumulative and annualized returns of31.4% and 3.5% trailed those of the other indexes by significant margins. Andwhile the “blue-chip” index underperformed the 80%-coverage benchmarkDow Jones Shanghai and Dow Jones Shenzhen indexes, those indexes inturn underperformed the Shanghai and Shenzhen all-share composite index-es compiled by the local exchanges.
What is even more puzzling is that with the increasing number of stocks, thevolatility of indexes rises rather than falls with the improved diversification.In particular, the volatility of the Shanghai Composite and Dow JonesShanghai benchmark indexes far exceeds that of the tradable Dow JonesChina 88 Index. Obviously, this runs counter to accepted norms and evencommon sense.
Table 27. Performance Comparison of China Indexes (1994 – 2001)
DJ DJ DJ Shanghai Shenzhen DJ China China 88 Shanghai Shenzhen Composite Composite
Cumulative Return 79.8% 31.4% 92.8% 82.7% 102.0% 103.3%
Annualized Return 7.6% 3.5% 8.6% 7.8% 9.2% 9.3%
Volatility 51.1% 50.0% 60.8% 46.8% 61.3% 48.0%
Return/Risk 0.1489 0.0694 0.1407 0.1671 0.1500 0.1930
Source: Dow Jones Indexes. From December 31, 1993 through December 31, 2001.
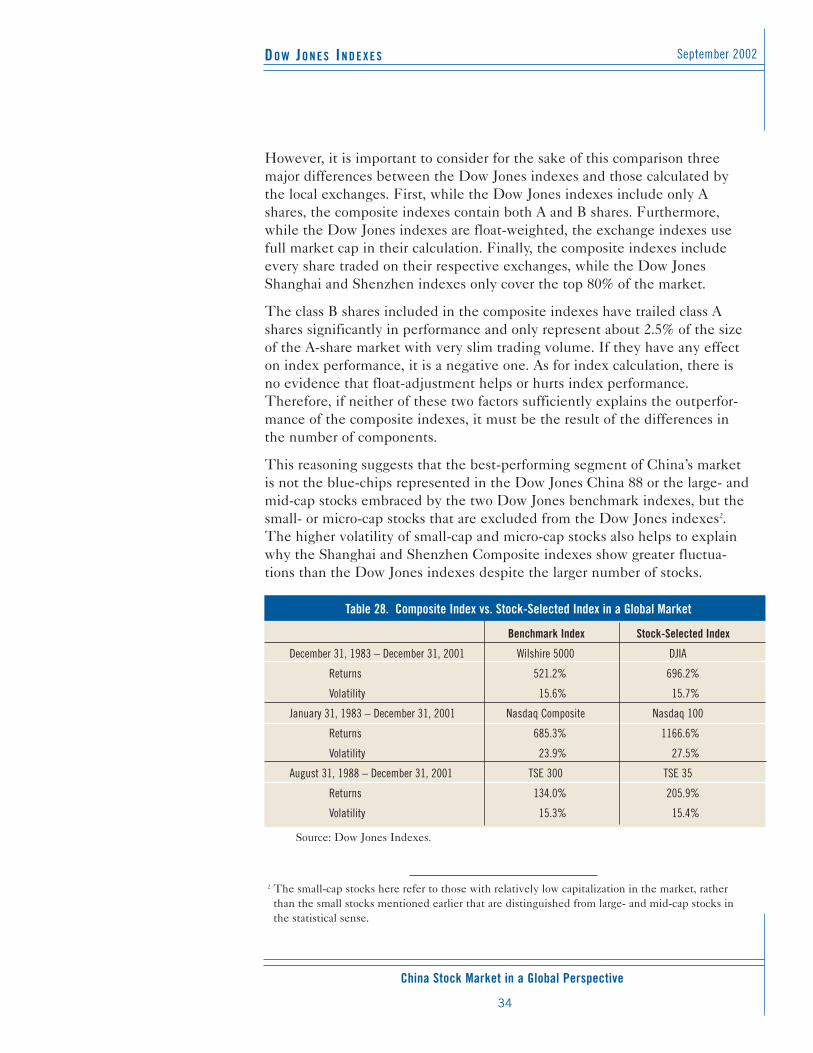
DO W JO N E S IN D E X E S
China Stock Market in a Global Perspective
September 2002
34
However, it is important to consider for the sake of this comparison threemajor differences between the Dow Jones indexes and those calculated bythe local exchanges. First, while the Dow Jones indexes include only Ashares, the composite indexes contain both A and B shares. Furthermore,while the Dow Jones indexes are float-weighted, the exchange indexes usefull market cap in their calculation. Finally, the composite indexes includeevery share traded on their respective exchanges, while the Dow JonesShanghai and Shenzhen indexes only cover the top 80% of the market.
The class B shares included in the composite indexes have trailed class Ashares significantly in performance and only represent about 2.5% of the sizeof the A-share market with very slim trading volume. If they have any effecton index performance, it is a negative one. As for index calculation, there isno evidence that float-adjustment helps or hurts index performance.Therefore, if neither of these two factors sufficiently explains the outperfor-mance of the composite indexes, it must be the result of the differences inthe number of components.
This reasoning suggests that the best-performing segment of China’s marketis not the blue-chips represented in the Dow Jones China 88 or the large- andmid-cap stocks embraced by the two Dow Jones benchmark indexes, but thesmall- or micro-cap stocks that are excluded from the Dow Jones indexes2.The higher volatility of small-cap and micro-cap stocks also helps to explainwhy the Shanghai and Shenzhen Composite indexes show greater fluctua-tions than the Dow Jones indexes despite the larger number of stocks.
Table 28. Composite Index vs. Stock-Selected Index in a Global Market
Benchmark Index Stock-Selected Index
December 31, 1983 – December 31, 2001 Wilshire 5000 DJIA
Returns 521.2% 696.2%
Volatility 15.6% 15.7%
January 31, 1983 – December 31, 2001 Nasdaq Composite Nasdaq 100
Returns 685.3% 1166.6%
Volatility 23.9% 27.5%
August 31, 1988 – December 31, 2001 TSE 300 TSE 35
Returns 134.0% 205.9%
Volatility 15.3% 15.4%
Source: Dow Jones Indexes.
2 The small-cap stocks here refer to those with relatively low capitalization in the market, ratherthan the small stocks mentioned earlier that are distinguished from large- and mid-cap stocks inthe statistical sense.
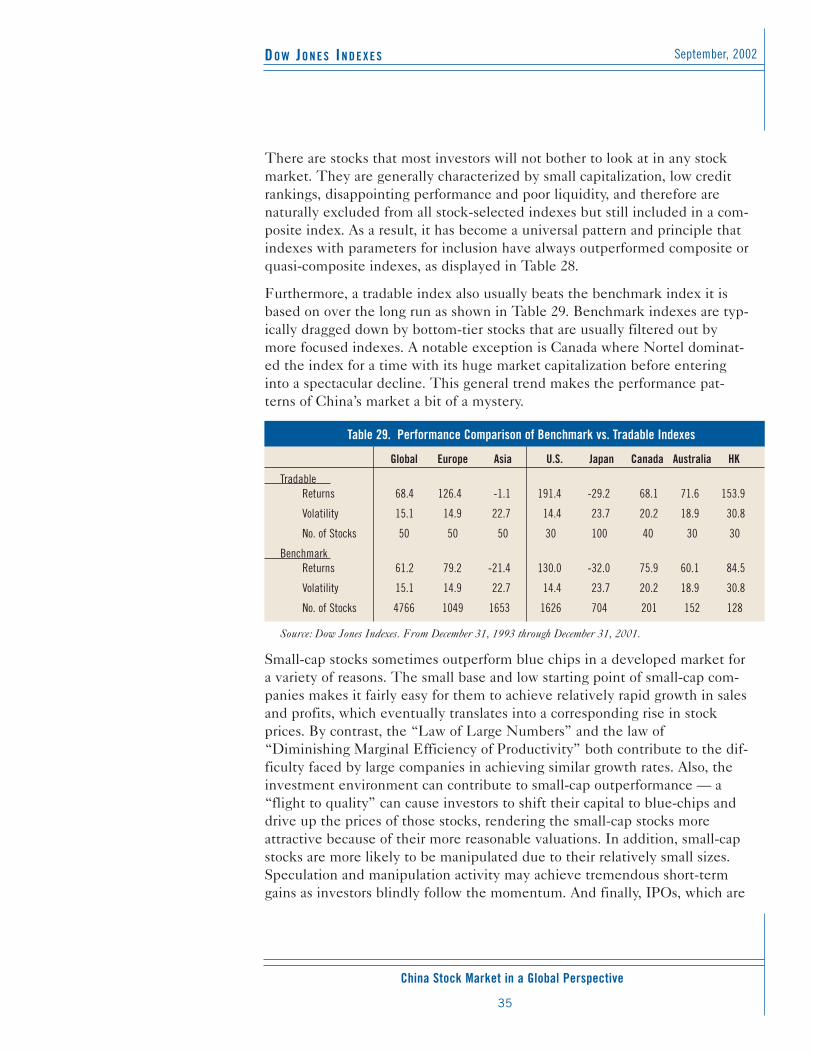
DO W JO N E S IN D E X E S
China Stock Market in a Global Perspective
September, 2002
35
There are stocks that most investors will not bother to look at in any stockmarket. They are generally characterized by small capitalization, low creditrankings, disappointing performance and poor liquidity, and therefore are naturally excluded from all stock-selected indexes but still included in a com-posite index. As a result, it has become a universal pattern and principle thatindexes with parameters for inclusion have always outperformed composite orquasi-composite indexes, as displayed in Table 28.
Furthermore, a tradable index also usually beats the benchmark index it isbased on over the long run as shown in Table 29. Benchmark indexes are typ-ically dragged down by bottom-tier stocks that are usually filtered out bymore focused indexes. A notable exception is Canada where Nortel dominat-ed the index for a time with its huge market capitalization before enteringinto a spectacular decline. This general trend makes the performance pat-terns of China’s market a bit of a mystery.
Small-cap stocks sometimes outperform blue chips in a developed market fora variety of reasons. The small base and low starting point of small-cap com-panies makes it fairly easy for them to achieve relatively rapid growth in salesand profits, which eventually translates into a corresponding rise in stockprices. By contrast, the “Law of Large Numbers” and the law of“Diminishing Marginal Efficiency of Productivity” both contribute to the dif-ficulty faced by large companies in achieving similar growth rates. Also, theinvestment environment can contribute to small-cap outperformance — a“flight to quality” can cause investors to shift their capital to blue-chips anddrive up the prices of those stocks, rendering the small-cap stocks moreattractive because of their more reasonable valuations. In addition, small-capstocks are more likely to be manipulated due to their relatively small sizes.Speculation and manipulation activity may achieve tremendous short-termgains as investors blindly follow the momentum. And finally, IPOs, which are
Table 29. Performance Comparison of Benchmark vs. Tradable Indexes
Global Europe Asia U.S. Japan Canada Australia HK
TradableReturns 68.4 126.4 -1.1 191.4 -29.2 68.1 71.6 153.9
Volatility 15.1 14.9 22.7 14.4 23.7 20.2 18.9 30.8
No. of Stocks 50 50 50 30 100 40 30 30
BenchmarkReturns 61.2 79.2 -21.4 130.0 -32.0 75.9 60.1 84.5
Volatility 15.1 14.9 22.7 14.4 23.7 20.2 18.9 30.8
No. of Stocks 4766 1049 1653 1626 704 201 152 128
Source: Dow Jones Indexes. From December 31, 1993 through December 31, 2001.
DO W JO N E S IN D E X E S
China Stock Market in a Global Perspective
September 2002
36
China’s stock market displaysextremely high turnover, with an
average holding period of about twomonths from 1994 through 2001.
The figure is indicative of the market’s rampant speculation.
generally small-cap companies, typically deliver impressive returns after list-ing, because they are always priced with some room for increases. Such “IPOEffects” may impact an index despite any divisor adjustments, because theirinitial rise may continue for a number of days.
In developed stock markets, a small-cap rally usually is the result of high val-uations in the large-cap segment and the fact that it is much easier for small-cap stocks to show high percentage increases for their prices. These small-caprallies usually do not last that long. For one thing, IPO effects and anyattempts at market manipulation are always small enough to be ignoredbecause of the dominance of blue-chip stocks in most markets. But in China,the outperformance of its smallest stocks is driven mainly by speculation andnew IPOs. On one hand, statistically speaking, small-caps in China have nei-ther a higher growth rate nor a significantly lower market valuation in P/Eratio. On the other hand, the pyramid structure of the market indirectlyamplifies the influence of stock manipulation on an index. The limited sizedifferences among companies make stock prices easier to manipulate, andthat manipulation can easily affect the movement of the index. Meanwhile,since IPOs are so much larger in proportion to the rest of China’s market thanin other markets, as analyzed before, they play a much more significant rolein composite indexes, and IPO effects may become a decisive element influ-encing the market movement to some extent.
11. Incredible SpeculationThe most commonly used indicator to measure the degree of speculation in amarket is the average stock turnover calculated as the total annual tradingvalue divided by the average market capitalization. A higher turnover pointsto a higher frequency of trading, or a shorter holding period, which in turnimplies a greater level of speculation. A turnover of 100% suggests that theaverage holding period for a single stock is one year. Statistics show that adeveloped market usually has a lower turnover level than an emerging mar-ket, because long-term investing and buy-and-hold strategies are moreingrained in the investing culture. Investors have more confidence in long-term economic development and the steady growth of corporate profits.
Table 30 compares the turnover in China with that of several developed mar-kets on an annual basis from 1994 to 2001. The annual average for China overthe eight-year period was more than 500%, suggesting that an individualstock changed hands five times a year on average, or the average holdingperiod is merely a little over two months. That is roughly ten times the aver-age turnover of most developed markets. In a developed market, the normalholding period for a single stock is about two years — even three years forCanada and Singapore. However, China’s annual turnover fell steadilythroughout the eight-year period, reflecting a healthy trend.
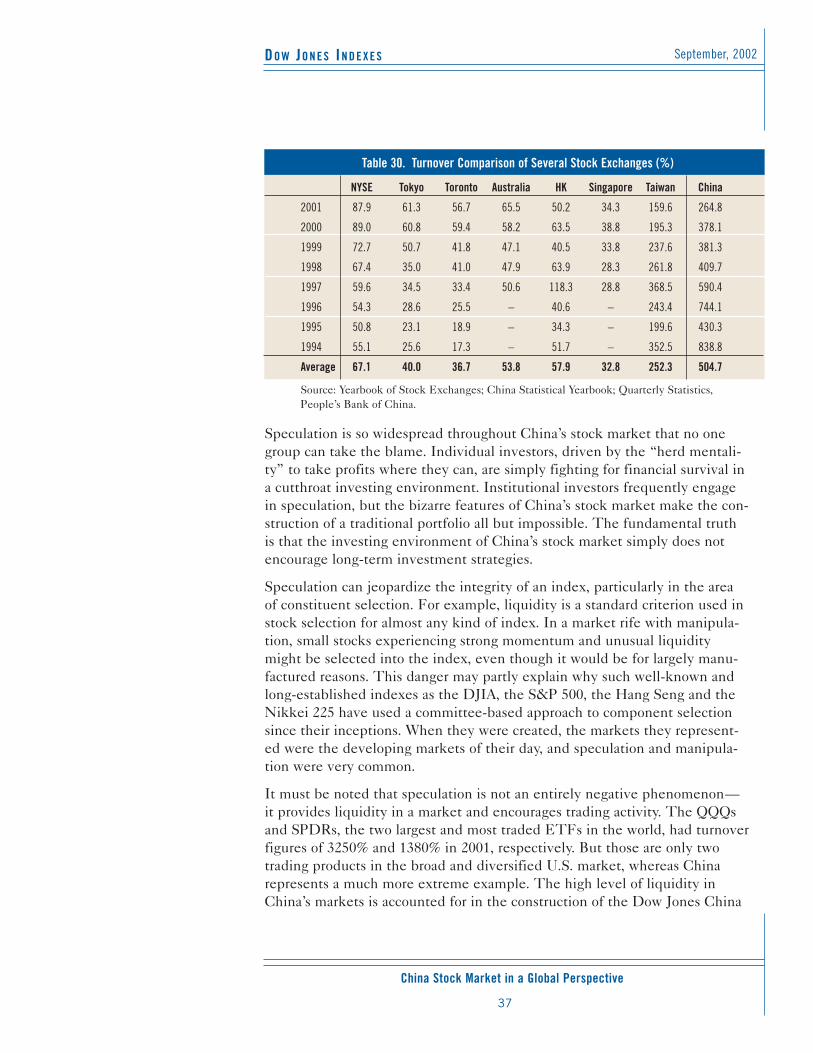
DO W JO N E S IN D E X E S
China Stock Market in a Global Perspective
September, 2002
37
Speculation is so widespread throughout China’s stock market that no onegroup can take the blame. Individual investors, driven by the “herd mentali-ty” to take profits where they can, are simply fighting for financial survival ina cutthroat investing environment. Institutional investors frequently engagein speculation, but the bizarre features of China’s stock market make the con-struction of a traditional portfolio all but impossible. The fundamental truthis that the investing environment of China’s stock market simply does notencourage long-term investment strategies.
Speculation can jeopardize the integrity of an index, particularly in the areaof constituent selection. For example, liquidity is a standard criterion used instock selection for almost any kind of index. In a market rife with manipula-tion, small stocks experiencing strong momentum and unusual liquiditymight be selected into the index, even though it would be for largely manu-factured reasons. This danger may partly explain why such well-known andlong-established indexes as the DJIA, the S&P 500, the Hang Seng and theNikkei 225 have used a committee-based approach to component selectionsince their inceptions. When they were created, the markets they represent-ed were the developing markets of their day, and speculation and manipula-tion were very common.
It must be noted that speculation is not an entirely negative phenomenon—it provides liquidity in a market and encourages trading activity. The QQQsand SPDRs, the two largest and most traded ETFs in the world, had turnoverfigures of 3250% and 1380% in 2001, respectively. But those are only twotrading products in the broad and diversified U.S. market, whereas Chinarepresents a much more extreme example. The high level of liquidity inChina’s markets is accounted for in the construction of the Dow Jones China
Table 30. Turnover Comparison of Several Stock Exchanges (%)
NYSE Tokyo Toronto Australia HK Singapore Taiwan China
2001 87.9 61.3 56.7 65.5 50.2 34.3 159.6 264.8
2000 89.0 60.8 59.4 58.2 63.5 38.8 195.3 378.1
1999 72.7 50.7 41.8 47.1 40.5 33.8 237.6 381.3
1998 67.4 35.0 41.0 47.9 63.9 28.3 261.8 409.7
1997 59.6 34.5 33.4 50.6 118.3 28.8 368.5 590.4
1996 54.3 28.6 25.5 – 40.6 – 243.4 744.1
1995 50.8 23.1 18.9 – 34.3 – 199.6 430.3
1994 55.1 25.6 17.3 – 51.7 – 352.5 838.8
Average 67.1 40.0 36.7 53.8 57.9 32.8 252.3 504.7
Source: Yearbook of Stock Exchanges; China Statistical Yearbook; Quarterly Statistics, People’s Bank of China.
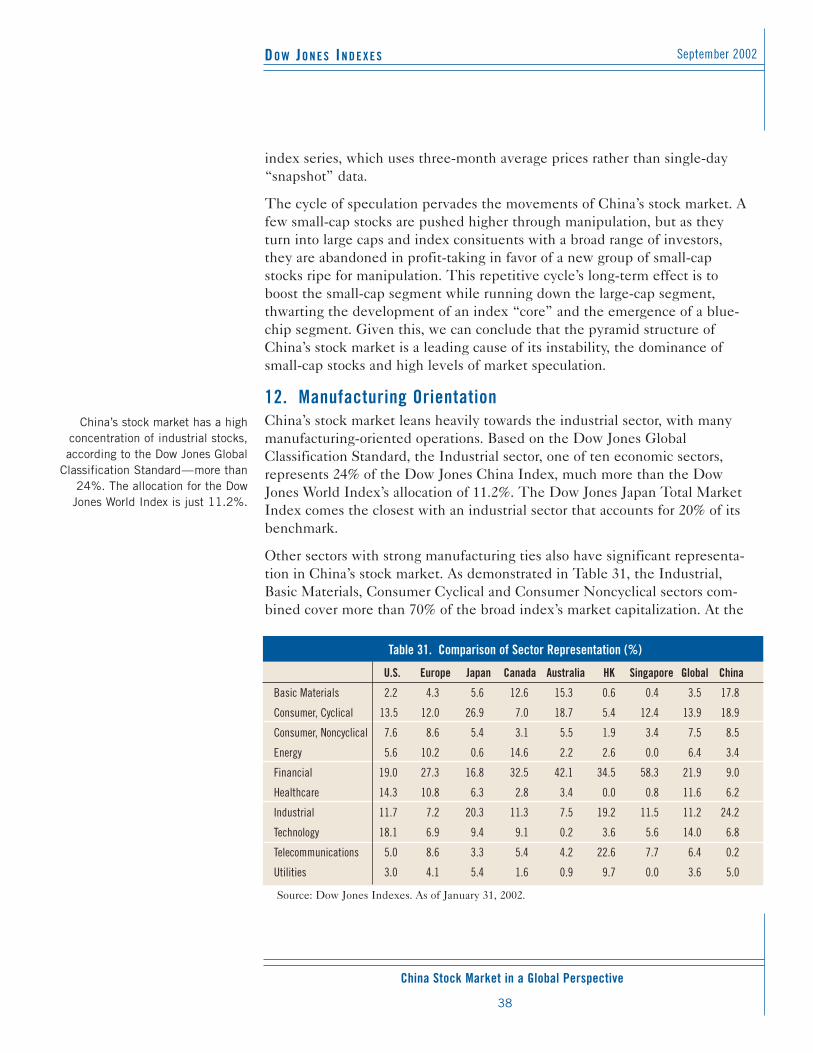
DO W JO N E S IN D E X E S
China Stock Market in a Global Perspective
September 2002
38
China’s stock market has a highconcentration of industrial stocks,according to the Dow Jones Global
Classification Standard—more than24%. The allocation for the Dow
Jones World Index is just 11.2%.
index series, which uses three-month average prices rather than single-day“snapshot” data.
The cycle of speculation pervades the movements of China’s stock market. Afew small-cap stocks are pushed higher through manipulation, but as theyturn into large caps and index consituents with a broad range of investors,they are abandoned in profit-taking in favor of a new group of small-capstocks ripe for manipulation. This repetitive cycle’s long-term effect is toboost the small-cap segment while running down the large-cap segment,thwarting the development of an index “core” and the emergence of a blue-chip segment. Given this, we can conclude that the pyramid structure ofChina’s stock market is a leading cause of its instability, the dominance ofsmall-cap stocks and high levels of market speculation.
12. Manufacturing OrientationChina’s stock market leans heavily towards the industrial sector, with manymanufacturing-oriented operations. Based on the Dow Jones GlobalClassification Standard, the Industrial sector, one of ten economic sectors,represents 24% of the Dow Jones China Index, much more than the DowJones World Index’s allocation of 11.2%. The Dow Jones Japan Total MarketIndex comes the closest with an industrial sector that accounts for 20% of itsbenchmark.
Other sectors with strong manufacturing ties also have significant representa-tion in China’s stock market. As demonstrated in Table 31, the Industrial,Basic Materials, Consumer Cyclical and Consumer Noncyclical sectors com-bined cover more than 70% of the broad index’s market capitalization. At the
Table 31. Comparison of Sector Representation (%)
U.S. Europe Japan Canada Australia HK Singapore Global China
Basic Materials 2.2 4.3 5.6 12.6 15.3 0.6 0.4 3.5 17.8
Consumer, Cyclical 13.5 12.0 26.9 7.0 18.7 5.4 12.4 13.9 18.9
Consumer, Noncyclical 7.6 8.6 5.4 3.1 5.5 1.9 3.4 7.5 8.5
Energy 5.6 10.2 0.6 14.6 2.2 2.6 0.0 6.4 3.4
Financial 19.0 27.3 16.8 32.5 42.1 34.5 58.3 21.9 9.0
Healthcare 14.3 10.8 6.3 2.8 3.4 0.0 0.8 11.6 6.2
Industrial 11.7 7.2 20.3 11.3 7.5 19.2 11.5 11.2 24.2
Technology 18.1 6.9 9.4 9.1 0.2 3.6 5.6 14.0 6.8
Telecommunications 5.0 8.6 3.3 5.4 4.2 22.6 7.7 6.4 0.2
Utilities 3.0 4.1 5.4 1.6 0.9 9.7 0.0 3.6 5.0
Source: Dow Jones Indexes. As of January 31, 2002.
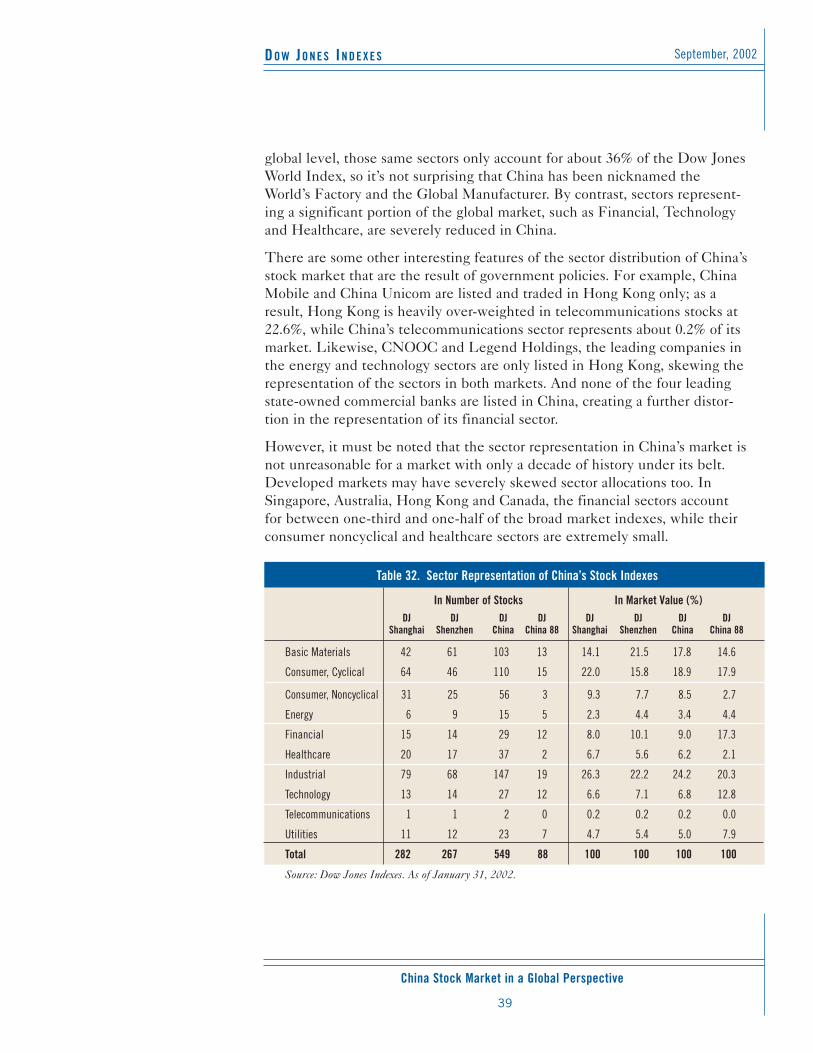
DO W JO N E S IN D E X E S
China Stock Market in a Global Perspective
September, 2002
39
global level, those same sectors only account for about 36% of the Dow JonesWorld Index, so it’s not surprising that China has been nicknamed theWorld’s Factory and the Global Manufacturer. By contrast, sectors represent-ing a significant portion of the global market, such as Financial, Technologyand Healthcare, are severely reduced in China.
There are some other interesting features of the sector distribution of China’sstock market that are the result of government policies. For example, ChinaMobile and China Unicom are listed and traded in Hong Kong only; as aresult, Hong Kong is heavily over-weighted in telecommunications stocks at22.6%, while China’s telecommunications sector represents about 0.2% of itsmarket. Likewise, CNOOC and Legend Holdings, the leading companies inthe energy and technology sectors are only listed in Hong Kong, skewing therepresentation of the sectors in both markets. And none of the four leadingstate-owned commercial banks are listed in China, creating a further distor-tion in the representation of its financial sector.
However, it must be noted that the sector representation in China’s market isnot unreasonable for a market with only a decade of history under its belt.Developed markets may have severely skewed sector allocations too. InSingapore, Australia, Hong Kong and Canada, the financial sectors accountfor between one-third and one-half of the broad market indexes, while theirconsumer noncyclical and healthcare sectors are extremely small.
Table 32. Sector Representation of China’s Stock Indexes
In Number of Stocks In Market Value (%)DJ DJ DJ DJ DJ DJ DJ DJ
Shanghai Shenzhen China China 88 Shanghai Shenzhen China China 88
Basic Materials 42 61 103 13 14.1 21.5 17.8 14.6
Consumer, Cyclical 64 46 110 15 22.0 15.8 18.9 17.9
Consumer, Noncyclical 31 25 56 3 9.3 7.7 8.5 2.7
Energy 6 9 15 5 2.3 4.4 3.4 4.4
Financial 15 14 29 12 8.0 10.1 9.0 17.3
Healthcare 20 17 37 2 6.7 5.6 6.2 2.1
Industrial 79 68 147 19 26.3 22.2 24.2 20.3
Technology 13 14 27 12 6.6 7.1 6.8 12.8
Telecommunications 1 1 2 0 0.2 0.2 0.2 0.0
Utilities 11 12 23 7 4.7 5.4 5.0 7.9
Total 282 267 549 88 100 100 100 100
Source: Dow Jones Indexes. As of January 31, 2002.
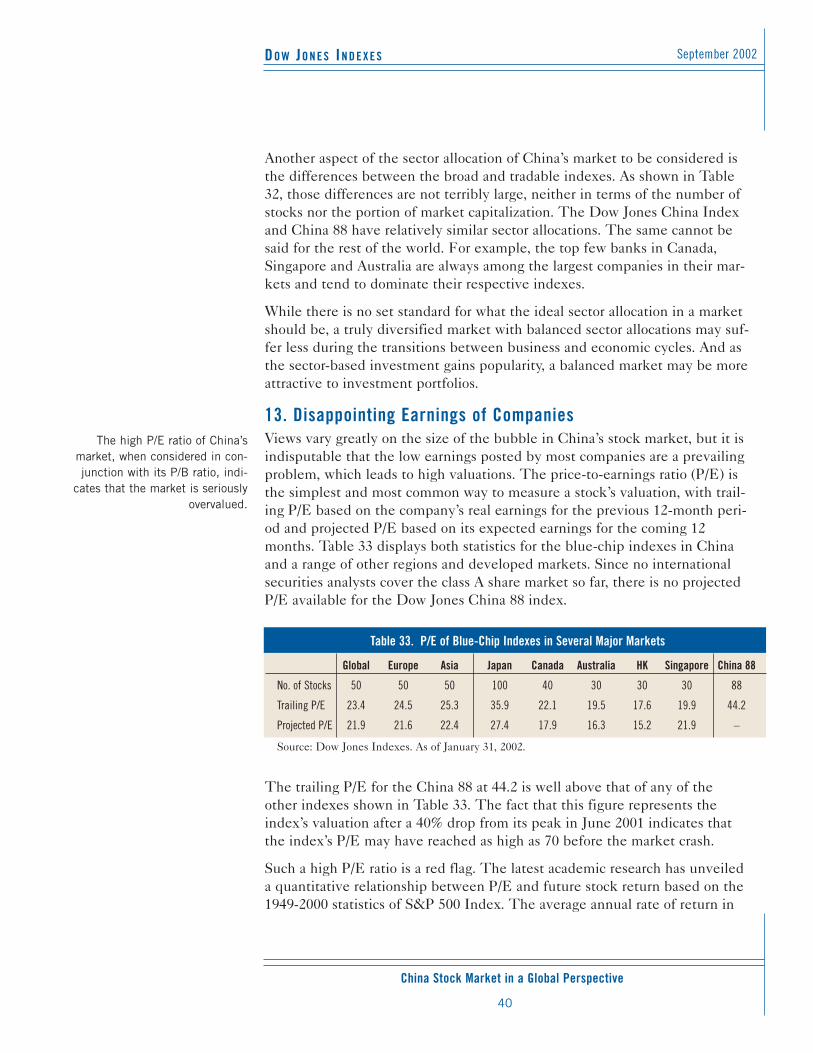
DO W JO N E S IN D E X E S
China Stock Market in a Global Perspective
September 2002
40
The high P/E ratio of China’s market, when considered in con-junction with its P/B ratio, indi-
cates that the market is seriouslyovervalued.
Another aspect of the sector allocation of China’s market to be considered isthe differences between the broad and tradable indexes. As shown in Table32, those differences are not terribly large, neither in terms of the number ofstocks nor the portion of market capitalization. The Dow Jones China Indexand China 88 have relatively similar sector allocations. The same cannot besaid for the rest of the world. For example, the top few banks in Canada,Singapore and Australia are always among the largest companies in their mar-kets and tend to dominate their respective indexes.
While there is no set standard for what the ideal sector allocation in a marketshould be, a truly diversified market with balanced sector allocations may suf-fer less during the transitions between business and economic cycles. And asthe sector-based investment gains popularity, a balanced market may be moreattractive to investment portfolios.
13. Disappointing Earnings of CompaniesViews vary greatly on the size of the bubble in China’s stock market, but it isindisputable that the low earnings posted by most companies are a prevailingproblem, which leads to high valuations. The price-to-earnings ratio (P/E) isthe simplest and most common way to measure a stock’s valuation, with trail-ing P/E based on the company’s real earnings for the previous 12-month peri-od and projected P/E based on its expected earnings for the coming 12months. Table 33 displays both statistics for the blue-chip indexes in Chinaand a range of other regions and developed markets. Since no internationalsecurities analysts cover the class A share market so far, there is no projectedP/E available for the Dow Jones China 88 index.
The trailing P/E for the China 88 at 44.2 is well above that of any of theother indexes shown in Table 33. The fact that this figure represents theindex’s valuation after a 40% drop from its peak in June 2001 indicates thatthe index’s P/E may have reached as high as 70 before the market crash.
Such a high P/E ratio is a red flag. The latest academic research has unveileda quantitative relationship between P/E and future stock return based on the1949-2000 statistics of S&P 500 Index. The average annual rate of return in
Table 33. P/E of Blue-Chip Indexes in Several Major Markets
Global Europe Asia Japan Canada Australia HK Singapore China 88
No. of Stocks 50 50 50 100 40 30 30 30 88
Trailing P/E 23.4 24.5 25.3 35.9 22.1 19.5 17.6 19.9 44.2
Projected P/E 21.9 21.6 22.4 27.4 17.9 16.3 15.2 21.9 –
Source: Dow Jones Indexes. As of January 31, 2002.
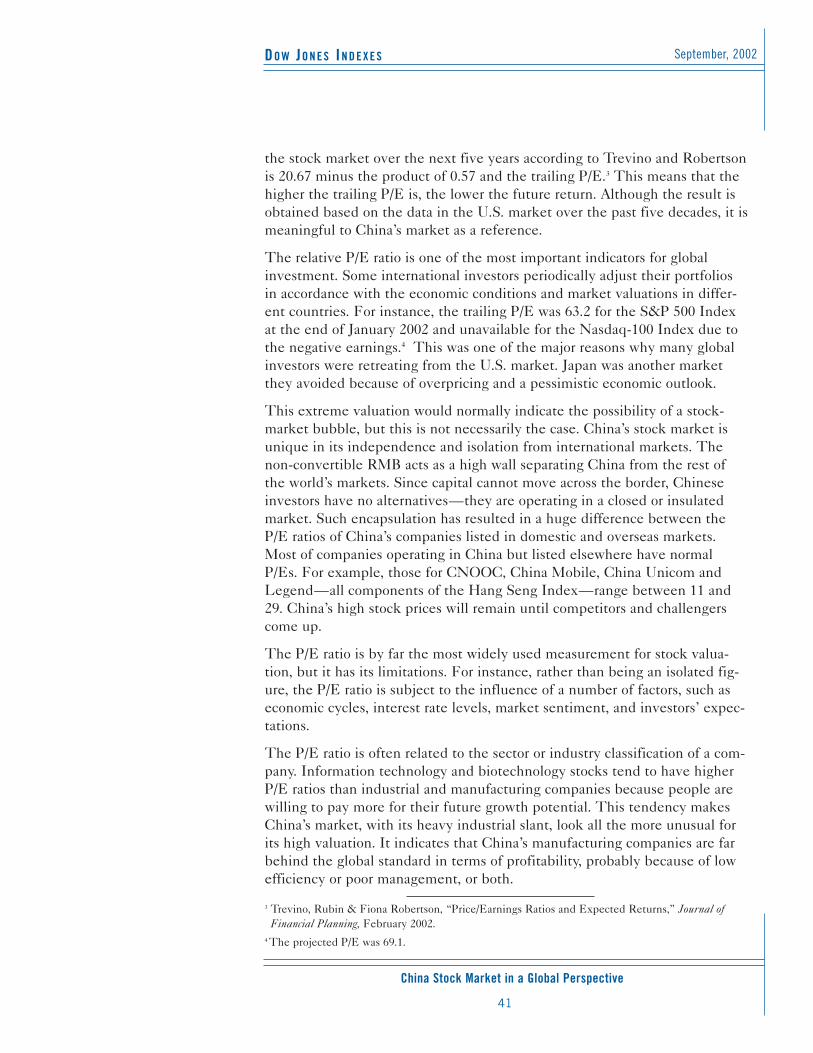
DO W JO N E S IN D E X E S
China Stock Market in a Global Perspective
September, 2002
41
the stock market over the next five years according to Trevino and Robertsonis 20.67 minus the product of 0.57 and the trailing P/E.3 This means that thehigher the trailing P/E is, the lower the future return. Although the result isobtained based on the data in the U.S. market over the past five decades, it ismeaningful to China’s market as a reference.
The relative P/E ratio is one of the most important indicators for globalinvestment. Some international investors periodically adjust their portfoliosin accordance with the economic conditions and market valuations in differ-ent countries. For instance, the trailing P/E was 63.2 for the S&P 500 Indexat the end of January 2002 and unavailable for the Nasdaq-100 Index due tothe negative earnings.4 This was one of the major reasons why many globalinvestors were retreating from the U.S. market. Japan was another marketthey avoided because of overpricing and a pessimistic economic outlook.
This extreme valuation would normally indicate the possibility of a stock-market bubble, but this is not necessarily the case. China’s stock market isunique in its independence and isolation from international markets. Thenon-convertible RMB acts as a high wall separating China from the rest ofthe world’s markets. Since capital cannot move across the border, Chineseinvestors have no alternatives—they are operating in a closed or insulatedmarket. Such encapsulation has resulted in a huge difference between theP/E ratios of China’s companies listed in domestic and overseas markets.Most of companies operating in China but listed elsewhere have normalP/Es. For example, those for CNOOC, China Mobile, China Unicom andLegend—all components of the Hang Seng Index—range between 11 and29. China’s high stock prices will remain until competitors and challengerscome up.
The P/E ratio is by far the most widely used measurement for stock valua-tion, but it has its limitations. For instance, rather than being an isolated fig-ure, the P/E ratio is subject to the influence of a number of factors, such aseconomic cycles, interest rate levels, market sentiment, and investors’ expec-tations.
The P/E ratio is often related to the sector or industry classification of a com-pany. Information technology and biotechnology stocks tend to have higherP/E ratios than industrial and manufacturing companies because people arewilling to pay more for their future growth potential. This tendency makesChina’s market, with its heavy industrial slant, look all the more unusual forits high valuation. It indicates that China’s manufacturing companies are farbehind the global standard in terms of profitability, probably because of lowefficiency or poor management, or both.
3 Trevino, Rubin & Fiona Robertson, “Price/Earnings Ratios and Expected Returns,” Journal ofFinancial Planning, February 2002.
4 The projected P/E was 69.1.
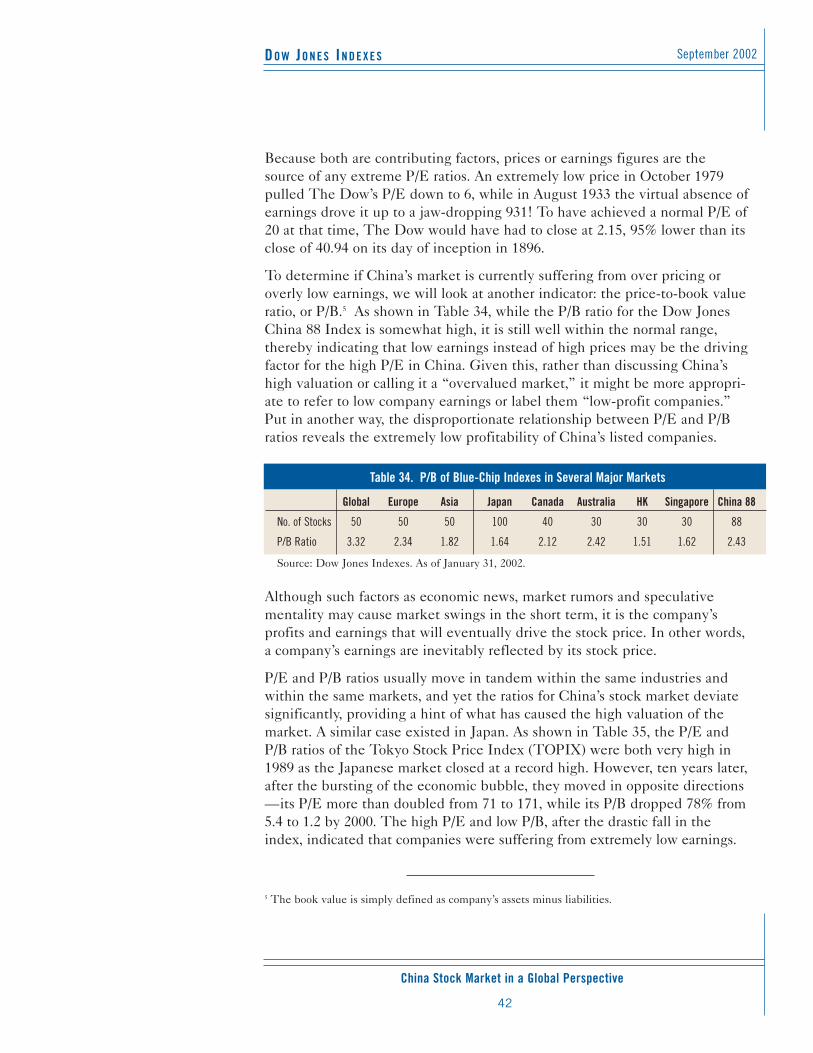
DO W JO N E S IN D E X E S
China Stock Market in a Global Perspective
September 2002
42
Because both are contributing factors, prices or earnings figures are thesource of any extreme P/E ratios. An extremely low price in October 1979pulled The Dow’s P/E down to 6, while in August 1933 the virtual absence ofearnings drove it up to a jaw-dropping 931! To have achieved a normal P/E of20 at that time, The Dow would have had to close at 2.15, 95% lower than itsclose of 40.94 on its day of inception in 1896.
To determine if China’s market is currently suffering from over pricing oroverly low earnings, we will look at another indicator: the price-to-book valueratio, or P/B.5 As shown in Table 34, while the P/B ratio for the Dow JonesChina 88 Index is somewhat high, it is still well within the normal range,thereby indicating that low earnings instead of high prices may be the drivingfactor for the high P/E in China. Given this, rather than discussing China’shigh valuation or calling it a “overvalued market,” it might be more appropri-ate to refer to low company earnings or label them “low-profit companies.”Put in another way, the disproportionate relationship between P/E and P/Bratios reveals the extremely low profitability of China’s listed companies.
Although such factors as economic news, market rumors and speculativementality may cause market swings in the short term, it is the company’sprofits and earnings that will eventually drive the stock price. In other words,a company’s earnings are inevitably reflected by its stock price.
P/E and P/B ratios usually move in tandem within the same industries andwithin the same markets, and yet the ratios for China’s stock market deviatesignificantly, providing a hint of what has caused the high valuation of themarket. A similar case existed in Japan. As shown in Table 35, the P/E andP/B ratios of the Tokyo Stock Price Index (TOPIX) were both very high in1989 as the Japanese market closed at a record high. However, ten years later,after the bursting of the economic bubble, they moved in opposite directions—its P/E more than doubled from 71 to 171, while its P/B dropped 78% from5.4 to 1.2 by 2000. The high P/E and low P/B, after the drastic fall in theindex, indicated that companies were suffering from extremely low earnings.
Table 34. P/B of Blue-Chip Indexes in Several Major Markets
Global Europe Asia Japan Canada Australia HK Singapore China 88
No. of Stocks 50 50 50 100 40 30 30 30 88
P/B Ratio 3.32 2.34 1.82 1.64 2.12 2.42 1.51 1.62 2.43
Source: Dow Jones Indexes. As of January 31, 2002.
5 The book value is simply defined as company’s assets minus liabilities.
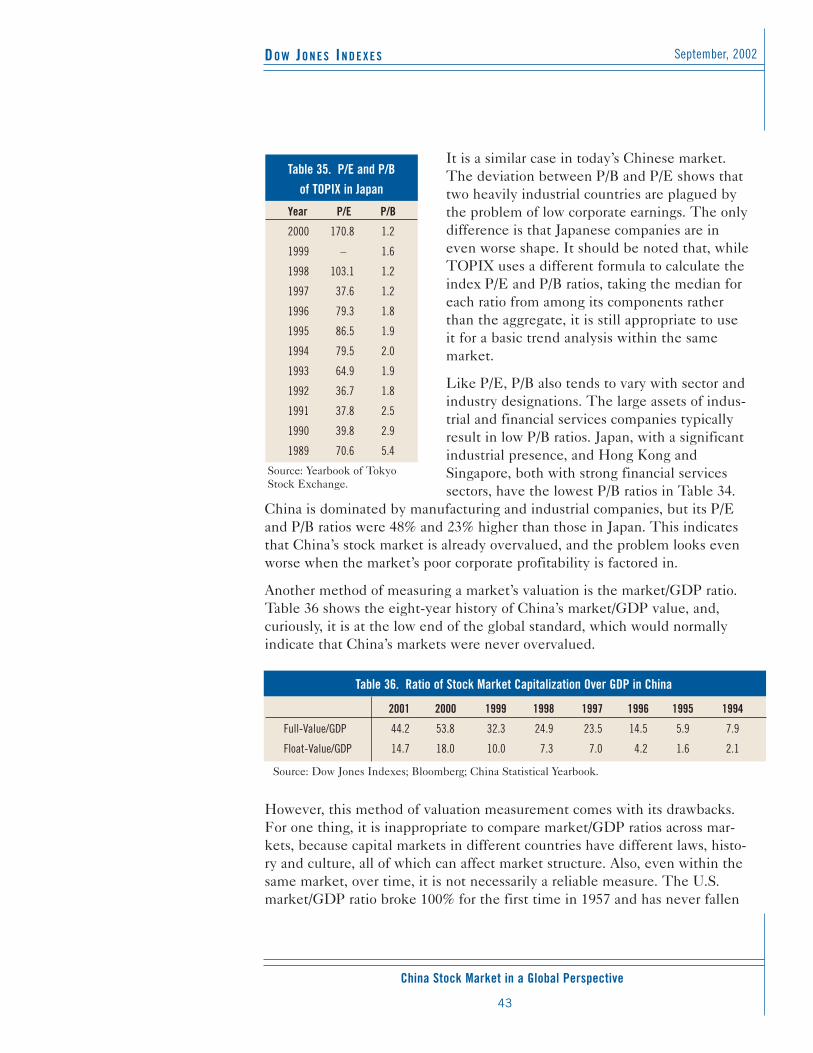
DO W JO N E S IN D E X E S
China Stock Market in a Global Perspective
September, 2002
43
It is a similar case in today’s Chinese market.The deviation between P/B and P/E shows thattwo heavily industrial countries are plagued bythe problem of low corporate earnings. The onlydifference is that Japanese companies are ineven worse shape. It should be noted that, whileTOPIX uses a different formula to calculate theindex P/E and P/B ratios, taking the median foreach ratio from among its components ratherthan the aggregate, it is still appropriate to useit for a basic trend analysis within the samemarket.
Like P/E, P/B also tends to vary with sector andindustry designations. The large assets of indus-trial and financial services companies typicallyresult in low P/B ratios. Japan, with a significantindustrial presence, and Hong Kong andSingapore, both with strong financial servicessectors, have the lowest P/B ratios in Table 34.
China is dominated by manufacturing and industrial companies, but its P/Eand P/B ratios were 48% and 23% higher than those in Japan. This indicatesthat China’s stock market is already overvalued, and the problem looks evenworse when the market’s poor corporate profitability is factored in.
Another method of measuring a market’s valuation is the market/GDP ratio.Table 36 shows the eight-year history of China’s market/GDP value, and,curiously, it is at the low end of the global standard, which would normallyindicate that China’s markets were never overvalued.
However, this method of valuation measurement comes with its drawbacks.For one thing, it is inappropriate to compare market/GDP ratios across mar-kets, because capital markets in different countries have different laws, histo-ry and culture, all of which can affect market structure. Also, even within thesame market, over time, it is not necessarily a reliable measure. The U.S.market/GDP ratio broke 100% for the first time in 1957 and has never fallen
Table 35. P/E and P/B of TOPIX in Japan
Source: Yearbook of TokyoStock Exchange.
Year P/E P/B
2000 170.8 1.2
1999 – 1.6
1998 103.1 1.2
1997 37.6 1.2
1996 79.3 1.8
1995 86.5 1.9
1994 79.5 2.0
1993 64.9 1.9
1992 36.7 1.8
1991 37.8 2.5
1990 39.8 2.9
1989 70.6 5.4
Table 36. Ratio of Stock Market Capitalization Over GDP in China
2001 2000 1999 1998 1997 1996 1995 1994
Full-Value/GDP 44.2 53.8 32.3 24.9 23.5 14.5 5.9 7.9
Float-Value/GDP 14.7 18.0 10.0 7.3 7.0 4.2 1.6 2.1
Source: Dow Jones Indexes; Bloomberg; China Statistical Yearbook.
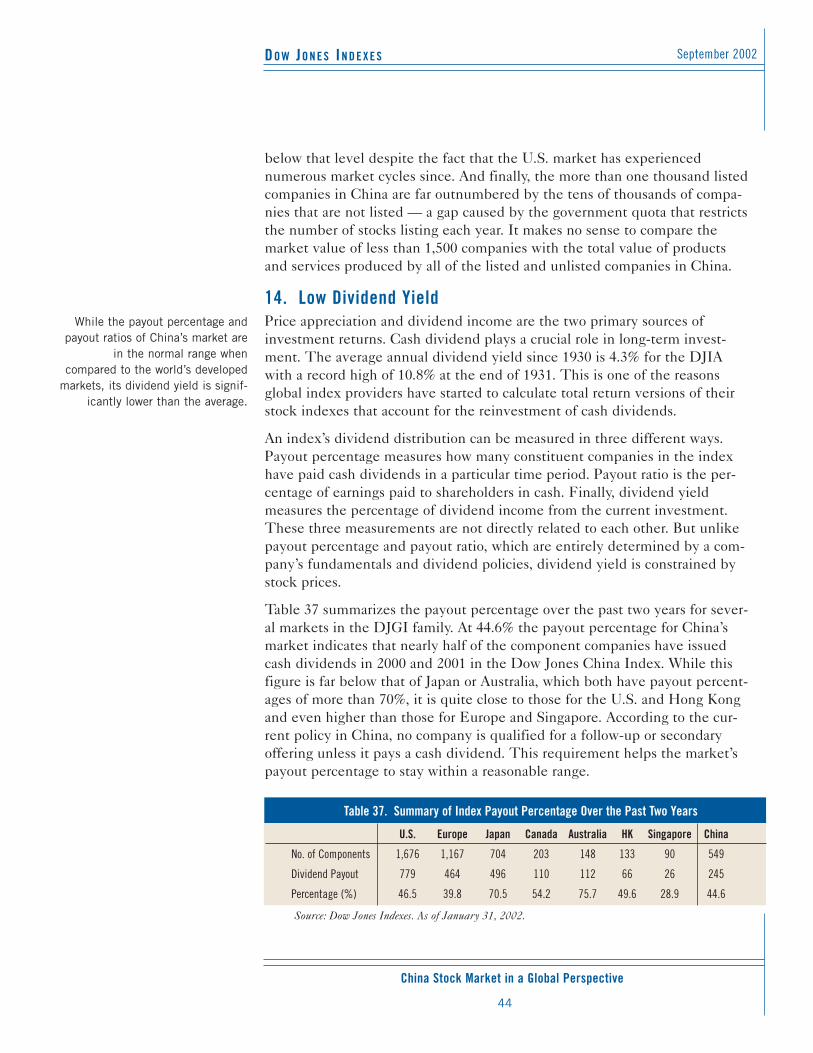
DO W JO N E S IN D E X E S
China Stock Market in a Global Perspective
September 2002
44
below that level despite the fact that the U.S. market has experiencednumerous market cycles since. And finally, the more than one thousand listedcompanies in China are far outnumbered by the tens of thousands of compa-nies that are not listed — a gap caused by the government quota that restrictsthe number of stocks listing each year. It makes no sense to compare themarket value of less than 1,500 companies with the total value of productsand services produced by all of the listed and unlisted companies in China.
14. Low Dividend YieldPrice appreciation and dividend income are the two primary sources ofinvestment returns. Cash dividend plays a crucial role in long-term invest-ment. The average annual dividend yield since 1930 is 4.3% for the DJIAwith a record high of 10.8% at the end of 1931. This is one of the reasonsglobal index providers have started to calculate total return versions of theirstock indexes that account for the reinvestment of cash dividends.
An index’s dividend distribution can be measured in three different ways.Payout percentage measures how many constituent companies in the indexhave paid cash dividends in a particular time period. Payout ratio is the per-centage of earnings paid to shareholders in cash. Finally, dividend yieldmeasures the percentage of dividend income from the current investment.These three measurements are not directly related to each other. But unlikepayout percentage and payout ratio, which are entirely determined by a com-pany’s fundamentals and dividend policies, dividend yield is constrained bystock prices.
Table 37 summarizes the payout percentage over the past two years for sever-al markets in the DJGI family. At 44.6% the payout percentage for China’smarket indicates that nearly half of the component companies have issuedcash dividends in 2000 and 2001 in the Dow Jones China Index. While thisfigure is far below that of Japan or Australia, which both have payout percent-ages of more than 70%, it is quite close to those for the U.S. and Hong Kongand even higher than those for Europe and Singapore. According to the cur-rent policy in China, no company is qualified for a follow-up or secondaryoffering unless it pays a cash dividend. This requirement helps the market’spayout percentage to stay within a reasonable range.
While the payout percentage andpayout ratios of China’s market are
in the normal range when compared to the world’s developed
markets, its dividend yield is signif-icantly lower than the average.
Table 37. Summary of Index Payout Percentage Over the Past Two Years
U.S. Europe Japan Canada Australia HK Singapore China
No. of Components 1,676 1,167 704 203 148 133 90 549
Dividend Payout 779 464 496 110 112 66 26 245
Percentage (%) 46.5 39.8 70.5 54.2 75.7 49.6 28.9 44.6
Source: Dow Jones Indexes. As of January 31, 2002.
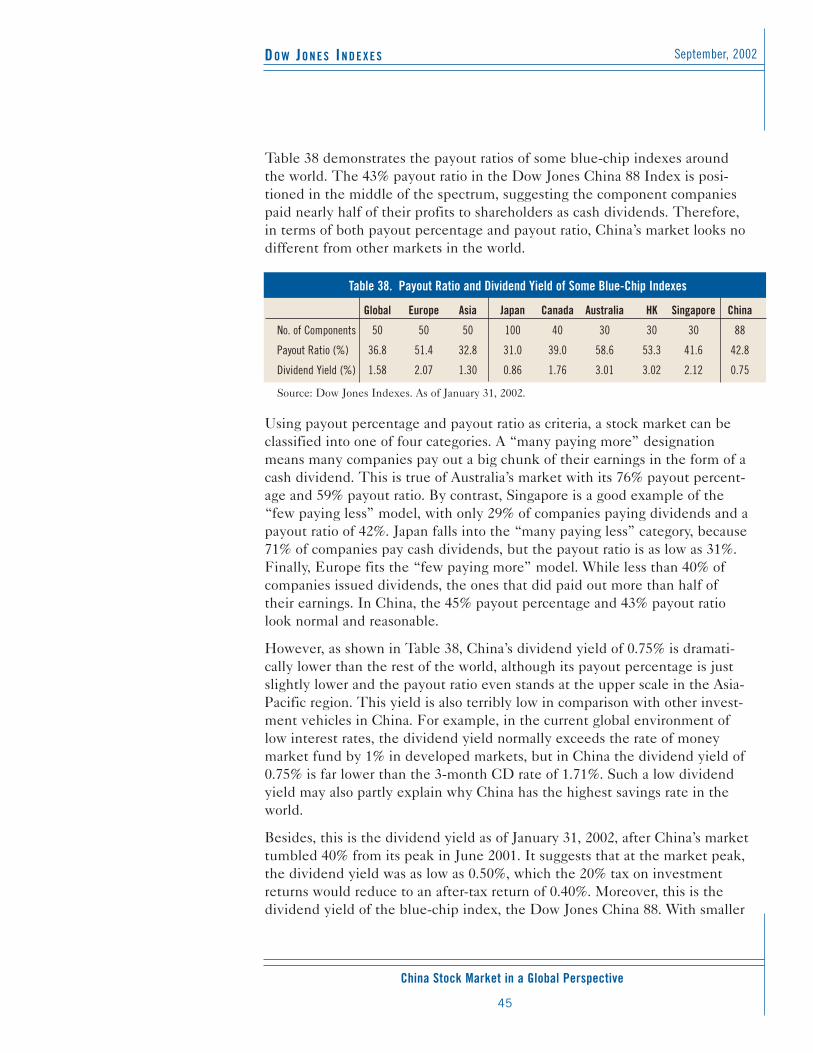
DO W JO N E S IN D E X E S
China Stock Market in a Global Perspective
September, 2002
45
Table 38 demonstrates the payout ratios of some blue-chip indexes aroundthe world. The 43% payout ratio in the Dow Jones China 88 Index is posi-tioned in the middle of the spectrum, suggesting the component companiespaid nearly half of their profits to shareholders as cash dividends. Therefore,in terms of both payout percentage and payout ratio, China’s market looks nodifferent from other markets in the world.
Using payout percentage and payout ratio as criteria, a stock market can beclassified into one of four categories. A “many paying more” designationmeans many companies pay out a big chunk of their earnings in the form of acash dividend. This is true of Australia’s market with its 76% payout percent-age and 59% payout ratio. By contrast, Singapore is a good example of the“few paying less” model, with only 29% of companies paying dividends and apayout ratio of 42%. Japan falls into the “many paying less” category, because71% of companies pay cash dividends, but the payout ratio is as low as 31%.Finally, Europe fits the “few paying more” model. While less than 40% ofcompanies issued dividends, the ones that did paid out more than half oftheir earnings. In China, the 45% payout percentage and 43% payout ratiolook normal and reasonable.
However, as shown in Table 38, China’s dividend yield of 0.75% is dramati-cally lower than the rest of the world, although its payout percentage is justslightly lower and the payout ratio even stands at the upper scale in the Asia-Pacific region. This yield is also terribly low in comparison with other invest-ment vehicles in China. For example, in the current global environment oflow interest rates, the dividend yield normally exceeds the rate of moneymarket fund by 1% in developed markets, but in China the dividend yield of0.75% is far lower than the 3-month CD rate of 1.71%. Such a low dividendyield may also partly explain why China has the highest savings rate in theworld.
Besides, this is the dividend yield as of January 31, 2002, after China’s markettumbled 40% from its peak in June 2001. It suggests that at the market peak,the dividend yield was as low as 0.50%, which the 20% tax on investmentreturns would reduce to an after-tax return of 0.40%. Moreover, this is thedividend yield of the blue-chip index, the Dow Jones China 88. With smaller
Table 38. Payout Ratio and Dividend Yield of Some Blue-Chip Indexes
Global Europe Asia Japan Canada Australia HK Singapore China
No. of Components 50 50 50 100 40 30 30 30 88
Payout Ratio (%) 36.8 51.4 32.8 31.0 39.0 58.6 53.3 41.6 42.8
Dividend Yield (%) 1.58 2.07 1.30 0.86 1.76 3.01 3.02 2.12 0.75
Source: Dow Jones Indexes. As of January 31, 2002.
DO W JO N E S IN D E X E S
China Stock Market in a Global Perspective
September 2002
46
stocks included, a broad market index most likely has even lower yield fortwo reasons. First, the smaller a company is, the lower the possibility that itwill pay a meaningful dividend. And second, speculation and manipulation inChina’s small-cap market means the stocks are more likely to be overvalued.
Traditionally considered value stocks, manufacturing companies tend to havehigher payout percentages, payout ratios and dividend yields, compared withtechnology-oriented “New Economy” firms. As a consequence, all three fig-ures are always higher in the DJIA than in the S&P 500, which in turn hashigher results for those figures than the Nasdaq Composite Index. With thisin mind, it seems even more unusual for China’s industrial-driven market tohave a dividend yield as low as 0.75%. But it does provide additional evi-dence of the low profitability and high valuation of China’s equity market.
Since the payout percentage and payout ratio are both within the normalrange in China’s market, its low dividend yield can only be driven by exces-sively high stock price or excessively low corporate earnings. To raise the div-idend yield, the ratio of cash dividend to stock price, either the dividendmust rise or the stock price must drop. The Chinese government regulatesthat no listed company is eligible for a secondary rights issue unless its rate ofreturn exceeds 6% for three consecutive years. This policy has promptedsome companies to lower their net asset value by paying out more dividends,thus paving the way for a share increase in the future. But despite suchincentives from the government, the dividend yield in China is still consider-ably low.
The current policy simply stimulates the increase of payout percentage in themarket, but does nothing to increase the dividend yield. Dividend paymentsmade for the purpose of raising new capital are a short-term corporate deci-sion, and do not necessarily turn into a long-term dividend policy.
Furthermore, if a company is forced to pay dividends to meet the require-ment for raising new capital, it will try to pay out as little as possible and tostop paying as soon as the goal of new capital is realized. Given this, the lowpayout percentage and dividend yield are rooted in the market’s poor corpo-rate earnings.
Additionally, the accounting system and dividend policy in China includessome different types of “dividends” involving rights issuances and shareexchanges, among other things, that are not accepted as substitutes for cashdividends in global markets. They lack the value of a regular cash dividend.
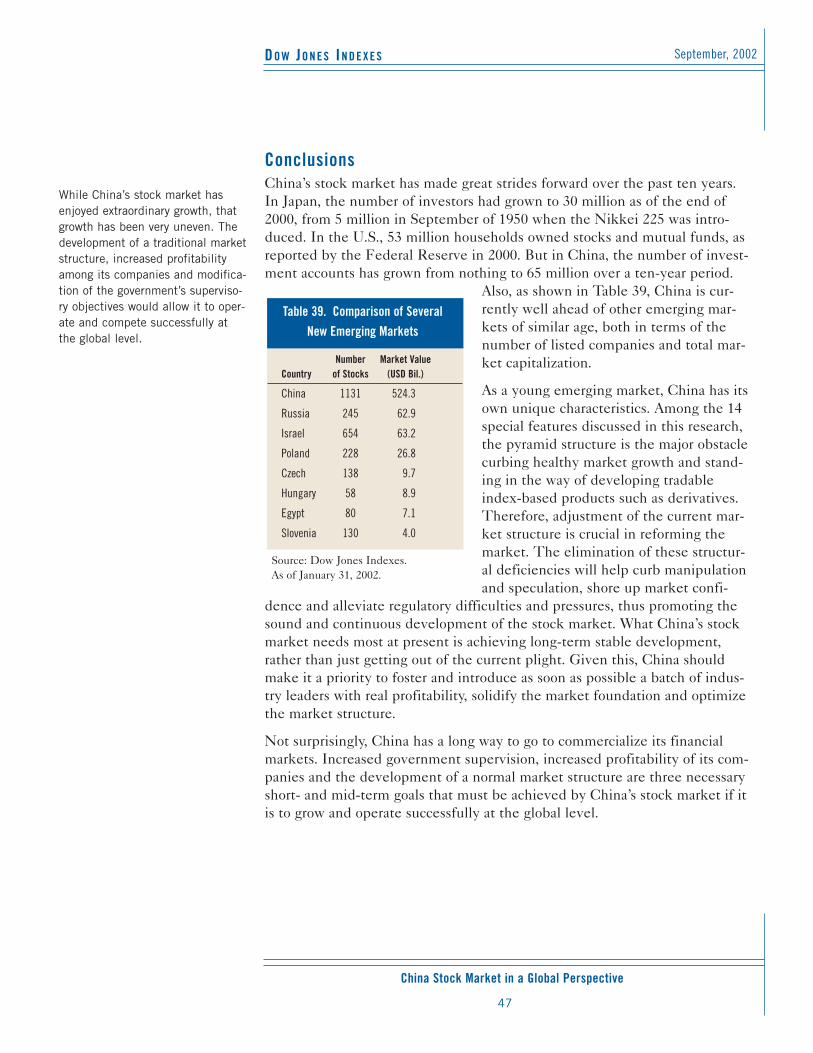
DO W JO N E S IN D E X E S
China Stock Market in a Global Perspective
September, 2002
47
ConclusionsChina’s stock market has made great strides forward over the past ten years.In Japan, the number of investors had grown to 30 million as of the end of2000, from 5 million in September of 1950 when the Nikkei 225 was intro-duced. In the U.S., 53 million households owned stocks and mutual funds, asreported by the Federal Reserve in 2000. But in China, the number of invest-ment accounts has grown from nothing to 65 million over a ten-year period.
Also, as shown in Table 39, China is cur-rently well ahead of other emerging mar-kets of similar age, both in terms of thenumber of listed companies and total mar-ket capitalization.
As a young emerging market, China has itsown unique characteristics. Among the 14special features discussed in this research,the pyramid structure is the major obstaclecurbing healthy market growth and stand-ing in the way of developing tradableindex-based products such as derivatives.Therefore, adjustment of the current mar-ket structure is crucial in reforming themarket. The elimination of these structur-al deficiencies will help curb manipulationand speculation, shore up market confi-
dence and alleviate regulatory difficulties and pressures, thus promoting thesound and continuous development of the stock market. What China’s stockmarket needs most at present is achieving long-term stable development,rather than just getting out of the current plight. Given this, China shouldmake it a priority to foster and introduce as soon as possible a batch of indus-try leaders with real profitability, solidify the market foundation and optimizethe market structure.
Not surprisingly, China has a long way to go to commercialize its financialmarkets. Increased government supervision, increased profitability of its com-panies and the development of a normal market structure are three necessaryshort- and mid-term goals that must be achieved by China’s stock market if itis to grow and operate successfully at the global level.
While China’s stock market hasenjoyed extraordinary growth, thatgrowth has been very uneven. Thedevelopment of a traditional marketstructure, increased profitabilityamong its companies and modifica-tion of the government’s superviso-ry objectives would allow it to oper-ate and compete successfully atthe global level.
Table 39. Comparison of SeveralNew Emerging Markets
Source: Dow Jones Indexes.As of January 31, 2002.
Number Market ValueCountry of Stocks (USD Bil.)
China 1131 524.3
Russia 245 62.9
Israel 654 63.2
Poland 228 26.8
Czech 138 9.7
Hungary 58 8.9
Egypt 80 7.1
Slovenia 130 4.0
DO W JO N E S IN D E X E S
China Stock Market in a Global Perspective
September 2002
48
This report is published by Dow Jones & Company, Inc., 4300 N. Route 1, South Brunswick, New Jersey08852. Dow Jones does not undertake to advise you of changes in this information. This report is not anoffer, solicitation or recommendation to buy or sell any financial product or a recommendation to partici-pate in any particular trading stategy and may not be relied on as such. The user of the information in thereport assumes the entire risk of any use made of the information provided therein.
These materials have been prepared solely for informational purposes based upon information generallyavailable to the public from sources believed to be reliable. Dow Jones makes no representation with respectto the accuracy or completeness of these materials, the content of which may change without notice. DowJones disclaims any and all liability relating to these materials, including, without limitation, and makesno express or implied representations or warranties concerning the statements made contained in, or omis-sions from, these materials.
No portion of this publication may be reproduced in any format or by any means including electronically ormechanically, by photocopying, recording or by any information storage or retrieval system, or by any otherform or manner whatsoever without the prior written consent of Dow Jones. You may not use or permit theuse of any information in the report in connection with the writing, trading, marketing or promotion of anyfinancial instruments or products to create any indexes.
“Dow Jones”, “Dow Jones Indexes” and “Dow Jones Global Titans 50” are trademarks of of Dow Jones &Company, Inc.