
D e Ar Archaeologists of Spai in DISCO... · 4 Contents Tables 4 Figures 5 0 Abstract 7 1...
45
D D isc o In o veri n nstitute of H n g t h Eva P Heritage Sci All con h e A r 2 0 Parga‐Dans iences (Inci Published ntents copy 1 Ar ch a 0 12- 1 s and Rocí pit) ‐ Spanis d by Incipit‐C yright © 201 a eol o 1 4 ío Varela‐P sh National CSIC, 2014 14 by Incipi o gis ts Pousa Research C t‐CSIC. ts of Council (CSI Spa i C) in
-
Upload
nguyennhan -
Category
Documents
-
view
214 -
download
0
Transcript of D e Ar Archaeologists of Spai in DISCO... · 4 Contents Tables 4 Figures 5 0 Abstract 7 1...
D
Disco
In
overin
nstitute of H
ng th
Eva P
Heritage Sci
All con
he Ar20
Parga‐Dans
iences (Inci
Published
ntents copy
1
Archa012-1
s and Rocí
pit) ‐ Spanis
d by Incipit‐C
yright © 201
aeolo14
ío Varela‐P
sh National
CSIC, 2014
14 by Incipi
ogists
Pousa
Research C
t‐CSIC.
ts of
Council (CSI
Spai
C)
in
2
3
This work is licensed under the Creative Commons Attribution 3.0 Unported License. To view a copy of this license, visit http://creativecommons.org/licenses/by/3.0/ or send a letter to Creative
Commons, 444 Castro Street, Suite 900, Mountain View, California, 94041, USA.
Under the terms of this licence, you are free:
to Share ‐ to copy, distribute and transmit the work to Remix – to adapt the work to make commercial use of the work
Under the following conditions:
Attribution — You must attribute the work in the manner specified by the author or licensor (but not in any way that suggests that they endorse you or your use of the work).
With the understanding that:
Waiver — Any of the above conditions can be waived if you get permission from the copyright holders.
Public Domain — Where the work or any of its elements is in the public domain under applicable law, that status is in no way affected by the licence.
Other Rights — In no way are any of the following rights affected by the licence: Your fair dealing or fair use rights, or other applicable copyright exceptions
and limitations; The authors’ moral rights; Rights other persons may have either in the work itself or in how the work is
used, such as publicity or privacy rights.
Notice — For any reuse or distribution, you must make clear to others the licence terms of this work.
The publisher has used its best efforts in preparing this book, and the information provided herein is provided "as is". Institute of Heritage Sciences makes no representation or warranties with respect to the accuracy or completeness of the contents of this book and specifically disclaims any implied warranties of merchantability or fitness for any particular purpose and shall in no event be liable for any loss of profit or any other commercial damage, including but not limited to special, incidental,
consequential, or other damages.
ISBN 13: 978‐84‐617‐1390‐5
This project acted as the Spanish component of the transnational Discovering the Archaeologists of Europe 2012‐14 project, which was administered by York Archaeological Trust with financial support from the Lifelong Learning Programme of the European Commission. This report reflects the views only of the authors, and the Commission cannot be held responsible for any use which may be made of the information contained therein.
4
Contents
Tables 4 Figures 5 0 Abstract 7 1 Introduction 10 2 Methodology 12 2.1 Technical characteristics of the survey 12 2.2 Data confidentiality 13
3 Results 14 3.1 Number of companies 14 3.2 Geographical distribution 14 3.3 Year company was set up 14 3.4 Archaeological activity of the company 15 3.5 Services offered 16 3.5.1 Percentage of activity 19
3.6 Size of companies 26 3.6.1 Number of workers 26 3.6.2 Economic results 27
3.7 Human capital 27 3.7.1 Typology 28 3.7.2 Gender, age and nationality 29 3.7.3 Level of studies and specialisation 29 3.7.4 Staff with disabilities 30 3.7.5 Average salary 31
3.8 Geographical market 32 3.9 Clients 33 3.10 Position in the market 35 3.11 Innovation 35 3.11.1 Strategic objectives 35 3.11.2 R&D activities 36 3.11.3 Investment 36 3.11.4 Technological Innovation 37 3.11.5 Non‐technological Innovation 38 3.11.6 Effects of innovation 39 3.11.7 Obstacles for innovation 40
3.12 Cooperation with other agencies 40 4 Conclusions 43 5 Associated Publications 45
Tables
Table 1: Percentage of activity supposed by field work for companies which carried out this service during 2012.. ........................................................................................................................... 19
Table 2: Percentage of activity constituted by research for the companies that performed this service during 2012.. .................................................................................................................... 20

5
Table 3: Percentage of activity represented by the archaeology of architecture for companies which performed this service during 2012. ........................................................................ 20
Table 4: Percentage of activity represented by advising and consultancy for companies which performed this service during 2012.. ......................................................................................... 21
Table 5: The percentage represented by educational activities with regard to the total activity of the companies which carried out this type of work during 2012.. ........................................ 21
Table 6: The percentage of activity represented by dissemination tasks for those companies which performed this service during 2012.. ......................................................................................... 22
Table 7: The percentage of activity represented by preservation and restoration work for the companies which performed these services during 2012.. ............................................................. 22
Table 8: The percentage of activity represented by anthropology/ethnography for the companies which performed these services during 2012. .................................................................... 23
Table 9: The percentage of activity represented by documentation work during 2012 for the companies which performed these tasks. ............................................................................................ 23
Table 10: The percentage of activity represented by topography for the companies which performed this service during 2012.. ................................................................................................... 24
Table 11: The percentage of activity represented by publishing, photography, etc. tasks for the companies which performed these services during 2012. .............................................................. 24
Table 12: The percentage of activity represented by archiving and library work for the companies which performed these services during 2012. .................................................................... 25
Table 13: The percentage of activity represented by work relating to radio, cinema, etc., for the companies which performed these services during 2012. .............................................................. 25
Table 14: The percentage of activity represented by forensic services during 2012 for the companies which carried out tasks of this kind. ................................................................................... 26
Table 15: Companies which have increased, maintained or reduced their staff with regard to previous years. Data expressed in percentages.................................................................................... 28
Table 16: The percentage of the total number of workers in each profile and mode of hiring. 2012. .................................................................................................................................................. 28
Table 17: The characteristics of contracts of staff working for archaeological companies in 2012.. ................................................................................................................................................. 29
Table 18: Number of men and women working for archaeological companies in 2012 by age range. ................................................................................................................................................ 29
Table 19: Level of studies and area of specialisation of staff working for archaeological companies in 2012. ............................................................................................................................. 30
Table 20: Number of workers of each type. Percentages calculated with regard to the responses obtained to this question.. .................................................................................................. 30
Table 21: Percentage of companies which hire this type of staff. Percentages calculated with regard to the total number of companies. ........................................................................................... 30
Table 22: Average annual salary for permanent full‐time contracts in different occupations: Spain, 2012.. ....................................................................................................................................... 32
Table 23: Companies which, after introducing those types of innovation in the period 2010‐2012, consider them to be “strategic” or “extremely strategic” for their development.. ...................... 37
Table 24: Companies which implanted these types of practices from 2010‐2012 and the evaluation of their effectiveness. ........................................................................................................ 39
Table 25: Companies which implanted these types of practices from 2010‐2012 and the evaluation of their effectiveness.. ....................................................................................................... 39
Figures
Figure 1: The percentage of companies which began their activity in the periods shown. Source: compiled by the authors. ....................................................................................................................................... 15
Figure 2: The percentage of archaeological activity in relation to the whole of the business in 2012. Source: compiled by the authors. ................................................................................................................... 16
Figure 3: Activities carried out in the last tax year (2012). Data expressed in percentages. Source: compiled by the authors. .................................................................................................................................. 18

6
Figure 4: Size of companies as far as number of workers is concerned. 2012. Source: compiled by the authors. ............................................................................................................................................. 26
Figure 5: The percentage of companies which claim to have obtained the stated business turnover in 2012. Source: compiled by the authors. ....................................................................................................... 27
Figure 6: Average gross annual salary for permanent full‐time archaeological staff. Data expressed in percentages for the year 2012. Source: compiled by the authors. ....................................................... 31
Figure 7: Percentage of companies working in each identified geographical market. Year 2012. Source: compiled by the authors. ................................................................................................................... 33
Figure 8: The perception of the archaeological companies of their position in the market. Year 2012. Source: compiled by the authors. ................................................................................................................... 35
Figure 9: Investment in innovation in archaeological companies for the year 2012. Source: compiled by the authors. ............................................................................................................................................. 37
Figure 10: Collaboration partners of archaeological companies. Data expressed in percentages for the year 2012. Source: compiled by the authors. .............................................................................................. 41
7
0 Abstract
This study forms part of the project Discovering the Archaeologists of Europe. The aim of the project is to identify and to define the current situation of archaeology as a profession in the continent of Europe. How many archaeologists are there? How many are men and how many are women? What kind of training do they have? Who do they work for? What types of tasks do they perform? What is their salary? What conditions do they carry out their work in? To what extent is there geographical mobility in this profession? How have they been affected by the current economic crisis? What steps have they taken to attempt to adapt to this situation? These are some of the questions which we hope to answer.
The first edition of the project was carried out between 2006 and 2008. The results of this phase can be seen at: http://www.discovering‐archaeologists.eu/final‐reports.html .
In 2012, the European Commission (via the Lifelong Learning Programme) took the decision to support a second edition in order to analyse the evolution of the profession in recent years and to discover the extent of the impact of the economic crisis on the sector. This edition, to which this study belongs, will end in September 2014 (henceforth we shall refer to this project as DISCO14).
This project has involved more than 20 countries, which have participated in either one or both editions. Each country has been represented by one or more organisations which have analysed the situation of the sector in their territory (the countries participating in the current edition of the project can be consulted here: http://www.discovering‐archaeologists.eu/front_page.html). By comparing the results obtained in each country, it will be possible to gain a global vision of the archaeological sector in Europe.
The analysis of the situation in Spain has been carried out by the Institute of Heritage Sciences (Incipit), which forms part of the CSIC (Spanish National Research Council), under the supervision of Dr. Eva Parga Dans.
This document contains the main data gathered within the context of DISCO14 and interpreted based on the research results generated in the Incipit in accordance with the research line “Socio‐economics of Cultural Heritage” (see sections: Introduction and Associated Publications). This data, therefore, provides the necessary context in order to give a profile of the sector and to establish how it has evolved since the beginning of the crisis.
The study is centred on commercial archaeology carried out in Spain since the passing of several laws (in 1985 and the following years) which made it necessary to evaluate and correct, as far as possible, the effects that any construction work could have on a heritage site. These regulations can be consulted on the following website: http://www.mcu.es/legislacionconvenio/loadSearchLegislation.do?cache=init&legislation.area.id=PAHI&layout=legislacionPatrimonio&language=es. However, the Public Administration in Spain could not respond to this obligation due to a lack of resources. Therefore, many private companies were set up which were specialized in the study and management of archaeological sites.
8
Archaeologists linked to the world of academia, museums and other public and private institutions have been kept out of this specific study for reasons which are explained in the section entitled Methodology. However, other partners in the project have included them within their analysis.
In the course of this study 158 archaeological companies were identified in Spain. In 2009 (the date of the last analysis of the sector), there were 273 companies. Therefore, it can be noted that there has been a 42% fall in the number of companies.
These 158 companies provide 796 jobs; 66% less than in 2009, when 2,358 jobs were registered.
What is more, the economic results of 78.3% of the companies have fallen in comparison with previous years, not reaching 200,000€ in 56% of the cases. The reason for this can be considered to be an excessive dependence on the construction sector and on public investment in infrastructure, two of the areas most directly affected by the financial crisis.
In spite of these data, the archaeological companies in Spain have not introduced significant modifications in their business strategy, although some changes can be noted. For example, although 76% of the companies employ less than 10 workers, the number of companies with more than 10 employees has increased compared to 2009, which may be attributed to mergers brought about with the aim of ensuring the survival of the companies involved. On the other hand, field work, consultancy, research and dissemination are still the most common services and no new services have been registered. However, once the percentage of activity that the companies dedicate to each of the services offered is known, a certain degree of diversification can be detected. In this way, it can be seen that companies which dedicate practically all their time to one type of service are in the minority. Another change can be observed in the list of clients; although the Public Administration and construction companies continue to be the main users of archaeological services, the percentage of surveyed companies which classify them as such has fallen 10‐20% compared to 2009. In addition, a new type of client has emerged, the general public (social agents not connected to public institutions or private corporations), both for the number of archaeological companies which claim to have been hired by the public and for the frequency with which they have been hired.
Other characteristics of the sector have not changed. The companies continue to sell their services on the national market (if not only within their own Autonomous Community), without betting on internationalization as a possible escape route from the crisis. In addition, work of a temporary nature continues to characterize the sector (approximately 52% of contracts are temporary). This, along with the fact that the majority of salaries are around the 1,000€ per month mark, thus not corresponding to the level of training of the workers, leads to a great deal of instability in the sector.
However, the high level of training of the workers lends the companies a great capacity to adapt their business models to the contingencies of the market. Indeed, the companies themselves identify both process innovation and organizational innovation as strategic lines in their organization.

9
These two aspects (human capital and innovation) seem to be key factors in overcoming the crisis through which the sector is passing.
All of this (detailed) information, as well as the transnational report which will be elaborated on the basis of the studies carried out by each partner in their own countries, will be passed on to all the agencies directly linked to the sphere of archaeology (Administration, academia, companies, political authorities, etc.) with the aims of promoting knowledge of the sector’s situation, facilitating decision taking and promoting the adoption of appropriate measures.
The results obtained will also be divulged in appropriate language by more informal media, with the aim of bringing the sector closer to society in general.
10
1 Introduction
In 2006, the Institute of Heritage Sciences (Incipit), as a part of the research line “Socio‐economics of Cultural Heritage”, undertook the task of gathering, systematizing and centralising information regarding archaeological activity in Spain, with the aim of characterizing both the profession and the sector.
The aim is to provide an outline of archaeological activity and its evolution from the 1990s to the present day. This is a period in which a complex and dynamic sector has developed in close connection to demand from the construction sector. Due to this fact, the archaeological sector has been greatly affected by the financial crisis and the end of the building boom in Spain.
In addition, this study aims to offer proposals with the aim of promoting the restructuring of archaeological activity within the framework of a global society, based on knowledge and technology, taking local, public and social aspects as a starting point and as a source of change, innovation and welfare.
The study has been carried out from an interdisciplinary perspective, with the collaboration of other institutes of the CSIC, such as the Instituto de Estudios Sociales Avanzados (IESA), the Instituto de Gestión de la Innovación y el Conocimiento (INGENIO) and the Centro de Ciencias Humanas y Sociales (CCHS). A methodological approach has been employed combining both qualitative and quantitative research techniques (CATI surveys, semi‐structured interviews, case studies, seminars, Delphi panels, etc.).
Several R&D projects, both nationally and internationally, have given coverage to this study:
Archaeology in Contemporary Europe, Professional Practices and Public Outreach. A project under the aegis of the Culture Programme of the European Commission, which was carried out between 2007 and 2012.
Programa de Investigación en Tecnologías para la conservación y revalorización del Patrimonio Cultural. Consolider‐Ingenio 2010. Ministerio de Ciencia e Innovación (Spain).
Creación del observatorio de arqueología. Un proceso de centralización de la información y de transferencia de conocimiento. Complementary Actions of the National Plan for R&D 2010‐2011. Ministerio de Ciencia e Innovación (Spain).
Estudio del mercado profesional en gestión del patrimonio arqueológico en España. Análisis de los requerimientos de innovación y transferencia de conocimiento. A project carried out under the aegis of the National Plan for R&D between 2008 and 2010.
Several research results have already been published (see Associated Publications), including two studies by Eva Parga‐Dans (one of the authors of this document): Primera encuesta sobre el mercado de trabajo arqueológico en España (published in 2009) and her doctoral thesis Innovación y Emergencia de un Servicio Intensivo en Conocimiento. El Caso de la Arqueología Comercial, which she defended at the University of Santiago de Compostela in 2011.

11
Both, the methodology designed and many of the conclusions taken from these studies are being applied successfully in other sectors, such as the creative and cultural industries and intensive knowledge services, thus demonstrating their validity, applicability and scientific rigour (see some examples in Associated Publications).
At the present time, research into the profile and evolution of the archaeological sector is being carried out in the Incipit, under the auspices of the Discovering the Archaeologists of Europe 2014 project financed by the European Commission through the Lifelong Learning Programme, in which more than 20 partners from differing fields (universities, companies, research institutes, professional archaeological associations, etc.) are participating.1
The aim of this project is to characterize the archaeological profession in the various participating countries and to analyse transnational mobility in the sector. It is within this context that the survey for the characterization of Spanish Archaeological Companies was carried out in 2013, the results of which will be presented below.
1 More information in: http://www.discovering‐archaeologists.eu/
12
2 Methodology
The absence of official sources (there are no specific data series or economic classifications) makes it difficult to quantify the situation of the archaeological sector in Spain. It is not possible, for example, to discover the real situation of companies or the volume of the work market. For this reason, Incipit have developed a methodology which allows the reality of the sector to be outlined as precisely as possible and which includes two surveys, the first was carried out in 2009 and the second in 2013.
This document refers exclusively to the survey carried out in 2013 within the context of the DISCO14 project, although the survey carried out in 2009 provides the necessary context for the interpretation of the data.
2.1 Technical characteristics of the survey
The DESIGN OF THE QUESTIONNAIRE was based on the model of the 2009 survey, though it was improved and those questions which had given rise to incidents at that time were adapted. In addition, some questions were included that were required by the Discovering the Archaeologists of Europe 2014 project, with the aim of generating a homogeneous database for all the participating countries in order to facilitate the carrying out of later comparative studies.
The survey was aimed at different organisations and agencies: museums, foundations, self‐employed people, administrations, universities, companies, etc. However, the majority of these showed a low rate of reply, which was not representative, so they have been excluded for now from analysis and their replies will be used in later activities of the study, in which they may play a significant role. This is the case, for example, with the self‐employed collective, which, despite being highly represented in the sector, only generated 52 valid replies.
As a consequence, what is put forward below refers exclusively to archaeological companies.
Indeed, it is possible that, given the absence of specific registers, the survey did not reach all the companies dedicated to archaeological activity in Spain. It does, however, offer a frame of interpretation with figures close to reality. In this way, the THEORETICAL UNIVERSE OF THE SURVEY is made up of companies which generated economic activity related to archaeology in 2012. This population was determined in May 2013 based on the list of companies identified in the 2009 survey (these were contacted by telephone to check that they were still in existence) and complemented by information from diverse business censuses which include companies set up after 2009.
Following a period of refinement, the frame of reference was established at 158 companies.
As far as the CARRYING OUT OF THE SURVEY is concerned, it was sent out addressed to each member of the universe between July and October 2013 as a self‐administered web questionnaire: www.arqueologiaquest.es.
13
The questionnaire was programmed in HTML4.01 + ASP and adjusted to different specific quality standards for research via surveys (UNE ISO‐20252, ICC/ESOMAR) and accessibility and usability in digital formats (UNE 139803, WCAG 1.0).
Firstly, each of the companies was contacted by telephone (CATI) in order to inform them of the study and to check the details associated with them. Immediately after that, they were sent a direct link via e‐mail to the web questionnaire (CAWI). Later, with the aim of encouraging participation in the study, they were sent a first reminder containing the link to the questionnaire. Finally, four more reminder e‐mails were sent to those companies which had not accessed their link.
In this way, of the 158 identified companies, 147 participated in the questionnaire (representing a reply rate of 67%), with an average participation time of 20.4 minutes.
After eliminating incomplete and inconsistent questionnaires, a total of 106 valid cases were obtained.
As it was not a random sample of the units which make up the universe, we lack the tools to determine the sampling error. However, taking into account the fact that 67% of the identified organisations participated in a considerable sample size and that no participation bias by determined control variables has been appreciated (Autonomous Communities and organisation profile), we consider that the sample surpasses the minimum threshold of quality in the analysis of the replies.
Eva Parga‐Dans has been responsible for coordinating all the work from the Incipit, in collaboration with the Statistics and Surveys sections of the Instituto de Estudios Sociales Avanzados (IESA‐CSIC).
2.2 Data confidentiality
The data of the organisations and specific individuals that participated in the survey has been treated according to the Organic Law 15/1999 (13th December) on the Protection of Personal Data in Spain.
The information provided will not be distributed to third persons, will be used exclusively for research purposes and will always be published as an annex.
14
3 Results
As mentioned above, 106 companies completed the questionnaire in a valid way. However, it should be stated that there were small differences in the reply rates to different questions, as not all the companies replied to all the questions of the survey and in certain variables a number of lost cases were registered (incomplete or inconsistent replies). In any case, all the questions posed in the survey obtained a number of valid replies that was sufficiently representative of the sample. Therefore, they have all been included in the study. The number of lost cases associated to each question is different, which justifies slight contradictions between the data shown here. For example, in Table 16 the sum of the percentages does not total 100% but to obtain a total of 97.47% means that only 2.5% of the replies could not be taken into account.
3.1 Number of companies
The first piece of data obtained by carrying out this second survey is devastating: whereas in the first survey 273 companies were identified, this time only 158 were found. This means that, apart from the well‐known caution that must be applied to this figure (see Methodology section), a mortality rate of 42% has been registered among archaeological companies in Spain between 2009 and 2013.
3.2 Geographical distribution
A large number of the companies which replied to the questionnaire are based in the Autonomous Community of Madrid, where 19.8% of the sample is concentrated. This is followed by Andalucía with 17.9% and Catalonia with 10.4%. 9.4% of the companies are located in Castilla y León and the Comunidad Valenciana. 8.5% of the entities are Galician, 5.7% from Castilla La Mancha and 4.7% from Aragon. The remaining 14.2% are located in the other Autonomous Communities in percentages of less than 3%.
As far as the results of the 2009 survey are concerned, the changes are less. Although the number of companies in most regions has decreased, their distribution has been maintained. Andalucia, Catalonia and Madrid were, in that order, the communities which held the highest number of companies. This is still the case today, although the order is different. Castilla y León, Comunidad Valenciana, Galicia, Castilla La Mancha and Aragón were, and still are, the next in the list, and are still in the same order.
3.3 Year company was set up
The date that a company was set up is one of the factors which gives most information on the evolution and dynamics of archaeological companies in Spain.
As can be seen in Figure 1, the beginning of archaeological business activity in Spain was in 1985, with the publication of the Spanish Historical Heritage Law. Only two companies have been shown to have existed before this date.
The effects of this law were noticed after 1990, coinciding with the start of the economic boom and the increase in the construction of infrastructures. Approximately 30% of the surveyed companies were set up in the 1990s, the decade of the Barcelona Olympic Games,

15
the Universal Exposition in Seville, the inauguration of the first high‐speed train lines, the massive construction of wind farms, etc.
After 2000, the rate of creation of new businesses increased notably in comparison with the 1990s. However, with the arrival of the economic crisis, after 2008 the rate of creation of companies fell dramatically. Therefore, in the 1990s an average of 3.3 companies were set up every year and from 2000 to 2007 the annual average was 7.6 companies. However, after 2008 the figure is only 1.6, which means a return to the kind of figures that existed at the beginning of the 1990s.
Figure 1: The percentage of companies which began their activity in the periods shown. Source: compiled by the authors.
Taking these data into account, it is possible to distinguish three phases:
1986‐2000: the birth and stabilisation of archaeological activity as a business. 40% of the surveyed companies were set up in this period.
2001‐2007: the boom of the sector. 50% of the companies were set up. 2008‐2013: a period of crisis for the sector. 9% of the companies were set up but
42% of those in existence before 2009 were closed down.
3.4 Archaeological activity of the company
Seventy‐five per cent of companies are exclusively, or almost exclusively, dedicated to the management of archaeological heritage, though this concept is understood in a broad sense: field work (assessment, registering, excavation, surveying etc.), research, archaeology of architecture, advising and consultancy, educational activities, and activities related to dissemination and interpretation. Specifically, 91% of the activity of 61% of the companies is made up of these activities, and another 14% of the companies report that this supposes between 71% and 90% of their activity.
For 25% of the companies, the management of archaeological heritage is a secondary activity which they complement by offering other types of services. In this way, for 15% of
1%
40%
50%
9%
Start of Activity
Before 1985
1986 ‐2000
2001‐2007
2008‐2013

16
the organisations, it supposes only 30% of their business activity. For 5% of the companies, it only represents 31%‐50% of their activity and for another 5% it represents between 51% and 70%.
Figure 2: The percentage of archaeological activity in relation to the whole of the business in 2012. Source: compiled by the authors.
3.5 Services offered
The services offered by the sector have been characterized by way of questions related to the activity carried out by the companies throughout 2012 and taking as a (non‐excluding) reference point a list of activities which were already identified and increased from the 2009 survey.
Most of the companies (95%) state that they have carried out field work activities (assessment, registering, excavation, surveying, etc.), which means that, in spite of the drop‐off in traditional archaeological activity (in parallel with the building decline) and the drastic reduction in the number of businesses working in the sector, the companies that have survived maintain field work as a fundamental element of the services they offer.
Consultancy, research and dissemination are also extremely frequent activities. 71%, 69% and 61%, respectively, of the surveyed companies carried out these activities.
Archaeology of Architecture, documentation activities and activities related with the use of geospatial technologies (scanners, GPS, etc.) are also common, although the number of companies that carry out these activities is less: 55%, 51% and 42% respectively. That is to say that approximately half of the companies surveyed carry out this type of activity.
The rest of the activities taken into account in the questionnaire are less frequent:
37% carry out preservation and restoration tasks; 35% perform educational activities; 22% carry out anthropological and ethnographic studies;
15%
5%
5%
14%61%
Archaeological activity
1‐30%
31‐50%
51‐70%
71‐90%
91‐100%

17
21% are involved in publishing, photography and the graphic, visual and plastic arts; 16% carry out archiving and library activities; 9% carry out work for radio, cinema, television and other types of entertainment; 6% offer forensic services.
Finally, it seems noteworthy that 95.3% of the surveyed companies stated that they do not carry out any other type of activity apart from those proposed in the questionnaire. This would suggest that the activity of archaeological companies in Spain is essentially characterized by field work, consultancy, research and dissemination.

18
Figure 3: Activities carried out in the last tax year (2012). Data expressed in percentages. Source: compiled by the authors.
95.3
68.9
54.7
70.8
34.9
61.3
36.8
21.7
50.9
41.5
20.8
16
8.5
5.7
4.7
4.7
31.1
45.3
29.2
65.1
38.7
63.2
78.3
49.1
58.5
79.2
84
91.5
94.3
95.3
0 10 20 30 40 50 60 70 80 90 100
Trabajo de campo
Investigación
Arqueología de la arquitectura
Asesoramiento y consultoría:
Actividades educativas
Divulgación
Conservación y restauración
Antropología y etnografía
Documentación e historia
Topografía
Edición, artes gráficas..
Archivos y biblioteca
Radio, cine…
Servicios forenses
Otros
Business activity
Lo ejecuta
NO lo ejecuta
Is carried out
Isn't carried out
Others
Forensic services
Radio, cinema and…
Archiving and library
Publishing, graphic art and…
Topography
Documentation and history
Anthropology ‐ ethnography
Preservation and restoration
Dissemination
Educational activities
Advising and consultancy
Archaeology of architecture
Research
Field work activities

19
3.5.1 Percentage of activity
The companies were asked about the percentage that each type of service identified in section 3.5 supposed with regard to the total activity of the company in 2012.
Field work
Assessment and correction of impact, excavation, surveying, etc. Although approximately 95% of the surveyed companies carry out this type of work, it is interesting to observe each aspect’s relative weight in the global activity of the companies:
% of activity compared to the company's total
% of companies that dedicate that amount of time to field work
10% or less 9%
11%‐30% 26%
31%‐50% 26%
51%‐70% 23%
71%‐90% 13%
91%‐100% 3%
Table 1: Percentage of activity supposed by field work for companies which carried out this service during 2012. Source: compiled by the authors.
For more than half of the companies which carried out field work (61%), it constituted half, or less, of their business activity. 39% dedicate more than 50% of their time to field work and only 3% of companies stated that it comprises between 91 and 100% of their global activity.
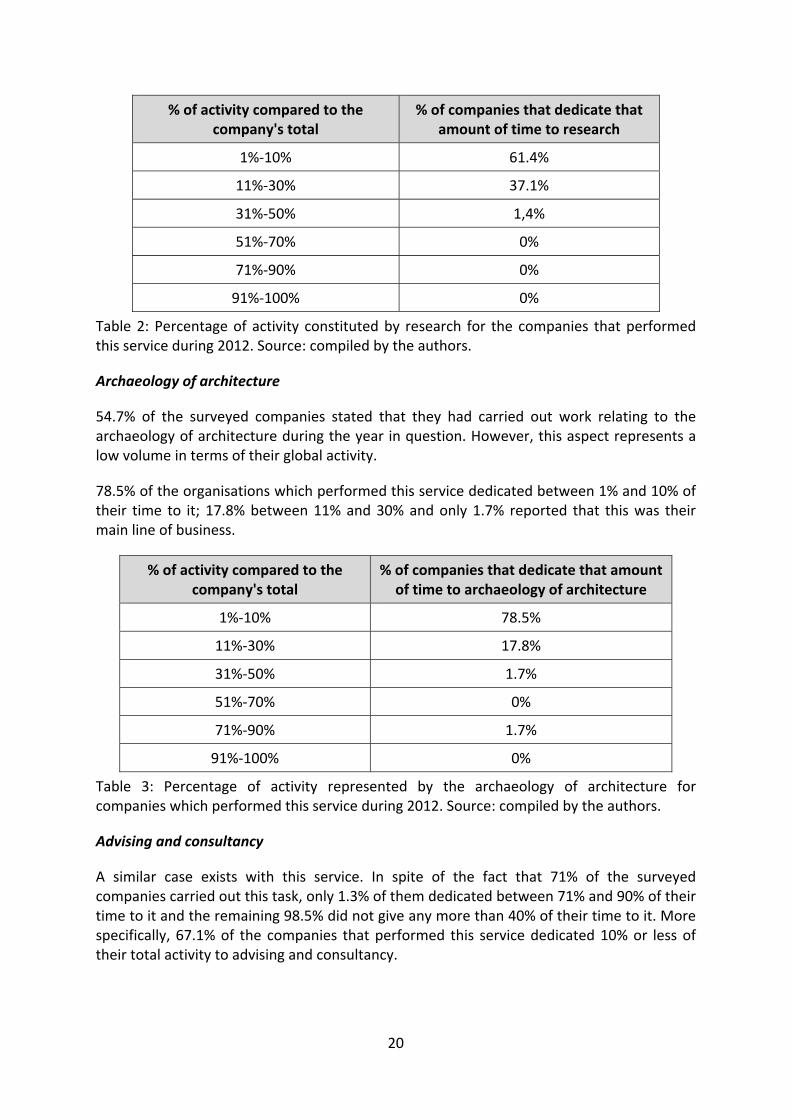
Research
In spite of it being a frequently offered service in the sector (69% of companies perform research tasks), none of the companies which carried out research in 2012 dedicated more than 45% of their total activity to it. 61.4% dedicated between 1% and 10% of their time, whereas for 37.1% it constituted between 11% and 30% of their global activity.
20
% of activity compared to the company's total
% of companies that dedicate that amount of time to research
1%‐10% 61.4%
11%‐30% 37.1%
31%‐50% 1,4%
51%‐70% 0%
71%‐90% 0%
91%‐100% 0%
Table 2: Percentage of activity constituted by research for the companies that performed this service during 2012. Source: compiled by the authors.
Archaeology of architecture
54.7% of the surveyed companies stated that they had carried out work relating to the archaeology of architecture during the year in question. However, this aspect represents a low volume in terms of their global activity.
78.5% of the organisations which performed this service dedicated between 1% and 10% of their time to it; 17.8% between 11% and 30% and only 1.7% reported that this was their main line of business.
% of activity compared to the company's total
% of companies that dedicate that amount of time to archaeology of architecture
1%‐10% 78.5%
11%‐30% 17.8%
31%‐50% 1.7%
51%‐70% 0%
71%‐90% 1.7%
91%‐100% 0%
Table 3: Percentage of activity represented by the archaeology of architecture for companies which performed this service during 2012. Source: compiled by the authors.
Advising and consultancy
A similar case exists with this service. In spite of the fact that 71% of the surveyed companies carried out this task, only 1.3% of them dedicated between 71% and 90% of their time to it and the remaining 98.5% did not give any more than 40% of their time to it. More specifically, 67.1% of the companies that performed this service dedicated 10% or less of their total activity to advising and consultancy.

21
% of activity compared to the company's total
% of companies that dedicate that amount of time to advising and consultancy
1%‐10% 67.1%
11%‐30% 30.1%
31%‐50% 1.3%
51%‐70% 0%
71%‐90% 1.3%
91%‐100% 0%
Table 4: Percentage of activity represented by advising and consultancy for companies which performed this service during 2012. Source: compiled by the authors.
Educational activities
Few are the companies which carry out work of this kind (34.9%) and the companies which do so report very low percentages of business activity for these tasks.
68.5% of the companies which carry out educational activities dedicate 10% or less of their time to them. Even adding the number of companies which report higher percentages of dedication to these tasks, the figure is less than 31.4%. No company exceeded 60% of dedication to educational activities.
% of activity compared to the company's total
% of companies that dedicate that amount of time to educational activities
1%‐10% 68.5%
11%‐30% 25.7%
31%‐50% 2.85%
51%‐70% 2.85%
71%‐90% 0%
91%‐100% 0%
Table 5: The percentage represented by educational activities with regard to the total activity of the companies which carried out this type of work during 2012. Source: compiled by the authors.
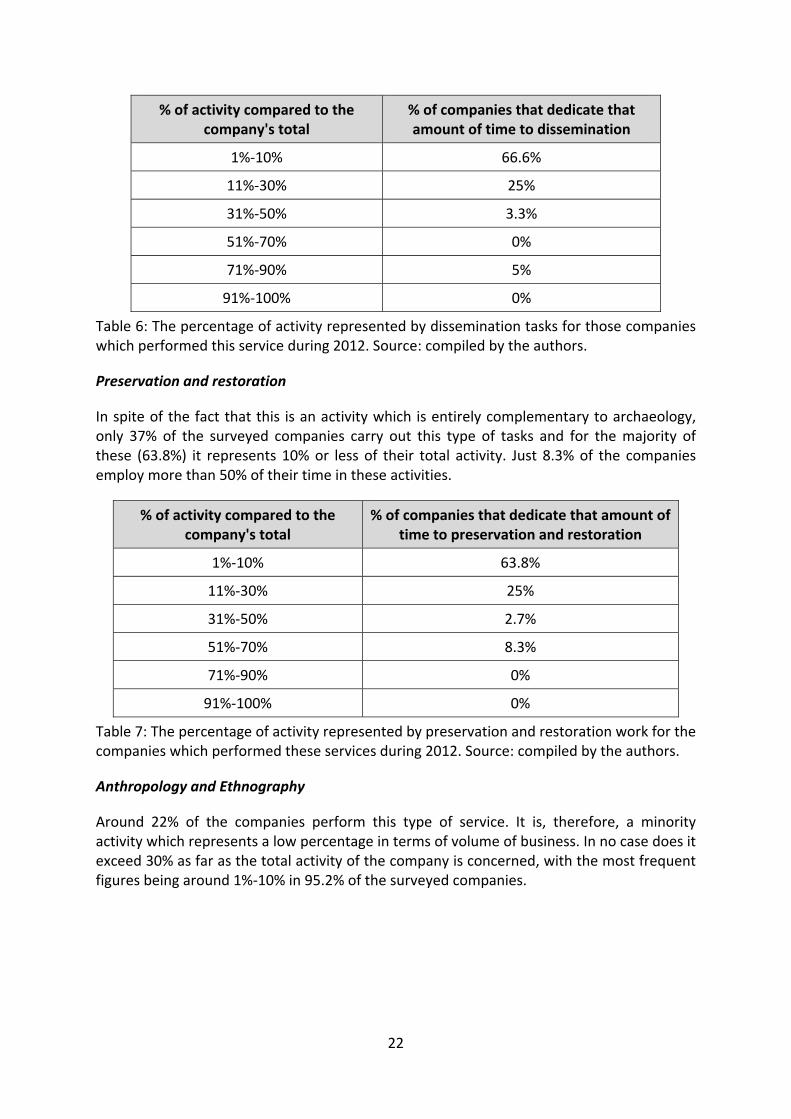
Dissemination
Approximately 61% of the companies perform dissemination tasks, albeit in low percentages. 91.6% of them dedicate less than 30% of their time to tasks of this type. It only constitutes a significant line of business for 5% of companies, representing between 71% and 90% of their total activity.
22
% of activity compared to the company's total
% of companies that dedicate that amount of time to dissemination
1%‐10% 66.6%
11%‐30% 25%
31%‐50% 3.3%
51%‐70% 0%
71%‐90% 5%
91%‐100% 0%
Table 6: The percentage of activity represented by dissemination tasks for those companies which performed this service during 2012. Source: compiled by the authors.
Preservation and restoration
In spite of the fact that this is an activity which is entirely complementary to archaeology, only 37% of the surveyed companies carry out this type of tasks and for the majority of these (63.8%) it represents 10% or less of their total activity. Just 8.3% of the companies employ more than 50% of their time in these activities.
% of activity compared to the company's total
% of companies that dedicate that amount of time to preservation and restoration
1%‐10% 63.8%
11%‐30% 25%
31%‐50% 2.7%
51%‐70% 8.3%
71%‐90% 0%
91%‐100% 0%
Table 7: The percentage of activity represented by preservation and restoration work for the companies which performed these services during 2012. Source: compiled by the authors.
Anthropology and Ethnography
Around 22% of the companies perform this type of service. It is, therefore, a minority activity which represents a low percentage in terms of volume of business. In no case does it exceed 30% as far as the total activity of the company is concerned, with the most frequent figures being around 1%‐10% in 95.2% of the surveyed companies.

23
% of activity compared to the company's total
% of companies that dedicate that amount of time to anthropology and ethnography
1%‐10% 95.2%
11%‐30% 4.7%
31%‐50% 0%
51%‐70% 0%
71%‐90% 0%
91%‐100% 0%
Table 8: The percentage of activity represented by anthropology/ethnography for the companies which performed these services during 2012. Source: compiled by the authors.
Documentation and History
51% of the surveyed companies carry out documentation tasks, though the percentage of activity which these tasks represent does not exceed 25%. Indeed, 87.2% of the companies which perform this service employ just 10% or less of their time in this way.
% of activity compared to the company's total
% of companies that dedicate that amount of time to documentation and history
1%‐10% 87.23%
11%‐30% 12.76%
31%‐50% 0%
51%‐70% 0%
71%‐90% 0%
91%‐100% 0%
Table 9: The percentage of activity represented by documentation work during 2012 for the companies which performed these tasks. Source: compiled by the authors.
Topography
A similar case occurs with regard to this service. Work related to geo‐spatial technology is a frequent activity for 41.5% of the companies, although these tasks never represent more than 20% of the total of their business activity. Again, most of the companies which carry out these tasks (specifically, 94.73%) dedicate 10% or less of their time to them.

24
% of activity compared to the company's total
% of companies that dedicate that amount of time to topography
1%‐10% 94.73%
11%‐30% 5.26%
31%‐50% 0%
51%‐70% 0%
71%‐90% 0%
91%‐100% 0%
Table 10: The percentage of activity represented by topography for the companies which performed this service during 2012. Source: compiled by the authors.
Publishing, photography and the graphic, plastic and visual arts
This is an extremely infrequent service only carried out by 20.8% of the companies surveyed. What is more, for 86.36% of the companies which perform these tasks, they only represent 10% or less of their total business activity.
% of activity compared to the company's total
% of companies that dedicate that amount of time to publishing, photography and…
1%‐10% 86.36%
11%‐30% 13.63%
31%‐50% 0%
51%‐70% 0%
71%‐90% 0%
91%‐100% 0%
Table 11: The percentage of activity represented by publishing, photography, etc. tasks for the companies which performed these services during 2012. Source: compiled by the authors.
Archiving and library activities
These are also very infrequent types of services, which are only performed by 16% of the companies and in extremely low percentages of activity. Of the companies which perform these tasks, 75% of them dedicate 10% or less of their time to such work.
25
% of activity compared to the company's total
% of companies that dedicate that amount of time to archiving and library activities
1%‐10% 75%
11%‐30% 16.6%
31%‐50% 8.3%
51%‐70% 0%
71%‐90% 0%
91%‐100% 0%
Table 12: The percentage of activity represented by archiving and library work for the companies which performed these services during 2012. Source: compiled by the authors.
Radio, cinema, television and entertainment
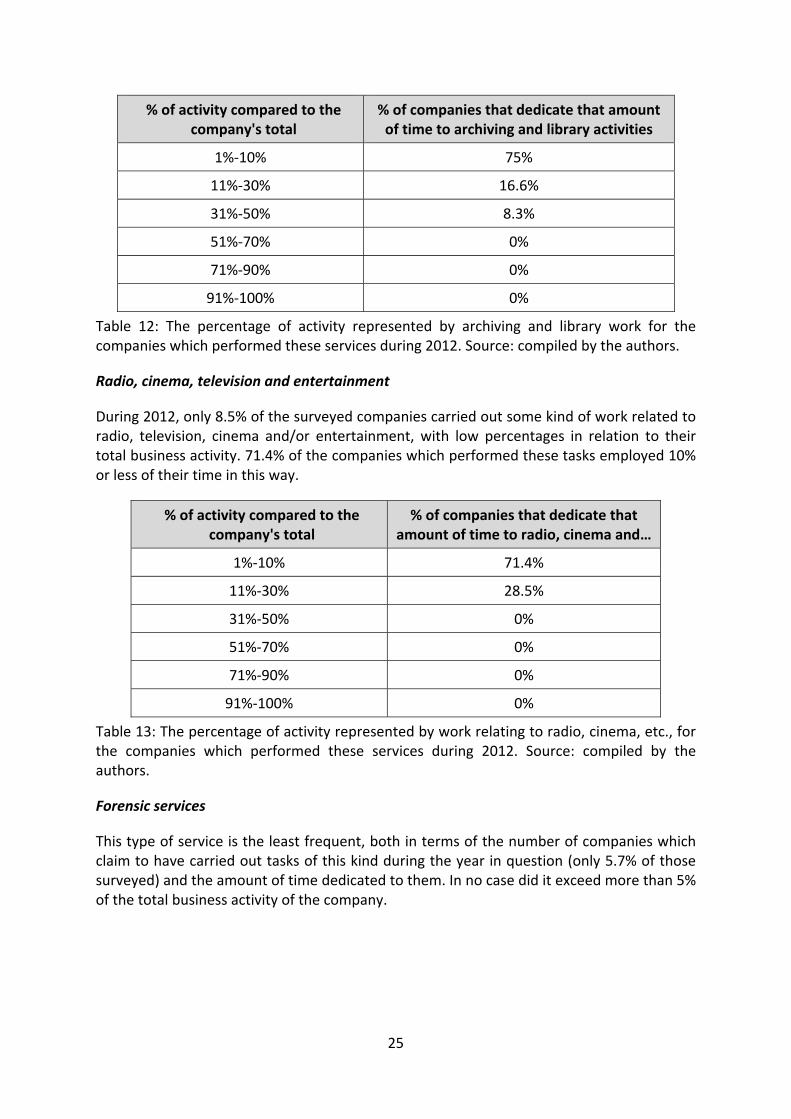
During 2012, only 8.5% of the surveyed companies carried out some kind of work related to radio, television, cinema and/or entertainment, with low percentages in relation to their total business activity. 71.4% of the companies which performed these tasks employed 10% or less of their time in this way.
% of activity compared to the company's total
% of companies that dedicate that amount of time to radio, cinema and…
1%‐10% 71.4%
11%‐30% 28.5%
31%‐50% 0%
51%‐70% 0%
71%‐90% 0%
91%‐100% 0%
Table 13: The percentage of activity represented by work relating to radio, cinema, etc., for the companies which performed these services during 2012. Source: compiled by the authors.
Forensic services
This type of service is the least frequent, both in terms of the number of companies which claim to have carried out tasks of this kind during the year in question (only 5.7% of those surveyed) and the amount of time dedicated to them. In no case did it exceed more than 5% of the total business activity of the company.
26
% of activity compared to the company's total
% of companies that dedicate that amount of time to forensic services
1%‐10% 100%
11%‐30% 0%
31%‐50% 0%
51%‐70% 0%
71%‐90% 0%
91%‐100% 0%
Table 14: The percentage of activity represented by forensic services during 2012 for the companies which carried out tasks of this kind. Source: compiled by the authors.
3.6 Size of companies
The size of the companies is determined by taking into account two factors: the number of workers and the economic results of the company.
3.6.1 Number of workers
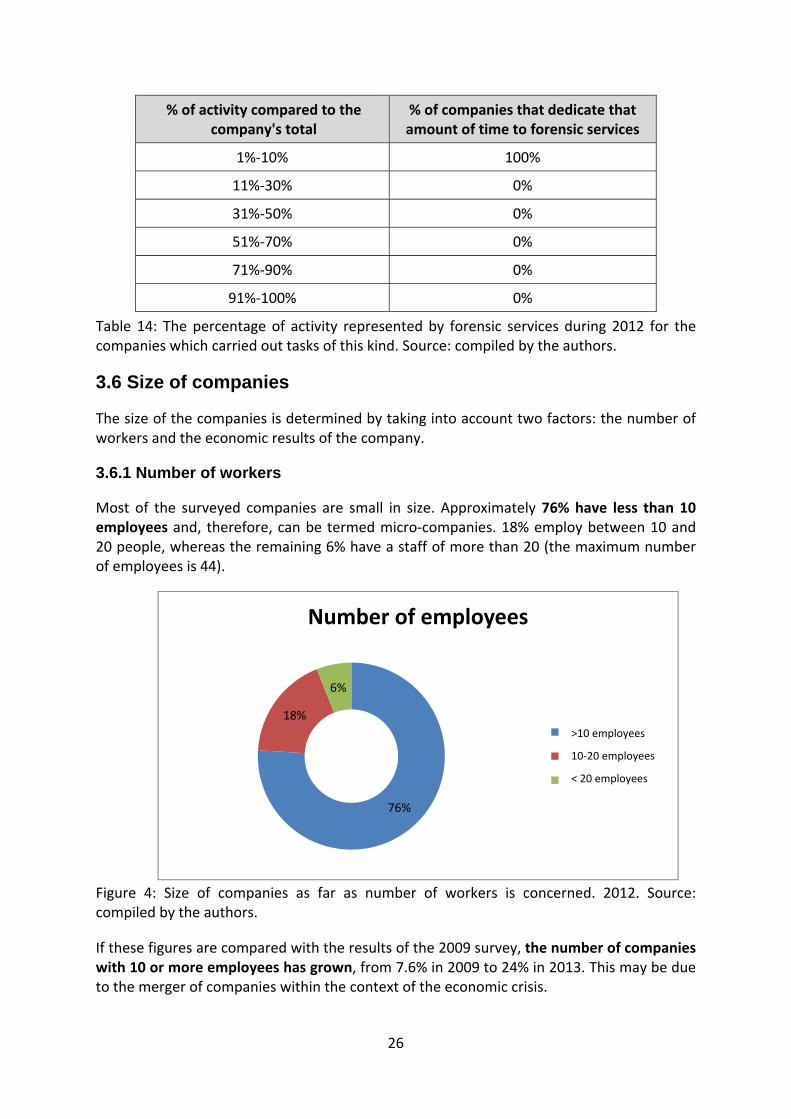
Most of the surveyed companies are small in size. Approximately 76% have less than 10 employees and, therefore, can be termed micro‐companies. 18% employ between 10 and 20 people, whereas the remaining 6% have a staff of more than 20 (the maximum number of employees is 44).
Figure 4: Size of companies as far as number of workers is concerned. 2012. Source: compiled by the authors.
If these figures are compared with the results of the 2009 survey, the number of companies with 10 or more employees has grown, from 7.6% in 2009 to 24% in 2013. This may be due to the merger of companies within the context of the economic crisis.
76%
18%
6%
Number of employees
>10 trabajadores
10‐20 trabajadores
< 20 trabajadores
>10 employees
10‐20 employees
< 20 employees
27
3.6.2 Economic results
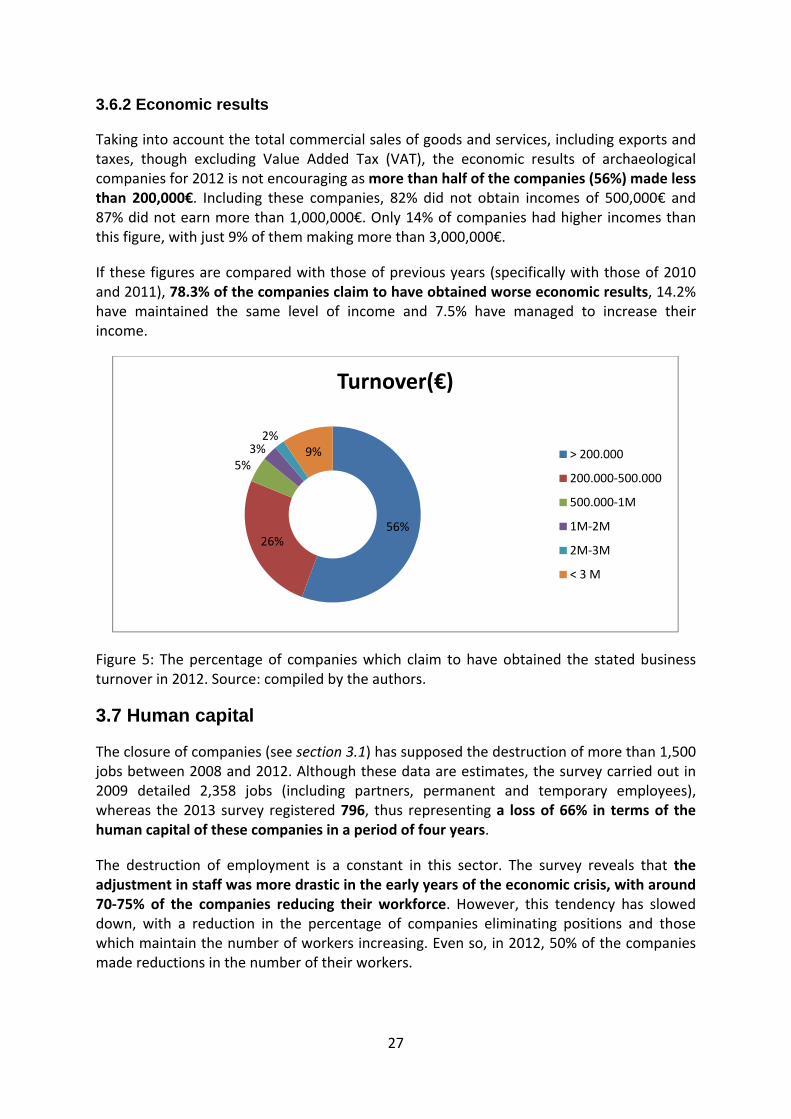
Taking into account the total commercial sales of goods and services, including exports and taxes, though excluding Value Added Tax (VAT), the economic results of archaeological companies for 2012 is not encouraging as more than half of the companies (56%) made less than 200,000€. Including these companies, 82% did not obtain incomes of 500,000€ and 87% did not earn more than 1,000,000€. Only 14% of companies had higher incomes than this figure, with just 9% of them making more than 3,000,000€.
If these figures are compared with those of previous years (specifically with those of 2010 and 2011), 78.3% of the companies claim to have obtained worse economic results, 14.2% have maintained the same level of income and 7.5% have managed to increase their income.
Figure 5: The percentage of companies which claim to have obtained the stated business turnover in 2012. Source: compiled by the authors.
3.7 Human capital
The closure of companies (see section 3.1) has supposed the destruction of more than 1,500 jobs between 2008 and 2012. Although these data are estimates, the survey carried out in 2009 detailed 2,358 jobs (including partners, permanent and temporary employees), whereas the 2013 survey registered 796, thus representing a loss of 66% in terms of the human capital of these companies in a period of four years.
The destruction of employment is a constant in this sector. The survey reveals that the adjustment in staff was more drastic in the early years of the economic crisis, with around 70‐75% of the companies reducing their workforce. However, this tendency has slowed down, with a reduction in the percentage of companies eliminating positions and those which maintain the number of workers increasing. Even so, in 2012, 50% of the companies made reductions in the number of their workers.
56%26%
5%3%2%
9%
Turnover(€)
> 200.000
200.000‐500.000
500.000‐1M
1M‐2M
2M‐3M
< 3 M

28
2007 2009 2011
Increase in staff 11% 10.6% 9.6%
Same number of staff 15% 17.4% 40.3%
Reduction in staff 74% 71.8% 50%
Table 15: Companies which have increased, maintained or reduced their staff with regard to previous years. Data expressed in percentages. Source: compiled by the authors.
The forecast for the future is as follows:
15.4% of the companies foresee that they will create employment in 2014 (this percentage increases to 32.5% if estimates of 3 years are taken into account).
51.5% predict that they will maintain the same number of staff in 2014 (for 2017, this estimate goes down to 43.8%).
33% believe that they will have to make workers redundant in 2014 (this percentage goes down to 23.5% in three years’ time).
3.7.1 Typology
Of the 796 workers recognised in the 2013 survey, approximately 65% are “archaeologist staff” (that is to say, workers with experience and professional capacity to work with archaeological heritage), with the remaining 32% being concerned either with administrative tasks or with other specialities.
Looking at the situation from a different perspective, it can be seen that 51.63% of the total number of workers have temporary contracts whereas 45.84% have permanent contracts. Both in the case of archaeologist staff and other workers, the percentage of temporary hiring is always slightly higher than that of permanent contracts. However, the figure of temporary employment should be taken with caution, as workers hired by one or more companies at different times of the same year may be being taken into account. Even taking this detail into consideration, the rate of temporary employment within the sector can be considered to be high, as it affects approximately half of the workers. However, similar levels have been maintained to those of the 2009 survey, which gave a figure of 56%.
Permanent staff Temporary staff Total
Archaeologist staff 31.65% 33.54% 65.19%
Non‐archaeologist staff 14.19% 18.09% 32.28%
Total 45.84% 51.63% 97.47%
Table 16: The percentage of the total number of workers in each profile and mode of hiring. 2012. Source: compiled by the authors.
On the other hand, in the case of both archaeologist and non‐archaeologist staff and of permanent or temporary contracts, full‐time contracts are much more common than part‐time ones, representing 80.9% of the total number of contracts. In the case of archaeologist staff, full‐time contracts are generally associated with permanent contracts (this is true for 89.2% of permanent contracts of archaeologist staff). However, in the case
29
of non‐archaeologist staff, full‐time contracts are linked more to temporary contracts (41.4%).
Part‐time contracts (in the case of archaeologist staff or otherwise) are also generally temporary in nature (see table 17).
Archaeologist staff Non archaeologist staff
Permanent staff Temporary staff Permanent staff Temporary staff
Full‐time Part‐time Full‐time Part‐time Full‐time Part‐time Full‐time Part‐time
89.2% 10.7% 78.3% 21.7% 39.1% 4.2% 41.4% 13.8%
Table 17: The characteristics of contracts of staff working for archaeological companies in 2012. Percentages calculated with regard to each type of contract. Source: compiled by the authors.
3.7.2 Gender, age and nationality
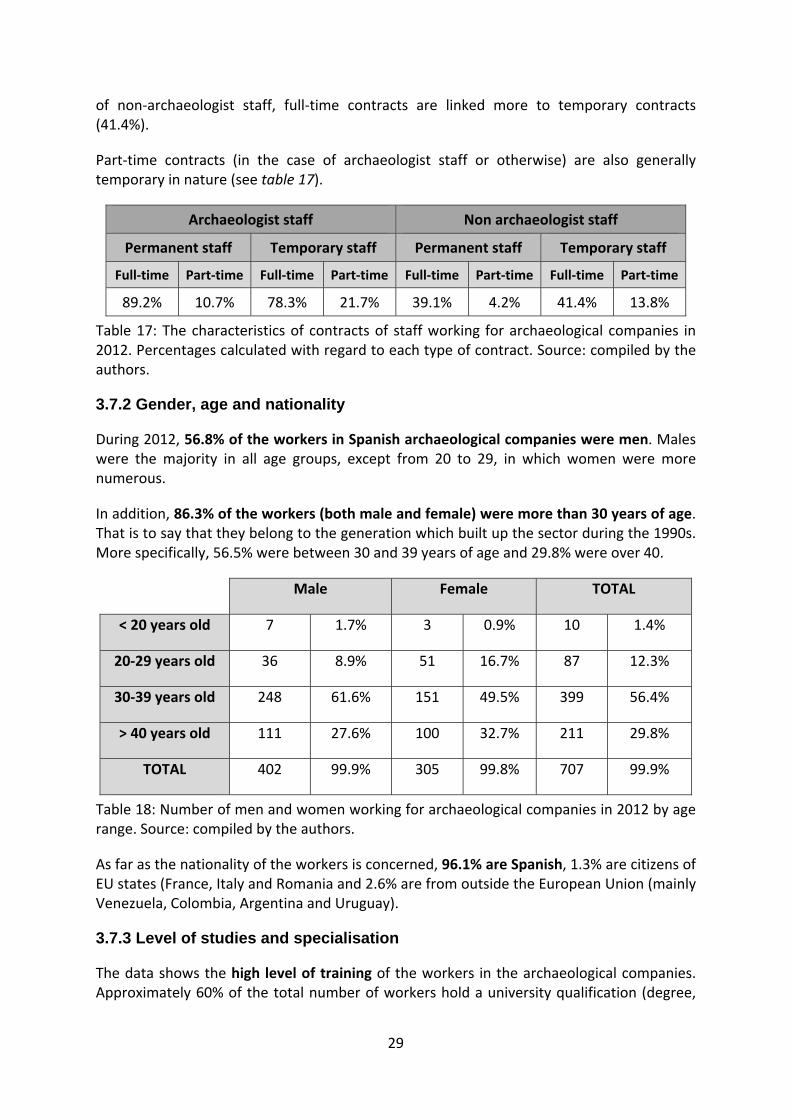
During 2012, 56.8% of the workers in Spanish archaeological companies were men. Males were the majority in all age groups, except from 20 to 29, in which women were more numerous.
In addition, 86.3% of the workers (both male and female) were more than 30 years of age. That is to say that they belong to the generation which built up the sector during the 1990s. More specifically, 56.5% were between 30 and 39 years of age and 29.8% were over 40.
Male Female TOTAL
< 20 years old 7 1.7% 3 0.9% 10 1.4%
20‐29 years old 36 8.9% 51 16.7% 87 12.3%
30‐39 years old 248 61.6% 151 49.5% 399 56.4%
> 40 years old 111 27.6% 100 32.7% 211 29.8%
TOTAL 402 99.9% 305 99.8% 707 99.9%
Table 18: Number of men and women working for archaeological companies in 2012 by age range. Source: compiled by the authors.
As far as the nationality of the workers is concerned, 96.1% are Spanish, 1.3% are citizens of EU states (France, Italy and Romania and 2.6% are from outside the European Union (mainly Venezuela, Colombia, Argentina and Uruguay).
3.7.3 Level of studies and specialisation
The data shows the high level of training of the workers in the archaeological companies. Approximately 60% of the total number of workers hold a university qualification (degree,

30
masters o diploma) and 15% also have a doctorate. Only 15.7% of the total number of workers do not hold higher education qualifications.
The staff with degree qualifications and doctorates are mainly specialized in archaeology. However, among the workers who do not hold higher education qualifications, it is more common to find that they are specialized in complementary areas.
Doctor University qualification Non‐university qualification
Archaeology 13.56% 50.62% 5.90%
Other areas of specialization
1.5% 9.17% 9.79%
Table 19: Level of studies and area of specialisation of staff working for archaeological companies in 2012. Percentages calculated with regard to the total number of workers. Source: compiled by the authors.
Doctor
University qualification
Non‐university qualification
Archaeology 108 90% 403 84.6% 47 37.6%
Other areas of specialization 12 10% 73 15.3% 78 62.4%
TOTAL 120 100% 476 100% 125 100%
Table 20: Number of workers of each type. Percentages calculated with regard to the responses obtained to this question. Source: compiled by the authors.
On the other hand, the survey indicates that, in 2012, 58% of the companies only employed staff with higher education studies, thus proving that the sector values academic studies highly and/or that redundancies have mainly affected less specialized jobs.
Doctor University qualification Non‐university qualification
Archaeology 47.2% 85.8% 9.4%
Other areas of specialization
8.5% 21.7% 19.8%
Table 21: Percentage of companies which hire this type of staff. Percentages calculated with regard to the total number of companies. Source: compiled by the authors.
3.7.4 Staff with disabilities
This question was answered for 91 companies. Only 3.3% of these companies employ staff with some kind of disability. Each of these companies employs 1 person with disability, so only 3 persons with disability were working in archaeology companies in 2012.
31
3.7.5 Average salary
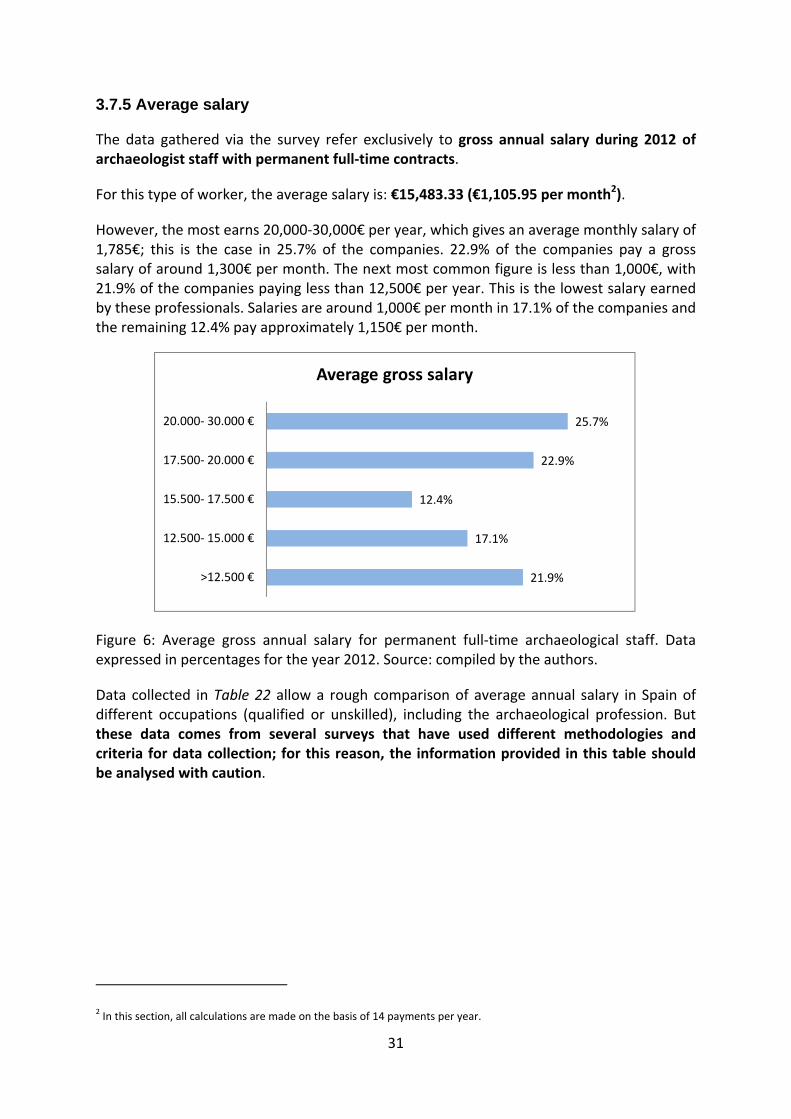
The data gathered via the survey refer exclusively to gross annual salary during 2012 of archaeologist staff with permanent full‐time contracts.
For this type of worker, the average salary is: €15,483.33 (€1,105.95 per month2).
However, the most earns 20,000‐30,000€ per year, which gives an average monthly salary of 1,785€; this is the case in 25.7% of the companies. 22.9% of the companies pay a gross salary of around 1,300€ per month. The next most common figure is less than 1,000€, with 21.9% of the companies paying less than 12,500€ per year. This is the lowest salary earned by these professionals. Salaries are around 1,000€ per month in 17.1% of the companies and the remaining 12.4% pay approximately 1,150€ per month.
Figure 6: Average gross annual salary for permanent full‐time archaeological staff. Data expressed in percentages for the year 2012. Source: compiled by the authors.
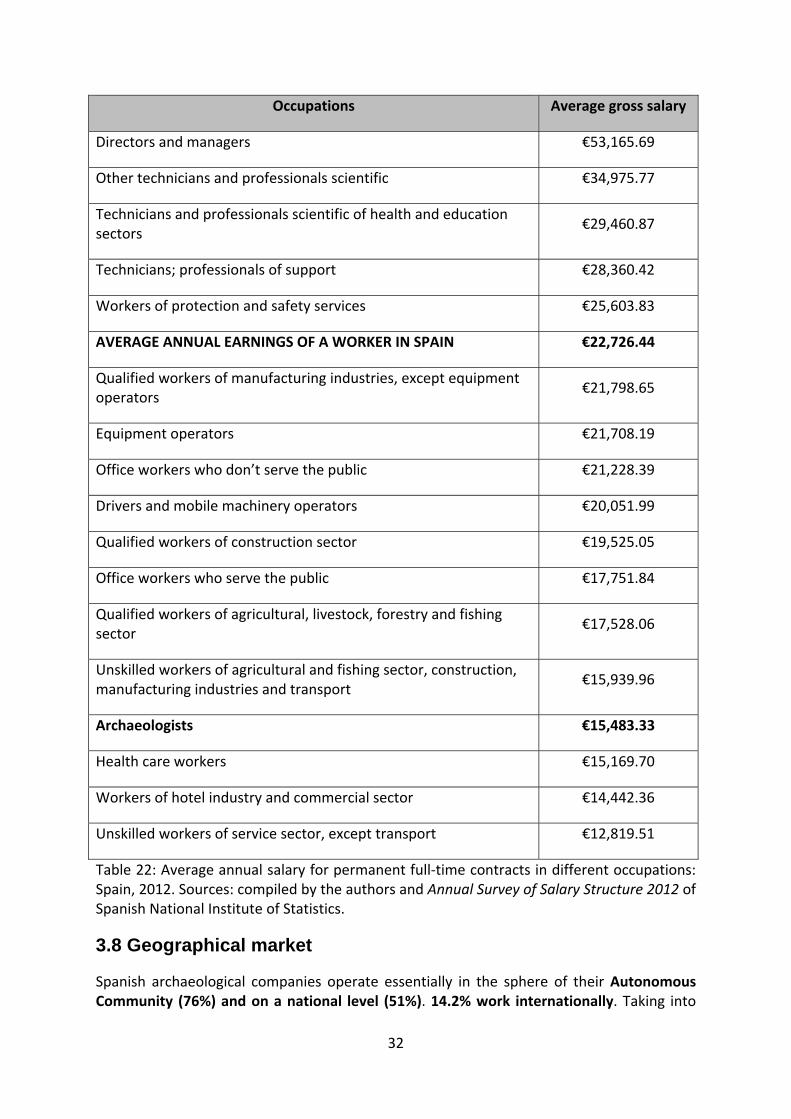
Data collected in Table 22 allow a rough comparison of average annual salary in Spain of different occupations (qualified or unskilled), including the archaeological profession. But these data comes from several surveys that have used different methodologies and criteria for data collection; for this reason, the information provided in this table should be analysed with caution.
2 In this section, all calculations are made on the basis of 14 payments per year.
21.9%
17.1%
12.4%
22.9%
25.7%
>12.500 €
12.500‐ 15.000 €
15.500‐ 17.500 €
17.500‐ 20.000 €
20.000‐ 30.000 €
Average gross salary
32
Occupations Average gross salary
Directors and managers €53,165.69
Other technicians and professionals scientific €34,975.77
Technicians and professionals scientific of health and education sectors
€29,460.87
Technicians; professionals of support €28,360.42
Workers of protection and safety services €25,603.83
AVERAGE ANNUAL EARNINGS OF A WORKER IN SPAIN €22,726.44
Qualified workers of manufacturing industries, except equipment operators
€21,798.65
Equipment operators €21,708.19
Office workers who don’t serve the public €21,228.39
Drivers and mobile machinery operators €20,051.99
Qualified workers of construction sector €19,525.05
Office workers who serve the public €17,751.84
Qualified workers of agricultural, livestock, forestry and fishing sector
€17,528.06
Unskilled workers of agricultural and fishing sector, construction, manufacturing industries and transport
€15,939.96
Archaeologists €15,483.33
Health care workers €15,169.70
Workers of hotel industry and commercial sector €14,442.36
Unskilled workers of service sector, except transport €12,819.51
Table 22: Average annual salary for permanent full‐time contracts in different occupations: Spain, 2012. Sources: compiled by the authors and Annual Survey of Salary Structure 2012 of Spanish National Institute of Statistics.
3.8 Geographical market
Spanish archaeological companies operate essentially in the sphere of their Autonomous Community (76%) and on a national level (51%). 14.2% work internationally. Taking into
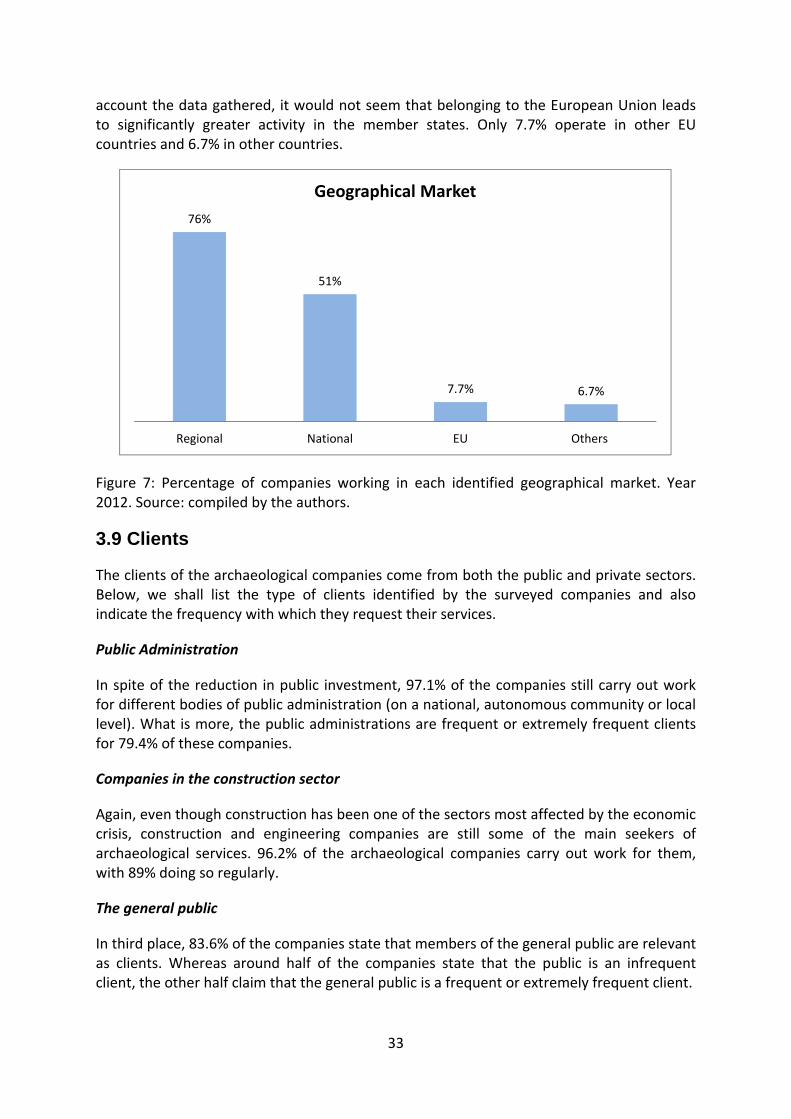
33
account the data gathered, it would not seem that belonging to the European Union leads to significantly greater activity in the member states. Only 7.7% operate in other EU countries and 6.7% in other countries.
Figure 7: Percentage of companies working in each identified geographical market. Year 2012. Source: compiled by the authors.
3.9 Clients
The clients of the archaeological companies come from both the public and private sectors. Below, we shall list the type of clients identified by the surveyed companies and also indicate the frequency with which they request their services.
Public Administration
In spite of the reduction in public investment, 97.1% of the companies still carry out work for different bodies of public administration (on a national, autonomous community or local level). What is more, the public administrations are frequent or extremely frequent clients for 79.4% of these companies.
Companies in the construction sector
Again, even though construction has been one of the sectors most affected by the economic crisis, construction and engineering companies are still some of the main seekers of archaeological services. 96.2% of the archaeological companies carry out work for them, with 89% doing so regularly.
The general public
In third place, 83.6% of the companies state that members of the general public are relevant as clients. Whereas around half of the companies state that the public is an infrequent client, the other half claim that the general public is a frequent or extremely frequent client.
76%
51%
7.7% 6.7%
Regional National EU Others
Geographical Market
34
Other archaeological companies
67.6% of archaeological companies have been hired at some time by other companies in the same sector, though this only occurs regularly in 21.1% of the cases. For 78.9% of the companies, other archaeological companies are not frequent clients.
Suppliers
These only appear on the list of clients of 35.2% of the surveyed companies. Furthermore, 91.9% of these state that they are infrequent or extremely infrequent clients.
Consultancies, commercial laboratories or similar companies
These are clients for 54.3% of the archaeological companies, although they do not require their services with regularity (according to 73.6% of the companies).
Companies from other sectors (other than those mentioned)
These were identified as users of archaeological services by 79.8% of the companies, although they were not a frequent client in 61.4% of the cases.
Museums
Although 69.5% of the companies have been hired at some time by museums, 60.2% of them stated that these are not a usual client.
Foundations
62.9% of the sample have worked for foundations. However, they are infrequent or extremely infrequent clients according to 65.1% of the companies.
Universities
60% of the archaeological companies have worked for universities but this is a regular activity for only 28.5% of them. 71.4% of the companies identified them as an infrequent client.
Research Institutes / Technological Centres
These are clients for 57.1% of the companies, with 68.3% of them stating that they are infrequent clients.
Other agencies
At specific moments, the archaeological companies may have other types of clients that have not been mentioned above. This is the case for 10.2% of the companies. For 50% of them, this type of client are extremely frequent, whereas 10% consider them to be regular clients and 40% state they are infrequent or extremely infrequent as clients.

3.10 P
Approxwithin tleadersto be m
Figure 8Year 20
Withouwhich twithin tlevel raofferedcompanfrom th
3.11 I
The sucompan
3.11.1
Taking “Encuesreferenobjectiv
For mor
Position
imately 16their Autonhip. On a na
market leade
8: The perc012. Source:
ut doubt, ththe compantheir own Aather than in the secnies see thehis point of v
nnovatio
urvey includnies with re
Strategic
the innovasta sobre Ince, the archve in their s
re than half
To developthe surveye
16
in the m
% of the cnomous Comational scalers and 26%
ception of t: compiled b
he perceptiny operatesAutonomousnationally. ctor is not emselves aview, they a
on
ded multipegard to inn
objective
ation objectnnovación haeologicalstrategy.
f of them, t
p more efficed compani
Leaders
6%
arket
companies mmunity ane, these fig
% state that
the archaeoby the auth
on of leade. Taking intos CommuniOn the othvery varieds being cloall carry out
ple questioovation dur
s
tives listed en las Emp companies
he main obj
cient relatioes).
Close to
7.5%
Position
Regional m
35
consider thnd 58% conures reducethey are clo
ological comhors.
ership is dio account tty, it is easiher hand, ifd, it is undse to a post practically
ons aimed ring the per
in the Spapresas” (Sus were aske
jectives are
ons with sup
leaders
57.5%25.5%
n in the
market Na
hemselves nsider that te by half: arose to leade
mpanies of
rectly linkethe fact thaier for themf we considerstandablesition of leay the same t
at charactriod 2010‐2
anish Natiourvey on Ined about th
e:
ppliers and
Long way froleaders
25.5%
%
market
ational marke
to be leadthey are cloround 8% coership.
their posit
ed to the tet most of thm to be marder that thee that a laradership dutype of wor
terising the012:
nal Statistinovation ine relevance
clients (acc
m
26.2%
t
t
ders in the ose to a posonsider the
tion in the
erritorial sphe companirket leaderse range of rge numbeue to the fark.
e strategy
cs Instituten Companiee they gave
cording to 5
market sition of mselves
market.
phere in ies work s on that services r of the act that,
of the
e´s (INE) es) as a to each
57.7% of
36
To improve efficiency in systems and procedures (56.8%). To reduce production, maintenance and staff costs (52.9%). To increase their market share (51.9%).
Optimising financial and business management, gaining access to new markets and improving selection and training of staff are also important aims (according to 47.2%, 47.1% and 42.3% of the companies respectively) albeit with lesser priority than the aforementioned objectives. In these cases, the number of companies which attributed “average importance” to these aspects was greater.
On the other hand, investment in up‐to‐date technology and in R&D is something which 53.8% and 48% of the companies respectively consider important for their strategy. However, 20.2% and 25% of the companies respectively consider these aspects to be of “no importance”.
3.11.2 R&D activities
Innovation can be the result of a previous R&D process or not. The survey included a question which was specifically oriented towards finding out how many companies carry out this type of activity with the aim of innovating and to what degree the inclusion of these processes in the company’s strategy has determined its growth. During the period considered in the survey, 44.2% of the companies stated that they had not carried out R&D activities (neither had they subcontracted them to other companies) as a prior step to innovation. Furthermore, 51.7% of the companies which did carry out these types of activities do not consider that they had a significant effect on their growth. On the other hand, 25.8% believe that R&D activities have played a significant role in their development and 22.4% consider them to have been fundamental.
3.11.3 Investment
32.1% of the surveyed companies state that they did not invest in innovation in 2012, whereas 52.8% claimed to have done so to the value of less than 10,000€.
Compared to previous years (2010‐2011), 35.6% of the companies maintained their funding for this type of activities, 7.7% increased funding and 56.7% reduced it.

37
Figure 9: Investment in innovation in archaeological companies for the year 2012. Source: compiled by the authors.
3.11.4 Technological Innovation
This includes the creation of new products or services and the introduction of substantial improvements in existing ones as well as the implantation of new processes for production, distribution, etc., in the company and the significant improvement of existing processes.
The latter point, innovations in processes, is more common for these companies than that of products and services. Approximately 67% have applied some kind of improvement or novelty in this area. In addition, 55% claim to have renewed or created new products or services.
On the other hand, perfecting pre‐existing processes is considered to be the most strategic technological innovation for company development:
Product/Service Process
New Improved New Improved
Evaluation of innovation as “strategic” or “extremely strategic”
54.5% 52.4% 51.4% 59.4%
Table 23: Companies which, after introducing those types of innovation in the period 2010‐2012, consider them to be “strategic” or “extremely strategic” for their development. Percentages calculated with regard to the total number of companies which claim to have carried out those types of innovation. Source: compiled by the authors.
Product/Service Innovation
Approximately half of the actions carried out in this sense consist of improvements to pre‐existing products/services. The other half is attributed to creating novel goods and services.
32.1%
52.8%
8.5%
4.7% 0.9% 0.9%
Investment in innovation
No invierte
<10000€
10000€‐25000€
25000€‐45000€
45000€‐60000€
>60000€
No investment

38
36.9% of these innovations were considered to be novelties in the markets at which they were aimed. The remaining 63.1% were new only for the companies which introduced them as they were already available on the market.
Innovation of processes
The most remarked process innovation (by 67% of the companies) was that of support activities, such as IT or accountancy support. 58.4% of the companies which carried out these activities stated that they were “strategic” or “extremely strategic” activities for their development.
Innovation in production methods is also frequent (in 51.3% of cases) and is, in addition, the most highly valued type of process innovation. Indeed, 67.5% of the companies which implanted such methods consider them to be “strategic” or “extremely strategic”.
A much smaller number of companies introduced innovations in logistics (34.6%). This type of innovation was also valued much less highly, with 51.9% of the companies which applied innovations in this area declaring them to be of “no or low relevance”.
3.11.5 Non-technological Innovation
This includes innovations in marketing (activities for the introduction and positioning of products/services of the company on the market) and in organisation (structure, delegation of responsibilities and competences, team management, external relations, etc.).
Innovation in marketing is much more common than organisational innovation. All the companies claim to have carried out some kind of activity of this type during the period 2010‐2012. However, organisational innovation (in any of its facets) played a more strategic role.
Marketing Innovation
Although the true extent of marketing activities (that is to say, the degree of innovation they supposed) carried out by the surveyed companies is not known, it is interesting to note that 71.8% considered them to be of low or no strategic importance. Only 13.2% considered them to be key to their position in the market.
Organisational Innovation
The introduction of new methods for optimising the delegation of responsibilities and decision taking is the most common and best valued type of organisational innovation. 59.4% of companies employed such techniques and, of these, 58.7% considered them to be of “strategic or extremely strategic importance” to the business. The exact practices mentioned were: the creation of multidisciplinary work groups, the minimization of hierarchies, the decentralization of tasks and the creation of quality circles. The creation of multidisciplinary work groups was identified by the companies as being the most effective method for maintaining their competitive position in the market:

39
% of companies which applied each practice
% of companies which consider the practice to be “effective or
extremely effective”
Creation of multidisciplinary work groups
95.2% 88.3%
Minimization if hierarchies 85.7% 62.9%
Decentralization of tasks 84.1% 64.1%
Creation of quality circles 79.4% 64%
Table 24: Companies which implanted these types of practices from 2010‐2012 and the evaluation of their effectiveness. Data expressed in percentages in relation to the total number of companies which introduced these types of practices. Source: compiled by the authors.
49.1% of the companies mentioned the optimisation of work procedures and/or the management of the company’s external relations. In both cases, 44.2% consider these aspects to be of low or no strategic importance and 55.7% “strategic or extremely strategic”.
As far as work procedures are concerned, the companies mentioned the following specific practices, considering that the creation of work groups is the most effective aspect for maintaining or improving the company’s competitive position in the market:
% of companies which applied each practice
% of companies which consider the practice to be “effective or
extremely effective”
Job enrichment 90.4% 65.9%
Creation of work groups in production
86.5% 75.5%
Implantation of training plans and programmes
80.8% 66.6%
Quality and environmental audits / obtaining of ISO certificates
53.8% 35.7%
Table 25: Companies which implanted these types of practices from 2010‐2012 and the evaluation of their effectiveness. Data expressed in percentages in relation to the number of companies which innovated in regard to organisation by way of work procedures. Source: compiled by the authors.
3.11.6 Effects of innovation
According to the surveyed companies, innovation has contributed notably towards improvement in the following aspects: levels of satisfaction of the companies’ workers (in

40
66.7% of cases), response times to the client (56.9%) and the quality of products/services offered by the companies (54.9%).
However, the general opinion is that the contribution of innovation is less in relation to the offering of a wider range of products/services, the fulfilment of certain legislative requirements and the increasing and flexibilisation of production.
Finally, the companies consider that innovation hardly contributed towards the reduction of work costs or the opening up of new markets (this was the opinion of 60.8% of the companies in both cases). Also of little importance were health and safety and environmental impact measures (according to 67.6% of the companies).
3.11.7 Obstacles for innovation
Without doubt, cost factors are those which most determine innovation activities in the companies, affecting not only the development of the process but also the decision to innovate. More specifically, the lack of funds (for 89.5% of the total number of companies) and the cost of the activities themselves (for 84.8%) were the most determining variables.
The next most deterring variable was the uncertainty associated with processes of innovation, that is to say, the fact of not knowing to what extent innovative products or services will be in demand. This is a market factor which 74.3% of the total number of companies classifies as “relevant or extremely relevant”.
Other factors also have an influence, although to a much lesser degree than those mentioned above. 59% of the companies consider that the existence of already established companies in the market is a “significant or extremely significant” factor in the decision of whether to innovate, although 41% state that this is not a determining factor. In addition, 55.2% of the companies stated that difficulty in finding partners, or a lack of information on the market, were great disadvantages. However, the remaining 44.8% classified these variables as of “little or no relevance”.
The lack of qualified staff was less of an obstacle, according to 56.2% of those surveyed.
However, it is interesting to note that 54.8% of the companies consider that it is not necessary to innovate due to the fact that there is no demand for it.
3.12 Cooperation with other agencies
At least 66% of the surveyed companies stated that they have established collaborative relations with differing agencies and organisations.
60% of the surveyed companies cooperate with companies from the construction sector and the Public Administrations. In other words, their main clients are also their main partners.
Between 50% and 60% of companies in the sector collaborate with their competitors (other archaeological companies), with companies from sectors other than archaeology and with universities.

41
In addition, suppliers, museums and research centres are regular partners for 40‐50% of the companies. 35% state that they collaborate with consultancies and commercial laboratories.
Only 6.9% of the surveyed companies collaborate with different types of agencies to those mentioned above.
Figure 10: Collaboration partners of archaeological companies. Data expressed in percentages for the year 2012. Source: compiled by the authors.
The most productive collaborations are those with companies from the construction sector and the Public Administrations (75.3% and 70.7% respectively of the companies surveyed consider these collaborations to be “effective or extremely effective”). In other words, the main users of archaeological services are identified as the main collaborative partners, both as far as the number of companies with which they cooperate and the quality of this collaboration is concerned.
In addition, in spite of the fact that the percentage of companies which collaborate with “other agencies” is very low (6.9%), the results are considered to be extremely positive in 71.4% of the cases.
In the same way, the 59.9% of the companies which cooperate with companies from different sectors to archaeology and construction evaluate this relationship as being “effective or extremely effective” but here it must be noted that 40% of the sample classify this collaboration as being “not very or not at all productive”. A similar case occurs in collaborations with competitors (55.5% evaluate them positively, whereas 44.4% consider them to be quite unproductive) and with research centres (51% and 48.9% respectively).
This tendency is reversed in the case of collaborations with universities and museums. The percentage of companies which consider these relationships to be “not very or not at all productive” is higher than that of companies which consider these collaborations to be
0 10 20 30 40 50 60 70
Construction companies
Public Administration
Competitors
Other sectors
Universities
Suppliers
Museums
Research centres
Consultancies, laboratories
Others
Collaborations

42
“effective or extremely effective” (in both cases around 51% consider these collaborations to be “not very or not at all productive”).
Finally, both collaborations with consultancies and commercial laboratories and with suppliers are evaluated negatively. 67.5% of the companies (in the first case) and 60.7% (in the second case) believe that associating themselves with these agencies is “not very or not at all effective”.

43
4 Conclusions
As was mentioned in the introduction to this text, the 2nd Survey of the Characterisation of Spanish Archaeological Companies is just one of many activities carried out by the Incipit within the framework of a larger project (Discovering the Archaeologists of Europe 2014) and in the context of a line of research with much wider aims (Socioeconomics of Cultural Heritage). With a common driving force (the study of the archaeological sector), different themes, contexts and agents are dealt with, suggesting multiple and varied activities (semi‐structured interviews, discussion groups, Delphi panels, etc., and the survey itself) which converge and make it possible to interpret the results in a trustworthy manner, giving them quality and consistency.
As a consequence, although this text makes reference to one specific activity (the 2nd survey) and its results can be an object of analysis by themselves, it should be taken into account that the research carried out deals with other aspects and actions which both complement and enrich it. This is the case, for example, with the analysis of the data presented in relation to the results of the survey carried out in 2009, when this is possible.
Without a doubt, the main conclusion which can be drawn is the drastic destruction of companies and jobs. The calculations indicate that 42% of companies and 66% of jobs have been lost in a 4‐year period. Furthermore, the economic results of 78.3% of the companies have reduced in comparison to previous years, with 56% of the cases failing to obtain an income of 200,000€. The reason for this was already clear in 2009: the excessive dependence of archaeological companies on the construction sector and on public investment in infrastructure, two of the spheres most directly affected by the financial crisis.
With the aim of adapting themselves to this situation, the archaeological companies in Spain do not appear to have taken significant steps towards modifying their strategy, although some changes can be noted. For example, although 76% of the companies have less than 10 employees (the sector continues to be extremely fragmented), the number of companies with more than 10 workers has increased in comparison with 2009, which may be due to companies merging with the aim of facilitating their survival. On the other hand, field work, consultancy, research and dissemination continue to be the most frequent services with no new services appearing to be offered. However, as the percentage of activity which the companies dedicate to each one of the services they offer is known, a certain degree of diversification can be detected. Therefore, it can be stated that companies which dedicate practically all their time to just one service are in the minority. Another change can be noted in the companies’ client base. Although the Public Administrations and the construction sector continue to be the main users of archaeological services, the percentage of surveyed companies which classified them as such has gone down 10‐20% when compared to 2009. In addition, a new type of client has sprung up: the general public, both for the number of archaeological companies which state that they have carried out work for members of the public and for the frequency with which the public hires the companies.
Other aspects (as has already been mentioned) have not changed with respect to 2009. The companies continue to sell their services on the national market (if not the market of their own Autonomous Community), without betting on internationalization as a possible escape route from the crisis. In addition, temporary contracts continue to characterize the work

44
market. This, along with salaries in the region of 1,000€ per month in a significant number of cases, which do not correspond to the level of training of the workers, leads to employment insecurity in the sector.
However, the survey reveals that the companies are built on extremely qualified human capital, which lends them a great capability to adapt their business models to the contingencies of the market. In the same way, a significant number of companies claim to have carried out activities related to innovation and consider that process and organizational innovation have been most strategic for their organization, both as far as activity and the results obtained are concerned.
These two factors (human capital and innovative potential) constitute a clear opportunity to overcome the crisis through which the sector is passing, by introducing formulae of innovation which are different to traditional values (oriented towards production and technology) as a source of development and competitiveness.
Some of the specific steps which can be applied are: investing in on‐going training of the workforce, defining a commercial strategy based on differentiation, specialization and innovation, widening the sphere of operation, improving internal work and organizational procedures and promoting processes of knowledge transfer.
45
5 Associated Publications
Parga‐Dans, E.; Martin‐Rios, C.; Criado‐Boado, F. 2013. La innovación organizativa y de gestión como motor de dinamización empresarial [Organizational and management innovation as a driving force of business renewal]. Journal of Technology Management Innovation, vol 8(2): 132‐143.
Parga‐Dans, E. 2012. Estructura y desafíos de la arqueología comercial en España. Un proceso de innovación social. Revista d’Arqueologia de Ponent, 22, 87‐100.
Parga‐Dans, E.; Fernández‐Esquinas, M. 2012. Instituciones públicas y dinámica empresarial en el sector cultural: la arqueología comercial en España. Arbor, 188, 135‐152.
Parga‐Dans, E.; Castro‐Martínez, E.; Fernández de Lucio, I. 2012. La arqueología comercial en España: ¿Un sistema sectorial de innovación? Cuadernos de Gestión, 12, 29‐46. ISSN: 1131‐6837.
Parga‐Dans, E.; Varela‐Pousa, R. 2011. Caracterización socioeconómica de la arqueología comercial española. Resultados de la Primera Encuesta dirigida a Empresas de Arqueología. Complutum, 22, 9‐25.
Parga‐Dans, E. 2011. Innovación y emergencia de un servicio intensivo en conocimiento: El caso de la arqueología comercial. Tesis doctoral editada por la Universidad de Santiago de Compostela. Servizo de Publicacións e Intercambio Científico. ISBN: 978‐84‐9887‐723‐6
Parga‐Dans, E. 2010. Commercial Spanish Archaeology: Its growth, development and the impact of the global crisis, pp. 45‐54. En Aitchison, K. Y Schangler, N. Archaeology and the Global Economic Crisis. Multiple Impacts, Possible Solutions. Culture Lab Editions. Brussels. ISBN: 978‐2‐9600‐527‐7‐0
Parga‐Dans, E. 2009. El mercado del patrimonio: nacimiento, estructura y desarrollo de las empresas que gestionan el patrimonio arqueológico. Cadernos de Arqueoloxía e Patrimonio, 21. Santiago de Compostela. ISSN: 1579‐5349.


