Preferential trade agreements AND MULTILATERAL LIBERALIZATION

WOrld Trade repOrT 2011
122
This section considers to what extent conclusions about deep preferential trade agreements (PTAs) and production networks, reached in Section C, are supported by evidence. The evidence presented includes an examination of the magnitude of preferential tariff rates, the coverage and contents of the agreements, econometric evidence on the relationship between production networks and deeper PTAs and the integration experience of specific PTAs.
d. anatomy of preferential trade agreements

II – tHe Wto AnD PReFeRentIAL tRADe AGReements
123
D. A
nA
tom
y o
F PR
eFe
Re
ntIA
L
tRA
De
AG
Re
em
en
ts
Contents 1. ArelowertariffsstillimportantforPTAs? 124
2. PatternsinthecontentofPTAs 128
3. ProductionnetworksanddeepPTAs 145
4. Africanregionalcooperation:lessonsfromdeepintegration? 151
5. Conclusions 153
Appendixtables 157
Some key facts and findings
• MFN tariffs are low and equal to 4 per cent on average in 2009.
• Most “sensitive” sectors remain “sensitive” in PTAs. Approximately
66 per cent of tariff lines with MFN rates above 15 percentage points
have not been reduced in PTAs.
• If the preferential access enjoyed by other exporters is taken into
account, less than 13 per cent of preferential trade benefits from a
competitive advantage exceeding 2 percentage points.
• Signing deep integration PTAs increases trade in production
networks by almost 8 per cent on average. In addition, high levels
of trade in production networks raise the likelihood of signing
deep agreements.

WOrld Trade repOrT 2011
124
1. ArelowertariffsstillimportantforPTAs?
TariffshaveprogressivelyfallensincetheestablishmentoftheGeneralAgreementonTariffsandTrade(GATT)in 1948. The pre-GATT average tariff among majortrading countries was between 20 and 30 per cent.1Since then, unilateral liberalization, eight rounds ofmultilateraltradenegotiationsandnumerousPTAshavesignificantly reduced the tariffs applied by WTOmembers.In2009,theaverageappliedtariffacrossallproductsandcountrieswasamere4percent.
The process of most-favoured nation (MFN)liberalization (i.e. the reduction of tariffs on an MFNbasis for all WTO members) accelerated in the late1980sand1990s,whenappliedtariffswerereducedinmany developing countries. The rates applied bydevelopedcountrieswerealready low,ataround6percent on average by the end of the 1980s. Theycontinued to decline subsequently, to an average ofapproximately 3 per cent in 2009. Average appliedtariffshavebeenfallinginallregions(seeFigureD.1).InSouth-CentralAmerica,theaveragetariffratefellfromover30percentatthebeginningofthe1990stolessthan10percenttenyearslater.Overthesameperiod,tariffsinEastAsiadroppedfromaround15-20percenttosome6percentin2009.Similarly,inAfrica,appliedMFNtariffsfellfromanaveragerateofroughly30percent to some 12 per cent in 2009. The reduction of
tariffs was more pronounced in West Asia, where theaverageMFNappliedtariffratefellfromanaverageofabout45percenttobelow15percent.
Tariff reductionshavenotoccurredat thesamepacein all sectors. Significant tariff barriers still exist inagriculture and some manufacturing sectors. MostMFN tariff reductions took place in manufacturedgoods,however,withparticularemphasisonpartsandcomponents (see Figure D.2). The latter trendaccompaniedthedevelopmentofproductionnetworks.
Despitevarianceintariffratesaroundtheaverage,lowaverage MFN rates suggest that the scope forexchangingpreferentialmarketaccessisunlikelytobeextensive. A similar conclusion is suggested by thedataontradeflows.AsseeninSectionB,theshareofMFN duty-free trade in total trade is estimated at52 per cent in 2008 (excluding trade within the EU),andover70percentoftotal tradeoccursatanMFNtariffrateofbelow5percent.
Moreover,PTAscannotbesatisfactorilyexplainedbyadesire to remove tariff peaks (i.e. relatively highertariffs).Most“sensitive”sectorswithhighertariffsalsotend to retain higher tariffs in PTAs. As shown inFigureD.3,forexample,tarifflinessubjecttoanMFNrate above 15 per cent continue to be subject torelatively high rates in PTAs. According to the 2007datareportedinthefigure,approximately66percent
FigureD.1: mFn tariff trends in developing countries by region (Percentage)
Note: Inorder toavoidsampleselectionbias,figureshavebeencalculated forabalancedsub-sampleofcountries ineach regionandmissingdatahavebeeninterpolated.Inthissubsample,EastAsiacomprises13economies(Australia;KingdomofBahrain;China;HongKong,China; Indonesia;Japan;RepublicofKorea;Malaysia;NewZealand;Philippines;Singapore;Thailand;andChineseTaipei);WestAsiacoversfourcountries(Bangladesh;India;SriLanka;andNepal);SouthandCentralAmericaismadeupof12countries(Argentina;thePlurinationalStateofBolivia;Brazil;Chile;Colombia;Cuba;Ecuador;Paraguay;Peru;TrinidadandTobago;Uruguay;andtheBolivarianRepublicofVenezuela);andAfricaincludes11countries(BurkinaFaso;Côted’Ivoire;Algeria;Ghana;Morocco;Nigeria;Rwanda;Tunisia;Tanzania;SouthAfrica;andZimbabwe).Thedatausedinthefigurearesimpleaveragesofad valoremlinesinallsectors.
Source:CalculationsbasedonTrainsdatabase,WITS.
Sim
ple
aver
age
(at t
he p
rodu
ct le
vel)
1990 1995 2000 2005 2010
50
40
30
20
10
0
Africa South and Central America
East Asia West Asia

II – tHe Wto AnD PReFeRentIAL tRADe AGReements
125
D. A
nA
tom
y o
F PR
eFe
Re
ntIA
L
tRA
De
AG
Re
em
en
ts
ofthetariffsabovethisratehavenotbeenreducedatall throughPTAs.Thismeans that “preferential” ratesarenolowerthanMFNrates.
Recent work has emphasized that the value of aparticular preferential tariff must be gauged in thecontextofanimportingcountry'soveralltariffpolicy.2
Thus, in a world of numerous PTAs, the advantageconferred by a preferential tariff to a given exporterdoesnotdependonlyon that rate,butalsoon tariffsfaced by competing suppliers from other countries inthesamemarket.
Inordertoaccountfortheactualadvantageprovidedbypreferences, Low et al. (2009) use the concept of a“competition-adjusted”preferencemargin,calculatedasthepercentage-pointdifferencebetweentheweighted
averagetariff rateapplied to therestof theworldandthepreferential rateappliedtothebeneficiarycountry,where weights are represented by trade shares in thepreference-grantingmarket(seeBoxD.1).
Unlike a traditional preference margin which was thebasis of the analysis in Section B, this competition-adjusted preference margin can assume positive aswell as negative values. A negative value indicatesthat, in a specific market, a certain country facesworse market conditions than its trade competitors.3Competition-adjusted preference margins emphasizethefactthatPTAscanresultfromthedesiretoavoidnegative discrimination rather than to benefit from apositive preference margin. This is the underlyingargument for theso-called “dominoeffect” toexplaintheproliferationofPTAs(seeSectionC).
FigureD.2: World mFn applied tariff trends (Percentage)
Note:Underlyingdataaretrade-weightedaveragesofad valoremrates.
Source:Trainsdatabase,WITS.
FigureD.3: Preferential reductions of tariff rates above 15 per cent, 2007
Note:“PreferentialequalMFN”denotestheshareoftarifflinesattheHS-6levelwithanMFNrateabove15percentthathavenotbeenreducedunderPTAs.“PreferentialbelowMFN”denotestheshareoftarifflinesthathavebeenatleastpartiallyreduced.
Source:CalculationsbasedontheFugazzaandNicita(2010)database,coveringthePTAsof85countries,accountingfor90percentofworldtrade.
MF
N a
pplie
d ta
riff
1988 1990 1992 1994 1996 1998 2000 2002 2004 2006 2008
10
9
8
7
6
5
4
3
2
1
0
Parts and components All products
Preferential below MFN34 per cent
Preferential equal MFN 66 per cent

WOrld Trade repOrT 2011
126
BoxD.1:measurement of the value of preferences
Traditionally, the valueofapreferencemargin forabeneficiarycountryhasbeenmeasuredsimplyas thedifference in terms of percentage points between the MFN rate and the preferential tariff. Or, expressedformally:
Traditionalpreferencemargin= jik
MFNik TT ,,
where MFNikT , istheMFNrateappliedbycountrykonproduct iand j
ikT , isthepreferentialrateappliedto
countryj.Bydefinitionthismargincanonlybepositive.
Alimitationofthismeasureofthevalueofthepreferenceisthatitcannotaddressthequestionwhethertheputative advantage of a preference effectively helps the beneficiary to export to the preference-givingcountry.Sincenumerousandoverlappingpreferentialtradeagreementsexistaroundtheworld,theMFNratedoesnotprovideanappropriatebasisforcalculatingthepreferencemargin.Onthecontrary,thevalueofapreferenceforonecountrywillultimatelydependontheadvantage/disadvantage ithasvis-à-vis theothercountriescompetinginthesamemarket.
The “competition-adjusted” preference margin proposed by Low et al. (2009) addresses this concern bymeasuringthevalueofapreferenceasthepercentage-pointdifferencebetweentheweightedaveragetariffrateappliedtotherestoftheworldandthepreferentialrateappliedtothepreferentialagreementpartner,where weights are represented by trade shares in the preference granting market. The formula for thismeasureisexpressedasfollows:
Competition-adjustedpreferencemarginforproducti= jik
wik TT ,,
where
vivk
v
vikivk
wik X
TXT
,
,,
, is theexport-weighted(X intheformuladenotesexportsofv intok)average
tariff imposedbycountrykonallotherexportingcountriesv (excludingcountry j) in respectofproduct i.Equivalently,theformulacapturesweightedtariffimposedbykonimportsfromallothercountriesbutj.As
before, jikT ,
isthepreferentialrateappliedtocountryj.Thiscompetition-adjustedpreferencemargincanbepositiveornegative,dependingonwhetherexportersofgood i fromcountry jbenefit frommarketaccessconditionsmoreorlessfavourablethantheothertradingpartnersofcountrykinthesamemarket.
In order to measure the overall level of advantage or disadvantage that a beneficiary under a PTA faces inenteringanothermarket in thepreferentialarea,FugazzaandNicita (2010)estimated theoverall value toacountryofpreferencesintermsofthedegreeofresponsivenessofimportdemandtovariationsinprice(priceelasticity of import demand), taking into account the trade share of the country concerned. Under thisspecification of the value of the preference, which the authors call the “relative preference margin” (RPM),preferencemarginsarethusweightedbytherelevantimportdemandelasticityandbytheexportshareofthepreference-receivingcountry.Therationaleforincludingtheseelementsinthepreferencemargincalculationisthat a preference margin is more or less valuable to the exporting country depending on the elasticity ofdemandintheimportingcountryandontheexportcapabilityoftheexportingcountry.Whenimportdemandiselastic,agivenpreferencemargingivesrisetolargerincreasesinimportdemandthanwhentheimportdemandisinelastic.Inaddition,apreferenceismorevaluabletoanexporterthehigherthelevelofexports.
TheformulafortheRPMis:
kj
X
TTXRPM
iikijk
i
jik
wikkiijk
jk
,
,,
,,,
whereεisanestimateofthepriceelasticityofdemandforanimport,andtheothervariablesaredefinedasabove.

II – tHe Wto AnD PReFeRentIAL tRADe AGReements
127
D. A
nA
tom
y o
F PR
eFe
Re
ntIA
L
tRA
De
AG
Re
em
en
ts
TableD.1showsthedistributionofcompetition-adjustedpreference margins at the Harmonized System (HS)6-digit level for the years 2000 and 2007. Thedistribution is highly concentrated, falling within therange of –2 per cent and +2 per cent. In 2007, over87 per cent of trade fell inside this range. Exceptperhaps for highly demand-elastic goods that areparticularlyresponsivetopricechanges,thesenumberssuggestthattodaytariffpreferencesareunlikelytobeasole reason,or insomecasesnotevenamajorone,forcountriesenteringPTAs.
A limitation of using competition-adjusted preferencemargins as a measure of the value of preferences isthattheydonottakeintoaccountthefactthatimportsofsomegoodscanbemoreresponsivethanotherstochanges in price. A reduction of the tariff on a goodwhose demand is inelastic (i.e. not very sensitive topricechanges)willhaveasmallerimpactontheoverallvolume of trade than a reduction of the samemagnitude for demand-elastic goods. Even a lowpreference margin may trigger significant changes inthe volume of trade when the import demand for thegood is elastic. In these circumstances, even lowpreferencemarginsmightleadtotheestablishmentofPTAs. Applying product-specific price elasticities toproducts,FugazzaandNicita(2010)defineanindexofthe overall advantage/disadvantage that exporters incountryA face incountryB (seeBoxD.1).This indexaccords lower weights to competition-adjustedpreference margins that are less sensitive to pricechanges(inelasticgoods)thanthosethataresensitive(elasticgoods).
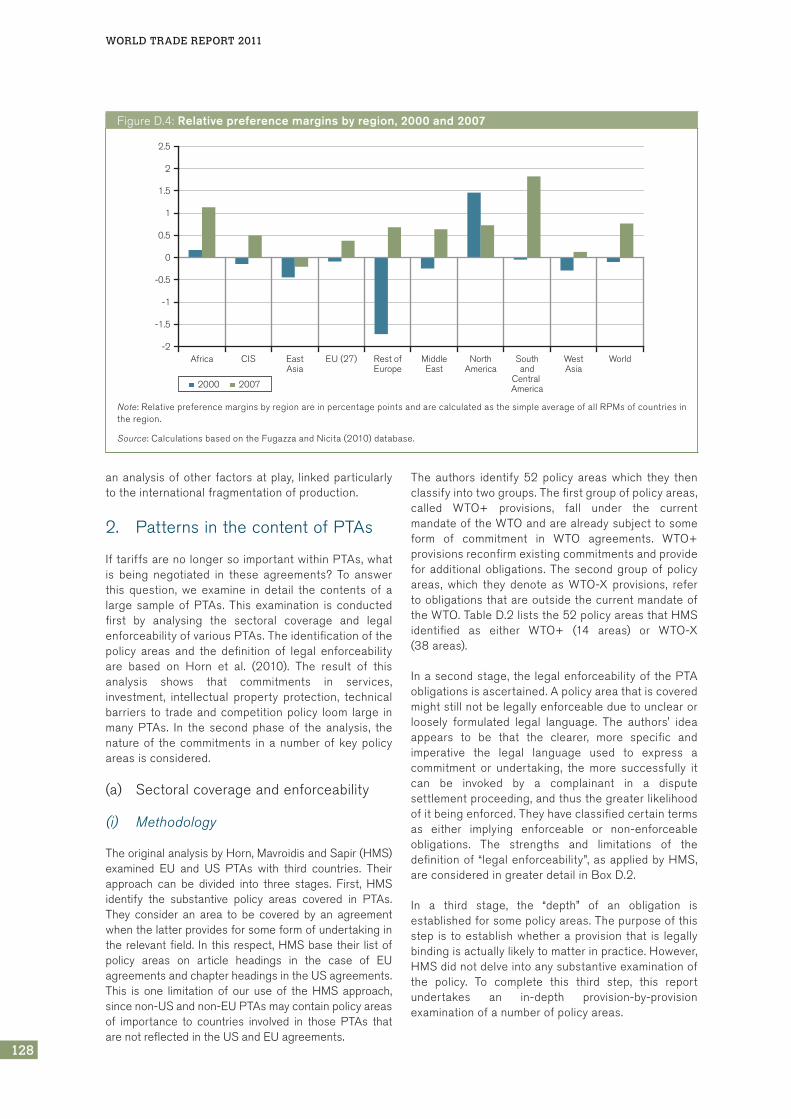
Data based on this relative preference margin (RPM)index was calculated for a sample of 85 countriescovering90percentoftradebetween2000and2008.As shown in Figure D.4, RPMs improved on averageacrossall regionsbetween2000and2007, except inNorthAmerica,wheretheinitialcompetitiveadvantageof the region has been eroded by the proliferation of
PTAs in other areas. In general, PTAs have helpedcountriestooffsetorreducethenegativediscriminationthey suffer vis-à-vis non-PTA trading partners. Forexample, countries in South and Central Americasignificantlyimprovedtheirconditionsofmarketaccessbetween 2000 and 2007, mainly because of thenumerousPTAstheysignedoverthatperiod.
Figure D.4 shows that on average RPMs were below1 per cent in 2007. Africa and South and CentralAmericahadRPMsinexcessofthisaverage.FugazzaandNicita(2010)calculatedthata1percentchangein the RPM would have a trade impact of 0.34 percent.4 This implies that a rise or fall of 2 per cent intrade would require a change in the RPM of at least5percentagepoints.ElSalvadoristheonlycountryinthe sample covered by the Fugazza and Nicitadatabase that satisfies these conditions. This findingreinforces our conclusion that limited scope remainsforthepursuitofpreferencesinPTAs.
In sum, the proliferation of PTAs between 2000 and2007 has improved the conditions of market accessfor signatory countries. To a large extent, theimprovement has been due to the reduction in thenumber of instances where relative preferencemargins were negative (i.e. cases where a countryfaces worse market conditions than its tradecompetitors). One may argue, therefore, that PTAshave in part restored a “level-playing field” for thosecountries that facedworseconditionsofaccess thanothers. Whether or not adjusted for tariffs faced byother suppliers, the overall level of tariffs faced byexporters is low, as is the volume of trade for whichpreference margins are significant.5 Low averagebenefits accruing from preferential tariffs on trademay nevertheless conceal larger effects for someproducts and countries, and this should be borne inmindinthecontextofthebroaderconclusionreachedin this report that preferential tariffs are no longer amajorconsiderationinPTAformation.Wenowturnto
Table D.1: share of tariff lines and trade by level of competition-adjusted preference margin, 2000 and 2007 (Percentage)
Competition-adjusted preference margin
2000 2007
tL covered trade covered tL covered trade covered
<–30 0.2 0.0 0.1 0.0
–30;–15 1.1 0.3 0.5 0.1
–15;–5 7.1 3.4 4.6 2.3
–5;–2 9.3 5.8 6.3 3.5
–2;2 72.4 77.8 79.0 87.3
of which MFN = 0 9.2 18.5 25.3 42.5
2;5 5.7 7.6 5.6 4.5
5;15 3.7 4.1 3.1 2.0
15;30 0.4 0.9 0.6 0.2
>30 0.1 0.1 0.1 0.0
Source:CalculationsbasedontheFugazzaandNicita(2010)database,coveringthePTAsof85countries,accountingfor90percentofworldtrade.
WOrld Trade repOrT 2011
128
ananalysisofother factorsatplay, linkedparticularlytotheinternationalfragmentationofproduction.
2. PatternsinthecontentofPTAs
IftariffsarenolongersoimportantwithinPTAs,whatis being negotiated in these agreements? To answerthis question, we examine in detail the contents of alarge sampleofPTAs. Thisexamination is conductedfirst by analysing the sectoral coverage and legalenforceabilityofvariousPTAs.Theidentificationofthepolicy areas and the definition of legal enforceabilityare based on Horn et al. (2010). The result of thisanalysis shows that commitments in services,investment, intellectual property protection, technicalbarriers to tradeandcompetitionpolicy loom large inmany PTAs. In the second phase of the analysis, thenatureof thecommitments inanumberofkeypolicyareasisconsidered.
(a) Sectoralcoverageandenforceability
(i) Methodology
TheoriginalanalysisbyHorn,MavroidisandSapir(HMS)examined EU and US PTAs with third countries. Theirapproach can be divided into three stages. First, HMSidentify the substantive policy areas covered in PTAs.They consider an area to be covered by an agreementwhenthelatterprovidesforsomeformofundertakingintherelevantfield. In this respect,HMSbasetheir listofpolicy areas on article headings in the case of EUagreementsandchapterheadingsintheUSagreements.This is one limitation of our use of the HMS approach,sincenon-USandnon-EUPTAsmaycontainpolicyareasof importance to countries involved in those PTAs thatarenotreflectedintheUSandEUagreements.
The authors identify 52 policy areas which they thenclassifyintotwogroups.Thefirstgroupofpolicyareas,called WTO+ provisions, fall under the currentmandateoftheWTOandarealreadysubjecttosomeform of commitment in WTO agreements. WTO+provisionsreconfirmexistingcommitmentsandprovideforadditionalobligations.Thesecondgroupofpolicyareas, which they denote as WTO-X provisions, refertoobligationsthatareoutsidethecurrentmandateoftheWTO.TableD.2liststhe52policyareasthatHMSidentified as either WTO+ (14 areas) or WTO-X(38areas).
Inasecondstage, the legalenforceabilityof thePTAobligationsisascertained.Apolicyareathatiscoveredmightstillnotbelegallyenforceableduetounclearorloosely formulated legal language. The authors' ideaappears to be that the clearer, more specific andimperative the legal language used to express acommitment or undertaking, the more successfully itcan be invoked by a complainant in a disputesettlementproceeding,andthusthegreaterlikelihoodofitbeingenforced.Theyhaveclassifiedcertaintermsas either implying enforceable or non-enforceableobligations. The strengths and limitations of thedefinitionof“legalenforceability”,asappliedbyHMS,areconsideredingreaterdetailinBoxD.2.
In a third stage, the “depth” of an obligation isestablishedforsomepolicyareas.Thepurposeofthisstep is toestablishwhetheraprovision that is legallybindingisactuallylikelytomatterinpractice.However,HMSdidnotdelveintoanysubstantiveexaminationofthe policy. To complete this third step, this reportundertakes an in-depth provision-by-provisionexaminationofanumberofpolicyareas.
FigureD.4: Relative preference margins by region, 2000 and 2007
Note:RelativepreferencemarginsbyregionareinpercentagepointsandarecalculatedasthesimpleaverageofallRPMsofcountriesintheregion.
Source:CalculationsbasedontheFugazzaandNicita(2010)database.
Africa CIS EastAsia
EU (27) Rest ofEurope
MiddleEast
NorthAmerica
Southand
Central America
WestAsia
World
2.5
2
1.5
1
0.5
0
-0.5
-1
-1.5
-2
2000 2007

II – tHe Wto AnD PReFeRentIAL tRADe AGReements
129
D. A
nA
tom
y o
F PR
eFe
Re
ntIA
L
tRA
De
AG
Re
em
en
ts
TableD.2: Wto+ and Wto-x policy areas in PtAsWto+ areas Wto-x areas
PTAindustrialgoods Anti-corruption Health
PTAagriculturalgoods Competitionpolicy Humanrights
Customsadministration Environmentallaws Illegalimmigration
Exporttaxes IPR Illicitdrugs
SPSmeasures Investmentmeasures Industrialcooperation
Statetradingenterprises Labourmarketregulation Informationsociety
Technicalbarrierstotrade Movementofcapital Mining
Countervailingmeasures Consumerprotection Moneylaundering
Anti-dumping Dataprotection Nuclearsafety
Stateaid Agriculture Politicaldialogue
Publicprocurement Approximationoflegislation Publicadministration
TRIMSmeasures Audiovisual Regionalcooperation
GATS Civilprotection Researchandtechnology
TRIPS Innovationpolicies SMEs
Culturalcooperation Socialmatters
Economicpolicydialogue Statistics
Educationandtraining Taxation
Energy Terrorism
Financialassistance Visaandasylum
Source:Hornetal.(2010).
BoxD.2:Legal enforceability
For thepurposeofclassifyingprovisions inPTAsas “legallyenforceable”or “non-enforceable”,Hornetal.(2010)focusontwovariablesrelatingtodisputesettlement:(a)theactualterminologyofaprovision,andinparticularwhetheraprovision“specifiesatleastsomeobligationthatisclearlydefinedandlikelyeffectivelytobindtheparties”,asdistinguishedfromvagueundertakingsthatare“notlikelytobesuccessfullyinvokedbyacomplainantinadisputesettlementproceeding”;and(b)whethertheagreement“explicitlystatesthatdisputesettlementisnotavailablefortheprovision”underthePTA.
Although these two variables constitute a solid starting point, there are a number of other variables –includingthoserelatedtodisputesettlement–thatcouldalsohaveabearingonthe“legalenforceability”ofobligationsarisingunderPTAs.TheHMSstudy,however,focusessolelyonthetextofPTAs,andnotontheireffectsorimplementation.
Whetherornottheactualterminologyofaprovisionestablishesalegallyenforceableobligationisaquestionoftreatyinterpretation.Animportantconsiderationisthereforetheapproachtotreatyinterpretationadoptedin the PTA. For example, in the context of WTO dispute settlement proceedings, the Appellate Body hasrepeatedlyemphasizedtheprincipleof“effectiveness”intreatyinterpretation,whichprovidesallofthetermsoftheWTOagreementswitha“legallyoperativemeaning”.TheAppellateBodyhasfoundonmorethanoneoccasionthattheterm“should”,inthesamewayas“shall”,cangiverisetoalegalobligation.
The tradition of treaty interpretation stems from the Vienna Convention on the Law of the Treaties 1969(VCLT).TheVCLTisa legal instrumentcodifiedbytheUNInternationalLawCommission. Itsetsoutrulesrecognizedascustomary international law.Forpresentpurposes, therelevantrulesoftreaty interpretationarelaiddowninArticles31-33oftheConvention.Article31oftheVCLTestablishesfourelementsthathavetobecombinedintheinterpretationofatreaty.Atreatyhastobeinterpreted:i)ingoodfaith;ii)withintheordinarymeaningofitsterms;iii)initsspecificcontext;andiv)inthelightofitsobjectandpurpose.6PTAsarerecognizedastreatiesunderinternationallawandhavetobeinterpretedinaccordancewiththerulesoftheVCLT.7
Thestrongfocusontheuseof legal languageinaPTAisreferredtoasatextualor literal interpretation.8The languageofaprovision reveals its intentionand theextent towhich itdeclares legalobligationsandrights.9The languagealsohelps todefinedemarcationsand thescopeofWTO law indisputesettlement

WOrld Trade repOrT 2011
130
The analysis conducted here extends HMS's originalanalysisof14EUand14USPTAstoatotalof96PTAs.Of these, 33 involve the EU and 11 involve the UnitedStates. The sample covers some recently concludedEPAs by the EU, with Cameroon and CARIFORUM, forexample,aswellasEuromedagreements.The42otherPTAswereconcludedbyregionaltradingblocsandmajortrading powers, such as the Association of SoutheastAsianNations(ASEAN),China,theEuropeanFreeTradeAgreement (EFTA), India and the Southern CommonMarket (MERCOSUR). PTAs from Africa (such asCOMESA and ECOWAS) and the Middle East (such asthe GCC and PAFTA) are also included in the analysis.ThesampleofPTAswaschosenprimarilyonaccountofthevolumeoftradewithinthePTA,butalsoincludedtheinitial set of PTAs examined in the HMS study (seeAppendixTableD.1foradetailedlistofthePTAscovered).
The HMS study only covers PTAs concluded by WTOmembers, signedby thepartiesandmostlynotified totheWTOasofOctober2008.Itconsidersagreementssignedbothbeforeandafter thecreationof theWTO,
butexcludesthosewherepartnersarenotmembersoftheWTO.Threeagreementsthathavebeensignedbutthatarenotyetratifiedwerealsoincludedinthestudy.HMSfurtherrestrictstheselectionofPTAsinitsstudytothoseconcludedunderArticleXXIVoftheGATTorArticleVoftheGeneralAgreementonTradeinServices(GATS).AgreementsnotifiedundertheEnablingClausearenot taken intoaccount.All thePTAsconsidered inthe HMS study are free trade agreements, except forEU-Turkey,whichisacustomsunion.
Thesampleusedinthisreportalsoincludesagreementsin which not all partners are members of the WTO.Somenon-notifiedagreementsarecovered,butallarein force. The sample covers the period from 1958 to2010. PTAs notified under the Enabling Clause areincludedalongwithothersnotifiedunderGATTArticleXXIVandGATSArticleV.Eighty-twooftheagreementscovered are free trade agreements, 12 are customsunions and two are partial scope agreements.14 Fouramong the EC agreements are enlargementagreements.
proceedings.Inthisrespect,treatylanguagealsorevealsthoseareasthathavenotbeennegotiatedwithintheframeworkoftheWTO.10Theprocessofenforcement,however,makesuseofotherapproachesinWTOdisputesettlement.Threeaspectsofthelegalenforceabilityofaprovisionarementionedbelow,inadditiontothetextualapproach.
First, obligations arising under the WTO agreements may have a bearing on the legal enforceability ofobligationsunderPTAs.HMSconsiderprovisionscarvedoutfromdisputesettlementproceedingsasbeingnon-enforceable.TotheextentthataprovisionofaPTAaddressesanareathatisalsodirectlyorindirectlycoveredbyoneormoreobligationsundertheWTOagreements, it remainstobeseenwhetheraPTAcandepriveapartyof its rightofaccess to theWTOdisputesettlement system. Inotherwords, the fact thatdispute settlement may not be available in respect of that provision under the PTA would not necessarilyprecludeapartyfromhavingrecoursetoWTOdisputesettlementproceduresinrespectofthecorrespondingobligation(s) under the WTO agreements. This complex and unsolved legal question leaves open whetherandtowhatextentrulesofconflictleadingtotheenforcementofaprovisionunderaPTAcanoverridetheWTOdisputesettlementsystem.11
Secondly,totheextentthattheconceptoflegalenforceabilityislinkedtothepossibilityofapplyingcounter-measurestogiveforcetoPTAobligations,rightsandobligationsunderWTOagreementslimitingtheuseoftrade counter-measures may also have a bearing on the enforceability of certain PTAprovisions.AnotherrelatedissuereferstotheenforceabilityofWTO-Xprovisions.Towhatextent is itpossibletomakeuseoftradecounter-measurestoenforcethosepolicyareasnotcoveredbytheWTO(Marceau,2009)?Thescopeandlimitationsoftherelevantlawstillneedtobeclarified.12
Thirdly,non-legalconsiderationsareanimportantfactorwhendeterminingtheenforceabilityofobligationsintradeagreements.Thisapproachencompassespoliticalfactorsasrelevantintheprocessoflegaldrafting,thusleadingtotheadoptionoflooselyformulatedlegallanguage.Itdoesnot,however,takeexternalpoliticalfactorsintoconsiderationthatmightbeimportantfortheactualenforcementofaprovisioninpractice.13AsHMS acknowledge, “provisions may be enforced not only through a formal judicial dispute settlementmechanism,butalsothroughmorepoliticalmeans”.Inotherwords,thefactthatparticularobligationsmaybecarved out from dispute settlement procedures does not necessarily mean that parties cannot seek toenforcesuchobligations throughpoliticalordiplomaticmeans.However, the reverse isalso true.The factthatparticularobligationsarenotcarvedoutfromdisputesettlementproceduresdoesnotnecessarilymeanthatlegalenforcementthroughdisputesettlementproceedingsisalwaysarealisticandviableoption.
Thevastmajorityofprovisionsinregionalandbilateraltradeagreementsareneverthesubjectofanydisputesettlementproceedings,evenwherea right to invokeproceedingsexists. Inanutshell,provisions thatarelegallyenforceableintheorymaybedifficulttoenforceinpractice,whetheronaccountofpoliticalfactors,resourceconstraints,orothernon-legalconsiderations.

II – tHe Wto AnD PReFeRentIAL tRADe AGReements
131
D. A
nA
tom
y o
F PR
eFe
Re
ntIA
L
tRA
De
AG
Re
em
en
ts
The majority of the EU's PTAs are concluded withneighbouring countries, whereas those of the UnitedStates tend to be more widely spread geographically.Included in the coverage are ten PTAs concluded byJapan, seven by China, five by Australia, five by theRepublic of Korea and four by India. The sample covers18majortradingblocs.TheanalysisheredepartsslightlyfromtheHMSapproachinthatcertainobligationscoveredmaynotbe thesubjectofadedicatedarticleorchapter.Provisionsintheareasof“visaandasylum”or“informationsociety”,forexample,areoftennotexplicitlymentionedasanarticleorchapterheading,but in thecontextofotherprovisions.Anothernotableexampleisexporttaxeswhere,unlike HMS, this report considers “customs duties onexports”assynonymouswithexporttaxes.Finally,itshouldbe noted that the analysis relates to the version of thetradeagreementasitwassignedornotifiedtotheWTO.Thismeansitwillnotcapturesubsequentchangestoanagreement, such as the addition of new areas ofcooperationorastrengtheningofexistingprovisions.
(ii) Empirical evidence on PTA content by income, policy area and over time
Figure D.5 shows that the average number of WTO+areas coveredbyPTAshasbeen increasingover time.From1958to2010,theproportionoflegallyenforceableprovisionswasveryclosetothetotalnumberofsectorscovered. As described above, WTO+ areas are thosecovered by existing WTO agreements. The patternobserved suggests that deepening commitments intheseareas,i.e.goingbeyondcommitmentsintheWTO,continuetobeamajordrivingforceforrecentPTAs.
Incontrast,thepatternovertimeofWTO-Xprovisionsisless clear (see Figure D.6). It is certainly the case thatPTAscomingintoforcesince2000covermoreWTO-Xareasthanagreementsestablishedearlier,andthatmoreof them are legally enforceable. However, the gap
betweenareascoveredthatarelegallyenforceableandthose that are not is still higher for WTO-X provisionsthanforWTO+provisions.Hornetal.(2010)characterizeWTO-Xprovisionsas largely regulatory innature.Usingthis interpretation, and even accounting for the smallerproportion of these areas that are enforceable, thegrowth in the average number of WTO-X provisions inrecentPTAsisatestimonytothegrowingimportanceofbehindthebordermeasuresinPTAs.
Which specific policy areas figure prominently inpreferentialtradeagreements?FigureD.7presentsthenumber of PTAs in the sample with specific WTO+provisions. As expected, all of the 96 agreementscontainprovisionsrelatingtoindustrialandagriculturaltariffs.However,an increasingly largenumberofPTAsnowgobeyondmerchandisetariffs,includingprovisionson technical barriers to trade, services, intellectualpropertyandtrade-relatedinvestmentmeasures.FigureD.7alsoshows thateven if oneexamineseachof theWTO+ areas individually, there is not much of a gapbetweencoverageandlegalenforceability.
The main policy areas covered by WTO-X provisionsare competition policy, intellectual property rights,investmentandmovementofcapital (seeFigureD.8).These are also the policy areas that are most oftenlegallyenforceableinPTAs.Thenextlargestgroupofpolicy areas with legally enforceable provisions(present in about one-third of the agreements) areenvironmental laws, labour market regulations andmeasures on visa and asylum. The remaining legallyenforceablepolicyareasappearinlessthantenoftheagreements. So while there appears to have been asignificant increase in new policy areas in PTAs, thepicturethatemergesfromFigureD.8ismorenuanced.Only a handful of truly important areas are affected,whereimportanceisjudgedbywhethertheprovisionscanbeenforcedbythepartiestotheagreement.
Figure D.5: Covered and enforceable Wto+ provisions over time
Source:WTOSecretariat.
Figure D.6: Covered and enforceable Wto-x provisions over time
Source:WTOSecretariat.
Num
ber o
f WTO
+ p
rovi
sion
s (a
vera
ge)
1958-79 1980-89 1990-99 2000-10
12
10
8
6
4
2
0
Covered Enforceable
Num
ber o
f WTO
-X p
rovi
sion
s (a
vera
ge)
1958-79 1980-89 1990-99 2000-10
12
10
8
6
4
2
0
Covered Enforceable

WOrld Trade repOrT 2011
132
To investigate possible differences among PTAssigned between categories of countries – that is,developed-developed, developed-developing anddeveloping-developing – the average number ofprovisionsinthesePTAcategoriesarecompared(seeFigureD.9).PTAsbetweendevelopedanddevelopingcountries contain on average a higher number oflegally enforceable WTO+ provisions compared withPTAs between trading partners with similar levels ofincome (i.e. among developed or among developingcountries). How might this be explained? Barriersaffecting goods and services are generally higher in
developing than in developed countries. DevelopedcountriesmightusePTAswithdevelopingcountriestoobtaindeeperlevelsofcommitmentsthanthosemadein the WTO. In exchange, developing countries mightacquirefullerandgreatersecurityofmarketaccesstothelargeeconomiesoftheirPTApartners.
As shown in the second panel of Figure D.9, PTAsbetweendevelopedanddevelopingcountriesalsocovera higher average number of WTO-X provisions thanPTAsbetweentwodevelopedcountriesorbetweentwodevelopingcountries.However,mostoftheseprovisions
FigureD.7: number of agreements covering Wto+ provisions
Source:WTOSecretariat.
FigureD.8: number of agreements covering Wto-x provisions
Source:WTOSecretariat.
Num
ber o
f PTA
s
Indu
stria
l tar
iffs
Agr
icul
tura
l tar
iffs
Cus
tom
s
AD
CV
M
Exp
ort t
ax
TBT
GAT
S
TRIP
S
Sta
te a
id
Pub
lic p
rocu
rem
ent
SP
S
STE
s
TRIM
S
100
90
80
60
40
70
50
30
20
10
0
Sector covered Legally enforceable
Num
ber o
f PTA
s
IPR
Agr
icul
ture
Ene
rgy
Cul
tura
l coo
pera
tion
Info
rmat
ion
soci
ety
Hum
an ri
ghts
Eco
nom
ic p
olic
y di
alog
ue
Mon
ey la
unde
ring
Dat
a pr
otec
tion
Illeg
al im
mig
ratio
n
Taxa
tion
Pub
lic a
dmin
istr
atio
n
Nuc
lear
saf
ety
Civ
il pr
otec
tion
Com
petit
ion
polic
y
Mov
emen
t of c
apita
l
Reg
iona
l coo
pera
tion
Indu
stria
l coo
pera
tion
Fina
ncia
l ass
ista
nce
Env
ironm
enta
l law
s
Edu
catio
n an
d tr
aini
ng
Visa
and
asy
lum
Con
sum
er p
rote
ctio
n
Sta
tistic
s
Inve
stm
ent
Res
earc
h an
d te
chno
logy
Labo
ur m
arke
t reg
ulat
ion
Soc
ial m
atte
rs
SM
EA
ppro
xim
atio
n of
legi
slat
ion
Pol
itica
l dia
logu
e
Illic
it dr
ugs
Ant
i-cor
rupt
ion
Aud
iovi
sual
Min
ing
Hea
lth
Terr
oris
m
Inno
vatio
n po
licie
s
100
90
60
40
50
30
20
10
0
Sector covered Legally enforceable

II – tHe Wto AnD PReFeRentIAL tRADe AGReements
133
D. A
nA
tom
y o
F PR
eFe
Re
ntIA
L
tRA
De
AG
Re
em
en
ts
are not legally enforceable. Agreements betweendevelopedcountriesonaveragehaveahighernumberof enforceable provisions, with PTAs betweendeveloping countries having the smallest number ofenforceable WTO-X provisions. The pattern betweendeveloped and developing countries observed in theportionofFigureD.9dealingwithWTO-Xprovisionsisconsistent with the argument made by HMS thatdeveloped countries are seeking to “export” theirregulatory regimes to developing countries. The factthat most of these WTO-X provisions are not legallyenforceable may suggest limited success in theseefforts, or perhaps that the process of regulatoryconvergenceinalegallybindingsenseisagradualone.
It may at first appear surprising that agreementsbetween developing countries include WTO-X policyareas. However, this pattern becomes moreunderstandablegiventhatmanyofthesePTAstypicallyinvolve upper or middle-income developing countriessuch as Chile, the Republic of Korea and Singapore.They may have the same interest in exporting theirregulatoryregimesasdevelopedcountries.
Overall, this analysis leads to two main conclusions.First, where WTO+ provisions are encountered inPTAs, involving any combination of developed ordeveloping countries, agreements have generallyserved to strengthen rules and commitment levelscompared with the WTO agreements. The fact thatthese are policy areas already covered by the WTOhas made it easier to give legal force to the relevantprovisions.Secondly,inspiteoftheapparentexplosionof new WTO-X issues covered by PTAs, the areasembodying legally enforceable and thereforesubstantive commitments in PTAs are relatively few,and are to be found predominantly in the fields ofinvestment, competition policy, intellectual propertyrights,andthemovementofcapital.
(b) PTAcommitmentsinselectedpolicyareas
(i) Services
Services obligations are usually included incomprehensive PTAs that cover not only trade ingoods, but also, for example, investment, intellectualproperty, e-commerce and competition. Out of 85notifications under Article V of the GATS,15 a littlemore than one-third of the agreements follow astructure that is close to that of the GATS, with asimilarsetofobligations(nationaltreatment,domesticregulation, etc.) that apply to the four modes ofsupply,16 and rely on a GATS-type “positive-listmodality” for the scheduling of liberalizationcommitments.17 A positive-list approach means thattheobligationsstipulatedintheagreementapplyonlyto those services sectors listed in WTO members'schedulesofcommitments (andsubject to limitationsinscribed), while a negative-list approach means thatobligations intheagreementapplyfullytoallsectors,subject only to explicitly listed reservations. In otherwords, inapositive listapproachonlywhat is listediscovered,whereasinanegativelistapproacheverythingiscoveredapartfromwhatislisted.
Almost half of the services PTAs notified follow adifferentstructure,whichisclosertotheapproachusedintheNorthAmericanFreeTradeAgreement(NAFTA)than to that of the GATS.18 Such agreements use anegative-list modality for the scheduling ofcommitments,andservicestradeiscoveredbydifferentsets of obligations. These include a chapter on cross-borderservicestradefocusingonmode1(cross-bordersupply), mode 2 (consumption abroad) and mode 4(movementofnaturalpersons),achapteroninvestmentcovering all sectors, including services, and separatechaptersontelecommunications,financialservicesandthetemporaryentryofbusinesspersons.19
FigureD.9: number of Wto+ and Wto-x provisions
Source:WTOSecretariat.
Num
ber o
f WTO
+ p
rovi
sion
s (a
vera
ge)
Developed Developed-Developing
Developing
15
10
5
0
Covered EnforceableN
umbe
r of W
TO-X
pro
visi
ons
(ave
rage
)
Developed Developed-Developing
Developing
12
10
8
6
4
2
0
WTO+ provisions WTO-X provisions

WOrld Trade repOrT 2011
134
Overtime,anumberofagreementshave innovated interms of their structure, combining elements of boththe original NAFTA and GATS-type models.20 Anumber of services PTAs, whether positive-list ornegative-list, also include some additional sector-specific provisions, contained in annexes to relevantchapters. Examples of these are recognition forprofessional services in various PTAs, provisionsspecifictoexpressdeliveryservicesinUSagreements,and maritime services in the agreement between theEUandtheCaribbeanForum(CARIFORUM).
Aside from innovations in architecture and market-openingmodalities,mostservicesPTAstendtoshareabroadcommonality,amongthemselvesandwiththeGATS,intermsofabasicsetofdisciplinesrelatingtotrade in services. These include national treatment(the principle of giving others the same treatment asone’s own nationals), market access, domesticregulation obligations, exceptions, definitions andscope.Intheareaof“rules”,forwhichnegotiationsareprovided for under the GATS, namely safeguards,subsidies andprocurement, PTAs have tendednot togo further. The same is true for most agreements inregardtodomesticregulationandtransparencyissues.Important exceptions exist here, however, as somecountries have gone beyond GATS provisions. TheseincludeanecessitytestondomesticregulationintheSwitzerland-JapanPTA,oradditionalservices-specificprovisionsontransparencyinUSagreements.21
How much more market access than under the GAts?
Inadditiontoarchitecturalandrules-relateddifferencesin the services provisions in PTAs, a key issue is theextent of market-opening commitments – that is, thelevel of access guaranteed for foreign services andservices suppliers (market access and nationaltreatmentobligations).Studieshavefoundthat,overall,services commitments in PTAs go beyond GATScommitments currently in force.22 Some studies alsoshow that PTA commitments go further than GATSoffers tabled so far in theDohaDevelopmentAgenda(DDA).23GATS+commitmentsinPTAstaketheformofbothnewbindingsorcommitments inservicessectorsuncommitted under the GATS and better bindings insectorsalreadycommittedundertheGATS.
Thevalueofservicescommitments inPTAs is largelybasedonthefactthattheyguaranteeaminimumleveloftreatment–oftenabetteronethanthatguaranteedundertheGATS.Thisisimportantformode3(foreigncommercialpresence),wherethesupplyinvolveslargeinvestments abroad, and for mode 1 (cross-bordersupply),wherethecurrentlackofrestrictionsinvarioussectorsmaynotlastastechnologicaladvancesleadtogreater trade, and competitive pressures, via thatmode.24 It isalso important formode4(movementofnaturalpersons),wheremeasuresaffectingtemporaryentrycanrapidlybereversed.
PTA commitments are not expected to lead to manyoccurrences of “real liberalization” – i.e. removal ofapplied restrictions. At the same time, although suchinformation is not readily discernible from PTAs,evidence suggests that some PTAs have, in certaininstances,directlyledtotheremovalofcertainappliedrestrictions, for example the phasing out of themonopolyintheinsurancesectorinCostaRicaandtheopeningoftheinsurancesectortoforeignbranchesinAustralia,theDominicanRepublicorChile.25
FigureD.1026highlightsdifferencesbetweenservicescommitmentsintheWTOandinPTAsbyfocusingontheproportionofservicessubsectorsthataresubjecttomarketaccess/nationaltreatmentcommitments.OnthebasisofdataforalargenumberofPTAs,thefigureshows that members involved in PTAs have, onaverage, undertaken commitments on a greaterproportion of services subsectors than they have intheGATS, or even than theyhave so far proposed intheir current GATS offers in the Doha DevelopmentAgenda(DDA).Thistrendisclearinbothmodes1and3,representingmorethan80percentofthevalueofworld trade in services. Levels of sectoral coverageachieved in PTAs are, on average, similar fordeveloping and developed countries included in thesample. The contrast with the GATS, however, isgreaterfordevelopingcountries,whosecommitmentstend to apply to a more limited set of servicessubsectorsatthemultilaterallevel.
Figure D.11 presents a more complete picture ofGATS+ commitments in PTAs by showing theproportion of subsectors where commitmentsundertaken by WTO members in PTAs go beyond
Figure D.10: sector coverage in PtAs in comparison with GAts commitments and DDA offers (Percentage)
Note:SeeAppendixTableD.3forthelistofPTAscovered.
Source: Updated from Roy et al. (2008) on the basis of anexpandeddataset.
Ave
rage
% o
f sub
sect
ors
com
mitt
ed
for m
embe
rs re
view
ed
Mode 1 Mode 3
100
80
60
40
90
70
50
30
20
10
0
GATS With GATS offer With PTA

II – tHe Wto AnD PReFeRentIAL tRADe AGReements
135
D. A
nA
tom
y o
F PR
eFe
Re
ntIA
L
tRA
De
AG
Re
em
en
ts
Figure D.11: Proportion of services subsectors subject to new or improved commitments in PtAs, compared to GAts (by member) (Percentage)
Note:GATSstandshereforGATScommitmentsandDDAoffers.Blue:subsectorscommittedunderGATS;red:subsectorscommittedunderGATSbutboundat abetter levelof treatmentunderPTAs;green: subsectorscommittedunderPTAs thatwereuncommittedunderGATS.Covers each member’s “best” PTA commitment across all the PTAs it is party to. Covers modes 1 and 3. See Box A.1. The legend of theacronymsforthemembersisprovidedinAppendixTableD.2.
Source:UpdatedfromRoyetal.(2007),onthebasisofexpandeddataset.
0 2010 30 40 50 60 70 80 90 100
Subsectors committed under GATS that are not further improved
Subsectors committed under GATS that are further improved in PTAs
Subsectors that are newlycommitted in PTAs
ARG
ATG
AUS
BHR
BLZ
BRA
BRB
BRN
CAN
CHE
CHL
CHN
COL
CRI
DMA
DOM
EC
GRD
GTM
GUY
HND
IDN
IND
ISL
JAM
JOR
JPN
KNA
KOR
LCA
LIE
MAR
MEX
MYS
NIC
NOR
NZL
OMN
PAK
PAN
PER
PHL
PRY
SGP
SLV
SUR
CHT
THA
TTO
URY
USA
VCT
VNM
WOrld Trade repOrT 2011
136
those inGATSschedulesofcommitmentsandoffers.This captures not only those instances where PTAsinclude new bindings in subsectors that wereuncommitted in theGATS,butalsobindingsatbetterlevelsofaccessinPTAsforthosesubsectorsalreadysubject to commitments under the GATS and DDAoffers.TheunderlyingPTAinformationrepresentsthePTA inwhich thememberconcernedhasundertakenthe highest level of binding – it is not an average ofbindingsinallPTAswithservicescommitments.Thesedata underscore the magnitude of GATS+commitments in PTAs, both among developing anddevelopedmembers.
The overall trend of significant GATS+ commitmentsobservedinmanyPTAsalsoembodieslargevariationsamong parties. Some exhibit spectacularimprovementsoverwhatiscommittedorofferedunderthe WTO, particularly in the case of a number ofdevelopingcountriesinLatinAmerica.Others,suchasASEAN countries (other than Singapore), showrelatively more limited GATS+ commitments in PTAs.Moreover,alargenumberofthosemembersthathavemade more significant GATS+ commitments havesubmitted relatively limited offers in the servicesnegotiationsintheDDA.
Thelevelofservicescommitmentsofindividualpartiesto PTAs also varies significantly among agreements.Singapore's services commitments, for example, varynotably in its agreements with the United States,Japan, and other ASEAN countries. Importantvariations can also be observed in the PTAcommitments of Australia, Chile and the Republic ofKorea.CommitmentsbytheUnitedStates,incontrast,do not vary significantly among PTAs, except for itsagreementwithJordan,whichwasbasedontheGATS(seeAppendixFigureD.1).
No simple or single reason explains why PTAcommitmentsaredifferentamong thePTAssignedbyvarious countries, or why PTA commitments aregenerally more far-reaching than those offered in theGATS. It has been argued that factors such asreciprocity (within services, but also among otherissues) as well as the respective economic size andimportanceofthepartiesinvolvedhaveplayedarole.27For example, the United States always obtains bettercommitmentsoverallonmodes1and3fromitstradingpartners than the commitments these countriesundertake in PTAs with other countries. In AppendixFigureD.1,thisisapparentinthePTAcommitmentsofChile,theRepublicofKorea,AustraliaandSingapore.
The type of liberalization modalities used in the PTA isalso a factor, as agreements using negative list28modalitieshave tended,onaverage, to result ingreatercommitmentsthanpositivelistones.Thismay,ofcourse,beduetothefactthatgovernmentswhicharereadytoassume more commitments are more comfortable withthenegativelistapproach.29Althoughnotinvestigatedin
the context of services PTAs, the nature of politicalregimes may also play a role in influencing levels ofGATS+ commitments that governments are ready toundertakeinapreferentialcontext.30
Figure D.12 shows GATS and PTA commitments bysectorformodes1and3.Overall,servicescommitmentsat the sectoral level in PTAs are more numerous thanthose inGATSsectors.Sectors thathaveprovedmoredifficult at the multilateral level (e.g. audiovisual,education)havealsoattractedlessGATS+commitmentsthan sectors such as telecommunications or financialservices. However, PTA commitments for the formerhavestillgonesignificantlybeyondGATScommitments.QualitativeanalysisofPTAcommitmentsinanumberofsectors also highlights this point.31 Nevertheless, themore sensitive sectors for larger trading partners havebeen subject to little or no improvement in PTAs(e.g. maritime transport for the United States oraudiovisualservicesfortheEuropeanUnion).
As for differences according to the level ofdevelopmentamongparties,theGATS+commitmentsof developed economies tend to be more limitedoverall in PTAs in view of the higher levels of GATScommitments in these countries. For developedcountries,GATS+commitments largely take the formofbetterlevelsofbindingsforsectorsalreadycoveredunder the GATS. The GATS+ commitments ofdeveloping countries are spread across all sectors,withparticularlysignificantadvancesinsuchareasasbusiness, environmental services, distribution,education and postal-courier services. Overall, PTAshavenarrowedthegapincommitmentlevelsbetweendevelopedanddevelopingcountries.
GATS+ commitments are more significant in cross-border supply (mode 1) and commercial presence(mode 3) than they are in respect of the temporarymovement of natural persons (mode 4). Mode 4commitments are essentially defined in a cross-sectoral manner in both the GATS and PTAs. PTAshave on the whole made notable improvements overtheGATS,althoughtoalesserextentinsuchimportantcategories of natural persons as “independentprofessionals”and“contractualservicesuppliers”.32
ThescaleofGATS+commitmentsvariessignificantlyfromonemembertoanother.AccordingtoStephensonandDelourme(2010),Australia,Canada,theEuropeanUnion and Japan have undertaken some significantGATS+commitments in some recentPTAs.33On theother hand, most United States PTAs on services,includingallthosenotifiedtotheWTOafter2003,donotgobeyondGATSonmode4.ThesameistrueforanumberofPTAcommitmentsbydevelopingcountries.However,thebroadersectoralcoverageofmostPTAsmeans that, at a minimum, GATS-type mode 4commitments are extended to many previouslyuncommittedsectors.34

II – tHe Wto AnD PReFeRentIAL tRADe AGReements
137
D. A
nA
tom
y o
F PR
eFe
Re
ntIA
L
tRA
De
AG
Re
em
en
ts
Bilateral investment treaties (BITs) also cover issuesrelevant tomode3.AlthoughthemajorityofBITsarelimited to post-establishment investor rights, somealso includecommitmentson investments in servicessectors with respect to the establishment phase.35ThisisparticularlythecasewithBITsconcludedbytheUnitedStates.
Finally,PTAsaresometimesGATS-minus, inthattheycontaincommitmentsthatprovideforlessthanwhatisbound under the GATS, either by excluding sectors(e.g. financial services in certain PTAs) or by listinglimitationsnotforeseeninGATScommitments.36
(ii) Investment
Thetradeand investment literature–see, forexample,Helpman (1984); Markusen (1984); Brainard (1993);Brainard (1997) and Markusen (1998) – allows us toinfer what provisions in trade agreements, and ininvestment chapters in particular, will be needed tofacilitateinternationalproductionnetworks.Akeyinsightof this literature is that what gives the multinationalenterprise itscompetitiveedge in internationalmarketsisitsfirm-specificassets–humancapital(managementor technical experts) and intellectual property, such aspatentsorblueprints.HenceprovisionsinPTAsthatgive
ample protection to these assets will encourage moreFDI flows and production sharing. Examples of suchprovisions are protection against expropriation or acommitment to compensate investors in the case ofexpropriation.
Allowingfreermovementofcorporatepersonnelwouldbe another critical ingredient in PTAs motivated byproductionsharing.Anotherprovisionthatmayimproveinvestor confidence is having the right to invoke thePTA'sdisputesettlementmechanism.Finally,reducingbarriers to investmentwill allowmoreenterprises theopportunity to establish a production facility in aforeignlocation.
What are investment provisions in PtAs commonly about?
SeveralstudieshaveanalysedinvestmentprovisionsinPTAs–see,forexample,Deeetal.(2006);Dee(2008);Houdeetal. (2007);Kotschwar (2009)andBergeretal.(2010).Forthepurposeofthisreport,theKotschwarstudywillbeused.Itisbasedonanexaminationoftheinvestment chapters or provisions in 52 PTAs. Thesample of PTAs includes 22 free trade agreementsamongcountriesoftheAmericas.Twoagreementsarefrom the 1980s, 13 from the 1990s, and 33 from
FigureD.12: GAts+ commitments in PtAs by sector, modes 1 and 3 (Percentage)
Note:GATSstandshereforGATScommitmentsandDDAoffers.Doneonthebasisofeachmember’s“best”PTAcommitmentacrossallthePTAsitispartyto.
Source:UpdatedfromRoyetal.(2007),onthebasisofexpandeddataset.
Members with commitments under GATS, without improvement in PTAs
Members improving upon GATS commitments in PTAs
Members committing for first time through PTAs
100
70
50
20
90
80
60
40
30
10
70
50
20
90
80
60
40
30
10
0
Tele
com
Tour
ism
Pos
tal-c
ourie
r
Pro
fess
iona
l
Insu
ranc
e
Mar
itim
e tr
ansp
ort
Env
ironm
enta
l
Hea
lth a
nd s
ocia
l
Dis
trib
utio
n
Edu
catio
n
Com
pute
r
Con
stru
ctio
n
Aud
iovi
sual
Ban
king
and
fina
ncia
l
Tele
com
Tour
ism
Pos
tal-c
ourie
r
Pro
fess
iona
l
Insu
ranc
e
Mar
itim
e tr
ansp
ort
Env
ironm
enta
l
Hea
lth a
nd s
ocia
l
Dis
trib
utio
n
Edu
catio
n
Com
pute
r
Con
stru
ctio
n
Aud
iovi
sual
Ban
king
and
fina
ncia
l
100
0
Mode 1 Mode 3

WOrld Trade repOrT 2011
138
2000 onwards. Seventeen agreements in the samplepaircountriesof theAmericaswithothersoutside theregion, including eight with Asian countries, six withcountries in the Middle East and three with Europeanpartners. Eight agreements are between Asiancountries, twoagreements amongEuropeancountriesor groups (European transition agreements), and oneeach involving Europe-Africa, Europe-Asia, Europe-Middle East and Africa-Africa. More than 30 specificfeatures of the investment chapters in theseagreementswereexaminedinKotschwar's2009study.
OnepotentialshortcomingoftheapproachtakenheretoexamineinvestmentprovisionsinPTAsisthattheseagreements are not the sole avenue for makinginternational commitments in investments. Over thepast20years,therehasbeenanexplosionofbilateralinvestment treaties (BITs). The United NationsConference on Trade and Development (UNCTAD)estimates that the total number of BITs increasedmorethansix-foldduringthe1990s,withtheirnumberrisingfrom385in1989tosome2,750bytheendof2009.37 One reason why investment and trade havebeen regulated by distinct treaties is becauseinvestmentandtradedisciplinesfocusedon“differentbut complementary objectives” (DiMascio andPauwelyn,2008).Tradeagreementsseekto increasetradingopportunitiesandinvestmentagreementsseektoprotectandpromoteforeigninvestment.
Even though PTAs increasingly include investmentrules, theirnumbersarestilldwarfedby theBITs.Forinstance, UNCTAD's BITs database reports that 82BITsweresignedin2009,whichexceedsthenumberof PTAs containing investment provisions notified tothe WTO that year.38 BITs have clearly been animportantvehicleforguaranteeinginvestorprotection(Adlung and Molinuevo, 2008). Baldwin (2010)considers the explosion of BITs in the 1990s as animportant means by which emerging markets wereable to attract offshored manufacturing jobs andfactories. Thus, it could be argued that BITs andinvestmentchapters inPTAsplay largelysimilar rolesinthespreadofinternationalproductionnetworks.
Kotschwar'sstudyidentifiesanumberofkeyelementsin the investment provisions of PTAs, includingcoverage, non-discrimination, standards of treatment,investor protection, temporary movement andnationalityofseniorpersonnel,anddisputesettlement.Eachoftheseisconsideredbrieflybelow.
Coverage
Thecoverageoftheinvestmentchapterdependsonhowinvestmentisdefinedandwhatdisciplinesarecontainedin the chapter. Investment may be defined in either abroad,asset-basedway(includingbothFDIandportfolioinvestment)ormorenarrowlyusinganenterprise-basedapproach(comprisingtheestablishmentoracquisitionofa business enterprise). Investment disciplines may be
dividedbetweentheinvestmentandserviceschaptersofanagreement.Asaconsequence, interactionsbetweenthemaremoreprevalent,andaregovernedeitherintheinvestmentortheserviceschapter(Houdeetal.,2007).Alternatively, investmentdisciplinesarecontainedintheinvestment chapter and there is limited interaction withtheserviceschapter.39
Principle of non-discrimination
A key mechanism for opening up investmentopportunitiesinaPTAistheapplicationoftheprincipleofnon-discriminationtoforeigninvestors.Theextentofopening depends upon how broadly investment isdefined in the agreement (i.e. the range of assets towhichnon-discriminationapplies),whethertheprincipleis applied to the entire lifetime of the investment (pre-andpost-establishment),andthenumberofreservations.There are two broad approaches for determiningreservations:thenegativelistandpositivelistapproach,asexplainedearlier.Ingeneral,anegativelistapproachislikelytoyieldgreaterinvestmentopportunities.
Standard of treatment
Beyondnon-discrimination,investmentprovisionsalsospecify other standards of treatment of foreigninvestors. These include such standards as fair andequitable treatment under international law, andfreedomintransferringpaymentsabroad.
Investor protection
Most investment chapters contain provisionsstipulating that investors are protected or will becompensated in the event that the host countrynationalizesorexpropriatesaninvestment.
Senior management and personnel
MostPTAsprovideforthetemporaryentryofmanagersand key personnel of a foreign investor. Someagreements allow hiring of top managerial personnelregardless of nationality, while other agreements holdthattheforeigninvestormaynotstipulatethenationalityofamajorityoftheboardofdirectors.
Dispute settlement
Whilemanyinvestmentchapters inPTAsnowcontainprovisionsondisputesettlement,disputesarehandledin a variety of ways. Some PTAs provide for thesettlement of disputes through coordination andnegotiation;otherscontainprovisiononlyforstate-to-state settlement of disputes. However, some PTAs,such as NAFTA, now allow investor-state disputesettlement. An investor that is a national of a PTAmembermaysubmittointernationalarbitrationaclaimthat a PTA member (state) has breached obligationsundertheinvestmentprovisionsofthePTA.

II – tHe Wto AnD PReFeRentIAL tRADe AGReements
139
D. A
nA
tom
y o
F PR
eFe
Re
ntIA
L
tRA
De
AG
Re
em
en
ts
Kotschwar'ssampleofPTAsisusedtoprovideamoredetailedanalysisof thoseelementsof theagreementsthatmightbeseenasessentialforproductionnetworks.FigureD.13showsthatalargeproportionofthesampleofthePTAs(between60and70percent)haveadopteda negative list approach to investment commitments.MFN and national treatment have also been widelyguaranteedtoforeigninvestorswhowishtoestablishapresence, or acquire or resell holdings. Investorprotectionguaranteesarewrittenintomostagreements,andprivateinvestorsarefrequentlygrantedtherighttodisputesettlement.Ingeneral,theinvestmentprovisionsin these PTAs appear to be rather open, although noattemptwasmade in theKotschwarstudy to testhowmuch these provisions actually affected FDI flows.Some econometric evidence is available, however,showing that FDI flows respond to provisions in theinvestment chapters of PTAs. See Dee et al. (2006),Dee(2008)andBergeretal.(2010).
Patterns over time
TheagreementsinKotschwar'ssamplespanfromtheearly 1980s to around 2009. Using the total numberofprovisionsintheinvestmentchapterasanindicatorof investment openness, later agreements appear tobe more open than earlier ones (see Figure D.14).40This trend is the same even if a narrower set ofprovisionsintheinvestmentchapterareused,suchasonlythoselimitedtoMFNandnationaltreatment.
Are there families of investment provisions?
KotschwarfindsthatPTAsaregroupedroughlyaroundtwo hubs: a NAFTA-type hub, which includesagreements among countries in the Americas andincreasingly in the Asia-Pacific region, and theEuropean-stylehub.ShecharacterizesallthePTAsin
FigureD.14: total number of provisions in investment chapter over time
Source:CalculatedfromKotschwar(2009).
1982
Tota
l num
ber o
f pro
visi
ons
1987 1993 1998 2004 2009
18
14
10
4
16
12
8
6
2
0
FigureD.13: Proportion of PtAs with selected provisions in investment chapter (Percentage)
Source:CalculatedfromKotschwar(2009).
Negative listapproach
Establishment Acquisition Post-establishment
MFN and national treatment
Resale Investor protection
Investor accessto disputesettlementmechanism
80
60
40
20
0

WOrld Trade repOrT 2011
140
the sample involving the three NAFTA members(Canada, Mexico and the United States) with theirrespectivepartnersintheAmericasas“encompassing”,since they apply the four modalities that determineinvestment conditions: establishment, acquisition,post-establishment operations and resale. They alsocover such disciplines as MFN treatment, nationaltreatment, anddispute settlement.Eightyper centormore also cover transparency, protection againstdenialofbenefitsandrestrictionoftransfers,minimumlimitations on the nationality of management and theboardof directors, noperformance requirements andguaranteesagainstexpropriation.
The United States leads the way in designingparticularly comprehensive PTAs. In Asia, Kotschwarfinds that Singapore and Australia’s agreements aremorecomprehensive,butotheragreementshavescantcoverage. In interregional agreements, she finds thatthe coverage is somewhat lower due to the limitedcoverageofdisciplinesintheEU-MexicoandEU-Chileagreements,aswellas in theChile-ChinaFreeTradeAgreement (FTA), the P-4 Agreement (Australia,BruneiDarussalam,ChileandSingapore),andtheUS-JordanFTA.
Kotschwarobservesthattheagreementssignedamongdeveloped economies tend to go beyond provisions atthe multilateral level. This is most obvious where theyinclude separate investment chapters that go beyondservices,coverallinvestmentphases,employanegativelist approach, and have little or no limitations on thenationality of board members and management. Ageographic divide exists with respect to limitations onperformance requirements. United States agreements(except for US-Israel) restrict performancerequirements. Singapore agreements (except for US-SingaporeandJapan-Singapore)donot.
A similar division is seen in terms of transparencyrequirements.AgreementsintheAmericastendtoaddprior comment and publication obligations to theGATS, and establish national enquiry points. Asianagreements, by and large, do not. Australianagreements (with the United States and withSingapore) incorporateGATS-styledenialofbenefits.Amongagreements that includeAsianmembers,onlya handful adopt tougher-than-GATS treatment. All ofthesearewithcountriesintheAmericas(Chile-Korea,Mexico-Japan, US-Korea and US-Singapore).Agreements with Australia or Israel do not containinvestor-state dispute settlement mechanisms exceptfortheSingapore-Australiaagreement–allSingaporeagreementsincorporatethiselement.
Asforagreementsbetweendevelopedanddevelopingcountries,thoseintheAmericasallcontainaseparateinvestment chapter or incorporate a BIT. EUagreements with developing countries generally donot. PTAs among developing countries varyconsiderably in content and approach. Agreements
signed by Chile and Mexico with other developingcountries look much more like the agreementsinvolving developed countries than those signedamong other developing countries, such asMERCOSUR. These latter agreements tend to openmarketsmoregradually.
(iii) Technical barriers to trade
In a world where tariff barriers have progressivelyfallen,non-tariffbarriers to tradehaveacquiredmoresignificance. As noted above, many PTAs includenorms on technical barriers to trade (TBT) and agrowingnumberincludeTBTprovisions.
Data reported here on TBT provisions in PTAs aretakenfromastudybyPiermartiniandBudetta(2009)of 70 PTAs that differ in terms of geographicalcharacteristics,levelofdevelopmentandtheextentofintra-regional trade. Fifty-eight of the 70 PTAssurveyedcontainedTBTprovisions.Thestudyemploysa template that maps TBT provisions in terms of theintegration approach chosen for standards, technicalregulations and conformity assessment procedures(i.e. harmonization or mutual recognition),improvements in transparency, institutions ormechanisms to administer the agreement and solvedisputes, and the possibility of cooperation amongregionalpartnersonstandards-related issuesbeyondtrade objectives and technical assistance. Since thisdatabase primarily41 relies on the legal texts of theagreements, it does not allow an assessment of theactualextentofimplementationoftheprovisions.
What are tBt provisions in PtAs commonly about?
The most common provisions in PTAs (occurring inover 50 per cent of the 58 PTAs included in thePiermartini and Budetta study that contain TBTprovisions) are mutual recognition of conformityassessment, harmonization of technical regulations,transparencyprovisions, andprovisions that establishinstitutionalmachinerysuchasacommittee,abodyora network for standard-related matters (seeFigure D.15). Harmonized standards, harmonizedconformity assessment procedures and disputesettlementprovisionswerefoundinmorethan40percentoftheagreementscontainedinthesampleof58PTAs. Provisions dealing with the mutual recognitionof regulations and standards, common policies,technical assistance and metrology occurred in lessthan30to40percentoftheagreements.
Mutual recognition means that countries agree torecognize each other's regulations, standards orconformity assessmentproceduresasequivalent, thusfacilitating the unimpeded flow of goods into partnermarkets. Like mutual recognition, harmonization ofregulationsandstandardsisasteptowardsmoreopentrade. Both mutual recognition and harmonization

II – tHe Wto AnD PReFeRentIAL tRADe AGReements
141
D. A
nA
tom
y o
F PR
eFe
Re
ntIA
L
tRA
De
AG
Re
em
en
ts
promote transparency and trade opening by reducingthecoststoexportersofmonitoringdestinationcountrypolicy changes. These arrangements also provideexporters with easier access to information about thepreferencesofconsumersinpartnercountries.42
The advantage of harmonization relative to mutualrecognition in termsof itseffectsontrade is thatwithharmonizationproductsproducedindifferentcountriesare more similar (more homogeneous) and thereforebetter substitutes from the point of view of producersand consumers. This, in turn, may facilitate trade byimproving consumer confidence about the quality ofimported goods. In enhancing compatibility betweenimported and domestically produced goods,harmonizationmakes iteasier forconsumers tomatchproducts.Itisalsolikelytoincreasecompetition,reduceprices and increase trade. However, harmonizationinvolves more arduous negotiations and carries higherregulatorycoststhanmutualrecognition.
Finally, strengthening cooperation on the institutionalset-up for the standards regime is a step towardsfurther trade opening because it is likely to promotetheeffective implementationofmeasures. Ingeneral,the gap between law and practice will depend oninstitutionsandadministrativeprocedures.
Who integrates tBt provisions the most?
Agreementssignedbetweencountriessimilarintermsof levels of development, technology, environmentalrequirementsandpreferencesare likely tobedeeperin termsofTBT integrationthanthosebetweenmoredissimilarcountries.Thisisbecausecountriesthatare
alike tend to share similar policy objectives andtherefore similar types of standards. In addition,countries at a higher level of development are morelikely to trust one another's conformity assessmentsand standards than countries at a lower level ofdevelopment.
In order to understand the overall level of TBTintegration, PTAs have been ranked on the basis ofprovisions that go beyond WTO commitments(i.e.WTO+integration).FigureD.16showstheaverage
FigureD.15: Percentage of PtAs by tBt provision
Note:Percentagesarerelativetothe58PTAsinthesamplecontainingTBTprovisions.MRdenotesmutualrecognitionandHarm.meansharmonization.
Source:Authors’calculationsonPiermartiniandBudetta(2009)database.
MR
sta
ndar
ds
MR
tech
nica
lre
gula
tions
MR
con
form
ityas
sess
men
t
Har
m. s
tand
ards
Har
m. t
echn
ical
regu
latio
ns
Har
m. c
onfo
rmity
asse
ssm
ent
Tran
spar
ency
Adm
inis
trat
ive
bodi
es
Dis
pute
set
tlem
ent
mec
hani
sms
Com
mon
pol
icy
Tech
nica
l ass
ista
nce
Met
rolo
gy
80
50
30
70
40
20
10
0
FigureD.16: Average degree of tBt integration by level of development
Note:The“North”consistsoftheEU,EFTAcountries,Australia,New Zealand, the United States, Canada and Japan.AgreementswithnoTBTprovisionsareincluded.
Source:Authors’calculationsbasedonPiermartiniandBudetta(2009)database.
16
12
8
14
10
6
4
2
0South-South
Num
ber o
f WTO
+ T
BT
prov
isio
ns (a
vera
ge)
North-North North-South

WOrld Trade repOrT 2011
142
levelofWTO+integrationachievedbyPTAsclassifiedaccordingtothelevelofdevelopmentandsimilarityoftheirmembercountries.InlinewiththepredictionthatadeeperlevelofintegrationislikelytobeachievedinPTAs among countries with a similar level ofdevelopment and higher incomes, agreementsbetween developed countries (the North) display thehighest degree of TBT integration on average. PTAsbetweendevelopingcountries(theSouth)scoremorehighly than agreements between a developed and adeveloping country, confirming the proposition thatintegrationismorelikelyamongsimilarcountries.
Are there families of PtAs in the context of tBt integration?
TableD.3showspatternsofTBTintegrationbyregion.The most common provisions (defined as those thatoccurredinover60percentofthecases)areshadedin green, the least common (those occurring in lessthan40percentofcases)areshadedinblue,andtherest(occurringbetween40and60percentofcases)are shaded in red. While mutual recognition ofconformity assessment is common across the board,significant differences are discernible in relation toothermeasuresadoptedinPTAs.
AmajordifferenceexistsbetweenEU-typeandNorthAmerican-type agreements in terms of the choicebetween harmonization and mutual recognition as avehicle for TBT integration. PTAs involving the EUtypically prefer harmonization, while North Americanagreements tend to prefer mutual recognition. Inaddition, TBT provisions in PTAs in North America,EastAsiaandSouth-CentralAmericamainlyfocusonintroducingtransparencyrequirementsanddevelopinginstitutionalbodies,whileEUandAfricanagreementsbarelyconsidertheseissues.
PTAs that harmonize standards are likely to featurehub-and-spoke characteristics, with a larger partnerrepresenting the hub to whose standards the spokeswill conform. This tendency can result in standardsbecoming a barrier to trade and integration amongmajorregionalgroupings.43
(iv) Competition policy
Thepresenceofmonopolies, cartelsandother formsofprivateanti-competitivepracticescan frustrate thebenefits of trade, investment and services reform.These market features prevent multinationalenterprises from taking full advantage of differencesin costs among countries through fragmentingproduction. The adoption of competition policy is inmany ways a natural complement to the reduction oftrade, investment and services barriers. While thelatter reduce or eliminate policy-created distortions,competition policy dilutes or prevents the abuse ofmarket power. As noted by many commentators, thestillborn 1948 Havana Charter of the InternationalTrade Organization included provisions on restrictivebusiness practices, testifying to the recognition bynegotiators of the link between trade opening andcompetitionlaw.
Thefollowinganalysisofcompetitionrules inPTAs isbasedonrecentresearchbySilva(2004);Brusiketal.(2005); Anderson and Evenett (2006); Solano andSennekamp (2006); Teh (2009) and Dawar andHolmes (2010). Many studies of competition rules inPTAs have focused only on the competition policychapters of agreements. However, as Anderson andEvenett (2006)haveemphasized,competition-relatedprovisionsalsoappearinotherprovisions.Intheirview,thesesector-specificcompetitionprovisionsmayhavestrongerpro-competitiveeffectsthanthecompetition
TableD.3: Patterns of tBt integration across regions (percentage of PtAs by provision and region)
Provisions eunorth
Americaeast Asia
south Central America
Africa
MRstandards 13 7 8 6 0
MRtechnicalregulations 13 40 31 41 0
MRconformityassessment 67 73 69 76 70
Harm.standards 80 20 31 47 60
Harm.technicalregulations 73 27 54 59 50
Harm.conformityassessment 80 20 31 47 60
Transparencyrequirements 20 67 62 65 20
Administrativebody 20 67 62 76 40
Disputesettlementbody 20 33 46 47 20
Commonpolicy 7 0 15 6 20
Technicalassistance 40 40 23 65 40
Metrology 47 13 8 47 60
Note:MRreferstomutualrecognitionandHarm.toharmonization.
Source:CalculationsonPiermartiniandBudetta(2009)database.

II – tHe Wto AnD PReFeRentIAL tRADe AGReements
143
D. A
nA
tom
y o
F PR
eFe
Re
ntIA
L
tRA
De
AG
Re
em
en
ts
policy chapter itself, assuming that the tradeagreement even has one. The authors also drawattentiontowhattheyrefertoas“horizontalprinciples”relating to thenon-discrimination,procedural fairnessandtransparencyprovisionsintheagreements.
Transparency requires the publication of lawspromoting fair competition and addressing anti-competitive practices. Procedural fairness requiresthat administrative proceedings are consistent,impartial and reasonable and that it is possible torevieworappealanydecisionstakeninadministrativeproceedings.AndersonandEvenett(2006)arguethatthese horizontal principles have a bearing oncompetitionlawandpolicy.
Confirming the hypothesis of Anderson and Evenett,the study by Teh (2009) documents how a largenumberofPTAsincludecompetitiondisciplinesinthechapters on investment, services (intelecommunications, maritime transport and financialservices), government procurement and intellectualproperty.Basedonhissampleof74PTAs,FigureD.17shows the proportion of PTAs which containcompetition-relatedelements in theotherchaptersoftheagreements.MorethanaquarterofthePTAs,forexample, have provisions that guard against majortelecommunications suppliers engaging in anti-competitive practices. About one-fifth of the PTAshave an intellectual property (IP) chapter preventingabuse or anti-competitive behaviour by IP rightsholders.
As has been argued in this report, infrastructuralservices, investments, and intellectual propertyprotectionare likely tobecentral ingredientsofwell-functioningproductionnetworkingarrangements.Theapplication of competition rules in these areascomplements the reduction of trade and otherregulatorybarriers.
The main obligations found in the competition policychapters of PTAs are the adoption or application ofcompetition law and closer cooperation amongcompetitionauthoritiesofPTApartners.Severaltypesof behaviour are considered anti-competitive or ashaving the potential to affect competition adversely,andareexplicitlymentionedintheagreements.Theseinclude concerted actions, abuse of a dominantposition and state aid. Monopolies, state enterprisesand undertakings with special or exclusive rights arealsogivenparticularattention.
Competition policy chapters typically mandate closercooperation among national competition authorities,althoughforthemostpartthescopeofcooperationislimitedtotheexchangeofinformation,notificationandconsultation.AsmallnumberofPTAs,however,giveasubstantial role to regional bodies in carrying outsurveillanceandinvestigations,andintakingmeasurestocurbanti-competitivebehaviour.
One complication in assessing the policy effects ofcompetitionpolicychapters,asdistinguishedfromthesector-specific competition provisions and horizontal
FigureD.17: sector-specific competition provisions in PtAs
Source:Teh(2009).
Per
form
ance
requ
irem
ents
Freq
uenc
y
Info
rmat
ion
requ
irem
ents
Nat
iona
l tre
atm
ent
Mon
opol
ies
and
excl
usiv
ese
rvic
e pr
ovid
ers
Fina
ncia
l ser
vice
s
Maj
or s
uppl
iers
/co
mpe
titiv
e sa
fegu
ards
Uni
vers
al s
ervi
ce
Valu
e-ad
ded
serv
ices
Mar
itim
e tr
ansp
ort
Tend
erin
g pr
inci
ples
(inc
l. no
n-di
sclo
sure
of c
onfid
entia
l inf
o.)
Info
. on
inte
nded
pro
cure
men
ts(in
cl. t
echn
ical
spe
cific
atio
ns)
Lim
ited
tend
erin
g
Trea
tmen
t of t
ende
rsan
d aw
ardi
ng o
f con
trac
ts
Per
mit
use
of IP
to re
med
yan
ti-co
mpe
titiv
e pr
actic
e
Pre
vent
abu
se o
f IP
righ
ts
Investment Services Int. propertyTelecommunications Govt. procurement
30
25
15
20
10
5
0

WOrld Trade repOrT 2011
144
principles, is that a sizeable number of PTAs excludethem wholly or in part from dispute settlementprovisions intheagreement.Outof the55PTAswithcompetitionpolicyprovisionsinthesampleof74PTAsinTeh(2009),14excludealloftheseprovisionsfromdisputesettlement,whileanothertwoexcludepartsofthecompetitionprovisions.Thesecarve-outssuggestthatcompetitionpolicychaptersareforthemostpartintendedtooperateona“bestendeavour”basisonly.44Theyalsounderscoretheimportanceofthehorizontalprinciples and sector-specific competition provisionsoutsidethecompetitionpolicychaptersoftherelevantPTAs.
Pattern over time
Figure D.18 shows that the commitment to promotecompetitionthoughPTAshasincreasedovertime.Thefocus of this analysis is limited to sector-specific andhorizontal competitionprovisions,given thata sizeablenumber of PTAs exclude, completely or in part, thecompetition policy provisions from dispute settlement.TheverticalaxisinFigureD.18measuresthefrequencyofthesector-specificandhorizontalprovisionsofeachPTA in thesamplewhile thehorizontalaxisshows thedateonwhichthePTAenteredintoforce.Theincreasedcommitment to promote competition is shown by theascending blue line for the entire sample of 74 PTAswhichcameintoforcefrom1958to2006.
Are there families of PtAs in the context of competition policy?
The question whether distinct kinds of competitionprovisionsarefoundinagreementsinvolvingparticularcountriesisrelevantinlightoftheclaimbyHornetal.(2010) that certain PTA hubs tend to export theirregulatory regimes to PTA partners. Solano andSennekamp(2006)arguethatdistinctpatternscanbedetected in the competition policy provisions in EU-and NAFTA-style agreements. Since that study
focusedonlyonthecompetitionpolicychaptersoftheagreements, the question arises whether the findingholds if a broader view is taken of competitionprovisionsinPTAs.
The analysis undertaken in this report suggests thatthe Solano and Sennekamp finding is robust, even ifwe include the sector-specific and horizontalprovisions. Four salient differences are identifiable inthe treatment of competition policy in PTAs involvingthe EU and the United States. First, horizontalprinciples are more pronounced in US-centred PTAs.Secondly, competition disciplines are fairly prominentin the sectoral chapters of US PTAs, particularly intelecommunications, government procurement andinvestment.Thirdly,comparedwiththeEUagreements,thereislesslikelihoodoffindingaspecificcompetitionpolicy chapter in North American PTAs. Nearly all ofthe PTAs concluded by the EU contain competitionpolicy chapters. Finally, US-centred PTAs excludecompetitionpolicychaptersfromdisputesettlement.
It is difficult to ascertain the practical relevance ofthesedifferences. IntheanalysisofTBTprovisionsinPTAs, one explanation for the observed existence offamilies of PTAs was that the hub in hub-and-spokePTAs was exporting its regulatory regime to thespokes.ThusoneinterpretationisthatthetwotradingpowersareinterestedinexportingdifferentaspectsoftheircompetitionregulationstotheirPTApartners.
Are competition rules preferential?
Unlike traditional market access provisions, manyelements of competition rules in PTAs arecharacterized by non-discrimination, see for example,Teh (2009) and Dawar and Holmes (2010).Competition disciplines usually operate through theuse of domestic regulations.45 While it is notimpossible for these regulations to be tailored tofavour enterprises originating from PTA partners, it
FigureD.18: Competition disciplines in PtAs over time
Source:Teh(2009).
1957
Num
ber o
f com
petit
ion
prov
isio
ns
1964 1971 1978 1984
Average
200519981991
14
10
4
12
8
6
2
0

II – tHe Wto AnD PReFeRentIAL tRADe AGReements
145
D. A
nA
tom
y o
F PR
eFe
Re
ntIA
L
tRA
De
AG
Re
em
en
ts
may be costly to do so and becomes even moredifficultasthenumberofPTAstowhichacountryisasignatory increases. Transparency, and in particularthe obligation to publish laws promoting competition,providesinformationthat isavailabletoPTAandnon-PTAmembersalike.
Competition policy chapters typically mandate theapplication of competition law and the establishmentof a competition authority. To the extent thatenforcement of competition law in a country reducesthemarketpowerofdomestic incumbents,all foreignenterprisesthatoperateinthemarketstandtobenefit,regardless of whether or not they are from a PTAmember. Competition policy obligations also provideopportunities for new foreign entrants (either fromPTA or non-PTA members) to challenge domesticincumbents.
Finally, positive benefits (spillovers) may arise fromcompetition provisions, particularly if they arecontainedinregionalratherthanbilateralagreements(DawarandHolmes,2010).Economiesofscalecanberealized from the creation of a regional competitionauthority. Even if no centralized authority isestablished, beneficial spillovers can result frominformation sharing and cooperation amongenforcement authorities. There can also bedemonstration effects in other jurisdictions, when acompetitionauthorityinonePTAmembertakesactionagainst another for anti-competitive behaviour.Eventually, more common competition norms andpracticeswithinaPTAwillpreventregulatoryarbitrage,where enterprises locate in a jurisdiction in the PTAwithrelativelylaxcompetitionpolicy.
3. ProductionnetworksanddeepPTAs
In this section of the report, we turn to the role ofinternational production networks in encouraging theestablishmentof“deep”PTAsthatgobeyondreducingtariffs. The econometric results show that greatertrade inpartsandcomponents isassociatedwith thegreaterdepthofnewlysignedagreementsamongPTAmembers. In addition, the analysis shows that thegreater the depth of an agreement, the bigger theincreaseintradeamongPTAmembers.Tocomplementthis analysis, we examine two case studies fromdifferentregionsoftheworld:ASEAN(AssociationofSoutheast Asian Nations) and Costa Rica. Theseprovideusefulinsightsintothelinkbetweenproductionnetworks and the process of creating a PTA.46 Theintention is to document the growth of trade in partsand components as well inflows of foreign directinvestment during the period leading up to theconclusionofthetradeagreement.
(a) Deepintegrationandproductionnetworks:anempiricalanalysis
The theoretical literature on PTAs reviewed inSection C.2 suggests that the relationship betweendeepintegrationandtradegoesinbothdirections.Onthe one hand, PTAs may stimulate the creation ofproduction networks by facilitating trade amongpotential members of a supply chain. On the otherhand, countries already involved in the internationalfragmentation of production are willing to signpreferential trade agreements with their partners inordertosecuretheirtradingrelationshipsasprovidersof intermediate goods and services. Moreover, whenproductionnetworkstakeplaceamongcountrieswithsignificantgaps (ordifferences) inbusiness lawsandregulations, deep PTAs are a vehicle for narrowingsuch gaps and further developing production sharingactivity. In this section we will empirically test bothdirectionsofcausality.
The impact of PTAs on trade has been widelystudied.47ThemainconclusionofthesestudiesisthatPTAs boost trade among members. The literature onthe effects of deep integration, however, is limited.One of the main reasons for this is that difficultiesarise in defining and measuring the depth ofagreements (see Section C.2). In this section, anattemptwillbemadetoinvestigatetheeffectsofdeepintegration on trade with a focus on productionnetworks for the sub-set of agreements analysed inSectionD.2.48
Thedepthofanagreementwillbedefinedintermsofcoverageandwillbecapturedby twosetsof indices.Thefirstgroupof indices isconstructedon thebasisof the number of legally enforceable WTO+ andWTO-X provisions included in each agreement. Thehigher the number of enforceable provisions coveredby an agreement, the deeper the agreement. Alimitation of these indices is that they give the sameweighttoeachoftheareascoveredinaPTA,therebyassuming that the potential impact of each provisiononproductionnetworksisofthesamemagnitude.
Todealwiththisproblem,anothermethod–knownasa principal factors component methodology49 – willalsobeusedtogenerateanindexcapturingthedepthofanagreement.Thismethodologyisnottheoreticallyfounded but it can be used as a starting point forfurtherresearchonhowtoquantifydeepintegration.
Two alternative indices capturing the depth of anagreementinareassuchascompetitionpolicyandTBTsarealsoconsidered.Theseindicesarealsocomputedintermsofthecoverageofprovisions,withahigherindexscore representing increased depth in the relevantarea.50 These particular provisions are chosen for tworeasons.First,anexistingliterature51hasattemptedin-depth analysis and a mapping of the provisions.Secondly, as discussed in Section D.2, areas such as

WOrld Trade repOrT 2011
146
competition policy and TBT are important in terms ofproduction sharing. The integration of TBT measuresmakes international fragmentationofproductioneasierbyloweringthecostoftestingandproductcertification.Competition policy allows multinational enterprises totakefulladvantageofcostdifferencesamongcountrieswhenproductionisfragmented.
Anaugmentedgravityequation52 isestimatedfor200countries, using data from 1980 to 2007, in order toinvestigatetheeffectofdeepintegrationonproductionnetworks.Thismethodologyhasbeenextensivelyusedby economists to test empirically the determinants oftrade flows, and in particular to estimate the effect ofpreferential trade opening on trade flows. Estimatingthe effects of PTAs on bilateral trade in parts andcomponents using a gravity equation is, however,susceptible to an endogeneity problem.53 In order totake account of this, the approach used by Baier andBergstrand(2007)isfollowed.54
Lackofdataposessomedifficulties inassessingtheinternational fragmentationofproduction.This iswhytheempiricalliteratureoftendrawsonproxymeasuresfor production networks. Different approaches havebeen used to quantify the magnitude and pattern ofmanufacturingtradedirectlyattributabletoproductionnetworks.55 We follow Yeats (1998) and Hummels etal. (2001) and use trade in parts and components toproxyforglobalproductionsharing.56
Preliminaryresultsshowthat,asexpected,signingaPTAincreases production sharing among countries. Morespecifically,preferentialtradeagreementsincreasetradeinpartsandcomponentsby35percentamongcountrymembers (see column (1) of Appendix Table D.4). Inaddition,countriesthatsigndeepagreementstrademorethan countries that sign shallow agreements. In otherwords,havinganadditionalprovisioninanagreementwillincreasetradebyalmost2percentagepointsonaverage(see columns (2) (3) and (4) of Appendix Table D.4).Interpretingthemagnitudeofdeepintegrationwhenitismeasured using principal component analysis is lessintuitive,sinceitisnoteasytounderstandthemeaningofa one-unit increase in such an index. However, resultsshow that on average, signing deep agreementsincreasestradeinproductionnetworksbetweenmembercountriesbyalmost8percentagepoints (seecolumn5ofAppendixTableD.4).
Preliminary evidence also shows that deeperagreements in areas such as TBT measures andcompetition policy have a positive and significantimpact on production networks (see the last twocolumnsofAppendixTableD.4).Includinganadditionalprovision in competition policy or TBTs will increasetradebyoneandthreepercentagepointsrespectively.Results confirm that TBT integration involving mutualrecognition, harmonization of standards andtransparencydecreasesthecostsoffragmentationofproduction. The adoption of competition law and
higher levelsofcooperationamongcountrymembersofaPTAalsomakeproductionsharingmoreprofitableforfirmsinthecountriesconcerned.
Since the TBT integration and competition policyindicesarebasedondifferentsamplesofcountries,itis not possible to compare the magnitude of thesecoefficientsinordertodeterminewhichpolicyareaisthemostimportantinrelationtoproductionnetworks.
So far, we have considered whether deep agreementsincrease trade in parts and components. The secondquestion noted at the start of this subsection waswhetherhigherlevelsoftradeinpartsandcomponentsincreasethelikelihoodofsigningdeeperagreements.Inorder to answer this, we follow the literature on thedeterminants of preferential trade agreements57 andestimateanequationinwhichthedepthofanagreementisnow thedependent variable tobeexplainedand theshareoftradeinpartsandcomponentsintotaltradeisincludedasanexplanatoryvariable.58
Results (see Appendix Table D.5) show that higherlevels of trade in parts and components relative tototal trade have a positive impact on the depth of anagreement. This effect is still significant after takingaccount of other PTA determinants, such as theeconomic similarity between countries and theirdifferencesinrelativefactorendowments.
(b) ASEAN:fromregionalizationtoregionalism
InSectionBof thisreport, referencewasmadetothelarge increase and regional concentration of trade inpartsandcomponentsinEastAsiainrecentyears.Thispattern is consistent with the findings of Ando andKimura (2005)andKimuraetal. (2007) forabroaderclass of products which they termed “machineryindustries”.59Theauthors link the largeshareof theseproductsinthetradeofEastAsiancountriestotheriseofinternationalproductionnetworksintheregion.
International production networks are not, of course,unique to East Asia. It is possible to identify suchnetworksinNorthAmerica(involvingAmericanfirmsandMexican maquiladoras) and in Europe (featuring, forexample, German car companies and Hungarian andCzechaffiliates).However,thereareatleastthreefactorsthatmaketheEastAsiannetworksdistinctive(AndoandKimura,2005).First, countries'manufacturingactivitiesand international trade are more intertwined. Secondly,the networks involve a large number of countries atdifferent levels of income. Thirdly, the networks includebothintra-firmandarm’slengthrelationships.
ASEAN was established in 1967 largely to deal withrisingterritorialtensionsamongsomeofitsmembers(theoriginalsignatorieswereIndonesia,Malaysia,Philippines,SingaporeandThailand),andwithpossiblespilloversfromthe conflict in Indochina. As a result, economic
II – tHe Wto AnD PReFeRentIAL tRADe AGReements
147
D. A
nA
tom
y o
F PR
eFe
Re
ntIA
L
tRA
De
AG
Re
em
en
ts
cooperation did not appear to be a priority until 1977,whenapartial-scopePTAwasestablished.However,thescheme only had a limited impact because of longexclusionlistsandlowpreferencemargins(CuyversandPupphavesa, 1996). It was not until 1992 that formaleconomic cooperation took a significant step forwardwhen themembersdecided tocreatea free tradearea.The initial goal was to reduce tariffs between membercountriestoarangeof0to5percentwithin15years,butthathorizonwassubsequentlyshortenedtotenyears.
Inthequarterofacenturythatspannedthecreationoftheassociationandthedecisionformallytoestablishafree trade area, a shift occurred in economic policyfromtraditionalimportsubstitutiontoexportpromotionandopennesstoFDI.Totalmerchandiseexportsofthefive original members expanded from US$ 8.9 billionin1967toUS$357billionin1992(seeTableD.4).Inparticular, exports of parts and components becameincreasinglyimportant,risingfromabout2percentoftotalexportsintheyearoftheAssociation'sfoundingto 17 per cent by the time the free trade agreementwassigned.
Equallytellingwastheincreasedprominenceofpartsandcomponentsinintra-regionaltrade.In1967,partsandcomponentsmadeuplessthan2percentofintra-regional trade and by 1992 accounted fornearly18percentofsuchtrade(seeFigureD.19).
In their description of East Asian production networks,AndoandKimuraarguedthatJapanesefirmshadalargerole in the development of these networks. They notethatby2000asmanyas80percentof theJapanesefirmsgoingabroadhadatleastoneaffiliateinEastAsia,and 54 per cent of the foreign affiliates of JapanesefirmswerelocatedinEastAsia(AndoandKimura,2005).
Complementary data from the Japanese ExternalTrade Organization (JETRO) show the large flow ofJapanese FDI to the original five ASEAN members.Between1967and1992,JapaneseFDItothesefivecountriesaveragedabout15percentofallitsoutflowsand 30 per cent of all Japanese FDI to developingcountries.60 Taking into account all sources of FDI,annual inflows to the five ASEAN countries grewsignificantlyduringthisperiod,startingfromlessthanabilliondollarsin1970toreachnearlyUS$13billionin1992.Theseflowsrepresenteda largeshareofallFDI going to developing countries, averaging morethanone-fifthduring the1970sand remainingaboveone-sixthinthe1980s(seeFigureD.20).
Whiletheincreasedregionalizationoftradeinpartsandcomponents would not have been possible withoutASEAN'sopennesstotradeandforeigninvestment,thismaynothavebeensufficientforproductionnetworkstoflourish. Production networks require low trade costs.Theyalsorequirepredictability ineconomicpolicy.EveniftariffswerebeingloweredbyASEANcountries,tradecosts could still be a problem because of inadequate
infrastructural services (such as transportation andtelecommunications)orbureaucraticredtape.
Asproductionnetworksexpand,theyresult ingreatereconomic integration. Differences in legal systemsand economic institutions among countries in suchareas as product and services standards, intellectual
TableD.4: AseAn-5 exports, 1967-92 (Milliondollars)
yearParts and
components exports
total exportsshare
(per cent)
1967 154.9 8,867.0 1.7
1970 235.1 12,213.7 1.9
1980 3,905.2 135,657.5 2.9
1990 38,562.2 276,095.8 14.0
1992 60,637.9 356,829.4 17.0
Source:CalculationsusingUNComtradedata.
Figure D.19: share of parts and components in intra-regional trade
Source:CalculationsusingUNComtradedata.
Intra-ASEAN P&C exports2 per cent
Intra-ASEAN P&C exports18 per cent
1967
1992

WOrld Trade repOrT 2011
148
property rights protection, investment protection, andaccess to dispute settlement mechanisms becomemore critical as a potential hindrance to productionsharing. To keep the momentum of productionnetworksgoing,countriesincreasinglyneededtoturntheirattentiontopoliciesbeyondtariffreduction.
Two recent papers by Pomfret and Sourdin(2009 and 2010) substantiate this view of the roleplayed by the ASEAN free trade area. They maintainthatASEANcountriesusedtheirPTAasavehicleforconcerted trade facilitationand that thedriving forcebehind these policies was the emergence ofinternational production networks and the desire ofASEAN governments to increase the efficiency ofthesearrangements.Progressinreducingtradecoststhrough improved customs administration and otherfacilitation measures benefits all trade and so gainsaccrue to members and non-members alike. It isthereforepossibletousetradecostsbetweenASEANmembersandcountrieswhoarenotpartiestothePTA(suchasAustralia)tomeasuretheimpactofASEAN'stradefacilitationinitiatives.
Pomfret and Sourdin find that the simple average ad valorem trade costs associated with the ten ASEANcountries'exportstoAustraliadeclinedfrom10.3percentin1990to3.9percentin2007,whichwasmuchmorepronouncedthanthedropintheglobalaverage.The results are similar if data from other countriessuchastheUnitedStatesorBrazilwereusedinstead.Theauthorsnotethatmostoftheobservedreductionin tradecosts relative to theglobalaverageoccurredbefore2002,whenASEANwasconstructing its freetrade area and there was little global movementtowardsimplementingtradefacilitationmeasures.
Anotherimportantelementthatmayhaveplayedarolein the creation of regional rules and institutions was
theexpansionofASEAN'smembership.Inthe1990s,fournewmembers,Cambodia,LaoPDR,MyanmarandViet Nam, acceded to the organization.61 Theeconomies of the new members were different fromthe older members both in terms of their stage ofdevelopment and their market orientation. Lao PDRandVietNamweresocialisteconomiesandCambodiawas just emerging from a long civil war. With theexception of Myanmar, none were GATT/WTOmembersatthattime.
The ASEAN Free Trade Area in 1992 was only thestart of thePTAprocess. Itwas followedby servicesand intellectual property agreements in 1995, aninvestment agreement and dispute settlementmechanism in 1996, and a framework agreement onmutual recognition arrangements for standards in1998. In sum, the trajectory followed by the ASEANPTA process began with the regionalization of tradeand production and culminated with the creation offormal regional rules and institutions to oversee athrivingandintegratedregionaleconomy.
The focus of this discussion on production networksandASEANisnotintendedtosuggestthatregionalismin South-East Asia is only about trade. As notedpreviously, the Association was partly intended tomanage territorial disputes among some of itsfoundingmembersandtocontainanyfalloutfromthewar in Indochina. With respect to these goals, theAssociation has outdone even its most optimisticexpectations. The region has been largely free ofmajor conflict since the end of the war in Indochina.The organization has played a key role in managingbig-power rivalries in East Asia. It has arguablyfacilitated the integrationofCambodia,LaoPDRandViet Nam into the international community. BothCambodiaandVietNamarenowmembersoftheWTO
FigureD.20: FDI flows to AseAn-5 and as share of FDI to developing countries, 1970-92
Source:UNCTADFDIdatabase(seehttp://unctadstat.unctad.org/).
1970
$ Billions Per cent
FD
I inf
low
s
Sha
re o
f FD
I to
deve
lopi
ng c
ount
ries
1972 1974 1976 1978 1980 1982 1984 1986 1988 1990 1992
14
10
6
12
8
4
2
0
60
50
30
40
20
10
0
Share of FDI to developing countries FDI flows to ASEAN-5

II – tHe Wto AnD PReFeRentIAL tRADe AGReements
149
D. A
nA
tom
y o
F PR
eFe
Re
ntIA
L
tRA
De
AG
Re
em
en
ts
andamongthefastestgrowingdevelopingeconomies.Lao PDR is in the process of accession to the WTO.As isthecaseofothersuccessfulmodelsofregionalcooperation,thecreationofregionalpublicgoodshasalsoproducedglobalbenefits.
(c) CostaRica
Productionnetworksareoftenassociatedmostcloselywith the Asia-Pacific region and Eastern Europe.Countries from other regions, however, may also beinvolved in international production networks wheretheyalsoplayapartintheprocessofPTAformation.
Monge-Ariño (2011)providesan insightfulaccountofCostaRica'stradepoliciesoverthepastfewdecades.The country has managed to combine an activeagenda in multilateral trade negotiations at the WTOwith the negotiation of several preferential tradeagreements. Its trade opening started in the mid-1980s with the unilateral reduction of import tariffsand continued with the accession to the GATT in1990. Further trade opening resulted from theUruguay Round (concluded in 1994) as well as fromPTAs negotiated with Mexico, Chile, the DominicanRepublic, Canada, the Caribbean Community(CARICOM), Panama, the United States, China,Singapore and the EU (see Table D.5). In addition,negotiations for a PTA with Peru began in 2010 andnegotiations for a PTA with South Korea areanticipated to begin in 2011. Costa Rica's policy oftrade opening has been accompanied by a strongemphasis on attracting FDI, particularly in high-techmanufacturingandservicesactivities.
These policies resulted in significant changes in thestructure of Costa Rica's exports, leading to asubstantialriseintheshareofmanufacturingexportsas well as trade in services in total exports, and adecrease in the dependence of the Costa Ricaneconomy on traditional export commodities, such ascoffeeandbananas(Echandi,2006).CostaRicaalsosaw an increase in its participation in internationalproduction networks, with 43 per cent of its totalmerchandise exports in 2009 directly related to fivemain supply chains: electronics, medical devices,automotive products, aeronautic/aerospace productsandfilm/broadcastingdevices(Monge-Ariño,2011).
OneofthepivotalmomentsinCostaRica'sinvolvementin international production networks came with thedecision by Intel in 1996 to establish a US$ 300million semiconductor assembly and test plant in thecountry(WorldBank,2006).ThevarietyofgoodsandservicesproducedinCostaRicaandexportedaspartofthesenetworksisrelativelywideforaneconomyofCostaRica'ssize.Theyrangefromcomputerpartsandmedicalequipmenttopartsforcarsandairplanes,andservices such as the design of turbines for airplanesand the first ever plasma-propelled engine for spaceshuttles.
The overall average for the domestic component ofexports associated with production networks was36 per cent in 2009, ranging from 72 per cent inaeronautics/aerospace to 22 per cent in electronics(Monge-Ariño, 2011). The joint contribution of labourandcapitaltothedomesticcomponentofexportswas40percentin2009,whilelocallyprovidedservicesandsuppliesaccountedforalmostone-sixthandone-tenth,
TableD.5: Costa Rica’s preferential trade agreementsPtA Current partners entry into force
CACMElSalvador,Guatemala,Honduras,Nicaragua
23September1963
CostaRica–Mexico Mexico 1January1995
CostaRica–Chile Chile 15February2002
CostaRica–DominicanRepublic DominicanRepublic 7March2002
CostaRica–Canada Canada 1November2002
CostaRica–CARICOM
Trinidad&Tobago 15November2005
Guyana 30April2006
Barbados 1August2006
CostaRica–Panama Panama 24November2008
CAFTA-DR-USUnitedStates,ElSalvador,Guatemala,Honduras,Nicaragua,DominicanRepublic
1January2009*
CostaRica–China China **
CostaRica–Singapore Singapore **
AACUE EU–27 ***
* ThisdatereferstowhentheagreemententeredintoforceforCostaRica.** Negotiationfinishedinearly2010andsubmittedforlegislativeapproval;entryintoforceexpectedin2011.***Negotiationcompletedinearly2010;legal“scrubbing”isexpectedtobecompletedinearly2011.
Source:Monge-Ariño(2011).

WOrld Trade repOrT 2011
150
respectively. The contribution of capital is moresignificantintheelectronicssector,whiletherespectivecontributionsoflabourandlocallyprovidedservicesaremoresignificantintheaeronautic/aerospacesector.
The link between production networks and PTAsseems apparent in Costa Rica's agreements with theUnited States (United States-Dominican Republic-Central America Free Trade Agreement) and withChina.62 The share of parts and components in totaltrade, a customary indicator of production sharing,rose rapidly with both countries between 1995 and2008. While total two-way trade with the UnitedStatesgrewbyabout11percentannually,TableD.6shows that parts and components trade expanded atabouttwicethatrate.
Alongwiththestrongtradeperformancebetweenthetwocountries,USFDIflowsrosemorethaneighteen-
foldbetween1982and2008,fromUS$142milliontoUS$2.6billion (seeFigureD.21).Asaconsequence,Costa Rica's share of US FDI to Central America63climbedfromlessthan3percentin1982toabout20percentin2008.
TurningtoCostaRica'slinkswithChina,two-waytradegrewbyanannualaveragerateofnearly30percentbetween 1995 and 2008, while trade in parts andcomponents grew at more than twice that rate (seeTableD.7).Overall,tradeinpartsandcomponentsnowmakeupabouthalfofCostaRica'stradewithChina.
These facts are consistent with the explanation thatCosta Rica's participation in international productionnetworks was an important trigger for its tradeagreementswiththeUnitedStatesandChina.
TableD.6: Costa Rica’s two-way trade with the united states, 1995-2008 (Milliondollars)
Items 1995 2008Average annual growth
(Per cent)
Parts&components 209.3 2,600.6 21.4
Allmerchandisegoods 2,537.6 9,571.4 10.8
Shareofpartsandcomponents(%) 8.2 27.2
Source:UNComtrade.
TableD.7: Costa Rica’s two-way trade with China, 1995-2008 (Milliondollars)
Items 1995 2008Average annual growth
(Per cent)
Parts&components 1.1 694.2 64.2
Allmerchandisegoods 50.1 1,478.4 29.7
Shareofpartsandcomponents(%) 2.2 47.0
Source:UNComtrade.
FigureD.21: Costa Rica’s share of us FDI flows to Central America, 1982-2008
Source:USDepartmentofCommerce,BureauofEconomicAnalysis.
1982
US
$ m
illio
ns
1984 1986 1988 1990 1992 1994 1996 1998 2002 20062000 2004 2008
3000
2000
2500
1500
1000
500
0
30
25
15
20
10
5
0
Share of US FDI to Central America US FDI to Costa Rica
Per cent
II – tHe Wto AnD PReFeRentIAL tRADe AGReements
151
D. A
nA
tom
y o
F PR
eFe
Re
ntIA
L
tRA
De
AG
Re
em
en
ts
4. Africanregionalcooperation:lessonsfromdeepintegration?64
NotallPTAsarepromptedbyinternationalproductionnetworks and the trend towards deep integration.African regional cooperation is a case in point. Deepintegrationmayneverthelessholdsomeusefullessonsthat can increase the returns from the process ofAfricanintegration.Muchofthesubsequentdiscussionwill refer to the experience of Sub-Saharan Africa.Hence it is essential not to lose sight of efforts bycountriesinNorthAfricatointegratewithoneanotherorwiththerestofthecontinent.EffortsatintegrationinNorthAfricaincludetheAgadiragreement(ofwhichJordan, a Middle Eastern country, is also a member)and the Arab Maghreb Union (AMU), which wascreated as the North African building block of thecontinent-wideAfricanEconomicCommunity.
ThegeopoliticalconfigurationofAfricahasbeenlargelydetermined by the political forces of colonialism. ThebordersofAfricancountriesdemarcatedthecoloniesofthe European powers, not the emergence of nationstatesinAfrica.Afragmentedcontinentistheresult,withsmallmarkets, smalleconomies,anda largenumberoflandlocked countries significantly limiting developmentoptions. Fragmentation is associated with the lack ofeconomiesofscaleintheproductionanddistributionofgoodsandservicesandtheimpactofscaleonthecostof public goods. In the early years of independence,attentionfocusedstronglyontheneedtoovercometheproblems of scale and fragmentation. Continentaleconomic and political unification was accepted as arational response in order to create a larger economicspaceforindustrializationandeconomicdevelopment.
This was an era of economic planning, and Africa’sleadership believed that economic planning would bemore practicable at a regional, and ultimatelycontinental, level. Underpinning this policy approachwastheconvictionthatthepathtodevelopmentwouldbe industrialization, and diversification away fromreliance on primary commodity production. Theindustrialization-regionalintegrationlinkswereclear.Alarger, protected market would provide the space forviableindustrializationtoreplacecertainimports.Thiswasatthetimeawell-acceptedstrategyfordevelopingcountries. Theaimwas toestablishabroad rangeofindustries across different sectors. Economicunification was seen as a solution to Africa’sdevelopment dilemma, and political unification wasrequired to make economic integration work. Morerecent experience has confirmed that politicalconsiderations are also key drivers of many Africanintegration arrangements. However, even in thesecases, regional integration remains a politicalarrangementthatmustbejustifiedineconomicterms.
Theambitionof regionaleconomic integrationand thecommitment to develop through industrialization were
important during the first decades of independence,and thisprovided themotivation for theLagosPlanofAction (LPA). The LPA was an initiative of theOrganisationofAfricanUnity(OAU),adoptedbyHeadsof State in April 1980, and actively supported by theUnitedNationsEconomicCommissionforAfrica(ECA).
The LPA emphasized the expected contribution ofindustrialization and the 1980s became the “IndustrialDevelopmentDecadeinAfrica”.Theproposedframeworkfor industrializationwasthedivisionofthecontinentintoregionalintegrationareasthatwouldeventuallyconstitutea united African economy, the African EconomicCommunity. To achieve this, the ECA supported threeregional integration arrangements: i) the EconomicCommunityofWestAfricanStates(ECOWAS),whichwasestablishedin1975,predatingtheLPA;ii)thePreferentialTrade Area (PTA) covering East and Southern Africa,which was the precursor of the Common Market forEastern and Southern Africa (COMESA); and iii) theEconomicCommunityofCentralAfricanStates(ECCAS).The Arab Maghreb Union was established in 1989,completingthecoverageofthecontinent.
Apartheid South Africa was at this stage still excludedfrom theAfrican integrationplan.TheSouthernAfricanDevelopment Coordination Conference (SADCC) wasestablished in1980,supportedby theEuropeanUnion,withthespecificaimofreducingeconomicdependenceon South Africa. SADCC was not a market integrationarrangement.ItsbroaddevelopmentmandatefocusedonregionalcooperationtoensureindependencefromSouthAfrica for countries that were known as the frontlinestates.65 As such, SADCC focused on cross-border,sector-specific projects, such as regional developmentcorridorsandtheSouthernAfricanPowerPool.
In anticipation of South Africa’s democratic transition,SADCC was transformed into the Southern AfricanDevelopment Community (SADC) in 1992. South AfricajoinedSADCin1994,thusbecomingpartofthecontinentalintegrationplan.IncontrasttoSADCC,SADCadoptedanexplicitmarket integrationagendaandisagoodexampleof a linear model of progressive integration in Africa.Although the SADC Treaty (and subsequently the SADCTrade Protocol) does not articulate a detailed plan forintegration, the detail was provided in the RegionalIndicative Strategic Development Plan of 2003. Thisstrategicplanprovidesfortheestablishmentofafreetradeareaby2008,acustomsunionin2010,acommonmarketin2015,monetaryunionin2016andtheintroductionofasinglecurrencyin2018.66Thisapproachwasalsoadoptedby the East African Community (EAC), established in199967andalsobyECOWASinWestAfrica.ProgressinECOWAStoestablishafreetradeareahasbeenveryslowandthecustomsunionisstillworkinprogress.
The SADC roadmap and the EAC integration planreflect the general trend in Africa to adopt a linearmodelofprogressiveregionalintegration,characterizedby ambitious targets. Of 14 regional economic

WOrld Trade repOrT 2011
152
communities that existed in 2001, nine have a fulleconomicunionasthespecifiedobjective,oneaimstobecome a common market (COMESA), one is anestablishedcustomsunion(theSouthAfricanCustomsUnion) with no plans to move beyond this, while theremaining three aim for intra-regional free trade orregional cooperation.Theseagendasshare theaimoftransforming the African economic landscape andestablishing “a strong united bloc of nations” over aperiodofjustmorethanthreedecades.
An important step in this process requires thestrengtheningofthebuildingblocksofregionaleconomiccommunities. This involves an evolutionary process,moving from free trade areas and customs unions to acommon market covering the continent (EconomicCommission for Africa, 2004). The member states ofCOMESA,SADCand theEAChaveundertaken recentcommitments to establish a Tripartite Free Trade Areaconsistingofthe26memberstatesoftheseagreements.This is seen as an important step in addressing theproblem of overlapping membership, a key feature ofAfricanregionalintegrationagreements.68
African regional integration focuses primarily onreducing barriers to trade in goods. Trade in servicesbecomes a feature of the regional integration modelwhenthecommonmarketstageisreached,buttodateservices have received very little attention in formalAfrican integration arrangements. This is also true offorays by African countries into preferential tradeagreements with external partners. The inclusion ofservices(andalsootherbehind-the-borderissues,suchas investment, competition policy and governmentprocurement)hasprovencontentious.
Africa’s regional integration initiatives have achievedlimited results, raising doubts about the approachadoptedtoaddressingfactorsthatinhibitregionaltrade.Barrierstotradethatraisethecostsofdoingbusinesscan be classified as border or behind-the-bordermeasures. African regional free trade arrangementshave focused on border measures, and primarily ontariffs. Tariffs are undeniably an important barrier buttheymaynotbethemostimportantone.
Abundant anecdotal evidence suggests that time-consuming and inefficient border procedures may bemore important than tariffs in inhibiting intra-regionaltrade.Multiplebordercrossingsforgoodstoreachland-lockedcountriesaddsignificantlytothetransactioncostsof intra-regional trade. Many other constraints besidesborder barriers increase the transaction costs of trade.Geography is an important consideration. Given thelimitedavailabilityofnavigableinlandwaterwaysandthecheaptransportthisallows,thelogisticalcostsoftradeingoodsarehigh.Thisisexacerbatedbypoorlydevelopedtransport systems, characterized by low per capitadensitiesofrailandroadtransportinfrastructure,whichincolonialtimeswasdesignedtotransportprimaryproductstoport.Poorlydevelopedcross-countryroad,airandrailconnectionsaretheoutcome(McCordetal.,2005).
Transport costs in Africa are still among the world’shighest. For example, shipping a car from Japan toAbidjan costs US$ 1,500 whereas the comparablecost for transporting thesamecar fromAddisAbabato Abidjan would be US$ 5,000 (EconomicCommissionforAfrica,2004).Bothinfrastructuralandregulatory forces are at work. Overall, the high costand unreliability of transport services contribute to abusiness environment in which firms are forced tokeep higher levels of inventories, ruling out thepossibility of adopting cost-saving managementsystemsfor“justintime”production(Collier,2000).
Thelackofskillsandcapitaltoestablishandoperatemoderncommunicationsystems,combinedwithsmallbusiness communities that do not allow financiallyviablebusinesspublications,meanthatbusinessnewsandinformationrequiredforinformeddecision-makingisanotherimportantconstraint.69Fixed-linetelephoneservices are limited and unreliable, with high callcharges, especially for international calls. In mostAfrican economies the provision of fixed-line phoneservices is still the exclusive preserve of publicmonopolies.Businesscontractsrequireinformationoncomparative prices and depend on reliable, fast andlow-cost access to market information. Information isessential to efficient market outcomes, and a lack ofreadily available information at reasonable cost willraise trade transactioncosts.Although thesebarriersalso constrain trade with the rest of the world, theirimpactonintra-regionaltradeisparticularlyimportant.
The barriers discussed so far feature strongly on thedemand side of intra-regional trade. These demand-side factors, however, may arguably be much lessimportant than the weak supply-side capacity ofAfricaneconomies. Indeed, itmaybeargued that thereal problem facing African economies is not marketaccess (borderconstraints)but rather thecapacity toproducetradableproductscompetitively.
Expandingmarketaccessby loweringthetransactioncosts of trade is necessary, but will not guaranteeeconomicgrowthanddevelopment.Enhancedmarketaccess without the capacity to produce goods andservicestobenefitfromthoseopportunitieswillfailtoproduce higher economic growth. Effective supply-side capacity depends on sound macroeconomic andmicroeconomic policies, good governance, well-developed institutional capacities, adequateinfrastructure and a sound business environmentcapableofattractinginvestment.
Supply-side constraints to efficient production couldbe partly addressed by a deep regional integrationagenda. No single, ready-made recipe exists foreffectivedeepregionalintegration.Amongthefactorsrelevant toAfricaare integrationofservicesmarkets,tradefacilitation,improvedmarketintelligence,disputesettlement mechanisms, revenue systems lessdependent on trade taxes, funding for cross-border

II – tHe Wto AnD PReFeRentIAL tRADe AGReements
153
D. A
nA
tom
y o
F PR
eFe
Re
ntIA
L
tRA
De
AG
Re
em
en
ts
infrastructure, and financing for regional institutions(Lamy,2010).Developmentpartnersandinternationalinstitutions could assist this process by recognizingthattheemergenceofregionalgroupingsisrelevanttothe planning and implementation of developmentassistance. The WTO, for its part, is progressivelyregionalizing its Trade Policy Reviews and is nowencouragingtheregionalizationofAidforTrade,whichaims to help developing countries develop the trade-related skills and infrastructure needed to implementandbenefitfromtradeagreementsandtoexpandtheirtrade.
5. Conclusions
While not discounting other explanations for PTAs, acentralfocusoftheliteratureonthissubjecthasbeenonpreferentialtariffs.Asaconsequence,muchoftheeconomic analysis of the effects of PTAs hasconcentratedonthetrade-creationandtrade-diversionimpactsofdiscriminatoryaccesstoindividualmarkets.
The analysis in this section demonstrates that PTAsare not only about lowering tariffs. Ample evidenceshowsthatcommitmentsinPTAscoveralargenumberofnon-tariffpolicyareasandhavebecomedeeper.Asfaras tariffsareconcerned, theproliferationofPTAshas eroded preference margins over time. If tariff-related reasons do weigh with countries engaged innegotiating PTAs, they may be more concerned withavoiding negative discrimination than securingpreferential tariffs. Furthermore, there is evidence –bothstatisticalandthroughcasestudies–ofaroleforproductionnetworksinPTAformation.
Two importantconclusionsfollowfromtheanalysis inthissection.First,researchneedstofocusincreasinglyon the reasons for establishingPTAs thatgobeyondthe reductionof tariffs.Secondly, further reflection isneededontheimplicationsforthemultilateraltradingsystemofdeeper integration inPTAs. This andotherquestions bearing on coherence between PTAs andthe multilateral trading system are the subject of thenextsectionofthisreport.

WOrld Trade repOrT 2011
154
Endnotes1 SeeWorldTradeOrganization(WTO)(2007).
2 Startingfromatheoreticalmodelofintra-industrytrade,AndersonandvanWincoop(2003)derivedagravity-typereducedformequationforthebilateraltradebetweentwocountries,wheretradebetweentwocountriesdependontheirgrossdomesticproducts(GDPs)andtheirrelativetradecosts.Inparticular,theyshowthatinatheoreticallyfoundedgravityequation,tradebetweentwocountries,AandB,whereAistheimporterandBistheexporter,dependsnotonlyontheirbilateraltradecosts,butalsoontheoveralllevelofbarriersthatexportsofcountryBfaceintherestoftheworld,andtheoveralllevelofrestrictiontoimportsthatcountryAimposesontherestoftheworld.
3 AsimilarapproachhasbeenusedbyHoekmanandNicita(2008)andCarrèreetal.(2008).
4 TheestimateisbasedonastandardgravitymodelaugmentedbytheRPMindex.
5 Recallthatover70percentistradedatanMFNratebelow5percentandlessthan15percentoftradeshowsrelativepreferencemarginsgreaterinabsolutevaluesthan2percent.
6 SeeKuijper(2010).
7 SeeHsu(2006).
8 SeeKuijper(2010).
9 SeeHsu(2006).
10 SeevanDamme(2006).
11 SeeKwakandMarceau(2006);Hillman(2009).
12 SeeKwakandMarceau(2006).
13 SeeHornetal.(2010).
14 ASEAN-ChinaandMERCOSUR-India.
15 Thisfigureiscurrentasof1March2011,countingnotificationsforagreementsthatarecurrentlyinforce.
16 ThefourmodesforsupplyingservicesunderGATSincludecross-bordertrade(mode1),consumptionabroad(mode2),commercialpresence(mode3),andtemporarymovementofnaturalpersons(mode4).
17 ExamplesofagreementsusingtheGATSapproachinclude,forexample,MERCOSURandAFAS(ASEANFrameworkAgreementonServices).
18 TherestoftheagreementsnotifiedunderGATSArticleVareagreementsthatdonoteasilyfitintotheGATS-typeornegative-listcategoriessincetheyaimatdeepregionalintegration,suchasagreementsbetweentheEUandEUcandidatecountries.
19 MostUnitedStatesPTAs,includingallthosenotifiedafter2003,donotincludeaseparatechapterontemporaryentryforbusinesspersons.
20 Forexample,anumberofmorerecentagreementshaveusednegative-listmodalitiesforamarketaccessobligationmodelledonGATSArticleXVIthatappliestoallmodesofsupply.InNAFTA,thereisnobindingobligationalongthelinesofGATSArticleXVI,whileinGATS-typeagreementssuchobligationsapplyonthebasisofapositive-listapproach.SeeRoyetal.(2007).
21 SeeMattooandSauvé(2010).
22 FororiginalWTOmembers,thesearethecommitmentsmadeintheperiod1995-97.
23 SeeRoyetal.(2007)and(2008);MarchettiandRoy(2008b),FinkandMolinuevo(2008a)and(2008b),Miroudotetal.(2010).
24 OnthatseeMattooandWunsch-Vincent(2004).
25 SeeRoyetal.(2007).
26 FiguresinthissectionrelyonanextensionofthedatasetusedinRoyetal.(2007),Royetal.(2008),andMarchettiandRoy(2008b).Itcovers68PTAsinvolving53WTOmembers(countingtheEU-15asone).ThelistofWTOmembers(andtheiracronyms)andthesetofservicesagreementscoveredcanbefoundinAppendixTablesD.2andD.3respectively.ThisincludesPTAsnotifiedunderArticleVoftheGATSbetween2000and2010,aswellasafewPTAsthathavebeensigned,buthavenotyetenteredintoforceandbeennotified.ForeachpartytoeachPTA,thecommitmentsundertakenformarketaccessandnationaltreatmentineachservicesub-sectorhavebeencomparedtothoseundertakenintheGATSandthoseproposedinthemostrecentGATSofferintheDDA.Thedatasetcoversmode1(cross-bordersupply)andmode3(commercialpresence),andlooksatcommitmentsthatareGATS+.Furtherinformationonthedatacanbefoundat:http://www.wto.org/english/tratop_e/serv_e/dataset_e/dataset_e.htm
27 SeeMarchettiandRoy(2008b).
28 Asnotedpreviously,anegativelistidentifiessectorsormodesinrespectofwhichcommitmentsdonotapply,whileapositivelistapproachdoesthereverse.
29 SeeFinkandMolinuevo(2008b),Royetal.(2007).
30 FortheimpactofregimetypeonPTAs,see,amongothers,Mansfieldetal.(2008).Roy(2010)looksattheimpactofdemocracyonlevelsofGATScommitments.
31 See,forexample,ChaudhuriandKarmakaronvariousbusinessservices,Zhangonpostalandcourierservices,Marchettionfinancialservices,RoyonaudiovisualanddistributionservicesorTuthillontelecommunicationservicesinMarchettiandRoy(2008a).Commitmentsoneducationandprofessionalservices,amongothers,arealsoexaminedinRoyetal.(2008).
32 SeeCarzaniga(2008).
33 SeeStephensonandDelourme,(2010).SeealsoSauvéandWard(2009)ontheEU’smode4commitmentsinthePTAwiththeCARIFORUM.
34 SeeMiroudotetal.(2010);FinkandMolinuevo(2008b).
35 SeeAdlungandMolinuevo(2008),Bergeretal.(2010).
36 SeeAdlungandMorrison(2010).
37 SeeUNCTAD(2010).
38 Seehttp://www.unctadxi.org/templates/Page____1007.aspx.
39 Houdeetal.(2007)referstotheformeras“GATS-inspired”agreementsandtothelatteras“NAFTA-style”agreements.
40 Analternativetothetotalnumberofprovisionsisamethodthat“scores”thevariousprovisionsintheinvestmentchapterforthecommitteddegreeofopenness.SeeforexampleDeeetal.(2006).

II – tHe Wto AnD PReFeRentIAL tRADe AGReements
155
D. A
nA
tom
y o
F PR
eFe
Re
ntIA
L
tRA
De
AG
Re
em
en
ts
41 Additionalinformationhasbeencollectedontheexistenceofmutualrecognitionarrangements.
42 SeeRauchandTrindade(2002)foranassessmentoftheimportanceofinformationcostsfortrade.
43 SeeCollinsandRodrik(2000).
44 Theextraterritorialapplicationofcompetitionpolicymayraisesovereigntyconcerns.Statesmaypreferengagementinthisareathroughdiscussionandpoliticalnegotiation.Anotherpossibleexplanationforthesecarve-outsfromdisputesettlementisthatcompetitionprovisionsarenewtosomePTAmembers,particularlydevelopingcountries.Whiledevelopingcountriesmightbewillingtoacceptcompetitionpolicyprovisions(e.g.implementcompetitionlaw,establishacompetitionauthority,oractonanti-trustandabuseofdominantposition),theymaybeuncertainabouthowquicklyorhowsuccessfullytheycanfullyimplementthesecommitments.
45 SeetheanalysisinSectionCwhichdemonstrateswhy,undercertainconditions,trade-diversioneffectsareabsentwhenregulatorybarriersareremovedinPTAs.
46 SeeRavenhill(2009)andRavenhill(2010)forascepticaltakeonthisinterpretationofEastAsianintegration.HearguesthattheprimarymotivationfortradeagreementsinEastAsiahasbeentosecurediplomaticorstrategicgains.
47 SeestudiessuchasBaierandBergstrand(2007),SilvaandTenreyro(2006),SoloagaandWinters(2001),GhoshandYamarik(2004),Aitken(1973),Bertstrand(1985),Frankel(1997)andFrankeletal.(1995).
48 ThisanalysisdrawsonOreficeandRocha(2011)(forthcoming).
49 Principalcomponentanalysisisamathematicalprocedurethatorthogonallytransformsanumberofpossiblycorrelatedvariables–inourcasethedifferentprovisionsincludedinanagreement–intoanumberofuncorrelatedvariablescalledprincipalcomponents.Thetransformationisdefinedinsuchawaythatthefirstprincipalcomponentaccountsforthehighestlevelofvariabilityinthedata.Eachsucceedingcomponentinturnhasthehighestvariancepossibleundertheconstraintthatitbeorthogonal(thatis,uncorrelated)totheprecedingcomponents.
50 FordetailsonhowtheindexonTBTshasbeenconstructedseeSectionD.2.Theindexoncompetitionpolicyisbuiltastheunweightedsumofthreedifferentelements.Thefirstelementfocusesonthegeneralobjectivesofanagreement.Thiselementtakesthevalueofonewhenevertheseobjectivespromoteandadvanceconditionsoffaircompetitionbetweenpartiesorestablishcooperationbetweentheminthisfieldandzerootherwise.Thesecondelementrepresentsthecountofthetotalnumberofcompetitionrelatedprovisionsthatarepresentbothinthecompetitionpolicychapterandinothersectionsofanagreementsuchasinvestmentandservices.Thethirdelementcountsthenumberofhorizontalprinciplessuchtransparency,non-discriminationandproceduralfairnessthatareincludedintheagreement.
51 SeeTeh(2009)andPiermartiniandBudetta(2009).
52 Gravityequationsarederivedfrommodelsthatseektoexplainorpredicttherelationshipbetweenaparticular(dependent)variable(inthiscasebilateraltradeinpartsandcomponents)andasetofother(independentorexplanatory)variableswhosevaluescanbeestimated(inthiscaseelementsofdeepintegration).
53 Endogeneityariseswhenanexplanatoryvariableinanequationiscorrelatedwiththeerrortermoftheequation,andtheerrortermistheunexplaineddeviationofsampledatafromtheirunobservable“true”value.StudiessuchasBaierandBergstrand(2007)showthatomittedvariables,andtoalesserextentsimultaneity,arethetwomostimportantsourcesofendogeneitybiascausedbyPTAs.TheomittedvariablesproblemofPTAsarisessincetheerrortermmayretaintheeffectofsomeunobservablecountry-specificpolicyvariables,whichatthesametimeaffectbothtradeandtheprobabilityofformingaPTA.If,forexample,theformationofaPTAalsoinducesreformsintrade-restrictivedomesticregulation,thelikelihoodofanFTAishigher(sincetheexpectedgainsfromtheFTAarehigher),andtheomissionofthedomesticregulationvariablewillbiasthePTAcoefficientdownwards.Asimultaneityproblemcanarise,forinstance,whengovernmentsoftwocountriesthattrademorethantheir“natural”leveloftrademaybeinducedtoformaPTA,asthereislessprobabilityoftradediversion.Inthiscase,thePTAcoefficientswillbeupwardbiased.
54 Specificallyweestimateafixed-effectgravityregression:In(xijt )= aij + ait + ajt + β1(PTAijt * DEEPNESSij )+ εijt wherexijtrepresentstheimportsinpartsandcomponentsfromcountryitocountryjintimet;αijarefixedeffectscapturingcountry-pairspecificvariablessuchasdistanceorthefactthatcountriessharethesameborderorthesamelanguage;αitandαjtarereporterandpartnertimespecificfixedeffectsandcapturefactorssuchasthesizeofacountryoritsmultilateraltraderesistance.β1 isthecoefficientofourinterestanditcapturestheeffectofdeepintegrationontrade.Finally,εijtistheerrorterm.
55 Foradescriptionoftheprosandconsofalternativemeasuresofinternationalfragmentationofproduction,seeWorldTradeOrganization(WTO)(2008),Box14.
56 ForaclassificationofgoodsbelongingtothecategorypartsandcomponentsseeSectionB.3
57 SeepaperssuchasBaierandBergstrand(2004)andBergstrandetal.(2010).
58 Specificallyweregressthefollowingequation:DEPTHij = a + β1(PC_shr)ij + β2Xij + εij wherePc_shrijistheaverageshareoftradeinintermediatesovertotaltradebetweencountriesiandjbetween1980andtheyearbeforetheagreementissignedandXisavectorofcontrolvariablesfortheeconomicdeterminantsofPTAsas(i)theeconomicsizeoftheinvolvedcountries(representedbythesumofthelogsofrealGDPofthetwocountries,GDPSUM);(ii)theeconomicsimilaritybetweenthetwocountries(representedthelogoftheproductofcountryishareofbothcountries’realGDPwithcountryjshare);(iii)thedifferenceintherelativefactorendowments(representedbytheabsolutevalueofthelogdifferencebetweencountries’percapitaGDP,GDPDIF);(iv)itssquarevalues(SQGDPDIF);(v)distanceand(vi)remoteness.
59 Includedinthiscategoryareindustriesthatmanufacturegeneralmachinery,electricalmachinery,transportequipment,andprecisionmachinery.
60 Forthisspecificcalculation,developingcountriesaredefinedasallcountrieslessAustralia,NewZealand,Canada,theUnitedStates,theEuropeanFreeTradeAgreement(EFTA)membersandEC-9(France,Germany,Italy,UnitedKingdom,Ireland,Denmark,Belgium,LuxembourgandNetherlands).
61 VietNamdidnotbecomeamemberuntil1995.LaoPDRandMyanmarbecamemembersin1998;whileCambodiabecameamemberin1999.

WOrld Trade repOrT 2011
156
62 Onecannot,ofcourse,discountthepossibilitythatothermotivationsmayhavealsoplayedarole.GriswoldandIkenson(2004),forinstance,havearguedthattheCAFTA-DR-USagreementenhancesimportantUSforeignpolicygoalsinaregionthathasexperiencedseverecivilstrifeintherecentpast.
63 CentralAmericaincludesBelize,CostaRica,ElSalvador,Guatemala,Honduras,NicaraguaandPanama.
64 ThisdiscussionisbasedonHartzenberg(2011).
65 Angola,Botswana,Lesotho,Malawi,Mozambique,Swaziland,Tanzania,ZambiaandZimbabwe.
66 Thefreetradeagreementadoptedin2008hasnotyetbeenfullyimplementedandataministerialtaskforcemeetinginMarch2010itwasdecidedtopostponetheestablishmentofthecustomsunion,withoutcommittingtoaspecificdeadline.
67 TheEACwasfoundedwhenthepresidentsofKenya,TanzaniaandUgandasignedtheCommunity’streatyin1999.BurundiandRwandahavesincejoinedtheEAC.AprotocoltopreparethewaytowardsacustomsunionwassignedinMarch2004,andacommonmarketprotocolwassignedinJune2010.ThecurrentEACisarevivalofanearlierpost-independencearrangement,alsotheEastAfricanCommunity,whichwasinitiatedbytheEastAfricanTreatyforCooperationsignedin1967.ThisEACcollapsedin1977.
68 AtripartitesummitoftheHeadsofStateandGovernmentofCOMESA,SADCandEACcountrieswasheldinKampala,Uganda,on22October2008.TheSummitapprovedtheexpeditiousestablishmentofafreetradeareaencompassingthememberstatesofthethreeagreements.IntegratingthethreeregionalcommunitiesisseenasanimportantstepinbuildingtheAfricanEconomicCommunityenvisagedintheAbujaTreaty.
69 CollierandVenables(2008)makethepointthatlargesocietiescanbebetterinformedthansmallsocietiesbecauseoftheexistenceofscaleeconomiesinthecommercialmedia.TheymentionthatinAfricaonly“SouthAfricacomesanywhereclosetoprovidingamarketinwhichspecialistjournalsareviable”.

II – tHe Wto AnD PReFeRentIAL tRADe AGReements
157
D. A
nA
tom
y o
F PR
eFe
Re
ntIA
L
tRA
De
AG
Re
em
en
ts
AppendixTableD.1: List of PtAs and results of Hms mapping
PtADate of
entry into force
member
number of provisions
Wto+ Wto-xWto+
Leg. enf.Wto-x
Leg. enf.
ANDEANCommunity 25-May-88 Developing 4 11 3 3
ASEANfreetradearea 28-Jan-92 Developing 2 0 2 0
ASEAN-Australia-NewZealand
01-Jan-10 Developed-Developing 11 8 11 5
ASEAN-India 01-Jan-10 Developing 9 0 8 0
ASEAN-Korea,Rep.of 01-Jan-10 Developing 12 11 11 8
Australia-NewZealand 01-Jan-83 Developed 8 2 6 1
Australia-Singapore 28-Jul-03 Developed-Developing 13 8 12 7
Australia-Thailand 01-Jan-05 Developed-Developing 14 8 13 5
CAFTA-DR-US 01-Mar-06 Developed-Developing 13 6 13 6
CEFTA 01-May-07 Developed-Developing 13 3 13 3
CIS 30-Dec-94 Developing 9 0 9 0
COMESA 08-Dec-94 Developing 10 19 7 4
Canada-EFTA 01-Jul-09 Developed 11 2 10 1
Canada-Peru 01-Aug-09 Developed-Developing 13 7 11 5
Chile-Australia 06-Mar-09 Developed-Developing 13 9 13 6
Chile-China 01-Oct-06 Developing 11 20 8 12
Chile-Japan 03-Sep-07 Developed-Developing 14 6 14 3
Chile-Korea,Rep.of 01-Apr-04 Developing 14 7 13 6
China-ASEAN 01-Jan-05 Developing 6 1 4 0
China-HongKong,China 01-Jan-04 Developing 5 3 5 0
China-NewZealand 10-Oct-08 Developed-Developing 13 8 13 8
China-Pakistan 01-Jul-07 Developing 9 2 9 2
China-Peru 01-Mar-10 Developing 12 13 12 2
China-Singapore 01-Jan-09 Developing 10 6 10 4
CommonEconomicZone 20-May-04 Developing 12 5 12 2
EAEC 08-Oct-97 Developing 6 8 6 8
ECEnlargement(12) 01-Jan-86 Developed 6 15 6 14
ECEnlargement(15) 01-Jan-95 Developed 6 6 6 5
ECEnlargement(25) 01-May-04 Developed 8 16 8 16
ECEnlargement(27) 01-Jan-07 Developed 9 11 9 11
TreatyofRome 01-Jan-58 Developed 10 12 10 9
EU-Albania 01-Dec-06 Developed-Developing 11 31 10 8
EU-Algeria 01-Sep-05 Developed-Developing 9 27 8 5
EU-BosniaHerzegovina 01-Jul-08 Developed-Developing 9 2 9 2
EU-CARIFORUM 01-Nov-08 Developed-Developing 13 14 13 7
EU-Cameroon 01-Oct-09 Developed-Developing 11 5 7 2
EU-Chile 01-Feb-03 Developed-Developing 13 27 13 4
EU-Croatia 01-Mar-02 Developed-Developing 12 29 10 4
EU-Côted'Ivoire 01-Jan-09 Developed-Developing 8 4 6 0
EU-Egypt 01-Jun-04 Developed-Developing 10 25 9 3
EU-FYRMacedonia 01-Jun-01 Developed-Developing 12 29 10 5
appendix tables

WOrld Trade repOrT 2011
158
AppendixTableD.1: List of PtAs and results of Hms mapping (continued)
PtADate of
entry into force
member
number of provisions
Wto+ Wto-xWto+
Leg. enf.Wto-x
Leg. enf.
EU-FaroeIslands 01-Jan-97 Developed 5 2 5 1
EU-Iceland 01-Apr-73 Developed 6 1 6 1
EU-Jordan 01-May-02 Developed-Developing 13 20 9 5
EU-Lebanon 01-Mar-03 Developed-Developing 8 3 8 2
EU-Montenegro 01-Jan-08 Developed-Developing 11 2 10 2
EU-Morocco 01-Mar-00 Developed-Developing 10 18 9 4
EU-Norway 01-Jul-73 Developed 6 1 6 1
EU-OverseasTerritories 01-Jan-71 Developed-Developing 8 17 7 6
EU-PalestinianAuthority 01-Jul-97 Developed-Developing 11 20 8 3
EU-SouthAfrica 01-Jan-00 Developed-Developing 10 26 8 2
EU-SwitzerlandLiechtenstein
01-Jan-73 Developed 6 1 6 1
EU-Syria 01-Jul-77 Developed-Developing 4 4 4 1
EU-Tunisia 01-Mar-98 Developed-Developing 11 20 9 4
EU-Turkey 01-Jan-96 Developed-Developing 10 4 9 3
ECOWAS 24-Jul-93 Developing 7 13 5 3
EFTA-Israel 01-Jan-93 Developed-Developing 9 4 8 2
EFTA-Korea 01-Sep-06 Developed-Developing 13 4 13 4
EU-SanMarino 01-Apr-02 Developed 4 3 4 1
EU-Serbia 01-Feb-10 Developed-Developing 9 3 9 2
GCC 01-Jan-03 Developing 5 8 4 4
India-Singapore 01-Aug-05 Developing 11 7 11 5
Japan-ASEAN 01-Dec-08 Developed-Developing 9 10 9 10
Japan-Indonesia 01-Jul-08 Developed-Developing 9 8 9 4
Japan-Malaysia 13-Jul-06 Developed-Developing 10 6 10 5
Japan-Mexico 01-Apr-05 Developed-Developing 12 9 12 9
Japan-Philippines 11-Dec-08 Developed-Developing 11 8 9 5
Japan-Singapore 30-Nov-02 Developed-Developing 12 7 11 3
Japan-Switzerland 01-Sep-09 Developed 12 8 12 7
Japan-Thailand 01-Nov-07 Developed-Developing 9 9 9 4
Japan-VietNam 01-Oct-09 Developed-Developing 12 5 12 4
Korea,Republicof-India 01-Jan-10 Developing 14 11 13 4
Korea,Republicof-Singapore
02-Mar-06 Developing 12 9 12 4
MERCOSUR 29-Nov-91 Developing 9 3 9 3
MERCOSUR-India 01-Jun-09 Developing 7 0 7 0
NAFTA 01-Jan-94 Developed-Developing 14 8 14 7
PAFTA 01-Jan-98 Developing 2 0 2 0
RussianFederation-Ukraine
21-Feb-94 Developing 4 1 4 0
SACU 15-Jul-04 Developing 7 4 4 0
SAFTA 01-Jan-06 Developing 4 0 2 0
SADC 01-Sep-00 Developing 11 1 10 0
Turkey-EFTA 01-Apr-92 Developed-Developing 11 2 10 2

II – tHe Wto AnD PReFeRentIAL tRADe AGReements
159
D. A
nA
tom
y o
F PR
eFe
Re
ntIA
L
tRA
De
AG
Re
em
en
ts
AppendixTableD.1: List of PtAs and results of Hms mapping (continued)
PtADate of
entry into force
member
number of provisions
Wto+ Wto-xWto+
Leg. enf.Wto-x
Leg. enf.
US-Australia 01-Jan-05 Developed 14 8 14 6
US-Bahrain 01-Aug-06 Developed-Developing 12 4 12 4
US-Israel 19-Aug-85 Developed-Developing 11 0 10 0
US-Jordan 17-Dec-01 Developed-Developing 6 5 5 4
US-Morocco 01-Jan-06 Developed-Developing 14 6 13 6
US-Oman 01-Feb-09 Developed-Developing 13 6 13 6
US-Peru 01-Feb-09 Developed-Developing 14 7 14 7
Ukraine-Belarus 11-Nov-06 Developing 6 1 6 1
Ukraine-Kazakhstan 19-Oct-98 Developing 4 1 4 1
Ukraine-Turkmenistan 04-Nov-95 Developing 4 1 4 1
Source:WTOSecretariat.

WOrld Trade repOrT 2011
160
AppendixTableD.2: Acronyms and membersAcronyms member Acronyms member
ARG Argentina KNA SaintKittsandNevis
ATG AntiguaandBarbuda KOR Rep.ofKorea
AUS Australia LCA St.Lucia
BHR Bahrain LIE Liechtenstein
BLZ Belize MAC Macao,China
BRA Brazil MAR Morocco
BRB Barbados MEX Mexico
BRN BruneiDarussalam MYS Malaysia
CAN Canada NIC Nicaragua
CHE Switzerland NOR Norway
CHL Chile NZL NewZealand
CHN China OMN Oman
COL Colombia PAK Pakistan
CRI CostaRica PAN Panama
DMA Dominica PER Peru
DOM DominicanRep. PHL Philippines
EC EuropeanUnion PRY Paraguay
GRD Grenada SGP Singapore
GTM Guatemala SLV ElSalvador
GUY Guyana SUR Suriname
HKG HongKong,China CHT ChineseTaipei
HND Honduras THA Thailand
IDN Indonesia TTO TrinidadandTobago
IND India URY Uruguay
ISL Iceland USA USA
JAM Jamaica VCT SaintVincentandtheGrenadines
JOR Jordan VNM VietNam
JPN Japan
Source:WTOSecretariat.

II – tHe Wto AnD PReFeRentIAL tRADe AGReements
161
D. A
nA
tom
y o
F PR
eFe
Re
ntIA
L
tRA
De
AG
Re
em
en
ts
AppendixTableD.3: List of services agreements in the database used for this reportKorea(Rep.)-India Japan-Thailand EFTA-Chile
ASEAN-Korea(Rep.) Chile-Japan Korea(Rep.)-Chile
ASEAN-Australia-NewZealand Chile-China EU-Chile
Honduras-ElSalvador-Taipei,Chinese
India-Singapore Chile-ElSalvador
Peru-China Panama-Singapore China-Macao,China
Japan-VietNam US-Bahrain China-HongKong,China
Japan-Switzerland EFTA-Korea(Rep.) US-Singapore
Chile-Colombia CostaRica-Mexico US-Chile
Canada-Peru Japan-Malaysia Singapore-Australia
Panama-Taipei,Chinese Mexico-Honduras EFTA-Singapore
Nicaragua-Taipei,Chinese Jordan-Singapore Japan-Singapore
China-NewZealand Mexico-Guatemala Chile-CostaRica
Australia-Chile Mexico-ElSalvador US-Jordan
China-SingaporeDominicanRep.-Cent.America-USA
NewZealand-Singapore
US-Peru Korea(Rep.)-Singapore EFTA-Mexico
US-Oman US-Morocco Chile-Mexico
Japan-Philippines Thailand-NewZealand EU-Mexico
EU-CARIFORUM Mexico-Nicaragua US-Korea(Rep.)
BruneiDarussalam-Japan ASEAN-China Mercosur(6thnegotiatedround)
Japan-Indonesia Japan-Mexico ASEAN(7thpackage)
Panama-Chile Panama-ElSalvador US-Colombia
Pakistan-Malaysia Thailand-Australia US-Panama
Pakistan-China US-Australia
Source:WTOSecretariat.

WOrld Trade repOrT 2011
162
AppendixTableD.4: the effects of deep integration on production networks
Dependent variabletrade in parts and components (log)
(1) (2) (3) (4) (5) (6) (7)
PTAij 0.299***
(0.020)
PTAij*Numberofprovisions
0.0165***
(0.001)
PTAij*NumberofWTO-Xprovisions
0.0265***
(0.002)
PTAij*NumberofWTO+provisions
0.0310***
(0.002)
PTAij*PrincipalComponentAnalysisIndex
0.0773***
(0.007)
PTAij*TBTIndex 0.0138***
(0.001)
PTAij*CompetitionPolicyIndex
0.0308***
(0.002)
Countrypairfixedeffects
yes yes yes yes yes yes yes
Country-timefixedeffects
yes yes yes yes yes yes yes
Observations 60,473 60,473 60,473 60,473 60,473 27,524 32,733
R-squared 0.328 0.328 0.327 0.327 0.327 0.434 0.414
Numberofcountrypairs
3,485 3,485 3,485 3,485 3,485 1,386 1,657
Note:Standarderrorsinparentheses***p<0.01,**p<0.05,*p<0.1
Source:WTOSecretariatestimates.
AppendixTableD.5: the effects of trade in parts and components on deep integration
DependentVariable NumberofProvisionNumberofWTO-X
provisionNumberofWTO+
provisionPrincipalComponent
AnalysisIndex
Shareoftradeinpartsandcomponentsovertotaltrade(ln)
0.0880***(0.028)
0.0107(0.024)
0.0630***(0.017)
0.0234***(0.006)
CountryfixedeffectsObservationsR-squared
yes2,5720.962
yes2,5720.955
yes2,5720.917
yes2,5720.927
Note:Standarderrorsinparentheses***p<0.01,**p<0.05,*p<0.1.distanceandremoteness.Othercontrolvariablesincludedintheregression:GDPSUM,GDPSIM,GDPDIF,SQGDPDIF
Source:WTOSecretariatestimations.

II – tHe Wto AnD PReFeRentIAL tRADe AGReements
163
D. A
nA
tom
y o
F PR
eFe
Re
ntIA
L
tRA
De
AG
Re
em
en
ts
AppendixFigureD.1: variations in the level of commitments offered in different PtAs: Australia, Chile, Republic of korea, singapore and united states
Note:ThisFigureusesanindexthatcapturesimprovementsin“partial”commitmentsfromoneagreementtothenext.GATSstandsforGATScommitmentsandoffer.Scoresof0,0.5and1aregivenforuncommitted,partiallycommittedandfullycommittedsubsectors,respectively,formodes 1 and 3. It also captures improvements in partial commitments by attaching to them between 0.5 and 1. This Figure underscoresdifferencesbetween thecommitmentsamemberundertakes indifferentPTAs,but isnotbestused tocompareGATS+commitments thatdifferentmembersundertake.Theindexisbroughtontoa0-100scale,with100representingfullcommitmentsinallsubsectorsandrelevantmodes.ThelegendoftheacronymsforthemembersisprovidedinAppendixTableD.2.
Source:FromupdateddataMarchettiandRoy(2008).
0 2010 30 40 50 60 70 80 90 100
USA-GATS
USA-SGP
USA-PER
USA-PAN
USA-OMN
USA-MAR
USA-KOR
USA-JOR
USA-DR-CAFTA
USA-COL
USA-CHL
USA-BHR
SGP-PAN
SGP-USA
SGP-NZL
SGP-KOR(ASEAN)
SGP-KOR
SGP-JPN
SGP-JOR
SGP-IND
USA-AUS
SGP-GATS
SGP-CHN(ASEAN)
SGP-EFTA
SGP-CHN
SGP-AUS
SGP-ASEAN
KOR-GATS
KOR-USA
KOR-SGP
KOR-IND
KOR-EFTA
KOR-CHL
KOR-ASEAN
CHL-GATS
CHL-USA
CHL-SLV
CHL-KOR
CHL-JPN
CHL-EFTA
CHL-EC
CHL-CRI
CHL-COL
AUS-GATS
AUS-USA
AUS-THA
AUS-SGP
AUS-ASEAN