CYTOKINE-MEDIATED REGULATION OF CATECHOLAMINE …. Byrne... · Catecholamines function in the...
148
CYTOKINE-MEDIATED REGULATION OF CATECHOLAMINE BIOSYNTHETIC ENZYMES IN ADRENAL CHROMAFFIN CELLS by COLLIN J BYRNE Thesis submitted in partial fulfillment of the requirements for the degree of Master of Science (MSc) in Biology Faculty of Graduate Studies Laurentian University Sudbury, Ontario, Canada © COLLIN J BYRNE, 2015
Transcript of CYTOKINE-MEDIATED REGULATION OF CATECHOLAMINE …. Byrne... · Catecholamines function in the...
CYTOKINE-MEDIATED REGULATION OF CATECHOLAMINE
BIOSYNTHETIC ENZYMES IN ADRENAL CHROMAFFIN CELLS
by
COLLIN J BYRNE
Thesis submitted in partial fulfillment
of the requirements for the degree of
Master of Science (MSc) in Biology
Faculty of Graduate Studies
Laurentian University
Sudbury, Ontario, Canada
© COLLIN J BYRNE, 2015

ii
THESIS DEFENCE COMMITTEE/COMITÉ DE SOUTENANCE DE THÈSE
Laurentian Université/Université Laurentienne
Faculty of Graduate Studies/Faculté des études supérieures
Title of Thesis
Titre de la thèse CYTOKINE-MEDIATED REGULATION OF CATECHOLAMINE
BIOSYNTHETIC ENZYMES IN ADRENAL
CHROMAFFIN CELLS
Name of Candidate
Nom du candidat Byrne, Collin
Degree
Diplôme Master of Science
Department/Program Date of Defence
Département/Programme Biology Date de la soutenance December 15, 2015
APPROVED/APPROUVÉ
Thesis Examiners/Examinateurs de thèse:
TC Tai
(Supervisor/Directeur(trice) de thèse)
Dr. Aseem Kumar
(Co-supervisor/Co-directeur(trice) de thèse)
Dr. Kabwe Nkongolo
(Committee member/Membre du comité)
Approved for the Faculty of Graduate Studies
Approuvé pour la Faculté des études supérieures
Dr. David Lesbarrères
Monsieur David Lesbarrères
Dr. H. Seo Acting Dean, Faculty of Graduate Studies
(External Examiner/Examinateur externe) Doyen intérimaire, Faculté des études
supérieures
ACCESSIBILITY CLAUSE AND PERMISSION TO USE
I, Collin Byrne, hereby grant to Laurentian University and/or its agents the non-exclusive license to archive
and make accessible my thesis, dissertation, or project report in whole or in part in all forms of media, now
or for the duration of my copyright ownership. I retain all other ownership rights to the copyright of the
thesis, dissertation or project report. I also reserve the right to use in future works (such as articles or books)
all or part of this thesis, dissertation, or project report. I further agree that permission for copying of this
thesis in any manner, in whole or in part, for scholarly purposes may be granted by the professor or
professors who supervised my thesis work or, in their absence, by the Head of the Department in which my
thesis work was done. It is understood that any copying or publication or use of this thesis or parts thereof
for financial gain shall not be allowed without my written permission. It is also understood that this copy is
being made available in this form by the authority of the copyright owner solely for the purpose of private
study and research and may not be copied or reproduced except as permitted by the copyright laws without
written authority from the copyright owner.
iii
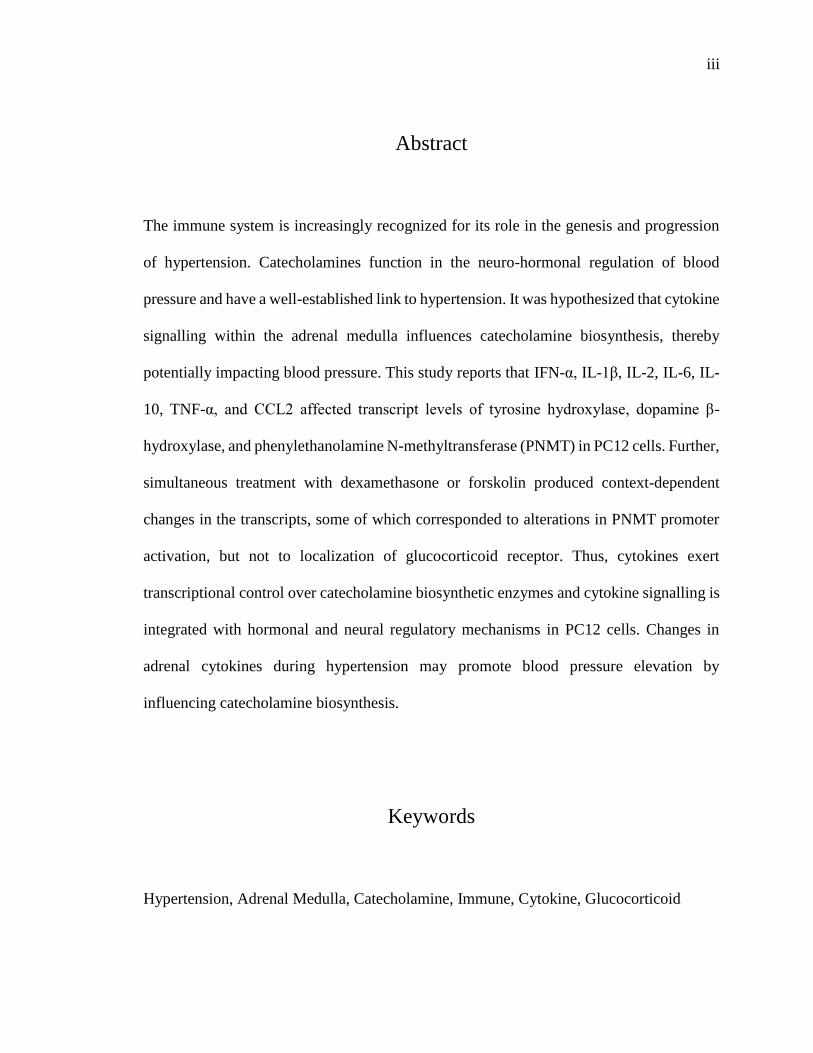
Abstract
The immune system is increasingly recognized for its role in the genesis and progression
of hypertension. Catecholamines function in the neuro-hormonal regulation of blood
pressure and have a well-established link to hypertension. It was hypothesized that cytokine
signalling within the adrenal medulla influences catecholamine biosynthesis, thereby
potentially impacting blood pressure. This study reports that IFN-α, IL-1β, IL-2, IL-6, IL-
10, TNF-α, and CCL2 affected transcript levels of tyrosine hydroxylase, dopamine β-
hydroxylase, and phenylethanolamine N-methyltransferase (PNMT) in PC12 cells. Further,
simultaneous treatment with dexamethasone or forskolin produced context-dependent
changes in the transcripts, some of which corresponded to alterations in PNMT promoter
activation, but not to localization of glucocorticoid receptor. Thus, cytokines exert
transcriptional control over catecholamine biosynthetic enzymes and cytokine signalling is
integrated with hormonal and neural regulatory mechanisms in PC12 cells. Changes in
adrenal cytokines during hypertension may promote blood pressure elevation by
influencing catecholamine biosynthesis.
Keywords
Hypertension, Adrenal Medulla, Catecholamine, Immune, Cytokine, Glucocorticoid

iv
Acknowledgments
I would like to sincerely thank Dr. T.C. Tai and Dr. Aseem Kumar for accepting me as their
graduate student and for their knowledge, expertise, and dedication that has contributed
greatly to my growth as a scientist. I would also like to thank Dr. Kabwe Nkongolo as a
member of my supervisory committee for his guidance and enthusiasm. Most of all, I would
like to express my appreciation to Dr. Sandhya Khurana for her guidance in teaching the
molecular techniques carried out in this thesis as well as for her invaluable encouragement
and support, all of which has helped make this research possible. I would like to thank the
past and present students of Tai Lab: Phong Nguyen, Julie Grandbois, Amanda
Hollingsworth, Jeremy Lamothe, Chad Williamson, Stephanie Mercier, and Erika
McDonald, for their friendship, cooperation and thoughtful discussion. For technical
assistance and training, I would also like to thank Paul Michael, Bruce Weaver, Dr. Carita
Lanner, Derek Edwardson, and Rashmi Narendrula. I would like to thank the NOSM staff
members, Sergio Fabris, Charlie Armstrong, Joe Eibl, and many others for keeping the lab
running during the time that I completed my research. Finally, studentship support from
the Natural Sciences and Engineering Research Council of Canada is gratefully
acknowledged.
v
Table of Contents
Abstract .............................................................................................................................. iii
Keywords ........................................................................................................................... iii
Acknowledgments ............................................................................................................... iv
Table of Contents ................................................................................................................. v
List of Tables ................................................................................................................... viii
List of Figures ..................................................................................................................... ix
List of Abbreviations ........................................................................................................ xii
1 - Introduction .................................................................................................................... 1
1.1 - Hypertension and the Roles of Catecholamines and Inflammation ......................... 1
1.1.1 - Hypertension ..................................................................................................... 1
1.1.2 - Regulation of Blood Pressure ........................................................................... 4
1.1.3 - Hypertension and Catecholamine Biosynthesis ............................................... 7
1.1.4 - Hypertension and Inflammation ..................................................................... 12
1.2 - The Major Mechanisms of Adrenal Medullary Regulation ................................... 18
1.2.1 - Hypothalamic-Pituitary-Adrenal Axis ............................................................ 20
1.2.2 - Sympathetic-Adrenal Axis.............................................................................. 23
1.3 - Cytokine-Mediated Regulation of Catecholamine Biosynthesis ........................... 27
1.3.1 - Cytokine Expression by Adrenal Chromaffin Cells ....................................... 29
1.3.2 - Cytokine Signalling in Chromaffin Cells ....................................................... 33
vi
1.3.3 - Cytokine Modulation of Glucocorticoid Signalling in Chromaffin Cells ...... 41
1.3.2 - Cytokine Modulation of Neurotransmitter and cAMP Signalling in Chromaffin
Cells ........................................................................................................................... 46
1.4 - Hypothesis and Objectives ..................................................................................... 47
1.4.1 - Hypothesis ...................................................................................................... 47
1.4.2 - Objectives ....................................................................................................... 48
2 - Methods ........................................................................................................................ 49
2.1 - Cell Culture ............................................................................................................ 49
2.2 - Cell Treatments ...................................................................................................... 50
2.2.1 - Cytokine Sources, Preparation, and Application ............................................ 50
2.2.2 - Dexamethasone and Forskolin Sources, Preparation, and Application .......... 52
2.3 - RNA extraction, cDNA Synthesis and RT-qPCR .................................................. 53
2.3.1 - RNA Extraction .............................................................................................. 53
2.3.2 - DNAse Treatment and cDNA Synthesis ........................................................ 53
2.3.3 - Quantitative Real Time PCR .......................................................................... 54
2.5 - Western Blot .......................................................................................................... 57
2.5.1 - Protein Extraction and Quantification ............................................................ 57
2.5.2 - Sample Preparation ......................................................................................... 58
2.5.3 - Gel Casting ..................................................................................................... 58
2.5.4 - Protein Transfer .............................................................................................. 59
vii
2.5.4 - Western Blot ................................................................................................... 59
2.5.5 - Densitometry .................................................................................................. 60
2.4 - Analysis of PNMT Promoter Activation ............................................................... 60
2.4.1 - Transformation and Plasmid Preparation ....................................................... 60
2.4.2 - Transfection and Luciferase Assay ................................................................. 61
2.6 - Microscopy ............................................................................................................ 62
2.7 - Data Analysis ......................................................................................................... 63
3 - Results .......................................................................................................................... 64
3.1 - Effects of Cytokines on Expression of Catecholamine Biosynthetic Enzymes ..... 64
3.2 - Cytokines as Modifiers of Hormonal and Neural Activation of Catecholamine
Biosynthetic Enzyme Gene Expression ......................................................................... 72
3.3 - Effects of Cytokines on Glucocorticoid Activation of the PNMT Promoter ......... 81
3.4 - Effect of Cytokines on Localization of Glucocorticoid Receptor.......................... 83
3.4.1 - Western Blot Analysis .................................................................................... 83
3.4.2 - Microscopy ..................................................................................................... 85
4 - Discussion ..................................................................................................................... 89
5 - Conclusion .................................................................................................................. 100
6 - Future Directions ........................................................................................................ 101
Appendicies ..................................................................................................................... 102
Bibliography .................................................................................................................... 103
viii
List of Tables
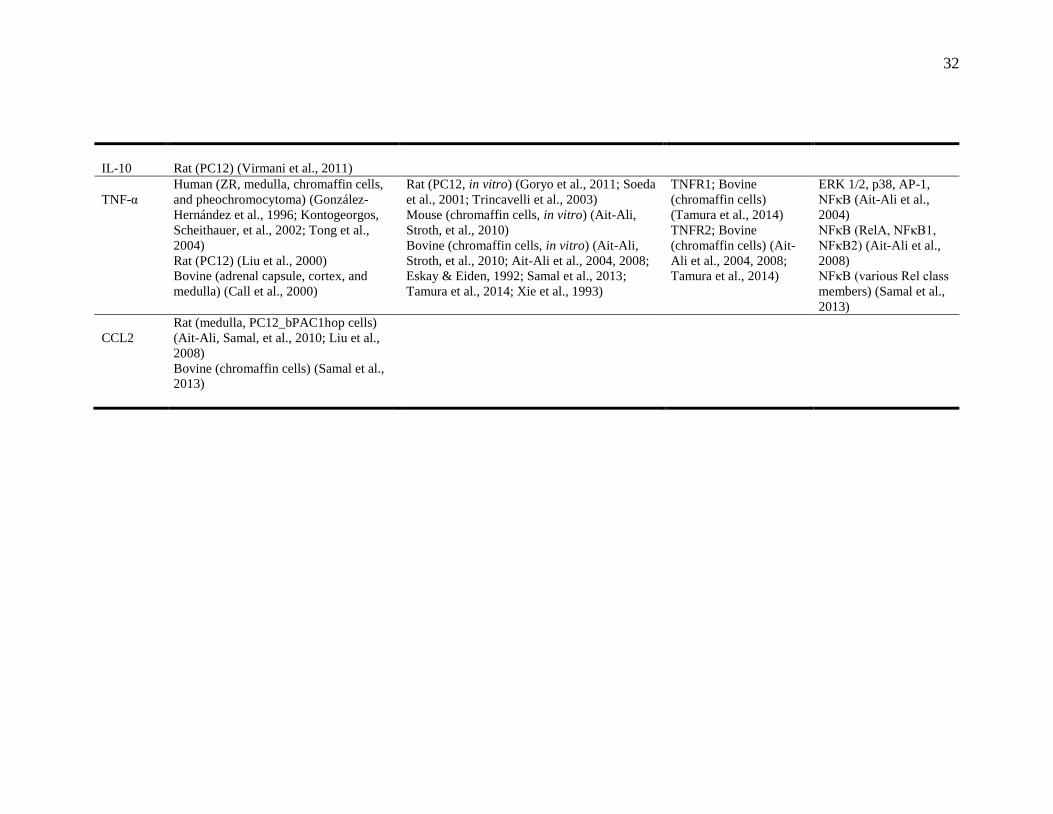
Table 1: Cytokine expression, responsiveness, and signalling observed in adrenal gland..
............................................................................................................................................ 31
Table 2: Buffer solutions used for resuspending cytokines and cytokine doses. .............. 51
Table 3: Primer specification and polymerase chain reaction set-up. ............................... 56
ix
List of Figures
Figure 1: Genetic complexity of blood pressure regulation.. .............................................. 3
Figure 2: Schematic of the general mechanisms for blood pressure regulation ................. 5
Figure 3: Catecholamine biosynthetic pathway.. ................................................................ 8
Figure 4: Possible inflammatory processes contributing to the progression of
hypertension.. ..................................................................................................................... 16
Figure 5: Hormonal and neural mechanisms regulating adrenal medullary chromaffin cells.
............................................................................................................................................ 19
Figure 6: Simplified schematic of neural, hormonal, and immune signalling pathways
activated in adrenal chromaffin cells. ................................................................................ 39
Figure 7 (A-D): Cytokine regulation of basal tyrosine hydroxylase (TH) expression in
PC12 cells.. ........................................................................................................................ 66
Figure 7 (E-G): Cytokine regulation of basal tyrosine hydroxylase (TH) expression in
PC12 cells.. ........................................................................................................................ 67
Figure 8 (A-D): Cytokine regulation of basal dopamine β-hydroxylase (DBH) expression
in PC12 cells.. .................................................................................................................... 68
Figure 8 (E-G): Cytokine regulation of basal dopamine β-hydroxylase (DBH) expression
in PC12 cells.. .................................................................................................................... 69
Figure 9 (A-D): Cytokine regulation of basal phenylethanolamine N-methyltransferase
(PNMT) expression in PC12 cells. .................................................................................... 70
Figure 9 (E-G): Cytokine regulation of basal phenylethanolamine N-methyltransferase
(PNMT) expression in PC12 cells. .................................................................................... 71
x
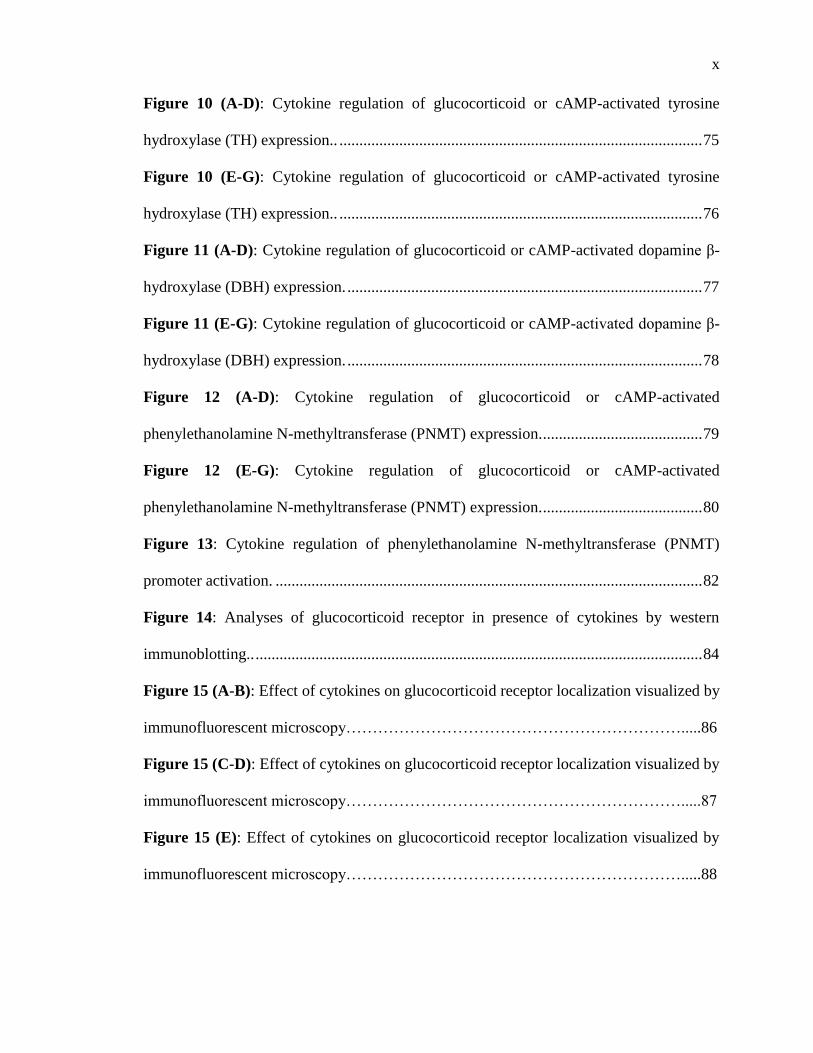
Figure 10 (A-D): Cytokine regulation of glucocorticoid or cAMP-activated tyrosine
hydroxylase (TH) expression.. ........................................................................................... 75
Figure 10 (E-G): Cytokine regulation of glucocorticoid or cAMP-activated tyrosine
hydroxylase (TH) expression.. ........................................................................................... 76
Figure 11 (A-D): Cytokine regulation of glucocorticoid or cAMP-activated dopamine β-
hydroxylase (DBH) expression. ......................................................................................... 77
Figure 11 (E-G): Cytokine regulation of glucocorticoid or cAMP-activated dopamine β-
hydroxylase (DBH) expression. ......................................................................................... 78
Figure 12 (A-D): Cytokine regulation of glucocorticoid or cAMP-activated
phenylethanolamine N-methyltransferase (PNMT) expression. ........................................ 79
Figure 12 (E-G): Cytokine regulation of glucocorticoid or cAMP-activated
phenylethanolamine N-methyltransferase (PNMT) expression. ........................................ 80
Figure 13: Cytokine regulation of phenylethanolamine N-methyltransferase (PNMT)
promoter activation. ........................................................................................................... 82
Figure 14: Analyses of glucocorticoid receptor in presence of cytokines by western
immunoblotting.. ................................................................................................................ 84
Figure 15 (A-B): Effect of cytokines on glucocorticoid receptor localization visualized by
immunofluorescent microscopy……………………………………………………….....86
Figure 15 (C-D): Effect of cytokines on glucocorticoid receptor localization visualized by
immunofluorescent microscopy……………………………………………………….....87
Figure 15 (E): Effect of cytokines on glucocorticoid receptor localization visualized by
immunofluorescent microscopy……………………………………………………….....88

xi
List of Appendices
Appendix A: Summary of significant results..................................................................102

xii
List of Abbreviations
AADC Aromatic amino acid decarboxylase
ACh Acetylcholine
ACTH Adrenocorticotropic hormone
Ang Angiotensin
AP-1 Activator protein 1
AP-2 Activator protein 2
bp Base pair
CA Catecholamine
cAMP Cyclic adenosine monophosphate
CBP CREB-binding protein
CNS Central nervous system
CRE cAMP response element
CRH Corticotropin-releasing hormone
CTM Charcoal treated media
CVD Cardiovascular disease
DA Dopamine
DBH Dopamine β-hydroxylase
DBP Diastolic blood pressure
Dex Dexamethasone
DMEM Dulbecco’s Modified Eagle’s Medium

xiii
DNA Deoxyribonucleic acid
DOCA Deoxycorticosterone acetate
ECL Enhanced chemiluminescence
Egr1 Early growth response 1
Epac Exchange protein directly activated by cAMP
Epi Epinephrine
ERK Extracellular signal regulated kinases
Forsk Forskolin
GC Glucocorticoid
gp Glycoprotein
GRE Glucocorticoid response element
GRIP Glucocorticoid receptor-interacting protein
HPA Hypothalamic-pituitary-adrenal
HRP Horseradish peroxidase
IFNAR IFN-α receptor
IL-1R IL-1 receptor
IL-6R IL-6 receptor
IRF Interferon regulatory factor
JAK Janus kinase
LB Luria Bertani
LDCV Large dense core vesicle
L-DOPA L-3,4-dihydroxyphenylalanine
MAPK Mitogen-activated protein kinase
xiv
mRNA Messenger ribonucleic acid
NE Norepinephrine
NO Nitric oxide
PACAP Pituitary adenylate cyclase-activating peptide
PKA Protein kinase A
PKC Protein kinase C
PLC Phospholipase C
PNMT Phenylethanolamine N-methyltransferase
RAAS Renin-angiotensin-aldosterone system
rpm Revolutions per minute
RT-qPCR Quantitative reverse transcription polymerase chain reaction
SA Sympathetic-adrenal
SBP Systolic blood pressure
SEM Standard error of the mean
Ser Serine
SHR Spontaneously hypertensive rat
SNS Sympathetic nervous system
Sp1 Specificity protein 1
SSV Small synaptic vesicle
STAT Signal transducer and activator of transcription
TH Tyrosine hydroxylase
TNFR TNF receptor

1
1 - Introduction
1.1 - Hypertension and the Roles of Catecholamines and Inflammation
1.1.1 - Hypertension
Approximately one in five Canadian adults live with hypertension (Wilkins et al., 2010).
Hypertension is defined as chronically elevated arterial blood pressure that is greater than
or equal to 140 mm Hg mean systolic blood pressure (SBP) or 90 mm Hg mean diastolic
blood pressure (DBP). Elevated blood pressure can cause changes in arterial structure that
can increase risk of stroke, heart disease, kidney failure, and other diseases (World Health
Organization, 2009). Hypertension is a leading cause of renal failure, second only to
diabetes (Rosamond et al., 2008). Globally, high blood pressure is attributed to causing
51% of stroke and 45% of coronary heart disease (World Health Organization, 2009). The
significant health risks associated with hypertension have made it the world’s leading risk
factor for death, estimated as the cause of 13.5% of premature deaths (Lawes et al., 2008).
A majority of adults in both developing and developed countries have blood pressure that
is higher than is optimal and the risk of dying from high blood pressure is particularly great
in lower income countries (Wilkins et al., 2010; World Health Organization, 2009).
Globally, the cost attributed to blood pressure above optimal levels, including both
prehypertension and hypertension, is estimated at US$370 billion, roughly 10% of money
spent on healthcare (Gaziano et al., 2009). Most recent estimates affirm that the treatment
of hypertension is one of the most cost-effective approaches available for increasing
quality-adjusted life-years and decreasing preventable deaths (Myers, 2007).

2
Hypertension can be classified into the categories of essential (or primary) and non-
essential (or secondary) hypertension. Hypertension is diagnosed as essential when there is
no discernable underlying cause. Essential hypertension is often attributed to a combination
of genetic and environmental factors. Non-essential hypertension is directly linked to a pre-
existing medical condition such as sleep apnea, kidney damage or diseases that consist of
abnormal hormone production. Only a small minority (5-10%) of hypertension diagnoses
are classified as non-essential, leaving the remaining majority (90-95%) of diagnosis to be
classified as essential hypertension (Rimoldi et al., 2014).
Like asthma, obesity, diabetes, and a multitude of other pathophysiological conditions,
essential hypertension is a multigenic disease (see Fig. 1) that is highly influenced by
environmental factors. Multigenic traits involve multiple genes and do not have a single
recognizable pattern of inheritance as do single-locus Mendelian traits. Only a small
proportion of cases of hypertension are directly caused by individual alleles which show
distinct inheritance patterns within families. Most common genetic disorders arise as a
complex interplay of intrinsic, extrinsic, and behavioral factors which together result in
disease (O’Shaughnessy, 2001). Recent estimates of hypertension awareness and control
have demonstrated increased proportions of people who are aware of their condition, who
receive treatment, and who have controlled their blood pressure with medication (Wilkins
et al., 2010). However, despite increased awareness and an abundance of available
interventions, data from the 2007-2009 Canadian Health Measures Survey indicates that
hypertension remains uncontrolled in 34% of Canadians (Wilkins et al., 2010).
3
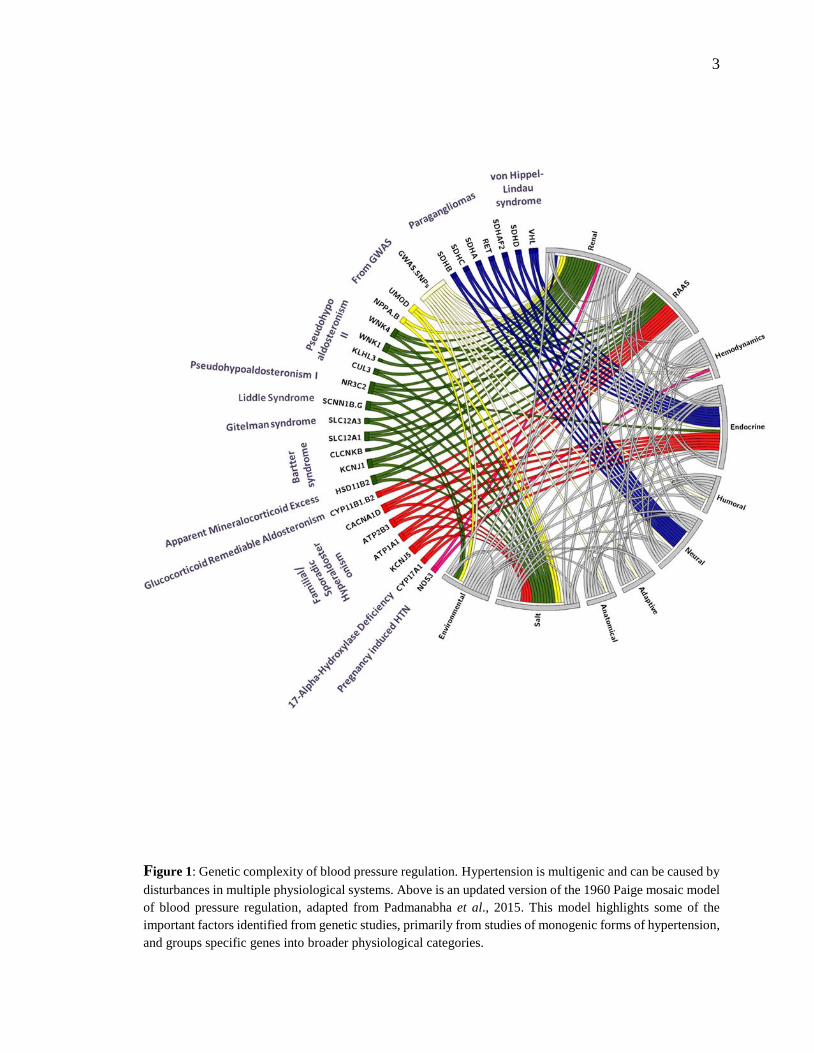
Figure 1: Genetic complexity of blood pressure regulation. Hypertension is multigenic and can be caused by
disturbances in multiple physiological systems. Above is an updated version of the 1960 Paige mosaic model
of blood pressure regulation, adapted from Padmanabha et al., 2015. This model highlights some of the
important factors identified from genetic studies, primarily from studies of monogenic forms of hypertension,
and groups specific genes into broader physiological categories.

4
1.1.2 - Regulation of Blood Pressure
Currently there is a panoply of treatments available for reducing blood pressure and
combating hypertension. This is, in part, due to the numerous physiological parameters that
influence blood pressure and that are accessible targets for treatment. Blood pressure is the
product of cardiac output and total systemic vascular resistance. These variables are
dependent on parameters such as blood volume, extracellular fluid volume, arterial and
venous compliance, and resistance to venous return (see Fig. 2). Changes in the structure
and function of kidneys, blood vessels, and the heart are regulated by neuroendocrine
feedback mechanisms and serve to control blood volume and vascular resistance (Coffman,
2011). Antihypertensive therapies must necessarily act upon the physiological mechanisms
that control cardiac output and vascular resistance in order to effectively regulate blood
pressure.
5
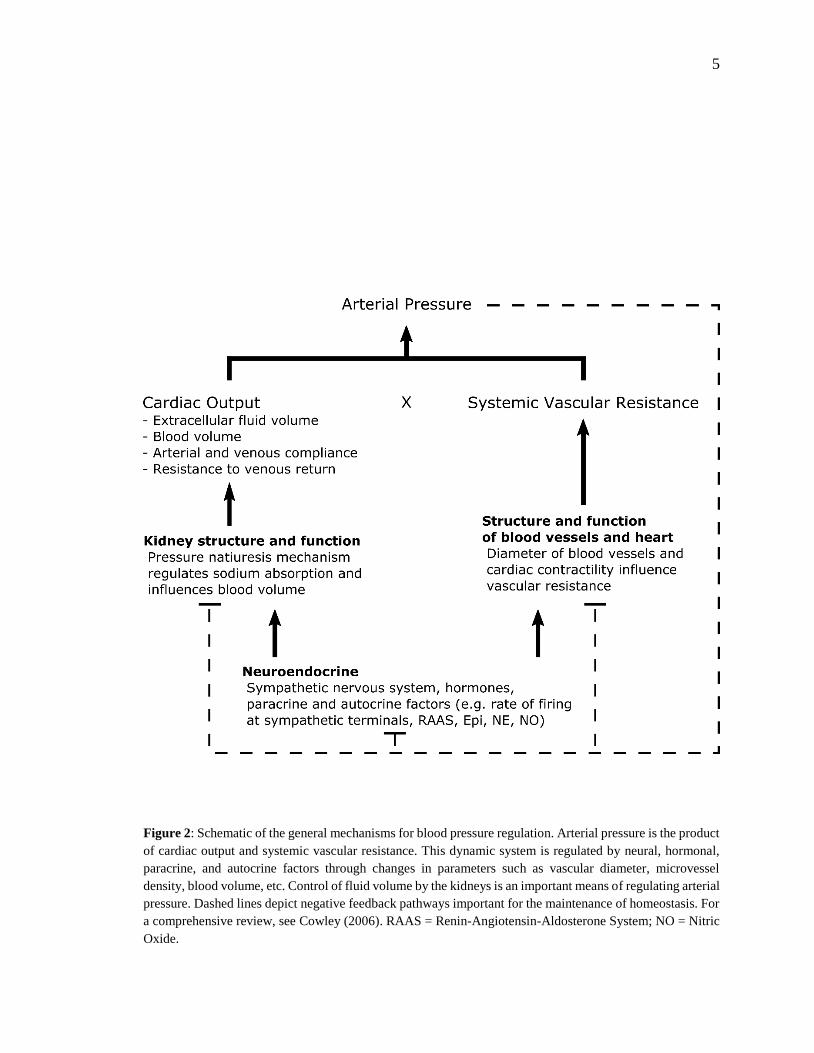
Figure 2: Schematic of the general mechanisms for blood pressure regulation. Arterial pressure is the product
of cardiac output and systemic vascular resistance. This dynamic system is regulated by neural, hormonal,
paracrine, and autocrine factors through changes in parameters such as vascular diameter, microvessel
density, blood volume, etc. Control of fluid volume by the kidneys is an important means of regulating arterial
pressure. Dashed lines depict negative feedback pathways important for the maintenance of homeostasis. For
a comprehensive review, see Cowley (2006). RAAS = Renin-Angiotensin-Aldosterone System; NO = Nitric
Oxide.
6
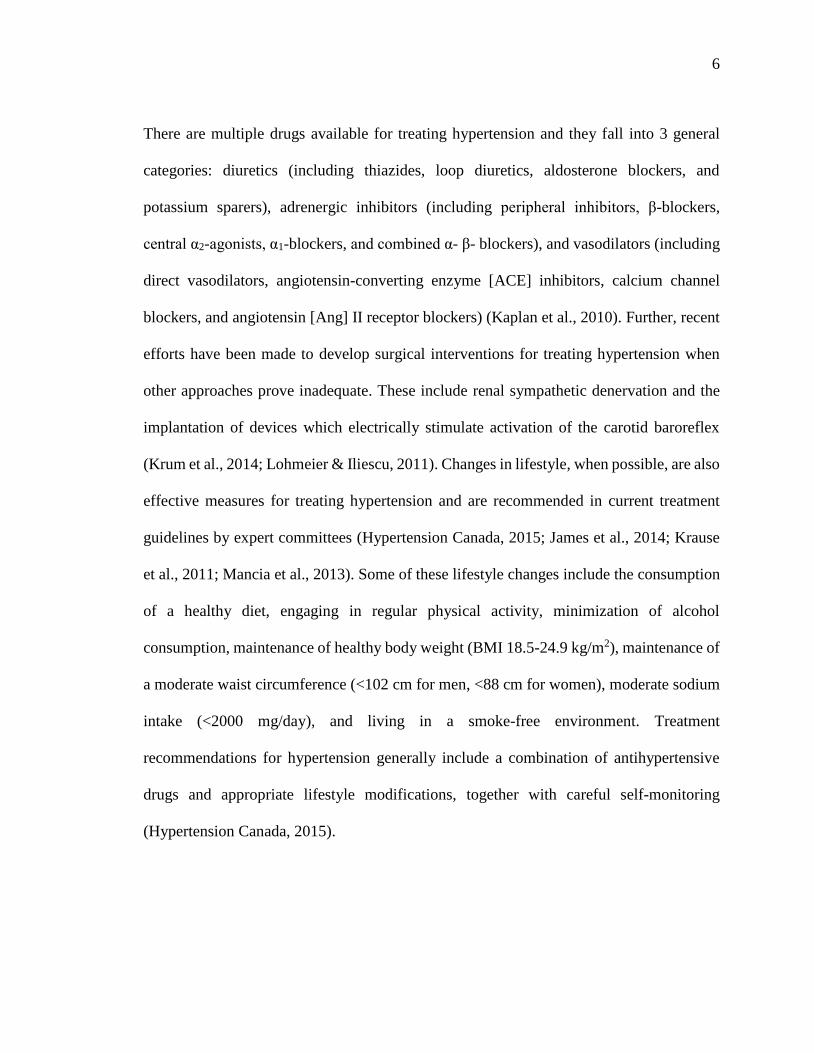
There are multiple drugs available for treating hypertension and they fall into 3 general
categories: diuretics (including thiazides, loop diuretics, aldosterone blockers, and
potassium sparers), adrenergic inhibitors (including peripheral inhibitors, β-blockers,
central α2-agonists, α1-blockers, and combined α- β- blockers), and vasodilators (including
direct vasodilators, angiotensin-converting enzyme [ACE] inhibitors, calcium channel
blockers, and angiotensin [Ang] II receptor blockers) (Kaplan et al., 2010). Further, recent
efforts have been made to develop surgical interventions for treating hypertension when
other approaches prove inadequate. These include renal sympathetic denervation and the
implantation of devices which electrically stimulate activation of the carotid baroreflex
(Krum et al., 2014; Lohmeier & Iliescu, 2011). Changes in lifestyle, when possible, are also
effective measures for treating hypertension and are recommended in current treatment
guidelines by expert committees (Hypertension Canada, 2015; James et al., 2014; Krause
et al., 2011; Mancia et al., 2013). Some of these lifestyle changes include the consumption
of a healthy diet, engaging in regular physical activity, minimization of alcohol
consumption, maintenance of healthy body weight (BMI 18.5-24.9 kg/m2), maintenance of
a moderate waist circumference (<102 cm for men, <88 cm for women), moderate sodium
intake (<2000 mg/day), and living in a smoke-free environment. Treatment
recommendations for hypertension generally include a combination of antihypertensive
drugs and appropriate lifestyle modifications, together with careful self-monitoring
(Hypertension Canada, 2015).
7
1.1.3 - Hypertension and Catecholamine Biosynthesis
Adrenergic inhibitors are among the most useful pharmacologic tools for treating
hypertension. Adrenergic signalling via α- and β-adrenergic receptors can influence cardiac
output and peripheral resistance. The catecholamines (CAs) dopamine (DA),
norepinephrine (NE), and epinephrine (Epi) are involved in the regulation of the
cardiovascular system. Because they are produced by neuroendocrine cells and have dual
hormone and neurotransmitter functions, these CAs are classified both as neurotransmitters
and/or neurohormones.
8
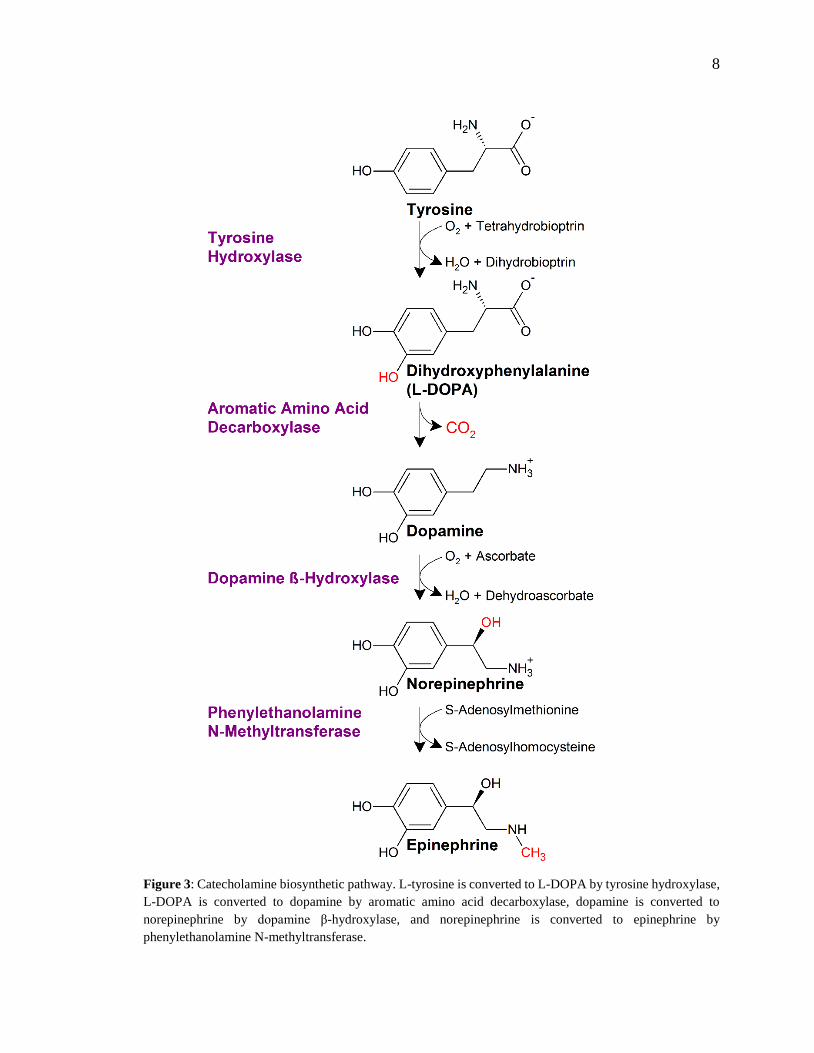
Figure 3: Catecholamine biosynthetic pathway. L-tyrosine is converted to L-DOPA by tyrosine hydroxylase,
L-DOPA is converted to dopamine by aromatic amino acid decarboxylase, dopamine is converted to
norepinephrine by dopamine β-hydroxylase, and norepinephrine is converted to epinephrine by
phenylethanolamine N-methyltransferase.
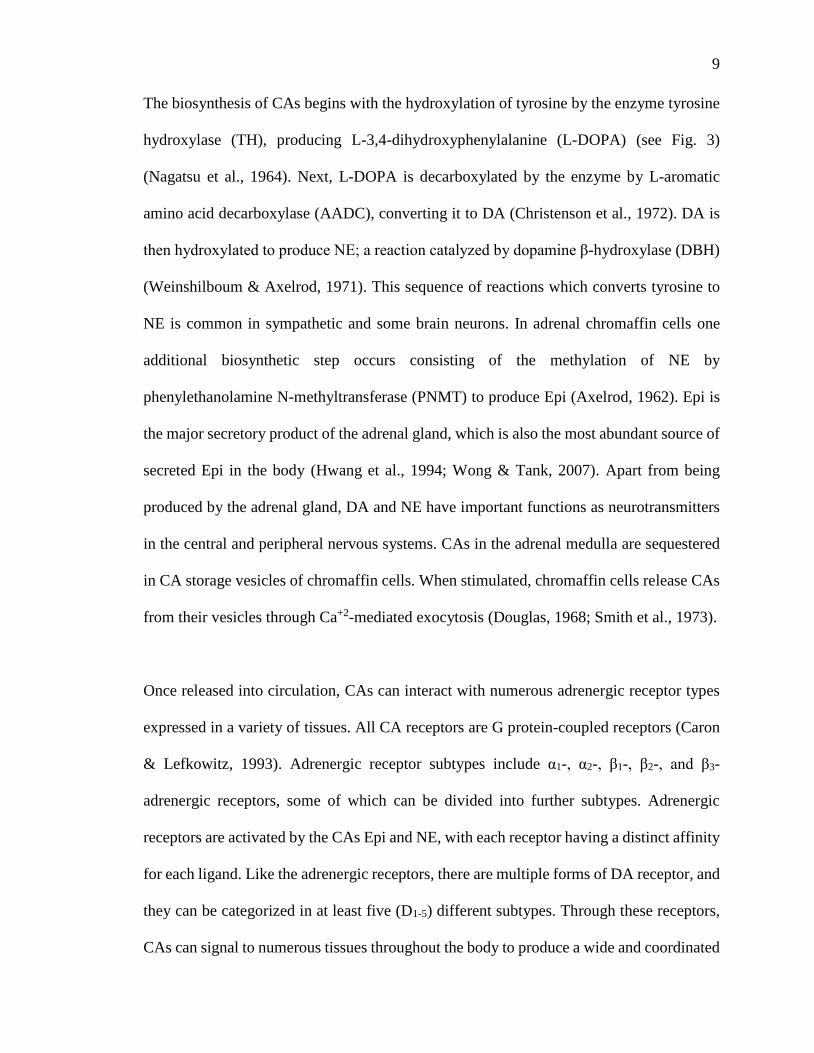
9
The biosynthesis of CAs begins with the hydroxylation of tyrosine by the enzyme tyrosine
hydroxylase (TH), producing L-3,4-dihydroxyphenylalanine (L-DOPA) (see Fig. 3)
(Nagatsu et al., 1964). Next, L-DOPA is decarboxylated by the enzyme by L-aromatic
amino acid decarboxylase (AADC), converting it to DA (Christenson et al., 1972). DA is
then hydroxylated to produce NE; a reaction catalyzed by dopamine β-hydroxylase (DBH)
(Weinshilboum & Axelrod, 1971). This sequence of reactions which converts tyrosine to
NE is common in sympathetic and some brain neurons. In adrenal chromaffin cells one
additional biosynthetic step occurs consisting of the methylation of NE by
phenylethanolamine N-methyltransferase (PNMT) to produce Epi (Axelrod, 1962). Epi is
the major secretory product of the adrenal gland, which is also the most abundant source of
secreted Epi in the body (Hwang et al., 1994; Wong & Tank, 2007). Apart from being
produced by the adrenal gland, DA and NE have important functions as neurotransmitters
in the central and peripheral nervous systems. CAs in the adrenal medulla are sequestered
in CA storage vesicles of chromaffin cells. When stimulated, chromaffin cells release CAs
from their vesicles through Ca+2-mediated exocytosis (Douglas, 1968; Smith et al., 1973).
Once released into circulation, CAs can interact with numerous adrenergic receptor types
expressed in a variety of tissues. All CA receptors are G protein-coupled receptors (Caron
& Lefkowitz, 1993). Adrenergic receptor subtypes include α1-, α2-, β1-, β2-, and β3-
adrenergic receptors, some of which can be divided into further subtypes. Adrenergic
receptors are activated by the CAs Epi and NE, with each receptor having a distinct affinity
for each ligand. Like the adrenergic receptors, there are multiple forms of DA receptor, and
they can be categorized in at least five (D1-5) different subtypes. Through these receptors,
CAs can signal to numerous tissues throughout the body to produce a wide and coordinated
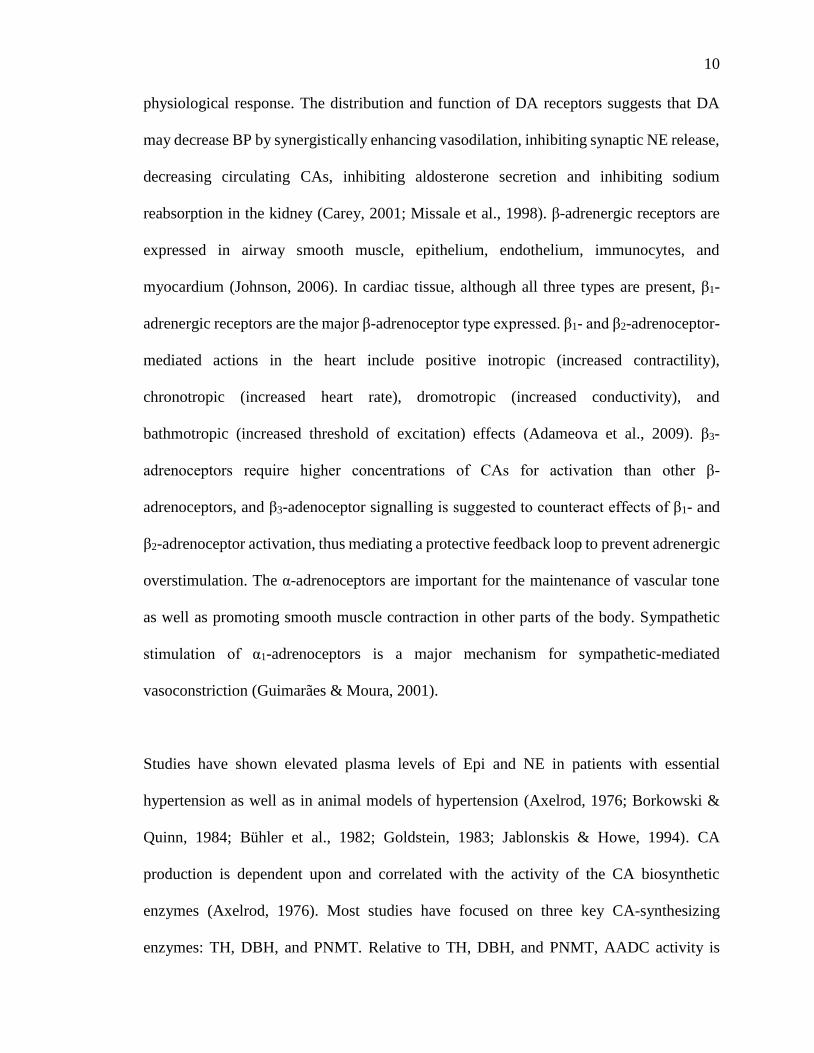
10
physiological response. The distribution and function of DA receptors suggests that DA
may decrease BP by synergistically enhancing vasodilation, inhibiting synaptic NE release,
decreasing circulating CAs, inhibiting aldosterone secretion and inhibiting sodium
reabsorption in the kidney (Carey, 2001; Missale et al., 1998). β-adrenergic receptors are
expressed in airway smooth muscle, epithelium, endothelium, immunocytes, and
myocardium (Johnson, 2006). In cardiac tissue, although all three types are present, β1-
adrenergic receptors are the major β-adrenoceptor type expressed. β1- and β2-adrenoceptor-
mediated actions in the heart include positive inotropic (increased contractility),
chronotropic (increased heart rate), dromotropic (increased conductivity), and
bathmotropic (increased threshold of excitation) effects (Adameova et al., 2009). β3-
adrenoceptors require higher concentrations of CAs for activation than other β-
adrenoceptors, and β3-adenoceptor signalling is suggested to counteract effects of β1- and
β2-adrenoceptor activation, thus mediating a protective feedback loop to prevent adrenergic
overstimulation. The α-adrenoceptors are important for the maintenance of vascular tone
as well as promoting smooth muscle contraction in other parts of the body. Sympathetic
stimulation of α1-adrenoceptors is a major mechanism for sympathetic-mediated
vasoconstriction (Guimarães & Moura, 2001).
Studies have shown elevated plasma levels of Epi and NE in patients with essential
hypertension as well as in animal models of hypertension (Axelrod, 1976; Borkowski &
Quinn, 1984; Bühler et al., 1982; Goldstein, 1983; Jablonskis & Howe, 1994). CA
production is dependent upon and correlated with the activity of the CA biosynthetic
enzymes (Axelrod, 1976). Most studies have focused on three key CA-synthesizing
enzymes: TH, DBH, and PNMT. Relative to TH, DBH, and PNMT, AADC activity is
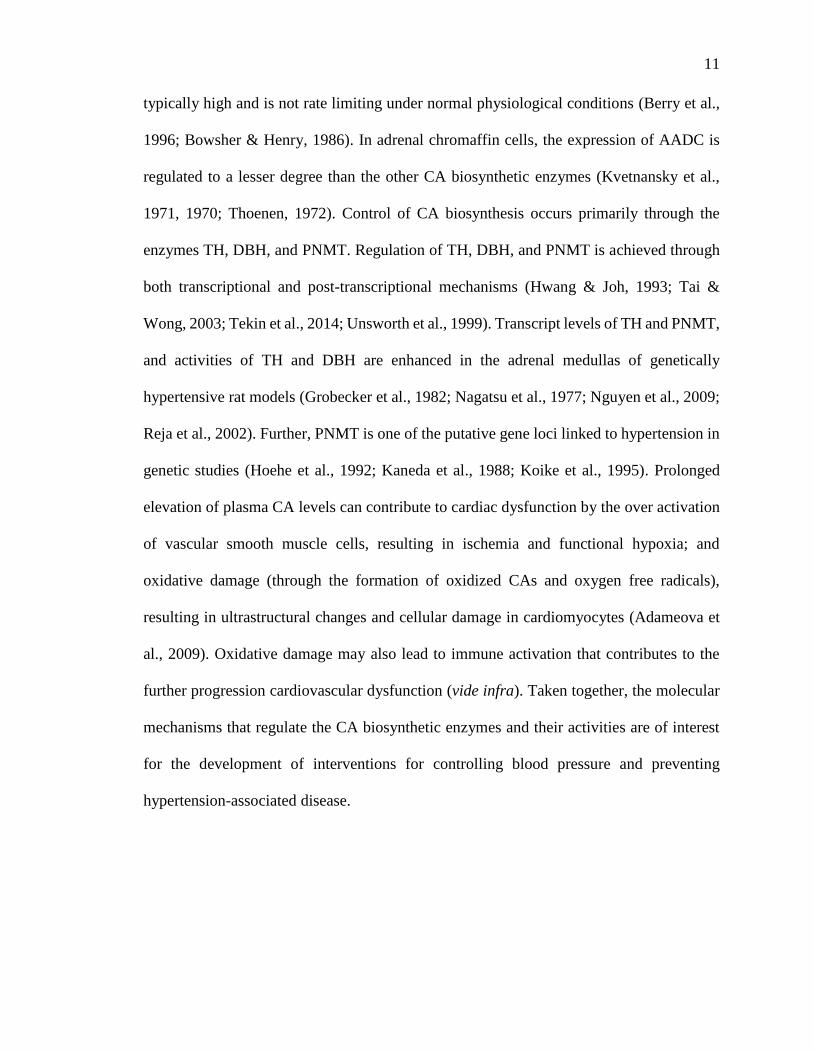
11
typically high and is not rate limiting under normal physiological conditions (Berry et al.,
1996; Bowsher & Henry, 1986). In adrenal chromaffin cells, the expression of AADC is
regulated to a lesser degree than the other CA biosynthetic enzymes (Kvetnansky et al.,
1971, 1970; Thoenen, 1972). Control of CA biosynthesis occurs primarily through the
enzymes TH, DBH, and PNMT. Regulation of TH, DBH, and PNMT is achieved through
both transcriptional and post-transcriptional mechanisms (Hwang & Joh, 1993; Tai &
Wong, 2003; Tekin et al., 2014; Unsworth et al., 1999). Transcript levels of TH and PNMT,
and activities of TH and DBH are enhanced in the adrenal medullas of genetically
hypertensive rat models (Grobecker et al., 1982; Nagatsu et al., 1977; Nguyen et al., 2009;
Reja et al., 2002). Further, PNMT is one of the putative gene loci linked to hypertension in
genetic studies (Hoehe et al., 1992; Kaneda et al., 1988; Koike et al., 1995). Prolonged
elevation of plasma CA levels can contribute to cardiac dysfunction by the over activation
of vascular smooth muscle cells, resulting in ischemia and functional hypoxia; and
oxidative damage (through the formation of oxidized CAs and oxygen free radicals),
resulting in ultrastructural changes and cellular damage in cardiomyocytes (Adameova et
al., 2009). Oxidative damage may also lead to immune activation that contributes to the
further progression cardiovascular dysfunction (vide infra). Taken together, the molecular
mechanisms that regulate the CA biosynthetic enzymes and their activities are of interest
for the development of interventions for controlling blood pressure and preventing
hypertension-associated disease.
12
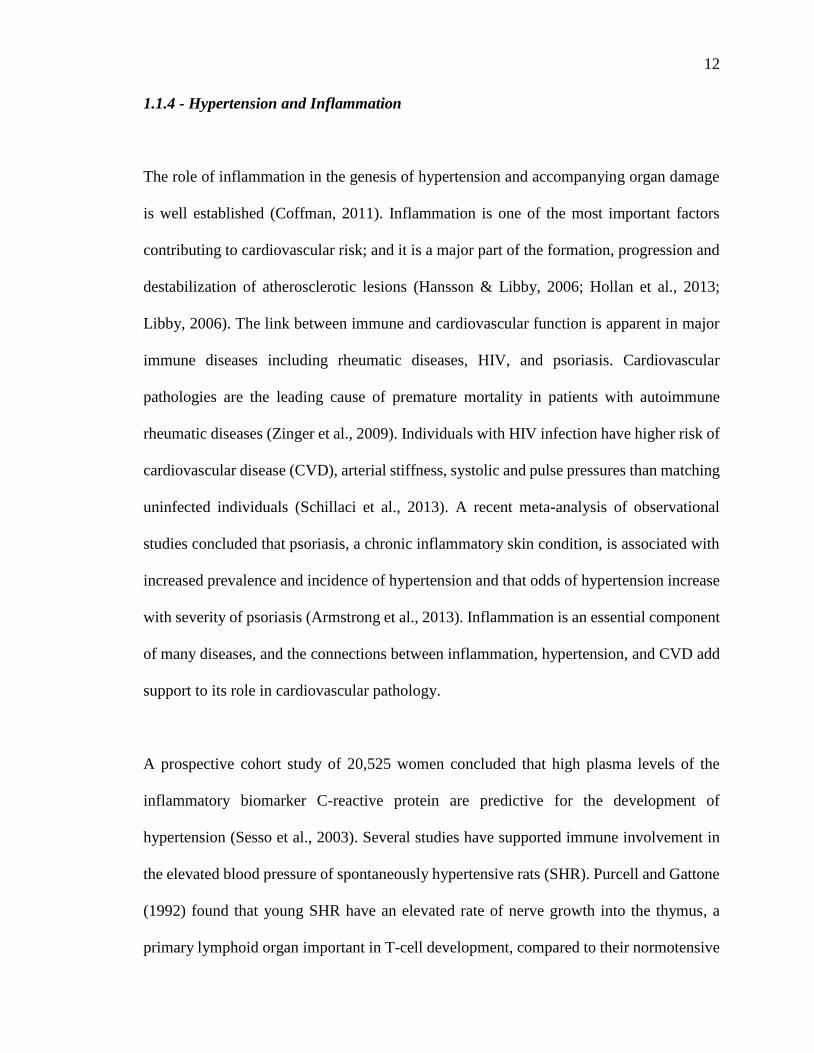
1.1.4 - Hypertension and Inflammation
The role of inflammation in the genesis of hypertension and accompanying organ damage
is well established (Coffman, 2011). Inflammation is one of the most important factors
contributing to cardiovascular risk; and it is a major part of the formation, progression and
destabilization of atherosclerotic lesions (Hansson & Libby, 2006; Hollan et al., 2013;
Libby, 2006). The link between immune and cardiovascular function is apparent in major
immune diseases including rheumatic diseases, HIV, and psoriasis. Cardiovascular
pathologies are the leading cause of premature mortality in patients with autoimmune
rheumatic diseases (Zinger et al., 2009). Individuals with HIV infection have higher risk of
cardiovascular disease (CVD), arterial stiffness, systolic and pulse pressures than matching
uninfected individuals (Schillaci et al., 2013). A recent meta-analysis of observational
studies concluded that psoriasis, a chronic inflammatory skin condition, is associated with
increased prevalence and incidence of hypertension and that odds of hypertension increase
with severity of psoriasis (Armstrong et al., 2013). Inflammation is an essential component
of many diseases, and the connections between inflammation, hypertension, and CVD add
support to its role in cardiovascular pathology.
A prospective cohort study of 20,525 women concluded that high plasma levels of the
inflammatory biomarker C-reactive protein are predictive for the development of
hypertension (Sesso et al., 2003). Several studies have supported immune involvement in
the elevated blood pressure of spontaneously hypertensive rats (SHR). Purcell and Gattone
(1992) found that young SHR have an elevated rate of nerve growth into the thymus, a
primary lymphoid organ important in T-cell development, compared to their normotensive
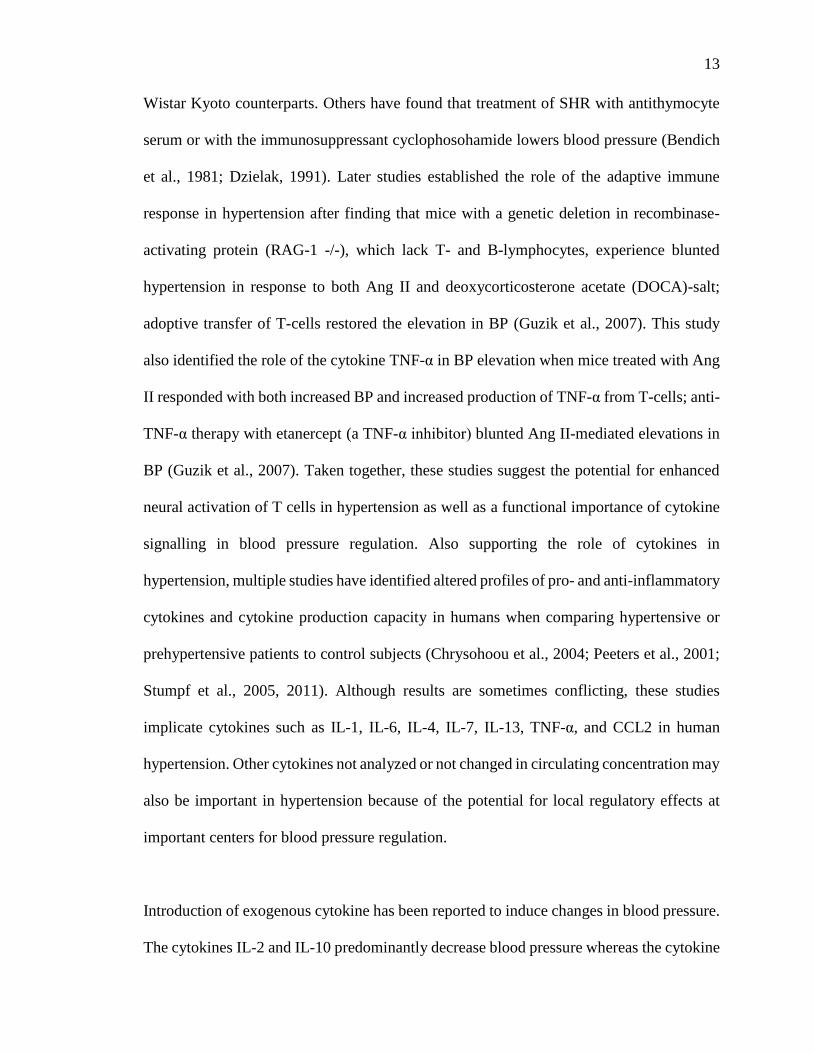
13
Wistar Kyoto counterparts. Others have found that treatment of SHR with antithymocyte
serum or with the immunosuppressant cyclophosohamide lowers blood pressure (Bendich
et al., 1981; Dzielak, 1991). Later studies established the role of the adaptive immune
response in hypertension after finding that mice with a genetic deletion in recombinase-
activating protein (RAG-1 -/-), which lack T- and B-lymphocytes, experience blunted
hypertension in response to both Ang II and deoxycorticosterone acetate (DOCA)-salt;
adoptive transfer of T-cells restored the elevation in BP (Guzik et al., 2007). This study
also identified the role of the cytokine TNF-α in BP elevation when mice treated with Ang
II responded with both increased BP and increased production of TNF-α from T-cells; anti-
TNF-α therapy with etanercept (a TNF-α inhibitor) blunted Ang II-mediated elevations in
BP (Guzik et al., 2007). Taken together, these studies suggest the potential for enhanced
neural activation of T cells in hypertension as well as a functional importance of cytokine
signalling in blood pressure regulation. Also supporting the role of cytokines in
hypertension, multiple studies have identified altered profiles of pro- and anti-inflammatory
cytokines and cytokine production capacity in humans when comparing hypertensive or
prehypertensive patients to control subjects (Chrysohoou et al., 2004; Peeters et al., 2001;
Stumpf et al., 2005, 2011). Although results are sometimes conflicting, these studies
implicate cytokines such as IL-1, IL-6, IL-4, IL-7, IL-13, TNF-α, and CCL2 in human
hypertension. Other cytokines not analyzed or not changed in circulating concentration may
also be important in hypertension because of the potential for local regulatory effects at
important centers for blood pressure regulation.
Introduction of exogenous cytokine has been reported to induce changes in blood pressure.
The cytokines IL-2 and IL-10 predominantly decrease blood pressure whereas the cytokine
14
IL-6 predominantly increases blood pressure. Other cytokines, such as TNF-α and IL-1,
appear to have more intricate effects in relation to blood pressure regulation. In a screening
experiment for changes in chemokine expression in DOCA/salt-induced hypertensive mice,
transcript of the chemokine CCL2 and its receptor CCR2 were increased in aortas after the
onset of hypertension. Treatment of mice with the CCR2 antagonist, INCB3344,
substantially reduced DOCA/salt-induced infiltration of macrophages in aortic wall and
DOCA/salt-induced elevations in blood pressure (Chan et al., 2012). Regulation of blood
pressure by cytokines may be mediated by signalling to neural control centers or by direct
actions on peripheral tissues. IL-1 can modulate blood pressure by influencing activity of
neurohormonal control centers in the brain (McCann et al., 2000; Shi et al., 2010;
Weidenfeld et al., 1989; Wilson et al., 1996). IL-1 can also modify vascular reactivity to
NE (Baudry et al., 1996). Human cancer patients who receive high doses of IL-2
demonstrate hemodynamic changes which suggest decreased peripheral resistance but
increased cardiac output, with an overall reduction in mean arterial pressure (Gaynor et al.,
1988; Quan et al., 2005). Similar hemodynamic changes and hypotension are observed in
experimental animals (Samlowski et al., 2003; Zeilender et al., 1989). Interestingly, IL-2
can decrease circulating Epi in mice, and reversal of IL-2-induced hypotension is associated
with a rise in circulating CAs (Samlowski et al., 2003). Like IL-2, experimentally-induced
elevations in IL-10 levels are associated with decreases in blood pressure in animal models
(Shi et al., 2010; Tinsley et al., 2010; Viel et al., 2010). IL-2 and other cytokines may reduce
CA-mediated vasoconstriction by enhancing superoxide production, a molecule that can
interact with CAs and inhibit their signalling function (Faggioni et al., 1994; Macarthur et
al., 2000; Suzuki et al., 1990). In contrast to many other cytokines, IL-6 appears to increase
blood pressure. In a large cohort study of healthy men, after controlling for age and other
15
cardiac risk factors, baseline plasma IL-6 levels were positively associated with increased
SBP, DBP, pulse pressure, and mean arterial pressure (Chae et al., 2001). In animal
experiments, IL-6 is shown to contribute to Ang II-induced, but not salt-sensitive
hypertension (Brands et al., 2010; Lee et al., 2006; Schrader et al., 2007; Sturgis et al.,
2009). Pro-hypertensive effects of IL-6 may be mediated, in part, by vasoconstrictive
effects of the cytokine that could result in increased peripheral resistance (Baudry et al.,
1996; Iversen et al., 1999). The major proinflammatory cytokine TNF-α can induce
hypotension; however, inhibition of TNF with etanercept can prevent elevations in blood
pressure caused by Ang II infusion, high-fructose feeding, and chronic inflammation in
animal models (Feinberg et al., 1988; Guzik et al., 2007; Saks & Rosenblum, 1992; Tran
et al., 2009; Venegas-Pont et al., 2010). TNF-α inhibition does not influence blood pressure
in salt-dependent hypertension (Elmarakby et al., 2008). TNF-α can directly modulate
arterial tone, and TNF-mediated signalling is involved in cardiac remodelling (Baudry et
al., 1996; Iversen et al., 1999). Prenatal exposure to elevated levels of cytokines may also
contribute to hypertension during adulthood (Samuelsson et al., 2006). This may involve
morphological changes in tissues, as suggested by findings of increased innervation by
adrenergic nerve fibers in human thymus after IFN-α therapy (Cavallotti et al., 2002). The
blood pressure-regulatory effects of cytokines are complex, affecting multiple
physiological systems in combination with hormones, neurotransmitters, and other
signalling molecules. Future investigations into the integration of cytokine signalling with
the other blood pressure regulatory systems will provide a better understanding of the
events responsible for blood pressure dysregulation in disease.
16
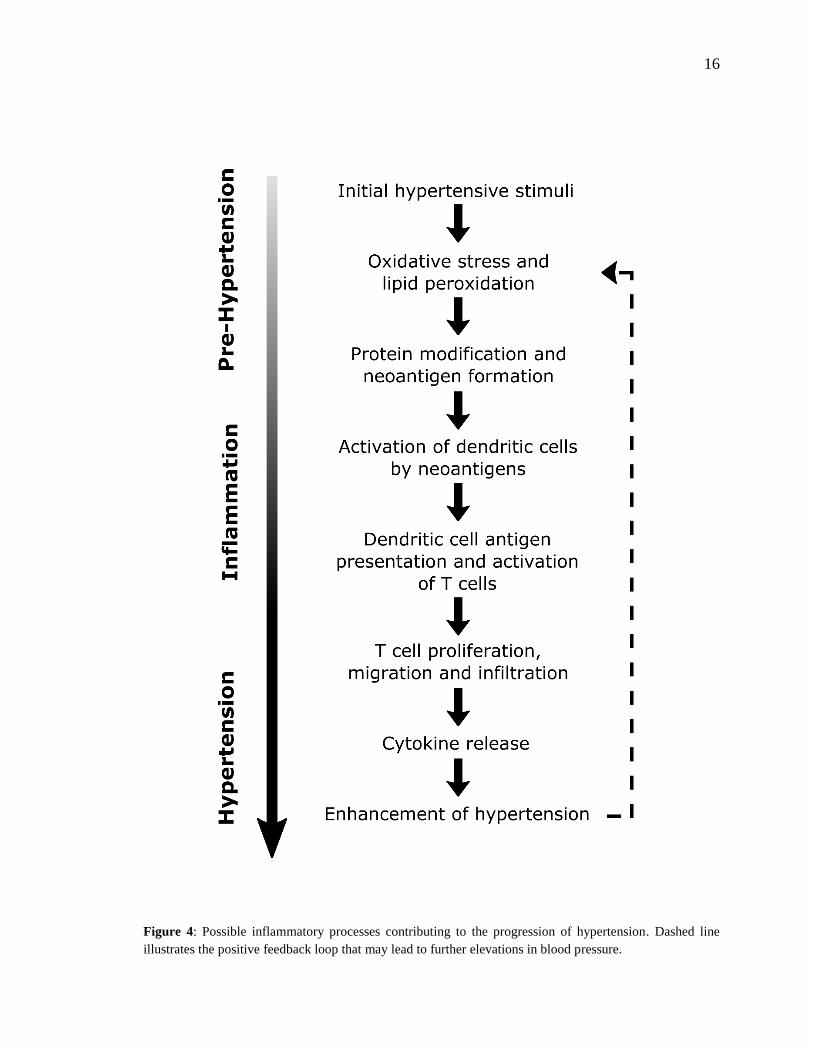
Figure 4: Possible inflammatory processes contributing to the progression of hypertension. Dashed line
illustrates the positive feedback loop that may lead to further elevations in blood pressure.
17
In describing a new model for how inflammation and hypertension interact, Harrison et al.
(2011) hypothesized that modest elevations in BP (to values of SBP ~135-140 mm Hg),
such as in prehypertension, largely caused by activity of the CNS, trigger immune changes
that lead to hypertension (see Fig. 4). In this model, initial elevations in BP are responsible
for neoantigen formation from oxidation and altered mechanical forces in vasculature.
Neoantigens then induce inflammatory responses in the kidneys, blood vessels and other
tissues, where lymphocyte infiltration and expression of inflammatory mediators such as
CCL2, IL-1, IL-6, IL-17, and TNF-α is increased (Blasi et al., 2003; Crowley et al., 2008;
Guzik et al., 2007; Madhur et al., 2010). These cytokines and inflammatory mediators work
in concert with CAs and other BP-elevating hormones leading to vascular and renal
dysfunction and initiating a more severe hypertensive state (Harrison et al., 2011). This
feed-forward model described by Harrison et al. (2011) was foretelling of recent findings
by Kirabo et al. (2014), whose work outlined a mechanism for hypertension based on an
autoimmune-like reaction. In this mechanism, initial increases in BP lead to oxidative stress
and lipid peroxidation which results in neoantigen formation, immune cell activation, and
initiation of T-cell proliferation and cytokine production, leading to further increases in BP.
With the support of these and other findings, a new paradigm is being established that
implicates inflammation in the elevation of BP and progression of hypertension.
18
1.2 - The Major Mechanisms of Adrenal Medullary Regulation
The adrenal gland is a key organ involved in the physiological adaptation to stress. The
“fight-or-flight” response, first described by Cannon in the early 20th century, is
characterized by increased blood pressure, increased heart rate, increased cardiac output,
and changes in vascular and respiratory smooth muscle tone (Cannon & La Paz, 1911;
Curtis & O’Keefe, 2002). The two major hormones secreted into circulation that facilitate
the physiological stress response include cortisol and Epi, both being primarily products of
the adrenal cortex and medulla respectively (Wong & Tank, 2007). There are two major
effector circuits which are activated when the CNS perceives or anticipates a stress. They
include the hypothalamic-pituitary-adrenal (HPA) axis, which stimulates the adrenal
medulla through a hormonal mechanism, and the sympathetic-adrenal (SA) axis, which
stimulates the adrenal medulla through a neural mechanism (Wong, 2006). These axes are
in many ways physically distinct but they also have overlapping CNS components and
physiological functions. Initiation of the physiological stress response, involving either
HPA or SA axis, is primarily derived from structures of the limbic system. Termination of
the stress response, caused by hormonal and neural feedback, also involves many of these
same limbic structures. Integration of hormonal and neural signalling cascades allows the
HPA and SA axis to function cooperatively while also tailoring individual responses to the
specific initiating stimuli (Ulrich-Lai & Herman, 2009).
19
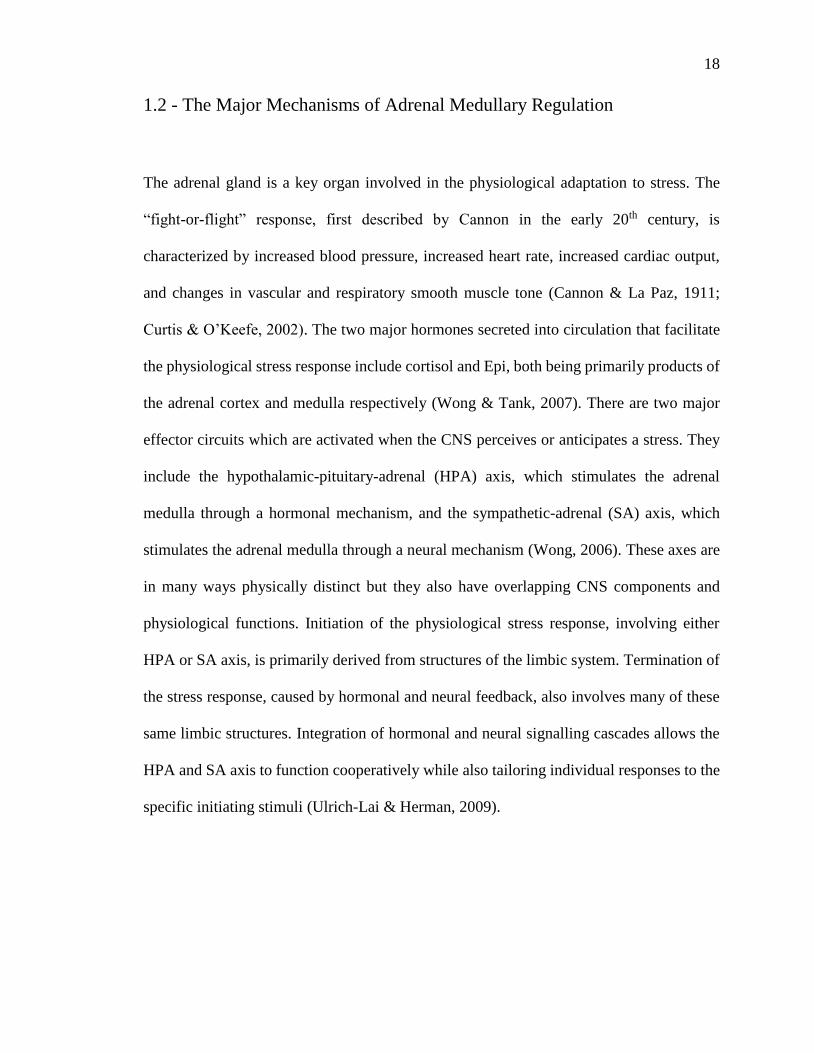
Figure 5: Hormonal and neural mechanisms regulating adrenal medullary chromaffin cells. The HPA-axis,
comprised of the hormones corticotropin-releasing hormone (CRH), adrenocorticotropic hormone (ACTH),
and cortisol, is shown in yellow. The SA-axis, comprised of afferent preganglionic sympathetic nervous
system (SNS) fibers, is shown in blue. Green squares represent glucocorticoid (cortisol) produced in the
adrenal cortex and traveling to the adrenal medulla through vasculature. Neurotransmitters, including
acetylcholine and pituitary adenylate cyclase-activating peptide are released from synaptic terminals. Both
glucocorticoids and sympathetic input stimulate release of catecholamines, primarily epinephrine, from
chromaffin cells by exocytosis. Epinephrine then enters into systemic circulation and travels to target tissues
throughout the body.
20
1.2.1 - Hypothalamic-Pituitary-Adrenal Axis
The HPA axis consists of the paraventricular nucleus of the hypothalamus, the anterior
pituitary gland and the adrenal gland (Smith & Vale, 2006). The HPA axis is activated
when afferent neurons from multiple brain regions stimulate hypophysiotrophic neurons of
the paraventricular nucleus and induce them to release corticotropin-releasing hormone
(CRH) and vasopressin (Fig. 5). CRH and vasopressin then travel through hypophysial
portal vessels to the anterior pituitary. CRH binds to receptors on pituitary corticotropes
and promotes the secretion of adrenocorticotrophic hormone (ACTH) into systemic
circulation. In the presence of CRH, vasopression has a synergistic effect, enhancing
secretion of ACTH into circulation. ACTH then travels to parenchymal cells of the
adrenocortical zona fasciculata, where it binds to plasma membrane receptors and initiates
a rapid increase in the production and secretion of glucocorticoids (GCs). Once in systemic
circulation, GCs bind to ubiquitously expressed intracellular glucocorticoid receptors
(GRs) to induce physiological adaptations to the initial stressor. An intra-adrenal portal
vascular system allows the exposure of adrenal medullary cells to especially high
concentrations of GCs released from the adrenal cortex (Wurtman, 2002). GCs produce
their cellular effects primarily by regulating transcription. Endogenous cortisol
(corticosterone in rodents) is a lipid-soluble steroid hormone that binds to the cytoplasmic
GR. Prior to ligand binding, GR is located in the cytoplasm as a multiprotein complex
(Nicolaides et al., 2010). HSP90, one of the proteins in this complex, maintains the
cytoplasmic retention of GR until binding of a ligand to GR causes dissociation from the
complex and translocation into the nucleus. GR then homodimerizes and binds to
glucocorticoid response elements (GRE) in the promoter regions of target genes directly,
21
or interacts with other transcription factor proteins causing transactivation or
transrepression (Nicolaides et al., 2010). GCs are important regulators of homeostasis
during basal conditions and during stress. They are critical for regulating cardiovascular,
immune, metabolic, developmental, and reproductive processes (Smith & Vale, 2006). For
example, the strong influence of GCs on immune function has allowed them to become
some of the most commonly used compounds for therapeutic treatment of inflammatory,
autoimmune, and lymphoproliferative disorders. In human leukocytes, approximately 20%
of genes are regulated either positively or negatively by GCs (Galon et al., 2002). The
effects of GCs on cardiovascular regulation are also important. Cortisol is a regulator of
blood pressure in humans and can lead to hypertension when in excess (Kelly et al., 1998).
One way that GCs can influence blood pressure is by influencing CA production. GCs
directly increase the release of CAs by sympathetic nerves and adrenal medullary cells
(Pilipović et al., 2012; Sharara-Chami et al., 2010). To compensate for increased secretion
of CAs, GCs must increase CA production by regulating CA biosynthetic enzymes. Early
evidence of GC control over adrenal CA biosynthesis was demonstrated in experiments
performed by Wurtman and Axelrod (1965), who reported that ablation of the pituitary
gland decreases PNMT activity, which can be restored by addition of ACTH or GC
(Wurtman & Axelrod, 1965). Later, in vitro and in vivo experiments confirmed that GCs
are responsible for increasing PNMT mRNA expression (Evinger et al., 1992; Sharara-
Chami et al., 2010; Wong et al., 1992), increasing the amount of functional intronless
mRNA splice variant (Unsworth et al., 1999), increasing PNMT activity (Unsworth et al.,
1999), and enhancing PNMT protein stability via regulation of the co-substrate S-adenosyl-
methionine (Berenbeim et al., 1979; Wong et al., 1985, 1982) in adrenal chromaffin cells.
22
Studies in rat pheochromocytoma cells show that, in addition to PNMT, GCs regulate the
other CA biosynthetic enzymes to produce parallel increases in their transcript level and
activity (Kim et al., 1993b; Lewis et al., 1987, 1983; McMahon & Sabban, 1992; Tischler
et al., 1983). Similar observations pertaining to regulation of enzyme transcript levels have
also been made with primary cultures of bovine adrenal medullary cells; however, unlike
rat pheochromocytoma cells, in bovine chromaffin cell primary cultures DBH transcript
does not appear to be regulated by GC (Hwang & Joh, 1993; Stachowiak, Hong, et al.,
1990).
Thus, GCs can increase transcript of TH, DBH, and PNMT. The site critical for GC
responsiveness of the rat TH gene is located at about -5.7 kb and it closely resembles the
activator protein 1 (AP-1) binding site (Rani et al., 2009). This finding is consistent with
earlier observations the proximal promoter region (-773 to +27 bp) is not sufficient for GC
regulation of the TH gene (Lewis et al., 1987, 1983). Another functional GRE has been
identified at ~2.4 kb upstream in the mouse TH promoter (Hagerty et al., 2001). Several
putative GREs have been identified in the first 1 kb of the upstream rat DBH gene, with
corresponding sequences in the human DBH promoter (McMahon & Sabban, 1992).
Although long exposure with GCs can increase transcript levels of DBH in PC12 cells,
functionality of putative GREs in the DBH promoter has not yet been proven (McMahon
& Sabban, 1992). In bovine chromaffin cells, GCs do not appear to regulate DBH
transcription (Hwang & Joh, 1993). GCs are also important regulators of PNMT
transcription (Wong et al., 1992). Three functional GREs have been identified in the
proximal 1 kb rat PNMT promoter, and activation at these sites can be synergistically
23
regulated by the transcription factors early growth response 1 (Egr1) and activator protein
2 (AP-2) (Ross et al., 1990; Tai et al., 2002; Wong et al., 1998).
1.2.2 - Sympathetic-Adrenal Axis
Working alongside the HPA-axis, another effector circuit that signals the adrenal medulla
to synthesize and secrete Epi, the SA-axis, consists of the direct innervation of adrenal
medullary chromaffin cells by the sympathetic nervous system (Axelrod & Reisine, 1984).
Stress signals, primarily originating from limbic structures, are transmitted to preganglionic
sympathetic neurons in the intermediolateral cell column of the thoracolumbar spinal cord
which project, via the splanchnic nerve, to adrenal chromaffin cells of the adrenal medulla
(Ulrich-Lai & Herman, 2009). The projections of preganglionic neurons from the
splanchnic nerve terminate with synapses on adrenal medullary chromaffin cells. The
neural stimulus is delivered to each chromaffin cell by several synaptic boutons and
compelling evidence now suggests that gap junctions also help to propagate
electrochemical signals between neighboring cells (Colomer et al., 2012; Desarménien et
al., 2013). A combination of neurotransmitters and neuropeptides are released from
sympathetic nerve terminals and bind to plasma membrane receptors on chromaffin cells.
These substances stimulate the release large amounts of stored CAs from chromaffin cell
vesicles via Ca+2-mediated exocytosis (Kvetnansky et al., 2009). Due to the direct
innervations of adrenal chromaffin cells, the SA effector circuit has a short latency in
comparison to excitation via the HPA axis, which is generally longer lasting and slower to
respond (Droste et al., 2008). Stimulation of chromaffin cell activity by the SA axis may
24
contribute to hypertension through either an increase in sympathetic nerve firing or an
unusually high sensitivity of chromaffin cells to sympathetic stimulation (Anderson et al.,
1989; Fhaner et al., 2013; Schlaich et al., 2004; Segura-Chama et al., 2015).
Synaptic transmission at the SA synapse is mediated by the small molecule transmitter
acetylcholine (ACh) and by neuroactive peptides. ACh is a transmitter for all preganglionic
neurons of the autonomic nervous system and all postganglionic neurons of the
parasympathetic nervous system (Kandel et al., 2012). The frequency of action potential
firing at sympathetic nerve terminals influences the types of neurotransmitters released
from the presynaptic nerve at the SA synapse. Stress is associated with high frequency
splanchnic nerve firing, whereas basal sympathetic tone is characterized by lower
frequency firing (Klevans & Gebber, 1970). In the preganglionic sympathetic nerves at the
SA synapse, small synaptic vesicles (SSVs) contain ACh and large dense core vesicles
(LDCVs) contain neuropeptides such as pituitary adenylate cyclase-activating peptide
(PACAP). During high frequency firing both LDCVs and SSVs are released from the
presynaptic nerve terminals. During basal conditions, only SSVs are released (Hökfelt et
al., 2003). Both PACAP and ACh are integral at the SA synapse for promoting CA
production and secretion (Wong, 2006). ACh is perhaps the best characterized molecule
for synaptic transmission from the splanchnic nerve to the adrenal medulla. ACh binds to
both nicotinic and muscarinic plasma membrane receptors on chromaffin cells. Cholinergic
stimulation increases release of CAs from chromaffin cells (Evinger et al., 1994;
Stachowiak, Hong, et al., 1990). Activation of nAChRs increases TH mRNA in chromaffin
cells in a protein kinase A (PKA)-dependent manner (Gueorguiev et al., 1999; Hiremagalur
et al., 1993; Stachowiak, Hong, et al., 1990). Cholinergic stimulation of chromaffin cells

25
also induces PNMT promoter-driven luciferase activity through a PKA-dependent
mechanism (Wong et al., 2002). In vitro and in vivo evidence also supports the role of
mAChRs in activating PNMT expression, via induction of the transcription factor Egr1
(Morita et al., 1996; Morita & Wong, 1996).
PACAP, primarily released from LDCVs during high frequency neuronal firing, is
important for generating sustained increases in CA production by chromaffin cells
(Wakade, 1988). PACAP is a ligand for the PAC1 receptor, which belongs to the subclass
B1 GPCR. PAC1R signals through Gαs, which regulates adenylyl cyclase (Martin et al.,
2005). Binding of PACAP to PAC1 can signal through the conventional cyclic adenosine
monophosphate (cAMP)-PKA pathway and at least two other insulated, cAMP-sensitive
signalling pathways involving the signal transduction proteins exchange protein directly
activated by cAMP (Epac) and the extracellular signal regulated kinases (ERK) 1 and 2
(Emery & Eiden, 2012; Gerdin & Eiden, 2007; Kuri et al., 2009). The PAC1 receptor can
also stimulate Gαq, which activates a phospholipase C (PLC)-protein kinase C (PKC)
pathway (Yang et al., 2010). PACAP is capable of upregulating chromaffin cell expression
of TH, DBH, and PNMT transcript (Stroth & Eiden, 2010; Tönshoff et al., 1997).
As mentioned above, signalling via cAMP is an important molecular mechanism induced
by both ACh and PACAP, and is involved in the regulation of CA biosynthetic enzymes in
adrenal chromaffin cells. In primary cultured bovine adrenomedullary chromaffin cells,
cAMP signalling produces synchronized increases in both transcript and activity levels of
TH, DBH, and PNMT (Hwang et al., 1994). Similar activation of the CA biosynthetic
enzymes by cAMP signalling occurs in rat chromaffin cells (Cheng et al., 2008; Lewis et
26
al., 1987, 1983; McMahon & Sabban, 1992; Wong et al., 2002). It should be noted that in
both rat and bovine models, the induction of PNMT by cAMP is relatively small compared
to the induction of TH and DBH. Signalling by cAMP activates PKA and can lead to tissue-
specific induction of other signalling pathways. For example, in PC12 cells, PACAP
activates PKA signalling as well as signalling through the mitogen-activated protein
kinases (MAPKs) p38 and ERK1/2 via a PKA dependent mechanism (Hansen et al., 2000;
Vaudry et al., 2009). Signalling by ERK1/2, downstream of PKA activation, may contribute
to PNMT transcriptional activation (Tai et al., 2010). The promoters of TH, DBH, and
PNMT all contain motifs that can bind a number of common transcription factors. The
transcription factors specificity protein 1 (Sp1), AP-2, and Egr1 all have functional
consensus sequences in the promoters of TH, DBH, and PNMT rat genes. AP-1 and CRE
motifs are also present within the rat TH and DBH promoters (Cheng et al., 2008;
Kvetnansky et al., 2009). Induction of Egr1 in rat chromaffin cells occurs through a
cAMP/PKA signalling mechanism (Ginty et al., 1991; Tai et al., 2001). In rat chromaffin
cells, Egr1 regulates transcription of TH, DBH, and PNMT (Cheng et al., 2008; Ebert et
al., 1994; Papanikolaou & Sabban, 2000). Splanchnic nerve activation, the cholinergic
agonists nicotine and muscarine, and the neuropeptide PACAP are all inducers of Egr1
(Morita et al., 1996; Wong et al., 2002). Transcriptional activation of TH and DBH also
occurs through cAMP induction of transcription factor binding to AP-1 and CRE motifs
(Kim et al., 1993a; Lim et al., 2000; Stachowiak, Goc, et al., 1990; Swanson et al., 1998).
Other transcription factors potentially involved in the activation of CA biosynthetic
enzymes by neural stimuli include Sp1 and AP-2 (Tai et al., 2010; Wong et al., 2002).
Taken together, these studies suggest that the neuronal regulation of chromaffin cells

27
involves a number of transcription factors which can act individually or cooperatively to
regulate expression of the enzymes responsible for CA biosynthesis.
1.3 - Cytokine-Mediated Regulation of Catecholamine Biosynthesis
Investigations into the potential role of cytokines in regulating CA production by the
adrenal gland were, in part, inspired by insights gained from studying depression.
Depression can be induced by alterations in NE and other neurotransmitter levels, and
sympathetic hyperactivity is a well characterized component of the condition (Raison et al.,
2006). It has also been reported that a large proportion of patients receiving IFN-α therapy
for treatment of cancer or infectious disease develop a behavioural syndrome that is very
similar to major depression (Raison et al., 2006). This finding led to questions about the
influence of cytokines on neurotransmitter production and the role of cytokines in
regulating neural activity. Interestingly, depression is now associated both with elevations
in plasma levels of proinflammatory cytokines and increased risk of hypertension,
cardiovascular morbidity and mortality (Dowlati et al., 2010; Meng et al., 2012; Serrano et
al., 2011). Although the causal relationships are not yet resolved, possible influences of
inflammatory mediators such as cytokines on catecholaminergic cell function are now
being investigated for their contribution to hypertension and CVD.
In humans, treatment with IFN-α increases circulating levels of NE and Epi (Corssmit et
al., 1996; Pende et al., 1990). Both intravenous and intracerebroventricular administration

28
of IL-1 to rats has been reported to increase plasma levels of NE and Epi, along with
increased renal sympathetic nerve activity, SBP and heart rate (Kannan et al., 1996; Rivier
et al., 1989). Central administration of IL-1 to rats has also been reported to increase ACTH
secretion (Hashimoto et al., 1993). These findings suggest that IL-1 can activate HPA and
SA axes by direct stimulation of regulatory centers within the brain. In humans, peripheral
administration of IL-6 increases plasma cortisol and NE but does not affect plasma Epi
levels (van Hall et al., 2003; Steensberg et al., 2003; Stouthard et al., 1995; Torpy et al.,
2000). Studies have suggested that peripherally, but not centrally administered, TNF-α
elevates plasma CA levels in rats (Darling et al., 1989; De Laurentiis et al., 2002). Increased
expression of IL-10 in the brain can inhibit elevations in plasma NE resulting from
myocardial infarction in rats (Yu et al., 2007). Numerous cytokines, including IFNs, IL-1,
IL-2, IL-6, and TNF-α induce changes in brain CA production or metabolism. Often,
excitatory or inhibitory effects of cytokines in the brain are regionally dependent. Many of
these same cytokines also modulate CA levels in the hypothalamus and influence function
of the HPA axis (Dunn, 2006; Haddad et al., 2002). For example, central and peripheral
administrations of IFN-α both alter levels of DA and NE in specific regions of the brain
(Kamata et al., 2000; Kitagami et al., 2003; Kumai et al., 2000). The patterns of altered CA
levels differ depending on the location, central or peripheral, of IFN-α administration. This
suggests that direct and indirect sensing of cytokines by the brain induce unique responses
in CA production by neural tissues. Numerous studies report similar regulatory effects for
other cytokines in relation to brain cytokine production. In peripheral tissues, the effects of
centrally or peripherally administered cytokines on CA levels and CA turnover is tissue-
specific, suggesting that cytokines can influence sympathetic activity both directly and
indirectly, and that modulation of sympathetic nerve activity is specific rather than global
29
(Akiyoshi et al., 1990; Bognar et al., 1994; Hurst & Collins, 1993; Saito et al.; Sterin-Borda
et al., 1996; Terao et al., 1994; Vriend et al., 1993).
Cytokines have also been reported to regulate CA biosynthetic enzymes in vivo. In vivo
studies using rats demonstrate that the cytokines IFN-α, IL-1β, and TNF-α regulate the CA
biosynthetic enzyme TH in catecholaminergic cells of the brain and carotid body (Kang et
al., 2009; Kumai et al., 2000; Sirivelu et al., 2012; Zhang et al., 2007). Interestingly,
centrally administered cytokines can regulate CA biosynthetic enzymes in the adrenal
medullas as well, likely through indirect mechanisms involving neural activation of level
of the CNS and downstream effects mediated by the HPA or SA axes (Sim et al., 2012).
For a more complete presentation of cytokine effects in the brain, HPA and SA axis, several
reviews are available (Dunn, 2006; Elenkov et al., 2000; Haddad et al., 2002; Turnbull &
Rivier, 1999). In sites of CA production outside the brain, the influence of cytokine
signalling is only beginning to be understood.
1.3.1 - Cytokine Expression by Adrenal Chromaffin Cells
Adrenal cytokines can originate either systemically or locally; both situations have possible
importance to cytokine-mediated regulation of adrenal function during hypertension.
Numerous studies have identified unique profiles of circulating and tissue-expressed
cytokines in hypertensive animal and human subjects (Chae et al., 2001; Chan et al., 2012;
Chrysohoou et al., 2004; Shi et al., 2010). Even during normal physiological conditions,
cytokines are expressed at detectable levels by adrenal medullary tissue. Cytokines are
30
expressed at varying levels throughout the adrenal gland (Call et al., 2000; González-
Hernández et al., 1996). The highest levels of expression are most commonly observed in
the cortex or steroid-producing cells within the medulla, although expression of cytokines
by chromaffin cells themselves has also been demonstrated in a number of studies (see
Table 1). In humans, as in many species, the adrenal medulla is contiguous with the adrenal
cortex, meaning that chromaffin cells are in direct contact with steroidogenic cells
(Willenberg et al., 2002). Chromaffin cells are also receptive to many cytokines that are
produced locally in the adrenal gland (see Table 1). Receptiveness to cytokines is
demonstrated either by expression of cytokine receptors or by response of isolated
chromaffin cells to cytokines. In instances where the cytokine and its receptor are co-
expressed, or when a locally produced cytokine can elicit a response in chromaffin cells,
there is a possibility of autocrine or paracrine signalling that may influence endocrine
function of the adrenal medulla (Douglas et al., 2010).

31
Table 1: Cytokine expression, responsiveness, and signalling observed in adrenal gland. JAK = Janus kinase; STAT = Signal Transducer and Activator of
Transcription; NO = Nitric Oxide; GC = Guanylyl Cyclase; NPY = Neuropeptide Y; ZG = Zona Glomerulosa; ZF = Zona Fasciculata; ZR = Zona Reticularis.
Cytokine Cytokine Expression (organism, tissue) Responsiveness (organism, tissue, mode of
exposure) Cytokine Receptors
(receptor name,
organism, tissue)
Supported Signalling
Mechanisms
IFN-α
Bovine (medulla and chromaffin cells, in
vitro) (Douglas & Bunn, 2009; Tachikawa et
al., 1997; Toyohira et al., 1998)
IFNAR2; Bovine
(chromaffin cells)
(Samal et al., 2013)
PKC, ERK1/2, STAT 1
and 2 (Douglas & Bunn,
2009)
PKC (Toyohira et al.,
1998)
IL-1 α/β
Human (cortex, medulla, and KAT45
cells) (González-Hernández et al., 1995;
Venihaki et al., 1998)
Rat and Mouse (chromaffin cells)
(Schultzberg et al., 1989)
Rat (cortex and medulla, chromaffin,
and PC12 cells) (Alheim et al., 1991;
Andersson et al., 1992; Engström et al.,
2007; Nobel & Schultzberg, 1995;
Schultzberg et al., 1995)
Human (chromaffin and KAT45 cells, in
vitro) (Rosmaninho-Salgado et al., 2009;
Venihaki et al., 1998)
Rat (medulla, in vivo) (Engström et al., 2007)
Rat (adrenal and PC12 cells, in vitro)
(Gwosdow, 1995; Gwosdow et al., 1992;
Joseph et al., 1995; Li et al., 1994; Liu et al.,
2000; Venihaki et al., 1997)
Mouse (primary chromaffin cells, in vitro)
(Rosmaninho-Salgado et al., 2007)
Bovine (medulla and chromaffin cells, in
vitro) (Ait-Ali et al., 2004; Eskay & Eiden,
1992; Morita et al., 2004; Yanagihara et al.,
1994)
IL1R1; Rat (medulla and
PC12 cells) (Engström
et al., 2007; Shu et al.,
2007)
IL1R2; Rat (medulla)
(Liu et al., 2008)
IL1RA; Rat (chromaffin
cells) (Schultzberg et al.,
1995)
MAPK, NO/PKC,
NO/GC, NPY, PKA/NO
(Rosmaninho-Salgado et
al., 2009)
NPY (Rosmaninho-
Salgado et al., 2007)
ERK1/2 (Morita et al.,
2004)
Ca2+ (Shu et al., 2007)
PKA (Joseph et al.,
1995)
CRH (Venihaki et al.,
1998)
IL-6
Human (cortex, medulla and chromaffin
cells) (Kontogeorgos, Scheithauer, et al.,
2002; Kontogeorgos, Messini, et al.,
2002; Päth et al., 1997)
Rat (medulla and PC12 cells) (Gadient
et al., 1995; Liu et al., 2000; Möller et
al., 2006; Sallmann et al., 2000)
Bovine (ZG, ZF, ZR, medulla, and
chromaffin cells) (Call et al., 2000;
Samal et al., 2013)
Human (adrenal, in vitro) (Päth et al., 1997;
Willenberg et al., 2002)
Rat (PC12, in vitro) (Li et al., 2012; Satoh et
al., 1988)
IL6R; Human (normal
and macrophage-
depleted adrenal) (Päth
et al., 1997; Willenberg
et al., 2002), Rat
(medulla) (Gadient et
al., 1995)
Gp130; Human
(adrenal) (Willenberg et
al., 2002), Rat (medulla)
(Gadient et al., 1995)
c-Fos (Satoh et al.,
1988)
STAT3 (Li et al., 2012)
32
IL-10
Rat (PC12) (Virmani et al., 2011)
TNF-α
Human (ZR, medulla, chromaffin cells,
and pheochromocytoma) (González-
Hernández et al., 1996; Kontogeorgos,
Scheithauer, et al., 2002; Tong et al.,
2004)
Rat (PC12) (Liu et al., 2000)
Bovine (adrenal capsule, cortex, and
medulla) (Call et al., 2000)
Rat (PC12, in vitro) (Goryo et al., 2011; Soeda
et al., 2001; Trincavelli et al., 2003)
Mouse (chromaffin cells, in vitro) (Ait-Ali,
Stroth, et al., 2010)
Bovine (chromaffin cells, in vitro) (Ait-Ali,
Stroth, et al., 2010; Ait-Ali et al., 2004, 2008;
Eskay & Eiden, 1992; Samal et al., 2013;
Tamura et al., 2014; Xie et al., 1993)
TNFR1; Bovine
(chromaffin cells)
(Tamura et al., 2014)
TNFR2; Bovine
(chromaffin cells) (Ait-
Ali et al., 2004, 2008;
Tamura et al., 2014)
ERK 1/2, p38, AP-1,
NFκB (Ait-Ali et al.,
2004)
NFκB (RelA, NFκB1,
NFκB2) (Ait-Ali et al.,
2008)
NFκB (various Rel class
members) (Samal et al.,
2013)
CCL2
Rat (medulla, PC12_bPAC1hop cells)
(Ait-Ali, Samal, et al., 2010; Liu et al.,
2008)
Bovine (chromaffin cells) (Samal et al.,
2013)
33
1.3.2 - Cytokine Signalling in Chromaffin Cells
Wherever they may originate, there is now strong evidence that cytokines profoundly
influence the adrenal medulla by inducing changes in secretion, intracellular signalling,
gene transcription, and translation (Bunn et al., 2012). The cytokines most studied for their
influence on adrenal chromaffin cell function include IFN-α, IL-1β, IL-6, and TNF-α.
These cytokines have likely received particular attention because they are prominent
mediators of the systemic acute phase inflammatory response.
IFN-α is a type I interferon and signals via the IFN-α receptor (IFNAR) complex, which
includes IFNAR-1 and IFNAR-2 subunits. Transcript expression of IFNAR2 has been
reported to increase in response to TNF-α treatment of bovine adrenal chromaffin cells
(Samal et al., 2013). In many cells, binding of ligand to IFNAR induces activation of janus
kinase (JAK)/signal transducer and activator of transcription (STAT) signalling, with the
phosphorylation of STAT1 and STAT2, which dimerize to form two different
transcriptional activator complexes (a STAT1 homodimer and STAT1-STAT2-IRF9
heterotrimer). IFN-α can also activate other members of the STAT family (Caraglia et al.,
2005). Treatment of bovine chromaffin cells with IFN-α induces phosphorylation,
increased expression, and nuclear translocation of STAT1 and STAT2 (Douglas & Bunn,
2009). Further, IFN-α induces an increase in STAT3 phosphorylation but only increases
nuclear STAT3 in a small proportion of cells (Douglas & Bunn, 2009). IFN-α also induces
ERK1/2 signalling downstream of PKC activation in chromaffin cells (Douglas & Bunn,
2009; Toyohira et al., 1998). Similar to IL-1, IFN-α inhibits ACh-stimulated CA secretion
from chromaffin cells (Tachikawa et al., 1997). IFN-α also suppresses NE uptake by
34
cultured bovine chromaffin cells (Toyohira et al., 1998). IFN-α induces PKC- and ERK1/2-
dependent phosphorylation of TH at the serine (Ser) -31 site (no change in phosphorylation
at Ser- 19 or 40), a post-translational modification that is linked to increased TH protein
stability and activity (Douglas & Bunn, 2009; Moy & Tsai, 2004; Sutherland et al., 1993).
ERK1/2 activation has also been reported to contribute to histamine and Ang II-induced
increases in TH Ser 31 phosphorylation in bovine adrenal chromaffin cells (Bobrovskaya
et al., 2001; Cammarota et al., 2003). Similar mechanisms of post-translational regulation
of TH by ERK1/2 in adrenal chromaffin cells may be utilized by other ERK1/2-activating
cytokines.
IL-1β increases protein levels of the CA biosynthetic enzyme TH and, like IFN-α, induces
phosphorylation of TH, in this case at the Ser-40 site which decreases inhibitory feedback
of CAs on TH activity (Daubner et al., 1992; Rosmaninho-Salgado et al., 2009). Induction
of TH phosphorylation by either IL-1β or IFN-α is transient (lasting <30 min) (Douglas &
Bunn, 2009; Rosmaninho-Salgado et al., 2009). Long-term (24 hour) incubation with IL-
1β does increase total TH protein, while incubation with IFN-α has not yet been
demonstrated to change TH protein level (Douglas & Bunn, 2009; Rosmaninho-Salgado et
al., 2009). IL-1β-induced phosphorylation of TH at other Ser sites and the involvement of
ERK1/2 signalling in IL-1β-induced TH regulation have not been investigated. IL-1
receptor (IL-1R)1 and IL-1R2 are both expressed by rat adrenal medullary cells (Engström
et al., 2007; Liu et al., 2008; Shu et al., 2007). IL-1R1 is responsible for transmembrane
signalling and IL1R2 is a decoy receptor that acts as an endogenous inhibitor, like IL-1RA,
to IL-1 signalling (Peters et al., 2013). IL-1 exists in two forms, IL-1α and IL-1β. Although
they are structurally very different, both IL-1α and IL-1β bind to the IL-1Rs and the

35
neurochemical effects of both forms are very similar (Dunn, 2006). The similarity in effects
of IL-1α and IL-1β is observed in adrenal chromaffin cells as well (Ait-Ali et al., 2004;
Gwosdow, 1995; Joseph et al., 1995; Morita et al., 2004; Rosmaninho-Salgado et al., 2009).
Stimulation of chromaffin cells with IL-1 can induce PKA, ERK1/2, nitric oxide
(NO)/PKC, and NO/guanylyl cyclase intracellular signalling mechanisms (Joseph et al.,
1995; Morita et al., 2004; Rosmaninho-Salgado et al., 2009). Some IL-1-induced effects in
chromaffin cells rely on intermediate autocrine signalling by factors such as NPY and CRH.
IL-1 induction of NPY is responsible for downstream activation of PKA/NO, as well as
ERK1/2, PKC and guanylyl cyclase pathways (Rosmaninho-Salgado et al., 2009). IL-1-
induced CRH expression can trigger a signalling loop, where CRH stimulates chromaffin
cells to produce more IL-1β (Venihaki et al., 1997, 1998). Exposure to IL-1 can also cause
increased expression of IL-1R1 in PC12 cells (Shu et al., 2007). An autocrine signalling
loop utilizing IL-1 is supported in vivo. Intravenous injection of IL-1β has been reported to
increase IL-1β and IL-1R1 mRNA levels in the medulla of rats (Engström et al., 2007).
IL-1 alone has been reported to stimulate CA release from cultures of primary adrenal
chromaffin cells and from pheochromocytomas (Gwosdow et al., 1992; Joseph et al., 1995;
Rosmaninho-Salgado et al., 2009; Venihaki et al., 1998; Yanagihara et al., 1994). A
significant portion of IL-1 induction of CA secretion relies on intermediate autocrine
signalling by NPY (Rosmaninho-Salgado et al., 2009, 2007). In contrast to basal
application of IL-1, when combined with ACh, IL-1 has an inhibitory effect on chromaffin
cell CA release (Morita et al., 2004). IL-1 may function in the homeostatic control of CA
production, where in the absence of stimulation by other sources, IL-1 enhances CA
secretion, but when other activators are present IL-1 dampens their effects on CA secretion.
36
An auto-regulatory mechanism utilizing IL-1 is supported in vivo, as administration of
cholinergic agonists increases IL-1 mRNA and decreases IL-1 protein stores in rat adrenals,
suggesting enhanced IL-1 secretion in response to cholinergic stimulation (Andersson et
al., 1992; Schultzberg et al., 1989). Interestingly, it has been reported that medullary
expression of IL-R2 is increased by immobilization stress (Liu et al., 2008). If IL-1 is
involved in homeostatic control of CA production, increased expression of the decoy
receptor IL-1R2 may be a stress-specific response, whereby IL-1R2 prevents IL-1 from
dampening CA release in response to a psychological stressor. Differential regulation of
CA biosynthetic enzymes has been reported in response to long-term exposure to cold or
immobilization stress (Kvetnansky, 2004; Kvetnansky et al., 2002, 2003).
IL-6 binds to a receptor complex consisting of IL-6 receptor (IL-6R) and glycoprotein (gp)
130 components. IL-6 binds to IL-6R, which can exist in either soluble or membrane-bound
forms. The receptor-ligand complex then couples to the gp130 signal transducing
component, promoting dimerization of gp130, facilitating downstream signalling
(Kamimura et al., 2003). JAK/STAT3 and MAPK/ERK signalling are common IL-6
activated pathways and are induced in neurons exposed to IL-6 (Fang et al., 2013). IL-6-
induced STAT3 signalling has been reported in PC12 cells, and both STAT3 and ERK1/2
signalling mechanisms are supported by preliminary investigations using bovine
chromaffin cells (Bunn et al., 2009; Li et al., 2012). The signal transducing component of
the IL-6R complex is shared with other IL-6 family cytokines which, like IL-6, bind to
ligand-specific receptors which then complex with a gp130. Thus, gp130 expression in the
adrenal chromaffin cells can be inferred by responsiveness to other IL-6 family cytokines
(Gadient et al., 1995). In immune cells, IL-6 activates AP-1 via a Ras-dependent MAPK

37
signalling mechanism (Jones et al., 2001). Activation of this transcription factor may also
occur in chromaffin cells, as IL-6 has been reported to induce increases in c-fos transcript
in PC12 cells (Satoh et al., 1988). In PC12 cells, high concentrations of IL-6 were also
found to have an inhibitory effect the basal CA-producing function, decreasing DA and NE
release as well as TH protein (Li et al., 2012).
TNF-α binds to the plasma membrane situated receptors TNF receptor (TNFR) 1 and
TNFR2. Binding of ligand to these receptors can initiate signalling cascades that utilize
numerous protein kinases and lead to the activation of two major transcription factors, AP-
1 and NFκB (Baud & Karin, 2001). Bovine chromaffin cells have been found to express
TNFR1 and TNFR2; however, TNFR1 appears to be more consistently expressed of the
two (Ait-Ali et al., 2004, 2008; Tamura et al., 2014). A detailed investigation by Ait-Ali et
al. (2004) found that TNF-α signalling in bovine chromaffin cells relies on ERK1/2 and
p38 signal transduction mechanisms. Further, this study determined that activation of the
transcription factor AP-1 occurs downstream of ERK1/2 activation, also finding that TNF-
α induces NFκB transcription factor activity in an ERK1/2-independent manner. In
chromaffin cells, TNF-α-induced NFκB signalling appears to involve primarily the p65
subunit, and possibly p52 and p50 subunits. Thus, transcriptional regulation likely occurs
primarily via the p65 homodimer (Ait-Ali et al., 2008). The inhibitor of NFκB, PDTC,
blocks the enhancement of the transcript levels of some genes by TNF-α (Ait-Ali et al.,
2008). Later experiments demonstrated that a variety of Rel family transcription factors are
likely involved in the transcriptional regulatory effects of TNF-α (Samal et al., 2013). TNF-
α has been reported to induce and to modulate neuropeptide transcript and protein in bovine
adrenal chromaffin cells (Ait-Ali, Stroth, et al., 2010; Ait-Ali et al., 2004; Eskay & Eiden,
38
1992). The effects of TNF-α on CA production have not been thoroughly investigated. A
study of cytokine modulation of hypoxic response found that TNF-α can inhibit hypoxic
induction of TH transcript (Goryo et al., 2011). An oligonucleotide microarray analysis of
TNF-α-induced changes in bovine chromaffin cell transcriptome identified upregulation of
PNMT transcript after long (48 hour), but not short (6 hour) exposures to the cytokine (Ait-
Ali et al., 2008).

39
Figure 6: Simplified schematic of neural, hormonal, and immune signalling pathways activated in adrenal chromaffin cells. These intracellular signals may be
integrated to regulate production of CAs by chromaffin cells during normal or pathological conditions. Dashed line represents signalling mechanism supported by
unpublished findings. ACh = Acetylcholine; PACAP = Pituitary Adenylate Cyclase-Activating Peptide; AC = Adenylyl Cyclase; GR = Glucocorticoid Receptor;
HSP = Heat Shock Protein; NPY = Neuropeptide Y; PKA = Protein Kinase A; NO = Nitric Oxide; PKC = Protein Kinase C; GC = Guanylyl Cyclase.
40
In addition to direct signalling mechanisms of cytokines (Fig. 6), evidence is now emerging
that cytokines can induce long-term changes in chromaffin cells through the activation of
autocrine signalling loops. It is a well-established phenomenon that in immune cells
cytokines favour their own production and the production of other cytokines, resulting in
the formation of autocrine signalling cascades (Cavaillon et al., 2003). Two long
established examples are IL-1 and TNF-α, which can stimulate their own production, along
with the production of numerous other cytokines and inflammatory mediators (DeForge et
al., 1992; Descoteaux & Matlashewski, 1990; Dinarello et al., 1987; Sparacio et al., 1992).
These autocrine signalling loops can be self-regulating by stimulating the production of
anti-inflammatory molecules such as IL-10 (de Waal Malefyt et al., 1993; Wanidworanun
& Strober, 1993). By inducing the production of autocrine signalling molecules, cytokines
may initiate long-term signalling programs in the adrenal medulla (Ait-Ali, Stroth, et al.,
2010; Call et al., 2000; Eskay & Eiden, 1992). For example, in primary cultures of bovine
adrenal chromaffin cells, treatment with IL-1α has been reported to induce production of
the cytokines IL-6 and TNF-α, as well as the neuropeptides VIP, NPY and Met-Enkephalin
(Call et al., 2000; Eskay & Eiden, 1992). Intermediate autocrine signalling by NPY is
critical for CA regulatory effects of IL-1 in chromaffin cells (Rosmaninho-Salgado et al.,
2009, 2007).
Whether the responses of medullary cells to cytokines primarily functions for protective
action against microbial challenge or if cytokines are a normal part of the diverse
informational molecules that constantly regulate chromaffin cell homeostatic function, it is
clear that local changes in cytokine signalling within the medulla has potential to exacerbate
dysfunctional CA production. The regulation of adrenal function by cytokines and the
41
importance of changes in immune operation in contributing to the progression of
hypertension and CVD are summarized above. The bi-directional relationship of the
immune and neuro-endocrine systems conceivably provides fitness advantages to
organisms in ways similar to the ‘neuro-immune circuit’ and may be a physiologically
important part of maintaining health, dysfunction of which may result in pathology. The
neuro-immune circuit has helped to explain perplexing phenomena such as the co-
morbidity of neuropsychiatric symptoms and inflammatory disease (Irwin & Cole, 2011).
Similarly, integration of immune and adrenal functions provides an explanation for the
aetiology of inflammation-related hypertension and may help to elucidate mechanisms of
essential hypertension.
1.3.3 - Cytokine Modulation of Glucocorticoid Signalling in Chromaffin Cells
GCs and transmitters released at splanchnic-adrenal medullary synapses are important
informational molecules which control Epi biosynthesis during normal and stress
conditions [see (Wong, 2006) and references therein]. Chromaffin cells must coordinate
intracellular signalling pathways induced by these and other informational molecules in
order to produce appropriate responses under diverse physiological conditions. Cytokines
produced either systemically or locally may be significant modulators of adrenal CA
biosynthesis by altering chromaffin cell response to GCs and neurotransmitters. How, and
to what extent, chromaffin cells simultaneously process information from immune and
stress circuits is not well understood.

42
A number of the cytokines, including IFN-α, IL-1, IL-2, and TNF-α, have been reported to
have inhibitory effects either on GC-induced GR nuclear translocation, GR-GRE binding,
or GR-mediated gene transcription in diverse cell types (Pace & Miller, 2009; Smoak &
Cidlowski, 2004). In mouse hippocampal HT22 cells, inhibition of GR transcriptional
activity by IFN-α is dependent on JAK/STAT signalling pathway. STAT5 (not STAT1 or
STAT2) appears to be the major mediator of IFN-α inhibitory effects on GR function in
HT22 cells. Co-immunoprecipitation revealed that phosphorylated STAT5 binds to GR
within the nucleus, and IFN-α-induced repression of GR function does not rely on
inhibition of GR protein expression or nuclear translocation (Hu et al., 2009). In bovine
chromaffin cells, IFN-α does not induce phosphorylation of STAT5; instead, IFN-α
primarily activates STAT1 and STAT2 (Douglas & Bunn, 2009). A trimeric complex
consisting of STAT1, STAT2, and interferon regulatory factor (IRF) 9, induced by IFN-
α/β receptor activation, is directly regulated by the nuclear coactivator of GR,
glucocorticoid receptor-interacting protein (GRIP) 1 in murine macrophages (Flammer et
al., 2010). Occupancy of target promoters by the STAT1-STAT2-IRF9 complex, pre-
initiation complex assembly, and type I IFN stimulated gene expression were reported to
be repressed by dexamethasone (Dex)-induced depletion of GRIP. Inhibition of IFN-
induced gene expression by Dex appears to be caused by sequestration of GRIP1 from its
functional activity as a coactivator for the STAT1-STAT2-IRF9 complex by GR.
Conceivably, as long as GRIP1 protein levels are sufficiently low in adrenal chromaffin
cells, this competitive mechanism could allow for the converse effect, whereby induction
of the STAT1-STAT2-IRF9 complex by IFN-α leads to an inhibition of GR transcriptional
effects through the repression of GRIP1 coactivation of GR.
43
In mouse fibroblast cells, inhibition of GR-GRE binding and GR-mediated promoter
activation by IL-1 has been reported to depend on p38 signalling (Wang et al., 2004). The
mechanism of p38 regulation of GR appears to involve direct phosphorylation of GR at the
Ser-211 site (human) which modulates recruitment of GR coactivators to GRE-containing
promoters (Kino et al., 2007; Miller et al., 2005). So far, p38 signalling has not been
demonstrated as a significant contributor in IL-1 regulation of chromaffin cell function
(Morita et al., 2004). Activation of p38 signalling pathway could possibly be a mechanism
for inhibition of GR function by other cytokines, such as TNF-α, which have been reported
to induce p38 signalling in chromaffin cells (Ait-Ali et al., 2004).
IL-2 inhibition of GR is dependent on signal transduction by p38 (reported in murine HT-
2 T-helper cell line) and by JAK3 (reported in human PBMCs), both contributing to
inhibition of GR nuclear translocation (Goleva et al., 2002; Irusen et al., 2002). In a murine
T-lymphocyte cell line (CTLL-2) IL-2 represses GR transactivation through direct protein-
protein interactions of IL-2-induced STAT5 with GR following translocation to the nucleus
(Biola et al., 2001).
In human keratinocyte-derived HaCaT cells, TNF-α inhibits GC-induced transcriptional
activation and GR nuclear translocation through a MEK-1/ERK-dependent mechanism
(Onda et al., 2006). In human epithelial-derived HeLa cells, the inhibitory effect of MAPK
signalling on GR function is demonstrated by inhibition of transcriptional activation of GR-
responsive luciferase constructs in the presence of constitutively activated p38 or JNK
(Szatmáry et al., 2004). In human colon carcinoma-derived HCT116 cells, TNF-α can
suppress GR transactivation by induction of FLICE-associated huge protein, which
44
competes with GR to bind the nuclear coactivator GRIP1 (Kino & Chrousos, 2003).
Additionally, mutual repression of GR and NFκB function may result from transrepression
(also known as tethering), caused by direct protein-protein interactions within the nucleus,
or from competition for the cofactors CBP and steroid receptor coactivator-1 (Caldenhoven
et al., 1995; Ray & Prefontaine, 1994; Sheppard et al., 1998).
IL-6 enhances GR function through a STAT3-dependent mechanism in rat hepatoma H4IIE
cells. Like STAT5, STAT3 forms complexes with GR in the nucleus; however, unlike
STAT5, formation of a STAT3-GR complex appears to enhance promoter activation, both
of IL-6 responsive elements and at GREs (Zhang et al., 1997).
IL-10 is another cytokine reported to have synergistic rather than inhibitory effects on GR
function. In a study using human leukocytes (U937 cells and whole blood cell cultures),
treatment with the anti-inflammatory cytokine IL-10 had opposite effects to TNF-α.
Inhibition of IL-6 secretion in whole-blood cell cultures and promotion of IL-1R antagonist
secretion by human monocyte-derived U937 cells are two effects of Dex treatment. TNF-
α supresses, whereas IL-10 intensifies these Dex-induced activities (Franchimont et al.,
1999). The mechanism of IL-10 and GR signalling crosstalk is not yet understood;
however, the effect may be achieved through an increase in GR production (Franchimont
et al., 1999). Other possible mechanisms include IL-10-induced activation of STAT3, or
IL-10 induced inhibition of NFκB, a transcription factor which inhibits GR function
through transrepression (Ray & Prefontaine, 1994; Wang et al., 1995; Williams et al.,
2004).
45
The mechanisms of cytokine-induced GR regulation involve intermediate signalling
molecules such as MAPKs and transcription factors including STAT1, STAT2, STAT3,
STAT5, NFκB, and AP-1. In chromaffin cells, the most commonly reported signalling
pathway by cytokines is that of the MAPK transduction molecules, particularly ERK1/2
(Bunn et al., 2012). The MAPKs JNK and ERK can inhibit GR-mediated transcriptional
activation by direct and indirect phosphorylation of GR at Ser-246 (rats, Ser-226 in
humans), which may prevent signalling by promoting nuclear export of the transcription
factor (Galliher-Beckley & Cidlowski, 2009; I Rogatsky et al., 1998). ERK1/2 signalling
can also lead to AP-1 transcription factor activity. In chromaffin cells, both IL-6 and TNF-
α have been reported to induce activation of AP-1 subunits (Ait-Ali et al., 2004; Satoh et
al., 1988). Treatment of bovine chromaffin cells with TNF-α increases transcriptional
activation of AP-1 responsive promoter elements and increases binding of fos and jun
proteins to TRE and CRE sequences through an ERK1/2-dependent mechanism (Ait-Ali et
al., 2004). In humans, GC resistance is positively correlated with expression of c-fos in
peripheral blood mononuclear cells in vivo (Takahashi et al., 2002). The interaction
between GR and AP-1 is mutually repressive, involving tethering at the GR-DNA binding
domain; thus, inhibition of GR function may occur after GR translocation to the nucleus
(Heck et al., 1994; Kassel et al., 2004; Inez Rogatsky et al., 2002; Schüle et al., 1990).
Activation of AP-1 signalling may be a component of chromaffin cell regulation by other
ERK1/2-inducing cytokines, such as IFN-α and IL-1, and leading to insensitivity of
chromaffin cells to GCs.
46
1.3.2 - Cytokine Modulation of Neurotransmitter and cAMP Signalling in Chromaffin
Cells
Integration of neurotransmitters such as ACh and PACAP with some cytokines has been
demonstrated in chromaffin cells. IL-1 inhibits ACh-induced CA release via ERK1/2-
mediated suppression of Ca2+ influx in bovine chromaffin cells (Morita et al., 2004).
Similarly, IFN-α has been reported to decrease ACh-stimulated CA secretion and Ca2+
influx in bovine chromaffin cells (Tachikawa et al., 1997). Chromaffin cell response to the
neuropeptide PACAP is also modified by cytokine exposure. Combined treatment with
PACAP and TNF-α synergistically upregulates VIP and galanin expression in bovine
chromaffin cells (Ait-Ali, Stroth, et al., 2010).
The signalling pathways of cAMP and cytokines may be integrated through interactions at
MAPK, JAK-STAT, and NFκB. A number of studies report effects of cAMP/PKA
signalling on the function of these other signalling molecules. In a human T-lymphocyte
cell line (Jurkat cells) cAMP increase ERK1/2 activity by inhibiting function of
haematopoietic protein tyrosine phosphatase, a negative regulator of ERK1/2 and p38
(Saxena et al., 1999). In experiments using mouse (70Z/3) and human (Jurkat) lymphocyte
cell lines, PKA was reported to contribute to the activation of NFκB by phosphorylating
p65 following dissociation from IκB (Zhong et al., 1997). In human PBMCs, cAMP has an
inhibitory effect on IL-6-induced STAT1 and STAT3 binding to DNA and prevents IL-6
induction of an IL-6-responsive gene harbouring a STAT1 and STAT3 binding sequence
(Sengupta et al., 1996). Compared to cAMP regulatory effects on cytokine signalling
pathways, the effects of cytokines on cAMP signalling are less well understood. This may
47
in part be because cAMP activation occurs early in intracellular signalling cascades and the
cellular output of cAMP activation is highly tissue-dependent (Taskén & Aandahl, 2004;
Zhang et al., 2005). In chromaffin cells, transcription factors involved in response to
cAMP/PKA signalling include Egr1, AP-1, and CREB (Ginty et al., 1991; Swanson et al.,
1998; Tai et al., 2001). Signalling via cAMP in chromaffin cells may also lead to activation
of the MAPKs p38 and ERK1/2 (Hansen et al., 2000; Vaudry et al., 2009). In bovine
chromaffin cells, the cytokines IL-1 and TNF-α have been reported to enhance induction
of VIP and substance P expression by forskolin (Forsk) an activator of adenylyl cyclase
(Eskay & Eiden, 1992). The mechanisms of cytokine modulation of cAMP signalling in
chromaffin cells have not been defined.
1.4 - Hypothesis and Objectives
1.4.1 - Hypothesis
Current literature supports roles for numerous cytokines in influencing blood pressure and
in regulating function of adrenal chromaffin cells. Cytokines are expressed locally in the
adrenal medulla and changes in circulating cytokine levels have been reported in
hypertensive patient cohorts. It was predicted that cytokines can directly regulate the CA
biosynthetic pathway in adrenal chromaffin cells, thus, providing a mechanism for
inflammation-mediated regulation of CA production during hypertension. Based on the
current literature, it was predicted that the cytokines IFN-α, IL-1β, TNF-α, and CCL2
would increase, while IL-2, IL-6, and IL-10 would decrease CA biosynthetic enzyme
48
expression in PC12 cells. Further, it was hypothesized that cross-talk between immune and
GC or cAMP signalling pathways would be observed in chromaffin cells. Changes in CA
biosynthetic enzyme transcript levels were predicted to be regulated by changes in
promoter activation. Cytokines were predicted to influence promoter activation by GCs,
possibly by regulating nuclear localization of GR.
1.4.2 - Objectives
The objectives of this study were: (i) to analyze possible regulatory effects of cytokines on
expression of the catecholamine biosynthetic enzymes TH, DBH and PNMT in PC12 cells.;
(ii) to determine if hormonal or neural activation, mimicked by Dex and Forsk respectively,
of TH, DBH and PNMT expression is modulated by cytokine signalling; and (iii) to
investigate the mechanisms involved in the transcriptional regulatory effects of cytokines
by analyzing PNMT promoter activation and GR nuclear localization.
49
2 - Methods
2.1 - Cell Culture
PC12 cells (ATCC; Manassas, Virginia, USA) were cultured in 100 mm tissue culture
dishes (Biolite; Thermo Scientific; Waltham, Massachusetts, USA) in Dulbecco’s
Modified Eagle’s Medium (DMEM), supplemented with 5% bovine calf serum, 5% equine
serum (Hyclone Laboratories Inc.; Logan, Utah, USA) and 50 ng/ml gentamycin sulphate
(Sigma-Aldrich; St. Louis, Missouri, USA). The cells were maintained in a humidified
incubator at 37C containing 5% CO2 (Forma Series I Water Jacketed CO2 Incubator,
Thermo Scientific) and grown to a confluence of 80-90% before being planted in a
subsequent passage for experimentation. In all experiments, cells (passage 14-20) were
grown in DMEM containing 5% charcoal-treated serum (equal parts bovine calf and equine
serum) and gentamycin sulphate. Charcoal treatment was required for the removal of
endogenous hormones and growth factors that would otherwise affect the expression of the
genes of interest. In all experiments, prior to planting, cells were dissociated using trypsin,
counted and viability determined using a cell viability analyzer (Vi-cell XR, Beckman
Coulter; Mississauga, Ontario, Canada). In all experiments, cells were planted in 5%
charcoal treated media (CTM) and allowed to acclimate for 24 hours to the reduced serum
environment prior to treatment with cytokines. At the end of the acclimation period,
medium was changed to fresh 5% CTM just prior to the addition of cytokines or drugs.
50
For RNA extraction and RT-qPCR experiments, 0.7 x10 6 cells were planted in 1 ml of
medium per well in 12 well plates (Corning; Tewksbury, Massachusetts, USA). For
luciferase assays, 0.35 x10 6 cells were planted in 1 ml per well in 24 well plates (Corning).
For nuclear protein extraction and western blotting, 2.5 x10 6 cells were planted in 2 ml of
medium per well in 6 well plates (Biolite dishes, Thermo Scientific). For microscopy, cells
were planted using the same method as for nuclear protein extraction; however a coverslip
was inserted into the bottom of the 6 well plates prior to planting cells.
2.2 - Cell Treatments
2.2.1 - Cytokine Sources, Preparation, and Application
The cytokines used in the study were: rat IL-1β, rat IL-2, rat IL-6, rat IL-10, rat TNF-α
(PeproTech Inc.; Rocky Hill, New Jersey, USA); rat IFN-α (Sigma-Aldrich) and rat CCL2
(R&D systems; Minneapolis, Minnesota, USA). All cytokines were obtained as lyophilized
powders and were resuspended in specific buffers prepared in 0.1% BSA (Table 2) as per
manufacturer specifications, and further aliquoted for long term storage at -80°C.
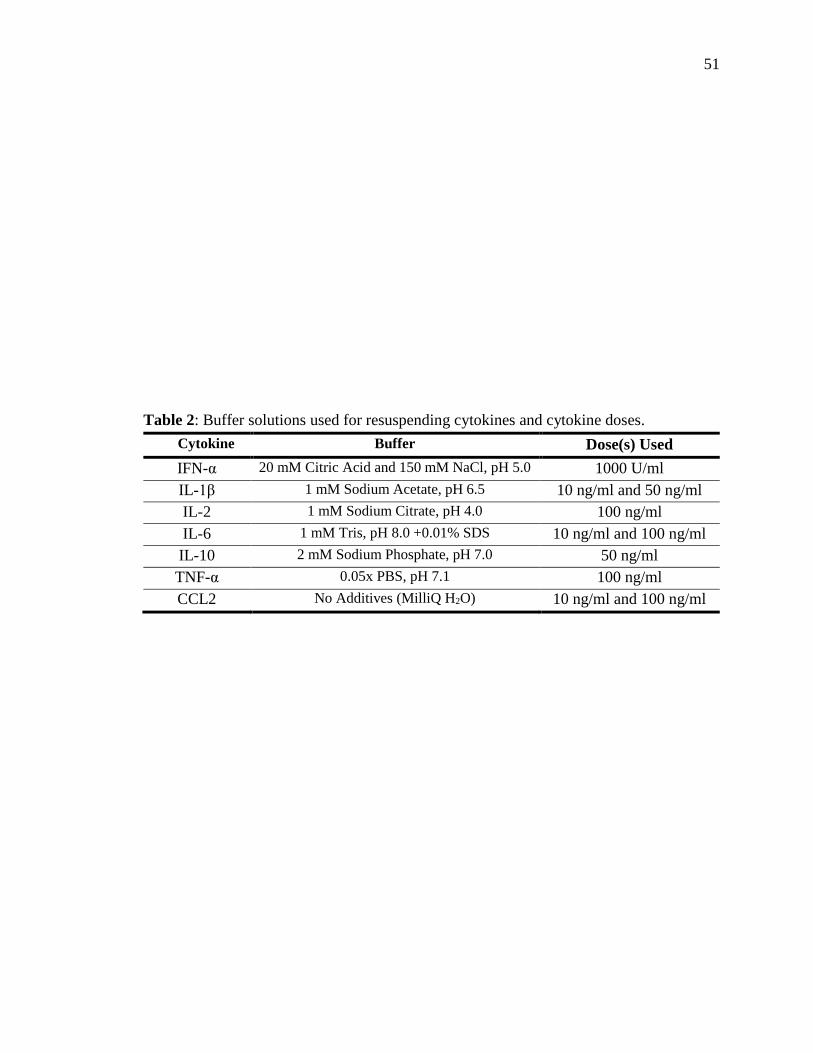
51
Table 2: Buffer solutions used for resuspending cytokines and cytokine doses.
Cytokine Buffer Dose(s) Used
IFN-α 20 mM Citric Acid and 150 mM NaCl, pH 5.0 1000 U/ml
IL-1β 1 mM Sodium Acetate, pH 6.5 10 ng/ml and 50 ng/ml
IL-2 1 mM Sodium Citrate, pH 4.0 100 ng/ml
IL-6 1 mM Tris, pH 8.0 +0.01% SDS 10 ng/ml and 100 ng/ml
IL-10 2 mM Sodium Phosphate, pH 7.0 50 ng/ml
TNF-α 0.05x PBS, pH 7.1 100 ng/ml
CCL2 No Additives (MilliQ H2O) 10 ng/ml and 100 ng/ml
52
Doses of cytokines and period of treatment were determined from prior screening
experiments (data not shown) or were selected based on previously published literature (see
Table 1 for papers). Two doses were selected for some cytokines when literature indicated
multiple effective doses or bimodal response patterns (see Table 2). For the initial screening
experiments, two time points (6 and 24 hours) of treatment with cytokine were used. All
remaining experiments described below were performed with a 24-hour cytokine treatment.
In all experimental designs, vehicle treated groups were included to account for effects
from buffers.
2.2.2 - Dexamethasone and Forskolin Sources, Preparation, and Application
In all experiments analyzing the effect of cytokine on modifying responses to GC or cAMP
signalling, samples were treated with Dex (Cayman Chemicals; Ann Arbor, Michigan,
USA) or Forsk (L.C. Laboratories; Boston, Massachusetts, USA) respectively. Drugs were
dissolved according to manufacturer’s instructions and stored at -80⁰C. Immediately prior
to treating cells, drugs were diluted in 5% CTM to concentrations of 10 mM and 100 µM
for Forsk and Dex respectively. Drugs were then applied to cells to obtain final
concentrations of 10 µM and 1 µM for Forsk and Dex respectively. Cells were treated with
either Dex of Forsk 6 hours prior to harvesting. Drug concentrations and treatment times
were based on previous studies from our laboratory (Tai et al., 2002; Tai & Wong, 2003).
53
2.3 - RNA extraction, cDNA Synthesis and RT-qPCR
2.3.1 - RNA Extraction
At the end of treatment period, media was aspirated and RNA extracted with Trizol reagent
(Sigma-Aldrich) as per the manufacturer’s protocol. In brief, cells were lysed with Trizol
(500 µl) by pipetting several times before transferring to fresh tubes. Subsequently, 100 l
of chloroform was added, mixed thoroughly by vortexing, and incubated for 10 minutes at
room temperature, then the samples were centrifuged (12,000 x g) for 20 minutes at 4˚C.
The aqueous phase containing the RNA was transferred to a fresh tube and RNA
precipitated with isopropanol; 125 l of isopropanol was added per sample and incubated
for 5-10 minutes, followed by centrifugation at 12,000 x g for 8 minutes at 4°C. The RNA
pellet was washed with 500 l of 70% ethanol and centrifuged (7,500 x g) for 5 minutes at
4˚C. Ethanol was then removed, RNA pellets air-dried, then dissolved in RNAse-free,
diethyl pyrocarbonate-treated water. RNA concentration was determined at 260 nm using
a NanoDrop ND-1000 Spectrophotometer (Nanodrop Technologies; Wilmington,
Delaware, USA).
2.3.2 - DNAse Treatment and cDNA Synthesis
Prior to cDNA synthesis, 2 µg of RNA was treated with Amplification Grade DNAse I (1
U/μL; Sigma Aldrich) for 15 minutes at room temperature in the DNAse Reaction buffer.
The reaction was terminated by the addition of a stop solution (50 mM EDTA; Sigma-
54
Aldrich) followed by heating at 70°C for 10 minutes. For cDNA synthesis, M-MLV
Reverse Transcriptase (M-MLV RT, Promega; Madison, Wisconsin, USA) was used as per
the manufacturer’s instructions. Briefly, random primers (1 μg) were added to the DNAse-
treated RNA and heated for 5 minutes at 70°C. After cooling on ice, a master mix
containing reaction buffer, dNTPs and M-MLV RT was added to the reaction mix and
samples were reverse transcribed at 37°C for 1 hour using a Mini Thermal Cycler (BioRad).
cDNAs were stored at -20⁰C for up to two weeks or -80⁰C for extended storage.
2.3.3 - Quantitative Real Time PCR
The transcripts for RPL29, TH, DBH, and PNMT were quantified by quantitative PCR
using the GoTaq qPCR mastermix with SYBR Green (Promega) as per the instructions
from the manufacturer. Briefly, for each gene, a standard curve using serial dilutions (0.78
ng to 50 ng) of cDNA from control cells prepared in parallel with the experimental samples
was used to determine the efficiency of PCR reactions and to validate primers. Following
this, the lowest cDNA input that yielded high efficiency (95-100%) with Ct value between
16-32 cycles was selected for subsequent qPCR analysis of target genes. The qPCRs were
performed in a BioRad Chromo 4 machine and analyzed using the Opticon Monitor
program (BioRad). The cycling conditions, primers, and cDNA input for each gene target
is summarized Table 3. Specificity of the product was analyzed by assessing the melting
curve. The Ct value for each sample was determined and fold changes were analyzed using
the

55
𝑟𝑎𝑡𝑖𝑜 = (𝐸𝑡𝑎𝑟𝑔𝑒𝑡)𝛥𝐶𝑇𝑡𝑎𝑟𝑔𝑒𝑡(𝑐𝑜𝑛𝑡𝑟𝑜𝑙−𝑠𝑎𝑚𝑝𝑙𝑒)
(𝐸𝑟𝑒𝑓)𝛥𝐶𝑇𝑟𝑒𝑓(𝑐𝑜𝑛𝑡𝑟𝑜𝑙−𝑠𝑎𝑚𝑝𝑙𝑒)
⁄ method (Pfaffl,
2001). For each experimental condition in a set, three biological replicates were included.
All samples were run in duplicate in the qPCR (technical replicates), and the experiment
was performed for n=3 unless otherwise stated in the legend.
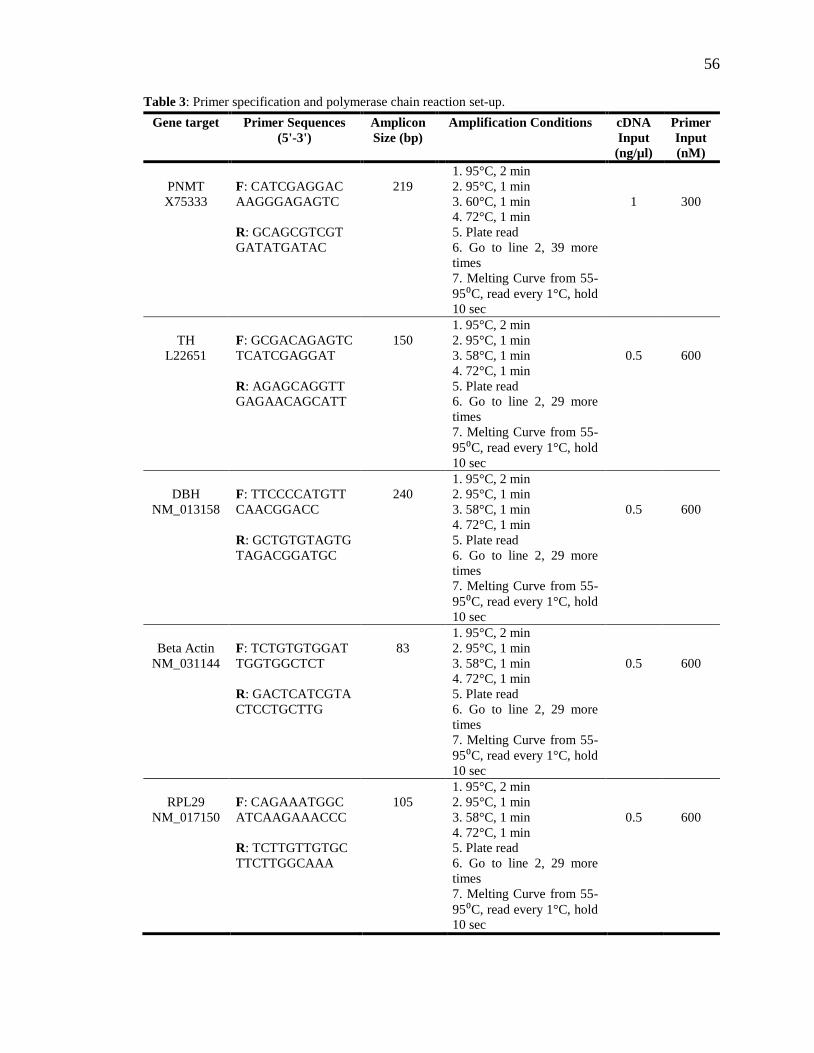
56
Table 3: Primer specification and polymerase chain reaction set-up.
Gene target Primer Sequences
(5'-3')
Amplicon
Size (bp)
Amplification Conditions cDNA
Input
(ng/µl)
Primer
Input
(nM)
PNMT
X75333
F: CATCGAGGAC
AAGGGAGAGTC
R: GCAGCGTCGT
GATATGATAC
219
1. 95°C, 2 min
2. 95°C, 1 min
3. 60°C, 1 min
4. 72°C, 1 min
5. Plate read
6. Go to line 2, 39 more
times
7. Melting Curve from 55-
95⁰C, read every 1°C, hold
10 sec
1
300
TH
L22651
F: GCGACAGAGTC
TCATCGAGGAT
R: AGAGCAGGTT
GAGAACAGCATT
150
1. 95°C, 2 min
2. 95°C, 1 min
3. 58°C, 1 min
4. 72°C, 1 min
5. Plate read
6. Go to line 2, 29 more
times
7. Melting Curve from 55-
95⁰C, read every 1°C, hold
10 sec
0.5
600
DBH
NM_013158
F: TTCCCCATGTT
CAACGGACC
R: GCTGTGTAGTG
TAGACGGATGC
240
1. 95°C, 2 min
2. 95°C, 1 min
3. 58°C, 1 min
4. 72°C, 1 min
5. Plate read
6. Go to line 2, 29 more
times
7. Melting Curve from 55-
95⁰C, read every 1°C, hold
10 sec
0.5
600
Beta Actin
NM_031144
F: TCTGTGTGGAT
TGGTGGCTCT
R: GACTCATCGTA
CTCCTGCTTG
83
1. 95°C, 2 min
2. 95°C, 1 min
3. 58°C, 1 min
4. 72°C, 1 min
5. Plate read
6. Go to line 2, 29 more
times
7. Melting Curve from 55-
95⁰C, read every 1°C, hold
10 sec
0.5
600
RPL29
NM_017150
F: CAGAAATGGC
ATCAAGAAACCC
R: TCTTGTTGTGC
TTCTTGGCAAA
105
1. 95°C, 2 min
2. 95°C, 1 min
3. 58°C, 1 min
4. 72°C, 1 min
5. Plate read
6. Go to line 2, 29 more
times
7. Melting Curve from 55-
95⁰C, read every 1°C, hold
10 sec
0.5
600
57
2.5 - Western Blot
2.5.1 - Protein Extraction and Quantification
After completion of experimental treatments, samples were washed twice with cold PBS,
scraped from the dish and transferred into a 1.5 ml tube in 1 ml of PBS. Next, samples were
centrifuged (15,700 x g) for 10 seconds at 4 ºC and the supernatant discarded. The cells
were resuspended with 150 l of lysis buffer A (10 mM Hepes-KOH, 1.5 mM MgCl2, 10
mM KCl, 0.5 mM DTT, 0.2 mM PMSF, 20 µl protease inhibitor cocktail) and incubated
on ice for 10 min. To enhance cell lysis, each sample was force ejected 10 times through a
22-gauge needle using 1ml syringes. Next, samples were vortexed for 10 seconds,
centrifuged (15,700 x g) for 10 seconds at 4 ºC, and the supernatant containing the cytosolic
protein fraction was collected. For nuclear protein extraction, the pellet was resuspended
in 50 l of lysis buffer C (20 mM Hepes KOH, 1.5 mM MgCl2, 420 mM NaCl, 25%
glycerol, 0.2 mM EDTA, 0.5 mM DTT, 0.2 mM PMSF, 20 µl protease inhibitor cocktail)
and incubated on ice for 20 min. Finally, samples were centrifuged (15,700 x g) for 2
minutes at 4C and the supernatant containing nuclear proteins was collected into a new
1.5 ml microcentrifuge tube. The samples were kept at -80°C for long-term storage.
Protein concentration was determined using the Bradford assay employing a protein
standard made with purified IgG ranging from 1-20 μg. The standards and sample dilutions
were plated in a total volume of 20 μl in a clear 96 well flat-bottomed microplate (Corning).
Next, 250 μl of 1x Bradford reagent (BioRad) was added to each well and incubated on a
microplate shaker at room temperature for 5 minutes. The absorbance was measured at a
58
wavelength of 595 using a spectrophotometer (Bio-Tek Instruments Inc.; Winooski,
Vermont, USA). The data was analyzed with KC-4 software to determine total amount of
protein using the standard curve.
2.5.2 - Sample Preparation
From each sample, 30 g of total nuclear protein was transferred to a fresh tube, and their
volume adjusted using lysis buffer C so that all samples have identical volumes of at least
20 l (to facilitate accurate pipetting). Sample loading dye with β-mercaptoethanol was
added and sample preparations were heated to 100C for 5 minutes and then immediately
loaded onto gels.
2.5.3 - Gel Casting
Polyacrylamide gels for protein gel electrophoresis were prepared using 10%
polyacrylamide resolving gel and 4% polyacrylamide stacking gel in 1.5 mm spaced plates
(BioRad) and 15-well combs (BioRad). 10 l of PageRuler Prestained protein ladder
(FroggaBio; North York, Ontario, Canada) was loaded as a molecular weight marker. Gels
were run at 75 V until the dye front migrated from the stacking gel into the resolving gel.
The voltage was then increased to 100 V and resolved until the dye front migrated to the
base of the gel.
59
2.5.4 - Protein Transfer
Gels were transferred onto 0.2 μm pore size nitrocellulose membranes (Pall Laboratories;
Port Washington, New York, USA) using transfer cassettes and the immersed tank system
(BioRad) with 1x Transfer buffer (250mM Tris, 1.92M glycine with 20% methanol) for
1hr at 100 V.
2.5.4 - Western Blot
The membranes were incubated in blocking buffer made with 5% skim milk in Tris Buffer
Saline with Tween (TBS-T; 10 mM Tris-HCl pH 8.0, 150 mM NaCl, 0.05% Tween-20) for
a minimum of 30 minutes on a rocker. Membranes were then rinsed 4 times in TBS-T for
10 minutes each at room temperature. The blots were incubated with primary antibody
diluted in blocking buffer overnight at 4C on a rocker (1:1000 anti GR; clone M-20, Santa
Cruz Biotechnology; Dallas, Texas, USA). Next, membranes were washed 4 times in TBS-
T (10 min each), and then incubated in horseradish peroxidase (HRP) conjugated anti-rabbit
secondary antibody diluted in blocking buffer (1:2000 goat anti rabbit-HRP, Santa Cruz
Biotechnology) for 1 hour. Finally, the membranes were washed again in TBS-T (10 min,
4 times) were blotted dry and proteins were detected by enhanced chemiluminescence
(ECL) and visualized on film processed on a developer. After the films were developed,
membranes were washed twice with TBS-T and stained with Ponceau S. Images of the
60
Ponceau S stained membrane were acquired using the BioRad Molecular FX Imager with
the Sypro Ruby red module (BioRad).
2.5.5 - Densitometry
For densitometric analysis, the band intensities were quantified using Image J software. For
quantification of variation in GR under the various experimental conditions, the intensity
of GR was normalized to the intensity of a band visualised by Ponceau S staining.
2.4 - Analysis of PNMT Promoter Activation
2.4.1 - Transformation and Plasmid Preparation
PC12 cells were transfected with a PNMT promoter driven luciferase reporter construct
(pGL893PNMT), consisting of the 893 bp proximal region of the rat PNMT promoter
sequence (-863 to +18 bp) cloned into the pGL3Basic vector (Promega) (for details see Her
et al., 1999). 1 µg of the stock plasmid was used to transform competent DH5α bacteria as
per the manufacturer’s protocol (Invitrogen; Carlsbad, California, USA). Bacteria
harbouring the plasmid were selected on Luria Bertani (LB) agar plates supplemented with
ampicillin; selected colonies were then grown in LB broth with ampicillin and plasmid
extracted using the PureLink HiPure Plasmid Filter MaxiPrep kit (Invitrogen). The plasmid
was resuspended in Tris-EDTA (TE) buffer, DNA concentration determined by NanoDrop
61
ND-1000 Spectrophotometer (Nanodrop Technologies) and adjusted to a concentration of
1 μg/μl before being aliquoted for storage at 4 ºC.
2.4.2 - Transfection and Luciferase Assay
PC12 cells were seeded in 24 well plates at a density of 0.35 x10 6 cells per well as described
above. After the 24 hour acclimation period which followed planting, the PNMT promoter-
luciferase reporter gene construct pGL3RP893 was transfected into the cells using
Turbofect transfection reagent (Promega). Briefly, for each well to be transfected, 1 μg of
plasmid DNA was mixed with 100 μl of basal serum free DMEM and 1 μl of Turbofect
reagent. The mixture was vortexed and allowed to incubate for 20 minutes at room
temperature before adding to the cells. For multiple wells, a master mix of transfection
solution was prepared. Six hours post-transfection, the cells were treated with cytokines or
vehicle as per the experimental design for a total of 24 hours. 18 hours post cytokine
treatment, Dex (1 μM) was added to appropriate sample groups for the remaining 6 hours
prior to harvesting.
At the end of treatments, the cells were washed twice with cold PBS and lysed with 100 µl
of cell lysis reagent supplemented with DTT before freezing at -80°C. The plates were
thawed on ice and the lysate, transferred to a V-shaped 96 well plate (Corning). The lysates
were then centrifuged at 1000 g for 10 min at 4°C, a fraction of the supernatant (40 µl) was
transferred into a 96-well white microplate (Corning). The luciferase activity was measured
by direct injection of 50 μl Luciferase assay buffer into the wells using the injection needle

62
and pump assembly of a microplate reader (FLUOstar OPTIMA; BMG Labtech;
Ortenberg, Baden-Württemberg, Germany). The protein concentration was determined
using a Bradford assay as described above. Finally, the luciferase activity for each
experimental condition was expressed relative to protein concentration (Relative light units
or RLU/μg protein).
2.6 - Microscopy
PC12s were seeded on coverslips in 6 well plates and treated with cytokine or Dex or a
combination of the two as outlined above. At the end of the treatments, cells were washed
with PBS, fixed with 3.7% p-formaldehyde, permeabilized with 0.2% Triton X100 and
stained with anti-GR for 1 hour at 37°C (1:20 dilution, 50 µl per coverslip; Clone, M-20,
Santa Cruz Biotechnology). The coverslips were rinsed twice with PBS and incubated with
1:2000 Alexa 488 conjugated secondary and 1:1000 DAPI (Invitrogen) prepared in 1%
BSA for 30 minutes in the dark at room temperature. The coverslips were washed twice
with PBS and mounted on slides using PermaFluor Mountant (Thermo Scientific). The
slides were visualized on a confocal microscope (Nikon TE2000, Nikon Instruments Inc.;
Melville, New York, USA). A minimum of 10 fields and 50 cells were visualised.

63
2.7 - Data Analysis
All data are presented as the mean ± SEM (n = 3-9). Statistical significance between control
and experimental groups was determined by unpaired, two-tailed t-tests or one-way
ANOVA followed by a Dunnett test for post hoc analyses. Statistical analysis was
performed using GraphPad Prism 5.00. Results were considered statistically significant
with values of p ≤ 0.05.
64
3 - Results
3.1 - Effects of Cytokines on Expression of Catecholamine Biosynthetic
Enzymes
PC12 cells were treated for 6 or 24 hours with the cytokines IFN-α, IL-1β, IL-2, IL-6, IL-
10, TNF-α, or CCL2 and transcript levels of TH, DBH, and PNMT were measured using
RT-qPCR in order to determine the effects of cytokines on basal expression of the CA
biosynthetic enzymes in adrenal chromaffin cells.
TH: Results from the RT-qPCR analysis of PC12 cells treated for 6 or 24 hours with IFN-
α, IL-1β, IL-2, IL-6, or TNF-α show specific changes in TH mRNA level. IFN-α (1000
U/ml) decreased TH mRNA levels after either 6 hour (0.78-fold; p<0.05) of 24 hour (0.74-
fold; p<0.001) incubation period (Fig. 7-A). IL-1β (10 ng/ml for 6 hours) decreased TH
mRNA (0.74-fold; p<0.05) (Fig. 7-B). IL-2 (100 ng/ml for 6 hours) decreased TH mRNA
to 0.73-fold (p<0.05) (Fig. 7-C). IL-6 decreased TH mRNA with both 10 ng/ml (0.73-fold;
p<0.01) and 100 ng/ml (0.81-fold; p<0.05) treatments after 24 hour exposure (Fig. 7-D). 6
hour TNF-α treatment decreased TH expression to 0.69-fold (p<0.001) and 24 hour
treatment decreased expression to 0.75-fold (p<0.001) (Fig. 7-F). Neither IL-10 nor CCL2
significantly changed TH mRNA levels with any of the conditions tested (Fig. 7- E and G).
TH was significantly responsive to 5 of the 7 cytokines tested, all producing decreases in
mRNA levels relative to respective control group.
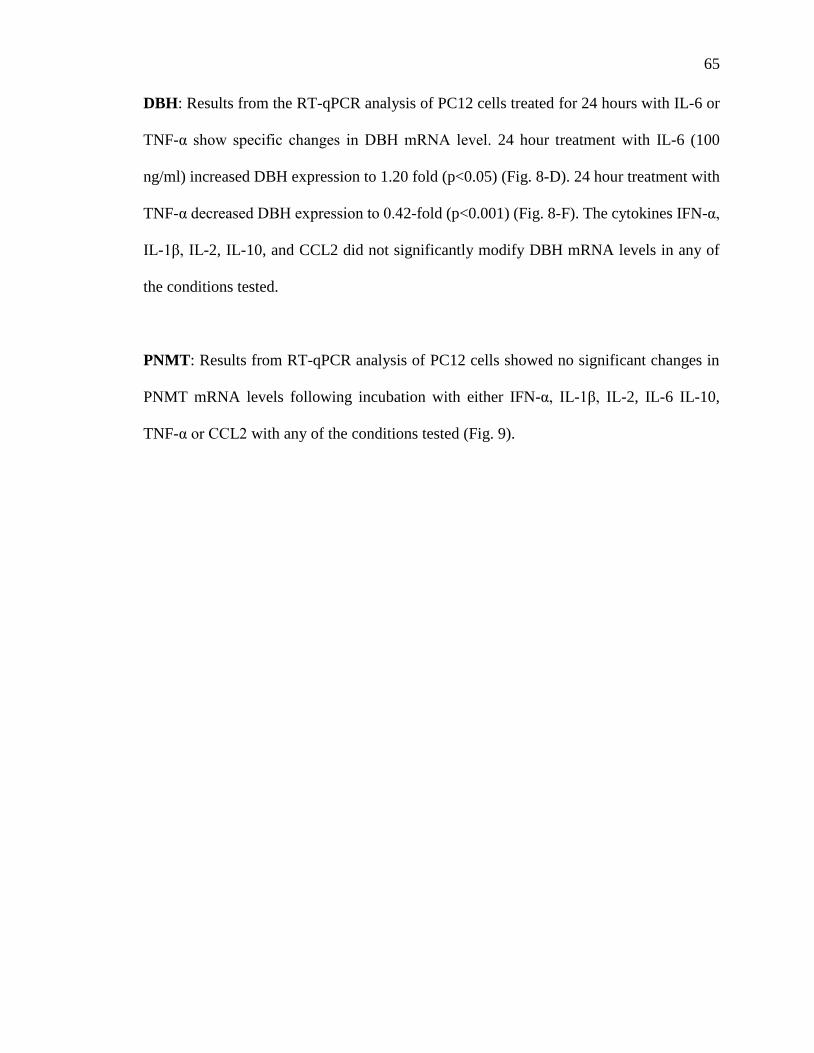
65
DBH: Results from the RT-qPCR analysis of PC12 cells treated for 24 hours with IL-6 or
TNF-α show specific changes in DBH mRNA level. 24 hour treatment with IL-6 (100
ng/ml) increased DBH expression to 1.20 fold (p<0.05) (Fig. 8-D). 24 hour treatment with
TNF-α decreased DBH expression to 0.42-fold (p<0.001) (Fig. 8-F). The cytokines IFN-α,
IL-1β, IL-2, IL-10, and CCL2 did not significantly modify DBH mRNA levels in any of
the conditions tested.
PNMT: Results from RT-qPCR analysis of PC12 cells showed no significant changes in
PNMT mRNA levels following incubation with either IFN-α, IL-1β, IL-2, IL-6 IL-10,
TNF-α or CCL2 with any of the conditions tested (Fig. 9).
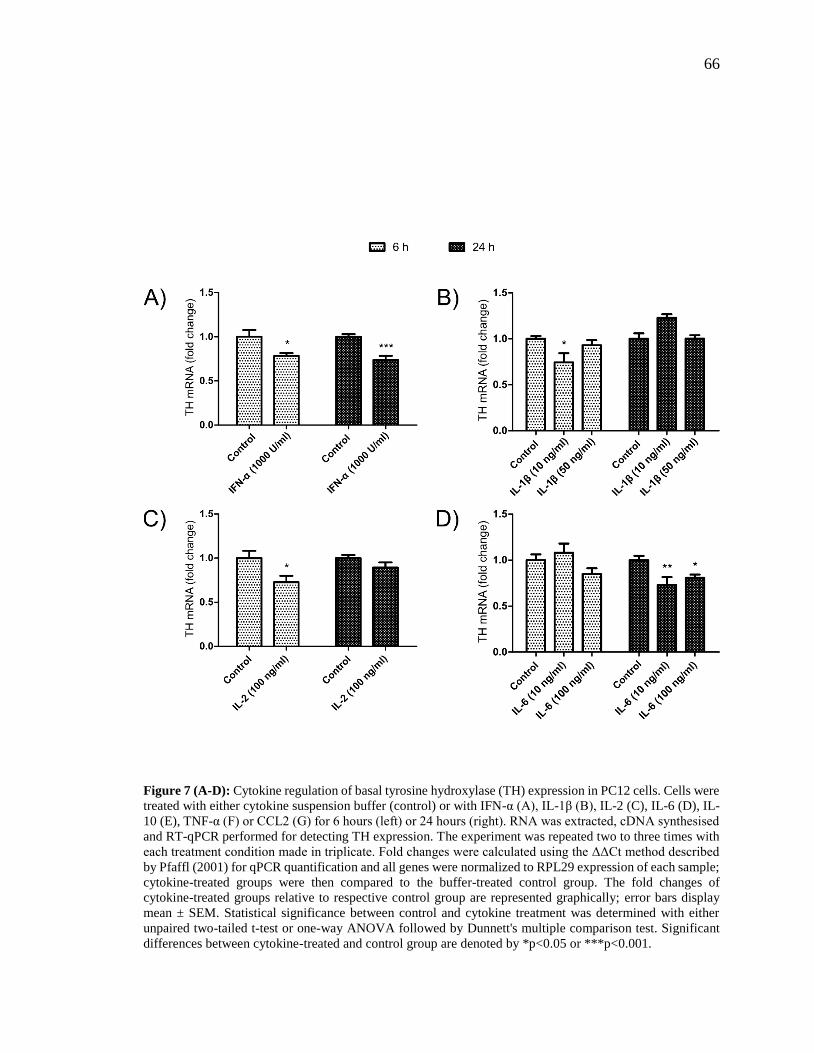
66
Figure 7 (A-D): Cytokine regulation of basal tyrosine hydroxylase (TH) expression in PC12 cells. Cells were
treated with either cytokine suspension buffer (control) or with IFN-α (A), IL-1β (B), IL-2 (C), IL-6 (D), IL-
10 (E), TNF-α (F) or CCL2 (G) for 6 hours (left) or 24 hours (right). RNA was extracted, cDNA synthesised
and RT-qPCR performed for detecting TH expression. The experiment was repeated two to three times with
each treatment condition made in triplicate. Fold changes were calculated using the ΔΔCt method described
by Pfaffl (2001) for qPCR quantification and all genes were normalized to RPL29 expression of each sample;
cytokine-treated groups were then compared to the buffer-treated control group. The fold changes of
cytokine-treated groups relative to respective control group are represented graphically; error bars display
mean ± SEM. Statistical significance between control and cytokine treatment was determined with either
unpaired two-tailed t-test or one-way ANOVA followed by Dunnett's multiple comparison test. Significant
differences between cytokine-treated and control group are denoted by *p<0.05 or ***p<0.001.
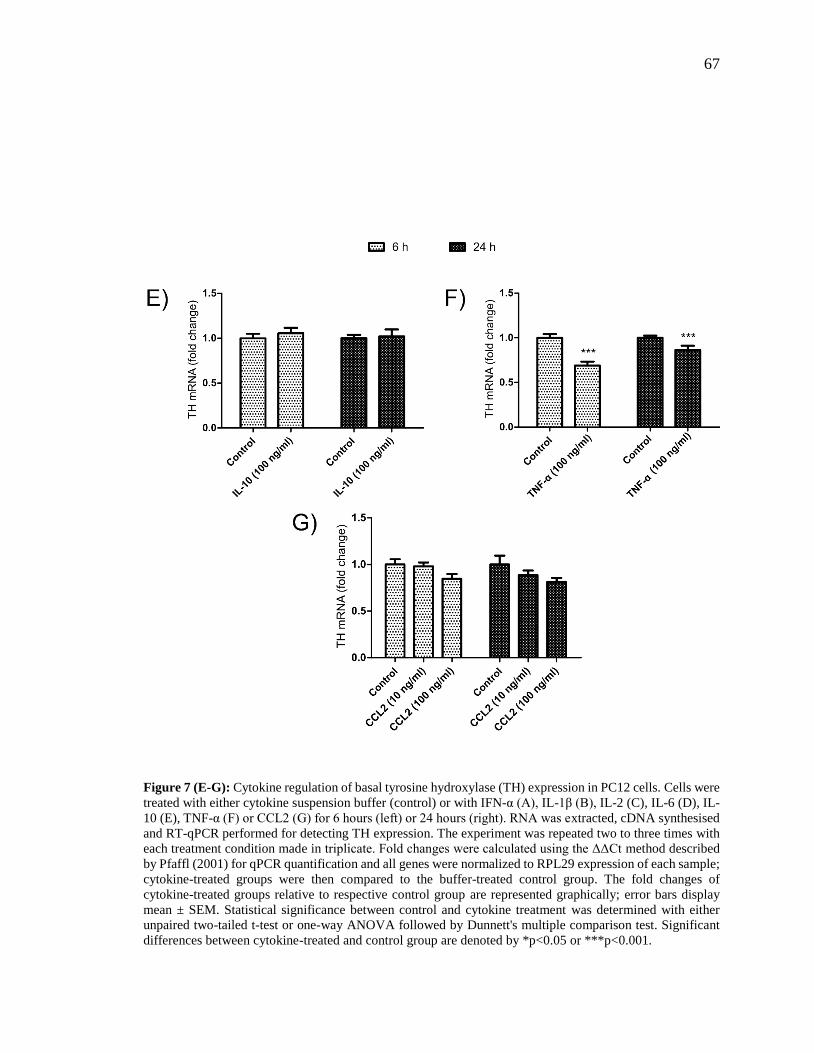
67
Figure 7 (E-G): Cytokine regulation of basal tyrosine hydroxylase (TH) expression in PC12 cells. Cells were
treated with either cytokine suspension buffer (control) or with IFN-α (A), IL-1β (B), IL-2 (C), IL-6 (D), IL-
10 (E), TNF-α (F) or CCL2 (G) for 6 hours (left) or 24 hours (right). RNA was extracted, cDNA synthesised
and RT-qPCR performed for detecting TH expression. The experiment was repeated two to three times with
each treatment condition made in triplicate. Fold changes were calculated using the ΔΔCt method described
by Pfaffl (2001) for qPCR quantification and all genes were normalized to RPL29 expression of each sample;
cytokine-treated groups were then compared to the buffer-treated control group. The fold changes of
cytokine-treated groups relative to respective control group are represented graphically; error bars display
mean ± SEM. Statistical significance between control and cytokine treatment was determined with either
unpaired two-tailed t-test or one-way ANOVA followed by Dunnett's multiple comparison test. Significant
differences between cytokine-treated and control group are denoted by *p<0.05 or ***p<0.001.
68
Figure 8 (A-D): Cytokine regulation of basal dopamine β-hydroxylase (DBH) expression in PC12 cells. Cells
were treated with either cytokine suspension buffer (control) or with IFN-α (A), IL-1β (B), IL-2 (C), IL-6
(D), IL-10 (E), TNF-α (F) or CCL2 (G) for 6 hours (left) or 24 hours (right). RNA was extracted, cDNA
synthesised and RT-qPCR performed for detecting DBH expression. The experiment was repeated two to
three times with each treatment condition made in triplicate. Fold changes were calculated using the ΔΔCt
method described by Pfaffl (2001) for qPCR quantification and all genes were normalized to RPL29
expression of each sample; cytokine-treated groups were then compared to the buffer-treated control group.
The fold changes of cytokine-treated groups relative to respective control group are represented graphically;
error bars display mean ± SEM. Statistical significance between control and cytokine treatment was
determined with either unpaired two-tailed t-test or one-way ANOVA followed by Dunnett's multiple
comparison test. Significant differences between cytokine-treated and control group are denoted by
***p<0.001.
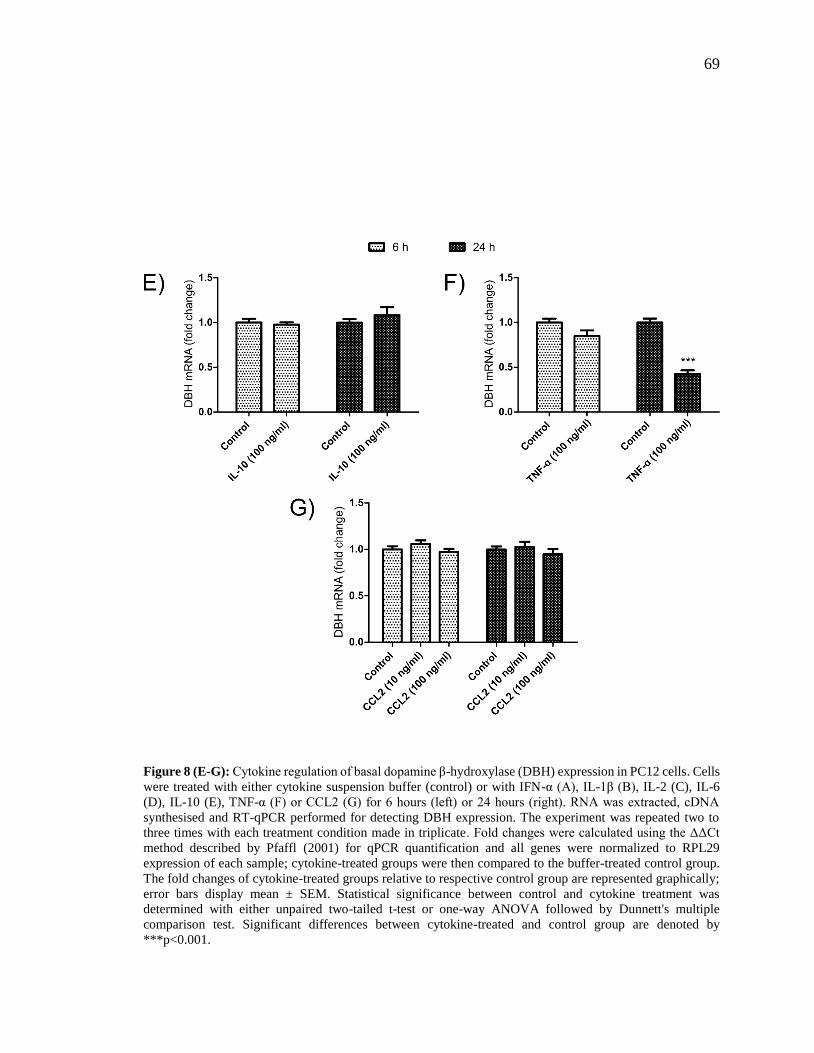
69
Figure 8 (E-G): Cytokine regulation of basal dopamine β-hydroxylase (DBH) expression in PC12 cells. Cells
were treated with either cytokine suspension buffer (control) or with IFN-α (A), IL-1β (B), IL-2 (C), IL-6
(D), IL-10 (E), TNF-α (F) or CCL2 (G) for 6 hours (left) or 24 hours (right). RNA was extracted, cDNA
synthesised and RT-qPCR performed for detecting DBH expression. The experiment was repeated two to
three times with each treatment condition made in triplicate. Fold changes were calculated using the ΔΔCt
method described by Pfaffl (2001) for qPCR quantification and all genes were normalized to RPL29
expression of each sample; cytokine-treated groups were then compared to the buffer-treated control group.
The fold changes of cytokine-treated groups relative to respective control group are represented graphically;
error bars display mean ± SEM. Statistical significance between control and cytokine treatment was
determined with either unpaired two-tailed t-test or one-way ANOVA followed by Dunnett's multiple
comparison test. Significant differences between cytokine-treated and control group are denoted by
***p<0.001.
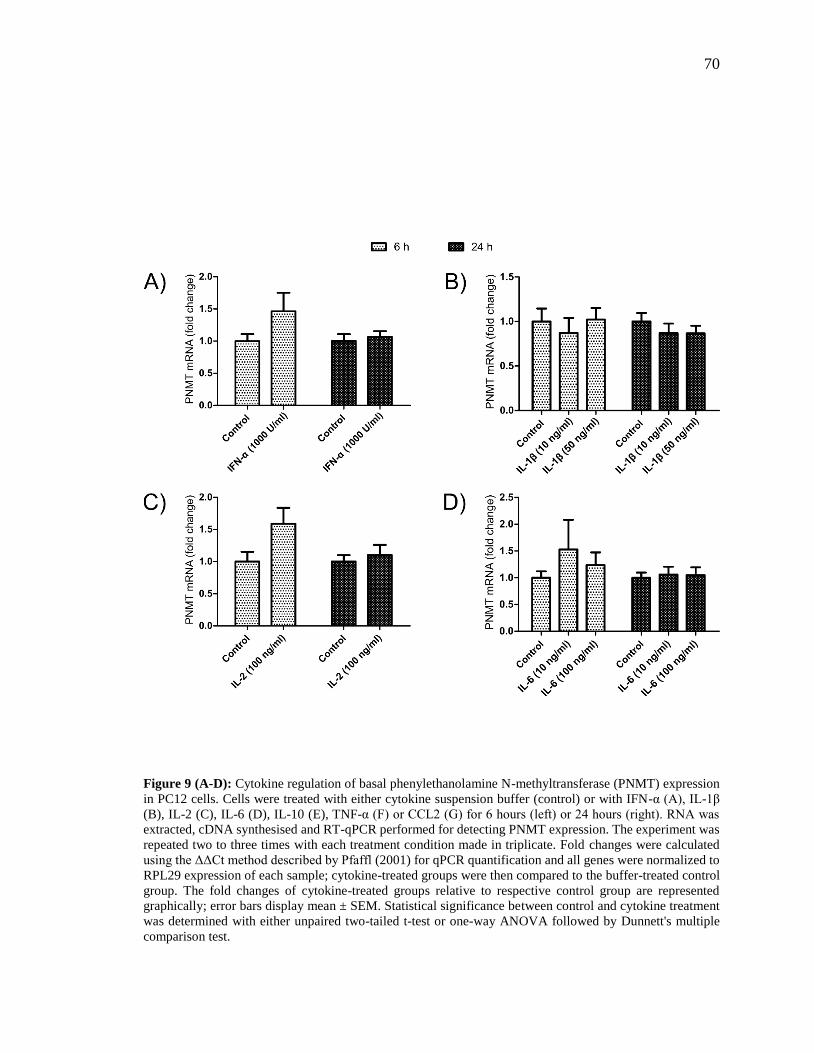
70
Figure 9 (A-D): Cytokine regulation of basal phenylethanolamine N-methyltransferase (PNMT) expression
in PC12 cells. Cells were treated with either cytokine suspension buffer (control) or with IFN-α (A), IL-1β
(B), IL-2 (C), IL-6 (D), IL-10 (E), TNF-α (F) or CCL2 (G) for 6 hours (left) or 24 hours (right). RNA was
extracted, cDNA synthesised and RT-qPCR performed for detecting PNMT expression. The experiment was
repeated two to three times with each treatment condition made in triplicate. Fold changes were calculated
using the ΔΔCt method described by Pfaffl (2001) for qPCR quantification and all genes were normalized to
RPL29 expression of each sample; cytokine-treated groups were then compared to the buffer-treated control
group. The fold changes of cytokine-treated groups relative to respective control group are represented
graphically; error bars display mean ± SEM. Statistical significance between control and cytokine treatment
was determined with either unpaired two-tailed t-test or one-way ANOVA followed by Dunnett's multiple
comparison test.
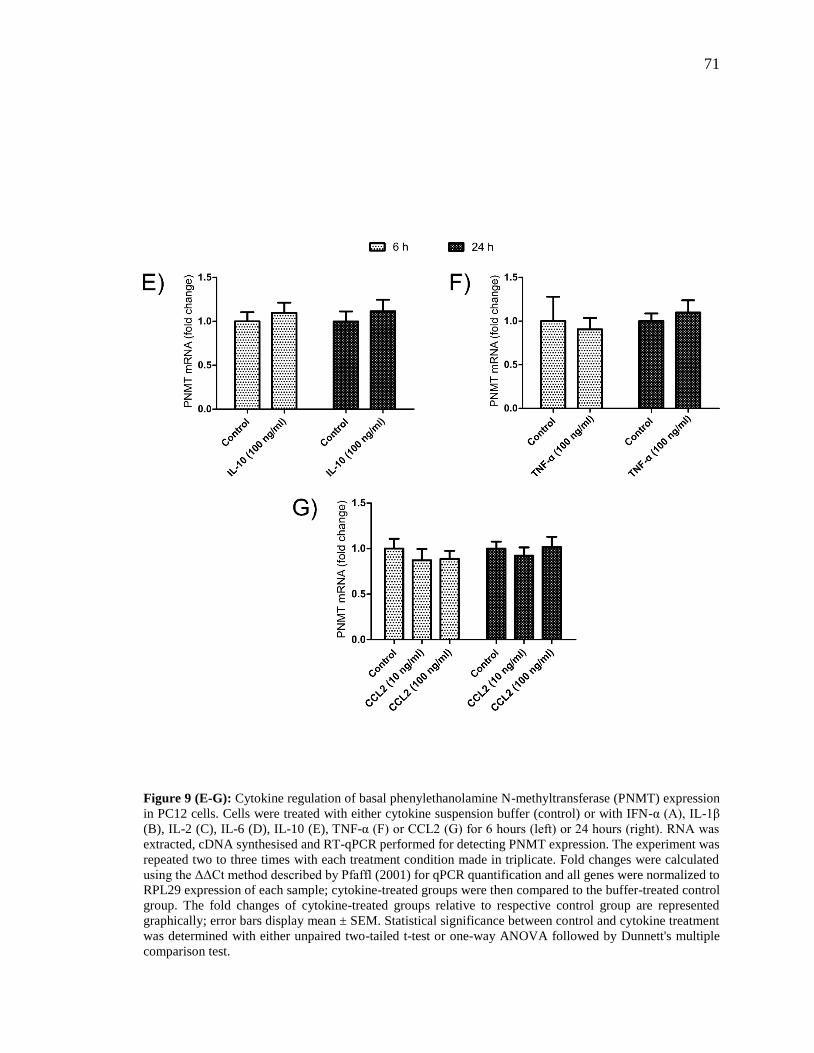
71
Figure 9 (E-G): Cytokine regulation of basal phenylethanolamine N-methyltransferase (PNMT) expression
in PC12 cells. Cells were treated with either cytokine suspension buffer (control) or with IFN-α (A), IL-1β
(B), IL-2 (C), IL-6 (D), IL-10 (E), TNF-α (F) or CCL2 (G) for 6 hours (left) or 24 hours (right). RNA was
extracted, cDNA synthesised and RT-qPCR performed for detecting PNMT expression. The experiment was
repeated two to three times with each treatment condition made in triplicate. Fold changes were calculated
using the ΔΔCt method described by Pfaffl (2001) for qPCR quantification and all genes were normalized to
RPL29 expression of each sample; cytokine-treated groups were then compared to the buffer-treated control
group. The fold changes of cytokine-treated groups relative to respective control group are represented
graphically; error bars display mean ± SEM. Statistical significance between control and cytokine treatment
was determined with either unpaired two-tailed t-test or one-way ANOVA followed by Dunnett's multiple
comparison test.
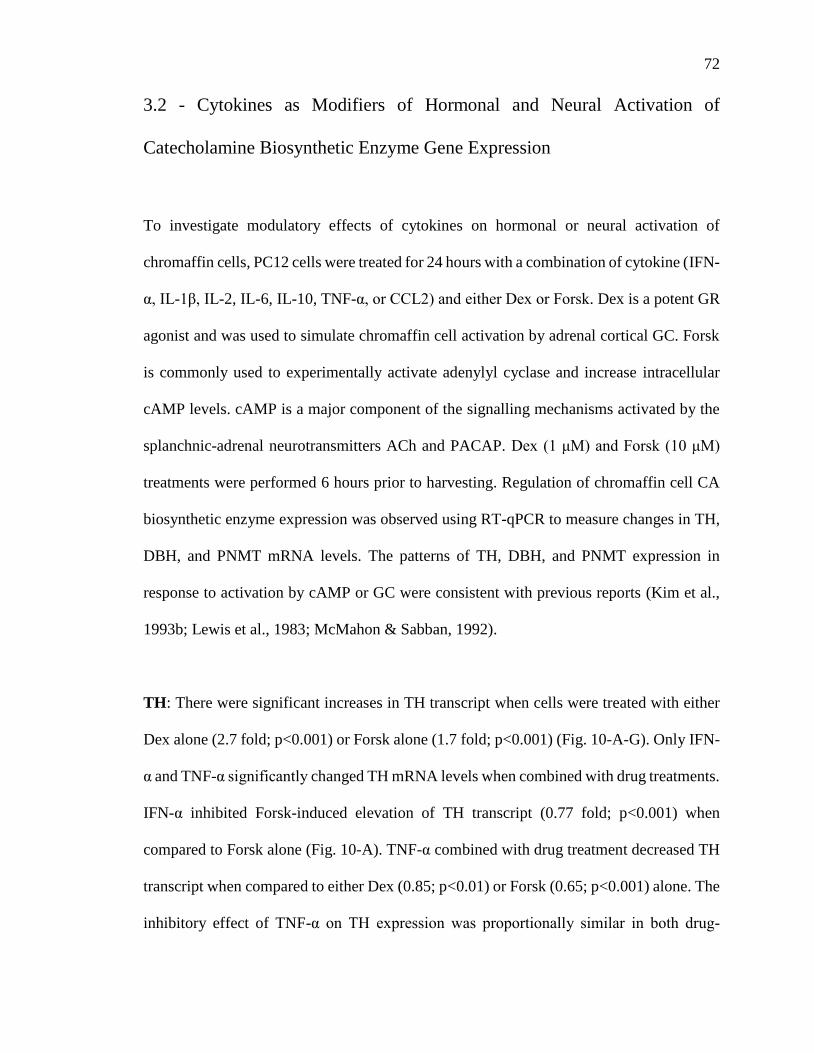
72
3.2 - Cytokines as Modifiers of Hormonal and Neural Activation of
Catecholamine Biosynthetic Enzyme Gene Expression
To investigate modulatory effects of cytokines on hormonal or neural activation of
chromaffin cells, PC12 cells were treated for 24 hours with a combination of cytokine (IFN-
α, IL-1β, IL-2, IL-6, IL-10, TNF-α, or CCL2) and either Dex or Forsk. Dex is a potent GR
agonist and was used to simulate chromaffin cell activation by adrenal cortical GC. Forsk
is commonly used to experimentally activate adenylyl cyclase and increase intracellular
cAMP levels. cAMP is a major component of the signalling mechanisms activated by the
splanchnic-adrenal neurotransmitters ACh and PACAP. Dex (1 μM) and Forsk (10 μM)
treatments were performed 6 hours prior to harvesting. Regulation of chromaffin cell CA
biosynthetic enzyme expression was observed using RT-qPCR to measure changes in TH,
DBH, and PNMT mRNA levels. The patterns of TH, DBH, and PNMT expression in
response to activation by cAMP or GC were consistent with previous reports (Kim et al.,
1993b; Lewis et al., 1983; McMahon & Sabban, 1992).
TH: There were significant increases in TH transcript when cells were treated with either
Dex alone (2.7 fold; p<0.001) or Forsk alone (1.7 fold; p<0.001) (Fig. 10-A-G). Only IFN-
α and TNF-α significantly changed TH mRNA levels when combined with drug treatments.
IFN-α inhibited Forsk-induced elevation of TH transcript (0.77 fold; p<0.001) when
compared to Forsk alone (Fig. 10-A). TNF-α combined with drug treatment decreased TH
transcript when compared to either Dex (0.85; p<0.01) or Forsk (0.65; p<0.001) alone. The
inhibitory effect of TNF-α on TH expression was proportionally similar in both drug-
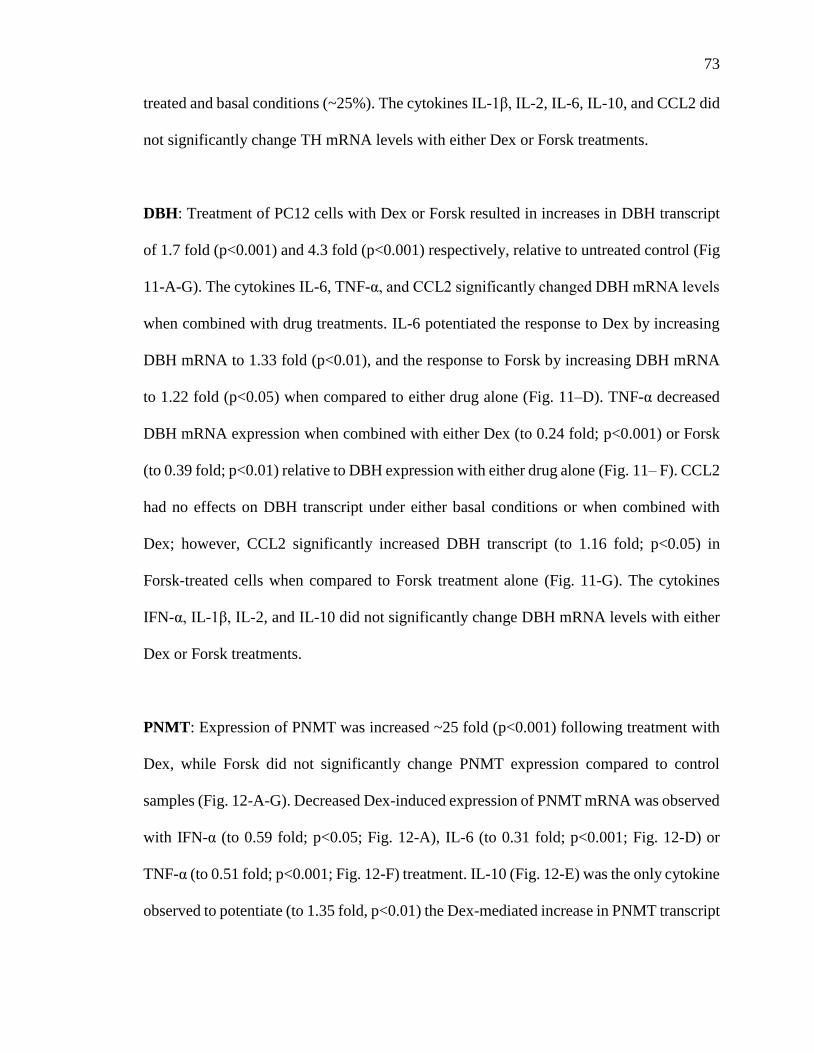
73
treated and basal conditions (~25%). The cytokines IL-1β, IL-2, IL-6, IL-10, and CCL2 did
not significantly change TH mRNA levels with either Dex or Forsk treatments.
DBH: Treatment of PC12 cells with Dex or Forsk resulted in increases in DBH transcript
of 1.7 fold (p<0.001) and 4.3 fold (p<0.001) respectively, relative to untreated control (Fig
11-A-G). The cytokines IL-6, TNF-α, and CCL2 significantly changed DBH mRNA levels
when combined with drug treatments. IL-6 potentiated the response to Dex by increasing
DBH mRNA to 1.33 fold (p<0.01), and the response to Forsk by increasing DBH mRNA
to 1.22 fold (p<0.05) when compared to either drug alone (Fig. 11–D). TNF-α decreased
DBH mRNA expression when combined with either Dex (to 0.24 fold; p<0.001) or Forsk
(to 0.39 fold; p<0.01) relative to DBH expression with either drug alone (Fig. 11– F). CCL2
had no effects on DBH transcript under either basal conditions or when combined with
Dex; however, CCL2 significantly increased DBH transcript (to 1.16 fold; p<0.05) in
Forsk-treated cells when compared to Forsk treatment alone (Fig. 11-G). The cytokines
IFN-α, IL-1β, IL-2, and IL-10 did not significantly change DBH mRNA levels with either
Dex or Forsk treatments.
PNMT: Expression of PNMT was increased ~25 fold (p<0.001) following treatment with
Dex, while Forsk did not significantly change PNMT expression compared to control
samples (Fig. 12-A-G). Decreased Dex-induced expression of PNMT mRNA was observed
with IFN-α (to 0.59 fold; p<0.05; Fig. 12-A), IL-6 (to 0.31 fold; p<0.001; Fig. 12-D) or
TNF-α (to 0.51 fold; p<0.001; Fig. 12-F) treatment. IL-10 (Fig. 12-E) was the only cytokine
observed to potentiate (to 1.35 fold, p<0.01) the Dex-mediated increase in PNMT transcript
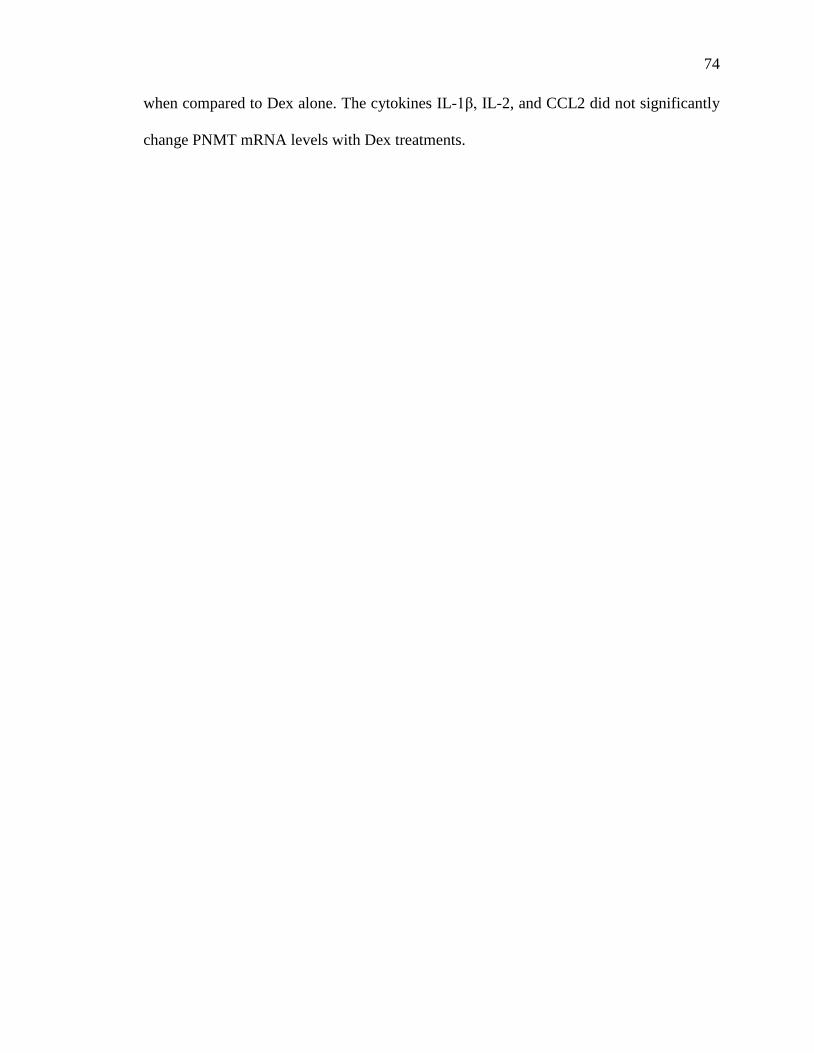
74
when compared to Dex alone. The cytokines IL-1β, IL-2, and CCL2 did not significantly
change PNMT mRNA levels with Dex treatments.
75
Figure 10 (A-D): Cytokine regulation of glucocorticoid or cAMP-activated tyrosine hydroxylase (TH)
expression. PC12 cells were treated with either cytokine suspension buffer (control) or with IFN-α (A), IL-
1β (B), IL-2 (C), IL-6 (D), IL-10 (E), TNF-α (F) or CCL2 (G) for 6 hours (left) or 24 hours (right).
Dexamethasone (1 μM) or forskolin (10 μM) were added during the last 6 hours of incubation. RNA was
extracted, cDNA synthesised and RT-qPCR performed for detecting TH expression. Each treatment was
performed in triplicate. Fold changes were calculated using the ΔΔCt method described by Pfaffl (2001) for
qPCR quantification and all genes were normalized to RPL29 expression of each sample; cytokine-treated
groups were then compared to the buffer-treated control group. The fold changes of cytokine-treated groups
relative to respective control group are represented graphically; error bars display mean ± SEM. Statistical
significance between control and cytokine treatment was determined with either unpaired two-tailed t-test.
Significant differences between cytokine-treated and control group are denoted by **p<0.01 or ***p<0.001.
76
Figure 10 (E-G): Cytokine regulation of glucocorticoid or cAMP-activated tyrosine hydroxylase (TH)
expression. PC12 cells were treated with either cytokine suspension buffer (control) or with IFN-α (A), IL-
1β (B), IL-2 (C), IL-6 (D), IL-10 (E), TNF-α (F) or CCL2 (G) for 6 hours (left) or 24 hours (right).
Dexamethasone (1 μM) or forskolin (10 μM) were added during the last 6 hours of incubation. RNA was
extracted, cDNA synthesised and RT-qPCR performed for detecting TH expression. Each treatment was
performed in triplicate. Fold changes were calculated using the ΔΔCt method described by Pfaffl (2001) for
qPCR quantification and all genes were normalized to RPL29 expression of each sample; cytokine-treated
groups were then compared to the buffer-treated control group. The fold changes of cytokine-treated groups
relative to respective control group are represented graphically; error bars display mean ± SEM. Statistical
significance between control and cytokine treatment was determined with either unpaired two-tailed t-test.
Significant differences between cytokine-treated and control group are denoted by **p<0.01 or ***p<0.001.
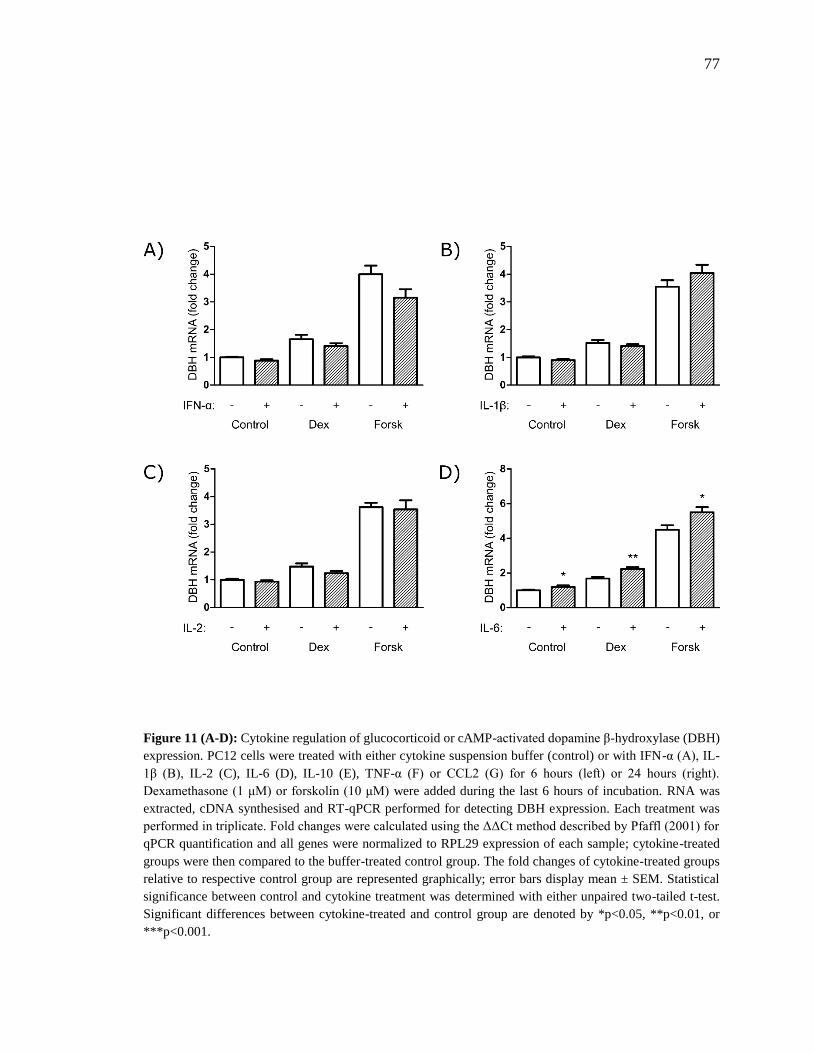
77
Figure 11 (A-D): Cytokine regulation of glucocorticoid or cAMP-activated dopamine β-hydroxylase (DBH)
expression. PC12 cells were treated with either cytokine suspension buffer (control) or with IFN-α (A), IL-
1β (B), IL-2 (C), IL-6 (D), IL-10 (E), TNF-α (F) or CCL2 (G) for 6 hours (left) or 24 hours (right).
Dexamethasone (1 μM) or forskolin (10 μM) were added during the last 6 hours of incubation. RNA was
extracted, cDNA synthesised and RT-qPCR performed for detecting DBH expression. Each treatment was
performed in triplicate. Fold changes were calculated using the ΔΔCt method described by Pfaffl (2001) for
qPCR quantification and all genes were normalized to RPL29 expression of each sample; cytokine-treated
groups were then compared to the buffer-treated control group. The fold changes of cytokine-treated groups
relative to respective control group are represented graphically; error bars display mean ± SEM. Statistical
significance between control and cytokine treatment was determined with either unpaired two-tailed t-test.
Significant differences between cytokine-treated and control group are denoted by *p<0.05, **p<0.01, or
***p<0.001.
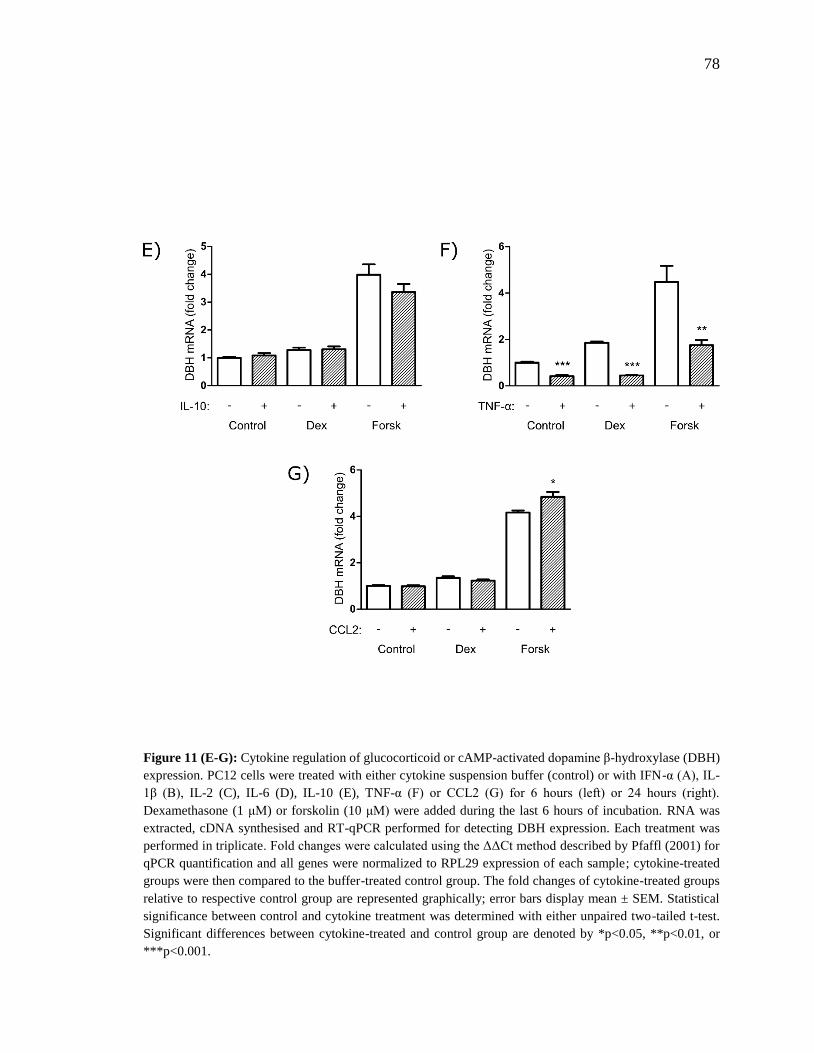
78
Figure 11 (E-G): Cytokine regulation of glucocorticoid or cAMP-activated dopamine β-hydroxylase (DBH)
expression. PC12 cells were treated with either cytokine suspension buffer (control) or with IFN-α (A), IL-
1β (B), IL-2 (C), IL-6 (D), IL-10 (E), TNF-α (F) or CCL2 (G) for 6 hours (left) or 24 hours (right).
Dexamethasone (1 μM) or forskolin (10 μM) were added during the last 6 hours of incubation. RNA was
extracted, cDNA synthesised and RT-qPCR performed for detecting DBH expression. Each treatment was
performed in triplicate. Fold changes were calculated using the ΔΔCt method described by Pfaffl (2001) for
qPCR quantification and all genes were normalized to RPL29 expression of each sample; cytokine-treated
groups were then compared to the buffer-treated control group. The fold changes of cytokine-treated groups
relative to respective control group are represented graphically; error bars display mean ± SEM. Statistical
significance between control and cytokine treatment was determined with either unpaired two-tailed t-test.
Significant differences between cytokine-treated and control group are denoted by *p<0.05, **p<0.01, or
***p<0.001.
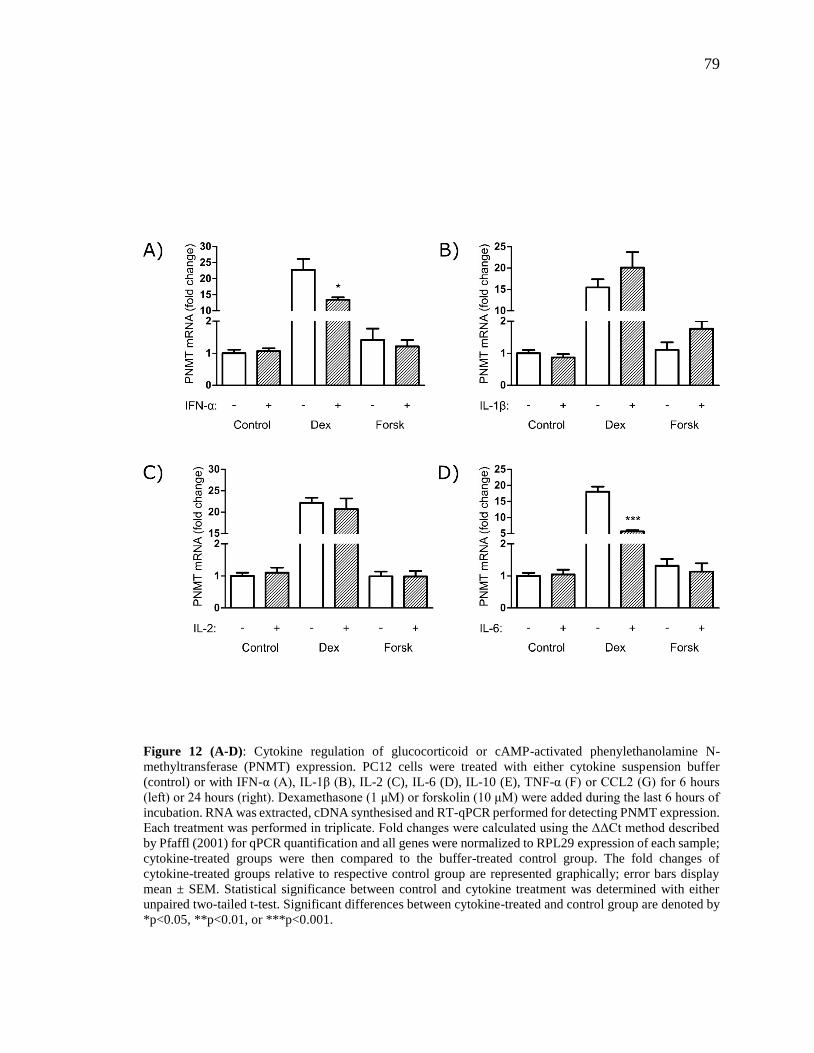
79
Figure 12 (A-D): Cytokine regulation of glucocorticoid or cAMP-activated phenylethanolamine N-
methyltransferase (PNMT) expression. PC12 cells were treated with either cytokine suspension buffer
(control) or with IFN-α (A), IL-1β (B), IL-2 (C), IL-6 (D), IL-10 (E), TNF-α (F) or CCL2 (G) for 6 hours
(left) or 24 hours (right). Dexamethasone (1 μM) or forskolin (10 μM) were added during the last 6 hours of
incubation. RNA was extracted, cDNA synthesised and RT-qPCR performed for detecting PNMT expression.
Each treatment was performed in triplicate. Fold changes were calculated using the ΔΔCt method described
by Pfaffl (2001) for qPCR quantification and all genes were normalized to RPL29 expression of each sample;
cytokine-treated groups were then compared to the buffer-treated control group. The fold changes of
cytokine-treated groups relative to respective control group are represented graphically; error bars display
mean ± SEM. Statistical significance between control and cytokine treatment was determined with either
unpaired two-tailed t-test. Significant differences between cytokine-treated and control group are denoted by
*p<0.05, **p<0.01, or ***p<0.001.
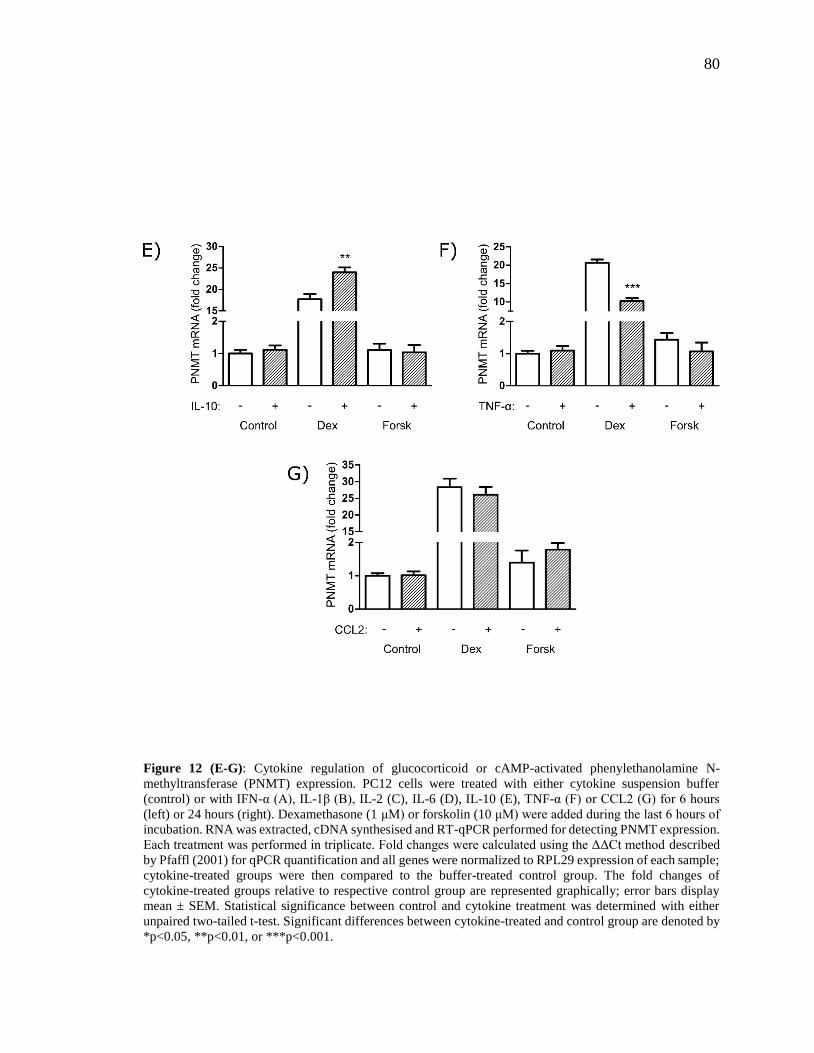
80
Figure 12 (E-G): Cytokine regulation of glucocorticoid or cAMP-activated phenylethanolamine N-
methyltransferase (PNMT) expression. PC12 cells were treated with either cytokine suspension buffer
(control) or with IFN-α (A), IL-1β (B), IL-2 (C), IL-6 (D), IL-10 (E), TNF-α (F) or CCL2 (G) for 6 hours
(left) or 24 hours (right). Dexamethasone (1 μM) or forskolin (10 μM) were added during the last 6 hours of
incubation. RNA was extracted, cDNA synthesised and RT-qPCR performed for detecting PNMT expression.
Each treatment was performed in triplicate. Fold changes were calculated using the ΔΔCt method described
by Pfaffl (2001) for qPCR quantification and all genes were normalized to RPL29 expression of each sample;
cytokine-treated groups were then compared to the buffer-treated control group. The fold changes of
cytokine-treated groups relative to respective control group are represented graphically; error bars display
mean ± SEM. Statistical significance between control and cytokine treatment was determined with either
unpaired two-tailed t-test. Significant differences between cytokine-treated and control group are denoted by
*p<0.05, **p<0.01, or ***p<0.001.
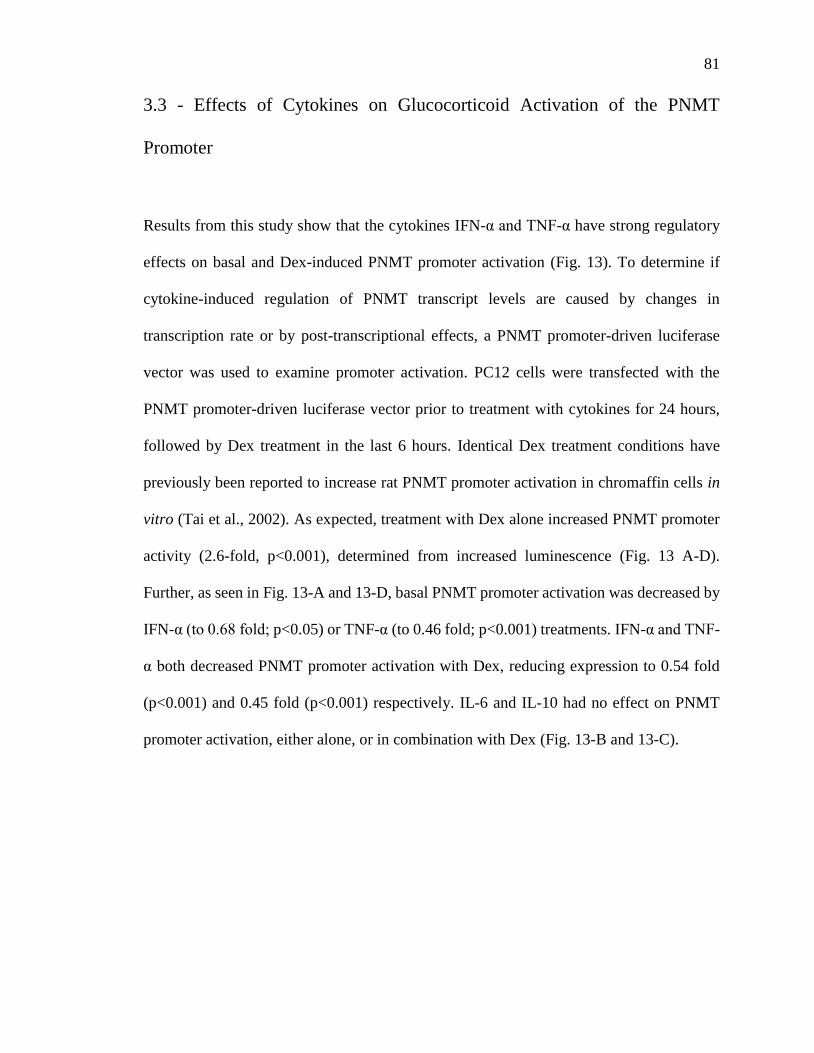
81
3.3 - Effects of Cytokines on Glucocorticoid Activation of the PNMT
Promoter
Results from this study show that the cytokines IFN-α and TNF-α have strong regulatory
effects on basal and Dex-induced PNMT promoter activation (Fig. 13). To determine if
cytokine-induced regulation of PNMT transcript levels are caused by changes in
transcription rate or by post-transcriptional effects, a PNMT promoter-driven luciferase
vector was used to examine promoter activation. PC12 cells were transfected with the
PNMT promoter-driven luciferase vector prior to treatment with cytokines for 24 hours,
followed by Dex treatment in the last 6 hours. Identical Dex treatment conditions have
previously been reported to increase rat PNMT promoter activation in chromaffin cells in
vitro (Tai et al., 2002). As expected, treatment with Dex alone increased PNMT promoter
activity (2.6-fold, p<0.001), determined from increased luminescence (Fig. 13 A-D).
Further, as seen in Fig. 13-A and 13-D, basal PNMT promoter activation was decreased by
IFN-α (to 0.68 fold; p<0.05) or TNF-α (to 0.46 fold; p<0.001) treatments. IFN-α and TNF-
α both decreased PNMT promoter activation with Dex, reducing expression to 0.54 fold
(p<0.001) and 0.45 fold (p<0.001) respectively. IL-6 and IL-10 had no effect on PNMT
promoter activation, either alone, or in combination with Dex (Fig. 13-B and 13-C).
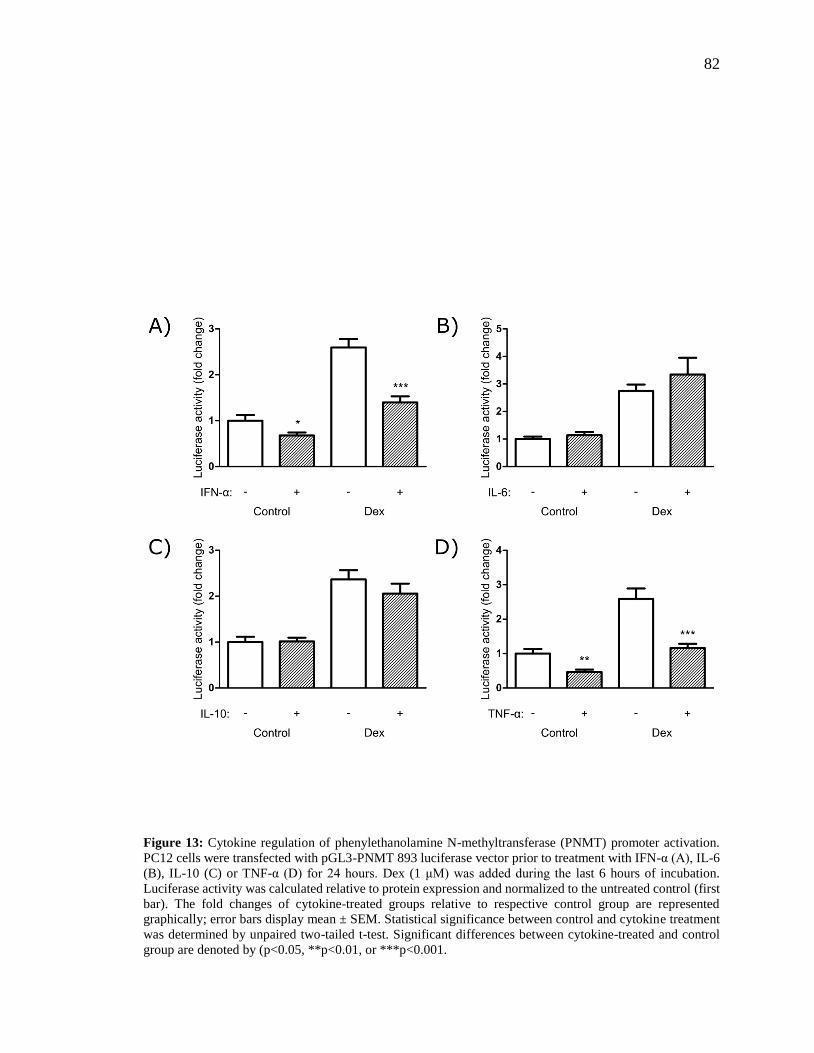
82
Figure 13: Cytokine regulation of phenylethanolamine N-methyltransferase (PNMT) promoter activation.
PC12 cells were transfected with pGL3-PNMT 893 luciferase vector prior to treatment with IFN-α (A), IL-6
(B), IL-10 (C) or TNF-α (D) for 24 hours. Dex (1 μM) was added during the last 6 hours of incubation.
Luciferase activity was calculated relative to protein expression and normalized to the untreated control (first
bar). The fold changes of cytokine-treated groups relative to respective control group are represented
graphically; error bars display mean ± SEM. Statistical significance between control and cytokine treatment
was determined by unpaired two-tailed t-test. Significant differences between cytokine-treated and control
group are denoted by (p<0.05, **p<0.01, or ***p<0.001.
83
3.4 - Effect of Cytokines on Localization of Glucocorticoid Receptor
3.4.1 - Western Blot Analysis
To further analyze the mechanism by which cytokines can inhibit PNMT promoter
activation, the nuclear translocation of GR in PC12 cells upon treatment with Dex was
investigated. GR is a major regulator of PNMT promoter activation; the PNMT promoter
contains three functional GREs which can bind GR and enhance PNMT expression.
Further, as discussed above, numerous cytokines have been reported to suppress GC
signalling by influencing the nuclear localization of GR. Regulation of Dex-mediated
PNMT promoter activation by IFN-α and TNF-α may be mediated by inhibition of GR
nuclear translocation.
PC12 cells were treated with cytokines for 24 hours and Dex was added in the last 6 hours
of treatment. At the end of the treatment period cells were harvested and nuclear extracts
prepared as described in Materials and Methods. Nuclear extracts were resolved using
PAGE, and membranes developed by ECL to detect GR in the nuclear extracts.
Treatment of PC12 cells with Dex results in a 2.1 fold average increase in nuclear GR
compared to untreated control (Fig. 14-A-D). The amount of nuclear GR protein did not
change when cells were treated with IFN-α, IL-6, IL-10, or TNF-α in either the Dex-treated
or the untreated groups. This suggests that none of the cytokines tested regulate PNMT
promoter activation by influencing GR nuclear translocation in the experimental conditions
tested.
84
Figure 14: Analyses of glucocorticoid receptor in presence of cytokines by western immunoblotting. PC12
cells were treated with IFN-α (A), IL-6 (B), IL-10 (C) or TNF-α (D) or respective suspension buffers for 24
hours. Dex (1 μM) was added during the last 6 hours of incubation. Nuclear extracts were collected as outlined
in Materials and Methods, resolved by PAGE, and GR detected by ECL. The experiment was performed two
times in triplicates. Bottom panels show representative gel images for each cytokine treatment. Densitometric
analysis of the GR band was done using Image J software. GR expression was normalized to the density of a
random band detected by Ponceau S staining of the membrane. The graph in the upper panel depicts fold
changes relative to untreated control (first bar). Error bars show mean ± SEM. Statistical analysis was
performed using unpaired two-way t test.
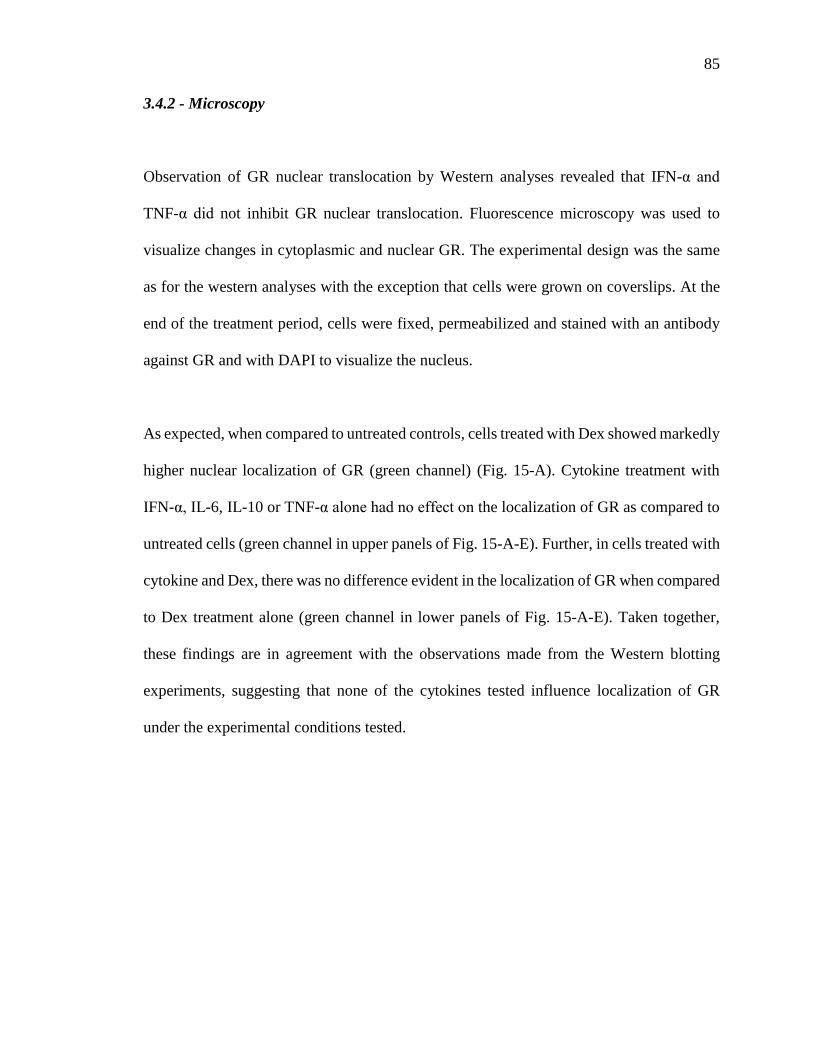
85
3.4.2 - Microscopy
Observation of GR nuclear translocation by Western analyses revealed that IFN-α and
TNF-α did not inhibit GR nuclear translocation. Fluorescence microscopy was used to
visualize changes in cytoplasmic and nuclear GR. The experimental design was the same
as for the western analyses with the exception that cells were grown on coverslips. At the
end of the treatment period, cells were fixed, permeabilized and stained with an antibody
against GR and with DAPI to visualize the nucleus.
As expected, when compared to untreated controls, cells treated with Dex showed markedly
higher nuclear localization of GR (green channel) (Fig. 15-A). Cytokine treatment with
IFN-α, IL-6, IL-10 or TNF-α alone had no effect on the localization of GR as compared to
untreated cells (green channel in upper panels of Fig. 15-A-E). Further, in cells treated with
cytokine and Dex, there was no difference evident in the localization of GR when compared
to Dex treatment alone (green channel in lower panels of Fig. 15-A-E). Taken together,
these findings are in agreement with the observations made from the Western blotting
experiments, suggesting that none of the cytokines tested influence localization of GR
under the experimental conditions tested.
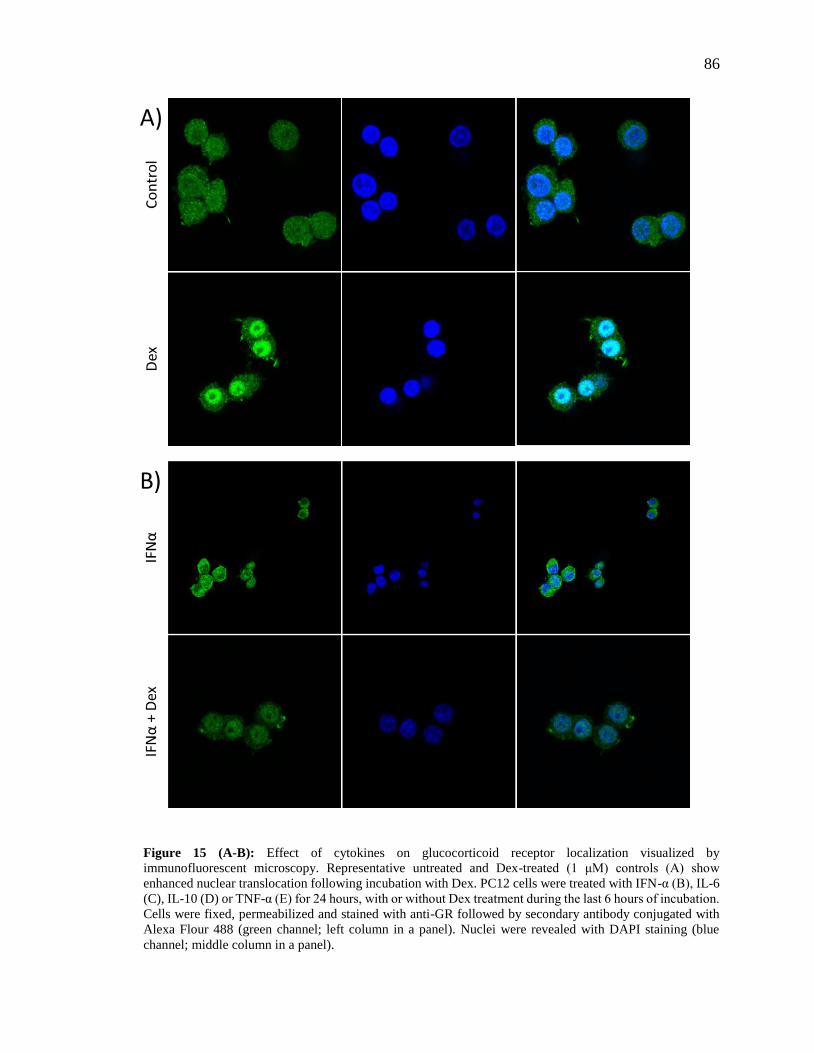
86
Figure 15 (A-B): Effect of cytokines on glucocorticoid receptor localization visualized by
immunofluorescent microscopy. Representative untreated and Dex-treated (1 μM) controls (A) show
enhanced nuclear translocation following incubation with Dex. PC12 cells were treated with IFN-α (B), IL-6
(C), IL-10 (D) or TNF-α (E) for 24 hours, with or without Dex treatment during the last 6 hours of incubation.
Cells were fixed, permeabilized and stained with anti-GR followed by secondary antibody conjugated with
Alexa Flour 488 (green channel; left column in a panel). Nuclei were revealed with DAPI staining (blue
channel; middle column in a panel).
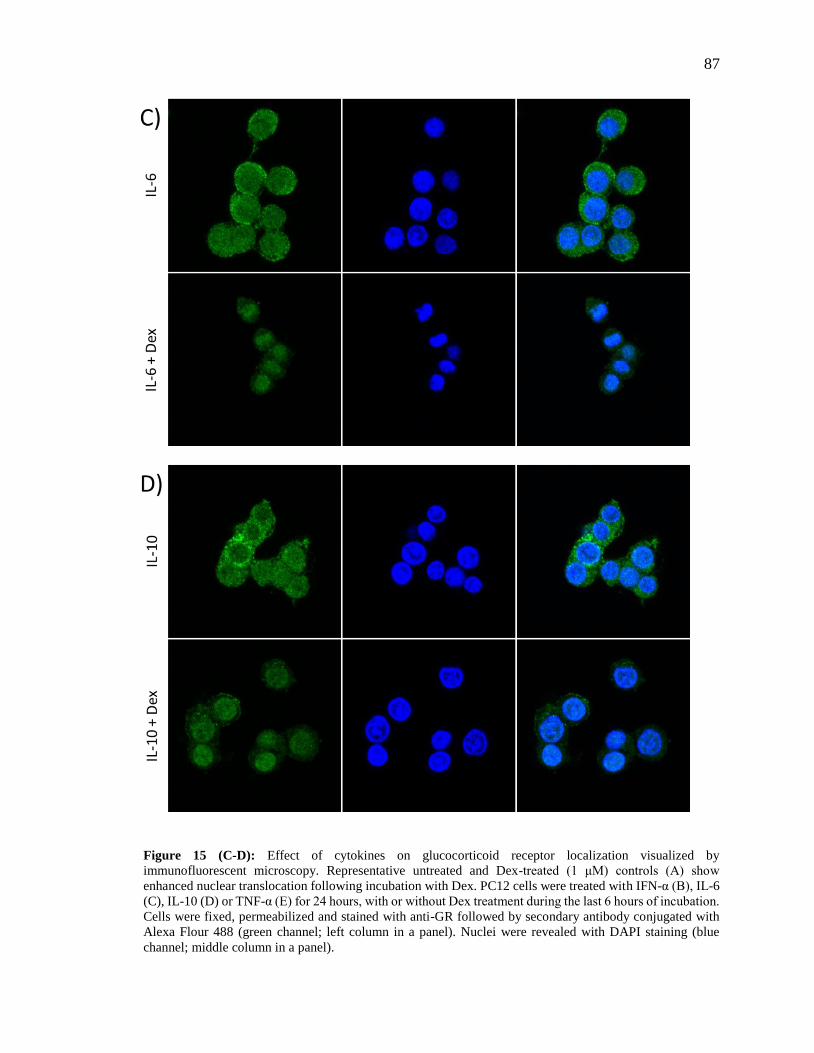
87
Figure 15 (C-D): Effect of cytokines on glucocorticoid receptor localization visualized by
immunofluorescent microscopy. Representative untreated and Dex-treated (1 μM) controls (A) show
enhanced nuclear translocation following incubation with Dex. PC12 cells were treated with IFN-α (B), IL-6
(C), IL-10 (D) or TNF-α (E) for 24 hours, with or without Dex treatment during the last 6 hours of incubation.
Cells were fixed, permeabilized and stained with anti-GR followed by secondary antibody conjugated with
Alexa Flour 488 (green channel; left column in a panel). Nuclei were revealed with DAPI staining (blue
channel; middle column in a panel).
88
Figure 15 (E): Effect of cytokines on glucocorticoid receptor localization visualized by immunofluorescent
microscopy. Representative untreated and Dex-treated (1 μM) controls (A) show enhanced nuclear
translocation following incubation with Dex. PC12 cells were treated with IFN-α (B), IL-6 (C), IL-10 (D) or
TNF-α (E) for 24 hours, with or without Dex treatment during the last 6 hours of incubation. Cells were fixed,
permeabilized and stained with anti-GR followed by secondary antibody conjugated with Alexa Flour 488
(green channel; left column in a panel). Nuclei were revealed with DAPI staining (blue channel; middle
column in a panel).
89
4 - Discussion
The present study provides compelling evidence that adrenal medullary chromaffin cells
are capable of integrating signals from immune signalling molecules with those of the HPA
and SA axes. These findings extend the current understanding of adrenal function in several
important ways. This study supports, for the first time, adrenal chromaffin cell
responsiveness to the cytokines IL-2, IL-10, and CCL2, and the potential regulatory effects
of these cytokines on CA biosynthetic function. Moreover, robust inhibitory effects of IFN-
α or TNF-α on expression of TH transcript and on PNMT promoter activation were
observed. This study also is the first to determine that chromaffin cells have the capacity to
integrate cytokine and GC signalling, resulting in context-specific regulation of CA
biosynthetic enzyme expression. This integration of cytokine and GC signalling occurs
independently of GR nuclear translocation and may rely on specific inhibitory mechanisms
within the nucleus.
As shown in Table 1, many cytokines are constitutively expressed in the adrenal medulla,
and can be derived locally from chromaffin cells themselves, from infiltrating immune
cells, or from adjacent steroid-producing cells (Call et al., 2000; Engström et al., 2007;
González-Hernández et al., 1994; Kontogeorgos, Messini, et al., 2002; Schober et al.,
1998). Based on the links between cytokines and hypertension, regulation of plasma CA
levels, or direct effects on adrenal chromaffin cells, seven cytokines were selected to
determine their influence on CA biosynthetic enzyme transcription. The concentrations of
90
cytokines used in our experiments were higher than concentrations reported in circulation
during hypertension; however, local adrenal cytokine concentrations may differ greatly
from those measured in circulation. Indeed, it has long been known that, compared to
peripheral sources, locally derived signalling molecules are particularly potent regulators
of adrenal chromaffin cell function (Wurtman, 1966). It was expected to that the cytokines
IFN-α, IL-1β, TNF-α, and CCL2 would increase, while IL-2, IL-6, or IL-10 would decrease
in CA biosynthetic enzyme expression in PC12 cells.
Our experiments demonstrated that IFN-α decreases basal TH transcript level. Signalling
by IFN-α in chromaffin cells may inhibit TH expression through activation of STAT1 and
STAT2. IFN-α increases phosphorylation and nuclear translocation of STAT1 and STAT2
in bovine chromaffin cells (Douglas & Bunn, 2009). STAT1 and STAT2 directly interact
with the CREB-binding protein (CBP)/p300 family of transcriptional coactivators
(Bhattacharya et al., 1996; Wojciak et al., 2009; Zhang et al., 1996). Competition of
multiple transcription factors for CBP/p300 has been demonstrated as a mechanism for
signal-induced transcriptional repression (Hottiger et al., 1998). CBP/p300 are also
coactivators of CREB, a major mediator of CRE-dependent transcription of TH in PC12
cells (Lewis-Tuffin et al., 2004; Vo & Goodman, 2001). The cAMP response element
(CRE) at -45 in the proximal rat TH promoter is important for basal TH expression and
cAMP response (Kim et al., 1993a; Trocmé et al., 1998). Preferential interaction of STAT1
and/or STAT2 with CBP/p300 could potentially explain IFN-α-induced decreases in TH
expression in basal conditions and in combination with Forsk. Like TH, the DBH promoter
also contains CRE-like motifs. Two adjacent CRE-like motifs are located in the DB1
element at approximately -180 bp in the DBH promoter; however, they appear to
91
preferentially bind Jun rather than CREB in the rat adrenal medulla (Sabban & Nankova,
1998). This may be why IFN-α did not have the simultaneous effect of inhibiting DBH
expression. Another change observed with IFN-α treatment was an inhibition of Dex-
induced PNMT mRNA expression. This finding was supported by a simultaneous reduction
in PNMT promoter driven luciferase activity. The IFN-α-induced decreases in luciferase
activity and PNMT mRNA with Dex treatment were proportionally similar, resulting in
approximately 45% inhibition. Inhibition of Dex-induced PNMT promoter activation by
IFN-α may be caused by transrepression of GR through STAT1 and STAT2 signalling.
STAT1-STAT2-IRF9 complex may prevent GRIP1 coactivation of GR if concentrations
of GRIP1 in chromaffin cells are limiting. Functional antagonism between STAT1-STAT2-
IRF9 complex and GR signalling has been reported previously in macrophages, which
express GRIP1 protein at low levels (Flammer et al., 2010). IFN-α treatment also inhibited
basal PNMT promoter expression in PC12 cells in absence of Dex, suggesting that the
inhibition could also occur by an alternate mechanism, independent of direct interaction
between IFN-α and GR signal transduction mechanisms. The inhibitory effects of IFN-α
on CA biosynthetic enzyme expression were not expected. IFN-α has been reported to
increase TH Ser-31 phosphorylation and inhibit NE uptake from chromaffin cells in vitro,
suggesting that under basal conditions this cytokine promotes the production and release of
CAs (Douglas & Bunn, 2009; Toyohira et al., 1998). Moreover, IFN-α treatment has been
reported to increase circulating NE and Epi levels in humans (Corssmit et al., 1996; Pende
et al., 1990). It is important to note, however, that IFN-α-induced TH Ser-31
phosphorylation is transient (returning to baseline after 20 min), and long-term (48 hour)
incubation with IFN-α does not increase TH protein levels in chromaffin cells (Douglas &
Bunn, 2009). A study of patients receiving acute treatment with IFN-α reported enhanced
92
HPA axis response, with elevated plasma ACTH and cortisol (Capuron et al., 2003).
Central or peripheral administration of IFN-α has also been reported to increase electrical
activity of splenic sympathetic nerve filaments in rats (Katafuchi et al., 1991). Therefore,
it is plausible that increases in circulating CA levels following injection of IFN-α in vivo
result from indirect regulatory effects on adrenal CA production. Moreover, in line with
our observation of IFN-α-induced inhibition of TH expression following Forsk treatment,
IFN-α has been reported to inhibit ACh-stimulated CA secretion in bovine chromaffin cells
(Tachikawa et al., 1997).
IL-1β treatment decreased TH mRNA levels after short term (6 hour) incubation, but IL-
1β did not significantly alter expression of TH, DBH, or PNMT in any other conditions
tested, including combined treatment with Dex or Forsk. IL-1β does not appear to be an
important regulator of CA biosynthetic enzymes at the transcript level. IL-1β treatment has
been reported to induce increases in total TH protein concentration (beginning at 6 hours),
TH Ser-40 phosphorylation, and CA release from adrenal chromaffin cells (Gwosdow et
al., 1992; Joseph et al., 1995; Rosmaninho-Salgado et al., 2009; Venihaki et al., 1998;
Yanagihara et al., 1994). Conversely, IL-1α/β has been reported to inhibit ACh-induced
CA release in bovine chromaffin cells (Morita et al., 2004). The increases in TH protein
concentration in chromaffin cells reported in the literature may result from regulation of
TH translation. In the absence of increases in TH transcript, induction of TH protein may
occur either through an enhanced rate of TH translation or an increase in TH protein
stability. Induction of TH protein and activity without concurrent elevation of TH mRNA
has been reported in rodent midbrain dopaminergic neurons through a mechanism
regulating TH mRNA translation rate (Chen et al., 2008).
93
After 6 hour incubation with IL-2, TH mRNA was decreased and after 24 hour incubation
with IL-10 Dex-induced elevation in PNMT mRNA was increased. Regulatory effects of
IL-2 were not observed in any other experimental condition tested. IL-10 did not
significantly change basal or Dex-induced PNMT promoter activation. IL-2 and IL-10 have
both been reported to decrease blood pressure and plasma Epi concentration. It was
expected that these cytokines would decrease expression of the CA biosynthetic enzymes
in adrenal chromaffin cells. Observations from the present study suggest that the
suppressive effect of IL-10 on plasma Epi concentration result from indirect action of the
cytokine on adrenal CA biosynthesis. IL-10 potentiation of PNMT transcriptional
activation by Dex may rely on post-transcriptional mechanisms, whereby integration of IL-
10 and GC signalling pathways results in altered PNMT mRNA splicing or stability. The
expression ratio of two distinct PNMT mRNA splice variants is subject to regulation and
has been correlated with PNMT enzyme activity (Unsworth et al., 1999). IL-10 could
plausibly increase the relative expression of the functional intronless PNMT transcript
compared to the intron-retaining transcript without changing overall PNMT promoter
activation.
The present study demonstrates that treatment with IL-6 (beginning at 24 hours) decreases
basal TH transcript in PC12 cells. Treatment of PC12 cells with IL-6 has previously been
reported to decrease TH protein levels (beginning at 24 hours) as well as DA and NE release
(Li et al., 2012). The IL-6-induced decrease in TH protein expression reported by Li et al.
(2012) may thus result from regulatory effects at the level of gene expression which lead
to reduced TH translation. Another possible mechanism may be gp-130-mediated
94
destabilization of TH protein, which has been reported in experiments using sympathetic
neurons treated with the IL-6 family cytokines ciliary neurotrophic factor and leukemia
inhibitory factor (Shi & Habecker, 2012). Increased expression of DBH with IL-6 treatment
was also observed. This increased DBH expression was present in control, Dex-, and Forsk-
treated groups, suggesting that this effect is independent GC or cAMP signalling
mechanisms. IL-6 signalling may cause repression of nuclear factors that bind to negative-
acting cis-regulatory elements in the DBH promoter (Kim et al., 1998; Shaskus et al., 1995).
Another possibility is that IL-6 signalling may inhibit basal Egr1 function, which could
conceivably result in reduced expression of TH and PNMT, and increased DBH expression,
which is similar to the overall effects observed in the present experiments (Cheng et al.,
2008). Because TH functions at an earlier stage in CA biosynthesis than DBH, the
inhibitory effects of IL-6 on TH expression may still limit activity of DBH, resulting in the
reported IL-6-induced decreases in DA and NE release from chromaffin cells (Li et al.,
2012). IL-6 also had a pronounced inhibitory effect on Dex-induced elevation of PNMT
transcript in PC12 cells. IL-6 did not produce a corresponding decrease in PNMT promoter
activation, suggesting that the effects of IL-6 on PNMT mRNA expression rely on post-
transcriptional mechanisms. Induction of STAT3 signalling has been reported in PC12 cells
treated with IL-6 (Li et al., 2012). STAT3 has also been reported to function synergistically
with GR signalling in rat hepatoma H4IIE cells, forming complexes with GR in the nucleus
and enhancing activation of IL-6 responsive elements and GREs (Zhang et al., 1997). Our
data suggest that synergistic interaction of IL-6 signalling pathways and GR must be tissue-
specific, as the effect was not observed in PC12 cells. Potential synergistic interaction of
GR and STAT3 may be inhibited by other IL-6-induced signalling events in chromaffin

95
cells, or IL-6 may fail to induce nuclear coactivators important in the function of the
STAT3-GR complex.
Incubation of PC12 cells with TNF-α produced significant changes in gene expression of
all three CA biosynthetic enzymes analyzed. TNF-α significantly decreased mRNA levels
of TH and DBH but did not decrease PNMT transcript level, although a decrease in PNMT
promoter activation was observed in luciferase experiments. A previous study using
oligonucleotide microarray analysis of TNF-α-induced changes in bovine chromaffin cell
transcriptome identified upregulation of PNMT transcript after long (48 hour), but not short
(6 hour) exposures to the cytokine (Ait-Ali et al., 2008). Preliminary experiments from the
present study did not reveal similar increases in PNMT mRNA levels with 48 hour exposure
to TNF-α; however, the concentration reported to increase PNMT was slightly higher than
our maximum tested concentration of 100 ng/ml (data not shown). The difference in
observations may be due to differences in the model systems used to assess cytokine
regulation of chromaffin cells. Differences between transcriptomes of bovine chromaffin
cells and PC12 cells following exposure to the same stimuli has been reported in the
literature (Ait-Ali, Samal, et al., 2010). Our observations from luciferase assay suggest that
TNF-α signalling in chromaffin cells does influence PNMT promoter activation,
presumably affecting transcription factor interaction with cis-regulatory elements. TNF-α
has been previously reported to have a suppressive effect on transactivation by the
transcription factor Sp1. Experiments using mouse hepatic and adipose cells demonstrated
that TNF-α signalling suppresses Sp1 binding to cis-regulatory elements and reduces
activity of an Sp1-responsive promoter-driven luciferase construct (Barth et al., 2002;
Denson et al., 2001). Promoters of TH, DBH, and PNMT all contain Sp1 binding sites.

96
Sp1binds to a cis-regulatory motif in the rat TH promoter that is critical for promoter
activation (Yang et al., 1998). Sp1 has also been reported to bind to the DBH promoter,
although its functional role is not fully understood (Kim et al., 1998; Seo et al., 1996).
There are two functional Sp1 binding sites in the PNMT promoter and Sp1contributes to
basal PNMT expression in chromaffin cells (Her et al., 1999, 2003). Taken together, TNF-
α-mediated inhibition of transactivation by Sp1 could explain the observed attenuation of
CA biosynthetic enzyme expression. Because TNF-α-induced decreases in gene expression
with Dex or Forsk were observed in tandem with decreases in basal expression, it is not
clear if the reduction in gene expression with combined application of TNF-α and either
Dex or Forsk is caused by functional interaction of the signalling pathways. TNF-α-
mediated inhibition of CA biosynthetic enzyme expression with Dex or Forsk may result
from inhibition of a factor, such as Sp1, that is involved in constitutive PNMT expression.
Such a mechanism for the repressive action of TNF-α on CA enzyme expression is
supported by the observation that GR localization following Dex treatment was not
significantly altered by TNF-α. Contradictory to the present observations, it was expected
that TNF-α would promote expression of the CA biosynthetic enzymes. Circulating TNF-
α concentrations are elevated in both mild hypertension and essential hypertension patient
cohorts relative their normotensive counterparts (Chrysohoou et al., 2004; Stumpf et al.,
2005). Further, it has been reported that peripherally administered TNF-α elevates plasma
CA levels in rats (Darling et al., 1989). The expected potentiation of CA biosynthetic
function in chromaffin cells by TNF-α was not observed, either under basal conditions or
when combined with stimulators of GR or cAMP signalling. Elevation of circulating CAs
by TNF-α may involve adrenal regulation through an intermediate mechanism similar to
the HPA and sympathetic activation reported with IFN-α. The present study is the first
97
detailed investigation of the direct regulatory effects of TNF-α on the CA biosynthetic
pathway in adrenal chromaffin cells. TNF-α has a marked inhibitory effect on CA
biosynthetic enzyme expression. This cytokine has been reported to be constitutively
expressed in the adrenal medulla (see Table 1). Thus, TNF-α may be an important local
regulator of chromaffin cell CA biosynthetic function in vivo, perhaps functioning to
decrease CA production during the progression of hypertension or other inflammatory
pathologies.
Though the chemotactic cytokine CCL2 may be a promising therapeutic target for reducing
blood pressure in hypertension, it does not appear to be an important regulator of
chromaffin cell CA biosynthetic enzyme expression. CCL2 has been suggested to
contribute to the progression of hypertension, with CCR2 antagonist reducing DOCA/salt-
induced elevations in blood pressure in mice. Elevated CCL2 expression is also reported in
mildly hypertensive humans and in tissues of hypertensive animals models, including
mouse aorta and rat renal cortex (Blasi et al., 2003; Chan et al., 2012; Stumpf et al., 2005).
This cytokine contributes to monocyte infiltration in the aortic wall in DOCA/salt
hypertensive mice (Chan et al., 2012). CCL2 expression in the adrenal medulla may be
increased in hypertension, originating either from the dense networks of medullary blood
vessels or from the chromaffin cells themselves. Indeed, CCL2 transcript expression has
been reported in bovine and rat chromaffin cells, with mRNA levels increasing in vitro
following incubation with TNF-α (>10-fold; bovine chromaffin cells) or PACAP (3-fold;
PC12_bPAC1hop cells), and in vivo in response to 2 hour immobilization stress (8-fold, rat
medulla) (Ait-Ali, Samal, et al., 2010; Liu et al., 2008; Samal et al., 2013). Inflammation
and enhanced SA activation may produce similar elevations in medullary CCL2 expression
98
during hypertension. Rather than directly influencing blood pressure through regulation of
chromaffin cell CA biosynthetic function, the blood pressure regulatory effects of CCL2
may be mediated by macrophage infiltration and the effects of macrophages on
physiological mechanisms of blood pressure control.
The cytokines IFN-α, IL-1, IL-2, IL-6, IL-10, TNF-α, and CCL2 can regulate expression
of enzymes responsible for production of CAs, the major secretory product of chromaffin
cells and important regulators of blood pressure homeostasis. The cytokines exerting the
strongest regulatory effects included IFN-α, IL-6, and TNF-α, which exhibited
predominantly inhibitory effects on CA biosynthetic enzyme expression. Constitutively
expressed cytokines may have an important function in homeostatic control of CA
biosynthesis by suppressing CA production during inflammation. This could be an
important innate mechanism for preventing the progression of hypertension, by dampening
CA production as inflammation increases with elevations in blood pressure. The inhibitory
effect of cytokines on GC-induced activation of chromaffin cells may also be part of an
autoregulatory loop to prevent medullary over-stimulation. This could be particularly
important in inflammatory conditions where inflammation induces a compensatory
increase GC secretion (an important endogenous anti-inflammatory molecule) (McEwen et
al., 1997). Increased concentration of GCs in the adrenal medulla, in the absence of such
an inhibitory mechanism, would result in increased CA release (Wurtman & Axelrod,
1966). Thus, immune changes that coincide with hypertension could potentially help to
signal an adaptive inhibition of CA biosynthetic function of the adrenal medulla. Cytokine-
mediated antagonism of GC-induced chromaffin cell activation could also help to prevent
adrenal medullary over-activation in situations when inflammation leads to increased

99
secretion of anti-inflammatory GCs. Both effects may be protective mechanisms against
the development of hypertension; disturbance of such mechanisms, either by changes in
local adrenal cytokine levels or by disruption of chromaffin cell sensitivity to cytokines
could be a contributing factor to the progression of hypertension in some individuals.

100
5 - Conclusion
Findings from the present study suggest that: (i) cytokines including IFN-α, IL-1β, IL-2,
IL-6, and TNF-α have direct regulatory effects on basal expression of the CA biosynthetic
enzymes TH and DBH; (ii) adrenal chromaffin cells have the capacity to integrate signals
from immune, hormonal, and neural origins to produce unique regulatory effects on CA
biosynthetic machinery and that these effects are particularly prominent in the regulation
of PNMT by IFN-α, IL-6, IL-10, and TNF-α; (iii) the regulatory effects of some cytokines,
such as IFN-α and TNF-α, involve direct control of PNMT promoter activation, whereas
other cytokines, such as IL-6 and IL-10, regulate PNMT transcript levels without affecting
promoter activation; and, (iv) cytokines do not regulate promoter activation by influencing
GR nuclear translocation in chromaffin cells. These findings support the possibility of a
novel mechanism, whereby cytokines could function as potent endogenous regulators of
CA biosynthetic function in the adrenal with the possibility of contributing to the
progression of hypertension.
101
6 - Future Directions
A potential role for multiple cytokines in regulating CA biosynthetic function of adrenal
chromaffin cells has now been identified in vitro. It is unknown if medullary expression of
cytokines that have robust regulatory effects on chromaffin cells, such as IFN-α, IL-6, or
TNF-α, is changed during hypertension. Future investigations to determine changes in local
cytokine concentrations in the adrenal medulla during prehypertension and overt
hypertension will provide better insight into the relevance of cytokine-chromaffin cell
signalling in this disease. The particular molecular mechanisms involved in integrating
hormonal, neural, and immune inputs to the adrenal medulla also remain to be elucidated.
The patterns of cytokine regulatory effects on CA enzyme expression provide insight into
potential points of interaction. Because cytokines inhibited PNMT transcript in presence of
Dex, and also altered promoter activation under these conditions, it would be interesting to
elucidate if these effects could be mediated by changes in GR binding at GREs or by
changes in other transcription factors that mediate PNMT transcription. Future
investigations into converging immune, hormonal, and neural signalling mechanisms may
also include: competition studies between STAT1/2 with CREB and GR for coactivators
CBP/p300 and GRIP1 respectively, the influence of IL-6 on binding of negative acting cis-
regulatory elements in the DBH promoter, regulation of Egr1-mediated promoter activation
by IL-6, suppression of Sp1 binding to cis-regulatory elements or Sp1-responsive
promoter-driven luciferase activity by TNF-α.
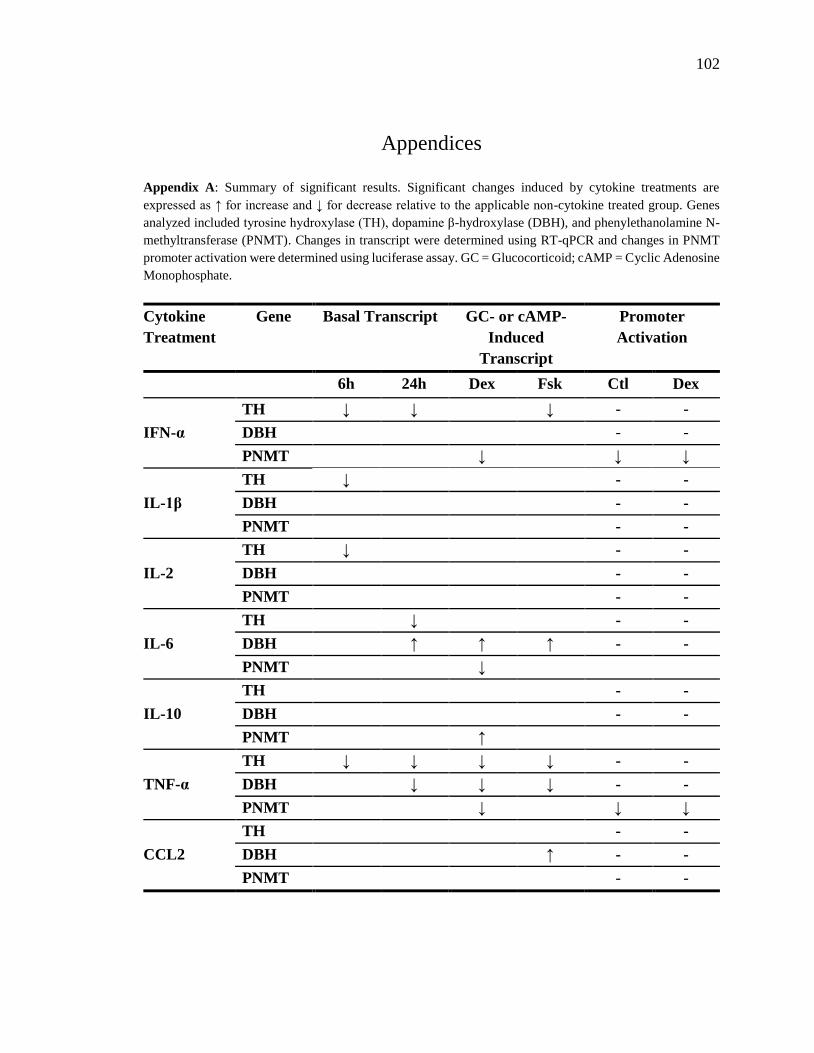
102
Appendices
Appendix A: Summary of significant results. Significant changes induced by cytokine treatments are
expressed as ↑ for increase and ↓ for decrease relative to the applicable non-cytokine treated group. Genes
analyzed included tyrosine hydroxylase (TH), dopamine β-hydroxylase (DBH), and phenylethanolamine N-
methyltransferase (PNMT). Changes in transcript were determined using RT-qPCR and changes in PNMT
promoter activation were determined using luciferase assay. GC = Glucocorticoid; cAMP = Cyclic Adenosine
Monophosphate.
Cytokine
Treatment
Gene Basal Transcript GC- or cAMP-
Induced
Transcript
Promoter
Activation
6h 24h Dex Fsk Ctl Dex
IFN-α
TH ↓ ↓ ↓ - -
DBH - -
PNMT ↓ ↓ ↓
IL-1β
TH ↓ - -
DBH - -
PNMT - -
IL-2
TH ↓ - -
DBH - -
PNMT - -
IL-6
TH ↓ - -
DBH ↑ ↑ ↑ - -
PNMT ↓
IL-10
TH - -
DBH - -
PNMT ↑
TNF-α
TH ↓ ↓ ↓ ↓ - -
DBH ↓ ↓ ↓ - -
PNMT ↓ ↓ ↓
CCL2
TH - -
DBH ↑ - -
PNMT - -
103
Bibliography
Adameova, A., Abdellatif, Y. & Dhalla, N. S. (2009). Role of the excessive amounts of
circulating catecholamines and glucocorticoids in stress-induced heart disease.
Canadian journal of physiology and pharmacology, 87(7), 493–514.
Ait-Ali, D., Samal, B., Mustafa, T. & Eiden, L. E. (2010). Neuropeptides, growth factors,
and cytokines: a cohort of informational molecules whose expression is up-regulated
by the stress-associated slow transmitter PACAP in chromaffin cells. Cellular and
molecular neurobiology, 30(8), 1441–9.
Ait-Ali, D., Stroth, N., Sen, J. M. & Eiden, L. E. (2010). PACAP-cytokine interactions
govern adrenal neuropeptide biosynthesis after systemic administration of LPS.
Neuropharmacology, 58(1), 208–14.
Ait-Ali, D., Turquier, V., Grumolato, L., Yon, L., Jourdain, M., Alexandre, D., Eiden, L.,
Vaudry, H., & Anouar, Y. (2004). The proinflammatory cytokines tumor necrosis
factor-alpha and interleukin-1 stimulate neuropeptide gene transcription and secretion
in adrenochromaffin cells via activation of extracellularly regulated kinase 1/2 and
p38 protein kinases, and activator protein-1 transcription factors. Molecular
Endocrinology, 18(7), 1721–39.
Ait-Ali, D., Turquier, V., Tanguy, Y., Thouënnon, E., Ghzili, H., Mounien, L., Derambure,
C., Jégou, S., Salier, J., Vaudry, H., Eiden, L., & Anouar, Y. (2008). Tumor necrosis
factor (TNF)-alpha persistently activates nuclear factor-kappaB signaling through the
type 2 TNF receptor in chromaffin cells: implications for long-term regulation of
neuropeptide gene expression in inflammation. Endocrinology, 149(6), 2840–52.
Akiyoshi, M., Shimizu, Y. & Saito, M. (1990). Interleukin-1 increases norepinephrine
turnover in the spleen and lung in rats. Biochemical and biophysical research
communications, 173(3), 1266–70.
Alheim, K., Andersson, C., Tingsborg, S., Ziolkowska, M., Schultzberg, M. & Bartfai, T.
(1991). Interleukin 1 expression is inducible by nerve growth factor in PC12
pheochromocytoma cells. Proceedings of the National Academy of Sciences of the
United States of America, 88(20), 9302–6.
Anderson, E. A., Sinkey, C. A., Lawton, W. J. & Mark, A. L. (1989). Elevated sympathetic
nerve activity in borderline hypertensive humans. Evidence from direct intraneural
104
recordings. Hypertension, 14(2), 177–83.
Andersson, C., Svenson, S. B., Deventer, S. Van, Cerami, A. & Bartfai, T. (1992).
Interleukin-1 alpha expression is inducible by cholinergic stimulation in the rat adrenal
gland. Neuroscience, 47(2), 481–5.
Armstrong, A. W., Harskamp, C. T. & Armstrong, E. J. (2013). The association between
psoriasis and hypertension: a systematic review and meta-analysis of observational
studies. Journal of hypertension, 31(3), 433–443.
Axelrod, J. (1962). Purification and properties of phenylethanolamine-N-methyl
transferase. J. Biol. Chem., 237(5), 1657–1660.
Axelrod, J. (1976). Catecholamines and hypertension. Clinical Science and Molecular
Medicine, 51, 415–421.
Axelrod, J. & Reisine, T. (1984). Stress hormones: their interaction and regulation. Science,
224(4648), 452–459.
Barth, N., Langmann, T., Schölmerich, J., Schmitz, G. & Schäffler, A. (2002).
Identification of regulatory elements in the human adipose most abundant gene
transcript-1 (apM-1) promoter: role of SP1/SP3 and TNF-alpha as regulatory
pathways. Diabetologia, 45(10), 1425–33.
Baud, V. & Karin, M. (2001). Signal transduction by tumor necrosis factor and its relatives.
Trends in cell biology, 11(9), 372–7.
Baudry, N., Rasetti, C. & Vicaut, E. (1996). Differences between cytokine effects in the
microcirculation of the rat. The American journal of physiology, 271(3 Pt 2), H1186–
92.
Bendich, A., Belisle, E. H. & Strausser, H. R. (1981). Immune system modulation and its
effect on the blood pressure of the spontaneously hypertensive male and female rat.
Biochemical and biophysical research communications, 99(2), 600–7.
Berenbeim, D. M., Wong, D. L., Masover, S. J. & Ciaranello, R. D. (1979). Regulation of
synthesis and degradation of rat adrenal phenylethanolamine N-methyltransferase. III.
Stabilization of PNMT against thermal and tryptic degradation by S-
adenosylmethionine. Molecular pharmacology, 16(2), 482–90.
Berry, M. D., Juorio, A. V, Li, X. M. & Boulton, A. A. (1996). Aromatic L-amino acid
decarboxylase: a neglected and misunderstood enzyme. Neurochemical research,
21(9), 1075–87.
Bhattacharya, S., Eckner, R., Grossman, S., Oldread, E., Arany, Z., D’Andrea, A. &
Livingston, D. M. (1996). Cooperation of Stat2 and p300/CBP in signalling induced
105
by interferon-alpha. Nature, 383(6598), 344–7.
Biola, A., Lefebvre, P., Perrin-Wolff, M., Sturm, M., Bertoglio, J. & Pallardy, M. (2001).
Interleukin-2 inhibits glucocorticoid receptor transcriptional activity through a
mechanism involving STAT5 (signal transducer and activator of transcription 5) but
not AP-1. Molecular endocrinology, 15(7), 1062–76.
Blasi, E. R., Rocha, R., Rudolph, A. E., Blomme, E. A. G., Polly, M. L. & McMahon, E.
G. (2003). Aldosterone/salt induces renal inflammation and fibrosis in hypertensive
rats. Kidney international, 63(5), 1791–800.
Bobrovskaya, L., Odell, A., Leal, R. B. & Dunkley, P. R. (2001). Tyrosine hydroxylase
phosphorylation in bovine adrenal chromaffin cells: the role of MAPKs after
angiotensin II stimulation. Journal of neurochemistry, 78(3), 490–8.
Bognar, I. T., Albrecht, S. A., Farasaty, M., Schmitt, E., Seidel, G. & Fuder, H. (1994).
Effects of human recombinant interleukins on stimulation-evoked noradrenaline
overflow from the rat perfused spleen. Naunyn-Schmiedeberg’s archives of
pharmacology, 349(5), 497–502.
Borkowski, K. R. & Quinn, P. (1984). Adrenaline and the development of genetic
hypertension. Journal of hypertension, 2(3), S81–3.
Bowsher, R. R. & Henry, D. P. (1986). Aromatic L-amino acid decarboxylase. In A. A.
Boulton, G. B. Baker & P. H. Yu (Eds.), Neuromethods: Neurotransmitter Enzymes
(Vol. 5, pp. 33–78). New Jersey: Humana Press.
Brands, M. W., Banes-Berceli, A. K. L., Inscho, E. W., Al-Azawi, H., Allen, A. J. & Labazi,
H. (2010). Interleukin 6 knockout prevents angiotensin II hypertension: role of renal
vasoconstriction and janus kinase 2/signal transducer and activator of transcription 3
activation. Hypertension, 56(5), 879–84.
Bühler, F., Amann, F. & Bolli, P. (1982). Elevated Adrenaline and Increased -
Adrenoceptor-Mediated Vasoconstriction in Essential Hypertension. Journal of
cardiovascular pharmacology, 4(1), 134–138.
Bunn, S. J., Ait-Ali, D. & Eiden, L. E. (2012). Immune-neuroendocrine integration at the
adrenal gland: cytokine control of the adrenomedullary transcriptome. Journal of
molecular neuroscience, 48(2), 413–9.
Bunn, S. J., Carman, F. & Douglas, S. (2009). Interleukin-6 mediated activation of ERK1/2
and STAT3 in adrenal medullary chromaffin cells. Proceedings of the Australian
Neuroscience Soc., Canberra, Australia.
Caldenhoven, E., Liden, J., Wissink, S., Stolpe, A., Raaijmakers, J., Koenderman, L.,
106
Okret, S., Gustafsson, J., Van der Saag, P. (1995). Negative cross-talk between RelA
and the glucocorticoid receptor: a possible mechanism for the antiinflammatory action
of glucocorticoids. Molecular endocrinology, 9(4), 401–12.
Call, G. B., Husein, O. F., McIlmoil, C. J., Adams, A., Heckmann, R. A. & Judd, A. M.
(2000). Bovine adrenal cells secrete interleukin-6 and tumor necrosis factor in vitro.
General and comparative endocrinology, 118(2), 249–61.
Cammarota, M., Bevilaqua, L. R. M., Rostas, J. A. P. & Dunkley, P. R. (2003). Histamine
activates tyrosine hydroxylase in bovine adrenal chromaffin cells through a pathway
that involves ERK1/2 but not p38 or JNK. Journal of neurochemistry, 84(3), 453–8.
Cannon, W. & Paz, D. de La. (1911). Emotional stimulation of adrenal secretion. American
Journal of physiology, 28, 64–70.
Capuron, L., Raison, C. L., Musselman, D. L., Lawson, D. H., Nemeroff, C. B. & Miller,
A. H. (2003). Association of exaggerated HPA axis response to the initial injection of
interferon-alpha with development of depression during interferon-alpha therapy. The
American journal of psychiatry, 160(7), 1342–5.
Caraglia, M., Marra, M., Pelaia, G., Maselli, R., Caputi, M., Marsico, S. A. & Abbruzzese,
A. (2005). Alpha-interferon and its effects on signal transduction pathways. Journal
of cellular physiology, 202(2), 323–35.
Carey, R. M. (2001). Renal dopamine system: paracrine regulator of sodium homeostasis
and blood pressure. Hypertension, 38(3), 297–302.
Caron, M. G. & Lefkowitz, R. J. (1993). Catecholamine receptors: structure, function, and
regulation. In C. Wayne Bardin (Ed.), Recent progress in hormone research (48th ed.,
pp. 277–290). 1250 Sixth Avenue, San Diego, California: Academic Press, Inc.
Cavaillon, J. M., Adib-Conquy, M., Fitting, C., Adrie, C. & Payen, D. (2003). Cytokine
cascade in sepsis. Scandinavian journal of infectious diseases, 35(9), 535–44.
Cavallotti, D., Artico, M., Iannetti, G. & Cavallotti, C. (2002). Occurrence of adrenergic
nerve fibers in human thymus during immune response. Neurochemistry
international, 40(3), 211–21.
Chae, C. U., Lee, R. T., Rifai, N. & Ridker, P. M. (2001). Blood pressure and inflammation
in apparently healthy men. Hypertension, 38(3), 399–403.
Chan, C. T., Moore, J. P., Budzyn, K., Guida, E., Diep, H., Vinh, A., … Drummond, G. R.
(2012). Reversal of vascular macrophage accumulation and hypertension by a CCR2
antagonist in deoxycorticosterone/salt-treated mice. Hypertension, 60(5), 1207–12.
Chen, X., Xu, L., Radcliffe, P., Sun, B. & Tank, A. W. (2008). Activation of tyrosine

107
hydroxylase mRNA translation by cAMP in midbrain dopaminergic neurons.
Molecular pharmacology, 73(6), 1816–28.
Cheng, S. Y., Serova, L. I., Glazkova, D. & Sabban, E. L. (2008). Regulation of rat
dopamine beta-hydroxylase gene transcription by early growth response gene 1
(Egr1). Brain research, 1193, 1–11.
Christenson, J. G., Dairman, W. & Udenfriend, S. (1972). On the identity of DOPA
decarboxylase and 5-hydroxytryptophan decarboxylase (immunological titration-
aromatic L-amino acid decarboxylase-serotonin-dopamine-norepinephrine).
Proceedings of the National Academy of Sciences of the United States of America,
69(2), 343–347.
Chrysohoou, C., Pitsavos, C., Panagiotakos, D. B., Skoumas, J. & Stefanadis, C. (2004).
Association between prehypertension status and inflammatory markers related to
atherosclerotic disease: The ATTICA Study. American journal of hypertension, 17(7),
568–73.
Coffman, T. M. (2011). Under pressure: the search for the essential mechanisms of
hypertension. Nature medicine, 17(11), 1402–9.
Colomer, C., Martin, A. O., Desarménien, M. G. & Guérineau, N. C. (2012). Gap junction-
mediated intercellular communication in the adrenal medulla: An additional ingredient
of stimulus-secretion coupling regulation. Biochimica et Biophysica Acta, 1818(8),
1937–1951.
Corssmit, E. P., Heijligenberg, R., Endert, E., Ackermans, M. T., Sauerwein, H. P. &
Romijn, J. A. (1996). Endocrine and metabolic effects of interferon-alpha in humans.
The Journal of clinical endocrinology and metabolism, 81(9), 3265–9.
Cowley, A. W. (2006). The genetic dissection of essential hypertension. Nature reviews.
Genetics, 7(11), 829–40.
Crowley, S. D., Frey, C. W., Gould, S. K., Griffiths, R., Ruiz, P., Burchette, J. L., …
Coffman, T. M. (2008). Stimulation of lymphocyte responses by angiotensin II
promotes kidney injury in hypertension. American journal of physiology. Renal
physiology, 295(2), 515–24.
Curtis, B. M. & O’Keefe, J. H. (2002). Autonomic tone as a cardiovascular risk factor: the
dangers of chronic fight or flight. Mayo Clinic proceedings, 77(1), 45–54.
Darling, G., Goldstein, D. S., Stull, R., Gorschboth, C. M. & Norton, J. A. (1989). Tumor
necrosis factor: immune endocrine interaction. Surgery, 106(6), 1155–60.
Daubner, S. C., Lauriano, C., Haycock, J. W. & Fitzpatrick, P. F. (1992). Site-directed
108
mutagenesis of serine 40 of rat tyrosine hydroxylase. Effects of dopamine and cAMP-
dependent phosphorylation on enzyme activity. The Journal of biological chemistry,
267(18), 12639–46.
DeForge, L. E., Kenney, J. S., Jones, M. L., Warren, J. S. & Remick, D. G. (1992). Biphasic
production of IL-8 in lipopolysaccharide (LPS)-stimulated human whole blood.
Separation of LPS- and cytokine-stimulated components using anti-tumor necrosis
factor and anti-IL-1 antibodies. Journal of immunology, 148(7), 2133–41.
Denson, L. A., Menon, R. K., Shaufl, A., Bajwa, H. S., Williams, C. R. & Karpen, S. J.
(2001). TNF-alpha downregulates murine hepatic growth hormone receptor
expression by inhibiting Sp1 and Sp3 binding. The Journal of clinical investigation,
107(11), 1451–8.
Desarménien, M. G., Jourdan, C., Toutain, B., Vessières, E., Hormuzdi, S. G. & Guérineau,
N. C. (2013). Gap junction signalling is a stress-regulated component of adrenal
neuroendocrine stimulus-secretion coupling in vivo. Nature communications, 4, 2938.
Descoteaux, A. & Matlashewski, G. (1990). Regulation of tumor necrosis factor gene
expression and protein synthesis in murine macrophages treated with recombinant
tumor necrosis factor. Journal of immunology, 145(3), 846–53.
Dinarello, C. A., Ikejima, T., Warner, S. J., Orencole, S. F., Lonnemann, G., Cannon, J. G.
& Libby, P. (1987). Interleukin 1 induces interleukin 1. I. Induction of circulating
interleukin 1 in rabbits in vivo and in human mononuclear cells in vitro. Journal of
immunology, 139(6), 1902–10.
Douglas, S. A. & Bunn, S. J. (2009). Interferon-alpha signalling in bovine adrenal
chromaffin cells: involvement of signal-transducer and activator of transcription 1 and
2, extracellular signal-regulated protein kinases 1/2 and serine 31 phosphorylation of
tyrosine hydroxylase. Journal of neuroendocrinology, 21(3), 200–7.
Douglas, S. A., Sreenivasan, D., Carman, F. H. & Bunn, S. J. (2010). Cytokine interactions
with adrenal medullary chromaffin cells. Cellular and molecular neurobiology, 30(8),
1467–75.
Douglas, W. W. (1968). Stimulus-secretion coupling: the concept and clues from
chromaffin and other cells. British Journal of Pharmacology, 34(3), 451–474.
Dowlati, Y., Herrmann, N., Swardfager, W., Liu, H., Sham, L., Reim, E. K. & Lanctôt, K.
L. (2010). A meta-analysis of cytokines in major depression. Biological psychiatry,
67(5), 446–57.
Droste, S. K., Groote, L. de, Atkinson, H. C., Lightman, S. L., Reul, J. M. H. M. &
Linthorst, A. C. E. (2008). Corticosterone levels in the brain show a distinct ultradian
109
rhythm but a delayed response to forced swim stress. Endocrinology, 149(7), 3244–
53.
Dunn, A. J. (2006). Effects of cytokines and infections on brain neurochemistry. Clinical
neuroscience research, 6(1-2), 52–68.
Dzielak, D. J. (1991). Immune mechanisms in experimental and essential hypertension. The
American journal of physiology, 260(3 Pt 2), R459–67.
Ebert, S. N., Balt, S. L., Hunter, J. P., Gashler, A., Sukhatme, V. & Wong, D. L. (1994).
Egr-1 activation of rat adrenal phenylethanolamine N-methyltransferase gene. The
Journal of biological chemistry, 269(33), 20885–98.
Elenkov, I. J., Wilder, R. L., Chrousos, G. P. & Vizi, E. S. (2000). The sympathetic nerve
- an integrative interface between two supersystems: the brain and the immune system.
Pharmacological reviews, 52(4), 595–638.
Elmarakby, A. A., Quigley, J. E., Imig, J. D., Pollock, J. S. & Pollock, D. M. (2008). TNF-
alpha inhibition reduces renal injury in DOCA-salt hypertensive rats. American
journal of physiology. Regulatory, integrative and comparative physiology, 294(1),
76–83.
Emery, A. C. & Eiden, L. E. (2012). Signaling through the neuropeptide GPCR PAC₁
induces neuritogenesis via a single linear cAMP- and ERK-dependent pathway using
a novel cAMP sensor. FASEB journal: official publication of the Federation of
American Societies for Experimental Biology, 26(8), 3199–211.
Engström, L., Rosén, K., Angel, A., Fyrberg, A., Mackerlova, L., Konsman, J. P., Engblom
D., Blomqvist, A. (2007). Systemic immune challenge activates an intrinsically
regulated local inflammatory circuit in the adrenal gland. Endocrinology, 149(4),
1436–50.
Eskay, R. L. & Eiden, L. E. (1992). Interleukin-1 alpha and tumor necrosis factor-alpha
differentially regulate enkephalin, vasoactive intestinal polypeptide, neurotensin, and
substance P biosynthesis in chromaffin cells. Endocrinology, 130(4), 2252–8.
Evinger, M. J., Ernsberger, P., Regunathan, S., Joh, T. H. & Reis, D. J. (1994). A single
transmitter regulates gene expression through two separate mechanisms: cholinergic
regulation of phenylethanolamine N-methyltransferase mRNA via nicotinic and
muscarinic pathways. The journal of neuroscience, 14(4), 2106–16.
Evinger, M. J., Towle, A. C., Park, D. H., Lee, P. & Joh, T. H. (1992). Glucocorticoids
stimulate transcription of the rat phenylethanolamine N-methyltransferase (PNMT)
gene in vivo and in vitro. Cellular and molecular neurobiology, 12(3), 193–215.

110
Faggioni, R., Allavena, P., Cantoni, L., Carelli, M., Demitri, M. T., Delgado, R., Gatti, S.,
Gnocchi, P., Isetta, A, Paganin, C. (1994). Mechanisms of interleukin-2-induced
hydrothoraxy in mice: protective effect of endotoxin tolerance and dexamethasone and
possible role of reactive oxygen intermediates. Journal of immunotherapy with
emphasis on tumor immunology, 15(3), 194–201.
Fang, X. X., Jiang, X. L., Han, X. H., Peng, Y. P. & Qiu, Y. H. (2013). Neuroprotection of
interleukin-6 against NMDA-induced neurotoxicity is mediated by JAK/STAT3,
MAPK/ERK, and PI3K/AKT signaling pathways. Cellular and molecular
neurobiology, 33(2), 241–51.
Feinberg, B., Kurzrock, R., Talpaz, M., Blick, M., Saks, S. & Gutterman, J. U. (1988). A
phase I trial of intravenously-administered recombinant tumor necrosis factor-alpha
in cancer patients. Journal of clinical oncology, 6(8), 1328–34.
Fhaner, M. J., Galligan, J. J. & Swain, G. M. (2013). Increased catecholamine secretion
from single adrenal chromaffin cells in DOCA-salt hypertension is associated with
potassium channel dysfunction. ACS chemical neuroscience, 4(10), 1404–13.
Flammer, J. R., Dobrovolna, J., Kennedy, M. A., Chinenov, Y., Glass, C. K., Ivashkiv, L.
B. & Rogatsky, I. (2010). The type I interferon signaling pathway is a target for
glucocorticoid inhibition. Molecular and cellular biology, 30(19), 4564–74.
Franchimont, D., Martens, H., Hagelstein, M. T., Louis, E., Dewe, W., Chrousos, G. P., …
Geenen, V. (1999). Tumor necrosis factor alpha decreases, and interleukin-10
increases, the sensitivity of human monocytes to dexamethasone: potential regulation
of the glucocorticoid receptor. The Journal of clinical endocrinology and metabolism,
84(8), 2834–9.
Gadient, R. A., Lachmund, A., Unsicker, K. & Otten, U. (1995). Expression of interleukin-
6 (IL-6) and IL-6 receptor mRNAs in rat adrenal medulla. Neuroscience letters, 194(1-
2), 17–20.
Galliher-Beckley, A. J. & Cidlowski, J. A. (2009). Emerging roles of glucocorticoid
receptor phosphorylation in modulating glucocorticoid hormone action in health and
disease. IUBMB life, 61(10), 979–86.
Galon, J., Franchimont, D., Hiroi, N., Frey, G., Boettner, A., Ehrhart-Bornstein, M., …
Bornstein, S. R. (2002). Gene profiling reveals unknown enhancing and suppressive
actions of glucocorticoids on immune cells. FASEB journal: official publication of the
Federation of American Societies for Experimental Biology, 16(1), 61–71.
Gaynor, E. R., Vitek, L., Sticklin, L., Creekmore, S. P., Ferraro, M. E., Thomas, J. X.,
Fisher, S. G., Fisher, R. I. (1988). The hemodynamic effects of treatment with
111
interleukin-2 and lymphokine-activated killer cells. Annals of internal medicine,
109(12), 953–8.
Gaziano, T. A., Bitton, A., Anand, S. & Weinstein, M. C. (2009). The global cost of
nonoptimal blood pressure. Journal of hypertension, 27(7), 1472–7.
Gerdin, M. J. & Eiden, L. E. (2007). Regulation of PC12 cell differentiation by cAMP
signaling to ERK independent of PKA: do all the connections add up? Science’s
STKE : signal transduction knowledge environment, 2007(382), pe15.
Ginty, D. D., Glowacka, D., Bader, D. S., Hidaka, H. & Wagner, J. A. (1991). Induction of
immediate early genes by Ca2+ influx requires cAMP-dependent protein kinase in
PC12 cells. The Journal of biological chemistry, 266(26), 17454–8.
Goldstein, D. S. (1983). Plasma catecholamines and essential hypertension. An analytical
review. Hypertension, 5, 86–99.
Goleva, E., Kisich, K. O. & Leung, D. Y. M. (2002). A role for STAT5 in the pathogenesis
of IL-2-induced glucocorticoid resistance. Journal of immunology (Baltimore, Md. :
1950), 169(10), 5934–40.
González-Hernández, J. A., Bornstein, S. R., Ehrhart-Bornstein, M., Geschwend, J. E.,
Adler, G. & Scherbaum, W. A. (1994). Macrophages within the human adrenal gland.
Cell and tissue research, 278(2), 201–5.
González-Hernández, J. A., Bornstein, S. R., Ehrhart-Bornstein, M., Gschwend, J. E.,
Gwosdow, A., Jirikowski, G. & Scherbaum, W. A. (1995). IL-1 is expressed in human
adrenal gland in vivo. Possible role in a local immune-adrenal axis. Clinical and
experimental immunology, 99(1), 137–41.
González-Hernández, J. A., Ehrhart-Bornstein, M., Späth-Schwalbe, E., Scherbaum, W. A.
& Bornstein, S. R. (1996). Human adrenal cells express tumor necrosis factor-alpha
messenger ribonucleic acid: evidence for paracrine control of adrenal function. The
Journal of clinical endocrinology and metabolism, 81(2), 807–13.
Goryo, K., Torii, S., Yasumoto, K. I. & Sogawa, K. (2011). Tumour necrosis factor-α
suppresses the hypoxic response by NF-κB-dependent induction of inhibitory PAS
domain protein in PC12 cells. Journal of biochemistry, 150(3), 311–8.
Grobecker, H., Saavedra, J. M. & Weise, V. K. (1982). Biosynthetic enzyme activities and
catecholamines in adrenal glands of genetic and experimental hypertensive rats.
Circulation research, 50(5), 742–6.
Gueorguiev, V. D., Zeman, R. J., Hiremagalur, B., Menezes, A. & Sabban, E. L. (1999).
Differing temporal roles of Ca2+ and cAMP in nicotine-elicited elevation of tyrosine
112
hydroxylase mRNA. The American journal of physiology, 276(1), 54–65.
Guimarães, S. & Moura, D. (2001). Vascular adrenoceptors: an update. Pharmacological
reviews, 53(2), 319–56.
Guzik, T. J., Hoch, N. E., Brown, K. A., McCann, L. A., Rahman, A., Dikalov, S., Goronzy,
J., Weyand, C., Harrison, D. G. (2007). Role of the T cell in the genesis of angiotensin
II induced hypertension and vascular dysfunction. The Journal of experimental
medicine, 204(10), 2449–60.
Gwosdow, A. R. (1995). Mechanisms of interleukin-1-induced hormone secretion from the
rat adrenal gland. Endocrine research, 21(1-2), 25–37.
Gwosdow, A. R., O’Connell, N. A., Spencer, J. A., Kumar, M. S., Agarwal, R. K., Bode,
H. H. & Abou-Samra, A. B. (1992). Interleukin-1-induced corticosterone release
occurs by an adrenergic mechanism from rat adrenal gland. The American journal of
physiology, 263(3), 461–6.
Haddad, J. J., Saadé, N. E. & Safieh-Garabedian, B. (2002). Cytokines and neuro-immune-
endocrine interactions: a role for the hypothalamic-pituitary-adrenal revolving axis.
Journal of neuroimmunology, 133(1-2), 1–19.
Hagerty, T., Fernandez, E., Lynch, K., Wang, S. S., Morgan, W. W. & Strong, R. (2001).
Interaction of a glucocorticoid-responsive element with regulatory sequences in the
promoter region of the mouse tyrosine hydroxylase gene. Journal of neurochemistry,
78(6), 1379–88.
Hall, G., Steensberg, A., Sacchetti, M., Fischer, C., Keller, C., Schjerling, P., Hiscock, N.,
Møller, K., Saltin, B., Febbraio, M. A., Pedersen, B. K. (2003). Interleukin-6
stimulates lipolysis and fat oxidation in humans. The Journal of clinical endocrinology
and metabolism, 88(7), 3005–10.
Hansen, T. O., Rehfeld, J. F. & Nielsen, F. C. (2000). Cyclic AMP-induced neuronal
differentiation via activation of p38 mitogen-activated protein kinase. Journal of
neurochemistry, 75(5), 1870–7.
Hansson, G. K. & Libby, P. (2006). The immune response in atherosclerosis: a double-
edged sword. Nature reviews. Immunology, 6(7), 508–19.
Harrison, D. G., Guzik, T. J., Lob, H. E., Madhur, M. S., Marvar, P. J., Thabet, S. R., …
Weyand, C. M. (2011). Inflammation, immunity, and hypertension. Hypertension,
57(2), 132–40.
Hashimoto, K., Hirasawa, R. & Makino, S. (1993). Comparison of the effects of intra-third
ventricular administration of interleukin-1 or platelet activating factor on ACTH

113
secretion and the sympathetic-adrenomedullary system in conscious rats. Acta medica
Okayama, 47(1), 1–6.
Heck, S., Kullmann, M., Gast, A., Ponta, H., Rahmsdorf, H. J., Herrlich, P. & Cato, A. C.
(1994). A distinct modulating domain in glucocorticoid receptor monomers in the
repression of activity of the transcription factor AP-1. The EMBO journal, 13(17),
4087–95.
Her, S., Bell, R. A., Bloom, A. K., Siddall, B. J. & Wong, D. L. (1999). Phenylethanolamine
N-methyltransferase gene expression. Sp1 and MAZ potential for tissue-specific
expression. The Journal of biological chemistry, 274(13), 8698–707.
Her, S., Claycomb, R., Tai, T. & Wong, D. L. (2003). Regulation of the rat
phenylethanolamine N-methyltransferase gene by transcription factors Sp1 and MAZ.
Molecular Pharmacology, 64(5), 1180–1188.
Hiremagalur, B., Nankova, B., Nitahara, J., Zeman, R. & Sabban, E. L. (1993). Nicotine
increases expression of tyrosine hydroxylase gene. Involvement of protein kinase A-
mediated pathway. J. Biol. Chem., 268(31), 23704–23711.
Hoehe, M. R., Plaetke, R., Otterud, B., Stauffer, D., Holik, J., Byerley, W. F., Baetge, E.
E., Gershon, E. S., Lalouel, J. M., Leppert, M. (1992). Genetic linkage of the human
gene for phenylethanolamine N-methyltransferase (PNMT), the adrenaline-
synthesizing enzyme, to DNA markers on chromosome 17q21-q22. Human molecular
genetics, 1(3), 175–8.
Hökfelt, T., Bartfai, T. & Bloom, F. (2003). Neuropeptides: opportunities for drug
discovery. The Lancet. Neurology, 2(8), 463–72.
Hollan, I., Meroni, P. L., Ahearn, J. M., Cohen Tervaert, J. W., Curran, S., Goodyear, C.
S., Hestad, K., Kahaleh, B., Riggio, M., Shields, K., Wasko, M. C. (2013).
Cardiovascular disease in autoimmune rheumatic diseases. Autoimmunity reviews,
12(10), 1004–15.
Hottiger, M. O., Felzien, L. K. & Nabel, G. J. (1998). Modulation of cytokine-induced HIV
gene expression by competitive binding of transcription factors to the coactivator
p300. The EMBO journal, 17(11), 3124–34.
Hu, F., Pace, T. W. W. & Miller, A. H. (2009). Interferon-alpha inhibits glucocorticoid
receptor-mediated gene transcription via STAT5 activation in mouse HT22 cells.
Brain, behavior, and immunity, 23(4), 455–63.
Hurst, S. & Collins, S. M. (1993). Interleukin-1 beta modulation of norepinephrine release
from rat myenteric nerves. The American journal of physiology, 264(1), 30–5.

114
Hwang, O. & Joh, T. H. (1993). Effects of cAMP, glucocorticoids, and calcium on
dopamine beta-hydroxylase gene expression in bovine chromaffin cells. Journal of
molecular neuroscience : MN, 4(3), 173–183.
Hwang, O., Kim, M. L. & Lee, J. D. (1994). Differential induction of gene expression of
catecholamine biosynthetic enzymes and preferential increase in norepinephrine by
forskolin. Biochemical pharmacology, 48(10), 1927–34.
Hypertension Canada. (2015). 2015 CHEP recommendations for the management of
hypertension. Markham, ON: Hypertension Canada.
Irusen, E., Matthews, J. G., Takahashi, A., Barnes, P. J., Chung, K. F. & Adcock, I. M.
(2002). p38 Mitogen-activated protein kinase-induced glucocorticoid receptor
phosphorylation reduces its activity: role in steroid-insensitive asthma. The Journal of
allergy and clinical immunology, 109(4), 649–57.
Irwin, M. R. & Cole, S. W. (2011). Reciprocal regulation of the neural and innate immune
systems. Nature reviews. Immunology, 11(9), 625–32.
Iversen, P. O., Nicolaysen, A., Kvernebo, K., Benestad, H. B. & Nicolaysen, G. (1999).
Human cytokines modulate arterial vascular tone via endothelial receptors. Pflügers
Archiv : European journal of physiology, 439(1-2), 93–100.
Jablonskis, L. T. & Howe, P. R. (1994). Elevated plasma adrenaline in spontaneously
hypertensive rats. Blood pressure, 3(1-2), 106–11.
James, P. A., Oparil, S., Carter, B. L., Cushman, W. C., Dennison-Himmelfarb, C.,
Handler, J., Lackland, D. T., LeFevre, M. L., MacKenzie, T. D., Ogedegbe, O., Smith,
S. C., Svetkey, L. P., Taler, S. J., Townsend, R. R., Wright, J. T. Narva, A. S., Ortiz,
E. (2014). 2014 evidence-based guideline for the management of high blood pressure
in adults: report from the panel members appointed to the Eighth Joint National
Committee (JNC 8). JAMA : the journal of the American Medical Association, 311(5),
507–20.
Johnson, M. (2006). Molecular mechanisms of beta(2)-adrenergic receptor function,
response, and regulation. The Journal of allergy and clinical immunology, 117(1), 18–
24.
Jones, S. A., Horiuchi, S., Topley, N., Yamamoto, N. & Fuller, G. M. (2001). The soluble
interleukin 6 receptor: mechanisms of production and implications in disease. FASEB
journal : official publication of the Federation of American Societies for Experimental
Biology, 15(1), 43–58.
Joseph, A., Kumar, A., O’Connell, N. A., Agarwal, R. K. & Gwosdow, A. R. (1995).
Interleukin-1 alpha stimulates dopamine release by activating type II protein kinase A
115
in PC-12 cells. The American journal of physiology, 269(6), 1083–8.
Kamata, M., Higuchi, H., Yoshimoto, M., Yoshida, K. & Shimizu, T. (2000). Effect of
single intracerebroventricular injection of alpha-interferon on monoamine
concentrations in the rat brain. European neuropsychopharmacology : the journal of
the European College of Neuropsychopharmacology, 10(2), 129–32.
Kamimura, D., Ishihara, K. & Hirano, T. (2003). IL-6 signal transduction and its
physiological roles: the signal orchestration model. Reviews of physiology,
biochemistry and pharmacology, 149, 1–38.
Kandel, E. R., Schwartz, J. H., Jessell, T. M., Siegelbaum, S. A. & Hudspeth, A. J. (2012).
Principles of Neural Science (5th ed., Vol. 5). New York: McGraw-Hill.
Kaneda, N., Ichinose, H., Kobayashi, K., Oka, K., Kishi, F., Nakazawa, A, Kurosawa Y.,
Fujita K., Nagatsu, T. (1988). Molecular cloning of cDNA and chromosomal
assignment of the gene for human phenylethanolamine N-methyltransferase, the
enzyme for epinephrine biosynthesis. The Journal of biological chemistry, 263(16),
7672–7.
Kang, Y. M., He, R. L., Yang, L. M., Qin, D. N., Guggilam, A., Elks, C., Yan, N., Guo, Z.,
Francis, J. (2009). Brain tumour necrosis factor-alpha modulates neurotransmitters in
hypothalamic paraventricular nucleus in heart failure. Cardiovascular research,
83(4), 737–46.
Kannan, H., Tanaka, Y., Kunitake, T., Ueta, Y., Hayashida, Y. & Yamashita, H. (1996).
Activation of sympathetic outflow by recombinant human interleukin-1 beta in
conscious rats. The American journal of physiology, 270(2), 479–85.
Kaplan, N. M., Victor, R. G. & Flynn, J. T. (2010). Treatment of Hypertension : Drug
Therapy. In Kaplan’s Clinical Hypertension, 10th edn. (10th ed., pp. 192–273).
Philadelphia: Lippincott Williams & Wilkins.
Kassel, O., Schneider, S., Heilbock, C., Litfin, M., Göttlicher, M. & Herrlich, P. (2004). A
nuclear isoform of the focal adhesion LIM-domain protein Trip6 integrates activating
and repressing signals at AP-1- and NF-kappaB-regulated promoters. Genes &
development, 18(20), 2518–28.
Katafuchi, T., Hori, T. & Take, S. (1991). Central administration of interferon-alpha
enhances rat sympathetic nerve activity to the spleen. Neuroscience letters, 125(1),
37–40.
Kelly, J. J., Mangos, G., Williamson, P. M. & Whitworth, J. A. (1998). Cortisol and
hypertension. Clinical and experimental pharmacology & physiology. Supplement,
25, S51–6.
116
Kim, H. S., Yang, C. & Kim, K. S. (1998). The cell-specific silencer region of the human
dopamine beta-hydroxylase gene contains several negative regulatory elements.
Journal of neurochemistry, 71(1), 41–50.
Kim, K. S., Lee, M. K., Carroll, J. & Joh, T. H. (1993). Both the basal and inducible
transcription of the tyrosine hydroxylase gene are dependent upon a cAMP response
element. Journal of biological chemistry, 268(21), 15689–95.
Kim, K. T., Park, D. H. & Joh, T. H. (1993). Parallel up-regulation of catecholamine
biosynthetic enzymes by dexamethasone in PC12 cells. Journal of neurochemistry,
60(3), 946–51.
Kino, T. & Chrousos, G. P. (2003). Tumor necrosis factor alpha receptor- and Fas-
associated FLASH inhibit transcriptional activity of the glucocorticoid receptor by
binding to and interfering with its interaction with p160 type nuclear receptor
coactivators. The Journal of biological chemistry, 278(5), 3023–9.
Kino, T., Ichijo, T., Amin, N. D., Kesavapany, S., Wang, Y., Kim, N., Rao, S., Player, A.,
Zheng, Y. L., Garabedian, M. J., Kawasaki, E., Pant, H. C., Chrousos, G. P. (2007).
Cyclin-dependent kinase 5 differentially regulates the transcriptional activity of the
glucocorticoid receptor through phosphorylation: clinical implications for the nervous
system response to glucocorticoids and stress. Molecular endocrinology, 21(7), 1552–
68.
Kirabo, A., Fontana, V., Faria, A. P. C. De, Loperena, R., Galindo, C. L., Wu, J.,
Bikineyeva, A. T., Dikalov, S., Xiao, L., Chen, W., Saleh, M. A., Trott, D. W., Itani,
H. A., Vinh, A., Amarnath, V., Amarnath, K., Guzik, T. J., Bernstein, K. E., Shen, X.
Z., Shyr, Y., Chen, S., Mernaugh, R. L., Laffer, C. L., Elijovich, F., Davies, S. S.,
Moreno, H., Madhur, M. S., Roberts, J., Harrison, D. G., Faria, A. P. C., Loperena,
R., Galindo, C. L., Wu, J., Bikineyeva, A. T., Dikalov, S., Xiao, L., Chen, W., Saleh,
M. A., Trott, D. W., Itani, H. A., Vinh, A., Amarnath, V., Amarnath, K., Guzik, T. J.,
Bernstein, K. E., Shen, X. Z., Shyr, Y., Chen, S., Mernaugh, R. L., Laffer, C. L.,
Elijovich, F., Davies, S. S., Moreno, H., Madhur, M. S., Ii, J. R., Harrison, D. G.
(2014). DC isoketal-modified proteins activate T cells and promote hypertension. The
journal of clinical investigation,124(10).
Kitagami, T., Yamada, K., Miura, H., Hashimoto, R., Nabeshima, T. & Ohta, T. (2003).
Mechanism of systemically injected interferon-alpha impeding monoamine
biosynthesis in rats: role of nitric oxide as a signal crossing the blood-brain barrier.
Brain research, 978(1-2), 104–14.
Klevans, L. R. & Gebber, G. L. (1970). Comparison of differential secretion of adrenal
catecholamines by splanchnic nerve stimulation and cholinergic agents. The Journal
117
of pharmacology and experimental therapeutics, 172(1), 69–76.
Koike, G., Jacob, H. J., Krieger, J. E., Szpirer, C., Hoehe, M. R., Horiuchi, M. & Dzau, V.
J. (1995). Investigation of the phenylethanolamine N-methyltransferase gene as a
candidate gene for hypertension. Hypertension, 26(4), 595–601.
Kontogeorgos, G., Messini, I., Kyrodimou, E., Giannikaki, L., Zois, E., Koukoulis, G. &
Tsagarakis, S. (2002). Immunohistochemical localization of interleukin-6 in
peripheral human endocrine glands. Endocrine, 17(2), 135–40.
Kontogeorgos, G., Scheithauer, B. W., Kovacs, K., Horvath, E. & Melmed, S. (2002).
Growth factors and cytokines in paragangliomas and pheochromocytomas, with
special reference to sustentacular cells. Endocrine pathology, 13(3), 197–206.
Krause, T., Lovibond, K., Caulfield, M., McCormack, T. & Williams, B. (2011).
Management of hypertension: summary of NICE guidance. BMJ (Clinical research
ed.), 343, d4891.
Krum, H., Schlaich, M. P., Sobotka, P. A., Böhm, M., Mahfoud, F., Rocha-Singh, K.,
Katholi, R., Esler, M. D. (2014). Percutaneous renal denervation in patients with
treatment-resistant hypertension: final 3-year report of the Symplicity HTN-1 study.
Lancet, 383(9917), 622–9.
Kumai, T., Tateishi, T., Tanaka, M., Watanabe, M., Shimizu, H. & Kobayashi, S. (2000).
Effect of interferon-alpha on tyrosine hydroxylase and catecholamine levels in the
brain of rats. Life sciences, 67(6), 663–9.
Kuri, B. A., Chan, S. A. & Smith, C. B. (2009). PACAP regulates immediate catecholamine
release from adrenal chromaffin cells in an activity-dependent manner through a
protein kinase C-dependent pathway. Journal of neurochemistry, 110(4), 1214–25.
Kvetnansky, R. (2004). Stressor specificity and effect of prior experience on catecholamine
biosynthetic enzyme phenylethanolamine N-methyltransferase. Annals of the New
York Academy of Sciences, 1032, 117–29.
Kvetnansky, R., Gewirtz, G. P., Weise, V. K. & Kopin, I. J. (1971). Catecholamine-
synthesizing enzymes in the rat adrenal gland during exposure to cold. The American
journal of physiology, 220(4), 928–31.
Kvetnansky, R., Jelokova, J., Rusnak, M., Dronjak, S., Serova, L., Nankova, B. & Sabban,
E. L. (2002). Novel stressors exaggerate tyrosine hydroxylase gene expression in the
adrenal medulla of rats exposed to long-term cold stress. In K. R. McCarty R, Aguilera
G, Sabban EL (Ed.), Stress Neural, Endocrine and Molecular Studies (pp. 121–128).
New York: Taylor and Francis.
118
Kvetnansky, R., Rusnak, M., Dronjak, S., Krizanova, O. & Sabban, E. L. (2003). Effect of
novel stressors on tyrosine hydroxylase gene expression in the adrenal medulla of
repeatedly immobilized rats. Neurochemical research, 28(3-4), 625–30.
Kvetnansky, R., Sabban, E. L. & Palkovits, M. (2009). Catecholaminergic systems in
stress: structural and molecular genetic approaches. Physiological reviews, 89(2),
535–606.
Kvetnansky, R., Weise, V. K. & Kopin, I. J. (1970). Elevation of adrenal tyrosine
hydroxylase and phenylethanolamine-N-methyl transferase by repeated
immobilization of rats. Endocrinology, 87(4), 744–9.
Laurentiis, A. De, Pisera, D., Caruso, C., Candolfi, M., Mohn, C., Rettori, V. & Seilicovich,
A. (2002). Lipopolysaccharide- and tumor necrosis factor-alpha-induced changes in
prolactin secretion and dopaminergic activity in the hypothalamic-pituitary axis.
Neuroimmunomodulation, 10(1), 30–9.
Law, M. R., Morris, J. K. & Wald, N. J. (2009). Use of blood pressure lowering drugs in
the prevention of cardiovascular disease: meta-analysis of 147 randomised trials in the
context of expectations from prospective epidemiological studies. BMJ (Clinical
research ed.), 338, b1665.
Lawes, C. M. M., Hoorn, S. Vander & Rodgers, A. (2008). Global burden of blood-
pressure-related disease, 2001. Lancet, 371(9623), 1513–8.
Lee, D. L., Sturgis, L. C., Labazi, H., Osborne, J. B., Fleming, C., Pollock, J. S., Manhiani
M., Imig, J.D., Brands, M. W. (2006). Angiotensin II hypertension is attenuated in
interleukin-6 knockout mice. American journal of physiology. Heart and circulatory
physiology, 290(3), 935–40.
Lewis, E. J., Harrington, C. A. & Chikaraishi, D. M. (1987). Transcriptional regulation of
the tyrosine hydroxylase gene by glucocorticoid and cyclic AMP. Proceedings of the
National Academy of Sciences of the United States of America, 84(11), 3550–4.
Lewis, E. J., Tank, A. W., Weiner, N. & Chikaraishi, D. M. (1983). Regulation of tyrosine
hydroxylase mRNA by glucocorticoid and cyclic AMP in a rat pheochromocytoma
cell line. Isolation of a cDNA clone for tyrosine hydroxylase mRNA. The Journal of
biological chemistry, 258(23), 14632–7.
Lewis-Tuffin, L. J., Quinn, P. G. & Chikaraishi, D. M. (2004). Tyrosine hydroxylase
transcription depends primarily on cAMP response element activity, regardless of the
type of inducing stimulus. Molecular and cellular neuroscience, 25(3), 536–47.
Li, R., Hou, J., Xu, Q., Liu, Q. J., Shen, Y. J., Rodin, G. & Li, M. (2012). High level
interleukin-6 in the medium of human pancreatic cancer cell culture suppresses
119
production of neurotransmitters by PC12 cell line. Metabolic brain disease, 27(1), 91–
100.
Li, X. M., Juorio, A. V & Boulton, A. A. (1994). Induction of aromatic L-amino acid
decarboxylase mRNA by interleukin-1 beta and prostaglandin E2 in PC12 cells.
Neurochemical research, 19(5), 591–5.
Libby, P. (2006). Inflammation and cardiovascular disease mechanisms. The American
journal of clinical nutrition, 83(2), 456–60.
Lim, J., Yang, C., Hong, S. J. & Kim, K. S. (2000). Regulation of tyrosine hydroxylase
gene transcription by the cAMP-signaling pathway: involvement of multiple
transcription factors. Molecular and cellular biochemistry, 212(1-2), 51–60.
Liu, M. T., Huang, H. M., Jeng, K. C., Ou, S. C. & Kuo, J. S. (2000). Induction of cytokine
genes and IL-1alpha by chemical hypoxia in PC12 cells. Life sciences, 67(18), 2147–
57.
Liu, X., Serova, L., Kvetnanský, R. & Sabban, E. L. (2008). Identifying the stress
transcriptome in the adrenal medulla following acute and repeated immobilization.
Annals of the New York Academy of Sciences, 1148, 1–28.
Lohmeier, T. E. & Iliescu, R. (2011). Chronic lowering of blood pressure by carotid
baroreflex activation: mechanisms and potential for hypertension therapy.
Hypertension, 57(5), 880–6.
Macarthur, H., Westfall, T. C., Riley, D. P., Misko, T. P. & Salvemini, D. (2000).
Inactivation of catecholamines by superoxide gives new insights on the pathogenesis
of septic shock. Proceedings of the National Academy of Sciences of the United States
of America, 97(17), 9753–8.
Madhur, M. S., Lob, H. E., McCann, L. A., Iwakura, Y., Blinder, Y., Guzik, T. J. &
Harrison, D. G. (2010). Interleukin 17 promotes angiotensin II-induced hypertension
and vascular dysfunction. Hypertension, 55(2), 500–7.
Mancia, G., Fagard, R., Narkiewicz, K., Redon, J., Zanchetti, A., Böhm, M., … Wood, D.
A. (2013). 2013 ESH/ESC guidelines for the management of arterial hypertension: the
Task Force for the Management of Arterial Hypertension of the European Society of
Hypertension (ESH) and of the European Society of Cardiology (ESC). European
heart journal, 34(28), 2159–219.
Martin, B., Lopez de Maturana, R., Brenneman, R., Walent, T., Mattson, M. P. &
Maudsley, S. (2005). Class II G protein-coupled receptors and their ligands in
neuronal function and protection. Neuromolecular medicine, 7(1-2), 3–36.
120
McCann, S. M., Kimura, M., Karanth, S., Yu, W. H., Mastronardi, C. A. & Rettori, V.
(2000). The mechanism of action of cytokines to control the release of hypothalamic
and pituitary hormones in infection. Annals of the New York Academy of Sciences,
917, 4–18.
McEwen, B. S., Biron, C. A., Brunson, K. W., Bulloch, K., Chambers, W. H., Dhabhar, F.
S., Goldfarb, R. H., Kitson, R. P., Miller, A. H., Spencer, R. L., Weiss, J. M. (1997).
The role of adrenocorticoids as modulators of immune function in health and disease:
neural, endocrine and immune interactions. Brain research. Brain research reviews,
23(1-2), 79–133.
McMahon, A. & Sabban, E. L. (1992). Regulation of expression of dopamine beta-
hydroxylase in PC12 cells by glucocorticoids and cyclic AMP analogues. Journal of
neurochemistry, 59(6), 2040–2047.
Meng, L., Chen, D., Yang, Y., Zheng, Y. & Hui, R. (2012). Depression increases the risk
of hypertension incidence: a meta-analysis of prospective cohort studies. Journal of
hypertension, 30(5), 842–51.
Miller, A. L., Webb, M. S., Copik, A. J., Wang, Y., Johnson, B. H., Kumar, R. &
Thompson, E. B. (2005). p38 Mitogen-activated protein kinase (MAPK) is a key
mediator in glucocorticoid-induced apoptosis of lymphoid cells: correlation between
p38 MAPK activation and site-specific phosphorylation of the human glucocorticoid
receptor at serine 211. Molecular endocrinology (Baltimore, Md.), 19(6), 1569–83.
Missale, C., Nash, S. R., Robinson, S. W., Jaber, M. & Caron, M. G. (1998). Dopamine
receptors: from structure to function. Physiological reviews, 78(1), 189–225.
Möller, J. C., Krüttgen, A., Burmester, R., Weis, J., Oertel, W. H. & Shooter, E. M. (2006).
Release of interleukin-6 via the regulated secretory pathway in PC12 cells.
Neuroscience letters, 400, 75–9.
Morita, K., Bell, R. A., Siddall, B. J. & Wong, D. L. (1996). Neural stimulation of Egr-1
messenger RNA expression in rat adrenal gland: possible relation to
phenylethanolamine N-methyltransferase gene regulation. The Journal of
pharmacology and experimental therapeutics, 279(1), 379–85.
Morita, K., Miyasako, T., Kitayama, S. & Dohi, T. (2004). Interleukin-1 inhibits voltage-
dependent P/Q-type Ca2+ channel associated with the inhibition of the rise of
intracellular free Ca2+ concentration and catecholamine release in adrenal chromaffin
cells. Biochimica et biophysica acta, 1673(3), 160–9.
Morita, K. & Wong, D. L. (1996). Role of Egr-1 in cholinergic stimulation of
phenylethanolamine N-methyltransferase promoter. Journal of neurochemistry, 67(4),
121
1344–51.
Moy, L. Y. & Tsai, L. H. (2004). Cyclin-dependent kinase 5 phosphorylates serine 31 of
tyrosine hydroxylase and regulates its stability. Journal of biological chemistry,
279(52), 54487–93.
Myers, M. G. (2007, May 15). Kaplan’s Clinical Hypertension, 9th edn (2005). The
Canadian Journal of Cardiology. Pulsus Group.
Nagatsu, T., Kato, T., Numata, Y., Ikuta, K. & Sano, M. (1977). Norepinephrine-
synthesizing enzymes in brain, adrenals and peripheral sympathetic nerves of
spontaneously hypertensive rats. Japanese journal of pharmacology, 27(4), 531–5.
Nagatsu, T., Levitt, M. & Udenfriend, S. (1964). Tyrosine hydroxylase. The initial step in
norepinephrine biosynthesis. The Journal of biological chemistry, 239, 2910–7.
Nguyen, P., Peltsch, H., Wit, J. de, Crispo, J., Ubriaco, G., Eibl, J. & Tai, T. C. (2009).
Regulation of the phenylethanolamine N-methyltransferase gene in the adrenal gland
of the spontaneous hypertensive rat. Neuroscience letters, 461(3), 280–4.
Nicolaides, N. C., Galata, Z., Kino, T., Chrousos, G. P. & Charmandari, E. (2010). The
human glucocorticoid receptor: molecular basis of biologic function. Steroids, 75(1),
1–12.
Nobel, C. S. & Schultzberg, M. (1995). Induction of interleukin-1 beta mRNA and
enkephalin mRNA in the rat adrenal gland by lipopolysaccharides studied by in situ
hybridization histochemistry. Neuroimmunomodulation, 2(2), 61–73.
O’Shaughnessy, K. M. (2001). The genetics of essential hypertension. British journal of
clinical pharmacology, 51(1), 5–11.
Onda, K., Nagashima, M., Kawakubo, Y., Inoue, S., Hirano, T. & Oka, K. (2006). Mitogen-
activated protein kinase kinase 1/extracellular signal-regulated kinase (MEK-1/ERK)
inhibitors sensitize reduced glucocorticoid response mediated by TNFalpha in human
epidermal keratinocytes (HaCaT). Biochemical and biophysical research
communications, 351(1), 266–72.
Pace, T. W. W. & Miller, A. H. (2009). Cytokines and glucocorticoid receptor signaling.
Relevance to major depression. Annals of the New York Academy of Sciences,
1179(1179), 86–105.
Padmanabhan, S., Caulfield, M. & Dominiczak, A. F. (2015). Genetic and molecular
aspects of hypertension. Circulation research, 116(6), 937–59.
Papanikolaou, N. A. & Sabban, E. L. (2000). Ability of Egr1 to activate tyrosine
hydroxylase transcription in PC12 cells. Cross-talk with AP-1 factors. The journal of
122
biological chemistry, 275(35), 26683–9.
Päth, G., Bornstein, S. R., Ehrhart-bornstein, M. & Scherbaum, W. A. (1997). Interleukin-
6 and the interleukin-6 receptor in the human adrenal gland: expression and effects on
steroidogenesis. Journal of Clinical Endocrinology & Metabolism, 82(7), 2343–9.
Peeters, C., Netea, M. G., Janssen, M. C., Kullberg, B. J., Meer, J. W. Van der & Thien, T.
(2001). Pro-inflammatory cytokines in patients with essential hypertension. European
journal of clinical investigation, 31(1), 31–6.
Pende, A., Musso, N. R., Vergassola, C., Puppo, F., Ioverno, A., Criscuolo, D., Indiveri F.,
Lotti, G. (1990). Neuroendocrine effects of interferon alpha 2-a in healthy human
subjects. Journal of biological regulators and homeostatic agents, 4(2), 67–72.
Peters, V. A., Joesting, J. J. & Freund, G. G. (2013). IL-1 receptor 2 (IL-1R2) and its role
in immune regulation. Brain, behavior, and immunity, 32, 1–8.
Pfaffl, M. W. (2001). A new mathematical model for relative quantification in real-time
RT-PCR. Nucleic acids research, 29(9), e45.
Pilipović, I., Radojević, K., Perišić, M. & Leposavić, G. (2012). Glucocorticoid-
catecholamine interplay within the composite thymopoietic regulatory network.
Annals of the New York Academy of Sciences, 1261(1261), 34–41.
Purcell, E. S. & Gattone, V. H. (1992). Immune system of the spontaneously hypertensive
rat. I. Sympathetic innervation. Experimental neurology, 117(1), 44–50.
Quan, W., Ramirez, M., Taylor, C., Quan, F., Vinogradov, M. & Walker, P. (2005).
Administration of high-dose continuous infusion interleukin-2 to patients age 70 or
over. Cancer biotherapy & radiopharmaceuticals, 20(1), 11–5.
Raison, C. L., Capuron, L. & Miller, A. H. (2006). Cytokines sing the blues: inflammation
and the pathogenesis of depression. Trends in immunology, 27(1), 24–31.
Rani, C. S. S., Elango, N., Wang, S. S., Kobayashi, K. & Strong, R. (2009). Identification
of an activator protein-1-like sequence as the glucocorticoid response element in the
rat tyrosine hydroxylase gene. Molecular pharmacology, 75(3), 589–98.
Ray, a & Prefontaine, K. E. (1994). Physical association and functional antagonism
between the p65 subunit of transcription factor NF-kappa B and the glucocorticoid
receptor. Proceedings of the National Academy of Sciences of the United States of
America, 91(2), 752–6.
Reja, V., Goodchild, a. K. & Pilowsky, P. M. (2002). Catecholamine-related gene
expression correlates with blood pressures in SHR. Hypertension, 40(3), 342–7.
123
Rimoldi, S. F., Scherrer, U. & Messerli, F. H. (2014). Secondary arterial hypertension:
When, who, and how to screen? European heart journal, 35, 1245–54.
Rivier, C., Vale, W. & Brown, M. (1989). In the rat, interleukin-1 alpha and -beta stimulate
adrenocorticotropin and catecholamine release. Endocrinology, 125(6), 3096–102.
Rogatsky, I., Logan, S. K. & Garabedian, M. J. (1998). Antagonism of glucocorticoid
receptor transcriptional activation by the c-Jun N-terminal kinase. Proceedings of the
National Academy of Sciences of the United States of America, 95(5), 2050–5.
Rogatsky, I., Luecke, H. F., Leitman, D. C. & Yamamoto, K. R. (2002). Alternate surfaces
of transcriptional coregulator GRIP1 function in different glucocorticoid receptor
activation and repression contexts. Proceedings of the National Academy of Sciences
of the United States of America, 99(26), 16701–6.
Rosamond, W., Flegal, K., Furie, K., Go, A., Greenlund, K., Haase, N., … Hong, Y. (2008).
Heart disease and stroke statistics - 2008 update: a report from the American Heart
Association Statistics Committee and Stroke Statistics Subcommittee. Circulation,
117(4), e25–146.
Rosmaninho-Salgado, J., Alvaro, A. R., Grouzmann, E., Duarte, E. P. & Cavadas, C.
(2007). Neuropeptide Y regulates catecholamine release evoked by interleukin-1beta
in mouse chromaffin cells. Peptides, 28(2), 310–4.
Rosmaninho-Salgado, J., Araújo, I. M., Alvaro, A. R., Mendes, A. F., Ferreira, L.,
Grouzmann, E., … Cavadas, C. (2009). Regulation of catecholamine release and
tyrosine hydroxylase in human adrenal chromaffin cells by interleukin-1beta: role of
neuropeptide Y and nitric oxide. Journal of neurochemistry, 109(3), 911–22.
Ross, M. E., Evinger, M. J., Hyman, S. E., Carroll, J. M., Mucke, L., Comb, M., …
Goodman, H. M. (1990). Identification of a functional glucocorticoid response
element in the phenylethanolamine N-methyltransferase promoter using fusion genes
introduced into chromaffin cells in primary culture. The Journal of neuroscience : the
official journal of the Society for Neuroscience, 10(2), 520–30.
Sabban, E. L. & Nankova, B. B. (1998). Multiple pathways in regulation of dopamine beta-
hydroxylase. Advances in pharmacology, 42, 53–6.
Saito, M., Akiyoshi, M. & Shimizu, Y. Possible role of the sympathetic nervous system in
responses to interleukin-1. Brain research bulletin, 27(3-4), 305–8.
Saks, S. & Rosenblum, M. (1992). Recombinant human TNF-alpha: preclinical studies and
results from early clinical trials. Immunology series, 56, 567–87.
Sallmann, S., Jüttler, E., Prinz, S., Petersen, N., Knopf, U., Weiser, T. & Schwaninger, M.
124
(2000). Induction of interleukin-6 by depolarization of neurons. The journal of
neuroscience : the official journal of the Society for Neuroscience, 20(23), 8637–42.
Samal, B., Ait-Ali, D., Bunn, S. J., Mustafa, T. & Eiden, L. E. (2013). Discrete signal
transduction pathway utilization by a neuropeptide (PACAP) and a cytokine (TNF-
alpha) first messenger in chromaffin cells, inferred from coupled transcriptome-
promoter analysis of regulated gene cohorts. Peptides, 45, 48–60.
Samlowski, W. E., Petersen, R., Cuzzocrea, S., Macarthur, H., Burton, D., McGregor, J. R.
& Salvemini, D. (2003). A nonpeptidyl mimic of superoxide dismutase, M40403,
inhibits dose-limiting hypotension associated with interleukin-2 and increases its
antitumor effects. Nature medicine, 9(6), 750–5.
Samuelsson, A. M., Alexanderson, C., Mölne, J., Haraldsson, B., Hansell, P. & Holmäng,
A. (2006). Prenatal exposure to interleukin-6 results in hypertension and alterations in
the renin-angiotensin system of the rat. The journal of physiology, 575(3), 855–67.
Satoh, T., Nakamura, S., Taga, T., Matsuda, T., Hirano, T., Kishimoto, T. & Kaziro, Y.
(1988). Induction of neuronal differentiation in PC12 cells by B-cell stimulatory factor
2/interleukin 6. Molecular and cellular biology, 8(8), 3546–9.
Saxena, M., Williams, S., Taskén, K. & Mustelin, T. (1999). Crosstalk between cAMP-
dependent kinase and MAP kinase through a protein tyrosine phosphatase. Nature cell
biology, 1(5), 305–11.
Schillaci, G., Maggi, P., Madeddu, G., Pucci, G., Mazzotta, E., Penco, G., Orofino, G.,
Menzaghi, B., Rusconi, S., Carenzi, L., Celesia, B. M., Martinelli, C., Bonfanti, P., De
Socio, G. V. De. (2013). Symmetric ambulatory arterial stiffness index and 24-h pulse
pressure in HIV infection: results of a nationwide cross-sectional study. Journal of
hypertension, 31(3), 560–7.
Schlaich, M. P., Lambert, E., Kaye, D. M., Krozowski, Z., Campbell, D. J., Lambert, G.,
Hastings, J., Aggarwal, A., Esler, M. D. (2004). Sympathetic augmentation in
hypertension: role of nerve firing, norepinephrine reuptake, and Angiotensin
neuromodulation. Hypertension, 43(2), 169–75.
Schober, A., Huber, K., Fey, J. & Unsicker, K. (1998). Distinct populations of macrophages
in the adult rat adrenal gland: a subpopulation with neurotrophin-4-like
immunoreactivity. Cell and tissue research, 291(3), 365–73.
Schrader, L. I., Kinzenbaw, D. A., Johnson, A. W., Faraci, F. M. & Didion, S. P. (2007).
IL-6 deficiency protects against angiotensin II induced endothelial dysfunction and
hypertrophy. Arteriosclerosis, thrombosis, and vascular biology, 27(12), 2576–81.
Schüle, R., Rangarajan, P., Kliewer, S., Ransone, L. J., Bolado, J., Yang, N., … Evans, R.

125
M. (1990). Functional antagonism between oncoprotein c-Jun and the glucocorticoid
receptor. Cell, 62(6), 1217–26.
Schultzberg, M., Andersson, C., Undén, A., Troye-Blomberg, M., Svenson, S. B. & Bartfai,
T. (1989). Interleukin-1 in adrenal chromaffin cells. Neuroscience, 30(3), 805–10.
Schultzberg, M., Tingsborg, S., Nobel, S., Lundkvist, J., Svenson, S., Simoncsits, A. &
Bartfai, T. (1995). Interleukin-1 receptor antagonist protein and mRNA in the rat
adrenal gland. Journal of interferon & cytokine research : the official journal of the
International Society for Interferon and Cytokine Research, 15(8), 721–9.
Segura-Chama, P., López-Bistrain, P., Pérez-Armendáriz, E. M., Jiménez-Pérez, N.,
Millán-Aldaco, D. & Hernández-Cruz, A. (2015). Enhanced Ca(2+)-induced Ca (2+)
release from intracellular stores contributes to catecholamine hypersecretion in
adrenal chromaffin cells from spontaneously hypertensive rats. Pflugers Archiv :
European journal of physiology, 467(11), 2307–23.
Sengupta, T. K., Schmitt, E. M. & Ivashkiv, L. B. (1996). Inhibition of cytokines and JAK-
STAT activation by distinct signaling pathways. Proceedings of the National Academy
of Sciences of the United States of America, 93(18), 9499–9504.
Seo, H., Yang, C., Kim, H. S. & Kim, K. S. (1996). Multiple protein factors interact with
the cis-regulatory elements of the proximal promoter in a cell-specific manner and
regulate transcription of the dopamine beta-hydroxylase gene. The Journal of
neuroscience : the official journal of the Society for Neuroscience, 16(13), 4102–12.
Serrano, C. V, Setani, K. T., Sakamoto, E., Andrei, A. M. & Fraguas, R. (2011).
Association between depression and development of coronary artery disease:
pathophysiologic and diagnostic implications. Vascular health and risk management,
7, 159–64.
Sesso, H. D., Buring, J. E., Rifai, N., Blake, G. J., Gaziano, J. M. & Ridker, P. M. (2003).
C-reactive protein and the risk of developing hypertension. JAMA : the journal of the
American Medical Association, 290(22), 2945–51. doi:10.1001/jama.290.22.2945
Sharara-Chami, R. I., Joachim, M., Pacak, K. & Majzoub, J. A. (2010). Glucocorticoid
treatment--effect on adrenal medullary catecholamine production. Shock (Augusta,
Ga.), 33(2), 213–7.
Shaskus, J., Zellmer, E. & Lewis, E. J. (1995). A negative regulatory element in the rat
dopamine beta-hydroxylase gene contributes to the cell type specificity of expression.
Journal of neurochemistry, 64(1), 52–60.
Sheppard, K. A., Phelps, K. M., Williams, A. J., Thanos, D., Glass, C. K., Rosenfeld, M.
G., Gerritsen, M. E., Collins, T. (1998). Nuclear integration of glucocorticoid receptor
126
and nuclear factor-kappaB signaling by CREB-binding protein and steroid receptor
coactivator-1. The journal of biological chemistry, 273(45), 29291–4.
Shi, P., Diez-Freire, C., Jun, J. Y., Qi, Y., Katovich, M. J., Li, Q., Sriramula, S., Francis,
J., Sumners, C., Raizada, M. K. (2010). Brain microglial cytokines in neurogenic
hypertension. Hypertension, 56(2), 297–303.
Shi, X. & Habecker, B. A. (2012). gp130 cytokines stimulate proteasomal degradation of
tyrosine hydroxylase via extracellular signal regulated kinases 1 and 2. Journal of
neurochemistry, 120(2), 239–47.
Shu, H. F., Wang, B. R., Bi, H., Pei, J. M., Wang, X., Fan, J. & Ju, G. (2007). PC12 cells
express IL-1 receptor type I and response to IL-1beta stimulation. Respiratory
physiology & neurobiology, 157(2-3), 187–95.
Sim, Y. B., Park, S. H., Kang, Y. J., Jung, J. S., Ryu, O. H., Choi, M. G. & Suh, H. W.
(2012). Interleukin-1β (IL-1β) increases pain behavior and the blood glucose level:
possible involvement of sympathetic nervous system. Pharmacology, biochemistry,
and behavior, 102(1), 170–6.
Sirivelu, M. P., MohanKumar, P. S. & MohanKumar, S. M. J. (2012). Differential effects
of systemic interleukin-1β on gene expression in brainstem noradrenergic nuclei. Life
sciences, 90(1-2), 77–81.
Smith, S. M. & Vale, W. W. (2006). The role of the hypothalamic-pituitary-adrenal axis in
neuroendocrine responses to stress. Dialogues in clinical neuroscience, 8(4), 383–
395.
Smith, U., Smith, D. S., Winkler, H. & Ryan, J. W. (1973). Exocytosis in the adrenal
medulla demonstrated by freeze-etching. Science, 179(4068), 79–82.
Smoak, K. A. & Cidlowski, J. A. (2004). Mechanisms of glucocorticoid receptor signaling
during inflammation. Mechanisms of ageing and development, 125(10-11), 697–706.
Soeda, S., Ochiai, T., Paopong, L., Tanaka, H., Shoyama, Y. & Shimeno, H. (2001). Crocin
suppresses tumor necrosis factor-alpha-induced cell death of neuronally differentiated
PC-12 cells. Life sciences, 69(24), 2887–98.
Sparacio, S. M., Zhang, Y., Vilcek, J. & Benveniste, E. N. (1992). Cytokine regulation of
interleukin-6 gene expression in astrocytes involves activation of an NF-kappa B-like
nuclear protein. Journal of neuroimmunology, 39(3), 231–42.
Stachowiak, M. K., Goc, A., Hong, J. S., Kaplan, B. B. & Stachowiak, E. K. (1990). Neural
and hormonal regulation of the tyrosine hydroxylase gene in adrenal medullary cells:
Participation of c-fos and AP1 factors. Molecular and cellular neurosciences, 1(3),
127
202–13.
Stachowiak, M. K., Hong, J. S. & Viveros, O. H. (1990). Coordinate and differential
regulation of phenylethanolamine N-methyltransferase, tyrosine hydroxylase and
proenkephalin mRNAs by neural and hormonal mechanisms in cultured bovine
adrenal medullary cells. Brain research, 510(2), 277–88.
Steensberg, A., Fischer, C. P., Keller, C., Møller, K. & Pedersen, B. K. (2003). IL-6
enhances plasma IL-1ra, IL-10, and cortisol in humans. American journal of
physiology. Endocrinology and metabolism, 285(2), E433–7.
Sterin-Borda, L., Perez Leiros, C., Borda, E. S. & Bracco, M. M. de. (1996). Effects of IL-
2 on the myocardium. Participation of the sympathetic system. Journal of molecular
and cellular cardiology, 28(12), 2457–65.
Stouthard, J. M., Romijn, J. A., Poll, T. Van der, Endert, E., Klein, S., Bakker, P. J., …
Sauerwein, H. P. (1995). Endocrinologic and metabolic effects of interleukin-6 in
humans. The American journal of physiology, 268(5), 813–9.
Stroth, N. & Eiden, L. E. (2010). Stress hormone synthesis in mouse hypothalamus and
adrenal gland triggered by restraint is dependent on pituitary adenylate cyclase-
activating polypeptide signaling. Neuroscience, 165(4), 1025–30.
Stumpf, C., Auer, C., Yilmaz, A., Lewczuk, P., Klinghammer, L., Schneider, M., Daniel,
W. G., Schmieder, R. E., Garlichs, C. D. (2011). Serum levels of the Th1
chemoattractant interferon-gamma-inducible protein (IP) 10 are elevated in patients
with essential hypertension. Hypertension research : official journal of the Japanese
Society of Hypertension, 34(4), 484–8.
Stumpf, C., John, S., Jukic, J., Yilmaz, A., Raaz, D., Schmieder, R. E., Daniel W. G.,
Garlichs, C. D. (2005). Enhanced levels of platelet P-selectin and circulating cytokines
in young patients with mild arterial hypertension. Journal of hypertension, 23(5), 995–
1000.
Sturgis, L. C., Cannon, J. G., Schreihofer, D. A. & Brands, M. W. (2009). The role of
aldosterone in mediating the dependence of angiotensin hypertension on IL-6.
American journal of physiology. Regulatory, integrative and comparative physiology,
297(6), 1742–8.
Sutherland, C., Alterio, J., Campbell, D. G., Bourdellès, B. Le, Mallet, J., Haavik, J. &
Cohen, P. (1993). Phosphorylation and activation of human tyrosine hydroxylase in
vitro by mitogen-activated protein (MAP) kinase and MAP-kinase-activated kinases
1 and 2. European journal of biochemistry, 217(2), 715–22.
Suzuki, K., Furui, H., Kaneko, M., Takagi, K. & Satake, T. (1990). Priming effect of
128
recombinant human interleukin-2 and recombinant human interferon-gamma on
human neutrophil superoxide production. Arzneimittel-Forschung, 40(10), 1176–9.
Swanson, D. J., Zellmer, E. & Lewis, E. J. (1998). AP1 Proteins mediate the cAMP
response of the dopamine beta-hydroxylase gene. Journal of Biological Chemistry,
273(37), 24065–74.
Szatmáry, Z., Garabedian, M. J. & Vilcek, J. (2004). Inhibition of glucocorticoid receptor-
mediated transcriptional activation by p38 mitogen-activated protein (MAP) kinase.
The Journal of biological chemistry, 279(42), 43708–15.
Tachikawa, E., Kondo, Y., Takahashi, M., Kashimoto, T., Yanagihara, N., Toyohira, Y. &
Izumi, F. (1997). Interferon-alpha reduces catecholamine secretion from bovine
adrenal chromaffin cells stimulated by acetylcholine. Naunyn-Schmiedeberg’s
archives of pharmacology, 356(6), 699–705.
Tai, T. C., Claycomb, R., Her, S., Bloom, A. K. & Wong, D. L. (2002). Glucocorticoid
responsiveness of the rat phenylethanolamine N-methyltransferase gene. Molecular
pharmacology, 61(6), 1385–92.
Tai, T. C., Morita, K. & Wong, D. L. (2001). Role of Egr-1 in cAMP-dependent protein
kinase regulation of the phenylethanolamine N-methyltransferase gene. Journal of
neurochemistry, 76(6), 1851–9.
Tai, T. C. & Wong, D. L. (2003). Protein kinase A and protein kinase C signaling pathway
interaction in phenylethanolamine N-methyltransferase gene regulation. Journal of
neurochemistry, 85(3), 816–29.
Tai, T. C., Wong-Faull, D. C., Claycomb, R., Aborn, J. L. & Wong, D. L. (2010). PACAP-
regulated phenylethanolamine N-methyltransferase gene expression. Journal of
neurochemistry, 115(5), 1195–205.
Takahashi, E., Onda, K., Hirano, T., Oka, K., Maruoka, N., Tsuyuguchi, M., Matsumura,
Y., Niitsuma, T., Hayashi, T. (2002). Expression of c-fos, rather than c-jun or
glucocorticoid-receptor mRNA, correlates with decreased glucocorticoid response of
peripheral blood mononuclear cells in asthma. International immunopharmacology,
2(10), 1419–27.
Tamura, R., Nemoto, T., Maruta, T., Onizuka, S., Yanagita, T., Wada, A., Murakami
M.,Tsuneyoshi, I. (2014). Up-regulation of NaV1.7 sodium channels expression by
tumor necrosis factor-α in cultured bovine adrenal chromaffin cells and rat dorsal root
ganglion neurons. Anesthesia and analgesia, 118(2), 318–24.
Taskén, K. & Aandahl, E. M. (2004). Localized effects of cAMP mediated by distinct
routes of protein kinase A. Physiological reviews, 84(1), 137–67.
129
Tekin, I., Roskoski, R., Carkaci-Salli, N. & Vrana, K. E. (2014). Complex molecular
regulation of tyrosine hydroxylase. Journal of neural transmission, 121(12), 1451–81.
Terao, A., Oikawa, M. & Saito, M. (1994). Tissue-specific increase in norepinephrine
turnover by central interleukin-1, but not by interleukin-6, in rats. The American
journal of physiology, 266(2), 400–4.
Thoenen, H. (1972). Comparison between the effect of neuronal activity and nerve growth
factor on the enzymes involved in the synthesis of norepinephrine. Pharmacological
reviews, 24(2), 255–67.
Tinsley, J. H., South, S., Chiasson, V. L. & Mitchell, B. M. (2010). Interleukin-10 reduces
inflammation, endothelial dysfunction, and blood pressure in hypertensive pregnant
rats. American journal of physiology. Regulatory, integrative and comparative
physiology, 298(3), R713–9.
Tischler, A. S., Perlman, R. L., Morse, G. M. & Sheard, B. E. (1983). Glucocorticoids
increase catecholamine synthesis and storage in PC12 pheochromocytoma cell
cultures. Journal of neurochemistry, 40(2), 364–70.
Tong, A. li, Zeng, Z. P., Yang, D., Li, H. Z., Li, M., Chen, S. & Sun, M. li. (2004).
[Expression of transforming growth factor alpha, tumor necrosis factor alpha, and
vascular endothelial growth factor of human pheochromocytoma tissues]. Zhongguo
yi xue ke xue yuan xue bao. Acta Academiae Medicinae Sinicae, 26(4), 426–31.
Tönshoff, C., Hemmick, L. & Evinger, M. J. (1997). Pituitary adenylate cyclase activating
polypeptide (PACAP) regulates expression of catecholamine biosynthetic enzyme
genes in bovine adrenal chromaffin cells. Journal of molecular neuroscience : MN,
9(2), 127–40.
Torpy, D. J., Papanicolaou, D. A., Lotsikas, A. J., Wilder, R. L., Chrousos, G. P. &
Pillemer, S. R. (2000). Responses of the sympathetic nervous system and the
hypothalamic-pituitary-adrenal axis to interleukin-6: a pilot study in fibromyalgia.
Arthritis and rheumatism, 43(4), 872–80.
Toyohira, Y., Yanagihara, N., Minami, K., Ueno, S., Uezono, Y., Tachikawa, E., Kondo,
Y., Kashimoto, T., Izumi, F. (1998). Down-regulation of the noradrenaline transporter
by interferon-alpha in cultured bovine adrenal medullary cells. Journal of
neurochemistry, 70(4), 1441–7.
Tran, L. T., MacLeod, K. M. & McNeill, J. H. (2009). Chronic etanercept treatment
prevents the development of hypertension in fructose-fed rats. Molecular and cellular
biochemistry, 330(1-2), 219–28.
Trincavelli, M. L., Falleni, A., Chelli, B., Tuscano, D., Costa, B., Gremigni, V., Lucacchini,
130
, A., Martini, C. (2003). A(2A) adenosine receptor ligands and proinflammatory
cytokines induce PC 12 cell death through apoptosis. Biochemical pharmacology,
66(10), 1953–62.
Trocmé, C., Sarkis, C., Hermel, J. M., Duchateau, R., Harrison, S., Simonneau, M., Al-
Shawi, R., Mallet, J. (1998). CRE and TRE sequences of the rat tyrosine hydroxylase
promoter are required for TH basal expression in adult mice but not in the embryo.
The European journal of neuroscience, 10(2), 508–21.
Turnbull, a V & Rivier, C. L. (1999). Regulation of the hypothalamic-pituitary-adrenal
axis by cytokines: actions and mechanisms of action. Physiological reviews, 79(1), 1–
71.
Ulrich-Lai, Y. M. & Herman, J. P. (2009). Neural regulation of endocrine and autonomic
stress responses. Nature reviews. Neuroscience, 10(6), 397–409.
Unsworth, B. R., Hayman, G. T., Carroll, A. & Lelkes, P. I. (1999). Tissue-specific
alternative mRNA splicing of phenylethanolamine N-methyltransferase (PNMT)
during development by intron retention. International journal of developmental
neuroscience : the official journal of the International Society for Developmental
Neuroscience, 17(1), 45–55.
Vaudry, D., Falluel-Morel, A., Bourgault, S., Basille, M., Burel, D., Wurtz, O., Fournier,
A., Chow, B. K. C., Hashimoto, H., Galas, L., Vaudry, H. (2009). Pituitary adenylate
cyclase-activating polypeptide and its receptors: 20 years after the discovery.
Pharmacological reviews, 61(3), 283–357.
Venegas-Pont, M., Manigrasso, M. B., Grifoni, S. C., LaMarca, B. B., Maric, C., Racusen,
L. C., … Ryan, M. J. (2010). Tumor necrosis factor-alpha antagonist etanercept
decreases blood pressure and protects the kidney in a mouse model of systemic lupus
erythematosus. Hypertension, 56(4), 643–9.
Venihaki, M., Gravanis, a & Margioris, a N. (1997). Comparative study between normal
rat chromaffin and PC12 rat pheochromocytoma cells: production and effects of
corticotropin-releasing hormone. Endocrinology, 138(2), 698–704.
Venihaki, M., Gravanis, A. & Margioris, A. N. (1998). KAT45 human pheochromocytoma
cell line. A new model for the in vitro study of neuro-immuno-hormonal interactions.
Annals of the New York Academy of Sciences, 840, 425–33.
Viel, E. C., Lemarié, C. a, Benkirane, K., Paradis, P. & Schiffrin, E. L. (2010). Immune
regulation and vascular inflammation in genetic hypertension. American journal of
physiology. Heart and circulatory physiology, 298(3), 938–44.
Virmani, A., Koverech, A., Ali, S. F. & Binienda, Z. K. (2011). Acetyl-L-Carnitine
131
Modulates TP53 and IL10 Gene Expression Induced by 3-NPA Evoked Toxicity in
PC12 Cells. Current neuropharmacology, 9(1), 195–9.
Vo, N. & Goodman, R. H. (2001). CREB-binding protein and p300 in transcriptional
regulation. The journal of biological chemistry, 276(17), 13505–8.
Vriend, C. Y., Zuo, L., Dyck, D. G., Nance, D. M. & Greenberg, A. H. (1993). Central
administration of interleukin-1 beta increases norepinephrine turnover in the spleen.
Brain research bulletin, 31(1-2), 39–42.
Waal Malefyt, R. de, Figdor, C. G., Huijbens, R., Mohan-Peterson, S., Bennett, B.,
Culpepper, J., Dang, W., Zurawski, G., Vries, J. E. de. (1993). Effects of IL-13 on
phenotype, cytokine production, and cytotoxic function of human monocytes.
Comparison with IL-4 and modulation by IFN-gamma or IL-10. Journal of
immunology, 151(11), 6370–81.
Wakade, A. R. (1988). Noncholinergic transmitter(s) maintains secretion of catecholamines
from rat adrenal medulla for several hours of continuous stimulation of splanchnic
neurons. Journal of neurochemistry, 50(4), 1302–8.
Wang, P., Wu, P., Siegel, M. I., Egan, R. W. & Billah, M. M. (1995). Interleukin (IL)-10
inhibits nuclear factor kappa B (NF kappa B) activation in human monocytes. IL-10
and IL-4 suppress cytokine synthesis by different mechanisms. The journal of
biological chemistry, 270(16), 9558–63.
Wang, X., Wu, H. & Miller, A. H. (2004). Interleukin 1alpha (IL-1alpha) induced activation
of p38 mitogen-activated protein kinase inhibits glucocorticoid receptor function.
Molecular psychiatry, 9(1), 65–75.
Wanidworanun, C. & Strober, W. (1993). Predominant role of tumor necrosis factor-alpha
in human monocyte IL-10 synthesis. Journal of immunology, 151(12), 6853–61.
Weidenfeld, J., Abramsky, O. & Ovadia, H. (1989). Evidence for the involvement of the
central adrenergic system in interleukin 1-induced adrenocortical response.
Neuropharmacology, 28(12), 1411–4.
Weinshilboum, R. & Axelrod, J. (1971). Serum dopamine-beta-hydroxylase activity.
Circulation Research, 28(3), 307–15.
Wilkins, K., Campbell, N., Joffres, M., McAlister, F., Nichol, M., Quach, S., Johansen H.
L., Tremblay, M. (2010). Blood pressure in Canadian adults. Statistics Canada:
Health Reports, 21(1), 37–46.
Willenberg, H. S., Päth, G., Vögeli, T. a, Scherbaum, W. A. & Bornstein, S. R. (2002).
Role of interleukin-6 in stress response in normal and tumorous adrenal cells and
132
during chronic inflammation. Annals of the New York Academy of Sciences, 966, 304–
14.
Williams, L., Bradley, L., Smith, A. & Foxwell, B. (2004). Signal transducer and activator
of transcription 3 is the dominant mediator of the anti-inflammatory effects of IL-10
in human macrophages. Journal of immunology, 172(1), 567–76.
Wilson, B. C., Fulop, K. & Summerlee, A. J. (1996). Changing effect of i.c.v. IL-1 beta on
vasopressin release in anaesthetized, female rats at different stages of lactation: role
of prostaglandins and noradrenaline. Journal of neuroendocrinology, 8(12), 915–20.
Wojciak, J. M., Martinez-Yamout, M. A., Dyson, H. J. & Wright, P. E. (2009). Structural
basis for recruitment of CBP/p300 coactivators by STAT1 and STAT2 transactivation
domains. The EMBO journal, 28(7), 948–58.
Wong, D. L. (2006). Epinephrine biosynthesis: hormonal and neural control during stress.
Cellular and molecular neurobiology, 26(4-6), 891–900. doi:10.1007/s10571-006-
9056-6
Wong, D. L., Anderson, L. J. & Tai, T. (2002). Cholinergic and peptidergic regulation of
phenylethanolamine N-methyltransferase gene expression. Annals of the New York
Academy of Sciences, (971), 19–26.
Wong, D. L., Hayashi, R. J. & Ciaranello, R. D. (1985). Regulation of biogenic amine
methyltransferases by glucocorticoids via S-adenosylmethionine and its metabolizing
enzymes, methionine adenosyltransferase and S-adenosylhomocysteine hydrolase.
Brain research, 330(2), 209–16.
Wong, D. L., Lesage, A., Siddall, B. & Funder, J. W. (1992). Glucocorticoid regulation of
phenylethanolamine N-methyltransferase in vivo. FASEB journal : official
publication of the Federation of American Societies for Experimental Biology, 6(14),
3310–5.
Wong, D. L., Siddall, B. J., Ebert, S. N., Bell, R. A. & Her, S. (1998). Phenylethanolamine
N-methyltransferase gene expression: synergistic activation by Egr-1, AP-2 and the
glucocorticoid receptor. Molecular brain research, 61(1-2), 154–61.
Wong, D. L. & Tank, A. W. (2007). Stress-induced catecholaminergic function:
transcriptional and post-transcriptional control. Stress, 10(2), 121–30.
Wong, D. L., Zager, E. L. & Ciaranello, R. D. (1982). Effects of hypophysectomy and
dexamethasone administration on central and peripheral S-adenosylmethionine levels.
The Journal of neuroscience : the official journal of the Society for Neuroscience, 2(6),
758–64.
133
World Health Organization. (2009). Global health risks: mortality and burden of disease
attributable to selected major risks. World Health Organization.
Wurtman, R. J. (1966). Control of epinephrine synthesis in the adrenal medulla by the
adrenal cortex: hormonal specificity and dose-response characteristics.
Endocrinology, 79(3), 608–14.
Wurtman, R. J. (2002). Stress and the adrenocortical control of epinephrine synthesis.
Metabolism: clinical and experimental, 51(6 Suppl 1), 11–4.
Wurtman, R. J. & Axelrod, J. (1965). Adrenaline synthesis: control by the pituitary gland
and adrenal glucocorticoids. Science, 150(3702), 1464–5.
Wurtman, R. J. & Axelrod, J. (1966). Control of enzymatic synthesis of adrenaline in the
adrenal medulla by adrenal cortical steroids. Journal of Biological Chemistry, 241,
2301–2305.
Xie, J., Wang, Y., Kolls, J., Malinski, T., Nelson, S., Summer, W. & Greenberg, S. S.
(1993). Tumor necrosis factor alpha inhibits contractions to sympathetic nerve
stimulation by a nitric oxide-dependent mechanism. Proceedings of the Society for
Experimental Biology and Medicine. Society for Experimental Biology and Medicine,
203(4), 446–53.
Yanagihara, N., Minami, K., Shirakawa, F., Uezono, Y., Kobayashi, H., Eto, S. & Izumi,
F. (1994). Stimulatory effect of IL-1 beta on catecholamine secretion from cultured
bovine adrenal medullary cells. Biochemical and biophysical research
communications, 198(1), 81–7.
Yang, C., Kim, H. S., Seo, H. & Kim, K. S. (1998). Identification and characterization of
potential cis-regulatory elements governing transcriptional activation of the rat
tyrosine hydroxylase gene. Journal of neurochemistry, 71(4), 1358–68.
Yang, K., Lei, G., Jackson, M. F. & Macdonald, J. F. (2010). The involvement of
PACAP/VIP system in the synaptic transmission in the hippocampus. Journal of
molecular neuroscience, 42(3), 319–26.
Yu, Y., Zhang, Z. H., Wei, S. G., Chu, Y., Weiss, R. M., Heistad, D. D. & Felder, R. B.
(2007). Central gene transfer of interleukin-10 reduces hypothalamic inflammation
and evidence of heart failure in rats after myocardial infarction. Circulation research,
101(3), 304–12.
Zeilender, S., Davis, D., Fairman, R. P. & Glauser, F. L. (1989). Inotropic and vasoactive
drug treatment of interleukin 2 induced hypotension in sheep. Cancer research,
49(16), 4423–6.
134
Zhang, J. J., Vinkemeier, U., Gu, W., Chakravarti, D., Horvath, C. M. & Darnell, J. E.
(1996). Two contact regions between Stat1 and CBP/p300 in interferon gamma
signaling. Proceedings of the National Academy of Sciences of the United States of
America, 93(26), 15092–6.
Zhang, X. J., Wang, X., Xiong, L. Z., Fan, J., Duan, X. L. & Wang, B. R. (2007). Up-
regulation of IL-1 receptor type I and tyrosine hydroxylase in the rat carotid body
following intraperitoneal injection of IL-1beta. Histochemistry and cell biology,
128(6), 533–40.
Zhang, X., Odom, D. T., Koo, S. H., Conkright, M. D., Canettieri, G., Best, J., Chen, H.,
Jenner, R., Herbolsheimer, E., Jacobsen, E., Kadam, S., Ecker, J. R., Emerson, B.,
Hogenesch, J. B., Unterman, T., Young, R. A., Montminy, M. (2005). Genome-wide
analysis of cAMP-response element binding protein occupancy, phosphorylation, and
target gene activation in human tissues. Proceedings of the National Academy of
Sciences of the United States of America, 102(12), 4459–64.
Zhang, Z., Jones, S., Hagood, J. S., Fuentes, N. L. & Fuller, G. M. (1997). STAT3 acts as
a co-activator of glucocorticoid receptor signaling. The Journal of biological
chemistry, 272(49), 30607–10.
Zhong, H., SuYang, H., Erdjument-Bromage, H., Tempst, P. & Ghosh, S. (1997). The
transcriptional activity of NF-kappaB is regulated by the IkappaB-associated PKAc
subunit through a cyclic AMP-independent mechanism. Cell, 89(3), 413–24.
Zinger, H., Sherer, Y. & Shoenfeld, Y. (2009). Atherosclerosis in autoimmune rheumatic
diseases-mechanisms and clinical findings. Clinical reviews in allergy & immunology,
37(1), 20–8.