Cystic Fibrosis Gene Therapy: Methods for the optimisation ...€¦ · Chapter 5 - Cystic Fibrosis...
111
i Cystic Fibrosis Gene Therapy: Methods for the optimisation of CFTR gene delivery. By Karlea Lee Kremer Discipline of Paediatrics School of Paediatrics and Reproductive Health Faculty of Health Sciences The University of Adelaide Submitted April 2010
Transcript of Cystic Fibrosis Gene Therapy: Methods for the optimisation ...€¦ · Chapter 5 - Cystic Fibrosis...

i
Cystic Fibrosis Gene Therapy: Methods for the
optimisation of CFTR gene delivery.
By Karlea Lee Kremer
Discipline of Paediatrics
School of Paediatrics and Reproductive Health
Faculty of Health Sciences
The University of Adelaide
Submitted April 2010

Chapter 5 - Cystic Fibrosis mouse models- Cftrtm1Unc-Tg(FABPCFTR)1Jaw/J
146
5 Cystic Fibrosis mouse models-
Cftrtm1Unc-Tg(FABPCFTR)1Jaw/J

Chapter 5 - Cystic Fibrosis mouse models- Cftrtm1Unc-Tg(FABPCFTR)1Jaw/J
147
5.1 The need for a new cystic fibrosis mouse model
New therapies for the treatment and cure of CF are currently being developed and researched. To aid
in pre-clinical development of these therapeutic interventions and to better understand
pathophysiology of the disease, several CF mouse models have been developed. In these mice the
CFTR gene has either been completely inactivated (null mice) or naturally occurring mutations such as
ΔF508 or G551D have been introduced leading to altered chloride transport across epithelial cells
[190].
Generally, while CF mice do not mimic human CF lung disease, they do have blocked and inflamed
intestines as a direct consequence of the altered ion transport. The lack of human-like lung disease in
knockout mice came as a disappointment, but may be due to the expression of alternative calcium-
activated chloride channels which act as a substitute for the absent CFTR-mediated chloride channel
function [191]. This activation of alternative ion channels occurs in the mice lung but not the human
lung. It is interesting to note that it does not occur in the mouse nasal epithelia, meaning the
characteristic CF ion transport abnormalities of increased sodium absorption and absent chloride
transport are retained in the mouse nasal epithelium [192].
It is well known that altered sodium and chloride transport in CF airway epithelial cells leads to changes
in the potential difference (PD) across the apical membrane of these cells. The baseline PD is
predominantly a measure of sodium absorption across the apical membrane and the response to the
sodium channel inhibitor amiloride is increased in CF. The response to perfusion with a low chloride
solution, which induces chloride flux via CFTR is reduced or absent. This PD measurement is used
widely as a measure the effectiveness of corrective therapy in CF mouse nasal epithelium. Ideally the
technique is used to observe treatment over time, with multiple measurements over the course of the
treatment or life of the mouse. The best mouse models to assess treatments on are those with very

Chapter 5 - Cystic Fibrosis mouse models- Cftrtm1Unc-Tg(FABPCFTR)1Jaw/J
148
low or absent residual CFTR function. The UNC-null, G551D or ΔF508 are the most widely used models
[169] [193] [194]. The severity of the intestinal disease in these mice varies depending on the strain
and genotype and is largely dependent on the level of residual CFTR activity [195]. The intestinal
problems impact severely on the lifespan of CF mice. By the age of weaning-21 days- a large proportion
of CF pups are dead- approximately 50-95% [195]. In most of these mice the intestinal morbidity and
mortality is seen at two distinct time points. Many new born CF mice die within 5 days of birth. The
second group of mice die shortly after weaning. The histology of jejunum from CFTR-knockout mice
(cftrTm1Unc) shows dilated and distended crypts with mucus, whereas these abnormal jejunum findings
are barely visible in crypts of normal mice. Further differences are seen with goblet cell hyperplasia
and hypertrophy apparent only in CF jejunum [195]. It has however, been found that manipulation of
the diet, with replacement of normal drinking water with an electrolyte solution containing 6%
polyethylene glycol before weaning can significantly increase the lifespan of the CF pups to near that of
normal mice, as intestinal complications are ameliorated [195, 196]. With this dietary modification a
large proportion of cftrtm1Unc mice remain alive up to 18 months of age, with this lifespan being similar
to that of normal mice.
In summary, CF mice suffer gut disease which causes high pre- and post-weaning mortality, runting and
reduced survival after anaesthesia [197]. In addition to these complications, breeding requires
heterozygote matings as the CFTR knockout causes infertility, particularly in females. Heterozygote
matings result in only ¼ of pups being of CF genotype. These characteristics are obviously not
favourable for producing the number of affected animals for large experiments.
To overcome the problems caused by the intestinal obstructions in CF mice, Zhou et al developed a
gut-corrected CF mouse. This was done by using the rat intestinal fatty acid-binding protein (FABp)
gene promoter to direct expression of the wild-type huCFTR complementary DNA to the intestinal
epithelial cells of the knockout mice [198].

Chapter 5 - Cystic Fibrosis mouse models- Cftrtm1Unc-Tg(FABPCFTR)1Jaw/J
149
A chimeric FABp-huCFTR gene construct was microinjected into fertilized oocytes, producing transgenic
mice from both heterozygotic CFTR +/- and wildtype FVB/N mice. The FABp-huCFTR transgene was
detected by Southern blot analysis in founder mice and their offspring. Human CFTR mRNA was readily
detected by reverse transcription PCR in the small intestine of 6 distinct FABp-huCFTR mouse lines.
Human CFTR mRNA was not detected in the lungs or nasal epithelium. Human CFTR mRNA was found
most abundant in the ileum, jejunum and duodenum and was less abundant in the cecum and colon.
Founder lines were bred to CFTR +/- heterozygotes, these heterozygotes were then bred to produce
homozygous CFTR -/- mice expressing huCFTR mRNA [198].
Mice that were FABp +/- and CFTR -/- were found to routinely survive weaning and showed prolonged
survival. No mice were found to have developed intestinal obstruction at ages ranging from 1.5 to 7.5
months. In contrast, matings of CFTR +/- mice from FVB/N and C57Bl/6 backgrounds without the FABp-
huCFTR transgene resulted in survival of less than 5% of the CFTR -/- offspring [198].
Short circuit measurements made from the intestine of CFTR -/- , bitransgenic (huCFTR +/-) / (CFTR -/-)
and wildtype mice showed Cl- secretion to be restored in bitransgenic mice. Correction of the goblet
cell hyperplasia was also shown in the ileum via histological examination [198].
The establishment of a FABp-huCFTR corrected CF colony appeared advantageous for our therapeutic
gene transfer studies. The establishment of this colony would not only be advantageous due to better
production of CF animals and simpler husbandry as there would not be a need for additives in the
drinking water, these mice would also be immune tolerant to the human CFTR. As we use the human
CFTR gene in our gene therapy vectors, using a mouse that already contains the human CFTR gene
(driven by the FABp promoter in the intestines) means the possibility of an immune response to the
human CFTR gene by the animals treated with our vector can be ruled out. A history of how the WCH
colony was developed is described further in this chapter.

Chapter 5 - Cystic Fibrosis mouse models- Cftrtm1Unc-Tg(FABPCFTR)1Jaw/J
150
5.2 An historical account of the WCH- Cftrtm1Unc-Tg(FABPCFTR)1Jaw/J mouse
colony
Initially, affected mice bred from the Cftrtm1Unc mouse colony were used for the work described in this
thesis. However, these mice showed significant morbidity and mortality following repeated anesthesia
and PD testing. In addition, breeding of affected animals in the required numbers was laborious due to
the inability to breed CFTR -/- males and females together due to the reduced fertility of female CF
mice, therefore the breeding colony requires Het +/- female, CFTR -/- male matings, resulting in only
50% of offspring being CFTR knockout mice. Accordingly, it was thought the establishment of a colony
of FABp-huCFTR CF mice (genotype) would be advantageous.
Cftrtm1Unc-Tg(FABPCFTR)1Jaw/J mice ordered from Jackson Laboratories arrived in Australia in August
2006. Five females and 7 males were received. Mice were released to Waite animal services following
2 days quarantine. While at the Waite holding facility, 5 breeding pairs were setup. From those
breeding pairs, the following offspring were recorded in Table 5-1.
Mice were released to the WCH animal facility in December 2006. As the breeding pairs were breeding
well, all pairs except for breeder box 2 were separated.
It was noticed in August 2007 that mice from the Cftrtm1Unc-Tg(FABPCFTR)1Jaw/J colony appeared to be
displaying the distinctive yellow and white incisors seen in non-CF animals our Cftrtm1Unc colony. In the
latter colony, a check of the teeth can be carried out for mice of post weaning age to determine
genotype as CF mice display chalky white incisors and heterozygote mice display distinctly yellow
incisors. This can usually only be carried out with certainty post weaning. The appearance of white and
yellow incisors was not expected in the Cftrtm1Unc-Tg(FABPCFTR)1Jaw/J colony as it was thought that all

Chapter 5 - Cystic Fibrosis mouse models- Cftrtm1Unc-Tg(FABPCFTR)1Jaw/J
151
mice ordered and received were homozygous for both the CFTR knockout (white teeth) and the FABp-
huCFTR knock-in.
Table 5-1: Original Breeding Pairs (from Waite Campus)
Box number Date of litter ♂offspring ♀offspring
1 23-11-2006 1 4
12-12-2006 8 2
4-01-2007 3 6
2 22-11-2006 3 6
12-12-2006 3 4
3 23-11-2006 4 4
17-12-2006 5 5
4 25-11-2006 5 0
5 22-11-2006 6 2
12-12-2006 7 4
By September 2007, there were no mice left in the Cftrtm1Unc-Tg(FABPCFTR)1Jaw/J colony displaying
white teeth which led to more breeding pairs being established to breed CFTR-knockout mice. Also
during this time, it was noted that there were deaths in the colony around weaning age. This drew our
attention to the FABp-huCFTR status of the mice, with the deaths likely due to intestinal problems
arising from the mice lacking the FABp-huCFTR knock-in, with the associated problems not being dealt
with as colonlytely was not being added to the drinking water. As with the CFTR-knockout genotyping,
these problems had not been considered earlier as it was thought all mice received in August 2006
were homozygous for the FABp-huCFTR knock-in.
As it became obvious mice were not homozygous for FABp-huCFTR, genotyping each mouse became
essential to determine its FABp status. This was done to help start establishing a breeding program to

Chapter 5 - Cystic Fibrosis mouse models- Cftrtm1Unc-Tg(FABPCFTR)1Jaw/J
152
produce mice homozygous for both FABp-huCFTR and the CFTR knockout. This would make genotyping
unnecessary with 100% of offspring being CF/FABp, as required for experimentation needs, as opposed
to breeding FABp-huCFTR hemizygotes, which limits the productivity of the colony, as 1 in 4 mice will
lack FABp-huCFTR and die.
Genotyping protocols were obtained from Jackson Laboratories for determination of CFTR and FABp-
huCFTR status.
5.2.1 Genotyping PCRs
The genotyping PCRs were established using gDNA extracted from toe tags, tail snips or ear tags from
new born to post-weaning colony mice. Genomic DNA was extracted from the tissue samples using 150
μL of Viagen TM ® tail lysis solution supplemented with 0.4 mg/mL proteinase K, with incubation at 55
°C overnight followed by inactivation of the proteinase K solution at 80 °C for 45 minutes .
Five to twenty nanograms of gDNA was used from each mouse for amplification, with 0.2 mM dNTPs, 1
μM primers, 0.0125 U/μL HotStarTaq polymerase, in a total volume of 20 μL.
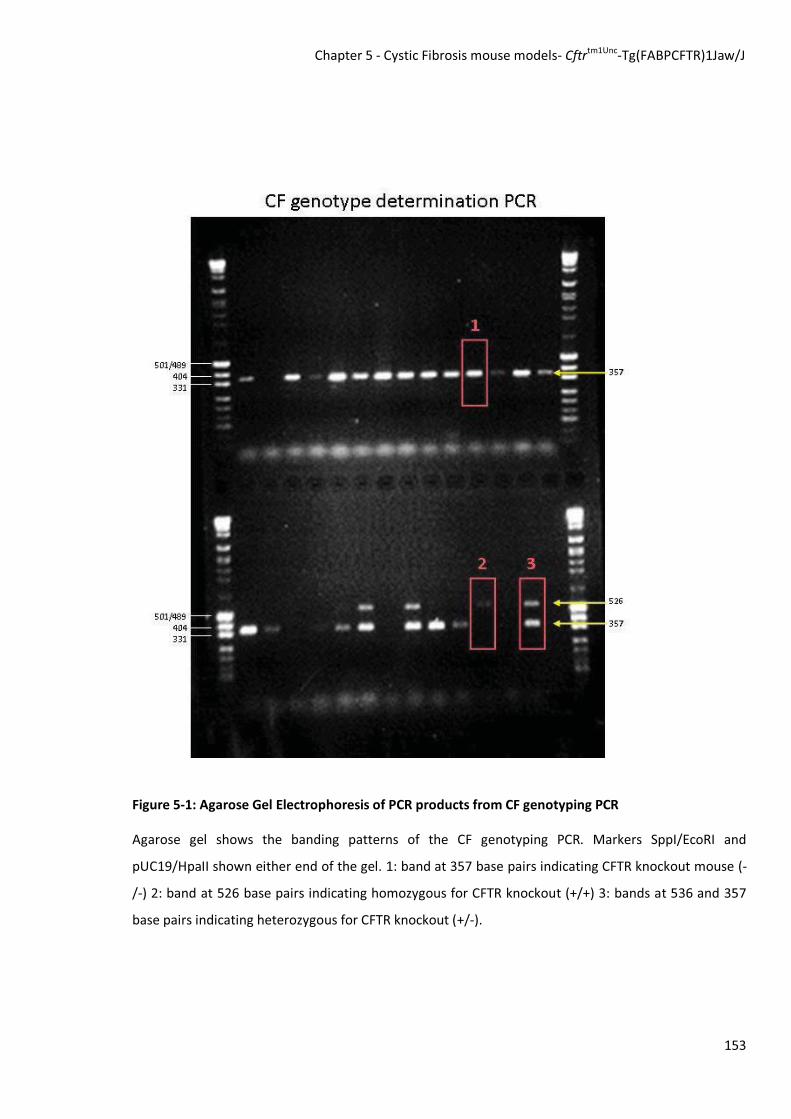
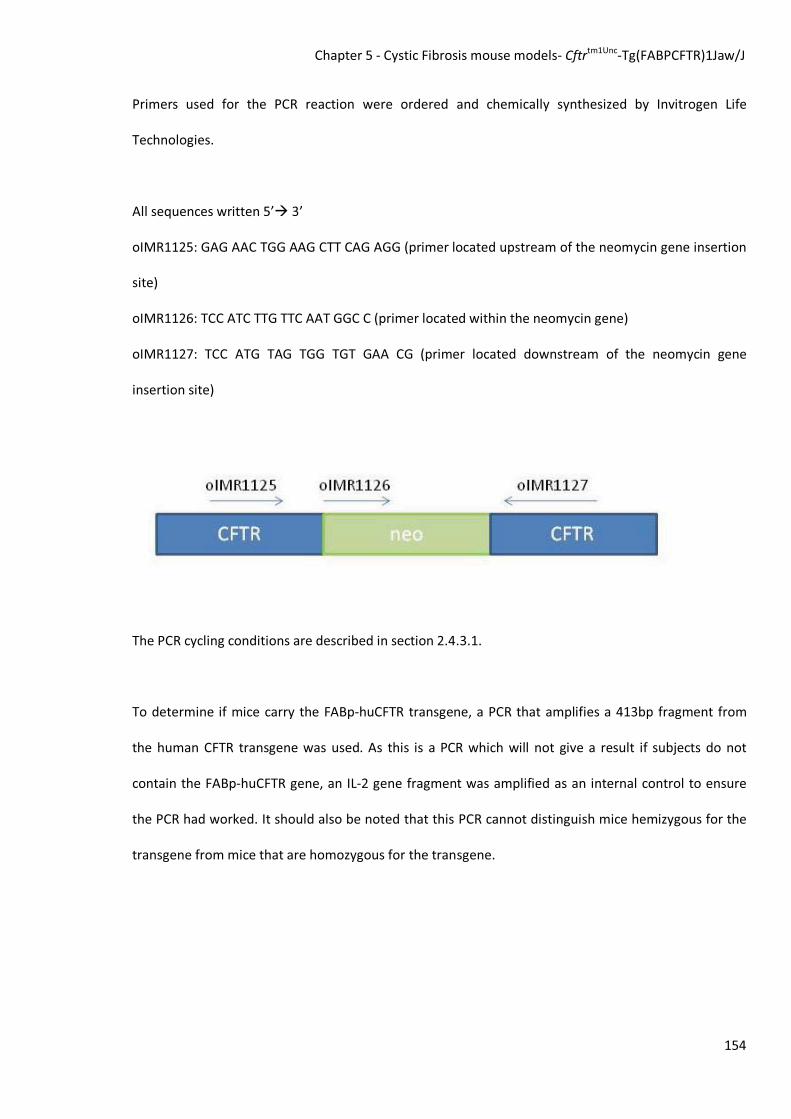
The CFTR knockout mice contain a neomycin gene inserted into the CFTR gene. The three primers in
this reaction give 3 distinct banding patterns to allow the exact genotype to be determined. These
banding patterns are:
Wildtype (+/+) = 526bp (band from the CFTR gene)
Heterozygote (+/-) = 526 + 357bp (bands from the CFTR gene and neomycin gene)
CFTR knockout (-/-) = 357bp (band from the neomycin gene)
An example gel is shown in Figure 5-1
Chapter 5 - Cystic Fibrosis mouse models- Cftrtm1Unc-Tg(FABPCFTR)1Jaw/J
153
Figure 5-1: Agarose Gel Electrophoresis of PCR products from CF genotyping PCR
Agarose gel shows the banding patterns of the CF genotyping PCR. Markers SppI/EcoRI and
pUC19/HpaII shown either end of the gel. 1: band at 357 base pairs indicating CFTR knockout mouse (-
/-) 2: band at 526 base pairs indicating homozygous for CFTR knockout (+/+) 3: bands at 536 and 357
base pairs indicating heterozygous for CFTR knockout (+/-).
Chapter 5 - Cystic Fibrosis mouse models- Cftrtm1Unc-Tg(FABPCFTR)1Jaw/J
154
Primers used for the PCR reaction were ordered and chemically synthesized by Invitrogen Life
Technologies.
All sequences written 5’� 3’
oIMR1125: GAG AAC TGG AAG CTT CAG AGG (primer located upstream of the neomycin gene insertion
site)
oIMR1126: TCC ATC TTG TTC AAT GGC C (primer located within the neomycin gene)
oIMR1127: TCC ATG TAG TGG TGT GAA CG (primer located downstream of the neomycin gene
insertion site)
The PCR cycling conditions are described in section 2.4.3.1.
To determine if mice carry the FABp-huCFTR transgene, a PCR that amplifies a 413bp fragment from
the human CFTR transgene was used. As this is a PCR which will not give a result if subjects do not
contain the FABp-huCFTR gene, an IL-2 gene fragment was amplified as an internal control to ensure
the PCR had worked. It should also be noted that this PCR cannot distinguish mice hemizygous for the
transgene from mice that are homozygous for the transgene.

Chapter 5 - Cystic Fibrosis mouse models- Cftrtm1Unc-Tg(FABPCFTR)1Jaw/J
155
The primers for this PCR are
All primers written 5’ � 3’
oIMR0042: CTA GGC CAC AGA ATT GAA AGA TCT (wild-type IL-2 forward primer)
oIMR0043: GTA GGT GGA AAT TCT AGC ATC ATC C (wild-type IL-2 reverse primer)
oIMR1011: AAA CTT CTA ATG GTG ATG ACA G
oIMR1012: AGA AAT TCT TGC TCG TTG AC
An example gel is shown in Figure 5-2
The PCR cycling conditions are described in section 2.4.3.2.
5.3 Results of genotyping
5.3.1 First round genotyping
The breeding pairs that were then being used for breeding, were genotyped for CFTR and FABp-huCFTR
status approximately 1 year after arrival at the WCH animal facility. As described previously, the delay
in genotyping was due to the incorrect assumption that all mice were homozygous for the CFTR
knockout, and for the FABp-huCFTR transgene.
Four main breeding pairs were genotyped, as shown in Table 5-2.

Chapter 5 - Cystic Fibrosis mouse models- Cftrtm1Unc-Tg(FABPCFTR)1Jaw/J
156
Figure 5-2: Agarose Gel Electrophoresis showing PCR products of FABp genotyping PCR
Agarose gel with SppI/EcoRI and pUC19/HpaII markers. Bands shown at 413 base pairs indicating the
presence of the FABp transgene, bands at 324 show the IL-2 internal control to ensure PCR integrity

Chapter 5 - Cystic Fibrosis mouse models- Cftrtm1Unc-Tg(FABPCFTR)1Jaw/J
157
Table 5-2: Genotyping of first generation Cftrtm1Unc-Tg(FABPCFTR)1Jaw/J mice
Breeder
identification
Sex Theoretical CFTR genotype
from incisor colour
PCR confirmed
CFTR genotype
PCR confirmed
FABP-huCFTR
status*
8C � Heterozygous Heterozygous +ve
� Heterozygous Heterozygous +ve
3B � CFTR-knockout CFTR-knockout +ve
� CFTR-knockout CFTR-knockout +ve
8B � Heterozygous Heterozygous -ve
� te><Author>WelCFTR- CFTR-knockout +ve
9B � Heterozygous Wild type +ve
� CFTR-knockout CFTR-knockout -ve
* This analysis cannot distinguish hemi/homozygous animals.
5.3.1.1 Breeder pair 8C
The family tree for breeder pair 8C is shown in Figure 5-3. The mice used in breeder pair 8C were 3rd
generation mice, with the female being progeny of breeder box 6 and the male from breeder box 8.
Both breeder box 6 and 8 were setup from the progeny of original mice received in August 2006. This
breeder pair, although confirmed as a het +/- by het +/- pairing was continued as the genotyping
results showed a positive FABp-huCFTR status for both animals, which is advantageous for further
breeding.
5.3.1.2 Breeder pair 3B
Breeder pair 3B was setup using brother/sister matings of a CF male and a het female. Again, this
pairing is of 3rd generation mice, breed from the original Box 1 mice received in 2006. The FABp-
huCFTR status of Box 3B was also found to be positive, with this breeding pair continued for further
expansion of the colony. (See Figure 5-4)

Chapter 5 - Cystic Fibrosis mouse models- Cftrtm1Unc-Tg(FABPCFTR)1Jaw/J
158
5.3.1.3 Breeder pair 8B
Breeder pair 8B was made up of a 2nd generation heterozygous female from the original breeder box 4,
and a 3rd generation CF male from the same lineage as the heterozygous male described in breeder box
8C (see Figure 5-5). After genotyping, it was found that the female heterozygous mouse was negative
for the FABp-huCFTR gene, indicating that this mouse does not express the huCFTR in the
gastrointestinal organs. The consequence of this is likely premature death of this mouse, but also the
introduction of an FABp negative breeding line into the colony. As the FABp-huCFTR PCR cannot
distinguish between mice that are hemizygous or homozygous for the transgene, breeding an FABp
negative animal increases the chance of breeding more FABp negative mice. This is not advantageous
for our breeding program, as it will not overcome the limitation we have with the Unc CF colony and
the intestinal problems associated with them. Therefore this breeding pair was discontinued.
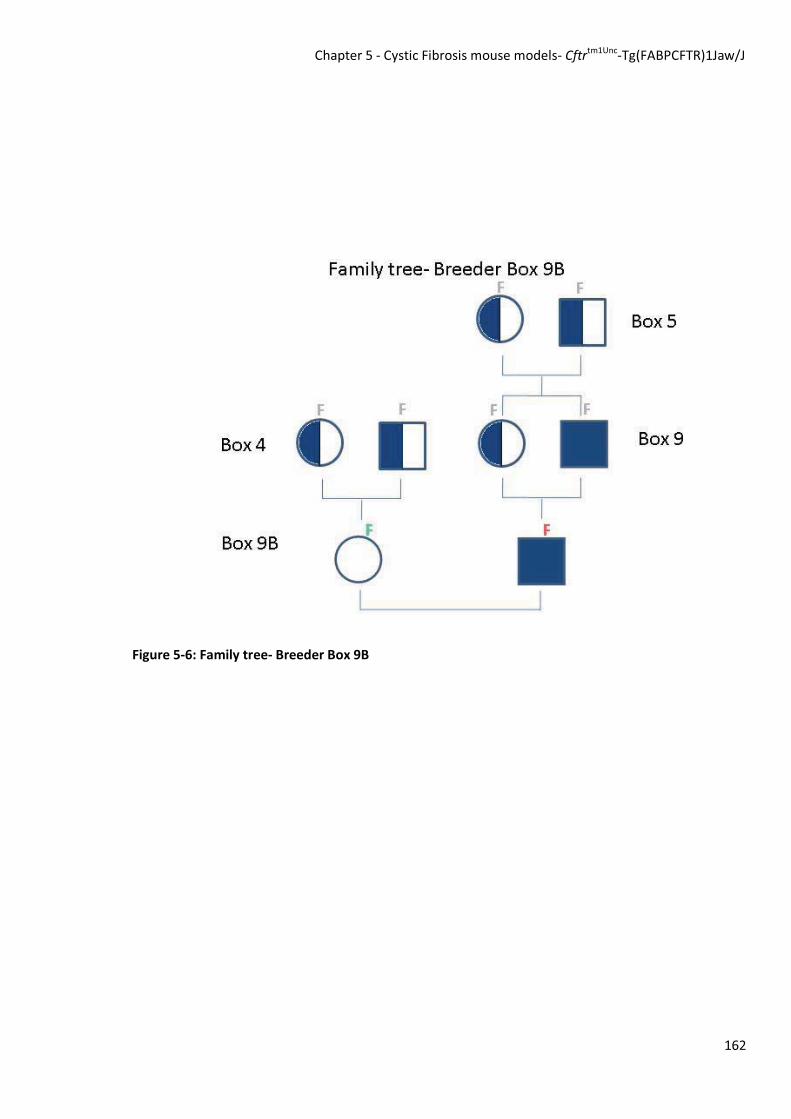
5.3.1.4 Breeder pair 9B
The mice used to establish breeder pair 9B were a 2nd generation female from original box 4 and a 3rd
generation CF male originally derived from box 5 (see Figure 5-6). The genotyping results from this pair
were interesting as it was also discovered that inscisor colour does not distinguish between mice that
are heterozygous for the CFTR knockout and mice that are wild type. The female mouse used in this
breeding pair presented with yellow inscisors, however, after genotyping it was found not to be
heterozygous, but rather wild type as it only gave a PCR result of a band at 526 bp, indicating a +/+
genotype. The male used in this breeding pair was found after genotyping to be FABp-huCFTR negative.
As this breeding pair presented many problems for continued breeding, the pair was separated.

Chapter 5 - Cystic Fibrosis mouse models- Cftrtm1Unc-Tg(FABPCFTR)1Jaw/J
159
Figure 5-3: Family tree- Breeder Box 8C

Chapter 5 - Cystic Fibrosis mouse models- Cftrtm1Unc-Tg(FABPCFTR)1Jaw/J
160
Figure 5-4: Family tree- Breeder Box 3B

Chapter 5 - Cystic Fibrosis mouse models- Cftrtm1Unc-Tg(FABPCFTR)1Jaw/J
161
Figure 5-5: Family tree- Breeder Box 8B
Chapter 5 - Cystic Fibrosis mouse models- Cftrtm1Unc-Tg(FABPCFTR)1Jaw/J
162
Figure 5-6: Family tree- Breeder Box 9B

Chapter 5 - Cystic Fibrosis mouse models- Cftrtm1Unc-Tg(FABPCFTR)1Jaw/J
163
5.3.2 Second round genotyping
Available progeny from breeding pairs genotyped in 5.3.1, as well as other available mice of the same
generation, were genotyped for both transgenes. See Table 5-3.
As Table 5-3 shows, all progeny from genotyped breeding pairs gave a positive PCR product for the
FABp-huCFTR transgene.
As these mice were still young, they were used to determine their true FABp-huCFTR status
(heterozygous or homozygous for FABp-huCFTR) by breeding with normal C57Bl/6 mice.
5.3.3 Determination of FABP-huCFTR status
As the FABp genotyping PCR cannot detect if the tested mouse carries one or two copies of the FABp-
huCFTR transgene (i.e. hemizygous versus homozygous mice), a different breeding program was
required to accurately determine FABp status.
Genotyped pups that had a positive FABp-huCFTR status were bred with normal wild type C57Bl/6
mice. Once pups were born, they were immediately sacrificed and genotyped for their FABp status.
If all the pups give a positive FABp PCR result, this indicates that the CFTRtm1Unc-Tg(FABPCFTR)1Jaw/J
mouse bred with the wild type normal is in all probability homozygous for the FABp-huCFTR transgene.
However, if any pups are found that are negative for the FABP transgene, then it can be concluded
with absolute confidence that the CFTRtm1Unc mouse bred with the wild type normal is heterozygous for
the FABp-huCFTR transgene.

Chapter 5 - Cystic Fibrosis mouse models- Cftrtm1Unc-Tg(FABPCFTR)1Jaw/J
164
Table 5-3: Genotyping of first generation Cftrtm1Unc-Tg(FABPCFTR)1Jaw/J mice
Identification CF Genotype FABP-huCFTR
status
4-1 CF -/- +ve
4-2 CF -/- +ve
3A-1 CF -/- +ve
3A-2 CF -/- +ve
8C-1 CF -/- +ve
8C-2 CF -/- +ve
8C-3 CF -/- +ve
8C-4 CF -/- +ve
8C-5 CF -/- +ve
8C-6 CF -/- +ve
8C-7 CF -/- +ve
8C-8 CF -/- +ve
8C-10 CF -/- +ve
8C-11 CF -/- +ve
8C-12 CF -/- +ve
3B-1 CF -/- +ve

Chapter 5 - Cystic Fibrosis mouse models- Cftrtm1Unc-Tg(FABPCFTR)1Jaw/J
165
Both male and female Cftrtm1Unc-Tg(FABP-huCFTR) mice were bred with their corresponding wild type
mouse.
From the Cftrtm1Unc-Tg(FABP-huCFTR) male 8C-8 bred with a normal female, from 6 pups born, 3 were
FABp positive and 3 FABp negative, therefore indicating that this male is heterozygous for FABp-
huCFTR. Therefore this mouse was not used for further breeding.
The female Cftrtm1Unc(FABp-huCFTR) mice setup to mate with a wild type male proved more difficult to
breed from. Three female Cftrtm1Unc-Tg(FABp-huCFTR) mice, 8C-10, 8C-11 and 8C-12, were housed for
breeding with one C57Bl/6 wild type male. It was noted on many occasions that mice were pregnant by
the animal house staff, and females were removed from the male C57Bl/6 to a separate cage to allow
identification of mother and pups. This occurred with all females, and in all cases the females were
found not to be pregnant. These phantom pregnancies were noted 3-4 times per mouse. Following the
phantom pregnancies, which led to re-caging every 2-3 weeks, the age of the females were thought to
be too old for breeding- particularly if they were to be returned to the colony for breeding. The
decision was made not to breed female CF mice with the normal males, as this was taking a significant
amount of breeding time that could be used to grow the colony, rather than further explore the FABp-
huCFTR status of the mice.
5.3.4 The Current WCH Cftrtm1Unc-Tg(FABPCFTR)1Jaw/J colony
As it stands, the current colony is now producing CF mice in numbers that can be used for
experimentation. Breeding pairs are setup from progeny of mice that have been genotyped and have
given a positive result for the FABp-huCFTR transgene. Currently, there are only CF mice being bred,
with litter sizes being approximately 4-5 mice per litter. As there have not been deaths post weaning,
this would indicate that the mice we are breeding contain the FABp-huCFTR transgene. The current

Chapter 5 - Cystic Fibrosis mouse models- Cftrtm1Unc-Tg(FABPCFTR)1Jaw/J
166
colony has been maintained by setting up breeding pairs using the progeny of breeding lines 8A and
3B, which had positive results for FABp-huCFTR genotyping and breed efficiently to produce CF mice.
Maintenance of the colony has been continued by Ms P Cmielewski, and FABp genotyping has been
discontinued at this point.
5.3.5 Lessons learned for Cftrtm1UncFABP-huCFTR breeding
To maintain the colony it was found that unlike the Cftrtm1Unc colony, breeding pairs must be setup at a
young age- approximately 4 weeks of age, just post weaning. From this experience it has also been
noted that mice stop breeding at approximately 4 months of age, which differs somewhat from our
experience with the Unc colony, with these mice starting breeding at 6-8 weeks of age, and continuing
to breed for as long as a year, with regular pregnancies.
It has been found by others that the Cftrtm1Unc-Tg(FABPCFTR)1Jaw/J mice stop breeding after 4-5 litters
(unpublished observation, personal communication, A van Heeckeren), therefore careful maintenance
of the colony is required to ensure young mice are available for breeding.
It was further noted that an advantage of this colony over the Unc colony is that CFTR-knockout
females are fertile, which allows for CF/CF matings, with all progeny being a CFTR-knockout. It was
seen however, that even in young CF/CF matings the number of progeny per litter was very small; on
average, 2.7 pups were born. Although it is an advantage to be able to breed both affected females
and males to produce a colony entirely of affected mice, the small litter sizes makes maintenance of a
colony difficult- as these progeny then have to be set up for breeding. Testing of female fertility in CF
mouse models has shown decreased female fertility, evidenced by fewer litters and fewer pups per
litter when compared to non-CF mice. Sperm transport is impaired in the female CF reproductive tract,
leading to decreased oocyte fertillisation. There has also been an observed decrease in the size of

Chapter 5 - Cystic Fibrosis mouse models- Cftrtm1Unc-Tg(FABPCFTR)1Jaw/J
167
reproductive organs, abnormal estrous cycling and aberrant ovulation patterns indicating that there
may be additional abnormalities contributing to the observed decreased fertility [199]. When CF
female mice were exposed to exogenous hormones, a correction of organ size and ovulation were
observed, leading to somewhat corrected fertility [199]. Therefore, the creation of a FABp colony does
not address all the reproductive issues associated with a CFTR-knockout colony. It may be useful to use
transgenic technology to correct CFTR expression in other non-respiratory tissues, such as the
reproductive tract. There are advantages of the Cftrtm1Unc-Tg(FABPCFTR)1Jaw/J colony for our research
as we are using gene therapy vectors to deliver the human CFTR gene. As the Cftrtm1Unc-
Tg(FABPCFTR)1Jaw/J colony has the huCFTR correction in the gastrointestinal organs, compared to
gene delivery in the original Cftrtm1Unc colony, it is unlikely that an immune response will be mounted
from the Cftrtm1Unc-Tg(FABPCFTR)1Jaw/J colony to the huCFTR, as these mice have already been
exposed to it. For the research described in this thesis, the FABp colony is advantageous as the immune
response issues can be ruled out as a reason for low level or no CFTR gene correction.
Breeding pairs utilizing female mice heterozygous for the CFTR-knockout and male homozygous CFTR-
knockout mice where both male and female also had a positive FABp-huCFTR PCR result continued to
be setup to allow for maintenance of a strong colony to produce enough mice for both breeding and
experimental work.
As approximately 3-4 generations of genotyping has been carried out, with all mice returning a positive
FABp result, it would appear that we have now established a breeding colony homozygous for the
FABp-huCFTR transgene. Work continues to expand the colony, to allow sufficient numbers of mice for
both breeding and mice to be used for further experiments.

Chapter 6 - Development of DNA Aptamers to human CFTR
168
6 Development of DNA
Aptamers to human CFTR

Chapter 6 - Development of DNA Aptamers to human CFTR
169
6.1 Aim
Experiments described in this chapter outline the attempted development of DNA aptamers to human
CFTR, to create a new tool for the assessment of CFTR transgene expression.
6.2 Aptamers
Aptamers are single stranded nucleic acid molecules that offer an alternative to traditional monoclonal
antibody technology. A random library of short single strand DNA sequences is screened for molecules
that bind to the desired target by multiple rounds of affinity purification, utilising PCR to amplify the
molecules purified from each round of selection [200]. The extremely high diversity of the original
library (1015 sequences) and the nature of the interaction of the aptamer and target means that
aptamers with extremely high affinity (sub nM to pM) and specificity can be isolated.
Aptamer technology offers an attractive alternative approach to antibodies in that it is rapid,
technically straight forward and negates the need for animals.
A gene therapy approach to a cure for cystic fibrosis is a complex and challenging area. Initial studies
are conducted in animal models to prove “proof of concept” safety and efficacy. For analysis of these
experiments highly specific reagents are required for analysis of the CFTR expression from gene
vectors.
Monoclonal antibodies to CFTR are available (such as those described in chapter 4) however, until
recently antibodies specific to human CFTR and suitable for immunohistochemistry of nasal tissue
sections have been difficult to use for detection of CFTR due to problems with availability and
problems with processing tissues which require decalcification, a process which destroys the epitope
recognized by the antibody. Recently there have been 4 antibodies to CFTR that have been shown to

Chapter 6 - Development of DNA Aptamers to human CFTR
170
have higher affinity and specificity compared to those previously described (Cystic Fibrosis Foundation
Therapeutics, personal communication). Despite this, the development of a new tool, such as
aptamers, offers a way to rapidly isolate high affinity reagents to CFTR that would expand the range of
tools available for analysis of CFTR expression.
Development of monoclonal antibodies was a milestone for the recognition of biological molecules
(specifically proteins) with high specificity and affinity. There are however some limitations to
monoclonal antibody technology. The technology is only well established in the mouse, making the
development of reagents for murine proteins difficult. Molecules that are conserved across species can
be difficult to raise antibodies against. Other proteins are simply not immunogenic.
Aptamers are single stranded nucleic acids of approximately 50-100 base pairs in length. They can be
either DNA or RNA and can bind to their target with both high affinity and specificity. This is possible
due to a three-dimensional shape adopted by the aptamer based on intrastrand base pairing that
allows interaction over many residues with the target. This differs from antibodies where the number
of interacting residues is relatively small [200]. Aptamers with pM binding affinities have been isolated
and binding affinities in the low nM range are common [201].
Target molecules for aptamers are diverse and range from simple chemicals such as ethanolamine to
diverse proteins [201]. Aptamers can also be used for detection, separation and purification of
molecules and cells. The small size of aptamers allows them to access epitopes that are sterically
inaccessible to antibodies.
SELEX technology (Systematic Evolution of Ligands by Exponential enrichment) is used to isolate
aptamers. In this process, aptamers recognizing the target of interest are enriched through multiple
cycles,- 10-15, of binding and elution, with amplification of binding aptamers by PCR after each step,

Chapter 6 - Development of DNA Aptamers to human CFTR
171
followed by cloning of individual molecular species. Cloning allows characterization of aptamers by
sequencing and their individual testing [200] [202]. Large quantities of aptamer can then be generated
by PCR or chemical synthesis.
The aptamer system appears technically uncomplicated and doesn’t require the use of animals or cell
culture, which means aptamers can be isolated to toxic or non-immunogenic molecules.
Several aptamers have been FDA approved for pre-clinical and clinical trials. One such FDA approved
aptamer is an anti-vascular endothelial growth factor aptamer for the treatment of ocular vascular
disease [200].
6.3 Development of aptamers to the CFTR gene
As the basic technology for cystic fibrosis gene therapy has been developed by a number of groups,
highly specific reagents are required for analysis of CFTR gene transfer. Monoclonal antibodies to CFTR
are available, however these have often been of poor quality with low affinity and specificity, as
evidenced by the relatively small number of CF gene therapy papers which make use of
immunohistochemistry as a form of analysis. The few “good” antibodies to CFTR can be hard to access,
therefore an attempt to select aptamers to the human CFTR protein for the quantification of CFTR
gene transfer in our gene therapy studies in the murine nasal airway system was deemed to be a
worthwhile enterprise.
A random 50mer library was made by chemical synthesis with primer binding sites at both 5’ and 3’
ends to allow PCR amplification. The primer sequences also contained restriction enzyme binding sites
(SacI and BamHI) to facilitate directional cloning.

Chapter 6 - Development of DNA Aptamers to human CFTR
172
5’ 3’
AGCTCAGAATAACGCTCAA -- N50 -- TTCGACATGAGGCCGGATC
Primers were made to both the 5’ and 3’ binding sites of the library to allow for aptamer amplification
Apt-For (forward primer)
5’ AGCTCAGAATAACGCTCAA 3’
Apt-Rev (reverse primer)
5’ GATCCGGCCTCATGTCGAA 3’
Primers were purchased from Invitrogen on a 40 nM scale, the library was purchased on a 10 μM scale.
Modifications to the primers were also made: Apt-For was prepared with FITC-fluorescent (for
visualization) or biotin (for binding of streptavidin labeled secondary reagents) labels and Apt-Rev was
prepared with a HEGL-A20 modification. The HEGL-A20 modification acts as a hydrophilic spacer, which
blocks Taq polymerase extension, and the A20 sequence allows for strand separation by size with the
addition of an extra 20 adenosine residues on the antisense strand of the amplified aptamers.
6.3.1 Initial screening of aptamer library
Five micrograms of the aptamer library in 500 μL of aptamer binding buffer was denatured at 90 °C for
10 minutes and cooled to 4°C and incubated for 15 minutes before being warmed to room
temperature.
The library was then incubated with untransduced CHOK-1 cells (1x10⁶ cells) to remove aptamer
sequences recognizing cellular molecules.
For detailed method describing the initial screening of the aptamer library, see section 2.2.16.

Chapter 6 - Development of DNA Aptamers to human CFTR
173
Briefly, the aptamer library/cell mixture was incubated at room temperature with gentle agitation for
30 minutes. Cells were removed via centrifugation. Unbound aptamer was then incubated with CHOK-
1 cells transduced with lentivirus containing the CFTR gene and incubated with gentle agitation for 30
minutes at room temperature.
Cells were then washed in binding buffer via repeated centrifugation / resuspension, followed by cell
lysis by resuspension in 100 μL 1% Triton X-100 at 0°C for 5 minutes. Lysed cells were centrifuged at
low speed to remove nuclei from the supernatant.
One hundred microlitres of 2 x elution buffer was added to the supernatant from the lysis step to elute
aptamer sequences.
Aptamer sequences were precipitated with 0.6 M sodium chloride and 5 volumes of ethanol overnight,
before being recovered via centrifugation for one hour and the aptamer pellet was then resuspended
in 20 μL of TE buffer.
One microlitre of recovered aptamer sequences were amplified in a PCR reaction containing 100 μM of
forward-FITC labeled primer and reverse primers-HEGL-A20, 10 mM dNTP’s with the appropriate 10 x
buffer, and made to 100 μL with H2O. The PCR reaction is described in section 2.2.16. This PCR was
carried out in duplicate to increase the amount of aptamer recovered.
The PCR reactions were precipitated with 0.3M sodium acetate and 3 volumes of ethanol. Samples
were incubated at room temperature for 30 minutes followed by centrifugation to pellet amplified
aptamers for 60 minutes. Aptamers were resuspended in 10 μL of Urea denaturing gel loading buffer.

Chapter 6 - Development of DNA Aptamers to human CFTR
174
Prior to running aptamer samples on a 10% w/v denaturing polyacrylamide gel, samples were
denatured at 95 °C for 3-4 minutes and then quenched on ice.
As the forward primer contains a FITC label, once samples were run to the end of the gel, the
fluorescent band was cut from the gel and aptamers eluted from the gel with 0.3M sodium acetate and
2 mM EDTA at 80 °C for 45 minutes with occasional mixing. Separation was achieved by the increased
size of reverse strand due to the HEGL-A20 sequence.
Aptamers were precipitated with 3 volumes of absolute ethanol, and spun down for use in the
subsequent screening for CFTR aptamers.
6.3.2 Subsequent screening of aptamers
Aptamers generated from the initial screening, were used in the subsequent screening process. The
protocol adapted for the subsequent screen is essentially the same as the initial screening process,
however, the previous round aptamers, rather than the aptamer library, were used as the aptamer
source. The heat denatured aptamers were then incubated with CHOK-1 cells expressing the CFTR gene
to bind CFTR recognizing sequences. The protocol is then the same as that described in section 2.2.17.
The recovered aptamers from the subsequent screening protocol were then used again in the
subsequent screening protocol until this had been carried out for 12 rounds of amplification.
Attempts were made to monitor aptamer binding and elution by measurement of the fluorescence in
samples taken following the binding step and samples after the PCR elution. Once the sample taken
following elution reaches a plateau, this indicates the end of aptamer selection (as no further selection
is taking place). This was attempted; however, the levels of fluorescence were too low to be measured

Chapter 6 - Development of DNA Aptamers to human CFTR
175
accurately. Radioactive markers are mostly used for the quantification of the enriched target-binding
oligonucleotides as well as the amount of non-binding olidonucleotides of each selection round. This is
a very sensitive method enabling the detection of slightest amounts of nucleic acids. Radioactive
materials do however pose a health risk to employees and is very cost intensive [203].
A diagrammatic view of the SELEX selection process is shown in Figure 6-1.

Chapter 6 - Development of DNA Aptamers to human CFTR
176
Figure 6-1: SELEX method of aptamer selection
The Systematic Evolution of Ligands by Exponential Enrichment process by which
aptamers to the CFTR gene were selected, isolated and enriched, ready for cloning
into vectors to be sequenced and analysed for CFTR binding abilities.

Chapter 6 - Development of DNA Aptamers to human CFTR
177

Chapter 6 - Development of DNA Aptamers to human CFTR
178
6.3.3 Cloning of amplified aptamer sequences into pBCKS cloning vector
Aptamers were amplified in 5 x 100 μL PCR reactions using forward and reverse primers without the
HEGL_A20 and FITC modifications. PCR reactions were pooled and purified using the Qiagen MinElute
PCR purification kit (Catalogue #28004) as per manufacturer’s instructions.
To allow cloning into pBCKS, restriction sites for SacI and BamHI were incorporated into the primers,
and aptamers were restricted with these two enzymes. Restricted aptamers were run on a 10% native
acrylamide gel, and stained with 1 mg/mL ethidium bromide. The gel was visualized under UV light,
and a distinct band was present at approximately 88 bp. The band was cut from the gel, and DNA
aptamers were extracted via incubation in 0.3 M sodium acetate at 80 °C for 45 minutes, and then
precipitated with absolute ethanol.
Aptamers were ligated into pBCKS (as described in section 2.2.9) that had also been restricted with SacI
and BamHI. Aptamer ligations were electroporated into DH10β cells (as described in section 2.2.3.1).
Cultures of aptamers were harvested, plasmid DNA prepared and sequenced using the T7 reverse
primer. Sequencing was carried out by the sequencing centre at the IMVS using the big dye terminator
chemistry.
A flow chart of the aptamer cloning process is shown in Figure 6-2.

Chapter 6 - Development of DNA Aptamers to human CFTR
179
Figure 6-2: Flow chart of aptamer cloning into pBCKS cloning vector.

Chapter 6 - Development of DNA Aptamers to human CFTR
180
Analysis of the sequences was carried out by the construction of the reverse complement of each
sequence. The sequence external to the SacI and BamHI restriction sites was deleted and the
remaining sequence used for further analysis, as this represents the aptamer sequence itself.
This section of sequence was aligned with the aptamer forward primer and the reverse complement of
the aptamer reverse primer sequences to show the primer sequences and the aptamer sequences
between the two primer sites. Alignments of all sequenced aptamer clones are shown in Table 6-1,
with no duplicate clones found. It was interesting to note that all aptamer sequences were found to be
smaller than the original library. This could be due to the unique binding abilities of aptamers and the
complex structure of the CFTR molecule, which allows small molecules to be generated to bind to
specific regions of CFTR. This could also be due to an inherent bias in the amplification and selection
procedure used.
Although there are segments of sequence that show similarities to each other, each has its own unique
3-dimensional structure. These structures were determined using the program RNAstructure version
5.0 © 1996-2009 Mathews Lab. The unique structures are shown inFigure 6-3.

Chapter 6 - Development of DNA Aptamers to human CFTR
181
Table 6-1: Alignments of sequenced aptamers with forward and reverse primer sequences
Aptamer forward primer: GGAGCTCAGAATAAACGCTCAA Aptamer reverse primer rc: GTTCGACATGAGGCCGGATCC Aptamer #1 rc: GGAGCTCAGAATAAACGCTCAAGGCACGATGGATGCTGCATTCGGCAC CCGTTCGACATGAGGCCGGATCC Aptamer #2 rc: GGAGCTCAGAATAAACGCTCAACGGGGCAGCAGACGTC GCGTG GTTCGACATGAGGCCGGATCC Aptamer #3 rc: GGAGCTCAGAATAAACGCTCAACGTGGACAAGTAGATGC TGTGTGG G CCGTTCGACATGAGGCCGGATCC Aptamer #4 rc: GGAGCTCAGAATAAACGCTCAAGGTGCACACACATCCTTA TGGCAGCACCTTGTTCGACATGAGGCCGGATCC Aptamer #5 rc: GGAGCTCAGAATAAACGCTCAACAGGCCATGCTCACACCG TGATGCTAC GTTCGACATGAGGCCGGATCC Aptamer #6 rc: GGAGCTCAGAATAAACGCTCAAGGGGGCATCCCGA TGTGG GTTCGACATGAGGCCGGATCC Aptamer #7 rc: GGAGCTCAGAATAAACGCTCAACACAGCGCACTACAACATCACTC GTTCGACATGAGGCCGGATCC Aptamer #8 rc: GGAGCTCAGAATAAACGCTCAAGCCCCAAGTTGACACATTATGAGCT GTTCGACATGAGGCCGGATCC Aptamer #9 rc: GGAGCTCAGAATAAACGCTCAACCCATGTACGGAGCCT TGGTGGTG TGGTTCGACATGAGGCCGGATCC Aptamer #10 rc: GGAGCTCAGAATAAACGCTCAATGTGCACATGC TGTCG GTTCGACATGAGGCCGGATCC Aptamer #11 rc: GGAGCTCAGAATAAACGCTCAATGCCGCTTGGAGTGGTCACGTGGC CCGTTCGACATGAGGCCGGATCC Aptamer #12 rc: GGAGCTCAGAATAAACGCTCAATGCGACTGGATGCTAGGTTGATCGTGC TTCGACATGAGGCCGGATCC Aptamer #13 rc: GGAGCTCAGAATAAACGCTCAACACAGCGCACTACAACATCACTC GTTCGACATGAGGCCGGATCC Aptamer #14 rc: GGAGCTCAGAATAAACGCTCAATGGGGGTGCATACCA TGCGTCGT GTTCGACATGAGGCCGGATCC Aptamer #15 rc: GGAGCTCAGAATAAACGCTCAACGTGGGCTGTGTCAA TGTCATGCA TGGTTCGACATGAGGCCGGATCC Aptamer #16 rc: GGAGCTCAGAATAAACGCTCAACCACAGGGCAGCATAAACAGAG TGGTTCGACATGAGGCCGGATCC Aptamer #18 rc: GGAGCTCAGAATAAACGCTCAATGTTGTGTACTGTGCTGGGGGTATG TGGTTCGACATGAGGCCGGATCC

Chapter 6 - Development of DNA Aptamers to human CFTR
182
Figure 6-3: Structures of the CFTR aptamers isolated using the SELEX procedure
(see the following 5 pages for aptamer structures)

Chapter 6 - Development of DNA Aptamers to human CFTR
183
Aptamer #1 Aptamer #2
Aptamer #3 Aptamer #4

Chapter 6 - Development of DNA Aptamers to human CFTR
184
Aptamer #5 Aptamer #6
Aptamer #7 Aptamer #8

Chapter 6 - Development of DNA Aptamers to human CFTR
185
Aptamer #9 Aptamer #10
Aptamer #11 Aptamer #12

Chapter 6 - Development of DNA Aptamers to human CFTR
186
Aptamer #13 Aptamer #14
Aptamer #15 Aptamer #16

Chapter 6 - Development of DNA Aptamers to human CFTR
187
Aptamer #18

Chapter 6 - Development of DNA Aptamers to human CFTR
188
6.3.4 Screening and testing of aptamer isolates
Aptamer sequences were used to generate pure aptamer species with a 5’ biotin label via PCR using
the biotinylated Apt-For primer and the HEGL-A20-Rev primer. Following PCR amplification, aptamers
were heat denatured and run on a denaturing polyacrylamide gel and aptamers eluted from the gel
with 0.3 M sodium acetate and precipitated with absolute ethanol. Precipitated aptamers were
resuspended in a total volume of 20 μL 0.5x TE buffer. The concentrations of each purified aptamer
were determined using 2 μL of sample, measured on a nano-spectrometer at absorbance 260 nm.
Table 6-2: Characteristics of purified isolated aptamers
Aptamer clone Concentration
ng/mL
OD 260 OD 260/280 OD 260/230
1 2.6 0.052 0.94 0.40
2 33.5 0.67 1 0.84
3 35.5 0.71 1.044 0.70
4 33 0.66 1.031 0.65
5 29.5 0.59 1 0.69
6 31.5 0.63 1 0.84
7 35 1.0 1.045 0.67
8 18.5 0.37 1.028 0.62
9 6.6 0.132 1 0.50
10 25 0.5 1.042 0.64
11 15.7 0.314 1.043 0.33
12 23.5 0.47 1.044 0.37
13 21 0.42 1 0.43
14 30 0.6 1.017 0.39
15 29 0.58 1 0.50
16 20.5 0.41 1.051 0.46
17 41 .82 0.988 0.76
18 18.5 0.37 0.974 0.52

Chapter 6 - Development of DNA Aptamers to human CFTR
189
Aptamers were not screened for their binding abilities to the CFTR gene in time for inclusion into this
thesis. However, subsequent assessment did not identify any aptamer that recognised NIH3T3 cells
transduced with a lentiviral vector expressing CFTR (DS Anson, personal communication).
6.4 Discussion and Conclusions
Aptamers are a solution to many of the problems associated with the use of antibodies, in terms of
their specificity, sensitivity and raising antibodies to non- immunogenic and toxic targets as they
negate the need for animals. As described earlier, a drawback of antibodies is the technology is only
well established in the mouse, which makes the development of reagents for murine proteins difficult.
Traditional monoclonal antibody technology requires the use of large numbers of animals and the
process can be slow and laborious.
As outlined in this chapter, the attempted development of aptamers to target the CFTR gene was
carried out. The process of developing and isolating aptamers is advantageous as their short DNA
sequences (50-100 base pairs) bind with high affinity and specificity to their target as they adopt a
specific three-dimensional structure [200] [201].
The use of the SELEX process of binding, dissociation, expansion, denaturation, purification and further
selection and enrichment to develop aptamers to the CFTR gene was described in this chapter. Twelve
stages of selection and enrichment were undertaken to obtain 18 different aptamer clones shown in
Figure 6-3.
Problems that arose during the aptamer selection process were most prominently the inability to
monitor selection by measuring the post-binding fluorescence. This meant there was not a measure to

Chapter 6 - Development of DNA Aptamers to human CFTR
190
indicate when the selection process was successful or when it had been completed. A number of 12
selection rounds was chosen as this appeared to be a common number of rounds in the literature.
Another problem faced was the inability to show the selection cell line expressed CFTR. This was due to
the lack of a suitable antibody to detect the expressed CFTR. Real time PCR was carried out on cell
lysates to confirm the presence of the CFTR transgene, however, it is not known whether the cells
expressed the CFTR which was used for aptamer selection.
It is interesting to consider whether smaller aptamer sequences were inadvertently selected for via gel
elution in the selection process, as evidenced by all aptamers being found to be smaller than the
aptamer selection library.
It is also unfortunate that aptamer clones were not able to be tested for their binding abilities to CFTR
in CHOK-1 cells for inclusion in this thesis. Testing was carried out by DS Anson on NIH3T3 cells as
transduced CHOK-1 cells were unavailable at the time of testing. Given the negative result, no real
conclusion can be drawn and testing of these aptamers on transduced CHOK-1 cells should be carried
out. Testing of the aptamers was carried out by applying 100 ng of the aptamer clone to a CHOK-1 cell
line expressing CFTR. The aptamers were fluorescently labeled using a biotinylated forward primer, and
streptavidin-FITC to amplify the signal, and tested for histochemical detection of CFTR. Initially this was
carried out on cell lines expressing CFTR, and clones showing positive results (fluorescence via binding
of the aptamer to the CFTR expressing cells) will then be used to detect CFTR in sections from
experimental animals, in similar methods to those described in chapter 4 with the 596 CFTR
monoclonal antibody.
There is a need for development of new aptamers beyond the therapeutic market. Assays and
analytical systems for medical diagnostics offer a wide range of applications. Some advantages of

Chapter 6 - Development of DNA Aptamers to human CFTR
191
aptamers in comparison to antibodies, like the chemical synthesis of aptamers, their easy chemical
modification without loss of function and their easier immobilization compared to antibody
immobilization should bring the replacement of antibody assays by aptamer based assays.
Aptamers appear to be a highly useful and required technology for the detection and visualization of
target molecules in diseases such as ocular vascular disease and lysosomal storage diseases, and for
use in CF gene therapy as an alternative to antibodies to the CFTR gene.

Chapter 7 - Development of Real Time PCR for determination of virus titre
192
7 Development of Real Time
PCR for determination of virus titre

Chapter 7 - Development of Real Time PCR for determination of virus titre
193
7.1 Aim
The determination of virus titre can be carried out by a number of techniques dependent on the viral
transgene. FACScan analysis can only be used to determine viral titre for virus expressing any
fluorescent protein and β-galactosidase staining can only be carried out on virus expressing the LacZ
gene. For virus expressing a therapeutic gene such as CFTR, Real Time PCR is one assay to determine
viral titre that is of general applicability. The real time PCR can be designed to assay either a vector
sequence, giving an assay that can be used on all vectors, or a vector specific sequence that can be
used to titre a given vector if more than one vector is present.
A Real time PCR based on TaqMan® chemistry was developed to titre all viruses independent of their
transgene. TaqMan® chemistry utilizes a fluorogenic probe in addition to the standard PCR primers.
The probe contains a fluorogenic molecule at one end and a non-fluorescent quencher, which
quenches the signal of the fluorogenic molecule at the other. The probe binds in between the primers
and through the action of the polymerase; it is digested during the synthesis of the PCR product
releasing the fluorogenic molecule allowing it to fluoresce. The advantage of Taqman ® chemistry is the
specific hybridization between the probe and target that is required to generate a fluorescent signal,
reducing the background and false positives. To apply this technology to the determination of virus
titre, two assays are required, one to measure the amount of virus sequence and another that corrects
for the number of cell equivalents of genomic DNA in the assay sample. An assay to determine viral
titre in NIH3T3 (mouse embryonic fibroblast cell line) and A549 (carcinomic human alveolar basal cells)
cell lines was developed in our laboratory, with the use of a vector sequence corresponding to the start
of the gag coding sequence and a single copy gene chosen to correct for the number of cell equivalents
per reaction. The gene chosen was transferrin, as both the human and mouse transferrin genes contain
sequences that are unique within their respective genomes.

Chapter 7 - Development of Real Time PCR for determination of virus titre
194
This assay can be used to detect the gag sequence from our virus in NIH3T3 and A549 cell lines.
Titering a virus containing the LacZ gene has traditionally been done via a staining assay (outlined in
section 2.3.5.1) in a CHOK-1 cell line (Chinese hamster ovary cells). To determine if the titre calculated
via this staining assay was comparable to the titres achieved by RT-PCR, a RT-PCR assay was developed
to assess the vector in CHOK-1 cells.
7.2 Development of a CHOK-1 Real Time PCR assay
As the same assay for the vector sequence (gag) can be utilized for this assay also, the gene chosen to
correct for the number of cell equivalents per reaction was the partial slc35a1 gene for CMP-sialic acid
(Accession number: AJ810300). A region of unique sequence was identified by BLAST searches and
TaqMan® Gene Expression Assays developed. The assays were developed by Applied Biosystems.
Sequences for the desired targets were chosen and given to Applied Biosystems, where algorithms
utilizing heuristic design rules generated primers and probe sequences with matched melting
temperatures, accounting for binding contribution of the dyes, MGB and specific di-nucleotide pairs.
Additional rules included the minimization of the effect of base runs, reduction of secondary structure
formation and primer-dimer formation. The sequences of the probe and primer concentrations are
shown below, Table 7-1.
In order to determine the copy number per cell, a standard of known copy number is required. To
obtain a standard of known copy number, CHOK-1 cells were infected with low amounts of virus
carrying the neomycin resistance gene. The resulting clones were selected by culture in Hams F12/10%
FCS supplemented with 1 mg/mL active G418. When distinct colonies had formed, they were isolated
and transferred to a well of a 96 well plate. Once confluent, the cells were expanded and gDNA was
prepared using the Qiagen Blood and Cell Culture gDNA Midi Kit, following the frozen cells protocol.
The copy number of vector in each clone was confirmed by Southern blot analysis.

Chapter 7 - Development of Real Time PCR for determination of virus titre
195
Table 7-1: Probe and Primer sequences for Real time PCR assays designed by Applied Biosystems
All sequences written 5’ � 3’. NFQ = Non-Fluorescent Quencher
Gene 3’ primer sequence 5’ primer sequence Probe sequence
CHO-CMP-sialic acid CTATGTAATGTTGTTCTTGTTGACTTGCT CTACTACATCAGACACAGTTACTACTAACATTAGA FAM-TCCCAGAGAAAATTTAC-NFQ
NLS-LacZ GCCACTTCTTGATGGACCACTT CCGCCACCGACATCATCT FAM-CACGCGGGCGTACAT-NFQ
Luciferase TTGTCGATGAGAGTGCTCTTAGC GCGCAGCTTGCAAGACTATAAG FAM-CTGGTGCCCACACTAT-NFQ
CFTR CCTTTAGAGAGAAGGCTGTCCTT CGCTGATGCGAGGCAGTAT FAM- CCCTGCTCAGAATCT-NFQ

Chapter 7 - Development of Real Time PCR for determination of virus titre
196
The standards created were used to determine the reaction efficiencies of the assays. Genomic DNA
was diluted in 10 fold serial dilutions until a 1:1,000,000 fold dilution was reached. Five microlitres of
each dilution was assayed as outlined in section 2.3.5.2.
From this the reaction efficiency- the slope of the standard curve- and the R2 values were determined
using the Applied Biosystems 7300 system software. The R2 values for gag and CHOK-1 slc35a1 were
0.998 and 0.999 respectively. The reaction efficiency of gag and CHOK-1 were -3.746 and -3.782. As the
reaction efficiencies of both assays were within 10% of each other, the ∆CT method was applied. This
method requires only one dilution of standard to determine the copy number of the gene of interest in
a sample. Once standards and samples have been run and the CT is determined, the following formulas
can be applied to determine viral titre.
∆CT sample = Ct gag – Ct CHOK-1
∆∆CT = ∆CT of sample – average ∆CT of standards
Copy number per cell = 1/2∆∆CT
Titre = copy number per cell x number of cells plated initially Volume virus assayed (μL)
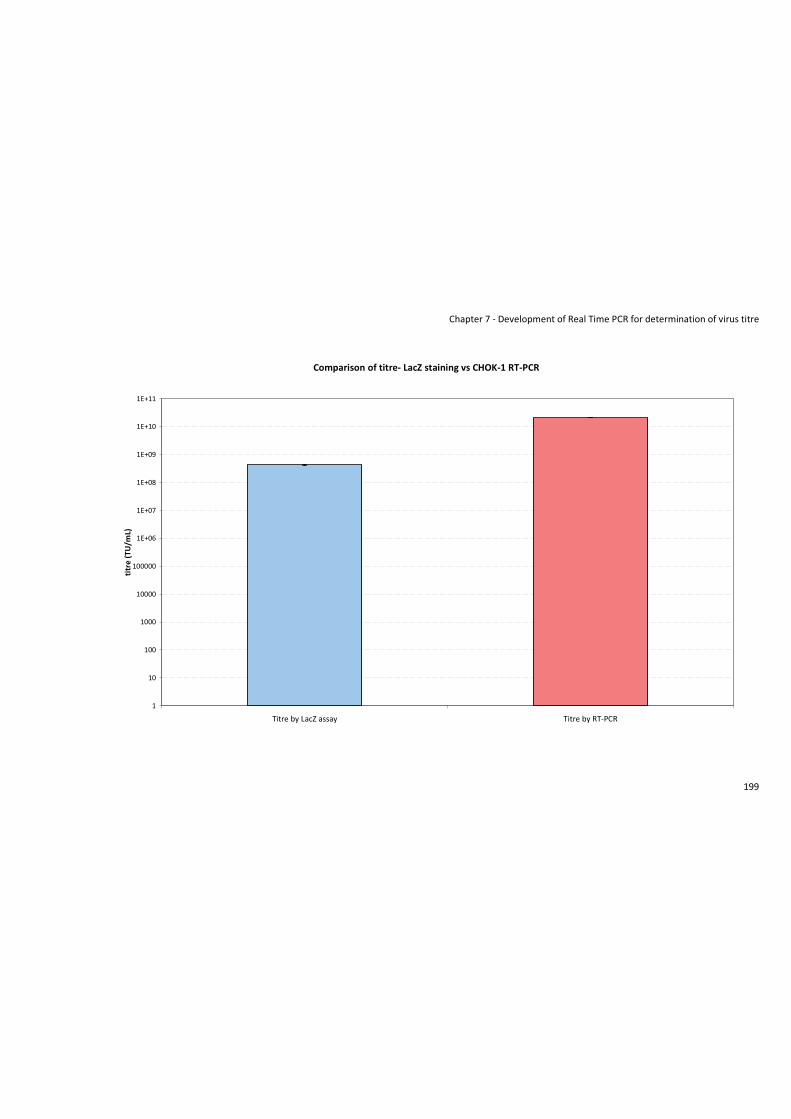
To validate the CHOK-1 Real Time PCR assay, a sample of concentrated LV-MPSvNLSLacZ virus (0.05 μL)
was assayed on CHOK-1 cells, with titre determined by LacZ staining assay and Real Time PCR. The
results showed titreing LacZ virus using the staining method appeared to underestimate virus titre by
49-fold (Figure 7-1). This underestimation of titre by cell counting is not unexpected due to the human
error involved in counting LacZ positive cells in culture, however, a 49-fold difference is too much to be
solely explained by the human error involved in counting the transduced cells. A possible explaination
is that the stained cells do not express the transgene at high enough levels to be counted. It is unlikely
that the RT-PCR result is inaccurate as the cells were grown in culture for 4 weeks to remove possible
plasmid DNA contamination. The copy numbers (shown in Table 7-2) are less than 1 copy per cell,

Chapter 7 - Development of Real Time PCR for determination of virus titre
197
which means the RT-PCR titre is not an underestimate of actual titre, as, if the copy number was high,
doubly infected cells would only be accounted for once.
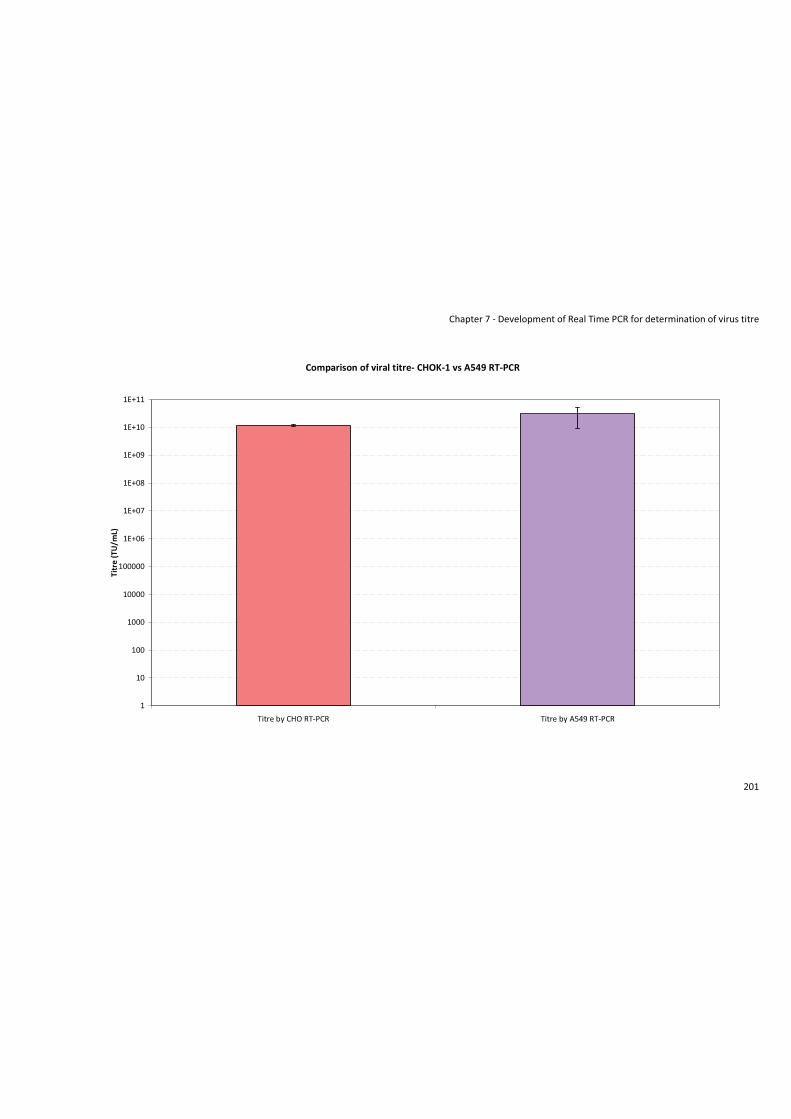
When comparing titres of the same virus carried out by Real Time PCR on two different cell lines, the
results were much tighter, with the A549 cells giving a 2.5-fold higher titre than that calculated using
the CHOK-1 cell Real Time PCR assay (See Figure 7-2). This result can be explained by the different
infectibilities of the two different cell lines utilized here, with A549 showing marginally higher
infectibility than the CHOK-1 cells.
Table 7-2: Copy number per cell of LacZ transcripts in transduced CHOK-1 cells
Virus Volume assayed Copy number/cell
LV-MPSvNLSLacZ 0.5 μL 0.5176
LV-MPSvNLSLacZ 0.5 μL 0.4829
LV-MPSvNLSLacZ 0.5 μL 0.4413

Chapter 7 - Development of Real Time PCR for determination of virus titre
198
Figure 7-1: Comparison of LacZ titre determined by staining assay and
CHOK-1 Real Time PCR (n=3)
CHOK-1 cells were transduced with LacZ expressing virus and the transducing
units/ mL were determined by both LacZ staining assay and Real Time PCR.
Error bars represent standard error.
Chapter 7 - Development of Real Time PCR for determination of virus titre
199
Comparison of titre- LacZ staining vs CHOK-1 RT-PCR
1
10
100
1000
10000
100000
1E+06
1E+07
1E+08
1E+09
1E+10
1E+11
Titre by LacZ assay Titre by RT-PCR
titr
e (T
U/m
L)

Chapter 7 - Development of Real Time PCR for determination of virus titre
200
Figure 7-2: Comparison of titering virus using CHOK-1 and A549 Real Time PCR (n=3)
CHOK-1 and A549 cells were transduced with the same volumes of lentivirus.
Titre was determined on both CHOK-1 and A549 cell lines using Real Time PCR.
Chapter 7 - Development of Real Time PCR for determination of virus titre
201
Comparison of viral titre- CHOK-1 vs A549 RT-PCR
1
10
100
1000
10000
100000
1E+06
1E+07
1E+08
1E+09
1E+10
1E+11
Titre by CHO RT-PCR Titre by A549 RT-PCR
Titr
e (T
U/m
L)

Chapter 7 - Development of Real Time PCR for determination of virus titre
202
7.3 CFTR, Luciferase and LacZ Real Time PCR assays
Real Time PCR assays were also designed by Applied Biosystems to the CFTR, Luciferase and the
nuclear localized LacZ genes used in our vector systems. The primers and probe sequences are shown
in Table 7-1.
The premise behind designing assays to these transgenes is for titreing virus such as that used in
section 8, where multiple transgenes are used. This virus was made as per the method outlined in
section 2.3.4, however, when the transfection was carried out, either two (Luciferase and LacZ) or
three (CFTR, Luciferase and LacZ) vectors were transfected into the cells in varied proportions. As all
virus made, whether it contains LacZ, Luciferase or CFTR, will be detected by our gag reaction as it
recognises a unique sequence in our vector, to distinguish between each transgene, an alternative
assay was required. The assays developed for these three transgenes can be used in the same way the
gag reaction is used, with a CT value determined for each reaction, and the titre for each different virus
can be determined using the standard formula shown above. The titre results of virus containing
multiple transgenes can be found in section 8 promoters section.
7.4 Discussion and Conclusions
The Real Time PCR assays developed here have allowed for more sophisticated virus preparations to be
made, containing mix of different viruses that carry different transgenes, that within a single PCR assay
can each be detected to obtain the titre of the three transgenes of interest- CFTR, LacZ and Luciferase.
The development of a Real Time PCR assay in CHOK-1 cells, has also allowed us to obtain a comparison
for titering LacZ viruses via real time PCR and the previously used staining method in the same cell line.
It was thought that the real time PCR method may be more accurate and eliminate the error involved

Chapter 7 - Development of Real Time PCR for determination of virus titre
203
in manually counting blue cells, however, the 49-fold difference in titre is greater than would be
expected by human error in counting the assay. The error involved in counting may account for a
portion of the 49-fold increase, it is more likely that the assay itself does not express the LacZ
transgene at a level where it can be visualized.
With the development of real time assays to all of the transgenes used- LacZ, Luciferase and CFTR, the
titreing of viruses can now be standardized across all the different types of viruses made- whether they
contain marker genes (Luciferase/LacZ) or therapeutic genes- CFTR, and all assays can be carried out in
the same cell line, as there is a difference in the infectibility of different cell lines. The creation of these
assays also allows for the development of more sophisticated virus preparations to be made, with
titres for each individual transgene able to be measured in the one RT-PCR assay.

Chapter 8 - Assessment of the level of gene expression on the phenotypic correction of the CFTR defect
204
8 Assessment of the level of
gene expression on the phenotypic
correction of the CFTR defect

Chapter 8 - Assessment of the level of gene expression on the phenotypic correction of the CFTR defect
205
8.1 Aim
Experiments outlined in this chapter were designed to assess the effect of the level of gene expression
of CFTR on phenotypic correction of the CFTR defect.
8.2 Effect of promoter on gene expression
Cystic fibrosis, as described previously, is the most common autosomal recessive disorder affecting
Caucasian populations. However, the level of gene transduction and the optimal level of gene
expression needed to correct or reduce disease severity and phenotype in vivo remains unknown. It is
unclear what proportion of epithelial cells would be required to be transduced with a therapeutic gene
to obtain a clinically beneficial correction of the underlying electrophysiological defect in CF. It has
been suggested that as little as 5% of normal CFTR levels significantly ameliorates the severity of lung
disease in patients [204]. It is also not certain that over expression of CFTR will compensate for
inefficient transduction. In vitro experiments showed over expression of CFTR in normal epithelial cells
does not increase the level of chloride transport in the epithelium [59].
Early studies show the endogenous CFTR promoter to be weak, producing approximately 1-2
transcripts per cell [204]. Even less CFTR expression may be sufficient for normal function, because
studies of humans with splice site variations suggest as little as 8% of normal transcripts preserve
normal lung function [205]. Similarly, mouse intestine expressing 5% of normal CFTR levels showed no
intestinal disease and retained approximately 50% of normal Cl- transport [206]. In all cases, the
endogenous CFTR promoter drove expression in most if not all of the epithelial cells. In contrast, gene
transfer vectors express CFTR in a smaller fraction of cells, governed by the transduction efficiency of
the vector.

Chapter 8 - Assessment of the level of gene expression on the phenotypic correction of the CFTR defect
206
This raises considerations of what promoter strength might be required in a gene transfer vector that
targets <100% of airway cells and whether CFTR over expression might have unexpected
consequences.
Previous reports have focussed on the percentage of cells expressing CFTR that were required to
correct the CF Cl- transport defect in vitro [60]. That study used a Moloney murine leukemia virus
retroviral vector that used the strong long terminal repeat (LTR) promoter to stably express CFTR in a
CF epithelial cell line. As few as 6-10% of vector corrected cells was sufficient to achieve Cl- transport at
levels close to those seen in totally corrected cell lines. Previous studies suggested the MoMLV
promoter generates expression at a level comparable to that of the cytomegalovirus (CMV) promoter
[207-209]. CMV drives CFTR expression at very high levels in airway epithelia [210-212]. The
percentage of cells required to repair Cl- transport with a weaker promoter driving CFTR is unknown.
In a later in vitro study, gene correction in 25% of cells was sufficient to restore mucus transport to
normal, again a vector that expressed CFTR at supranormal levels was used [61] but again the effect of
varying the level of CFTR expression was not assessed.
Many gene transfer vectors have utilised viral promoters because they generate high level expression
in numerous different cell types. There is some evidence to suggest that over expression of CFTR may
have a deleterious effect, as over expression of CFTR in cultured cell lines reduced the rate of cell
proliferation in NIH-3T3 fibroblasts, a monkey kidney cell line and in a CF bronchial epithelial cell line
[213-215]. However, in vivo, over expression of the human CFTR in the gastrointestinal organs by the
fatty acid binding promoter [198] has no apparent adverse effect.
Studies have been carried out previously in vivo using lentivirus expressing LacZ under the control of a
promoter that drives a high level of ubiquitous expression- the elongation factor 1 α gene promoter

Chapter 8 - Assessment of the level of gene expression on the phenotypic correction of the CFTR defect
207
(EF1α), a promoter that induces low level ubiquitous expression- phosphoglycerate kinase gene
promoter (pgk), and the cytokeratin 18 gene promoter (K18) which is reported to drive a low level,
ciliated airway epithelial cell specific pattern of expression which mimics the endogenous expression of
CFTR [216]. These studies showed EF1α to give the highest level of LacZ expression, followed by pgk
and then K18, as would be expected by the description of the promoters. However, these studies
utilising LacZ only provide a qualitative indication of relative promoter strength. Interestingly, these
studies also showed that in the context of the lentiviral vector used in this study, the K18 promoter was
not restricted to ciliated cells, as previously described when delivered as plasmid DNA to a human CF
bronchial cell line [216], but was expressed in both ciliated and non-ciliated epithelial cells in the same
ratio as with the two other promoters.
8.3 Assessing relative promoter activity in vivo
To provide a quantitative measure of promoter strength the Luciferase transgene was utilised.
Four groups of mice (n=4) were instilled using the inhalation driven method of LPC/LV as described in
section 2.4.1 with 4 μL 0.3% LPC followed by 20 μL of saline (control group) or LV expressing Luciferase
under control of 3 different promoters- EF1α, pgk and K18. The Luciferase marker gene was used to
analyse the promoter strength. A second LV expressing the LacZ gene under the control of the MPSV
promoter was also included in the virus (≈20% of transfected transgene was the LacZ gene, and ≈80%
was Luciferase) to analyse tissues post-mortem for cell type analysis, and give a quantitative measure
of the rate of transduction, allowing the Luciferase results to be normalised for transduction efficiency.
Mice instilled with the Luciferase constructs were imaged one week post instillation using the Xenogen
IVIS 1000 system as described in 2.4.2.5.

Chapter 8 - Assessment of the level of gene expression on the phenotypic correction of the CFTR defect
208
Immediately following imaging, mice were sacrificed and stained for LacZ expression as described in
section 2.4.2. Cell counts were carried out on cut sections from all mice. The cell counts were found to
correspond with the in vitro LacZ virus titre of each virus preparation. The mice treated with LV-
K18Luciferase/LacZ had the highest LacZ titre of 5.75 x 10⁸ TU/mL (as assayed on A549 cells) and also
showed the highest LacZ cell count average of 121 LacZ positive cells. The pgk group had a LacZ titre of
3.77 x 10⁸ TU/mL and had the second highest average cell count of 95.25 LacZ positive cells. The LV-
EF1αLuciferase/LacZ group had the lowest LacZ titre out of all the virus preparations made at 2.86 x
108 TU/mL. However, this group of mice showed no LacZ positive cells. It remains unknown why this
group showed no LacZ cells at all and this result means that the Luciferase results for the
EF1αLuciferase/LacZ group cannot be normalised, which makes it difficult to give a definitive result for
the relative strength of this promoter in the nasal airway epithelium. However, to provide an
alternative analysis, the Luciferase data was also normalised to the relevant in vitro Luciferase titres.
This confirms the relative strengths of the 3-promoters, and suggests that EF1α is the strongest
followed by pgk and K18. The ratios of each promoter shown under Table 8-1 suggest that normalising
Luciferase results to Luciferase titre may be a valid method of analysis as the values for pgk:K18 agree
closely with those obtained after normalising to LacZ. In addition, the LacZ data from the pgk and K18
groups confirms that transduction was limited to the respiratory and transitional epithelia.
Figure 8-1 a and b show the raw Luciferase data and Luciferase data normalised for LacZ for the pgk
and K18 treated groups. After normalisation for LacZ titre and transduction efficiency the difference
the Luciferase results for the K18 and pgk groups is accentuated, increasing from 1.59-fold to 2.62-fold.
However, significance does not alter before and after normalisation to LacZ even though a bigger
difference between the two groups is seen, as large standard deviations are observed. A scatter plot
for both pgk and K18 promoter groups (see Figure 8-1 c and d) shows low R2 values for each promoter,
indicating a low level of correlation between the LacZ and Luciferase results. The pgk group was
similar, with the highest Luciferase response also showing the largest LacZ response.

Chapter 8 - Assessment of the level of gene expression on the phenotypic correction of the CFTR defect
209
The low R2 values undermine the basis of the experiment somewhat. Reasons for such low R2 values
may be due to the LacZ data not sampling enough tissue to be representative. This may be true given
that some of the LacZ cell counts are very low or zero. A change that could be made to adjust for this is
to increase the proportion of LacZ plasmid in the virus preparation mixture. Another method to
compensate for this may be to cut and assess more sections to gain a more representative sample-
closer to what was measured with the Luciferase imaging. There may also be something affecting one
of the transgenes post-transduction in a variable way, which could be the beginnings of an immune
response, however unlikely this may be only one week post-transduction. The data most likely
indicates an increase in ‘n-value’ to gain a significant and clearer outcome.
Mice treated with Luciferase have been shown to exhibit an immune response to Luciferase (P.
Cmielewski, personal communication), with expression decreasing over time, correlating to the
increasing level of Luciferase antibodies. This experiment should be repeated with assessment of
immune response to the two transgenes (Luciferase and LacZ), so that mice who exhibit an immune
response can be excluded from the study. It is unlikely however for an immune response to be present
at just one week post treatment, but this additional step may add more insight into the issues involved
in the variability in the gene transfer process.

Chapter 8 - Assessment of the level of gene expression on the phenotypic correction of the CFTR defect
210
Table 8-1: Determination of normalised Luciferase data
Luciferase
construct
Luciferase
(Photons/Sec)
LacZ cell
count
Ratio Luc
to LacZ
titre
Normalised
Luciferase
Average
Norm
Luciferase
Luciferase
normalised
to Luc titre
Average
Norm to
titre
EF1α 1539000 0 1.65 - 326059
EF1α 6376500 0 1.65 - 1350953
EF1α 2204100 0 1.65 - 466970
EF1α 3297700 0 1.65 - - 698665 710662
pgk 106800 178 0.326 2598 86829
pgk 458500 77 0.326 2578 372764
pgk 195130 121 0.326 698 158642
pgk 340110 5 0.326 29454 8832 276512 22368
K18 442210 169 1.66 4213 46450
K18 281290 0 1.66 0 29547
K18 245290 163 1.66 2423 25765
K18 326220 152 1.66 3455 3364 34266 34007
Ratio of pgk:K18 (normalised to LacZ count) = 6.63
Ratio of EF1α:pgk (normalised to Luciferase titre) = 3.17
Ratio of EF1α:K18 (normalised to Luciferase titre) = 20.89
Ratio of pgk:K18 (normalised to Luciferase titre) = 6.577

Chapter 8 - Assessment of the level of gene expression on the phenotypic correction of the CFTR defect
211
Figure 8-1: Luciferase gene transfer in normal mice treated with LV-Luciferase
under control of the three test promoters EF1α, pgk and K18
a) Raw Luciferase measurements for each promoter group measured in
photons/second, ANOVA p=0.367, Mean +/- SE
b) Luciferase data normalised for LacZ and in vitro titre for pgk and K18-Luciferase
treated mice, t-test p=0.857, Mean +/- SE
c) Scatter plot of Luciferase data compared to LacZ result for each individual mouse
in the pgkLuciferase/MPSVLacZ group, R2= 0.2325
d) Scatter plot of Luciferase data compared to LacZ result for each individual mouse
in the K18Luciferase/MPSVLacZ group, R2= 0.1337

Chapter 8 - Assessment of the level of gene expression on the phenotypic correction of the CFTR defect
212
a)
b)

Chapter 8 - Assessment of the level of gene expression on the phenotypic correction of the CFTR defect
213
c)
d)
R² = 0.2325
0
200000
400000
600000
800000
1000000
1200000
0 50 100 150 200
Flux
(pho
tons
/sec
)
LacZ cell count
pgkLuciferase/MPSVLacZ
R² = 0.1337
0
50000
100000
150000
200000
250000
300000
350000
400000
450000
500000
0 20 40 60 80 100 120 140 160 180
Flux
(pho
tons
/sec
ond)
LacZ cell count
K18Luciferase/MPSVLacZ

Chapter 8 - Assessment of the level of gene expression on the phenotypic correction of the CFTR defect
214
The same promoters driving expression of CFTR were tested in FABp-CFTR knockout mice (as described
in chapter 5). Each CFTR vector (EF1a-CFTR, pgk-CFTR and K18-CFTR) were co-packaged with constructs
expressing Luciferase (EF1a-Luc) and LacZ (MPSV-LacZ) to provide two independent measures of in vivo
transduction efficiency (Luciferase imaging and X-gal staining). In each case the transfection for virus
generation used 80% by mass of the relevant CFTR vector and 10% by mass of the other two vectors.
The rationale for having the three constructs in the virus preparations was to use CFTR for assessing
phenotypic correction of the CFTR defect, Luciferase to provide an ongoing real time quantitative
measure of gene transfer efficiency and LacZ for a second quantitative measure of gene transfer post-
mortem. For each virus preparation, the relative transduction efficiencies of each transgene was
measured in vitro using real time PCR analyses specific to each transgene (see section 2.3.5.2).
8.4 Testing the effect of promoter on functional CFTR expression
Four groups of mice were treated as per section 2.4.1 with 4 μL of 0.3% LPC followed one hour later by
80 μL LV-CFTR under control of the 3 test promoters, EF1α, pgk and K18 with a control group receiving
saline in place of vector. Mice were imaged for Luciferase expression at 1 month post vector instillation
to provide a quantitative measure of transduction and TPD analysis was then performed immediately
after to determine functional Cl- channel correction.
The results from the Luciferase imaging (Figure 8-2) showed significant expression at the 1 month
experimental period. The results in Figure 8-2 are broken down into the different promoter/CFTR
groups, however, all mice received the same EF1αLuciferase LV with the only variable in the Luciferase
viruses being the titre of the virus. The flux (photons/sec) measured from each treatment group
corresponds with the in vitro Luciferase titres of each virus, with the
EF1αCFTR/EF1αLuciferase/MPSvLacZ virus having the highest Luciferase titre of 1.05 x10⁹ TU/mL,

Chapter 8 - Assessment of the level of gene expression on the phenotypic correction of the CFTR defect
215
K18CFTR/EF1αLuciferase/MPSvLacZ having the second highest Luciferase titre of 3.27 x 10⁸ TU/mL and
the pgkCFTR/EF1αLuciferase/MPSvLacZ virus having the lowest Luciferase titre of 1.07 x10⁸ TU/mL.
Data from Figure 8-2 shows that when compared to virus titre, there was not a linear relationship
present, as a 10-fold decrease in titre, only decreases gene transfer by 50%. The virus titres are better,
although not wholly reflected by the lung transduction, as nasal transduction appears to reach a point
of saturation with respect to vector dose, whereas lung transduction appears to better represent the
titres of each virus.
Following Luciferase imaging, TPD measurements were taken to assess the functional correction of the
CFTR Cl- channel. Figure 8-3 shows the ΔPD and Basal PD results seen at 1 month following LV
instillation.

Chapter 8 - Assessment of the level of gene expression on the phenotypic correction of the CFTR defect
216
Figure 8-2: Luciferase flux measured in each CFTR promoter group
Luciferase gene expression measured in photons/sec for each of the promoter groups at 1 month after
vector delivery. *note all groups expressed Luciferase under control of the EF1α promoter. Solid bars
represent transduction in the nasal airways; faded bars represent transduction in the lung. Mean, +/-
SEM, ANOVA (nasal) p = 0.096, ANOVA (lung) p = 0.012.
0.00E+00
5.00E+05
1.00E+06
1.50E+06
2.00E+06
2.50E+06
3.00E+06
3.50E+06
4.00E+06
EF1aCFTR pgkCFTR K18CFTR saline
Flux
(ph/
sec)

Chapter 8 - Assessment of the level of gene expression on the phenotypic correction of the CFTR defect
217
Figure 8-3: ΔPD measurement and Basal PD measurement at 1 month post treatment
Data showing the average ΔPD measurement for each promoter group at 1 month post LV instillation.
Normal ΔPD value is -5 to -7, normal Basal PD value (average) +3. n= 9 per group +SEM. Solid bars
represent ΔPD values, transparent bars represent Basal PD values.
*t-test p=0.047 (pgk ΔPD v saline ΔPD)
Chapter 8 - Assessment of the level of gene expression on the phenotypic correction of the CFTR defect
218
There were no significant changes towards correction of the electrophysiological defect- either ΔPD or
basal PD measurement- seen with any of the CFTR treatment groups. There was a small trend towards
normal for ΔPD seen in mice treated with K18CFTR, however this was absent in the other treatment
groups. This change towards normal may not reflect K18 as the best promoter to use for correction of
the CFTR defect, but instead reflect the higher CFTR titre seen with this vector compared to both the
EF1α and pgkCFTR viruses (see Table 8-2). All treatment groups showed a trend towards normalisation
of the Basal PD, however, again the greatest effect was seen with the K18CFTR vector, most likely
explained by the higher CFTR virus titre seen in this virus. The results suggest transduction efficiency
for the CFTR vectors was too low to achieve significant normalisation of the electrophysiological
parameters. The experiment should be repeated with virus preparations that show a higher titre, as
this would seem to be the likely reason for the lack of ΔPD normalisation seen in the EF1α and pgkCFTR
groups.
Figure 8-3 also shows the Basal PD measurement (this is the difference between Basal solution reading
and Basal + amiloride reading) which measures sodium channel activity. CF untreated mice have a large
positive change in basal PD, and normal mice have been shown to have a small positive change
between the two basal readings. As expected, the saline (untreated) group show a large positive
change in the basal PD reading, and there is a trend seen with the treated groups to a smaller positive
change. K18CFTR treated mice showed the largest decrease in basal PD- this meaning it trended
towards what would be seen in normal mice. However, the differences seen in basal PD were not
significantly different. It is interesting to note the basal PD appears to return closer to normal values
than the ΔPD. This suggests a lower level of CFTR gene transduction may be required for the regulation
of ENaC than for correction of Cl- ion transport. As sodium transport is thought to be a more important
issue in the development of CF pathophysiology, this result can be seen as somewhat encouraging.

Chapter 8 - Assessment of the level of gene expression on the phenotypic correction of the CFTR defect
219
One week following Luciferase and TPD analysis of gene transfer, mice were sacrificed as per section
2.4.2 and LacZ analysis was carried out.
All groups showed low levels of LacZ gene transfer (Figure 8-4). This low level of gene transfer is not
entirely surprising as each of the viruses delivered was made up of only approximately 10% LacZ. The
results from the LacZ cell counts show the K18 group to give a level of gene transduction as would be
expected for this composition of virus. This LacZ result appears to correlate with the ΔPD results
achieved by the K18CFTR, as it reflects high efficiency of gene transfer rather than the level of
expression. There is no significant difference seen in this LacZ data. It is however somewhat surprising
that the level of gene transfer was seen to be so low in the EF1α and pgk virus preparations, as the
experiment carried out in normal C57Bl/6 mice using virus containing both the Luciferase and LacZ
marker genes, with the virus containing 20% LacZ vector gave much higher cell counts than those seen
in the FABp-CF knockout mice, while LacZ titres were similar (as shown below in Table 8-2. From
previous experience, virus expressing only LacZ with a similar titre in normal C57Bl/6 mice would
produce a result of approximately 150-200 LacZ positive cells, which is much higher than the results
achieved here. It would indicate a difference between LacZ transduction in normal and FABp-CF mice
or as experienced previously there may be something causing the LacZ to be affected post-
transduction as the LacZ data is in disagreement with the Luciferase data, as there was a level of
Luciferase expression measured that reflects the Luciferase titre.

Chapter 8 - Assessment of the level of gene expression on the phenotypic correction of the CFTR defect
220
Table 8-2: Virus titres (in vitro titres measured on A549 cells)
Virus LacZ titre (transducing
units / mL)
Luciferase titre CFTR titre (if
applicable)
EF1αLuciferase/MPSvLacZ 2.86 x 10⁸ 4.72 x 10⁸ -
pgkLuciferase/MPSvLacZ 3.77 x 10⁸ 1.23 x 10⁸ -
K18Luciferase/MPSvLacZ 5.75 x 10⁸ 9.25 x 10⁸ -
EF1αCFTR/EF1αLuciferase/MPSLacZ 3.43 x 10⁸ 1.05 x 10⁹ 9.10 x 10¹⁰
pgkCFTR/EF1αLuciferase/MPSLacZ 3.63 x 10⁸ 1.07 x 10⁸ 8.44 x 10¹⁰
K18CFTR/EF1αLuciferase/MPSLacZ 3.54 x 10⁸ 3.27 x 10⁸ 1.02 x 10¹¹
Figure 8-4: LacZ gene transfer in mice treated with LV-CFTR/Luciferase/LacZ
Average LacZ cell counts for each promoter treatment group in FABp-CFTR mice. *note all LacZ was
under control of the MPSV promoter
0
10
20
30
40
50
60
70
80
90
EF1aCFTR pgkCFTR K18CFTR saline
Ave
rage
cel
l cou
nt#L
acZ
posi
tive
cel
ls/m
ouse

Chapter 8 - Assessment of the level of gene expression on the phenotypic correction of the CFTR defect
221
This difference in LacZ gene transfer and the apparent lack of correction seen in the FABp-CFTR mice
raises the question as to whether there is a difference in gene transfer between normal C57Bl/6 mice
and the FABp-CFTR mice.
8.5 Comparison of LacZ gene transfer in C57Bl/6 and FABp-CFTR mice
Two groups of C57Bl/6 mice and two groups of FABp-CFTR mice were instilled using the standard
instillation protocol described in section 2.4.1, with n=8 in each treatment group. One group of each
breed of mice were instilled with 20 μL of virus and the other group instilled with 80 μL of virus. The
LV-LacZ titre was 3.93 x 10⁹ TU/mL.
Mice were sacrificed one week post virus instillation and stained for the presence of LacZ (section
2.4.2.2).
Shown in Figure 8-5, FABp-CFTR mice, whether they received 20 μL or 80 μL of LV-LacZ demonstrated
very low levels of gene transfer, 0.625 and 6.25 LacZ positive cells/mouse respectively. The normal
C57Bl/6 mice that received the exact same treatment using the same stocks of LPC and LV-LacZ
showed much higher gene transfer, with the 20 μL group having an average of 108.25 LacZ positive
cells/mouse and the 80 μL group having 146.125 LacZ positive cells/mouse. The difference between
groups was shown to be significant (ANOVA, p < 0.001).

Chapter 8 - Assessment of the level of gene expression on the phenotypic correction of the CFTR defect
222
Figure 8-5: Comparison of LacZ gene transfer in FABp-CFTR and C57Bl/6 mice
Comparison of average LacZ cell counts in FABp-CFTR and C57Bl/6 mice treated with 20 μL and 80 μL of
LV-LacZ. n =8, ANOVA, p < 0.001
0
50
100
150
200
250
300
FABp 20 uL FABp 80 uL C57 20 uL C57 80 uL
cell
coun
t#L
acZ
posi
tive
cel
ls/m
ouse

Chapter 8 - Assessment of the level of gene expression on the phenotypic correction of the CFTR defect
223
8.6 Discussion and Conclusions
Initial studies looking at the effect of different promoters on gene expression showed that in marker
gene studies (Luciferase) the EF1α promoter drove a significantly higher level of gene expression in the
nasal airway compared to the pgk and K18 promoters. The design of the experiment utilising the two
reporter genes- Luciferase and LacZ – was to allow the normalisation of the Luciferase data to gene
transduction efficiency (ie the LacZ cell counts) for each mouse, taking into account the in vitro titres of
both transgenes. Although it was thought that this would improve the data, smaller standard
deviations were not seen after normalisation. The EF1αLuciferase group could not be analysed in this
way as surprisingly there was no LacZ gene transfer seen in any of these mice. Immune responses to
Luciferase have been measured after lentiviral vector mediated gene transfer to the mouse nose (P.
Cmielewski, personal communication). It may therefore be possible that there was an immune
response seen to the LacZ transgene in this cohort of mice. However, this would seem unlikely given
that the same LacZ vector is used in each case, especially given that the animals were analysed only
one week after gene delivery. A further experiment should be carried out as described in this chapter,
with the additional steps of blood collection prior to treatment and in the weeks post treatment to
allow analysis of antibody formation to the transgenes. This would allow mice who show an antibody
response to be excluded from the data set.
However, looking at only the raw Luciferase data, it closely resembles the data obtained in the LacZ
studies carried out utilising the same three promoters with EF1α giving the highest level of gene
transduction, followed by pgk and K18, indicating that the experimental design was fundamentally
sound. Normalising the Luciferase results for in vitro Luciferase vector titre leads to the same
conclusion, although this approach not without issues of its own given that the relationship between
titre and gene transfer does not seem to be a simple linear one.

Chapter 8 - Assessment of the level of gene expression on the phenotypic correction of the CFTR defect
224
The lack of close correlation between Luciferase and LacZ in each cohort of mice, is potentially a
problem. There are possible explanations for this, however, it makes it difficult to assess whether
either of the reporter genes can provide an accurate surrogate for gene transduction efficiency in the
CFTR experiments, which is an integral part of the experimental design. Apart from the possibility of an
immune response to one or both gene products (Luciferase/LacZ), this may indicate that gene transfer
is highly non linear relative to titre or to an unknown factor. Luciferase provides a global analysis of
gene transfer, while LacZ is a local analysis. More exhaustive sampling of LacZ cell counts and a larger
number of animals per group may be beneficial to determine a relationship between the two reporter
genes and their corresponding titre values.
Similar experiments using the FABp-CFTR mice and the CFTR transgene- with Luciferase and LacZ also
incorporated into the virus- were also conducted. The data obtained from these experiments
measuring phenotypic benefit of CFTR via ΔPD measurement at 1 month post treatment, showed
markedly different results from those seen in the Luciferase/LacZ study.
The results showed that the level of gene transfer with all vectors was too low to give significant
electrophysiological correction of phenotype. The K18 promoter did appear to show a trend towards
correction of the defect, however this is likely due to the higher titre of this virus compared to the EF1α
and pgkCFTR viruses.
The LacZ data from this experiment indicates that gene transduction in the EF1α and pgk groups is low
compared to the K18 group, despite the 3 virus preparations having almost identical LacZ in vitro titres.
LacZ data shows the same pattern as seen with the CFTR results with the K18 group showing the best
phenotypic correction when compared to the other two promoter groups. This could indicate three
things; (1) gene transfer using LV-K18CFTR was efficient when compared with the other two viruses (2)

Chapter 8 - Assessment of the level of gene expression on the phenotypic correction of the CFTR defect
225
there is an unexplained environmental factor interfering with LacZ gene transfer or (3) the viruses are
behaving differently in vivo compared to the in vitro titre assays.
The low level of LacZ gene transfer seen in the LacZ analysis of the CFTR experiment in FABp-CFTR mice
raised questions over the efficiency of gene transfer in this mouse strain. This led to the requirement
to examine whether there is a difference in the levels of gene transfer achieved in the two mouse
strains used in this set of experiments- the FABp-CFTR and the C57Bl/6 normal strain.
The subsequent experiment to test any differences between the two groups of mice showed a distinct
difference between the two groups. The only variables in this experiment were the volumes of LV-LacZ
delivered (either 20 μL or 80 μL) and the strain of mouse. The mice were age matched as well as
possible to avoid any possible effect age may have on gene transfer. Mice were treated with the same
vial of LPC and the same aliquots of virus, again to avoid the variability of making solutions on different
days that may affect gene transfer.
The results indicated a distinct difference in the level of gene transfer seen in the two groups of mice,
with the normal mice exhibiting high levels of gene transfer, which were representative of mice treated
with this virus previously, at both treatment volumes and the FABp-CFTR mice showing extremely low
levels of LacZ gene transfer. This experiment was then repeated (by another person at a later date)
with another group of FABp-CFTR mice, again comparing to normal C57Bl/6 mice. In this experiment,
the results showed the FABp-CFTR mice exhibited gene transfer of the same order of magnitude as the
C57Bl/6; however it was seen to be at lower levels (approximately 250 LacZ positive cells) when
compared to the normal mice (600+ LacZ positive cells) (P. Cmielewski, personal communication).
Although a different batch of virus was used in the two studies, this is unlikely to be the cause of the
differences in the results is as only one batch of virus was used in each study. However, it may be
noteworthy that all FABp-CFTR mice in the first study outlined were housed in the same cage, whereas

Chapter 8 - Assessment of the level of gene expression on the phenotypic correction of the CFTR defect
226
in the subsequent study mice were not housed in this same way. It is possible that with the commonly
caged mice colony there was a nasal infection or similar environmental factor that may have been
present in the FABp-CFTR colony, but not in the control (C57/Bl6) mice, which did not allow efficient
gene transfer event to occur. However, it remains unclear what caused the difference between what
appear to be two identical studies. The inconsistent results do however seem to suggest that certain
environmental factors may have a large influence on the efficiency of gene transfer.
The result of comparing the FABp-CFTR mice to normal mice is important to consider when analysing
the previous experiment utilising the 3 promoters and CFTR gene delivered to the FABp-CFTR mice. The
lack of complete phenotypic correction may be due to the low level of gene transfer achieved by
delivery of our lentivirus into the FABp-CFTR mice. However, the transduction by Luciferase in the
FABp-CFTR mice cannot be disregarded. There may be complications in measuring the
electrophysiological response to CFTR gene delivery in FABp-CFTR mice that is not found in the
CFTRtm1Unc mice. It is also interesting to note the lack of published data to report successful CFTR gene
transfer in the FABp-CFTR mouse strain [217]. There have however been reports of successful CFTR
gene transfer in the CFTRtm1Unc mouse strain, which has been bred on a C57Bl/6 background [93] [218].
This set of experiments is a commencement into understanding the relationship regarding the level of
gene expression most optimal for phenotypic correction of the CFTR defect. The analysis of efficiency
of gene expression from each promoter via Luciferase imaging was established with the EF1α promoter
giving the highest level of gene expression. However, when this was transferred into the FABp-CFTR
mice, the results obtained showed no phenotypic correction as the levels of gene transfer were too
low to give a result.
As with the Luc/LacZ studies, a repeat of the CFTR/Luciferase/LacZ studies should be carried out with
the additional step of blood collection and analysis for antibody formation to any of the transgene. This

Chapter 8 - Assessment of the level of gene expression on the phenotypic correction of the CFTR defect
227
is important to determine if an antibody response is being mounted against the treatment, and
eliminate mice that do exhibit an antibody response from the data set. An additional change to the
experimental design to rule out the potential influence of an immune response may be to carry out all
analysis (Luciferase, TPD and LacZ) 1 week post instillation as this would make it unlikely that a
significant immune response would be mounted. In addition, if it could be determined which marker
gene provided the best surrogate measure of CFTR gene transfer, then the experimental design could
be simplified to use only one marker gene, rather than both.
It would also be beneficial to carry out the CFTR arm of the experiment in both the FABp-CFTR mice
and CFTRtm1Unc colonies to examine any differences in phenotypic response in these two strains of mice.

Chapter 9 - Development of aerosolised delivery of lentiviral vectors in vivo
228
9 Development of aerosolised
delivery of lentiviral vectors in vivo

Chapter 9 - Development of aerosolised delivery of lentiviral vectors in vivo
229
9.1 Aerosolised delivery of therapeutics
Delivery of therapeutics to the airways is most easily done using an inhalable aerosol as this allows
simple, widespread and effective delivery. The broad area of deposition (large airways, small airways,
bronchioles and alveoli) can be controlled by altering the aerosol droplet size. Part of the development
of airway gene therapy is to examine the potential for delivery of lentiviral particles as an aerosol.
Aerosol delivery of therapeutics such as gene therapy vectors is ideal due to the non-invasive delivery,
targeting of the area of interest- the lungs- and the reduced systemic toxicity when compared to other
methods of gene delivery [219].
The most commonly used aerosol devices are jet or ultrasonic nebulisers which have showed poor in
vivo results when used with non-complexed plasmid DNA ranging in size from 4.7-7.2 kbp [220]. These
atomisation and spray devices are however regularly utilised in the delivery of non-viral, nucleotide
based therapies to the lungs with good success. To achieve micron sized droplets for delivery to the
lower airways, a significant increase in surface energy must be applied to a fluid stream. For this
reason, high strain rates are often applied.
Several options exist for atomisation of liquid formulations in a clinical setting including pressure
driven, pneumatic, ultrasonic and electrostatic devices. Each of these devices imparts strain on the
fluid steam in a unique manner to create the desired droplet size [220]. Metered dose inhalers use a
high pressure propellant or simplex atomiser geometry to break fluid streams into small droplets [221-
223]. Lower pressures can be employed if centrifugal forces are used in conjunction with the applied
pressure, as occurs with pressure-swirl atomisers [224]. Energy provided by compressed gas flow is
used in pneumatic jet nebulisers in order to generate an aerosol from a reservoir containing the
therapeutic [225]. Electrostatic sprays apply significant voltages that are large enough to overcome the
surface tension forces of the fluid, resulting in the generation of an aerosol [226].

Chapter 9 - Development of aerosolised delivery of lentiviral vectors in vivo
230
To date, most studies looking at the aerosolisation of gene therapy agents have been focused on the
use of non-viral therapies. The studies outlined in this thesis, investigate the aerosolisation of a
lentiviral vector using the Aerogen nebuliser device.
The Aerogen nebuliser contains a vibrating mesh or plate containing multiple holes which uses
electricity to vibrate the element at low frequency, forming droplets of solution that can inspired [220].
The advantages of the Aerogen system are the low sheer forces created, therefore there are no
alterations or damage to the test compounds and molecular integrity and concentration are
maintained. The Aerogen produces a low velocity, fine, controlled droplet size aerosol without
compressed air. This system has also been shown to have high efficiency, with small to no wastage of
input material, which is a significant advantage when using small volumes and costly materials such as
gene therapy vectors.
Initially in vitro experiments were undertaken to assess the nebulisation technology with lentivirus to
ensure any loss of viable virus was minimal. The Aerogen piezoelectric nebuliser with a pore size of 3.7
μm was deemed best for the aerosolisation of lentivirus following tests assessing the recovery of virus
following nebulisation with the Aerogen. Tests were also conducted using protein stabilisers to
enhance the recovery of nebulised virus. Foetal calf serum, Bovine Serum Albumin, Pluronic F68 and
Maltodextran were added to the virus prior to nebulisation and their effect on recovery of viable virus
measured. Bovine Serum Albumin at a concentration of 0.3% when added to the final virus consistently
gave the best recoveries of nebulised virus. Four tests using 0.3% BSA were carried out with the
following recoveries: 93.89%, 73.64%, 66.55% and 100%. This in vitro data was used when translating
to in vivo use. (Chuan K. Tan, unpublished data).

Chapter 9 - Development of aerosolised delivery of lentiviral vectors in vivo
231
A rat model using the SCIREQ Flexivent small animal ventilator in conjunction with the Aerogen was
used to deliver the LPC pre-treatment and lentivirus to the lungs of this small animal model.
The SCIREQ small animal ventilator is designed to be used in conjunction with the Aerogen nebuliser
and allows targeted and controlled delivery of aerosol directly to the airways via intubation. The
controlled delivery via the SCIREQ ventilator allows nebulisation into the lungs to be co-ordinated with
inspiration.
Using the SCIREQ Flexivent, lung compliance, airway tissue resistance and tissue elastance can be
continually monitored through the dosing procedure to monitor the effect of the procedure on the
lungs.
Experiments were carried out using a LV expressing the LacZ marker gene to allow the visualisation and
quantification of gene therapy.
9.2 Nebulisation of airway gene therapy into rat lung
Rats were anaesthetised with 75 mg/kg Domitor and 0.5 mg/kg Ketamine via intra-peritoneal injection.
Intubation of the rats was carried out by laying the rat in a supine position. The nose of the rat was
immobilised by a piece of cotton thread. The trachea was visualised using a hook-shaped pen light
which was used to gently lift up the bottom jaw. The trachea was located by the transient opening and
closing of the epiglottis. Once the trachea was located, a 16G catheter was slowly and gently inserted
into the trachea. To check the rat was correctly intubated, the catheter was connected to the Flexivent
machine. If correctly intubated, the lungs will visibly expand, whereas if inserted incorrectly (into the
stomach) the stomach will expand in which case the catheter was removed.

Chapter 9 - Development of aerosolised delivery of lentiviral vectors in vivo
232
Rats were allowed to adjust to ventilation for 30 minutes prior to pre-treatment. Lung mechanics were
also measured to gain an understanding of lung function prior to gene therapy treatment.
Three rats were initially tested in the nebulisation model.
9.2.1 Rat ‘A’
The first rat received 500 μL of 0.1% LPC in PBS nebulised into the lungs on inspiration. The
nebulisation of LPC took 6 minutes. The nebuliser was detached from the Flexivent setup and was
cleaned with PBS as LPC has negative effects on the stability of lentivirus (unpublished observation). It
was vital that any remnants of LPC were removed as to not cause loss of viability of the lentivirus to be
delivered to the lungs. Lung mechanics were measured during the hour between LPC delivery and the
LV delivery. One millilitre of LV-LacZ formulated in PBS was then delivered via the Aerogen nebuliser on
inspiration to the lungs of the rat. The delivery of LV-LacZ took 12 minutes to be delivered to the lungs.
Lung mechanics were measured for10 minutes after the completion of LV-LacZ delivery. Following the
measurement of lung mechanics, the rat was removed from the Flexivent and woken with antisedan
and allowed to recover from anaesthesia in an incubator.
9.2.2 Rat ‘B’
Rat ‘B’ was treated in the same manner described in 9.2.1, but with the following changes.
The LPC concentration was increased to 0.3%. This concentration was chosen as this is the
concentration of LPC used in mouse experiments and has shown the highest levels of gene transfer
when compared to other concentrations [218]. As the concentration of LPC was increased, the volume
delivered was decreased to 250 μL. The nebulisation of the LPC via the Aerogen nebuliser took 3
minutes to be totally delivered to the lungs. One hour post administration of the LPC the same volume
of LV-LacZ was delivered- 1 mL- however, the virus was made to a final concentration of 0.3% BSA as a

Chapter 9 - Development of aerosolised delivery of lentiviral vectors in vivo
233
means of protection for the virus during the nebulisation process. The nebulisation of the virus took 15
minutes, with the increased time likely due to the increased viscosity of the virus solution due to the
addition of the 0.3% BSA.
9.2.3 Rat ‘C’
The treatment given to rat three was identical to that given to rat ‘B’. However, testing of lung
mechanics was undertaken every 5 minutes post LPC delivery for the hour between LPC and LV-LacZ
delivery. It should also be noted that rat ‘C’ died 3 days post treatment.
9.2.4 Lung mechanics
The mechanics of the lung were measured prior to gene therapy treatment, following LPC delivery and
following LV-LacZ delivery to note the effects of treatment on the lungs.
Rn: Newtonian resistance, which is indicative of the resistance of the central airways
I: Inertance, which is indicative of the inertive properties of the gas in the airways, this is
generally close to 0 or slightly negative in intubated rats
G: Tissue damping, is closely related to tissue resistance and reflects the energy dissipation in the
lung tissue
H: Tissue elastance, which shows energy conservation in the lung tissues
Eta (η): Hysteresivity, represents the ratio of energy dissipation to energy conservation (G/H), an
increase in η shows a structural change in the lungs
COD: Coefficient of determination: a quality control parameter measuring the “fit” of the test model
(a value of 1.0 indicates a perfect fit of the model)

Chapter 9 - Development of aerosolised delivery of lentiviral vectors in vivo
234
PEEP: Positive End Expiratory Pressure, is the pressure applied when breathing out. This keeps the
lungs from collapsing while on ventilation. (The PEEP parameter is a set value at the beginning
of testing which is then measured when lung mechanics are measured)
The lung mechanics data from each of the three test rats is shown in the tables below (Table 9-1
through to Table 9-4).
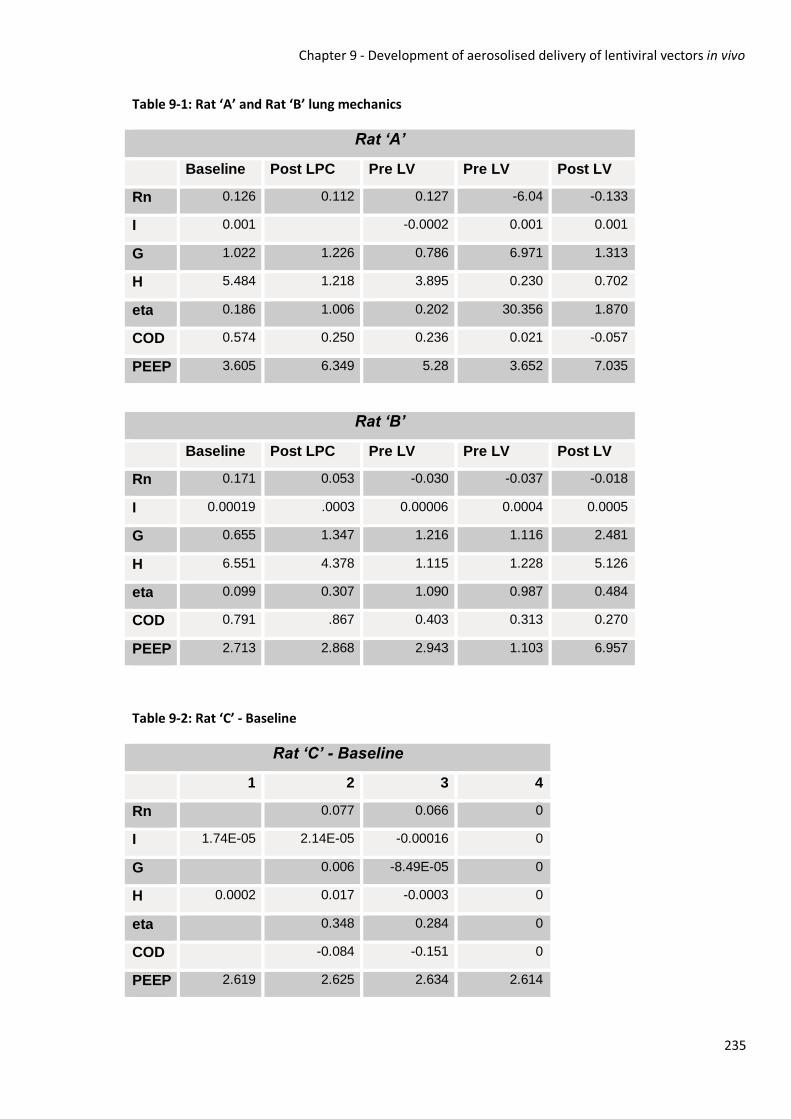
Chapter 9 - Development of aerosolised delivery of lentiviral vectors in vivo
235
Table 9-1: Rat ‘A’ and Rat ‘B’ lung mechanics
Rat ‘A’
Baseline Post LPC Pre LV Pre LV Post LV
Rn 0.126 0.112 0.127 -6.04 -0.133
I 0.001 ������ -0.0002 0.001 0.001
G 1.022 1.226 0.786 6.971 1.313
H 5.484 1.218 3.895 0.230 0.702
eta 0.186 1.006 0.202 30.356 1.870
COD 0.574 0.250 0.236 0.021 -0.057
PEEP 3.605 6.349 5.28 3.652 7.035
Rat ‘B’
Baseline Post LPC Pre LV Pre LV Post LV
Rn 0.171 0.053 -0.030 -0.037 -0.018
I 0.00019 �.0003 0.00006 0.0004 0.0005
G 0.655 1.347 1.216 1.116 2.481
H 6.551 4.378 1.115 1.228 5.126
eta 0.099 0.307 1.090 0.987 0.484
COD 0.791 .867 0.403 0.313 0.270
PEEP 2.713 2.868 2.943 1.103 6.957
Table 9-2: Rat ‘C’ - Baseline
Rat ‘C’ - Baseline
1 2 3 4
Rn 0.077 0.066 0
I 1.74E-05 2.14E-05 -0.00016 0
G 0.006 -8.49E-05 0
H 0.0002 0.017 -0.0003 0
eta 0.348 0.284 0
COD -0.084 -0.151 0
PEEP 2.619 2.625 2.634 2.614

Chapter 9 - Development of aerosolised delivery of lentiviral vectors in vivo
236
Table 9-3: Rat ‘C’ – Post LPC
Rat ‘C’ – Post LPC (Data points 1-14)
1 2 3 4 5 6 7 8 9 10 11 12 13 14
Rn 0.125 -24.78 0.105 0.115 0.089 -82.877 0.072 0.069 0.065 0.064 0.063 0.062 0.056 0.058
I 0.0003 0.0001 0.0003 0.0002 7.23E-05 1.93E-05 5.42E-05 5.97E-05 7.06E-05 7.38E-05 2.54E-05 6.48E-05 3.86E-05 2.48E-05
G 0.261 25.021 0.383 0.110 0.125 82.978 0.049 0.057 0.053 0.057 0.052 0.048 0.047 0.034
H 1.358 0.014 1.388 1.228 0.651 0.001 0.118 0.436 0.288 0.304 0.155 0.255 0.062 0.178
eta 0.192 1760.7 0.275 0.090 0.193 65812 0.416 0.130 0.184 0.189 0.338 0.188 0.761 0.195
COD 0.815 0.052 0.923 0.705 0.672 -0.068 0.149 0.424 0.281 0.298 0.142 0.203 0.047 0.046
PEEP 3.015 2.812 2.783 2.674 2.852 2.755 2.532 2.476 2.453 2.468 2.572 2.499 2.587 2.487
Rat ‘C’ – Post LPC (Data points 15-27)
15 16 17 18 19 20 21 22 23 24 25 26 27
Rn 0.057 0.053 -0.292 0.073 0.058 0.059 0.062 0.071 0.068 -0.045 0.072 0.418
I 2.57E-05 1.77E-06 2.30E-05 1.27E-05 1.64E-07 2.05E-05 1.83E-06 7.51E-06 1.01E-05 -4.50E-07 0.0001 4.08E-05 -1.10E-06
G 0.053 0.033 0.377 0.014 0.026 0.016 0.034 0.026 0.017 0.178 0.022 -0.339
H 0.142 0.084 0.004 0.067 0.001 0.122 0.01 0.059 0.105 0.099 0.022 0.165 -0.001
eta 0.373 0.392 830499 0.218 0.218 1.825 0.570 0.248 0.175 8.125 0.135 448.23
COD 0.113 -0.0485 -0.065 -0.125 -0.045 -0.119 -0.015 0.005 -0.023 0.220 0.098 -0.151
PEEP 2.55 2.517 2.528 2.59 2.55 2.63 2.625 2.557 2.657 2.662 2.630 2.569 2.591

Chapter 9 - Development of aerosolised delivery of lentiviral vectors in vivo
237
Table 9-4: Rat ‘C’ – Post LV-Lac Z delivery
Rat ‘C’ – Post LV-Lac Z delivery
1 2 3 4 5 6 7 8 9 10 11 12 13 14 15
Rn -4.712 0.018 0.070 -1.398 -26.291 0.033 0.039 0.074 0.078 0.077 0.074 0.081 0.073 0.074
I 2.76E-05 6.93E-05 3.64E-05 3.13E-05 3.10E-05 3.43E-05 1.59E-05 -4.10E-07 1.73E-05 1.82E-05 9.89E-06 5.12E-05 5.22E-05 1.53E-05 2.96E-05
G 4.808 0.071 0.012 1.481 26.375 0.052 0.042 0.006 0.008 0.010 0.042 0.029 0.022 0.023
H 0.003 0.006 0.164 0.002 0.002 0.004 0.002 -0.002 0.002 0.013 0.049 0.203 0.282 0.170 0.029
eta 1711.7 11.05 0.078 627.09 16444 12.586 21.847 2.575 0.640 0.216 0.208 0.104 0.131 0.795
COD -0.046 -0.049 0.056 -0.067 -0.085 -0.064 -0.109 -0.113 -0.092 -0.047 0.207 0.198 0.075 -0.008
PEEP 2.630 2.613 2.595 2.846 2.757 2.687 2.721 2.729 2.711 2.567 2.589 2.610 2.667 2.631 2.612

Chapter 9 - Development of aerosolised delivery of lentiviral vectors in vivo
238
The lung mechanics measured in each of the three rats cannot be considered reliable due to the “fit” of
the model measure being below the desired threshold of 0.9 (90% fit). In all of the three rats to
undergo this treatment, the initial measurement of the model fit was below the desired 0.9 value. A
series of baseline measurements once the rat has been ventilated for an amount of time and adjusted
to the anaesthesia and ventilation may be a better indication of the “fit” of the model. This was tested
for rat ‘c’, however COD values were quite different at each time point. The COD measurement may
also be low due to the rat trying to breathe against the Flexivent, or in the initial stages due to light
anaesthesia. The COD measurement is likely to reduce during the treatment protocol due to the
changes occurring in the lungs with the LPC and LV-LacZ volumes affecting the measurements being
taken during the ventilation process.
Lung mechanics from each rat were examined, however, as the COD- the fit of the model- prior to any
treatment is below 0.9 which is considered a “cut off” for using the data, the results of the lung
mechanics cannot be used with any confidence. Although the COD values are low, another important
value to look at is the η value, as an increasing value indicates structural changes and damage to the
lung tissue. Figure 9-1 shows graphically the η values measured prior to treatment, post LPC treatment
and post LV treatment. In all rats, an increase is seen following LPC pre-treatment, indicating that there
may be some structural damage to the lungs. It is however, interesting to note that there is a large
change in η for rat C post LV delivery. This large increase in η is indicative of damage to the lungs, and
may explain the unexpected death of this rat 2 days post treatment.

Chapter 9 - Development of aerosolised delivery of lentiviral vectors in vivo
239
Figure 9-1: Eta (η) measurements for Rats A-C
Eta measurements for all experimental Rats, with data points taken prior to
treatment and during the treatment process

Chapter 9 - Development of aerosolised delivery of lentiviral vectors in vivo
240
0
5
10
15
20
25
30
35
Baseline Post LPC Post LPC Post LPC Post LV
0
0.2
0.4
0.6
0.8
1
1.2
Baseline Post LPC Post LPC Post LPC Post LV
0
200
400
600
800
1000
1200
1400
Baseline Post LPC Post LV
Rat “A”: Eta
Rat “B”: Eta
Rat “C”: Eta

Chapter 9 - Development of aerosolised delivery of lentiviral vectors in vivo
241
9.2.5 Measurement of gene transfer
One week post treatment Rats were sacrificed with an overdose of pentothal (140 mg/kg). The trachea
was exposed via incision through the skin on the neck, and a small blunt needle was placed into the
trachea, facing toward the lungs. The needle was secured with a suture, and the needle connected to a
syringe containing 2% PFA/0.5% Glutaraldehyde. The fixative solution was allowed to run into the lungs
until they were inflated to near capacity. The fixative flow and needle were removed and the suture
used to seal the trachea and the fixed lungs. Lungs were then cut out from the chest cavity and placed
in a pot containing fixative solution. The lungs then underwent staining for LacZ as described in section
2.4.2.2, and were sectioned following incubation in 10% NBF. Lungs were sectioned as follows:
Figure 9-2: Diagramatic representation of rat lung dissection
LL= left lung, Cr= cranial lobe, M= median lobe, C= caudal lobe, A= accessory lobe. Rat lung was cut into
sections represented by the dotted lines.
The six gross lung sections were embedded in paraffin and 8 μm sections taken and stained with Saf O
for analysis of gene transfer.

Chapter 9 - Development of aerosolised delivery of lentiviral vectors in vivo
242
9.2.6 Analysis of Rat lung sections
Rat lung sections prior to embedding were observed under high power magnification. Initially it
appeared that gene transfer was present due to the large amount of blue staining in all treated lungs.
See Figure 9-3 a-h. Fine sections were observed under 400 x magnification for identification of cellular
level gene transfer. Gene transfer was not present in any sections of any levels of lung taken. There
were cells found in the thymus gland that appeared to stain the blue of the LacZ gene. These cells
however were identified as macrophages.
The thin sections of rat lung that were observed also showed areas of bronchitis or pneumonia. This is
likely caused by the volumes of fluid entering the lungs, which caused damage to the bronchioles in the
airway (see Figure 9-3 i-j).
As no gene transfer was seen in the Saf O sections, but there were what appeared to be distinct areas
of gene transfer in the gross lung sections, lungs from an untreated rat were removed and stained
using the protocol described earlier (section 2.4.2.2) and observed for background/non-specific
staining. It was interesting to observe what appeared to be distinct areas of gene transfer (areas of
blue staining-see Figure 9-3 g-h). When embedded and fine sections were cut, there was again no
evidence of LacZ staining in the lung. It appears that the rat lung, and in particular the thymus has
some endogenous LacZ activity-giving the lungs the appearance of gene transfer on gross section, but
when fine sections are taken, there is no evidence of what appeared to be these distinct areas of gene
transfer.
Rat “A” and “B” showed no gene transfer to be evident. Small amounts of damage were seen using
high magnification, which is not surprising as when lung mechanics were measured an increase in η
was seen following LPC delivery which is an indication of structural damage to the lungs.

Chapter 9 - Development of aerosolised delivery of lentiviral vectors in vivo
243
Rat “C” died unexpectedly 2 days following treatment. Although looking at the lung mechanics data
and in particular at the η data (showing structural damage) it is not surprising as this value increased
enormously following LV-LacZ delivery. En Face section showed what appeared to be widespread
destruction of the lung tissue, and following fine sectioning of the lungs, areas of bronchitis and
pneumonia were present, which likely contributed to the unexpected death of this rat.

Chapter 9 - Development of aerosolised delivery of lentiviral vectors in vivo
244
Figure 9-3: Gross and Histological Rat lung sections
a) Rat A, upper lung section, x 20 magnification
b) RatA, upper lung section, x 40 magnification
c) Rat B, upper lung section, x 20 magnification
d) Rat B, upper lung section, x 40 magnification
e) Rat A, lower left lung section, x 20 magnification
f) Rat A, lower right lung section, x 20 magnification
g) Control rat, lower right lung section, x 20 magnification
h) Control Rat, lower left lung section, x 20 magnification
i) Rat A, x 400 magnification, bronchitis indicated by the black arrow
j) Rat A, x 400 magnification, pneumonia indicated by the black arrow

Chapter 9 - Development of aerosolised delivery of lentiviral vectors in vivo
245
a) b)
c) d)

Chapter 9 - Development of aerosolised delivery of lentiviral vectors in vivo
246
e) f)
g) h)

Chapter 9 - Development of aerosolised delivery of lentiviral vectors in vivo
247
i)
j)

Chapter 9 - Development of aerosolised delivery of lentiviral vectors in vivo
248
9.2.7 Discussion and Conclusions
The aerosolisation of therapeutics into the lungs for direct delivery to the affected area in a disease
such as CF is the eventual aim for many therapies such as gene therapy. Currently aerosol therapy is
most commonly used to treat asthma and chronic obstructive pulmonary disease, and there are a large
number of medications used or in development for other diseases. The development of more efficient
aerosol delivery devices has allowed specific targeting of specific parts of the airways and lung. Efforts
in the use of aerosols as gene transfer agents have largely centred on complementary DNA transfer of
the CFTR gene in CF patients. For gene transfer to be effective as an aerosol, the vector and its package
must be stable to shear forces during aerosolisation [227].
In vitro tests were conducted to ensure the recovery of the virus post nebulisation, however, it may be
useful to conduct a similar in vitro experiment identical to the protocol used in vivo. It has been shown
that LPC reduces the stability of lentivirus following co-incubation. Following nebulisation of LPC, the
nebuliser needs to have all traces of LPC removed to ensure the viability of the virus for delivery into
the lungs. In vitro testing to determine good cleaning procedures is essential to ensure that the highest
amount of virus is being delivered to the lungs as possible.
The lungs when removed from treated rats were seen to be intact; however, there was injury to the
lung, likely caused by effects of the LPC. There appears to be a delicate balance between the
concentration and volume of LPC required to achieve gene transfer and the concentration and volume
required to cause damage to the epithelium. The local effect of LPC on opening tight junctions appears
too small for a gene transfer event; however, globally the effect of LPC is too high to be tolerated by
the rat. A series of titration experiments with LPC alone nebulised into the rat lung testing a series of
volumes and concentrations of LPC (0.1% and 0.3% as these concentrations have been shown to allow
gene transfer in mouse nasal airway gene therapy) and then examining for the effects on the lung.
Once the highest tolerated dose of LPC has been determined, an appropriate volume of concentrated

Chapter 9 - Development of aerosolised delivery of lentiviral vectors in vivo
249
LV-LacZ can be determined, and added into the treatment protocol, and lungs observed for gene
transfer. Time needs to be spent in a methodical determination of optimal concentrations and volumes
to achieve a high level of gene transfer. It would be useful to measure lung mechanics in the days post
treatment to ensure that lung function has returned to normal (baseline) values, also ensuring the
well-being of the rat post treatment.
This nebulisation approach to virus delivery may also need to be adapted to treat only a small portion
of the lung at a time, to reduce the impact on the whole lung. The use of lentiviral vectors pseudotyped
with an envelope targeting the apical surface of the epithelium, such as GP64 or filovirus, may also be
warranted to exclude the need for LPC pre-treatment as this may be the cause of the damage seen in
the treated lung sections.
The experiments conducted here were a small step towards the understanding of using lentivirus as an
aerosol in the lungs of rats. More investigation needs to be carried out to achieve gene transfer
without causing damage to the lungs.
Although these experiments did not show gene transfer in the lungs, it has developed a new technique
within the laboratory for the intubation of rats and their ventilation using the SCIREQ small animal
ventilator. More work should be continued into developing this gene therapy protocol using LPC and
lentivirus for the delivery of genes to the conducting airways, as this is the most effective and possibly
non-invasive method of delivering the therapeutic gene CFTR to CF patients with targeted delivery to
the direct area.

Chapter 10 - Concluding Remarks
250
10 Concluding Remarks

Chapter 10 - Concluding Remarks
251
The development of a gene therapy protocol for an inherited genetic disease such as Cystic Fibrosis is a
complex process with many processes that need to be considered. In the case of cystic fibrosis, it is
clear from previous work that the efficiency of gene transfer, and the resulting effects, are of primary
concern. One factor that will impact the response to gene therapy is the immune response initiated to
the gene delivery vector, in this study a Lentivirus, and whether this can be controlled to achieve better
outcomes. Another important aspect to consider is the level of gene expression required to achieve a
therapeutic outcome. The way in which the gene delivery vector is delivered to best target the affected
organs must also be considered, as well as developing the technology in an appropriate animal model
that represents the disease state while remaining robust enough to measure therapeutic outcomes for
a significant period of time. An appropriate method of measuring gene transfer outcomes is also
essential for critical analysis of the gene transfer process. This thesis has described work undertaken to
further study these areas to optimize and achieve the best therapeutic outcomes for gene therapy for
cystic fibrosis.
The body naturally initiates an immune response to foreign particles entering the body. This immune
response involves organelles including the proteasome and lysosome, which act to degrade foreign
proteins and eliminate them from the system. Proteasome and lysosome inhibitors Z-LLL, Doxorubicin
HCl and Bafilomycin A1 were tested for their ability to inhibit the proteasome response to the
introduction of foreign peptides- such as our lentiviral gene therapy. In all cases, topical application
was not found to be beneficial for gene transfer, and in reality caused damage to the nasal epithelium.
These results were not seen to be beneficial for our gene transfer protocol. When the inhibitors were
delivered via I.P injection prior to gene transfer, the level of gene transfer was not seen to increase
significantly compared to our standard gene transfer protocol. The use of proteasome inhibitors was
not pursued further as no beneficial effect was seen when investigated.

Chapter 10 - Concluding Remarks
252
As the studies described in this thesis used a HIV-1 derived lentivirus, an inhibitor of the innate
antiretroviral immune response- Leptomycin B- was tested for any beneficial effects it may have on
suppressing the immune response to our lentiviral vector. Initial testing showed a modest increase in
gene transfer when coupled with our gene transfer protocol utilizing a LacZ marker gene in a normal
mouse model. When transferred into a disease model results were not entirely replicated to what was
seen in the normal models, and mice treated with Leptomycin B did not show increased correction of
the CFTR defect when compared to mice that did not receive the Leptomycin B. Although it showed
initial promise for increasing the level of gene transfer achieved, when tested in the disease model, no
benefit of incorporating Leptomycin B was observed.
These results suggest that manipulating the immune response to increase the efficiency of gene
transfer in vivo is not feasible, despite the many in vitro studies that provided the intellectual basis for
this work, and that other means need to be considered. These could include improving pertinent
characteristics of the vector such as titre, specific infectivity, purity and dose. In addition, manipulation
of the acquired, rather than the innate, immune response to allow repeated dosing of vector may be
beneficial in terms of achieving the desired outcomes.
Another problem with the experimentation undertaken to investigate the manipulation of the immune
response to increase efficiency of gene transfer was the low levels of gene transfer observed in mice
treated with the standard gene therapy protocol. With low starting gene transfer efficiencies, this may
have impaired the feasibility of the studies (using proteasome and lysosome inhibitors and LMB)
performed.
To develop a gene therapy protocol for Cystic Fibrosis or any genetic disease, it is important for the
protocol to be tested on the best representative disease model, which for Cystic Fibrosis is a mouse
model. The mouse model used previously at the WCH was the CFTRtm1Unc knockout model in which
CFTR is knocked out. This CFTR knockout causes intestinal disease and so there is a requirement for the
mice to have a modified diet to reduce the effects of these intestinal problems. The mice are also

Chapter 10 - Concluding Remarks
253
noted to be less robust compared to normal mice which makes long term experimentation difficult-
particularly with repeated testing for CFTR correction via TPD at regular intervals which requires
multiple rounds of anesthesia. This led to a more robust model of the disease being sought and the
CFTRtm1Unc-Tg(FABPCFTR)1Jaw/J, which contains a knock-in of CFTR under control of the FABp promoter
to prevent gastrointestinal problems, was obtained. Other advantages of this mouse model are that
both female and male CFTR-knockout mice are fertile, which allows breeding of more affected mice
compared to the CFTRtm1Unc colony, which only allowed for breeding heterozygous females with
affected males, producing only 50% affected progeny. The work in this thesis allowed a colony of the
CFTRtm1Unc-Tg(FABPCFTR)1Jaw/J mice to be set up that was homozygous for both the CFTR knockout
and the FABP-CFTR knock-in, maximizing its productivity. It is hoped that this mouse colony will be
more robust and allow for long term experiments to be carried out for the life of the mice more easily-
which is crucial for developing a life long gene therapy cure for Cystic Fibrosis.
Antibodies to the CFTR gene for analysis of gene transfer in the disease model of cystic fibrosis have
been often hard to obtain. Problems with low specificity have also been apparent meaning it can be
difficult to get useful results with these reagents. This thesis described the development of aptamers to
the CFTR gene as a potential method of visualizing CFTR in treated mouse tissues. These aptamers hold
great potential in becoming tools for analyzing gene transfer, however, isolated aptamers require
further testing to ensure specificity and binding to the CFTR gene.
Real time PCR assays are also described in this thesis as a method of streamlining the process of
titering lentivirus with any transgene. The development of these assays allows more complex and
sophisticated virus mixtures to be used, containing multiple transgenes with the titre of each individual
virus being easily obtained using only one virus assay. This allows for more accurate and consistent
titering of viruses. The development of these assays is not only beneficial for determining virus titre,

Chapter 10 - Concluding Remarks
254
but can also be used for analysis of treated mouse tissues, with a reading of how many copies of the
delivered transgene have been incorporated into the treated cells.
Although it is clear from natural experiments (mild CF) that only low levels of CFTR expression in all
cells is sufficient to avoid severe disease in vivo, and that expression of normal or high levels of CFTR in
as few as 5-10% of cells in in vitro models is sufficient to correct the Cl- transport defect, it remains
unclear how the level of gene expression and the efficiency of gene transduction interact in vivo. The
ability to correct the electrophysiological defect in vivo with our vector system creates a unique
opportunity to assess this issue. This thesis compared 3 different strength promoters and their effects
on the level of correction of the CFTR defect observed. Unfortunately no definitive conclusions can be
drawn from this data as experiments in the disease model showed no significant difference in the level
of correction seen between the 3 different promoters. Testing in normal mice using marker genes
under control of the 3 test promoters successfully showed the different strength of each promoter
(Luciferase), and the cell type specificity (LacZ), but was not easily translated into the disease model.
These experiments should be repeated with vector preparations that result in sufficiently high levels of
gene transfer to achieve at least partial electrophysiological correction. In addition collection of blood
samples pre and post treatment would allow testing for immune responses to the transgenes used that
may influence the results obtained.
Finally, when treating a disease it is important to target the sites where disease is present. In cystic
fibrosis, the major target organ is the lung, as it is lung disease that ultimately causes morbidity and
mortality in cystic fibrosis patients. Aerosolisation of our gene therapy vector into the rat lung is
described in this thesis. The technique is still very early in development, however, this work describes a
significant starting point for a number of previously unknown methods in our laboratory, including the
intubation of the rat and ventilation using the SCIREQ flexivent. The delivery of pre-treatment and
lentivirus into the lungs using the Aerogen piezoelectric nebulizer was also developed. Further work to

Chapter 10 - Concluding Remarks
255
determine concentrations of the LPC pre-treatment and volumes of both pre-treatment and virus that
can be tolerated by the rat also need to be developed in order to begin larger studies to determine the
areas of the lung that are targeted to achieve high level gene expression. Again, these experiments
highlighted the complex issues raised by moving from model systems to more biologically relevant
models.
In conclusion, the use of lentiviral vectors as gene delivery agents is not a trivial process. Many aspects
of the gene delivery process need to be analysed to obtain the best distribution and level of expression
in the target organ. Robust disease models are required for analysis using the therapeutic gene, and
tools for analysis of this gene transfer are required. All of the issues described above need to be
carefully addressed to obtain the level of gene transfer required to allow this treatment to be
transferred to the clinic.