Cygnus Apr09
27
1 April 2009 Cygnus Business Consulting & Research Pvt. Ltd. 4 th & 5 th Floors, Astral Heights, Road No. 1, Banjara Hills, Hyderabad-500034, India Tel: +91-40-23430202-05, Fax: +91-40-23430201, E-mail: [email protected] Website: www.cygnusindia.com Disclaimer: All information contained in this report has been obtained from sources believed to be accurate by Cygnus Business Consulting & Research Pvt. Ltd. (Cygnus). While reasonable care has been taken in its preparation, Cygnus makes no representation or warranty, express or implied, as to the accuracy, timeliness or completeness of any such information. The information contained herein may be changed without notice. All information should be considered solely as statements of opinion and Cygnus will not be liable for any loss incurred by users from any use of the publication or contents QUARTERLY PERFORMANCE ANALYSIS OF COMPANIES (January - March 2009) INDIAN STEEL INDUSTRY
-
Upload
ruchi-n-sarda -
Category
Documents
-
view
247 -
download
7
description
Steel Industry
Transcript of Cygnus Apr09

1
April 2009
Cygnus Business Consulting & Research Pvt. Ltd. 4th & 5th Floors, Astral Heights, Road No. 1, Banjara Hills, Hyderabad-500034, India
Tel: +91-40-23430202-05, Fax: +91-40-23430201, E-mail: [email protected] Website: www.cygnusindia.com
Disclaimer: All information contained in this report has been obtained from sources believed to be accurate by Cygnus Business Consulting & Research Pvt. Ltd. (Cygnus). While reasonable care has been taken in its preparation, Cygnus makes no representation or warranty, express or implied, as to the accuracy, timeliness or completeness of any such information. The information contained herein may be changed without notice. All information should be considered solely as statements of opinion and Cygnus will not be liable for any loss incurred by users from any use of the publication or contents
QUARTERLY PERFORMANCE ANALYSIS OF COMPANIES
(January - March 2009)
INDIAN STEEL INDUSTRY

QPAC-Indian Steel Industry- January -March 2009
© Cygnus Business Consulting & Research Pvt. Ltd. 2009 2
EXECUTIVE SUMMARY ................................................................................................................................. 3
INDUSTRY ANALYSIS ..................................................................................................................................... 5
OUTLOOK FOR THE SECTOR..................................................................................................................... 7
INTER-FIRM COMPARISON ......................................................................................................................... 9
STOCKSCAN...................................................................................................................................................... 13
COMPANY ANALYSIS ................................................................................................................................... 16
1. BHUSHAN STEEL .................................................................................................................................. 16
2. HINDALCO............................................................................................................................................... 17
3. HINDUSTAN ZINC LTD...................................................................................................................... 18
4. ISPAT INDUSTRIES LIMITED........................................................................................................... 19
5. JINDAL STAINLESS LIMITED........................................................................................................... 20
6. JSW STEEL................................................................................................................................................. 21
7. MUKUND STEEL.................................................................................................................................... 22
8. TATA STEEL ............................................................................................................................................ 23
9. SAIL.............................................................................................................................................................. 24
10. USHA MARTIN...................................................................................................................................... 25
11. UTTAM GALVA STEELS LIMITED ............................................................................................... 26
SOURCES & METHODS FOR COMPANY PROJECTIONS ............................................................... 27
CONTENTS
QPAC-Indian Steel Industry- January -March 2009
© Cygnus Business Consulting & Research Pvt. Ltd. 2009 3
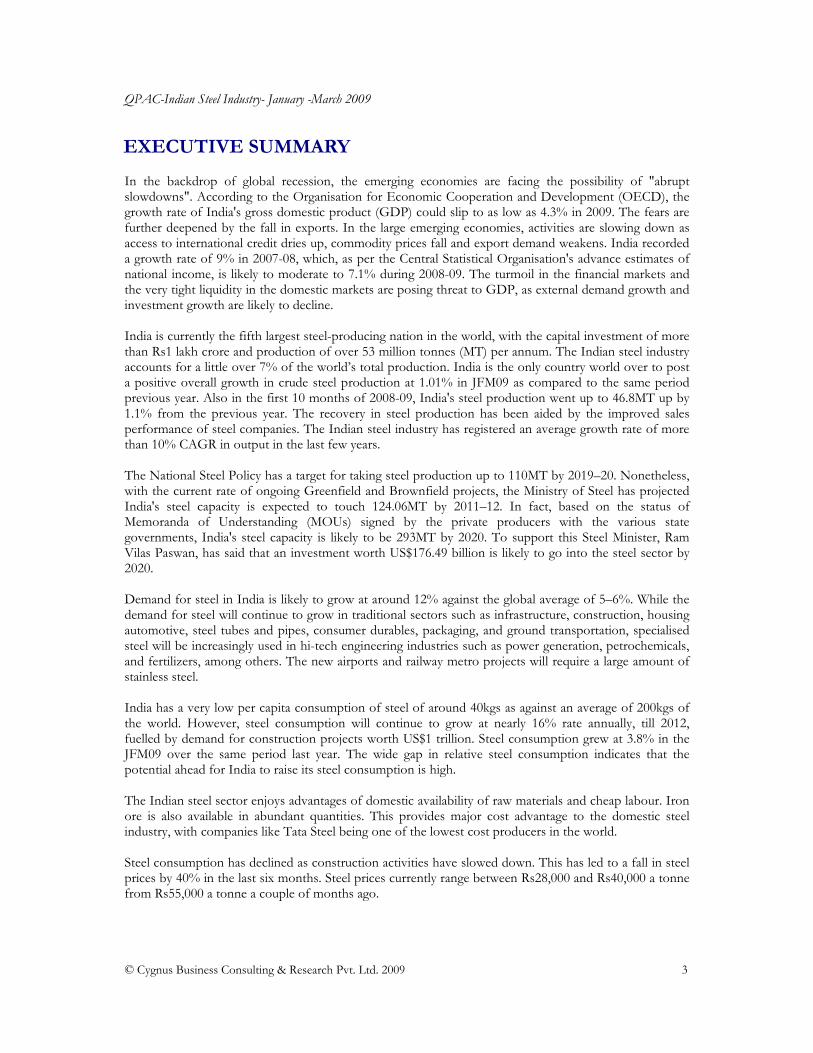
EXECUTIVE SUMMARY In the backdrop of global recession, the emerging economies are facing the possibility of "abrupt slowdowns". According to the Organisation for Economic Cooperation and Development (OECD), the growth rate of India's gross domestic product (GDP) could slip to as low as 4.3% in 2009. The fears are further deepened by the fall in exports. In the large emerging economies, activities are slowing down as access to international credit dries up, commodity prices fall and export demand weakens. India recorded a growth rate of 9% in 2007-08, which, as per the Central Statistical Organisation's advance estimates of national income, is likely to moderate to 7.1% during 2008-09. The turmoil in the financial markets and the very tight liquidity in the domestic markets are posing threat to GDP, as external demand growth and investment growth are likely to decline. India is currently the fifth largest steel-producing nation in the world, with the capital investment of more than Rs1 lakh crore and production of over 53 million tonnes (MT) per annum. The Indian steel industry accounts for a little over 7% of the world’s total production. India is the only country world over to post a positive overall growth in crude steel production at 1.01% in JFM09 as compared to the same period previous year. Also in the first 10 months of 2008-09, India's steel production went up to 46.8MT up by 1.1% from the previous year. The recovery in steel production has been aided by the improved sales performance of steel companies. The Indian steel industry has registered an average growth rate of more than 10% CAGR in output in the last few years. The National Steel Policy has a target for taking steel production up to 110MT by 2019–20. Nonetheless, with the current rate of ongoing Greenfield and Brownfield projects, the Ministry of Steel has projected India's steel capacity is expected to touch 124.06MT by 2011–12. In fact, based on the status of Memoranda of Understanding (MOUs) signed by the private producers with the various state governments, India's steel capacity is likely to be 293MT by 2020. To support this Steel Minister, Ram Vilas Paswan, has said that an investment worth US$176.49 billion is likely to go into the steel sector by 2020. Demand for steel in India is likely to grow at around 12% against the global average of 5–6%. While the demand for steel will continue to grow in traditional sectors such as infrastructure, construction, housing automotive, steel tubes and pipes, consumer durables, packaging, and ground transportation, specialised steel will be increasingly used in hi-tech engineering industries such as power generation, petrochemicals, and fertilizers, among others. The new airports and railway metro projects will require a large amount of stainless steel. India has a very low per capita consumption of steel of around 40kgs as against an average of 200kgs of the world. However, steel consumption will continue to grow at nearly 16% rate annually, till 2012, fuelled by demand for construction projects worth US$1 trillion. Steel consumption grew at 3.8% in the JFM09 over the same period last year. The wide gap in relative steel consumption indicates that the potential ahead for India to raise its steel consumption is high. The Indian steel sector enjoys advantages of domestic availability of raw materials and cheap labour. Iron ore is also available in abundant quantities. This provides major cost advantage to the domestic steel industry, with companies like Tata Steel being one of the lowest cost producers in the world. Steel consumption has declined as construction activities have slowed down. This has led to a fall in steel prices by 40% in the last six months. Steel prices currently range between Rs28,000 and Rs40,000 a tonne from Rs55,000 a tonne a couple of months ago.
QPAC-Indian Steel Industry- January -March 2009
© Cygnus Business Consulting & Research Pvt. Ltd. 2009 4
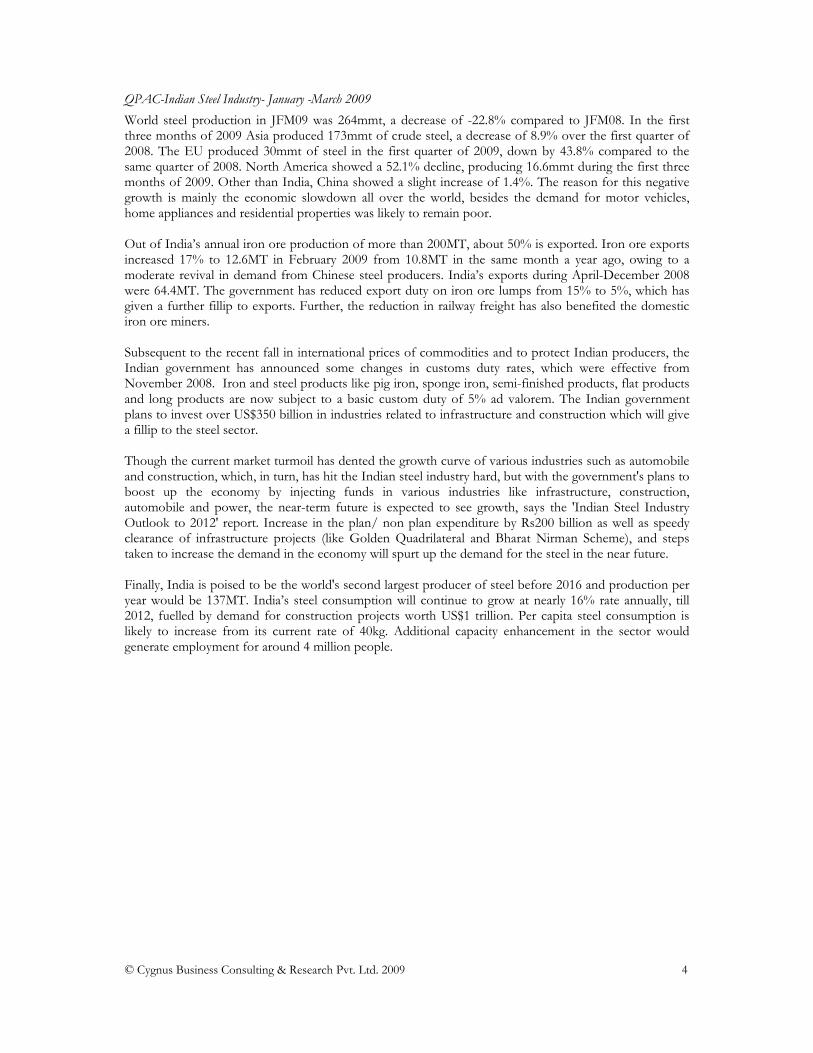
World steel production in JFM09 was 264mmt, a decrease of -22.8% compared to JFM08. In the first three months of 2009 Asia produced 173mmt of crude steel, a decrease of 8.9% over the first quarter of 2008. The EU produced 30mmt of steel in the first quarter of 2009, down by 43.8% compared to the same quarter of 2008. North America showed a 52.1% decline, producing 16.6mmt during the first three months of 2009. Other than India, China showed a slight increase of 1.4%. The reason for this negative growth is mainly the economic slowdown all over the world, besides the demand for motor vehicles, home appliances and residential properties was likely to remain poor. Out of India’s annual iron ore production of more than 200MT, about 50% is exported. Iron ore exports increased 17% to 12.6MT in February 2009 from 10.8MT in the same month a year ago, owing to a moderate revival in demand from Chinese steel producers. India’s exports during April-December 2008 were 64.4MT. The government has reduced export duty on iron ore lumps from 15% to 5%, which has given a further fillip to exports. Further, the reduction in railway freight has also benefited the domestic iron ore miners. Subsequent to the recent fall in international prices of commodities and to protect Indian producers, the Indian government has announced some changes in customs duty rates, which were effective from November 2008. Iron and steel products like pig iron, sponge iron, semi-finished products, flat products and long products are now subject to a basic custom duty of 5% ad valorem. The Indian government plans to invest over US$350 billion in industries related to infrastructure and construction which will give a fillip to the steel sector. Though the current market turmoil has dented the growth curve of various industries such as automobile and construction, which, in turn, has hit the Indian steel industry hard, but with the government's plans to boost up the economy by injecting funds in various industries like infrastructure, construction, automobile and power, the near-term future is expected to see growth, says the 'Indian Steel Industry Outlook to 2012' report. Increase in the plan/ non plan expenditure by Rs200 billion as well as speedy clearance of infrastructure projects (like Golden Quadrilateral and Bharat Nirman Scheme), and steps taken to increase the demand in the economy will spurt up the demand for the steel in the near future. Finally, India is poised to be the world's second largest producer of steel before 2016 and production per year would be 137MT. India’s steel consumption will continue to grow at nearly 16% rate annually, till 2012, fuelled by demand for construction projects worth US$1 trillion. Per capita steel consumption is likely to increase from its current rate of 40kg. Additional capacity enhancement in the sector would generate employment for around 4 million people.

QPAC-Indian Steel Industry- January -March 2009
© Cygnus Business Consulting & Research Pvt. Ltd. 2009 5
Net sales
330
360
390
JFM08 JFM09
Rs b
n
-20
-14
-8
-2
4
%
Sales (LHS)
% Growth (RHS)
EBITDA and OPM
75
85
95
105
JFM08 JFM09
Rs b
n
15
21
27
33
%
EBITDA (LHS)OPM (RHS)
Net profit and NPM
45
55
65
75
JFM08 JFM09
Rs b
n
10
14
18
%
Net profit (LHS)
NPM (RHS)
Source: BSE India, Cygnus Research
INDUSTRY ANALYSIS Introduction Today, consumption of steel is also regarded as an indicator of development of a nation. Per capita steel consumption is now universally accepted as an index of economic development of a nation. Given its role, steel has established itself as the backbone of India. Total world steel production was 1329.72mmt in the year 2008, a 1.08% decrease over the year 2007. Steel consumption has declined as construction activities have slowed down. This has led to fall in steel prices by 40% in the last six months. Steel prices currently range between Rs28,000 and Rs40,000 a tonne from Rs55,000 a tonne a couple of months ago. On the basis of the companies taken for projection, total steel industry sales for the quarter JFM09 is estimated at Rs338,240.40m. Growth drivers of steel include automobiles, construction, engineering and consumer durable industry. According to Cygnus, the industry’s EBITDA is estimated to have registered a negative growth of 20% and NPM a negative growth of 25% in JFM09. Note: The industry aggregate consists of the following companies- Tata Steel, Bhushan Steel, Hindalco Industries Ltd, Uttam Galva Steels, Hindustan Copper, Hindustan Zinc, Jindal Steel & Power, Jindal Saw, Jindal Stainless, JSW Steel, Kalyani Steel, Kirloskar Ferrous, Lloyd Steel, Maharashtra, Seamless, Maharashtra Ugine, Man Industries, Monnet Ispat, Mukand Ltd, NALCO, Navbharat Ventures, PSL, Sesa Goa, Shree Pre Coated Steels, SAIL, Sterlite Industries, Texmaco, Usha Martin, Uttam Galva, and Vesuvius India & Welspun Gujarat.
Industry Aggregate for JFM09
Particulars Rs m
Net sales 338240.40 Change -12%EBITDA 81700.96 Change -20%Depreciation 15836.70 Interest 13581.54 Other income 10723.63 PBT 62177.04 Tax 13015.12 Effective tax rate 21%PAT 49161.91 Change -25%Market cap 938650.30Source: Cygnus Research
QPAC-Indian Steel Industry- January -March 2009
© Cygnus Business Consulting & Research Pvt. Ltd. 2009 6
Cost Structure
-10
0
10
20
30
40
50
(Inc)
/dec
inst
ock
in
trade
Consu
mption
of
raw
mate
rials
Consu
mption
of
store
s &
spare
s
Freig
ht
and
handlin
g
Sta
ff c
ost
Pow
er
& F
uel
Oth
er
expenditure
Depre
ciation
Inte
rest
Tax
% o
f N
et
sale
s
JFM 2009
JFM 2008
Source: BSE India, Cygnus Research
Production & Capacity utilisation of Crude Steel
4.2
4.4
4.6
4.8
5.0
Jan-09 Feb-09 Mar-09
MT
82
90
98
106
%
production
capacity utilisation
Source: JPC India Steel, Cygnus Research
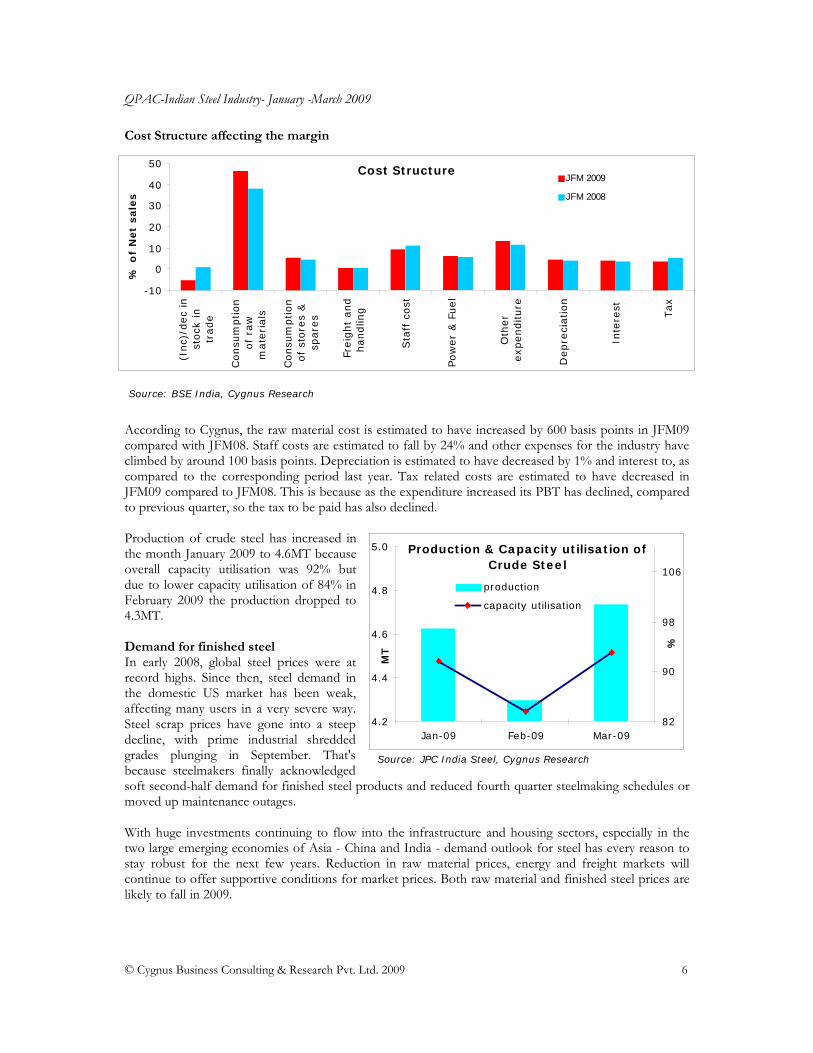
Cost Structure affecting the margin
According to Cygnus, the raw material cost is estimated to have increased by 600 basis points in JFM09 compared with JFM08. Staff costs are estimated to fall by 24% and other expenses for the industry have climbed by around 100 basis points. Depreciation is estimated to have decreased by 1% and interest to, as compared to the corresponding period last year. Tax related costs are estimated to have decreased in JFM09 compared to JFM08. This is because as the expenditure increased its PBT has declined, compared to previous quarter, so the tax to be paid has also declined. Production of crude steel has increased in the month January 2009 to 4.6MT because overall capacity utilisation was 92% but due to lower capacity utilisation of 84% in February 2009 the production dropped to 4.3MT. Demand for finished steel In early 2008, global steel prices were at record highs. Since then, steel demand in the domestic US market has been weak, affecting many users in a very severe way. Steel scrap prices have gone into a steep decline, with prime industrial shredded grades plunging in September. That's because steelmakers finally acknowledged soft second-half demand for finished steel products and reduced fourth quarter steelmaking schedules or moved up maintenance outages. With huge investments continuing to flow into the infrastructure and housing sectors, especially in the two large emerging economies of Asia - China and India - demand outlook for steel has every reason to stay robust for the next few years. Reduction in raw material prices, energy and freight markets will continue to offer supportive conditions for market prices. Both raw material and finished steel prices are likely to fall in 2009.
QPAC-Indian Steel Industry- January -March 2009
© Cygnus Business Consulting & Research Pvt. Ltd. 2009 7
Demand for Indian iron ore India’s annual iron ore production, a key input in steel making, is more than 200m tonnes, of which about 50% is exported. On the back of rising demand from China, the country's iron ore exports jumped 39% to 13.6mtonnes in December, 2008 against 9.8m tonnes in the same month a year ago. India has emerged as the third largest exporter of iron ore, after Brazil and Australia. The Indian steel industry, predicted by some experts, would rise to 120m tonnes by 2020. However, market economics and free trade suggest Indian iron ore companies should take advantage of having a scarce commodity, the world is happy to buy. As the demand for iron ore in the international market is increasing, the top two iron ore rich states in the country, Orissa and Karnataka (having 17% and 38% reserves), are planning to carry out a re-assessment of the reserves. India to be a significant player in the world steel industry For overseas steel companies, South Asian countries are full of allurements. Abundant iron ore resources and a steel consuming market on the edge of explosion are tempting for international steel firms. Along with China, India is undertaking large-scale urban construction, and the demand for steel products is huge. Many Indian steel industry professionals believe that India’s domestic demand will rival China’s in five to ten years due to its fast growth. India is all set to become a world-leading steel market. Steel consumption in India will not be as large as China’s but India will be a significant player in the world steel industry in future. In the past ten years, India’s steel demand has grown 7.8% annually, and is expected to rise to 9% within 10 years. India Steel Alliance also predicts that India’s average annual GDP growth will reach 8% and the demand for crude steel will grow by 125% between 2006 and 2020. However, India still needs to build up its processing and smelting industry to complete its steel industry chain. At present, it has only two major steel makers: Tata Group and SAIL. The steel plant Sinosteel is in the process of becoming an important force in the industry. India is rich in raw mining resources. According to 2007 figures, with 80% of its exported iron ore sold to China, India is China’s third largest source, next only to Australia and Brazil. But with the prices rising and production costs going up, the world’s steel giants seek to control the raw material supply. India steel makers are appealing to the government to restrain iron ore exports. India is facing a steel boom and the domestic ore demand may skyrocket by 100% by around 2011. OUTLOOK FOR THE SECTOR India is a reputed name in the world steel industry and the country’s steel industry is catching up the pace and luring the steel majors from all over the world. The industry has gained strength from the strong Indian economy, and strong sectors like infrastructure, construction and automobile. However, the current market turmoil has dented the growth curve of various industries such as automobile and construction, which, in turn, has hit the Indian steel industry hard. But with the government plans to boost up the economy by injecting funds in various industries like infrastructure, construction, automobile and power, the growth is definite. The outlook for Indian steel industry is very bright. India's lower wages and favourable energy prices will continue to promise substantial cost advantages compared to production facilities in (Western) Europe or the US. It is also expected that steel industry will undergo a process of consolidation since industry players are engaged in an unfettered rush for scale. This is evident from the recent acquisition of Corus by Tata. The deployment of modern production systems is also enabling Indian steel companies to improve the quality of their steel products and thus enhance their export prospects. High investment is expected in steel consuming industries, including automotive, aerospace and marine, power, telecom and railways, which will further boost up the Indian steel industry. Although India consumes less steel as compared to other Asian countries, it was ranked the Fifth major crude steel producer in the world in 2008.
QPAC-Indian Steel Industry- January -March 2009
© Cygnus Business Consulting & Research Pvt. Ltd. 2009 8
Though the prices of metals seem to have bottomed out, the demand is still on the wane owing to global financial crunch, coupled with slowdown in auto and construction sector. The demand is likely to pick up in the second half of the year 2009, as the gap between demand-supply will narrow down owing to production cut of up to 35% across the world. The prices of most of the metals are hovering around their marginal cost of production. However, with declining input prices, marginal cost is also expected to come down by 10%-20%. Further, the government’s initiative to increase public spending and provide sops to the industry may boost the demand for the commodities. In line with this, the Indian Government on January 2, 2009, withdrew the re-imposed 10% Countervailing Duty (CVD) on imports of long steel products -TMT bars and structurals. It also withdrew exemptions on customs duty on imported zinc and ferro alloys. The move is likely to benefit Indian steel producers, by reducing the gap between landed imported price and domestic price, which are witnessing high inventories and cheap dumping. With the exemptions withdrawn on customs duty on zinc and ferro alloys, importers will now have to pay 5% customs duty on import of zinc and ferro alloys. This would help domestic zinc and ferrochrome prices remain firm and boost demand to some extent. The per capita consumption for most metals in India and China are still well below the developed markets, which will keep long-term demand for metals intact. Growing population, increasing income levels, low penetration for electricity, telecom, and drinking water are some of the factors in India, which are likely to drive huge investments in infrastructure and consequently could fuel demand for metals. .
QPAC-Indian Steel Industry- January -March 2009
© Cygnus Business Consulting & Research Pvt. Ltd. 2009 9
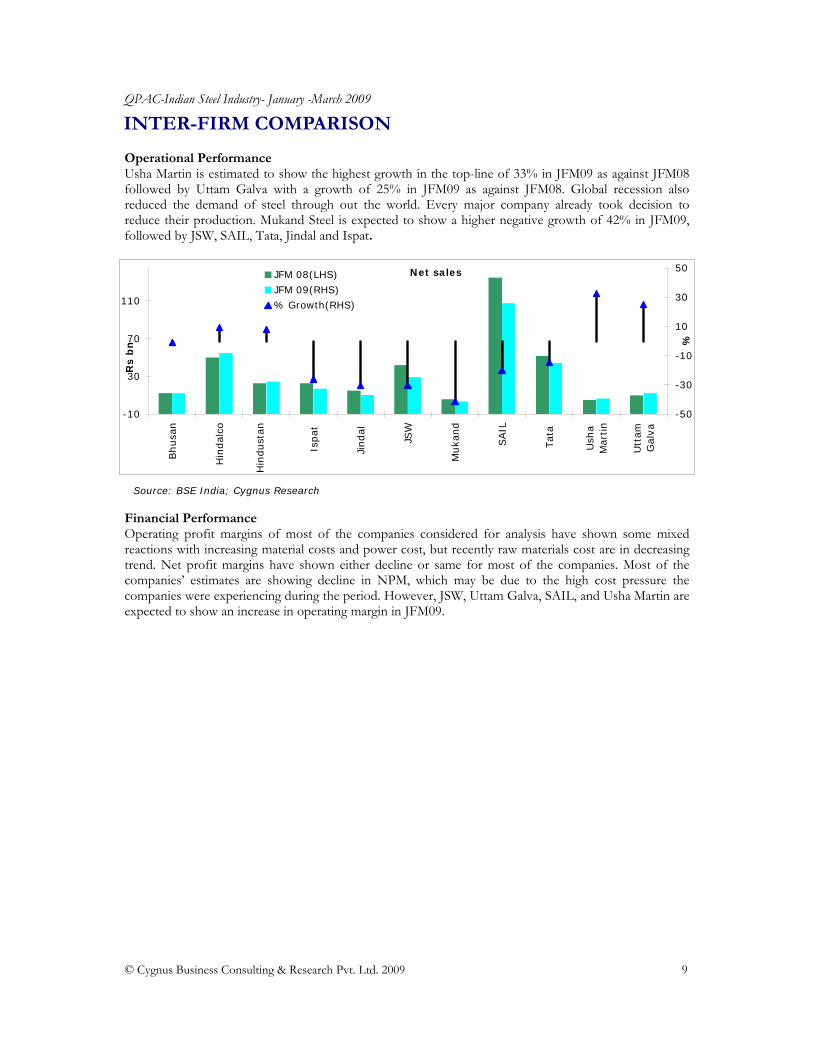
INTER-FIRM COMPARISON Operational Performance Usha Martin is estimated to show the highest growth in the top-line of 33% in JFM09 as against JFM08 followed by Uttam Galva with a growth of 25% in JFM09 as against JFM08. Global recession also reduced the demand of steel through out the world. Every major company already took decision to reduce their production. Mukand Steel is expected to show a higher negative growth of 42% in JFM09, followed by JSW, SAIL, Tata, Jindal and Ispat.
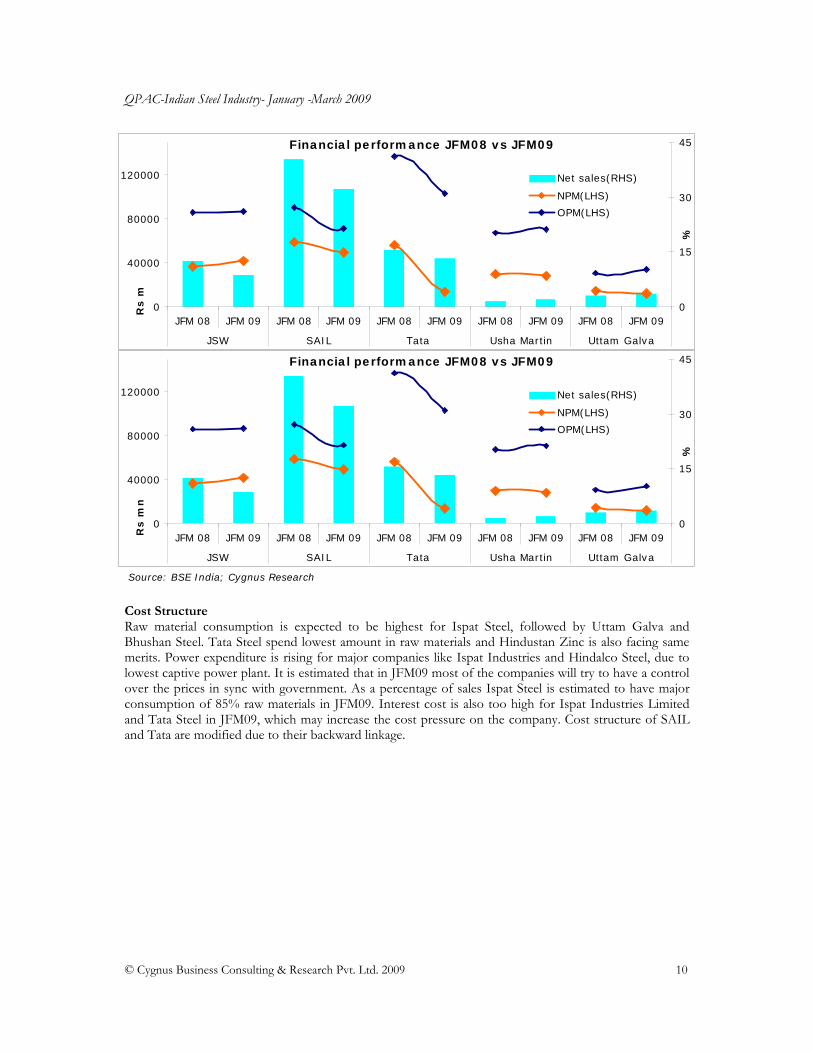
Financial Performance Operating profit margins of most of the companies considered for analysis have shown some mixed reactions with increasing material costs and power cost, but recently raw materials cost are in decreasing trend. Net profit margins have shown either decline or same for most of the companies. Most of the companies’ estimates are showing decline in NPM, which may be due to the high cost pressure the companies were experiencing during the period. However, JSW, Uttam Galva, SAIL, and Usha Martin are expected to show an increase in operating margin in JFM09.
Net sales
-10
30
70
110
Bhusa
n
Hin
dal
co
Hin
dust
an
Ispat
Jindal
JSW
Muka
nd
SAIL
Tat
a
Ush
aM
artin
Utt
amG
alva
Rs
bn
-50
-30
-10
10
30
50
%
JFM 08(LHS)
JFM 09(RHS)
% Growth(RHS)
Source: BSE India; Cygnus Research
QPAC-Indian Steel Industry- January -March 2009
© Cygnus Business Consulting & Research Pvt. Ltd. 2009 10
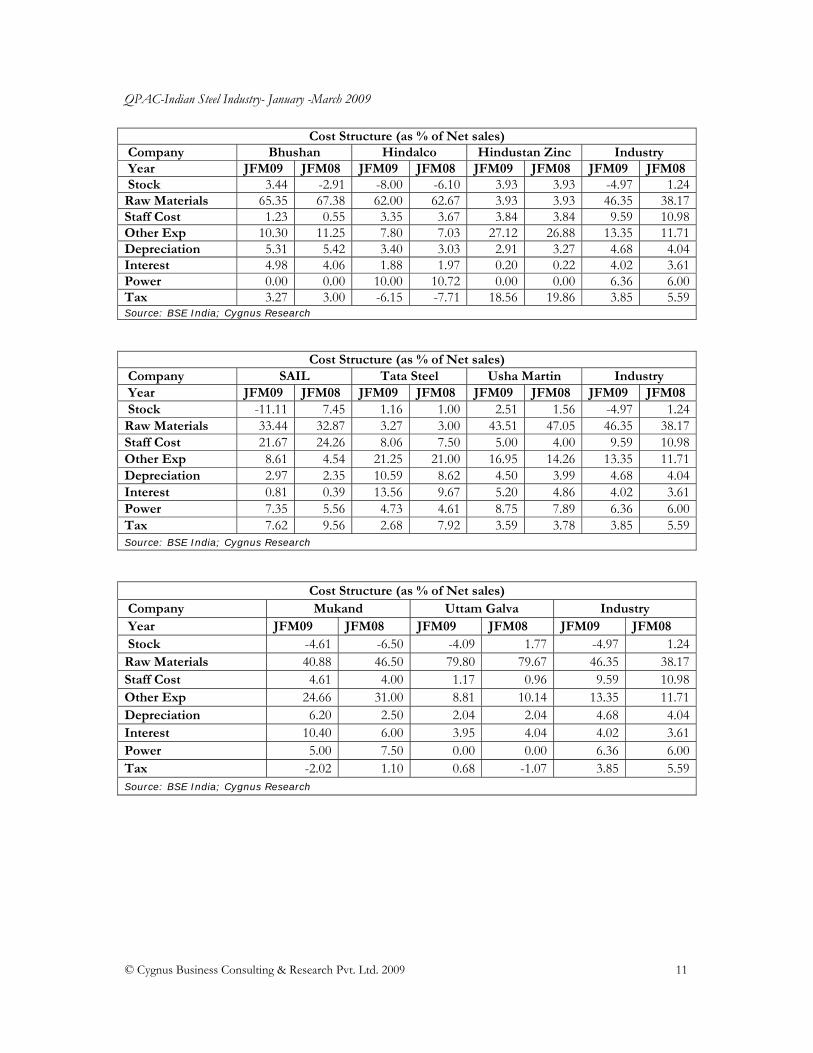
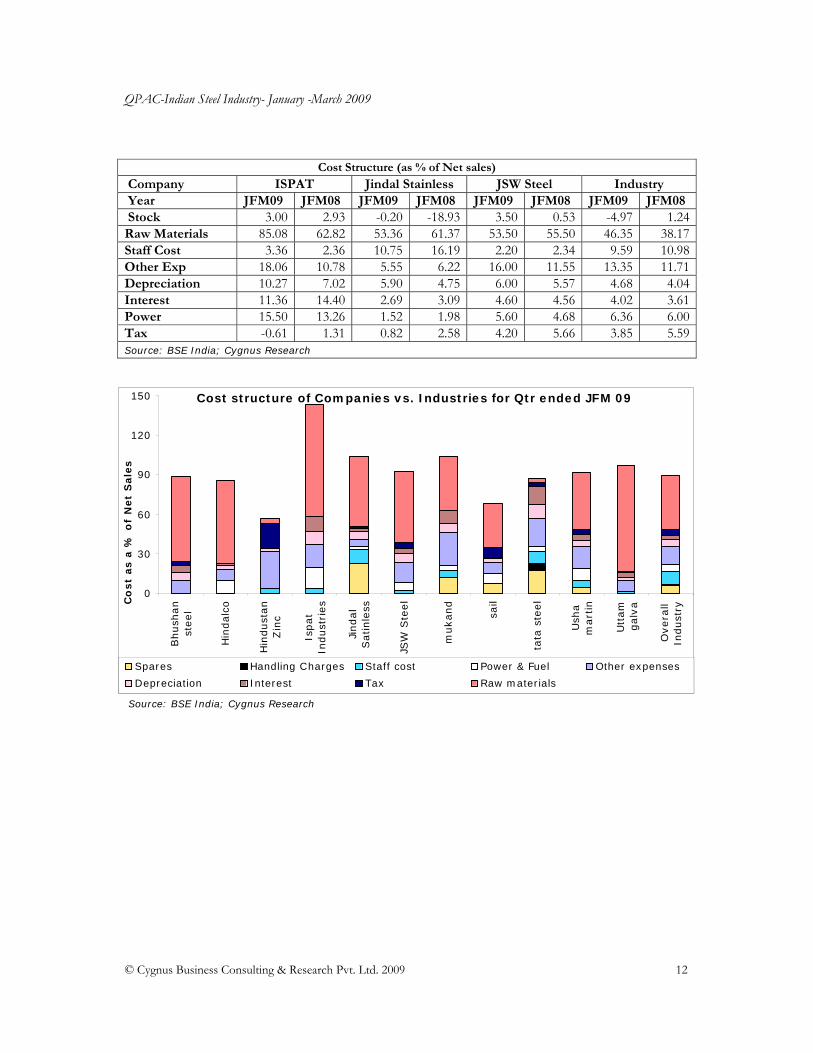
Cost Structure Raw material consumption is expected to be highest for Ispat Steel, followed by Uttam Galva and Bhushan Steel. Tata Steel spend lowest amount in raw materials and Hindustan Zinc is also facing same merits. Power expenditure is rising for major companies like Ispat Industries and Hindalco Steel, due to lowest captive power plant. It is estimated that in JFM09 most of the companies will try to have a control over the prices in sync with government. As a percentage of sales Ispat Steel is estimated to have major consumption of 85% raw materials in JFM09. Interest cost is also too high for Ispat Industries Limited and Tata Steel in JFM09, which may increase the cost pressure on the company. Cost structure of SAIL and Tata are modified due to their backward linkage.
Financial performance JFM08 vs JFM09
0
40000
80000
120000
JFM 08 JFM 09 JFM 08 JFM 09 JFM 08 JFM 09 JFM 08 JFM 09 JFM 08 JFM 09
JSW SAIL Tata Usha Martin Uttam Galva
Rs m
0
15
30
45
%
Net sales(RHS)
NPM(LHS)
OPM(LHS)
Financial performance JFM08 vs JFM09
0
40000
80000
120000
JFM 08 JFM 09 JFM 08 JFM 09 JFM 08 JFM 09 JFM 08 JFM 09 JFM 08 JFM 09
JSW SAIL Tata Usha Martin Uttam Galva
Rs m
n
0
15
30
45
%
Net sales(RHS)
NPM(LHS)
OPM(LHS)
Source: BSE India; Cygnus Research
QPAC-Indian Steel Industry- January -March 2009
© Cygnus Business Consulting & Research Pvt. Ltd. 2009 11
Cost Structure (as % of Net sales) Company Bhushan Hindalco Hindustan Zinc Industry Year JFM09 JFM08 JFM09 JFM08 JFM09 JFM08 JFM09 JFM08 Stock 3.44 -2.91 -8.00 -6.10 3.93 3.93 -4.97 1.24Raw Materials 65.35 67.38 62.00 62.67 3.93 3.93 46.35 38.17Staff Cost 1.23 0.55 3.35 3.67 3.84 3.84 9.59 10.98Other Exp 10.30 11.25 7.80 7.03 27.12 26.88 13.35 11.71Depreciation 5.31 5.42 3.40 3.03 2.91 3.27 4.68 4.04Interest 4.98 4.06 1.88 1.97 0.20 0.22 4.02 3.61Power 0.00 0.00 10.00 10.72 0.00 0.00 6.36 6.00Tax 3.27 3.00 -6.15 -7.71 18.56 19.86 3.85 5.59Source: BSE India; Cygnus Research
Cost Structure (as % of Net sales) Company SAIL Tata Steel Usha Martin Industry Year JFM09 JFM08 JFM09 JFM08 JFM09 JFM08 JFM09 JFM08 Stock -11.11 7.45 1.16 1.00 2.51 1.56 -4.97 1.24Raw Materials 33.44 32.87 3.27 3.00 43.51 47.05 46.35 38.17Staff Cost 21.67 24.26 8.06 7.50 5.00 4.00 9.59 10.98Other Exp 8.61 4.54 21.25 21.00 16.95 14.26 13.35 11.71Depreciation 2.97 2.35 10.59 8.62 4.50 3.99 4.68 4.04Interest 0.81 0.39 13.56 9.67 5.20 4.86 4.02 3.61Power 7.35 5.56 4.73 4.61 8.75 7.89 6.36 6.00Tax 7.62 9.56 2.68 7.92 3.59 3.78 3.85 5.59Source: BSE India; Cygnus Research
Cost Structure (as % of Net sales) Company Mukand Uttam Galva Industry Year JFM09 JFM08 JFM09 JFM08 JFM09 JFM08 Stock -4.61 -6.50 -4.09 1.77 -4.97 1.24Raw Materials 40.88 46.50 79.80 79.67 46.35 38.17Staff Cost 4.61 4.00 1.17 0.96 9.59 10.98Other Exp 24.66 31.00 8.81 10.14 13.35 11.71Depreciation 6.20 2.50 2.04 2.04 4.68 4.04Interest 10.40 6.00 3.95 4.04 4.02 3.61Power 5.00 7.50 0.00 0.00 6.36 6.00Tax -2.02 1.10 0.68 -1.07 3.85 5.59Source: BSE India; Cygnus Research
QPAC-Indian Steel Industry- January -March 2009
© Cygnus Business Consulting & Research Pvt. Ltd. 2009 12
Cost Structure (as % of Net sales) Company ISPAT Jindal Stainless JSW Steel Industry Year JFM09 JFM08 JFM09 JFM08 JFM09 JFM08 JFM09 JFM08 Stock 3.00 2.93 -0.20 -18.93 3.50 0.53 -4.97 1.24Raw Materials 85.08 62.82 53.36 61.37 53.50 55.50 46.35 38.17Staff Cost 3.36 2.36 10.75 16.19 2.20 2.34 9.59 10.98Other Exp 18.06 10.78 5.55 6.22 16.00 11.55 13.35 11.71Depreciation 10.27 7.02 5.90 4.75 6.00 5.57 4.68 4.04Interest 11.36 14.40 2.69 3.09 4.60 4.56 4.02 3.61Power 15.50 13.26 1.52 1.98 5.60 4.68 6.36 6.00Tax -0.61 1.31 0.82 2.58 4.20 5.66 3.85 5.59Source: BSE India; Cygnus Research
Cost structure of Companies vs. Industries for Qtr ended JFM 09
0
30
60
90
120
150
Bhush
an
steel
Hin
dalc
o
Hin
dust
an
Zin
c
Ispat
Indust
ries
Jindal
Satinle
ss
JSW
Ste
el
mukand
sail
tata
ste
el
Ush
am
art
in
Utt
am
galv
a
Overa
llIn
dust
ry
Co
st
as a
% o
f N
et
Sale
s
Spares Handling Charges Staff cost Power & Fuel Other expenses
Depreciation Interest Tax Raw materials
Source: BSE India; Cygnus Research
QPAC-Indian Steel Industry- January -March 2009
© Cygnus Business Consulting & Research Pvt. Ltd. 2009 13
STOCKSCAN
Relative Market Cap performance
65
75
85
95
105
115
1-J
an
4-J
an
7-J
an
10-J
an
13-J
an
16-J
an
19-J
an
22-J
an
25-J
an
28-J
an
31-J
an
3-F
eb
6-F
eb
9-F
eb
12-F
eb
15-F
eb
18-F
eb
21-F
eb
24-F
eb
27-F
eb
2-M
ar
5-M
ar
8-M
ar
11-M
ar
14-M
ar
17-M
ar
20-M
ar
23-M
ar
26-M
ar
29-M
ar
BSE SensexBSE MetalBhushanHindalco
Relative Market Cap performance
70
90
110
130
1-J
an
4-J
an
7-J
an
10-J
an
13-J
an
16-J
an
19-J
an
22-J
an
25-J
an
28-J
an
31-J
an
3-F
eb
6-F
eb
9-F
eb
12-F
eb
15-F
eb
18-F
eb
21-F
eb
24-F
eb
27-F
eb
2-M
ar
5-M
ar
8-M
ar
11-M
ar
14-M
ar
17-M
ar
20-M
ar
23-M
ar
26-M
ar
29-M
ar
BSE Sensex HindustanIspat JindalBSE Metal
Relative Market Cap performance
60
80
100
120
140
1-J
an
4-J
an
7-J
an
10-J
an
13-J
an
16-J
an
19-J
an
22-J
an
25-J
an
28-J
an
31-J
an
3-F
eb
6-F
eb
9-F
eb
12-F
eb
15-F
eb
18-F
eb
21-F
eb
24-F
eb
27-F
eb
2-M
ar
5-M
ar
8-M
ar
11-M
ar
14-M
ar
17-M
ar
20-M
ar
23-M
ar
26-M
ar
29-M
ar
BSE MetalBSESensexUshamartinUttam GalvaMukhand
Relative Market Cap performance
60
80
100
120
1-J
an
4-J
an
7-J
an
10-J
an
13-J
an
16-J
an
19-J
an
22-J
an
25-J
an
28-J
an
31-J
an
3-F
eb
6-F
eb
9-F
eb
12-F
eb
15-F
eb
18-F
eb
21-F
eb
24-F
eb
27-F
eb
2-M
ar
5-M
ar
8-M
ar
11-M
ar
14-M
ar
17-M
ar
20-M
ar
23-M
ar
26-M
ar
29-M
ar
BSE Sensex JSWSAIL Tata steelBSE Metal
Source: BSE India, Cygnus Research

QPAC-Indian Steel Industry- January -March 2009
© Cygnus Business Consulting & Research Pvt. Ltd. 2009 14
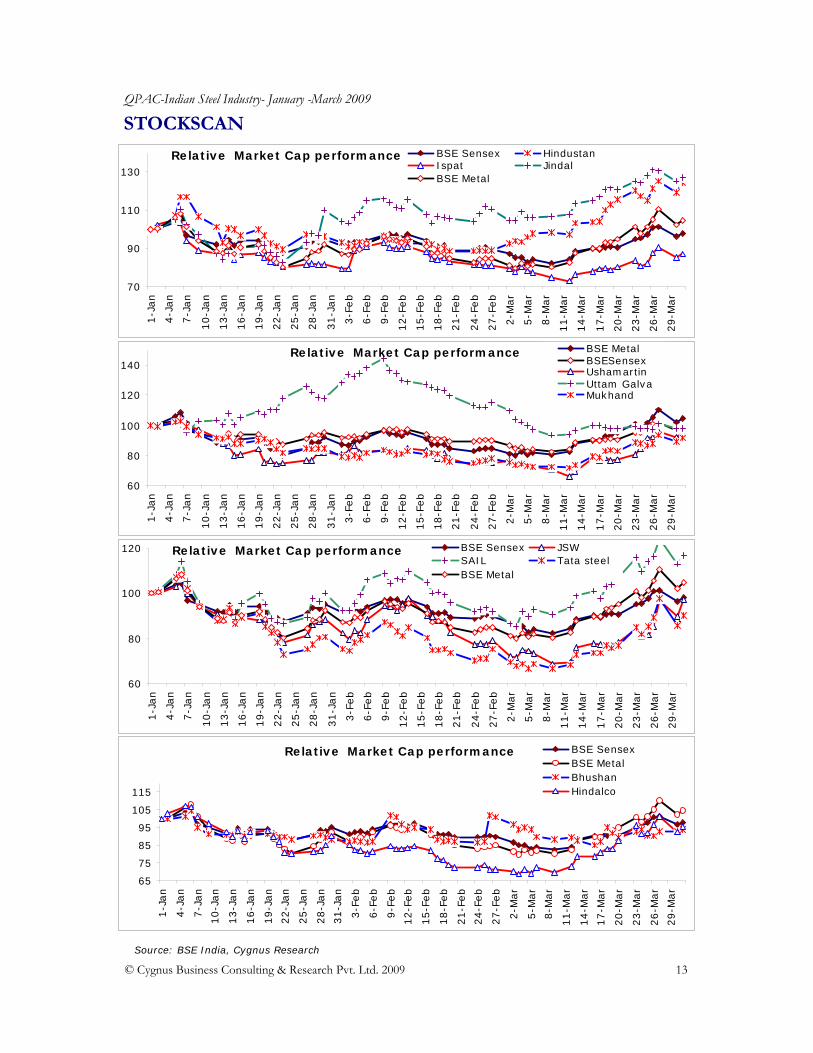
BSE Sensex: The BSE Sensex witnessed a marginal fall of 12 points in JFM09 quarter. The Sensex dropped to 9,708.50 points on March 31, 2009 from 9,720.55 points on January 1, 2009. In January and February 2009, the Sensex declined by 3.1% and 5% respectively, but registered a growth of 9.7% in March. Sectors like capital goods, automobiles, heavyweights and metals helped the Sensex surge in March. BSE Metal: The baton of robust financial performance is expected to be passed on to the steel companies driven by strong volume growth and supported by firm prices despite a rising rupee. During JFM09 the metal index grew by 4.82% from 5528.38 points on January 01, 2009 to reach 5795.07 points on March 31, 2009. The market meltdown has hit the metal stocks very hard. Hindalco: Share price of the company decreased by 4.29% from Rs54.2 in January 2009 to Rs51.90 at the end of March 2009. The company is planning to acquire copper mines. It is eyeing developing countries like South America, Colombia, Peru or Argentina for the purchase of mines. Ispat: Share price of Ispat declined by 13.06% from Rs12.48 in January 2009 to Rs10.85 at the end of March 2009. It entered into a MoU with MP Trade & Investment Facilitation Corp upon allotment of coal block. It also formed a joint venture with UK-based Stemcor to set a coke plant at an investment of Rs9 billion. SAIL: Share price of SAIL rose by 16.56% from Rs82.75 in January 2009 to Rs96.45 at the end of March 2009. It has placed orders for modernisation and expansion of IISCO and Salem Steel Plant. Tata Steel: Share price of Tata Steel decreased by 9.95% from Rs228.75 in January 2009 to Rs206 at the end of March 2009. It signed a MoU with Vietnam Steel Corporation for the proposed cold rolling mill in Vietnam, and also joined hands with SAIL for coal mining. Usha Martin: Share price of the company decreased by 4.7% from Rs28.75 in January 2009 to Rs27.40 at the end of March 2009. Usha Martin has manufacturing facilities at Ranchi, Jamshedpur, Hoshiarpur, UK, Thailand, UAE and USA. It has created a worldwide distribution, service and marketing network spread across the US, UK, Europe, Africa, the Middle East, South East Asia and Australia. Mukand: Share price of the company decreased by 8.45% from Rs24.95 in January 2009 to Rs22.85 at the end of March 2009. Mukand Ltd has signed a joint venture agreement with Vini Iron & Steel Udyog Ltd for captive mining of coal block in the state of Jharkhand as per the letter for allocation of coal block issued by Government of India, Ministry of Coal. Uttam Galva: Share price of the company decreased by 1.9% from Rs28.95 in January 2009 to Rs28.4 at the end of March 2009. The company has signed a Memorandum of Understanding (MoU) with Government of Maharashtra for setting up a project to manufacture half a million tonnes of pig iron. The plant located at Wardha, Maharashtra will see an investment of Rs10.96 billion.
Stock Market Performance Company Change (%) P/E HighBSE Sensex -1.97 12.98BSE Metal 4.82 Bhushan 22.07 4.45Hindalco -4.29 4.11Hindustan Zinc 24.49 4.68Ispat Industries -13.06 58.71Jindal Stainless 27.43 16.54JSW -2.65 3.16Mukand -8.45 4.44SAIL 16.56 6.15Tata Steel -9.95 4.68Usha Martin -4.70 6.48Uttam Galva -1.90 4.15Source: BSE; Cygnus Research

QPAC-Indian Steel Industry- January -March 2009
© Cygnus Business Consulting & Research Pvt. Ltd. 2009 15
JSW: Share price of the company decreased by 2.65% from Rs288.15 in January 2009 to Rs231.85 in March 2009. The expansion to take capacity to 6.8mtpa is nearing completion and will be fully commissioned by end of FY09. On successful completion of the proposed project the company is poised to become the largest producer in the private sector. Jindal Stainless: Share price of the company increased by 27.43% from Rs942.9 in January 2009 to Rs1201.55 in March 2009. JSL’s parent plant at Hisar is underway expansion to meet annual melting and hot rolling capacity of 7,20,000MT, further to be expanded to 1.5MT by 2010. The current cold rolling capacity of 2, 75, 000 tonnes at Hisar is being upgraded to 3,75,000 tonnes. JSL is setting up one of world’s largest single location fully integrated stainless steel plant at Orissa; the 1.6MTPA greenfield project envisages complete integration from mining to cold rolling, along with 500MW captive power plant. Hindustan zinc: Share price of the company increased by 24.49% from Rs359.4 in January 2009 to Rs447.4 in March 2009. The company has under in expansion projects that will take its total integrated zinc-lead capacity to 1,065,000 tonnes per annum with fully integrated mining and captive power generation capacities, thereby making HZL the world's largest integrated zinc-lead producer by 2010. Two brownfield smelter projects each of 210,000 tonnes and 100,000 tonnes respectively at Rajpura Dariba in Rajasthan, is expected to increase the production capacities of zinc and lead. Bhushan Steel: Share price of the company increased by 22.07% from Rs326.3 in January 2009 to Rs398.3 at the end of March 2009. The company is setting up an integrated steel plant in the state of West Bengal with facilities including slab plant, coke ovens and captive power plant. It also plans to set up a 6m tonnes per annum integrated steel plant as an expansion of its existing plant being set up at Meramandali in Orissa
QPAC-Indian Steel Industry- January -March 2009
© Cygnus Business Consulting & Research Pvt. Ltd. 2009 16
COMPANY ANALYSIS
1. BHUSHAN STEEL
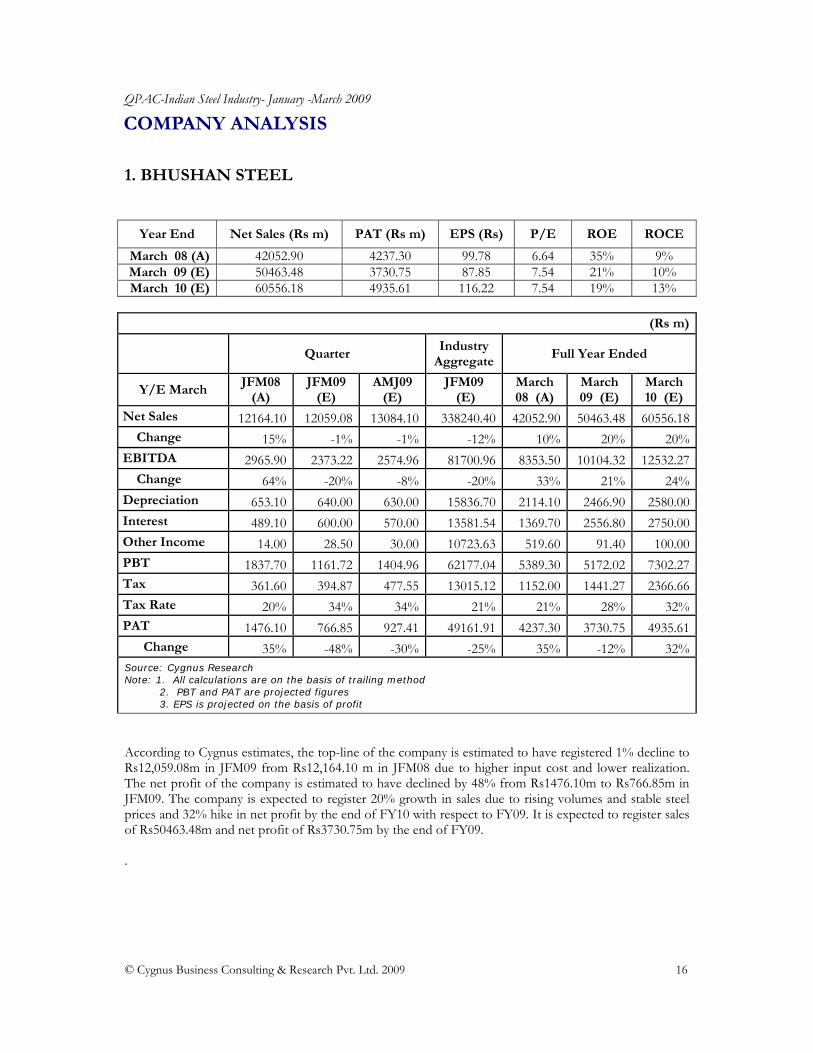
According to Cygnus estimates, the top-line of the company is estimated to have registered 1% decline to Rs12,059.08m in JFM09 from Rs12,164.10 m in JFM08 due to higher input cost and lower realization. The net profit of the company is estimated to have declined by 48% from Rs1476.10m to Rs766.85m in JFM09. The company is expected to register 20% growth in sales due to rising volumes and stable steel prices and 32% hike in net profit by the end of FY10 with respect to FY09. It is expected to register sales of Rs50463.48m and net profit of Rs3730.75m by the end of FY09. .
Year End Net Sales (Rs m) PAT (Rs m) EPS (Rs) P/E ROE ROCE
March 08 (A) 42052.90 4237.30 99.78 6.64 35% 9% March 09 (E) 50463.48 3730.75 87.85 7.54 21% 10% March 10 (E) 60556.18 4935.61 116.22 7.54 19% 13%
(Rs m)
Quarter Industry
AggregateFull Year Ended
Y/E March JFM08
(A) JFM09
(E) AMJ09
(E) JFM09
(E) March 08 (A)
March 09 (E)
March 10 (E)
Net Sales 12164.10 12059.08 13084.10 338240.40 42052.90 50463.48 60556.18 Change 15% -1% -1% -12% 10% 20% 20%EBITDA 2965.90 2373.22 2574.96 81700.96 8353.50 10104.32 12532.27 Change 64% -20% -8% -20% 33% 21% 24%Depreciation 653.10 640.00 630.00 15836.70 2114.10 2466.90 2580.00Interest 489.10 600.00 570.00 13581.54 1369.70 2556.80 2750.00Other Income 14.00 28.50 30.00 10723.63 519.60 91.40 100.00PBT 1837.70 1161.72 1404.96 62177.04 5389.30 5172.02 7302.27Tax 361.60 394.87 477.55 13015.12 1152.00 1441.27 2366.66Tax Rate 20% 34% 34% 21% 21% 28% 32%PAT 1476.10 766.85 927.41 49161.91 4237.30 3730.75 4935.61 Change 35% -48% -30% -25% 35% -12% 32%Source: Cygnus Research Note: 1. All calculations are on the basis of trailing method 2. PBT and PAT are projected figures 3. EPS is projected on the basis of profit

QPAC-Indian Steel Industry- January -March 2009
© Cygnus Business Consulting & Research Pvt. Ltd. 2009 17
2. HINDALCO
Sale of the company is estimated to have grown by 9% to Rs54,611.8m in JFM09 from Rs50,102m in JFM08. EBIDTA is estimated to have increased by 16% to Rs9201.97m in JFM09 from Rs7967m in JFM08. It is expected that the company’s sales will increase by 4% to Rs199,090.08m in the FY09 from Rs192,010m in the FY08. EBIDTA is also expected to grow by 7% to Rs36,418.7m in the FY09 from Rs34,011 m in FY10. Net profit of the company is also expected to grow by 9% to Rs31,164.12m in FY09 from Rs28,609m in FY08. Various stimulus packages announced by different countries will help to boost the demand in the economy, so it is expected that the company would have a 25% growth in sales in FY10. Higher asset utilisation, better working management and low input cost would help to increase its EBIDTA which is expected to be 57% in the FY10. It is also expected that net profit of the company would grow by 29% in FY10.
Year End Net Sales (Rs m) PAT (Rs m) EPS (Rs) P/E ROE ROCE
March 08 (A) 192010.00 28609.00 23.31 7.07 23% 14% March 09 (E) 199090.08 31164.12 18.33 2.83 20% 13% March 10 (E) 248862.60 40136.49 23.61 2.83 20% 15%
(Rs m)
Quarter Industry
AggregateFull Year Ended
Y/E March JFM08
(A) JFM09
(E) AMJ09
(E) JFM09
(E) March 08
(A) March 09
(E) March 10 (E)
Net Sales 50102.00 54611.18 57238.40 338240.40 192010.00 199090.08 248862.60 Change 6% 9% 23% -12% 5% 4% 25%EBITDA 7967.00 9201.97 12392.11 81700.96 34011.00 36418.27 57039.26 Change -24% 16% 31% -20% -15% 7% 57%Depreciation 1516.00 1,856.78 1934.66 15836.70 5878.00 6627.38 8461.33Interest 988.00 1026.69 1030.29 13581.54 2806.00 3574.89 3981.83Other Income 1442.00 1874.60 2166.26 10723.63 4929.00 7293.80 9846.63PBT 6905.00 8193.10 11593.42 62177.04 30256.00 33509.80 44596.10Tax -3865.00 -3355.92 2782.42 13015.12 1647.00 2345.68 4459.61Tax Rate -56% -41% 24% 21% 5% 7% 10%PAT 10770.00 11549.02 8811.00 49161.91 28609.00 31164.12 40136.49 Change 49% 7% 26% -25% 12% 9% 29%Source: Cygnus Research Note: 1. All calculations are on the basis of trailing method 2. PBT and PAT are projected figures 3. EPS is projected on the basis of profit

QPAC-Indian Steel Industry- January -March 2009
© Cygnus Business Consulting & Research Pvt. Ltd. 2009 18
3. HINDUSTAN ZINC LTD
According to Cygnus estimates, the top-line of the company is estimated to have registered 8% growth to Rs24,472.80m in JFM09 from Rs22,660.00m in JFM08. The net profit of the company is estimated to have grown by 1% from Rs12,780m to Rs12,929.21m in JFM09. The company is expected to register 7% growth in sales because of increasing volumes and 1% growth in net profit by the end of FY10 with respect to FY09. It is expected to register sales of Rs69,506.00m and net profit of Rs34,690.61m by the end of FY09.
Year End Net Sales (Rs m) PAT (Rs m) EPS (Rs) P/E ROE ROCE
March 08 (A) 78780.00 59850.00 104.04 5.06 37% 32% March 09 (E) 69506.00 44097.90 82.11 6.41 21% 19% March 10 (E) 74371.42 47463.37 83.13 6.41 14% 15%
(Rs m)
Quarter Industry
AggregateFull Year Ended
Y/E March JFM08
(A) JFM09
(E) AMJ09
(E) JFM09
(E) March 08 (A)
March 09 (E)
March 10 (E)
Net Sales 22660.00 24472.80 18408.99 338240.40 78780.00 69506.00 74371.42 Change 12% 8% 12% -12% -8% -12% 7%EBITDA 14810.00 15933.90 10766.48 81700.96 53800.00 38582.10 41817.37 Change 6% 8% 10% -20% -16% -28% 8%Depreciation 740.00 712.00 700.00 15836.70 2220.00 2814.40 2814.00Interest 50.00 50.00 50.00 13581.54 240.00 233.30 240.00Other Income 3260.00 2300.00 2000.00 10723.63 8510.00 8563.50 8700.00PBT 17280.00 17471.90 12016.48 62177.04 59850.00 44097.90 47463.37Tax 4500.00 4542.69 3124.29 13015.12 15890.00 9407.29 12340.48Tax Rate 26% 26% 26% 21% 27% 21% 26%PAT 12780.00 12929.21 8892.20 49161.91 43960.00 34690.61 35122.89 Change 37% 1% 5% -25% -1% -21% 1%Source: Cygnus Research Note: 1. All calculations are on the basis of trailing method 2. PBT and PAT are projected figures 3. EPS is projected on the basis of profit
QPAC-Indian Steel Industry- January -March 2009
© Cygnus Business Consulting & Research Pvt. Ltd. 2009 19
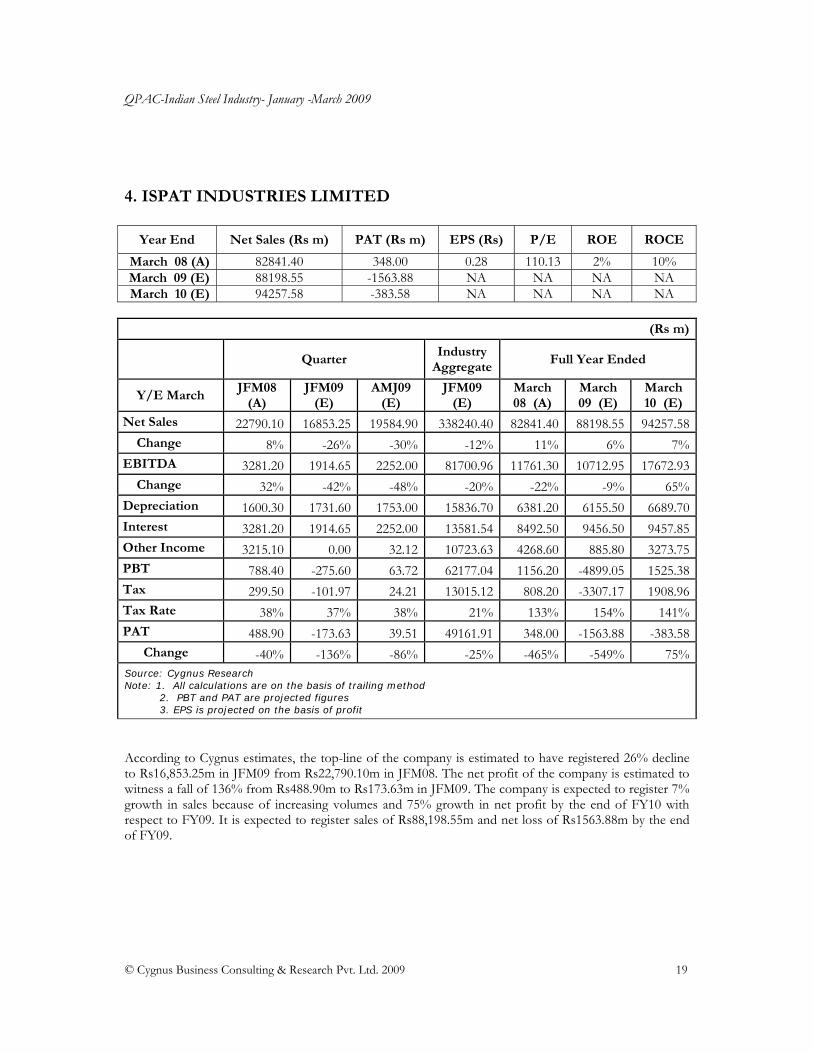
4. ISPAT INDUSTRIES LIMITED
According to Cygnus estimates, the top-line of the company is estimated to have registered 26% decline to Rs16,853.25m in JFM09 from Rs22,790.10m in JFM08. The net profit of the company is estimated to witness a fall of 136% from Rs488.90m to Rs173.63m in JFM09. The company is expected to register 7% growth in sales because of increasing volumes and 75% growth in net profit by the end of FY10 with respect to FY09. It is expected to register sales of Rs88,198.55m and net loss of Rs1563.88m by the end of FY09.
Year End Net Sales (Rs m) PAT (Rs m) EPS (Rs) P/E ROE ROCE
March 08 (A) 82841.40 348.00 0.28 110.13 2% 10% March 09 (E) 88198.55 -1563.88 NA NA NA NA March 10 (E) 94257.58 -383.58 NA NA NA NA
(Rs m)
Quarter Industry
AggregateFull Year Ended
Y/E March JFM08
(A) JFM09
(E) AMJ09
(E) JFM09
(E) March 08 (A)
March 09 (E)
March 10 (E)
Net Sales 22790.10 16853.25 19584.90 338240.40 82841.40 88198.55 94257.58 Change 8% -26% -30% -12% 11% 6% 7%EBITDA 3281.20 1914.65 2252.00 81700.96 11761.30 10712.95 17672.93 Change 32% -42% -48% -20% -22% -9% 65%Depreciation 1600.30 1731.60 1753.00 15836.70 6381.20 6155.50 6689.70Interest 3281.20 1914.65 2252.00 13581.54 8492.50 9456.50 9457.85Other Income 3215.10 0.00 32.12 10723.63 4268.60 885.80 3273.75PBT 788.40 -275.60 63.72 62177.04 1156.20 -4899.05 1525.38Tax 299.50 -101.97 24.21 13015.12 808.20 -3307.17 1908.96Tax Rate 38% 37% 38% 21% 133% 154% 141%PAT 488.90 -173.63 39.51 49161.91 348.00 -1563.88 -383.58 Change -40% -136% -86% -25% -465% -549% 75%Source: Cygnus Research Note: 1. All calculations are on the basis of trailing method 2. PBT and PAT are projected figures 3. EPS is projected on the basis of profit
QPAC-Indian Steel Industry- January -March 2009
© Cygnus Business Consulting & Research Pvt. Ltd. 2009 20
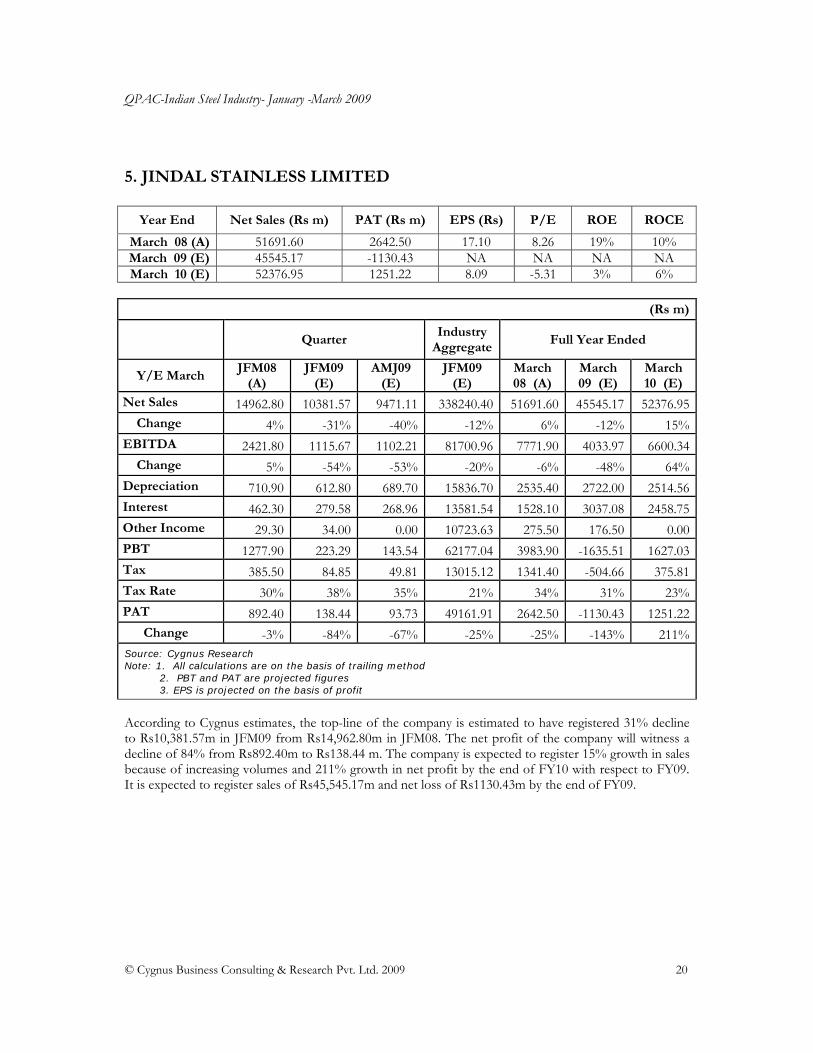
5. JINDAL STAINLESS LIMITED
According to Cygnus estimates, the top-line of the company is estimated to have registered 31% decline to Rs10,381.57m in JFM09 from Rs14,962.80m in JFM08. The net profit of the company will witness a decline of 84% from Rs892.40m to Rs138.44 m. The company is expected to register 15% growth in sales because of increasing volumes and 211% growth in net profit by the end of FY10 with respect to FY09. It is expected to register sales of Rs45,545.17m and net loss of Rs1130.43m by the end of FY09.
Year End Net Sales (Rs m) PAT (Rs m) EPS (Rs) P/E ROE ROCE
March 08 (A) 51691.60 2642.50 17.10 8.26 19% 10% March 09 (E) 45545.17 -1130.43 NA NA NA NA March 10 (E) 52376.95 1251.22 8.09 -5.31 3% 6%
(Rs m)
Quarter Industry
AggregateFull Year Ended
Y/E March JFM08
(A) JFM09
(E) AMJ09
(E) JFM09
(E) March 08 (A)
March 09 (E)
March 10 (E)
Net Sales 14962.80 10381.57 9471.11 338240.40 51691.60 45545.17 52376.95 Change 4% -31% -40% -12% 6% -12% 15%EBITDA 2421.80 1115.67 1102.21 81700.96 7771.90 4033.97 6600.34 Change 5% -54% -53% -20% -6% -48% 64%Depreciation 710.90 612.80 689.70 15836.70 2535.40 2722.00 2514.56Interest 462.30 279.58 268.96 13581.54 1528.10 3037.08 2458.75Other Income 29.30 34.00 0.00 10723.63 275.50 176.50 0.00PBT 1277.90 223.29 143.54 62177.04 3983.90 -1635.51 1627.03Tax 385.50 84.85 49.81 13015.12 1341.40 -504.66 375.81Tax Rate 30% 38% 35% 21% 34% 31% 23%PAT 892.40 138.44 93.73 49161.91 2642.50 -1130.43 1251.22 Change -3% -84% -67% -25% -25% -143% 211%Source: Cygnus Research Note: 1. All calculations are on the basis of trailing method 2. PBT and PAT are projected figures 3. EPS is projected on the basis of profit
QPAC-Indian Steel Industry- January -March 2009
© Cygnus Business Consulting & Research Pvt. Ltd. 2009 21
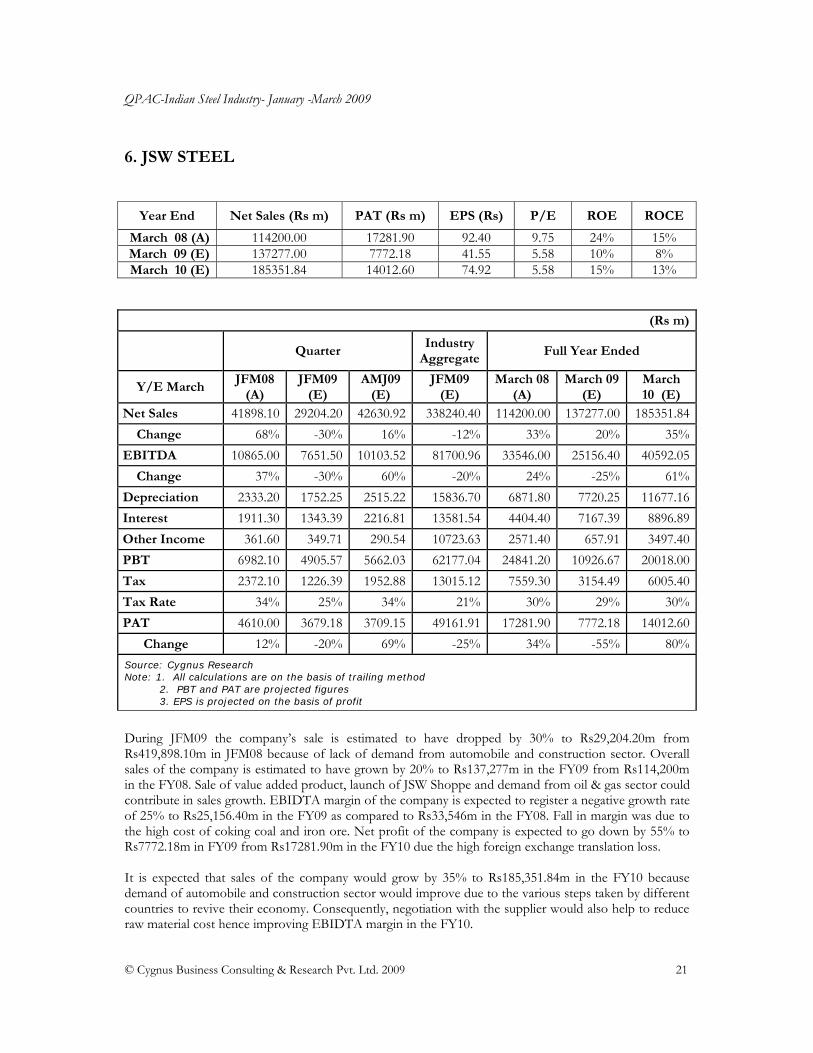
6. JSW STEEL
During JFM09 the company’s sale is estimated to have dropped by 30% to Rs29,204.20m from Rs419,898.10m in JFM08 because of lack of demand from automobile and construction sector. Overall sales of the company is estimated to have grown by 20% to Rs137,277m in the FY09 from Rs114,200m in the FY08. Sale of value added product, launch of JSW Shoppe and demand from oil & gas sector could contribute in sales growth. EBIDTA margin of the company is expected to register a negative growth rate of 25% to Rs25,156.40m in the FY09 as compared to Rs33,546m in the FY08. Fall in margin was due to the high cost of coking coal and iron ore. Net profit of the company is expected to go down by 55% to Rs7772.18m in FY09 from Rs17281.90m in the FY10 due the high foreign exchange translation loss. It is expected that sales of the company would grow by 35% to Rs185,351.84m in the FY10 because demand of automobile and construction sector would improve due to the various steps taken by different countries to revive their economy. Consequently, negotiation with the supplier would also help to reduce raw material cost hence improving EBIDTA margin in the FY10.
Year End Net Sales (Rs m) PAT (Rs m) EPS (Rs) P/E ROE ROCE
March 08 (A) 114200.00 17281.90 92.40 9.75 24% 15% March 09 (E) 137277.00 7772.18 41.55 5.58 10% 8% March 10 (E) 185351.84 14012.60 74.92 5.58 15% 13%
(Rs m)
Quarter Industry
AggregateFull Year Ended
Y/E March JFM08
(A) JFM09
(E) AMJ09
(E) JFM09
(E) March 08
(A) March 09
(E) March 10 (E)
Net Sales 41898.10 29204.20 42630.92 338240.40 114200.00 137277.00 185351.84 Change 68% -30% 16% -12% 33% 20% 35%EBITDA 10865.00 7651.50 10103.52 81700.96 33546.00 25156.40 40592.05 Change 37% -30% 60% -20% 24% -25% 61%Depreciation 2333.20 1752.25 2515.22 15836.70 6871.80 7720.25 11677.16Interest 1911.30 1343.39 2216.81 13581.54 4404.40 7167.39 8896.89Other Income 361.60 349.71 290.54 10723.63 2571.40 657.91 3497.40PBT 6982.10 4905.57 5662.03 62177.04 24841.20 10926.67 20018.00Tax 2372.10 1226.39 1952.88 13015.12 7559.30 3154.49 6005.40Tax Rate 34% 25% 34% 21% 30% 29% 30%PAT 4610.00 3679.18 3709.15 49161.91 17281.90 7772.18 14012.60 Change 12% -20% 69% -25% 34% -55% 80%Source: Cygnus Research Note: 1. All calculations are on the basis of trailing method 2. PBT and PAT are projected figures 3. EPS is projected on the basis of profit

QPAC-Indian Steel Industry- January -March 2009
© Cygnus Business Consulting & Research Pvt. Ltd. 2009 22
7. MUKUND STEEL
Due to the global slowdown and reduction in steel demand, the sales of Mukand Steel Ltd is estimated to have decreased by 42% in JFM09 coming to Rs3349.8m, as compared to the same quarter previous year. But the same shows a revival in the very next quarter growing to Rs4012.7m, showing a negative growth of 28%. Also the EBITDA is estimated to have a negative growth of 44% and 29% in JFM09 & AMJ09 respectively, due to rising raw material prices. PAT is estimated to show drastic negative figures of 215% and 265% during the quarters respectively due to base effect registering losses of Rs134.47m and Rs184.12m. For year on year comparison the company is showing growth of 15% and 11% growth in sales in FY09 and FY10 respectively. The EBITDA is expected to fall by 16% in FY09 due to rising raw material prices but will grow by 23% in FY10 due to decrease in raw material prices. The interest and depreciation is expected to rise in the year 2009 due to high capital expenditure, due to which the PAT will have a negative growth of 57% while it will increase by 62% in 2010.
Year End Net Sales (Rs m) PAT (Rs m) EPS (Rs) P/E ROE ROCE
March 08 (A) 19267.88 593.97 8.12 11.08 9% 10% March 09 (E) 22160.39 253.37 3.47 6.59 4% 6% March 10 (E) 24535.78 409.75 5.60 6.59 5% 8%
(Rs m)
Quarter Industry
AggregateFull Year Ended
Y/E March JFM08
(A) JFM09
(E) AMJ09
(E) JFM09
(E) March 08 (A)
March 09 (E)
March 10 (E)
Net Sales 5728.19 3349.80 4012.70 338240.40 19267.88 22160.39 24535.78 Change 20% -42% -28% -12% 6% 15% 11%EBITDA 630.10 353.91 414.14 81700.96 2394.66 2014.50 2478.98 Change -2% -44% -29% -20% -4% -16% 23%Depreciation 143.20 207.65 219.17 15836.70 579.43 643.27 689.40Interest 343.69 348.47 471.85 13581.54 1130.83 1277.51 1257.89Other Income 37.23 0.00 0.00 10723.63 214.54 41.05 0.00PBT 180.44 -202.21 -276.87 62177.04 898.94 93.72 531.69Tax 63.15 -67.74 -92.75 13015.12 304.97 -31.20 121.93Tax Rate 35% 34% 34% 21% 34% -33% 23%PAT 117.28 -134.47 -184.12 49161.91 593.97 253.37 409.75 Change -43% -215% -265% -25% -34% -57% 62%Source: Cygnus Research Note: 1. All calculations are on the basis of trailing method 2. PBT and PAT are projected figures 3. EPS is projected on the basis of profit

QPAC-Indian Steel Industry- January -March 2009
© Cygnus Business Consulting & Research Pvt. Ltd. 2009 23
8. TATA STEEL
The company is estimated to have negative growth of 14.4% in JFM09 due to bad economic scenario. Again the company is estimated to register a decline of 24.4% in sales in AMJ09 to Rs46,589.8m in comparison to the same period previous year because of economic slowdown, while showing a growth of 5.5% from the previous quarter JFM09, because a revival is expected in AMJ09.. Also the EBITDA is estimated to fall by 35.4% and 46.8% in JFM09 and AMJ09 due to rise in raw material prices. But still since the company enjoys a competitive edge over other companies because of high production capacity. Consequently, the company is expected to show a growth of 4.6% and 8.1% in sales of FY09 and FY10 respectively. The EBITDA is expected to show a negative growth of 12.2% in FY09 due to rising raw material prices, but again the prices are expected to reduce in FY10 registering a growth of 17.1%.
Year End Net Sales (Rs m) PAT (Rs m) EPS (Rs) P/E ROE ROCE
March 08 (A) 196932.80 46870.30 64.16 10.80 21% 31% March 09 (E) 205894.90 36058.81 49.36 4.17 13% 29% March 10 (E) 222546.70 44533.15 60.96 4.17 12% 30%
(Rs m)
Quarter Industry
AggregateFull Year Ended
Y/E March JFM08
(A) JFM09
(E) AMJ09
(E) JFM09
(E) March 08
(A) March 09
(E) March 10 (E)
Net Sales 51726.59 44163.70 46589.80 338240.40 196932.80 205894.90 222546.70 Change 3.9% -14.6% -24.4% -12% 12.2% 4.6% 8.1%EBITDA 21227.93 13707.00 14480.80 81700.96 84446.70 74122.90 86793.70 Change 11.5% -35.4% -46.8% -20% 21.1% -12.2% 17.1%Depreciation 4458.66 4678.90 4889.50 15836.70 8346.10 11848.20 10798.90Interest 5000.00 5987.89 6204.50 13581.54 8787.00 14435.39 12589.90Other Income 1034.53 795.31 735.98 10723.63 3350.00 3386.11 2630.02PBT 12803.80 3040.21 3386.80 62177.04 70663.60 59112.81 63404.90Tax 4097.66 1182.64 1253.12 13015.12 23793.30 23054.00 18871.75Tax Rate 0.32 0.39 0.37 21% 0.34 0.39 0.30PAT 8706.14 1857.57 2133.68 49161.91 46870.30 36058.81 44533.15 Change -23.9% -78.7% -85.7% -25% 7.2% -23.1% 23.5%Source: Cygnus Research Note: 1. All calculations are on the basis of trailing method 2. PBT and PAT are projected figures 3. EPS is projected on the basis of profit
QPAC-Indian Steel Industry- January -March 2009
© Cygnus Business Consulting & Research Pvt. Ltd. 2009 24
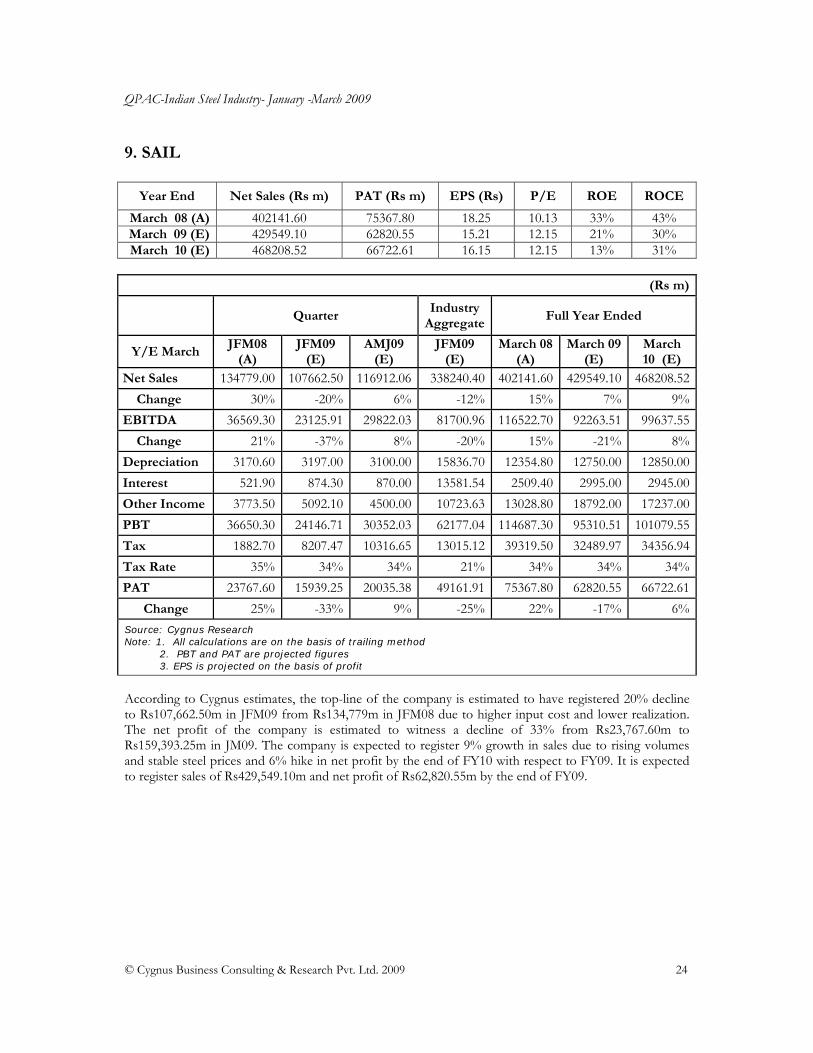
9. SAIL
According to Cygnus estimates, the top-line of the company is estimated to have registered 20% decline to Rs107,662.50m in JFM09 from Rs134,779m in JFM08 due to higher input cost and lower realization. The net profit of the company is estimated to witness a decline of 33% from Rs23,767.60m to Rs159,393.25m in JM09. The company is expected to register 9% growth in sales due to rising volumes and stable steel prices and 6% hike in net profit by the end of FY10 with respect to FY09. It is expected to register sales of Rs429,549.10m and net profit of Rs62,820.55m by the end of FY09.
Year End Net Sales (Rs m) PAT (Rs m) EPS (Rs) P/E ROE ROCE
March 08 (A) 402141.60 75367.80 18.25 10.13 33% 43% March 09 (E) 429549.10 62820.55 15.21 12.15 21% 30% March 10 (E) 468208.52 66722.61 16.15 12.15 13% 31%
(Rs m)
Quarter Industry
AggregateFull Year Ended
Y/E March JFM08
(A) JFM09
(E) AMJ09
(E) JFM09
(E) March 08
(A) March 09
(E) March 10 (E)
Net Sales 134779.00 107662.50 116912.06 338240.40 402141.60 429549.10 468208.52 Change 30% -20% 6% -12% 15% 7% 9%EBITDA 36569.30 23125.91 29822.03 81700.96 116522.70 92263.51 99637.55 Change 21% -37% 8% -20% 15% -21% 8%Depreciation 3170.60 3197.00 3100.00 15836.70 12354.80 12750.00 12850.00Interest 521.90 874.30 870.00 13581.54 2509.40 2995.00 2945.00Other Income 3773.50 5092.10 4500.00 10723.63 13028.80 18792.00 17237.00PBT 36650.30 24146.71 30352.03 62177.04 114687.30 95310.51 101079.55Tax 1882.70 8207.47 10316.65 13015.12 39319.50 32489.97 34356.94Tax Rate 35% 34% 34% 21% 34% 34% 34%PAT 23767.60 15939.25 20035.38 49161.91 75367.80 62820.55 66722.61 Change 25% -33% 9% -25% 22% -17% 6%Source: Cygnus Research Note: 1. All calculations are on the basis of trailing method 2. PBT and PAT are projected figures 3. EPS is projected on the basis of profit

QPAC-Indian Steel Industry- January -March 2009
© Cygnus Business Consulting & Research Pvt. Ltd. 2009 25
10. USHA MARTIN
The sales of the company is estimated to have increased by 33% to Rs6537.38m in JFM09 from Rs4930.70m in JFM08. EBIDTA is also estimated to have increased by 39% to Rs1391.76m in JFM09 from Rs1002.20m in JFM08. Net Profit is estimated to have increased by 24% to Rs547.95m in JFM09 from Rs443.10m in JFM08. In AMJ09 it is expected that sales, EBIDTA, and net profit to grow by 15%, 20% and 13% respectively, compared to last year. Sales of the company is expected to grow by 36% to Rs22,541.68m in the FY09 from Rs16,559m in FY08; EBIDTA is expected to grow by 39% to Rs4745.76m in FY09 from Rs3413.8m in FY08; and net profit margin is also expected to grow by 24% to Rs1800.85m in FY09 from Rs1448.40m in FY08. Sales, EBIDTA and net profit is expected to grow by 14%, 21% and 30% respectively in FY10.
Year End Net Sales (Rs m) PAT (Rs m) EPS (Rs) P/E ROE ROCE
March 08 (A) 16559.00 1448.40 5.79 13.74 17% 13% March 09 (E) 22541.68 1800.85 7.20 11.05 17% 15% March 10 (E) 25718.23 2167.77 8.66 11.05 18% 17%
(Rs m)
Quarter Industry
AggregateFull Year Ended
Y/E March JFM08
(A) JFM09
(E) AMJ09
(E) JFM09
(E) March 08 (A)
March 09 (E)
March 10 (E)
Net Sales 4930.70 6537.38 5658.01 338240.40 16559.00 22541.68 25718.23 Change 23% 33% 15% -12% 18% 36% 14%EBITDA 1002.20 1391.76 1530.87 81700.96 3413.80 4745.76 5720.01 Change 29% 39% 20% -20% 26% 39% 21%Depreciation 196.90 294.18 297.05 15836.70 759.20 928.38 1285.90Interest 239.80 339.94 316.84 13581.54 803.80 1311.44 1337.30Other Income 64.00 25.15 0.00 10723.63 156.40 106.35 125.21PBT 629.50 782.79 916.98 62177.04 2007.20 2612.29 3096.81Tax 186.40 234.84 275.09 13015.12 558.80 811.44 929.04Tax Rate 30% 30% 30% 21% 28% 31% 30%PAT 443.10 547.95 641.89 49161.91 1448.40 1800.85 2167.77 Change 53% 24% 13% -25% 43% 24% 20%Source: Cygnus Research Note: 1. All calculations are on the basis of trailing method 2. PBT and PAT are projected figures 3. EPS is projected on the basis of profit

QPAC-Indian Steel Industry- January -March 2009
© Cygnus Business Consulting & Research Pvt. Ltd. 2009 26
11. UTTAM GALVA STEELS LIMITED
It is estimated that the sales of the company would have grown by 25% to Rs12,237.75m in JFM09 from Rs9805.80m in JFM08; EBIDTA is also estimated to have grown by 38% to Rs1250.78m in JFM09 from Rs905.20m in JFM08 and net profit to increase by 5% to Rs435.18m in JFM09 from Rs414.10m in JFM08. In AMJ09 it is expected that sales, EBIDTA, and net profit to grow by 67%, 46% and 20% respectively, compared to last year. Sales of the company is expected to grow by 42% to Rs44,909.75m in FY09 from Rs31,558.40m in FY08; and EBIDTA to grow by 31% to Rs3947.08m in FY09 from Rs3008.5m in the FY08. Sales, EBIDTA and net profit is expected to grow by 42%, 55% and 87% respectively in FY10.
Year End Net Sales (Rs m) PAT (Rs m) EPS (Rs) P/E ROE ROCE
March 08 (A) 31558.40 1238.60 10.87 3.34 17% 14% March 09 (E) 44909.75 967.38 8.49 4.27 12% 17% March 10 (E) 63771.85 1808.58 15.87 4.27 21% 24%
(Rs m)
Quarter Industry
AggregateFull Year Ended
Y/E March JFM08
(A) JFM09
(E) AMJ09
(E) JFM09
(E) March 08 (A)
March 09 (E)
March 10 (E)
Net Sales 9805.80 12237.75 13392.09 338240.40 31558.40 44909.75 63771.85 Change 16% 25% 67% -12% 23% 42% 42%EBITDA 905.20 1250.78 1543.59 81700.96 3008.50 3947.08 6109.34 Change 15% 38% 46% -20% 12% 31% 55%Depreciation 200.00 249.90 350.39 15836.70 647.60 919.10 1297.75Interest 396.50 482.81 601.37 13581.54 1138.80 1886.21 2550.87Other Income 0.70 0.00 0.00 10723.63 21.10 3.20 0.00PBT 309.40 518.07 591.83 62177.04 1243.20 1144.97 2260.72Tax -104.70 82.89 118.36 13015.12 4.60 177.59 452.14Tax Rate -34% 16% 20% 21% 0.37% 16% 20%PAT 414.10 435.18 473.47 49161.91 1238.60 967.38 1808.58 Change 3% 5% 78% -25% 23% -22% 87%Source: Cygnus Research Note: 1. All calculations are on the basis of trailing method 2. PBT and PAT are projected figures 3. EPS is projected on the basis of profit

QPAC-Indian Steel Industry- January -March 2009
© Cygnus Business Consulting & Research Pvt. Ltd. 2009 27
SOURCES & METHODS FOR COMPANY PROJECTIONS Sources
Company annual reports
Press releases
BSE India
Research reports related to Economy, Industry and Company
Methods
Understanding companies’ product services
Understanding industry and economic indicators and general economic scenario
Understanding the dynamics between the companies and the industry in relation to demand and
supply, technology, regulation, inflation, etc
Understanding recent strategies and initiatives taken by companies such as product launches, capacity
additions and M&As
Making revenue projections based on the expected business strategies and financial analysis
Validating the financial projections of the company with the overall business strategy
Calculating the cost structure on the basis of sales and past and present trends in the industry
Analyzing quarterly growth rates and growth rates of last 8 quarters
The cut-off date for JFM quarter results is April 18, 2009. Quarterly performance analysis of
companies announcing their results after this date is based on Cygnus estimates.