Cyclone Yasi: Experiences of Backpackers in Townsville … · 3 Cyclone Yasi: Experiences of...
41
Cyclone Yasi: Experiences of Backpackers in Townsville and Cairns during Cyclone Yasi Astrid Vachette and David King 2011 Centre for Disaster Studies, James Cook University
Transcript of Cyclone Yasi: Experiences of Backpackers in Townsville … · 3 Cyclone Yasi: Experiences of...

Cyclone Yasi: Experiences of
Backpackers in Townsville
and Cairns during Cyclone
Yasi
Astrid Vachette and David King
2011
Centre for Disaster Studies, James
Cook University

2

3
Cyclone Yasi: Experiences of Backpackers in Townsville and Cairns during Cyclone Yasi Astrid Vachette and David King Centre for Disaster Studies, James Cook University Summary Evacuation
• 58% of backpackers evacuated to Townsville or Cairns • Almost 70% of people who evacuated had been told to do so, especially people interviewed
in Cairns where only few took the decision themselves • The evacuated areas were the coastline in general, Cardwell, Tully and Magnetic Island
Awareness
• Word of mouth and media (tv, radio and internet) were the main sources of general information on cyclones
• 65% of the backpackers were aware of cyclones in Australia and in the area before arrival • A large majority had not been prepared for this kind of event and didn’t really know what to
do, but without knowing it, they responded correctly in preparing themselves for the cyclone: looking for a shelter, buying food and seeking information. Awareness of Yasi
• People heard about cyclone Yasi quite late: 47% on Monday and 37% on Tuesday • Word of Mouth, TV and government texts were the main sources of information on Yasi
Actions
• Most Backpackers felt calm at the peak of the cyclone, while as many people felt afraid as excited by the event
• Buying food, finding a shelter and ringing relatives were the main activities just before the cyclone
• Sleeping, eating and cyclone party (for those who stayed in their hostel) were the main occupations during the cyclone – where there was no power loss, everyone watched tv
• 62% considered leaving NQ before Yasi but it was too expensive or too late • 36% of people went outside during the cyclone and amongst the rest many would have gone
outside if they had been able to • Only 7% people were alone during the cyclone
Impact
• The main damage everywhere was damage to trees and small amounts of flooding • Almost every backpacker experienced loss of power

4
Personal impact
• 71% of backpackers had received assistance from the staff of their shelters or official organisations: especially information and food
• Almost half of the backpackers would have changed their plans if they had known about Yasi • Almost half of the backpackers didn’t expect to come or stop during their trip in the city
where they sheltered, especially Townsville where 58% stayed against their will • Many backpackers were disappointed by the experience of the cyclone, thinking “it wasn’t
that bad” • Problems after the cyclone were lack of food for almost 90% of the backpackers (noodle soup
and bread seemed to have rescued a lot of people), • Because of the loss of the telephone signal after the cyclone many people were unable to call
their relatives • An important issue was the loss of job and holiday time • Many backpackers saw their goods robbed during the cyclone • Right after the cyclone transport was an issue: rare and expensive for people who wanted to
leave Townsville quickly Experience
• 69% of backpackers hadn’t experienced a cyclone before Yasi Travel
• Bus is the main transport means used by Backpackers • Plane is used only for really long journeys • A majority of people travels with other people (friends most of the case) but the number of
people travelling alone was significant Demographics
• The 20-25 year age cohort is the main group, then 26-30 years • A majority of backpackers are from Europe • In most of the cases, backpackers had a good knowledge of English • The information texts on Yasi sent by the government were useful to backpackers but tv and
newspapers were the main source of information and warnings. Word of mouth was equally beneficial for every age

5
Introduction Very heavy rain began in North Queensland before Christmas 2010, culminating in the brief declaration of cyclone Natasha that crossed the coast close to Innisfail on Christmas Day. The resulting extreme weather system moved down the Queensland coast bringing exceptionally heavy rain and flooding to most of the state throughout January 2011. During the weekend of 29th and 30th January 2011 Cyclone Anthony threatened the area between Townsville and Bowen and crossed the coast between Bowen and Ayr. As Anthony impacted the coast, Yasi was identified as a much more severe threat that followed behind. All of these events contributed to a heightened awareness of hazards amongst the population, such that people were generally well prepared for a cyclone before Yasi approached. As the cyclone was predicted to be a category 5 system and was extremely large, over 1,000 kms across, the media gave Yasi a great deal of attention. Its estimated track on Sunday 30th predicted a crossing close to Cardwell (close to its ultimate crossing), but on Monday and Tuesday it was variously estimated to cross at locations between Cairns and Townsville. The heightened threat over an extensive area of North Queensland added to preparations and virtually total awareness in all communities. People in coastal locations were warned/ordered to evacuate inland on Tuesday and on Wednesday, although as the crossing point became clearer on Wednesday, many residents who had temporarily left beachside suburbs in Townsville and Cairns returned to their homes. Evacuation centres were opened in locations from Cairns to Townsville and many people sought shelter in centres, whether they had been told to evacuate or not. However, many people left coastal towns and cities, including flights out of Townsville and Cairns. The approaching cyclone was classified as category 5 with destructive winds forecast for the whole coast from Cairns to Townsville. Over 400,000 people were directly impacted by Cyclone Yasi. Although it moved rapidly, it was because of its very large size that winds that ranged from gale force to cyclonic blew for 24 hours and it was still a cyclone when it crossed Julia Creek 700 kms inland. Fortunately the rain associated with the cyclone was lower than expected, although it still caused extensive flooding. The worst inundation was associated with storm surge that caused extensive destruction to beachfront property from Mission Beach to Cardwell. Three immediate observations can be made; concerning deaths and injuries, building damage and evacuation. As in Cyclone Larry in 2006, there were no deaths (other than a tragic accident not directly caused by the cyclone) and relatively few injuries. Also similar to cyclone Larry, new houses built to cyclone standards post 1980, stood up to wind damage very well, even coping with storm surge in the beach suburbs, with most damaged and destroyed dwellings being older structures. The issue that was significantly different from many earlier cyclones was the extensive evacuation that took place. Although many people subsequently felt it was unnecessary, it was a sensible precaution given the nature of the threat. The problem in the future may be less willingness to evacuate next time, amongst beachside residents in Townsville and Cairns. A compounding problem of evacuation was a lack of assistance to evacuees, both in terms of transport and organised evacuation centres.

6
Methodology A focus of research in the centre during the late 1990’s and early 2000’s was the hazard awareness and preparedness of tourists. A particular emphasis was on independent travellers, of whom backpackers are an identifiable sub group. These tourists and travellers, mostly young, travel independently of organised groups whose leaders have a duty of care and protection for their members. Backpackers come from areas outside cyclone impact zones and may be unaware of local hazards. During 2000 and 2003 students from Europe (Elke Kuehlbrandt in 2000, Wouter Hoogenraad and Ronald van Eden in 2003) joined the Centre for Disaster Studies on placement as part of their degree programs. In 2011 Astrid Vachette is with the centre for the same purpose. Two surveys were carried out in Cairns, of backpackers and backpacker accommodation providers, by Kuehlbrandt in the dry season of 2000, and by Hoogenraad and van Eden in the wet (cyclone) season of 2003. As Vachette had recently arrived in Australia and was staying in a backpacker hostel in Townsville during the passage of Yasi, we decided to replicate the earlier backpacker studies to explore the experience of young travellers during and after a cyclone. It was also clear from media and anecdotal reports before the cyclone that extensive evacuation was occurring and that it had swept up many backpackers. Backpackers were interviewed by questionnaire in Townsville and Cairns, during the week immediately following the cyclone. By the end of the week, many had moved on (Townsville in particular was not an ideal holiday location at that time) and it proved difficult to recruit further participants. By that time 55 backpackers had participated in the survey, randomly selected from hostels and cheap hotels in the centre of each city. The small size of the sample makes statistical analyses of limited value, and besides, all of the questions were qualitative in nature. The survey provides useful indicators of the backpacker experience of cyclone Yasi, and many of the results of the two earlier surveys have been incorporated into this report. The survey instrument is provided in the appendix at the end of this report.

7
Actions Taken by Respondents Actions and behaviour are influenced by emotions and feelings. Table 1. How did you feel as the cyclone reached its peak? Feeling at the peak of the cyclone City Total
Townsville Cairns Number % Number % Number %
calm 11 31% 4 21% 15 28% afraid 7 19% 1 5% 8 15% excited 6 17% 3 16% 9 16% sleeping 5 14% 5 26% 10 18% don't know when the peak was 4 11% 5 26% 9 16% curious 3 8% 1 5% 4 7% Total 36 100% 19 100% 55 100% Backpackers were for the most part calm at the peak of the cyclone although there were as many people afraid as people excited by the event. There were widespread media and anecdotal reports of fear and psychological trauma from the experience, both in Townsville and Cairns. The backpacker experience is fairly typical of general experiences of the population in these two cities. Table 2. What did you do on Wednesday as the cyclone approached? Individual preparations on Wednesday before the cyclone by City
Actions on Wednesday before cyclone
City Total Townsville Cairns
Number % Number % Number % bought food and water 11 31% 4 21% 15 27% bought food, cigarettes/alcohol 1 3% 4 21% 5 9% rang my relatives 1 3% 4 21% 5 9% bought supplies and rang relatives 4 11% 2 10.5% 6 11% looked for a shelter 5 14% 2 10.5% 7 13% went to see the sea 6 17% 1 5.5% 7 13% took cash and bought supplies 3 8% 0 0% 3 5% nothing in particular 5 14% 2 10.5% 7 13% Total 36 100% 19 100% 55 100% Preparations were rational and within the range of advice that backpackers would receive. Preparation is also a useful activity that distracts from the tension of waiting for the storm. The main activities were buying food, finding a shelter and ringing relatives. Activities during the passage of the storm also mirror those of most of the urban community. Partying seems to have been more significant in Cairns, where the cyclone impact was less than in Townsville.

8
Table 3. What did you do during the night as the storm passed through? Occupation during the storm by City
Occupation during the storm City Total Townsville Cairns
Number % Number % Number % sleeping 7 19% 4 21% 11 20% eating, talking, sleeping 11 31% 5 27% 16 29% sleeping, eating, talking, playing cards 5 14% 0 0% 5 9% Reading, watching tv, listening to music 6 17% 1 5% 7 13% praying 1 3% 1 5% 2 4% cyclone party 6 17% 8 42% 14 25% Total 36 100% 19 100% 55 100% Sleeping, eating and being in a cyclone party, for those who stayed in their hostel, were the main occupations during the passage of the cyclone. Where there was no power loss people watched TV. Table 4. Did you consider leaving North Queensland when you heard the cyclone warning? People who considered leaving NQ because of Yasi by City Considered leaving NQ
City Total Townsville Cairns
Number % Number % Number % yes 24 67% 10 53% 34 62% no 12 33% 9 47% 21 38% Total 36 100% 19 100% 55 100%
A high proportion (62%) considered leaving the region when they heard about cyclone Yasi, but it was too expensive or too late by the time they considered it. The cyclone covered such an extensive area that relocation was necessary on Tuesday. By Tuesday afternoon many forms of public transport were closed for safety reasons. Table 5. Why didn’t you leave? Reason for not leaving NQ by City
Reason for not leaving City Total Townsville Cairns
Number % Number % Number % too expensive 5 14% 5 26% 10 18% too late 8 22% 2 11% 10 18% didn't know where to go 3 9% 1 5% 4 7% didn't want to leave friends 3 9% 1 5% 4 7% lack of transport facilities 5 14% 1 5% 6 11% didn't want to leave 12 33% 9 48% 21 39% Total 36 100% 19 100% 55 100%

9
Table 6. During the evening and night of Wednesday into Thursday where did you shelter? Place of shelter during the storm by City
Shelter during the storm City Total Townsville Cairns
Number % Number % Number % In a safe room of my hostel 17 47% 7 37% 24 44% Commonwealth shelter 5 14% 0 0% 5 9% Parking shelter on Flinders St. 6 17% 0 0% 6 11% Primary School 0 0% 8 42% 8 14.5% Stockland shelter 0 0% 2 11% 2 4% with friends 2 6% 1 5% 3 5.5% with strangers 3 8% 1 5% 4 7% holiday Inn 2 6% 0 0% 2 4% Civic guest house 1 3% 0 0% 1 2% Total 36 100% 19 100% 55 100% Shelters during the storm were city specific. Many people remained at the hostels where they had checked in, but others had been evacuated from coastal and surge prone areas and had probably made no contacts in the city. A number of shelters opened up during Wednesday but information was piecemeal and many of the centres were ill-prepared for the large influx of people. Table 7. Did you go outside during the evening or night while the strong winds blew? Went outside during the strong winds by Age
Age Went outside during the strong winds Total yes no
Number % Number % Number % less than 20 1 5.0% 2 5.7% 3 5.5% between 20 and 25 7 35.0% 16 45.7% 23 41.8% between 26 and 30 8 40.0% 10 28.6% 18 32.7% between 30 and 40 2 10.0% 4 11.4% 6 10.9% more than 40 2 10.0% 3 8.6% 5 9.1% Total 20 100.0% 35 100.0% 55 100.0% Table 7 indicates that 36% of the respondents went outside during the cyclone. Amongst the other 64% many were inside shelters and would have gone outside, but were not allowed to where police were present in the shelters that they had gone to. The breakdown by age groups seems to suggest that the 20 to 25 year olds were not particularly risk-takers. This is an interesting behaviour, but the sample was quite small and for most of this age group this was their first cyclone experience. It needs to be noted that in most cyclones, many TV reporters are filmed outside against a backdrop of the storm. This gives a message that it is safe to do so -- part of the package of unsafe behaviours that are perpetrated by the less responsible media.

10
Table 8. Did you go outside during the evening or night while the strong winds blew? Went outside during the strong winds by City
Went outside during the strong
winds
City Total Townsville Cairns
Number % Number % Number % yes 13 36% 7 37% 20 36% no 23 64% 12 63% 35 64% Total 36 100% 19 100% 55 100% Between the two cities there is no difference in the behaviour of venturing outside during the storm. It was observed that there were significant numbers of people on the streets of Townsville during Yasi’s passage. Table 9. Were you with other people while the storm passed? With other people during the storm by City With other people during
the storm City Total
Townsville Cairns Number % Number % Number %
yes 32 89% 19 100% 51 93% no 4 11% 0 0% 4 7% Total 36 100% 19 100% 55 100% Only 7% of the respondents were alone during the cyclone. This is rational and desirable behaviour during a natural hazard. There was no significant difference between locations. Table 10. Actual city or town in which located during Yasi? Place stayed during Yasi by City
Place stayed in Yasi
City Total Townsville Cairns
Number % Number % Number % Townsville 35 97% 0 0% 35 64% Cairns 0 0% 18 95% 18 32% Ingham 1 3% 0 0% 1 2% Airlie Beach 0 0% 1 5% 1 2% Total 36 100% 19 100% 55 100%

11
Arrival and residence Most backpackers had been in North Queensland for a relatively short period, although Cairns demonstrates a longer residence than Townsville. Table 11. What date did you first arrive in North Queensland? Date arrived in NQ by City
Date arrived In NQ City Total Townsville Cairns
Number % Number % Number % less than week 2 6% 2 10.5% 4 7% 1 week to 1 month 16 44% 4 21% 20 37% 1 month to 3 months 12 33% 11 58% 23 42% 3 to 6 months 4 11% 0 0 % 4 7% More than 6 months 2 6% 2 10.5% 4 7% Total 36 100% 19 100% 55 100% Table 12. Location: Place of interview by City
Place of interview City Total Townsville Cairns
Number % Number % Number % Civic Guest House 19 53% 0 0% 19 35% Reef Lodge Budget Accommodation 2 6% 0 0% 2 4% Adventurers Backpackers Resorts 4 11% 0 0% 4 7% Holiday Inn 5 14% 0 0% 5 9% Beach 6 17% 2 10% 8 14.5% Bohemia Central 0 0% 6 32% 6 11% Woodduck Backpackers 0 0% 4 21% 4 7% Pacific International 0 0% 4 21% 4 7% Castaways Backpackers 0 0% 3 16% 3 5.5% Total 36 100% 19 100% 55 10% Backpackers were interviewed at nine accommodation providers in the two cities plus 8 (14%) who were interviewed at the beach -- the Strand and the Esplanade.

12
Awareness Table 13. Were you aware that this area is affected by tropical cyclones? Aware of cyclones by Gender
Aware of cyclones
Gender Total Male Female
Number % Number % Number % yes 27 79% 9 43% 36 65% no 7 21% 12 57% 19 35% Total 34 100% 21 100% 55 100% Most of the backpackers (65%) were aware of cyclones in Australia and in the area of North Queensland before coming here. In this survey males seemed to be more aware of cyclones in North Queensland than females, but there are important differences based on age, especially between the early and late 20s cohorts. Awareness is fairly high, but the gender difference is significant. The 2003 study showed awareness of cyclones by 74% of respondents. Table 14. Were you aware that this area is affected by tropical cyclones? Awareness of cyclones area by Age
Age group Aware of cyclones Total yes no
Number % Number % Number % less than 20 3 8.3% 0 .0% 3 5.5% between 20 and 25 12 33.3% 11 57.9% 23 41.8% between 26 and 30 15 41.7% 3 15.8% 18 32.7% between 30 and 40 3 8.3% 3 15.8% 6 10.9% more than 40 3 8.3% 2 10.5% 5 9.1% Total 36 100.0% 19 100.0% 55 100.0% Table 15. Relationship between age groups and cyclone awareness
Age groups 0-19 20-25 26-30 31-40
No. % No. % No. % No. % General awareness
Yes 10 67 67 71 29 76 10 100 No 5 33 28 29 9 24
Affected areas correct / partially correct 7 47 50 52 28 74 9 90 incorrect 1 7 3 3 1 3 Do not know 7 47 42 44 9 24 1 10
Cyclone season correct / partially correct 6 40 49 52 25 66 7 70 incorrect 6 6 Do not know 9 60 40 42 13 34 3 30
Source: Kuehlbrandt 2000 Table 16. Awareness of cyclones in Australia Frequency Percent Yes 163 74.1 No 57 25.9 Total 220 100.0 Source: Hoogenraad and van Eden 2003
13
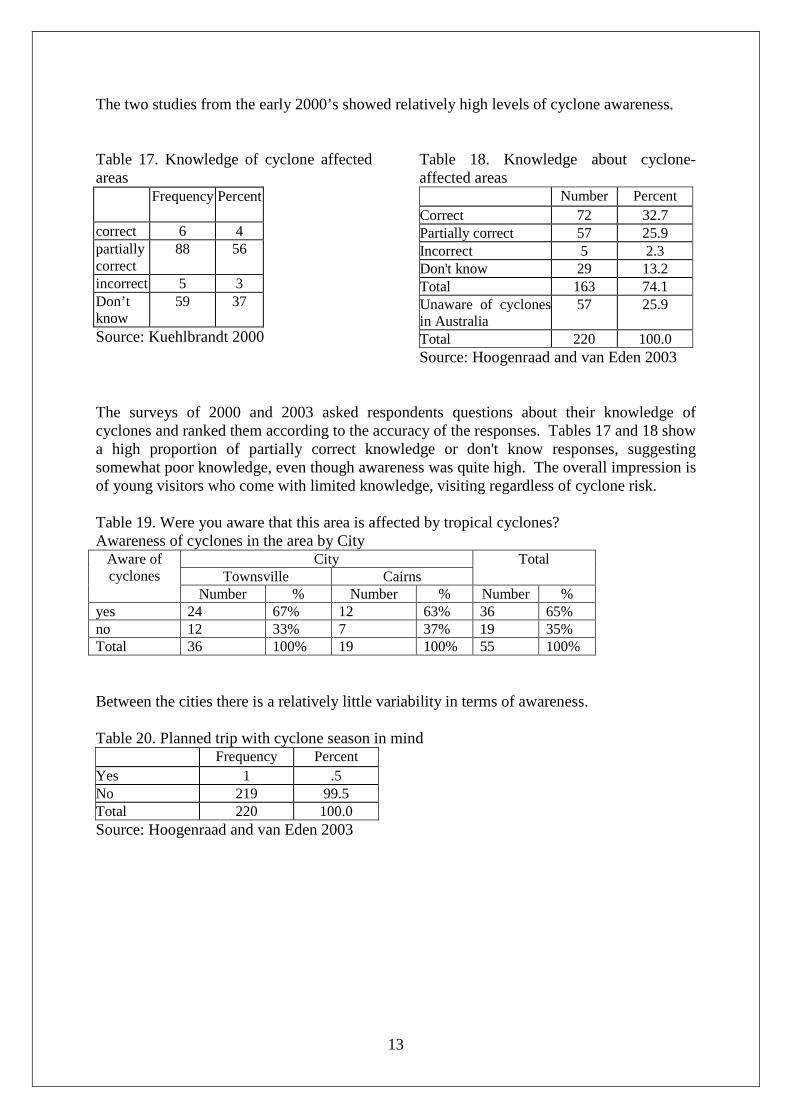
The two studies from the early 2000’s showed relatively high levels of cyclone awareness. Table 17. Knowledge of cyclone affected areas Frequency Percent
correct 6 4 partially correct
88 56
incorrect 5 3 Don’t know
59 37
Source: Kuehlbrandt 2000
Table 18. Knowledge about cyclone-affected areas Number Percent Correct 72 32.7 Partially correct 57 25.9 Incorrect 5 2.3 Don't know 29 13.2 Total 163 74.1 Unaware of cyclones in Australia
57 25.9
Total 220 100.0 Source: Hoogenraad and van Eden 2003
The surveys of 2000 and 2003 asked respondents questions about their knowledge of cyclones and ranked them according to the accuracy of the responses. Tables 17 and 18 show a high proportion of partially correct knowledge or don't know responses, suggesting somewhat poor knowledge, even though awareness was quite high. The overall impression is of young visitors who come with limited knowledge, visiting regardless of cyclone risk. Table 19. Were you aware that this area is affected by tropical cyclones? Awareness of cyclones in the area by City
Aware of cyclones
City Total Townsville Cairns
Number % Number % Number % yes 24 67% 12 63% 36 65% no 12 33% 7 37% 19 35% Total 36 100% 19 100% 55 100% Between the cities there is a relatively little variability in terms of awareness. Table 20. Planned trip with cyclone season in mind Frequency Percent Yes 1 .5 No 219 99.5 Total 220 100.0 Source: Hoogenraad and van Eden 2003
14
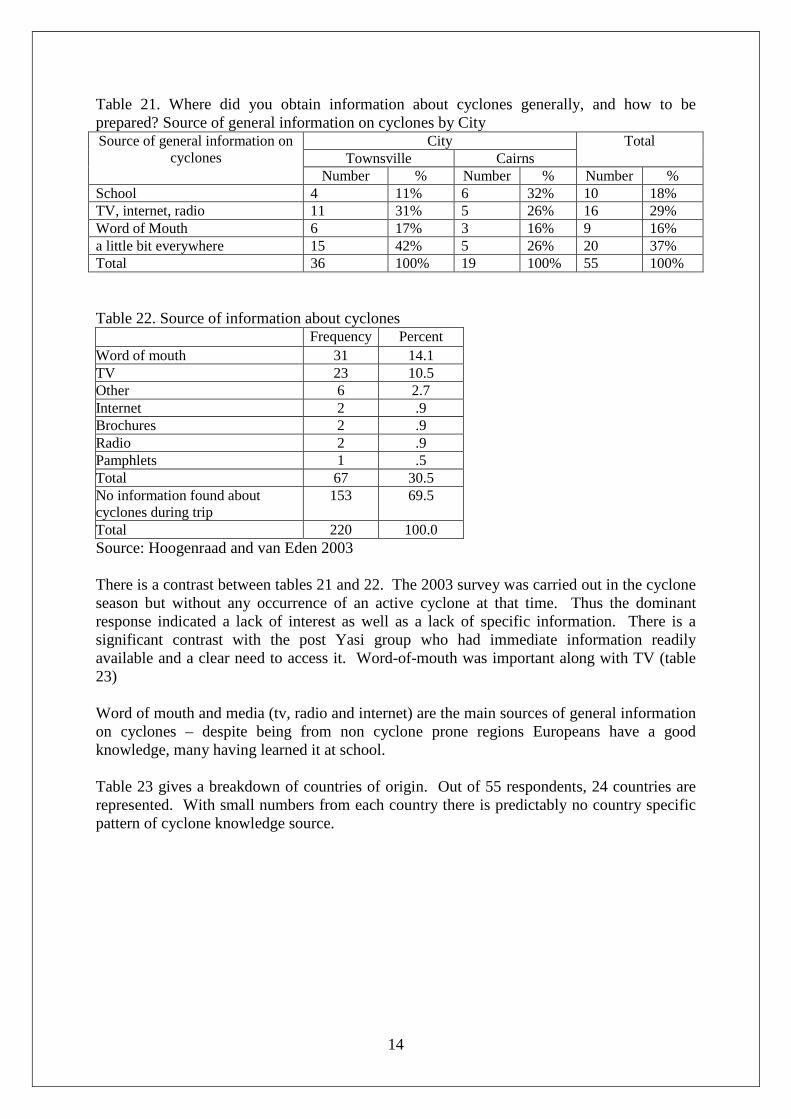
Table 21. Where did you obtain information about cyclones generally, and how to be prepared? Source of general information on cyclones by City Source of general information on
cyclones City Total
Townsville Cairns Number % Number % Number %
School 4 11% 6 32% 10 18% TV, internet, radio 11 31% 5 26% 16 29% Word of Mouth 6 17% 3 16% 9 16% a little bit everywhere 15 42% 5 26% 20 37% Total 36 100% 19 100% 55 100% Table 22. Source of information about cyclones Frequency Percent Word of mouth 31 14.1 TV 23 10.5 Other 6 2.7 Internet 2 .9 Brochures 2 .9 Radio 2 .9 Pamphlets 1 .5 Total 67 30.5 No information found about cyclones during trip
153 69.5
Total 220 100.0 Source: Hoogenraad and van Eden 2003 There is a contrast between tables 21 and 22. The 2003 survey was carried out in the cyclone season but without any occurrence of an active cyclone at that time. Thus the dominant response indicated a lack of interest as well as a lack of specific information. There is a significant contrast with the post Yasi group who had immediate information readily available and a clear need to access it. Word-of-mouth was important along with TV (table 23) Word of mouth and media (tv, radio and internet) are the main sources of general information on cyclones – despite being from non cyclone prone regions Europeans have a good knowledge, many having learned it at school. Table 23 gives a breakdown of countries of origin. Out of 55 respondents, 24 countries are represented. With small numbers from each country there is predictably no country specific pattern of cyclone knowledge source.

15
Table 23. Where did you obtain information about cyclones generally, and how to be prepared? Source of general information on cyclones based on country of origin Country of origin
Source of information on Yasi Word of mouth
TV newspaper Internet government text
from relatives outside NQ
a little bit from everywhere
Total
America 0 1 0 0 0 0 0 1 American 0 0 0 0 0 0 1 1 Argentina 1 0 0 1 0 0 0 2 Australia 2 0 0 0 0 1 0 3 Belgium 0 0 0 1 0 0 0 1 Brazil 1 0 0 0 0 0 0 1 Canada 0 0 1 0 0 0 0 1 Czech Republic
0 0 2 0 0 0 0 2
Denmark 3 0 0 0 0 0 0 3 England 0 0 1 0 0 0 0 1 Estonia 0 1 0 0 0 0 0 1 France 1 2 0 1 2 0 0 6 Germany 0 0 0 0 4 0 1 5 Holland 0 0 0 0 1 2 0 3 Italy 1 2 0 0 0 0 1 4 Japan 0 1 0 0 0 0 1 2 Lebanon 0 0 0 1 0 0 0 1 Madagascar 0 0 0 0 0 0 1 1 Mexico 1 0 0 0 0 0 0 1 New Zealand
1 1 0 1 0 1 0 4
Slovenia 0 0 0 0 0 0 1 1 South Korea
3 1 0 0 0 0 0 4
Spain 3 0 0 0 1 0 0 4 Sweden 0 1 0 0 0 0 0 1 Switzerland 0 0 0 1 0 0 0 1 Total 17 10 4 6 8 4 6 55 Table 24. What sort of preparations in case of cyclones had you made? Kind of preparations for cyclones by City
Kind of preparations City Total Townsville Cairns
Number % Number % Number % no preparation 27 75% 10 53% 37 67% training on what to for the house 1 3% 2 11% 3 5.5% training on what to do to protect oneself 2 5% 1 5% 3 5.5% training on what to do to help others 0 0% 1 5% 1 2% general training (house, oneself, others) 6 17% 5 26% 11 20% Total 36 100% 19 100 55 100%

16
There is significant variation between the pre-cyclone 2003 study where the strongest response was to seek information, and the post-Yasi survey where two thirds stated having made no general preparations. It's interesting that in 2003 30% indicated an intention to evacuate, which became a reality for many of those interviewed after Yasi. 20% of the respondents in this study had received some kind of training on how to protect themselves, other people and property from cyclones, but a large majority had not been prepared for this kind of event and didn't really know what to do. However, without knowing it they showed the right reaction to prepare themselves for the cyclone -- looking for a shelter, buying food and seeking information. Table 25. What to do in case of a cyclone Frequency Percent Seek information 91 41.4 Evacuate 65 29.5 Shelter 39 17.7 Stay 18 8.2 Don't know 5 2.3 Call emergency services 2 .9 Total 220 100.0 Source: Hoogenraad and van Eden 2003 The 2003 study showed that only a few people had received information on cyclones during their trip, but if they had, it had been useful, whereas most people before Yasi had received information, although many thought it wasn't really useful. The differences indicated in tables 26 and 27 are statistically significantly different, but of course, so was the experience to which the backpackers were responding at each survey Table 26. How useful was the cyclone information you had received? Usefulness of cyclone information by City
Usefulness of cyclone information
City Total Townsville Cairns
Number % Number % Number % really useful 5 14% 5 26% 10 18% useful 13 36% 9 48% 22 40% not really useful 18 50% 5 26% 23 42% Total 36 100% 19 100% 55 100% In Hoogenraad and van Eden’s 2003 study only a few people had received information on cyclones during their trip but if they had, it had been useful, whereas most people in the 2011 study had received information but many thought it wasn’t really useful. Table 27. How useful was the information about cyclones? Frequency Percent Very 25 11.4 Moderate 24 10.9 Not 14 6.4 No response 4 1.8 Total 67 30.5 No information about cyclones during trip 153 69.5 Total 220 100.0 Source: Hoogenraad and van Eden 2003

17
Demographics Table 28. Age by City
Age City Total Townsville Cairns
Number % Number % Number % less than 20 1 3% 2 11% 3 5% between 20 and 25 13 36% 10 53% 23 42% between 26 and 30 13 36% 5 26% 18 33% between 30 and 40 5 14% 1 5% 6 11% more than 40 4 11% 1 5% 5 9% Total 36 100 19 100 55 100 The 20 to 25 year age cohort was the main group in each study, then 26 to 30 years, while less than 20 and more than 30 years were much smaller proportions. Backpackers are young and generally well educated and informed about the destination to which they travel, although that does not necessarily extend to hazards. Table 29. Age of backpackers
Frequency Percent 0-19 15 9 20-25 95 60 26-30 38 24 31-40 10 6 Source: Kuehlbrandt 2000
Table 30. Age of backpackers Frequency Percent 0-15 Years old 1 .5 16-19 Years old 27 12.3 20-25 Years old 137 62.3 26-30 Years old 41 18.6 31-40 Years old 12 5.5 >40 Years old 2 .9 Total 220 100.0 Source: Hoogenraad and van Eden 2003
Gender: the 2003 and 2000 surveys interviewed larger numbers of respondents and covered roughly equal numbers of males and females. In this smaller survey there were slightly more males amongst the backpackers. It is reasonable to assume that generally there are probably equal proportions of males and females amongst backpackers in Australia.

18
Table 31. What is your first language? Language by City Language City Total
Townsville Cairns Number Number Number %
Czech 2 0 2 4% Danish 3 0 3 5.5% Dutch 3 0 3 5.5% English 7 4 11 20% Estonian 1 0 1 2% French 4 3 7 13% German 3 2 5 9% Hungarian 0 1 1 2% Italian 4 0 4 7% Japanese 0 2 2 4% Korean 4 0 4 7% Lebanese 0 1 1 2% Malagasy 1 0 1 2% Portuguese 0 1 1 2% Slovenian 0 1 1 2% Spanish 3 4 7 13% Swedish 1 0 1 2% Total 36 19 55 100% The majority of backpackers were from Europe (86% in 2003 and 62% in this study). While the earlier studies identified a far greater proportion of UK origin and backpackers in their studies in Cairns, at this time the UK economy is much more depressed than it was in 2003. The nature of small surveys throws up a variability in details, but all three surveys show that backpackers have a good knowledge of English. Table 32. Origin of Backpackers Frequency Percent UK 102 46.4 Europe (except UK) 88 40.0 USA and Canada 13 5.9 Israel 8 3.6 Asia 4 1.8 New Zealand 3 1.4 Other 2 .9 Total 220 100.0 Source: Hoogenraad and van Eden 2003 Table 33. How good is your understanding of written and spoken English? Level of English by City
Level of English City Total Townsville Cairns
Number % Number % Number % low 3 8% 0 0% 3 6% middle 9 25% 7 37% 16 29% good 17 47% 9 47% 26 47% mother tongue 7 20% 3 16% 10 18% Total 36 100% 19 100% 55 100%
19
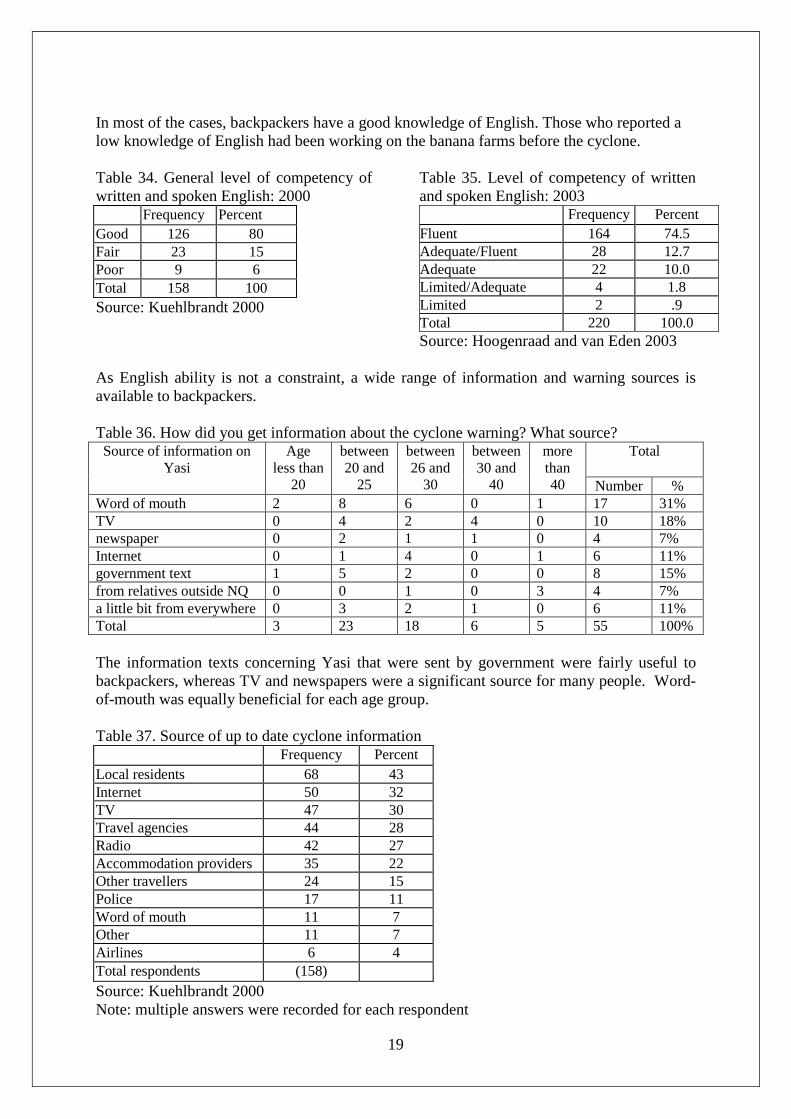
In most of the cases, backpackers have a good knowledge of English. Those who reported a low knowledge of English had been working on the banana farms before the cyclone. Table 34. General level of competency of written and spoken English: 2000 Frequency Percent Good 126 80 Fair 23 15 Poor 9 6 Total 158 100 Source: Kuehlbrandt 2000
Table 35. Level of competency of written and spoken English: 2003 Frequency Percent Fluent 164 74.5 Adequate/Fluent 28 12.7 Adequate 22 10.0 Limited/Adequate 4 1.8 Limited 2 .9 Total 220 100.0 Source: Hoogenraad and van Eden 2003
As English ability is not a constraint, a wide range of information and warning sources is available to backpackers. Table 36. How did you get information about the cyclone warning? What source? Source of information on
Yasi Age
less than 20
between 20 and
25
between 26 and
30
between 30 and
40
more than 40
Total
Number % Word of mouth 2 8 6 0 1 17 31% TV 0 4 2 4 0 10 18% newspaper 0 2 1 1 0 4 7% Internet 0 1 4 0 1 6 11% government text 1 5 2 0 0 8 15% from relatives outside NQ 0 0 1 0 3 4 7% a little bit from everywhere 0 3 2 1 0 6 11% Total 3 23 18 6 5 55 100% The information texts concerning Yasi that were sent by government were fairly useful to backpackers, whereas TV and newspapers were a significant source for many people. Word-of-mouth was equally beneficial for each age group. Table 37. Source of up to date cyclone information
Frequency Percent Local residents 68 43 Internet 50 32 TV 47 30 Travel agencies 44 28 Radio 42 27 Accommodation providers 35 22 Other travellers 24 15 Police 17 11 Word of mouth 11 7 Other 11 7 Airlines 6 4 Total respondents (158) Source: Kuehlbrandt 2000 Note: multiple answers were recorded for each respondent

20
Table 38. Source of up to date cyclone information Frequency Percent of all
responses Percent of actual responses
Internet 161 36.6 61.0 TV 29 6.6 11.0 Travel agencies 20 4.5 7.6 News(papers) 13 3.0 4.9 Library 11 2.5 4.1 No response 6 1.4 2.3 Local residents 5 1.1 1.9 Don't know 4 .9 1.5 Radio 3 .7 1.1 Word of mouth 3 .7 1.1 Other 3 .7 1.1 Accommodation providers 2 .5 .8 Other travellers 2 .5 .8 Guidebook 2 .5 .8 Total 264 60.0 100 No 2nd answer given 176 40.0 Total respondents 440 100.0 Source: Hoogenraad and van Eden 2003 Note: multiple answers were recorded for each respondent Table 36 records specific information on Yasi, whereas each of the other surveys recorded a range of cyclone information at a time when there was no threat. The variability of internet use is interesting. This may partly reflect the lack of IT sites about cyclones and probably a lack of backpacker knowledge of sites such as the Bureau of Meteorology.

21
Evacuation Backpackers are an important component of the North Queensland economy. While they generally spend minimal amounts of money on food and accommodation, they are major consumers of adventure and recreational activities. In the past backpackers were disparaged as a minor contribution to tourism but his attitude has changed over time. They are part of a significant component of the independent visitors who not only consume a niche of the tourist market but who also stay for extended periods of time. An important part of the trip for many backpackers is employment at tourist locations and on farms in adjacent areas. In North Queensland many backpackers work in bars and restaurants etc, but significant numbers also work on farms, fruit picking and packing, as in the mango and banana industries, and in various jobs on cattle stations in the outback. As Yasi approached many backpackers on coastal farms were told to evacuate, often without instructions as to where, and finding no official support or transport in evacuating. Additionally, people at vulnerable beachfront tourist locations were ordered to evacuate en masse. Magnetic Island and beachside suburbs in Townsville and Cairns were evacuated prior to Yasi. Media estimates suggested that 75,000 people were evacuated in Queensland during the period of the floods and cyclones from late December to early February (Townsville Bulletin 12/2/11). This could constitute the biggest natural disaster evacuation in Australian history. Evacuation may not have been long distance or of long duration for many, but it was part of the 2010/11 wet season experience for large numbers of people. The evacuation experience was an important part of the survey, with the following tables detailing the extent and pattern of the experience for a small number of backpackers.

22
Table 39. Were you told to evacuate or did you make your own decision to evacuate? Evacuation Decision by City Evacuation Decision City Total
Townsville Cairns Number % Number % Number %
own decision 9 25% 1 5% 10 18% told to evacuate 12 33% 10 53% 22 40% didn't evacuate 15 42% 8 42% 23 42% Total 36 100% 19 100% 55 100% The proportions evacuated to Townsville and Cairns were the same. Almost 70% of people who evacuated had been told to do so, especially those who were interviewed in Cairns. A relatively small number took the decision themselves.

23
Table 40. As the cyclone approached were you staying at a place where you had to evacuate? If yes where? Origin Location of Evacuees by City
Places Evacuated from City Total Townsville Cairns
Number % Number % Number % from Cardwell 2 6% 0 0% 2 4% from Tully 3 8% 0 0% 3 5.5% from the coastline 14 39% 11 58% 25 45.5% from Magnetic Island 2 6% 0 0% 2 4% Not evacuated 15 41% 8 42% 23 42% Total 36 100% 19 100% 55 100% These specific areas that were evacuated were the coastline in general, Cardwell, Tully Coast and Magnetic Island. Those who had evacuated from Cardwell and Tully involved people who had been working on fruit and banana farms. The majority of evacuees had been staying in a variety of seafront locations. People commented on the lack of specific advice on being told to evacuate and on the lack of facilities etc, especially in Townsville.

24
Cyclone Experience Table 41. Was it the first cyclone you have experienced? First personally experienced Cyclone by City
First Cyclone
City Total Townsville Cairns
Number % Number % Number % yes 26 72% 12 63% 38 69% no 10 28% 7 37% 17 31% Total 36 100% 19 100% 55 100% For most people this was their first experience of a cyclone: 69% of the backpackers hadn't experienced a cyclone before Yasi. In the 2003 survey 69% of backpackers had never travelled in cyclone prone areas of Australia before. Table 42. Lived in a cyclone prone area: 2003 Frequency Percent Yes 13 5.9 No 207 94.1 Total 220 100.0 Source: Hoogenraad and van Eden 2003
Table 43. Travelled in a cyclone prone area: 2003 Frequency Percent Yes 67 30.5 No 151 68.6 Don't know 2 .9 Total 220 100.0 Source: Hoogenraad and van Eden 2003
The 2003 survey showed that most backpackers had come to North Queensland without any direct cyclone experience. Most previous experiences of cyclones had been in America and Asia. (There is an insignificant discrepancy of one person between tables 41 and 44.) Table 44. Have you ever experienced a cyclone or hurricane before? If yes, where was it? Place previously experienced cyclone by City
Place previously experienced cyclone
City Total Townsville Cairns
Number % Number % Number % No experience 27 75% 12 64% 39 71% America 1 3% 2 10.5% 3 5% Asia 1 3% 2 10.5% 3 5% Australia 0 0% 1 5% 1 2% Australia, Asia, America 1 3% 0 0% 1 2% Australia, Louisiana 1 3% 0 0% 1 2% Haiti 0 0% 1 5% 1 2% Korea 4 10% 0 0% 4 7% Martinique 1 3% 0 0% 1 2% Pacific islands 0 0% 1 5% 1 2% Total 36 100% 19 100% 55 100%
25
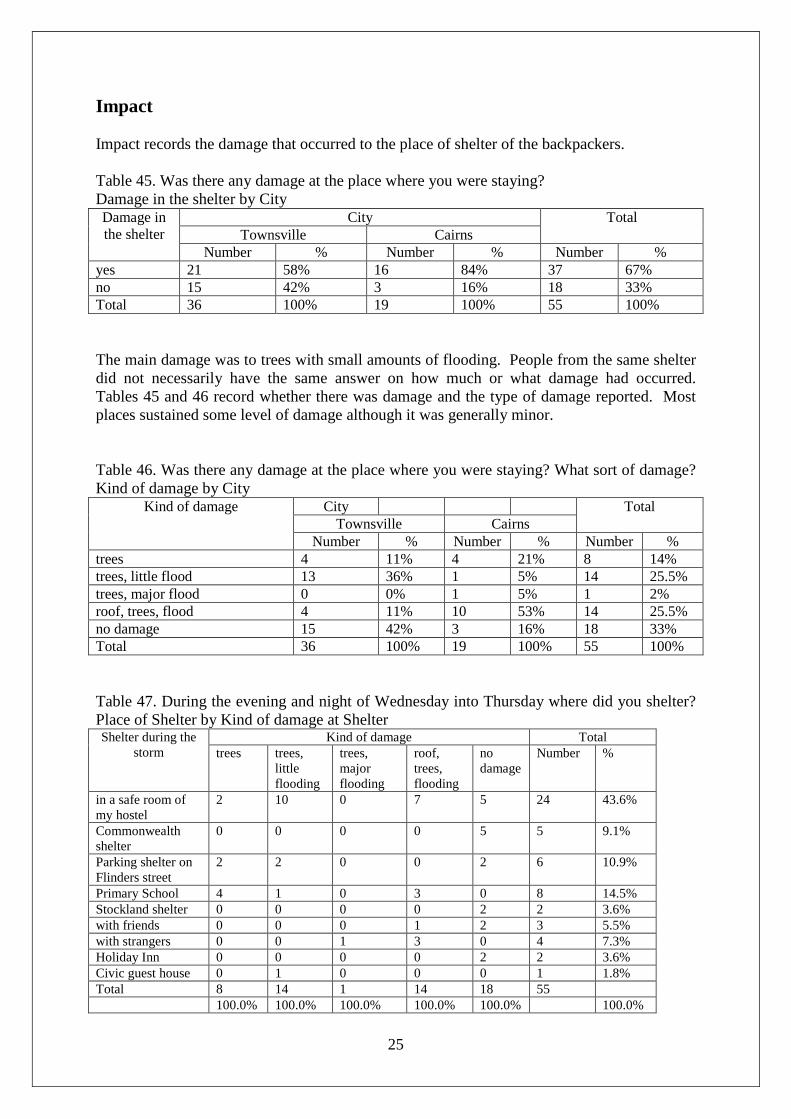
Impact Impact records the damage that occurred to the place of shelter of the backpackers. Table 45. Was there any damage at the place where you were staying? Damage in the shelter by City Damage in the shelter
City Total Townsville Cairns
Number % Number % Number % yes 21 58% 16 84% 37 67% no 15 42% 3 16% 18 33% Total 36 100% 19 100% 55 100% The main damage was to trees with small amounts of flooding. People from the same shelter did not necessarily have the same answer on how much or what damage had occurred. Tables 45 and 46 record whether there was damage and the type of damage reported. Most places sustained some level of damage although it was generally minor. Table 46. Was there any damage at the place where you were staying? What sort of damage? Kind of damage by City
Kind of damage City Total Townsville Cairns
Number % Number % Number % trees 4 11% 4 21% 8 14% trees, little flood 13 36% 1 5% 14 25.5% trees, major flood 0 0% 1 5% 1 2% roof, trees, flood 4 11% 10 53% 14 25.5% no damage 15 42% 3 16% 18 33% Total 36 100% 19 100% 55 100% Table 47. During the evening and night of Wednesday into Thursday where did you shelter? Place of Shelter by Kind of damage at Shelter Shelter during the
storm Kind of damage Total
trees trees, little flooding
trees, major flooding
roof, trees, flooding
no damage
Number %
in a safe room of my hostel
2 10 0 7 5 24 43.6%
Commonwealth shelter
0 0 0 0 5 5 9.1%
Parking shelter on Flinders street
2 2 0 0 2 6 10.9%
Primary School 4 1 0 3 0 8 14.5% Stockland shelter 0 0 0 0 2 2 3.6% with friends 0 0 0 1 2 3 5.5% with strangers 0 0 1 3 0 4 7.3% Holiday Inn 0 0 0 0 2 2 3.6% Civic guest house 0 1 0 0 0 1 1.8% Total 8 14 1 14 18 55 100.0% 100.0% 100.0% 100.0% 100.0% 100.0%

26
Table 47 indicates the places where backpackers stayed during the night of Yasi and the sort of damage that occurred to each place. Many evacuation shelters opened up during Wednesday and people went to them regardless of whether or not they needed to. Centres were specifically intended for those who were told to evacuate, but many nervous citizens and tourists went to them for shelter. Consequently some were overcrowded and stressful. Table 48. Impacts of cyclone Steve on the accommodation facility: 2000 Number Percent no impact, no damage 11 52 no tourists - bad business 6 29 damage to building 5 24 debris 5 24 power loss 4 19 flooding/water damage 3 14 adverse media 2 10 public transport 2 10 no impact on business, people stayed longer
1 5
Total respondents 21 Source: Kuehlbrandt 2000 Note: multiple answers were recorded for each respondent
Table 49. Possible impacts of cyclones on the accommodation facilities according to backpackers owners
Frequency Percent Power failure 12 57 Severe winds 10 48 Damage from flying debris 8 38 Flooding 7 33 Storm surge 5 24 All 4 19 None 1 5 Other 1 5 Total respondents 21 Source: Kuehlbrandt 2000 Note: multiple answers were recorded for each respondent
The 2000 survey was carried out in the latter half of 2000 during the dry season, but cyclone Steve had crossed Cairns earlier in the year, at a slightly stronger impact than that of Yasi in Cairns. The 2000 survey interviewed the staff or owners of 21 backpacker establishments and the 2003 survey interviewed staff or owners of 16 accommodation facilities. Tables 48 to 50 suggest a broadly similar impact had occurred in 2000 to that in Townsville and Cairns during Yasi. Table 50. Possible damage at facility in case of a cyclone according to backpackers owners Frequency Percent Storm surge 4 25.0 Severe winds 3 18.8 Damage from flying debris 4 25.0 Power failure 1 6.3 Wouldn't 1 6.3 Other 1 6.3 No second answer given 2 12.5 Total answers given 16 100.0 Source: Hoogenraad and van Eden 2003

27
The expectation of cyclone damage varied considerably between the two surveys, the numbers were small and many premises were different between the surveys. Table 51. Did the place you were staying at lose power? How long for? Loss of power by City
Loss of power City Total Townsville Cairns
Number % Number % Number % yes between 1 day and 3 days 5 14% 4 21% 9 16% yes more than 3 days 13 36% 8 42% 21 38% Yes the whole time in the shelter 11 31% 6 32% 17 31% no 7 19% 1 5% 8 15% Total 36 100% 19 100% 55 100% The majority of backpackers experienced loss of power, many for more than three days. Part of awareness education is to be prepared for loss of power for at least three days. Extreme wind damage to vegetation resulted in a widespread power loss in both cities. Table 52. Did the place at which you were staying lose water? How long for? Loss of water by City
Loss of water City Total Townsville Cairns
Number % Number % Number % yes few hours 5 14% 3 16% 8 14.5% no 31 86% 16 84% 47 85.5% Total 36 100% 19 100% 55 100% The loss of water was a minor issue: only 15% and for just a few hours. At a point shortly after the cyclone Townsville's main water supply was in danger of failure, but the power was restored to pumps just before storage was exhausted. More remote locations experienced longer loss of water, but this did not affect most backpackers.

28
Personal Impact Table 53. Would you have come to North Queensland if you had known this would happen? Decision to come to NQ if Yasi had been predicted by City Visit to NQ
if Yasi predicted
City Total Townsville Cairns
Number % Number % Number % yes 17 47% 13 68% 30 55% no 19 53% 6 32% 25 45% Total 36 100% 19 100% 55 100% Almost half of the backpackers would have changed their trip plans if they had known about Yasi beforehand. The 2003 survey showed that there was no real influence on preparedness of the choice of accommodation and that people didn't think about the cyclone season when they decided to come to Australia. The 2000 study showed a slightly higher consideration of cyclone risk. As Table 53 shows, the experience of the cyclone probably made backpackers more cautious about the choice they might have made. Table 54. Influence of cyclone preparedness on choice of accommodation
Frequency Valid Percent
Yes 32 21 Yes, in cyclone season 34 22 No 86 55 Do not know 6 2 Total 158 100 Source: Kuehlbrandt 2000
Table 55. Influence of cyclone preparedness on choice of accommodation Frequency Percent Yes 50 22.7 No 164 74.5 Don't know 6 2.7 Total 220 100.0 Source: Hoogenraad and van Eden 2003
Table 56. Do you have any other comments? Significant Issues: Expectation of ending up in this city during the cyclone by City
Expectation of ending up in this
city before, during or after the cyclone
City Total Townsville Cairns
Number % Number % Number %
yes 15 42% 16 84% 31 56% no 21 58% 3 16% 24 44% Total 36 100% 19 100% 55 100% Almost half of the backpackers did not expect to come to this location or to stop there during their trip. This was especially the case in Townsville where 58% felt that they were there against their will. The survey question tabulated in Table 57 was an open-ended statement about a variety of issues. These were diverse, some negative, some positive, but a repeated issue was the unexpectedness of their destination during the cyclone -- a consequence of evacuation. For many, being in Townsville was neither planned nor desired.

29
Table 57. How do you feel about the whole cyclone experience? Feeling about the whole cyclone experience by City
Feeling about the whole experience
City Total Townsville Cairns
Number % Number % Number % scary experience 9 25% 4 21% 13 24% disappointed 13 36% 8 42% 21 38% enjoyed it 3 8% 2 11% 5 9% nothing in particular 11 31% 5 26% 16 29% Total 36 100% 19 100% 55 100% Many backpackers were disappointed by the whole experience of the cyclone. Because of all the warning information beforehand they thought it would be a major disaster but felt that it wasn't really that bad. Only a minority found it scary -- perhaps to be expected of the dominantly youthful set of respondents. Table 58. After the cyclone had passed did you have any problems getting food to eat? How did you feed yourself? Issues to find food - if yes what did you eat by City Issues to find food - if yes
what did you eat City Total
Townsville Cairns Number % Number % Number %
yes - didn't eat 5 14% 3 16% 8 14% yes - had small stock 10 28% 3 16% 13 24% yes - bread 6 17% 3 16% 9 16% yes - noodles 8 22% 4 21% 12 22% yes - hotel restaurant 7 19% 0 0% 7 13% no 0 0% 6 32% 6 11% Total 36 100% 19 100% 55 100%

30
The problem of finding food after the cyclone was greatest in Townsville, but generally this issue impacted the majority of backpackers. With power off, shops closed and many having been evacuated at short notice food was a major problem for almost 90% of the backpackers. Table 59. Did you receive any assistance? Source of Assistance by City
Assistance from City Total Townsville Cairns
Number % Number % Number % the staff of the shelter 10 28% 5 26% 15 27% other tourists 1 3% 0 0% 1 2% official and voluntary organisations 9 25% 6 32% 15 27% other tourists and official tourists 1 3% 1 5% 2 4% the staff and official organisations 0 0% 2 11% 2 4% the staff and tourists 3 8% 1 5% 4 7% no assistance 12 33% 4 21% 16 29% Total 36 100% 19 100% 55 100% The previous tables have indicated more general impacts. Table 59 records the type and source of assistance backpackers received during and after the cyclone. 71% of backpackers reported having received assistance from the staff of their shelters or from official organisations: information and food, and some assistance from other tourists. Assistance helped individuals in regaining confidence. Table 60. What sort of assistance did you get and who from? Kind of assistance by City
Kind of assistance City Total Townsville Cairns
Number % Number % Number % information and advice 9 25% 12 63% 21 38% food and water 2 6% 0 0% 2 4% light, food, information 8 22% 1 5% 9 16% confidence 5 14% 2 11% 7 13% no assistance 12 33% 4 21% 16 29% Total 36 100% 19 100% 55 100% The type of assistance received particularly involved information and advice. Food and water were less forthcoming in terms of assistance, although the giving of confidence -- lifting morale -- is an important observation.
31
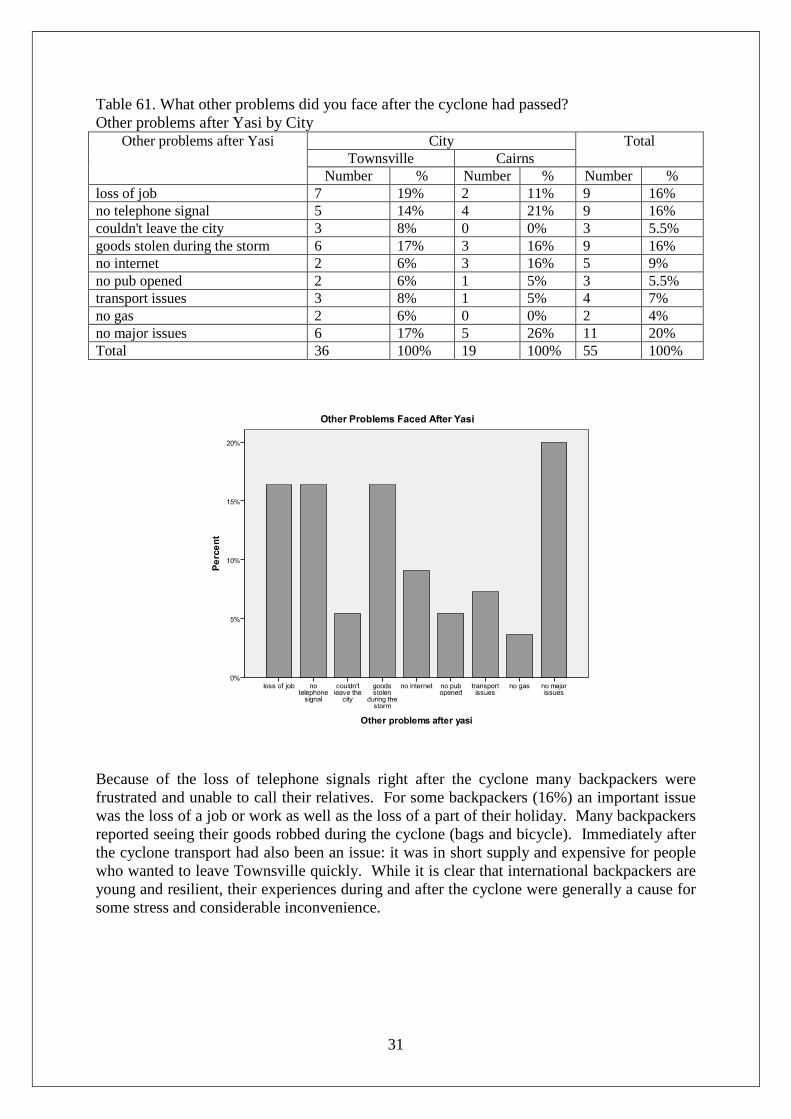
Table 61. What other problems did you face after the cyclone had passed? Other problems after Yasi by City
Other problems after Yasi City Total Townsville Cairns
Number % Number % Number % loss of job 7 19% 2 11% 9 16% no telephone signal 5 14% 4 21% 9 16% couldn't leave the city 3 8% 0 0% 3 5.5% goods stolen during the storm 6 17% 3 16% 9 16% no internet 2 6% 3 16% 5 9% no pub opened 2 6% 1 5% 3 5.5% transport issues 3 8% 1 5% 4 7% no gas 2 6% 0 0% 2 4% no major issues 6 17% 5 26% 11 20% Total 36 100% 19 100% 55 100%
Because of the loss of telephone signals right after the cyclone many backpackers were frustrated and unable to call their relatives. For some backpackers (16%) an important issue was the loss of a job or work as well as the loss of a part of their holiday. Many backpackers reported seeing their goods robbed during the cyclone (bags and bicycle). Immediately after the cyclone transport had also been an issue: it was in short supply and expensive for people who wanted to leave Townsville quickly. While it is clear that international backpackers are young and resilient, their experiences during and after the cyclone were generally a cause for some stress and considerable inconvenience.

32
Travel Patterns of Backpackers Table 62. How you have assisted each other? Help to other people by City
Help to other people City Total Townsville Cairns
Number % Number % Number % no help 15 42% 13 68% 28 51% made them calm 16 44% 4 21% 20 36% cooked 2 6% 1 5% 3 6% gave information 3 8% 1 5% 4 7% Total 36 100% 19 100% 55 100% Table 62 indicates significant provision of help and assistance by the backpackers towards others, primarily helping other backpackers. Making people calm is significant and relates to the idea of regaining confidence as stated earlier. Table 63. How long are you staying in Australia? Length of stay in Australia by City Length of stay in Australia City Total
Townsville Cairns Number % Number % Number %
less than one month 1 3% 0 0% 1 2% between 1 month and 3 months 10 28% 3 16% 13 24% between 3 months and 6 months 7 19% 3 16% 10 18% between 6 months and 1 year 5 14% 6 32% 11 20% more than 1 year 9 25% 1 5% 10 18% don't know 4 11% 6 32% 10 18% Total 36 100% 19 100% 55 100% Table 64. Length of stay in Australia: 2000
Frequency Percent < 2 weeks 1 1 < 2 months 20 14 < 4 months 28 20 < 6 months 10 7 < 8 months 18 13 < 10 months 2 1 10-12 months 56 39 > 1 year 7 5 Source: Kuehlbrandt 2000
Table 65. Length of stay in Australia: 2003 Frequency Percent < 2 weeks 1 .5 2 weeks < 2 months 54 24.5 2 months < 4 months 68 30.9 4 months < 6 months 31 14.1 6 months < 8 months 22 10.0 8 months < 10 months 7 3.2 10 months - 12 months 33 15.0 > 1 year 4 1.8 Total 220 100.0 Source: Hoogenraad and van Eden 2003
All three surveys show that the majority of backpackers stay in Australia for extended periods of time, contributing significantly to the economy. They are required on arrival to bring significant financial resources to support themselves and many have visas that permit employment.
33
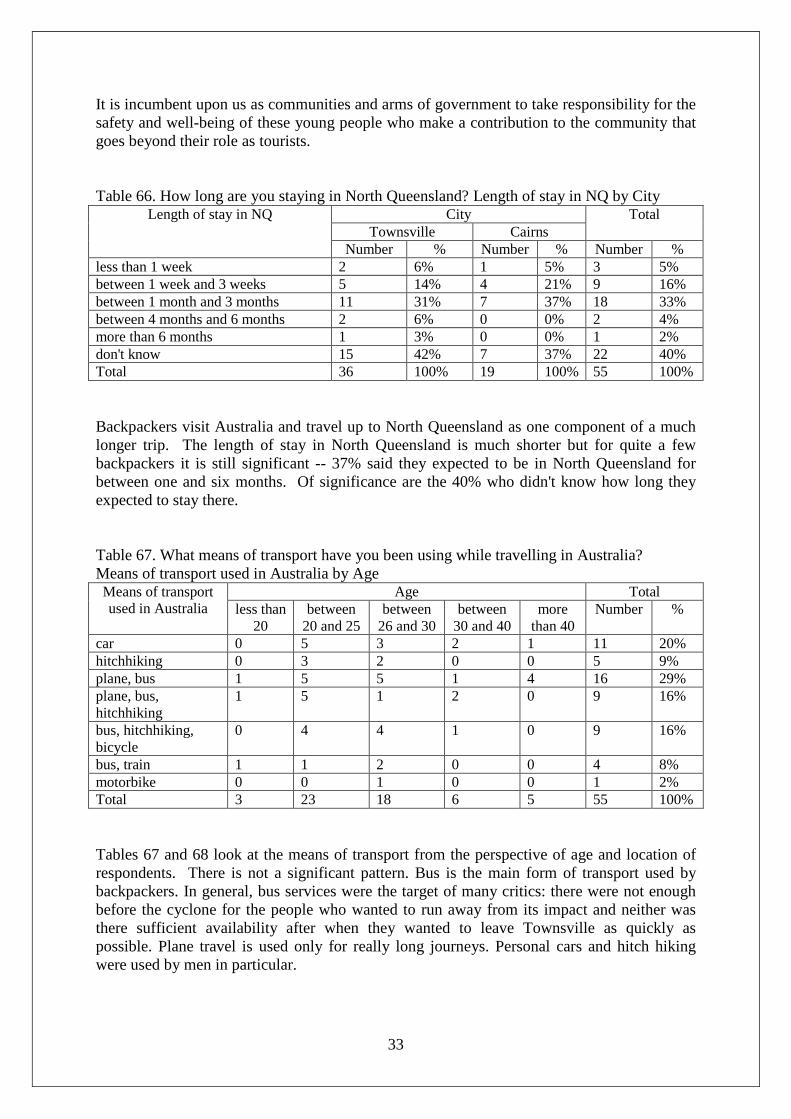
It is incumbent upon us as communities and arms of government to take responsibility for the safety and well-being of these young people who make a contribution to the community that goes beyond their role as tourists. Table 66. How long are you staying in North Queensland? Length of stay in NQ by City
Length of stay in NQ City Total Townsville Cairns
Number % Number % Number % less than 1 week 2 6% 1 5% 3 5% between 1 week and 3 weeks 5 14% 4 21% 9 16% between 1 month and 3 months 11 31% 7 37% 18 33% between 4 months and 6 months 2 6% 0 0% 2 4% more than 6 months 1 3% 0 0% 1 2% don't know 15 42% 7 37% 22 40% Total 36 100% 19 100% 55 100% Backpackers visit Australia and travel up to North Queensland as one component of a much longer trip. The length of stay in North Queensland is much shorter but for quite a few backpackers it is still significant -- 37% said they expected to be in North Queensland for between one and six months. Of significance are the 40% who didn't know how long they expected to stay there. Table 67. What means of transport have you been using while travelling in Australia? Means of transport used in Australia by Age Means of transport used in Australia
Age Total less than
20 between
20 and 25 between
26 and 30 between
30 and 40 more
than 40 Number %
car 0 5 3 2 1 11 20% hitchhiking 0 3 2 0 0 5 9% plane, bus 1 5 5 1 4 16 29% plane, bus, hitchhiking
1 5 1 2 0 9 16%
bus, hitchhiking, bicycle
0 4 4 1 0 9 16%
bus, train 1 1 2 0 0 4 8% motorbike 0 0 1 0 0 1 2% Total 3 23 18 6 5 55 100% Tables 67 and 68 look at the means of transport from the perspective of age and location of respondents. There is not a significant pattern. Bus is the main form of transport used by backpackers. In general, bus services were the target of many critics: there were not enough before the cyclone for the people who wanted to run away from its impact and neither was there sufficient availability after when they wanted to leave Townsville as quickly as possible. Plane travel is used only for really long journeys. Personal cars and hitch hiking were used by men in particular.

34
Table 68. What means of transport have you been using while travelling in Australia? Means of transport used in Australia by City
Means of transport used in Australia
City Total Townsville Cairns
Number % Number % Number % bus 4 11% 0 .0% 4 7% car 9 25% 2 10.5% 11 20% hitchhiking 2 6% 3 16% 5 9% plane, bus 10 28% 2 10.5% 12 22% plane, bus, hitchhiking 3 8% 6 32% 9 16% bus, hitchhiking, bicycle 5 14% 4 21% 9 16% bus, train 3 8% 1 5% 4 7% motorbike 0 0% 1 5% 1 2% Total 36 100% 19 100% 55 100% Table 69. Transport use Type of transport
Percentage of use 1-20% 21-40% 41-60% 61-80% 81-100% Total F % F % F % F % F % F %
4WD 16 64 1 4 1 4 0 0 7 28 25 16 motor bike 1 50 0 0 0 0 0 0 1 50 2 1 hitchhiking 2 20 3 30 1 10 2 20 2 20 10 6 train 4 27 7 47 4 27 0 0 0 0 15 9 motor car 10 17 7 12 8 14 8 14 26 44 59 37 bicycle 3 38 1 13 0 0 1 13 3 38 8 5 bus 16 15 11 10 17 16 21 20 42 39 107 68 plane 36 55 8 12 11 17 5 8 6 9 66 42 other 1 20 3 60 0 0 1 20 0 0 5 3 Source: Kuehlbrandt 2000 Table 70. Main transport use Frequency Percent Bus 149 67.7 Car 44 20.0 Plane 16 7.3 Van 5 2.3 Train 3 1.4 4WD 1 .5 Bicycle 1 .5 Hitchhiking 1 .5 Total 220 100.0 Source: Hoogenraad and van Eden 2003 The 2000 and 2003 surveys show some similar results. Hitchhiking was a significant means of travel in earlier decades but for the current generation of backpackers it has dropped to a very low level, probably consequent upon some well-publicised horror stories, backed up by advice to refrain from hitchhiking.

35
Table 71. Have you been travelling in Australia alone, or with friends or other visitors? Travel mates by City
Travel mates City Total Townsville Cairns
Number % Number % Number % alone 16 44% 10 53% 26 47% with my partner 6 17% 2 10% 8 15% with friend(s) 13 36% 3 16% 16 29% with my family 1 3% 4 21% 5 9% Total 36 100% 19 100% 55 100% The majority of backpackers travel with other people (friends mostly) but a significant number travel alone (35% in 2000, 31% in 2003 and 47% in this survey). These individuals are potentially more vulnerable than those who are part of informal groups. Backpackers are not part of formal or commercial organised groups. Table 72. Size of travel group
Frequency Valid Percent
Small informal group 99 63 Alone 56 35 Organised group 3 2 Source: Kuehlbrandt 2000
Table 73. Size of travel group Frequency Percent Alone 69 31.4 Small informal group 149 67.7 Group 2 .9 Total 220 100.0 Source: Hoogenraad and van Eden 2003
Travelling in small informal groups was dominant in the 2000 and 2003 surveys. The fact that this is a much lower proportion in the post Yasi survey, where those travelling alone formed a much higher percentage, may partly be attributable to the evacuation experience, where the move was made hurriedly and at short notice. This also could explain the relatively high rate of loss of belongings from crime.
36
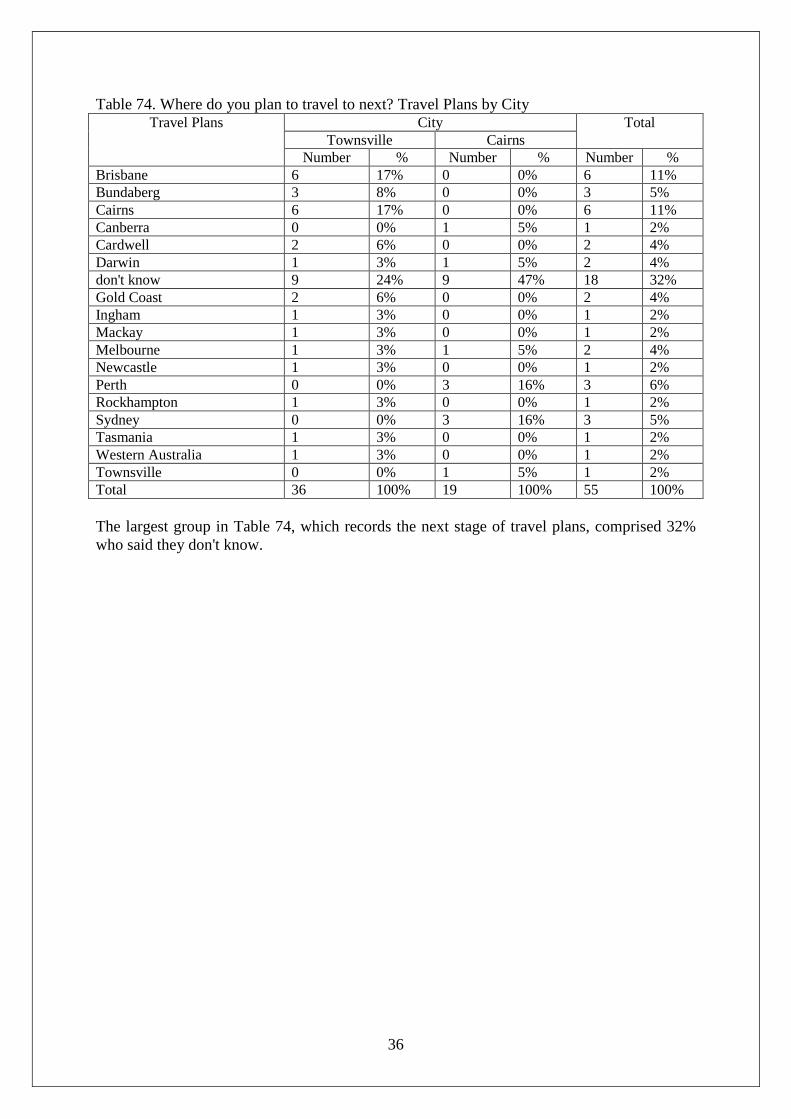
Table 74. Where do you plan to travel to next? Travel Plans by City Travel Plans City Total
Townsville Cairns Number % Number % Number %
Brisbane 6 17% 0 0% 6 11% Bundaberg 3 8% 0 0% 3 5% Cairns 6 17% 0 0% 6 11% Canberra 0 0% 1 5% 1 2% Cardwell 2 6% 0 0% 2 4% Darwin 1 3% 1 5% 2 4% don't know 9 24% 9 47% 18 32% Gold Coast 2 6% 0 0% 2 4% Ingham 1 3% 0 0% 1 2% Mackay 1 3% 0 0% 1 2% Melbourne 1 3% 1 5% 2 4% Newcastle 1 3% 0 0% 1 2% Perth 0 0% 3 16% 3 6% Rockhampton 1 3% 0 0% 1 2% Sydney 0 0% 3 16% 3 5% Tasmania 1 3% 0 0% 1 2% Western Australia 1 3% 0 0% 1 2% Townsville 0 0% 1 5% 1 2% Total 36 100% 19 100% 55 100% The largest group in Table 74, which records the next stage of travel plans, comprised 32% who said they don't know.

37
Information and warnings The final tables deal with information and warnings. Table 75. When did you first hear about cyclone Yasi? Date of first information on Yasi by City
Date of first information on Yasi
City Total Townsville Cairns
Number % Number % Number % Saturday 3 8% 0 0% 3 5.5% Sunday 3 8% 3 16% 6 11% Monday 17 47% 9 47% 26 47% Tuesday morning 11 31% 6 32% 17 31% Tuesday afternoon 2 6% 1 5% 3 5.5% Total 36 100% 19 100% 55 100% Backpackers, along with most of the rest of the community, learned about cyclone Yasi relatively late: 47% on Monday and 37% on Tuesday. However the track of the cyclone was indeterminate until Wednesday with many people having been told to evacuate on Tuesday as a precaution. Also the weekend was dominated by the threat to Townsville, and areas south, of the passage of cyclone Anthony. From Tuesday onwards it would be fair to say that warnings of Yasi dominated all media.
38
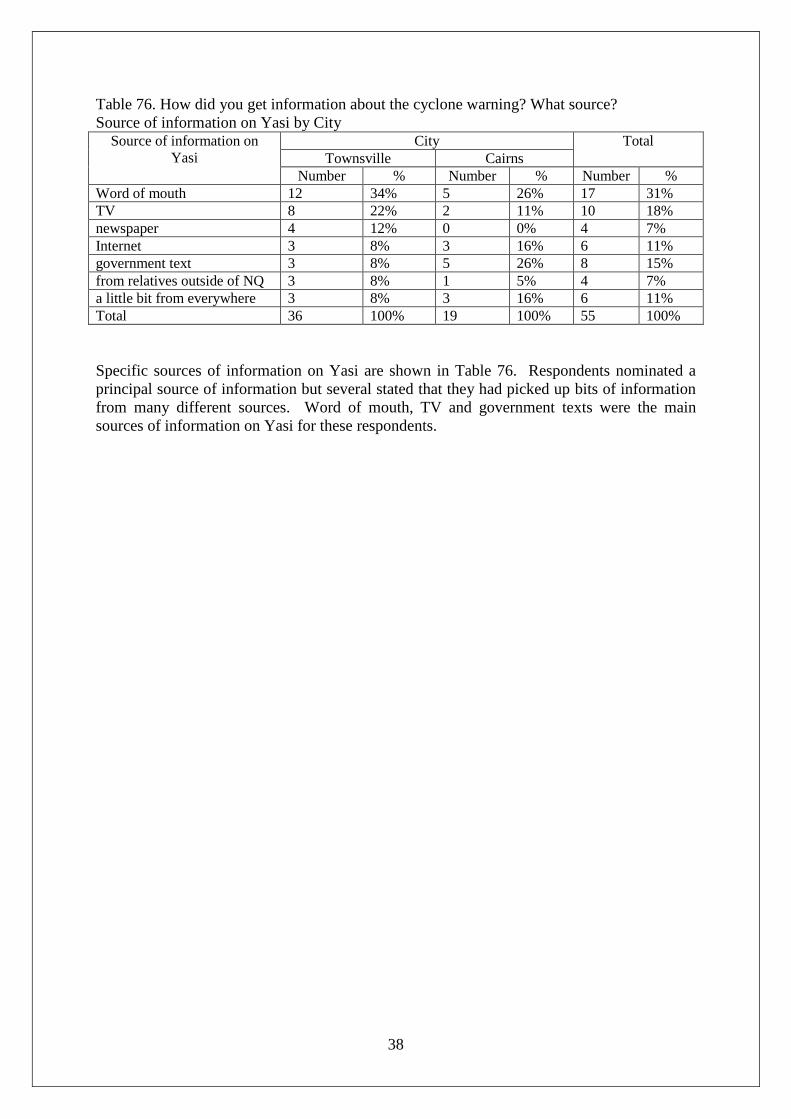
Table 76. How did you get information about the cyclone warning? What source? Source of information on Yasi by City
Source of information on Yasi
City Total Townsville Cairns
Number % Number % Number % Word of mouth 12 34% 5 26% 17 31% TV 8 22% 2 11% 10 18% newspaper 4 12% 0 0% 4 7% Internet 3 8% 3 16% 6 11% government text 3 8% 5 26% 8 15% from relatives outside of NQ 3 8% 1 5% 4 7% a little bit from everywhere 3 8% 3 16% 6 11% Total 36 100% 19 100% 55 100% Specific sources of information on Yasi are shown in Table 76. Respondents nominated a principal source of information but several stated that they had picked up bits of information from many different sources. Word of mouth, TV and government texts were the main sources of information on Yasi for these respondents.

39
References Hoogenraad, Wouter and van Eden, Ronald. 2003. Tropical cyclone awareness and preparedness amongst backpackers and accommodation providers in Cairns, Queensland, Australia. Ed. King, David. Centre for Disaster Studies JCU, Cairns Kuehlbrandt, E. 2000. Tropical Cyclone Awareness and Preparedness amongst Backpacker Accommodation Providers and Backpackers in Cairns. CDS, James Cook University, Cairns Townsville Bulletin. (2011). TV Scare Tactic. Townsville Bulletin 12/2/11 Astrid Vachette is enrolled in a Masters in International Humanitarian Action, specialising in Prevention and Post Disaster Management at the Université Paris Est Créteil, France and is on placement with the Centre for Disaster Studies during the first half of 2011. David King is Director of the Centre for Disaster Studies.

40
Appendix. Survey Instrument.
Centre for Disaster Studies, James Cook University. Post Cyclone Yasi Survey of independent tourists and backpackers. This brief survey is to find out how visitors and tourists coped during and after the passage of cyclone Yasi on 2nd/3rd February 2011. Results will be used to advise emergency services organisations on how visitors responded during the emergency. The survey is completely confidential and has ethical approval from James Cook University. The survey is voluntary and you can stop it whenever you wish. My name is …….. and I am a student with the Centre for Disaster Studies at the university. For further information and confirmation that this is a genuine research survey please contact the director, Associate Professor David King on 0747814430 in the School of Earth and Environmental Sciences, James Cook University. Thank you very much for agreeing to participate in this survey. 1 City 2 Location 3 What date did you first arrive in North Queensland? 4 Where were you staying on the night the cyclone hit? 5 Were you aware that this area is affected by tropical cyclones? 6 Were you prepared for experiencing a cyclone before you arrived here? 7 If yes, what sort of preparations had you made? 8 Where did you obtain information about cyclones generally, and how to be prepared? 9 How useful was the cyclone information you had received? 10 How useful were your preparations? 11 When did you first hear about cyclone Yasi? 12 How did you get information about the cyclone warning? What source? ie radio, TV, text, Internet, word of mouth etc. 13 What means of transport have you been using while travelling in Australia? 14 Did you consider leaving North Queensland when you heard the cyclone warning? 15 Why didn’t you leave? 16 As the cyclone approached were you staying at a place where you had to evacuate? If yes where? 17 If yes, were you told to evacuate or did you make your own decision to evacuate? 18 What did you do on Wednesday as the cyclone approached? 19 During the evening and night of Wednesday into Thursday where did you shelter? 20 Were you with other people while the storm passed? 21 What did you do during the night as the storm passed through? 22 Did you go outside during the evening or night while the strong winds blew? 23 How did you feel as the cyclone reached its peak? 24 Was there any damage at the place where you were staying?

41
25 If yes, what sort of damage? 26 Did the place you were staying at lose power? If yes how long for? 27 Did the place at which you were staying lose water? If yes how long for? 28 After the cyclone had passed did you have any problems getting food to eat? How did you feed yourself? 29 What other problems did you face after the cyclone had passed? 30 Did you receive any assistance from a) staff where you were staying b) other tourists c) official or voluntary organisations 31 What sort of assistance did you get and who from? 32 How do you feel about the whole cyclone experience? 33 Would you have come to North Queensland if you had known this would happen? 34 Where do you plan to travel to next? 35 Have you ever experienced a cyclone or hurricane before? 36 If yes, where was it? 37 Have you been travelling in Australia alone, or with friends or other visitors? 38 If yes, please tell me how you have assisted each other? 39 Where are you from? 40 What is your first language? 41 How good is your understanding of written and spoken English? 42 How old are you? 43 How long are you staying in Australia? 44 How long are you staying in North Queensland? 45 Gender 46 Do you have any other comments?