Cycle Accurate Profiling With Perf - eLinux.org · · 2016-07-06/ # time perf record -F 1000 -e...
41
Cycle Accurate Profiling With Perf Cycle Accurate Profiling With Perf Cycle Accurate Profiling With Perf Cycle Accurate Profiling With Perf Cycle Accurate Profiling With Perf Cycle Accurate Profiling With Perf Cycle Accurate Profiling With Perf Cycle Accurate Profiling With Perf Cycle Accurate Profiling With Perf Cycle Accurate Profiling With Perf Cycle Accurate Profiling With Perf Cycle Accurate Profiling With Perf Cycle Accurate Profiling With Perf Cycle Accurate Profiling With Perf Cycle Accurate Profiling With Perf Cycle Accurate Profiling With Perf Cycle Accurate Profiling With Perf Paweł Moll <[email protected]> 1
Transcript of Cycle Accurate Profiling With Perf - eLinux.org · · 2016-07-06/ # time perf record -F 1000 -e...

Cycle Accurate Profiling With PerfCycle Accurate Profiling With PerfCycle Accurate Profiling With PerfCycle Accurate Profiling With PerfCycle Accurate Profiling With PerfCycle Accurate Profiling With PerfCycle Accurate Profiling With PerfCycle Accurate Profiling With PerfCycle Accurate Profiling With PerfCycle Accurate Profiling With PerfCycle Accurate Profiling With PerfCycle Accurate Profiling With PerfCycle Accurate Profiling With PerfCycle Accurate Profiling With PerfCycle Accurate Profiling With PerfCycle Accurate Profiling With PerfCycle Accurate Profiling With PerfPaweł Moll <[email protected]>
1

The plan
2

The plan
n Hardwaren Linux perfn Let’s hack!
3

Hardware
4

ARM CoreSight
JTAG-AP
AXI-AP
APB-AP
CTI CTI CTI
Cross Trigger Matrix (CTM)System Interconnect (AXI)
Funnel
ETB
TPIU
Cortex Processor
SWJ-DP
STM
ETM
DAP
Debug APB Interconnect (APBIC)
n Sourcen Busn Sink
5

Processor trace
n Embedded Trace Macrocelln Instructionsn Data
n Program Trace Macrocelln Only branches
n Bandwidthn From 10Mbps to many Gbps per core
n Non- (or low-) intrusive debug
6

Sinks
n Embedded Trace Buffern Dedicated, small SRAMn Flight recorder use case
n Trace Portn External analysern Large buffern External (high speed) pins
n Embedded Trace Routern Sinks data into main interconnectn Usually uses system DRAMn Consumes memory system bandwidth
7
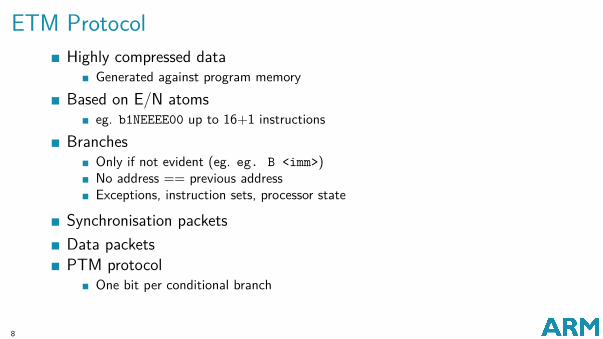
ETM Protocoln Highly compressed data
n Generated against program memoryn Based on E/N atoms
n eg. b1NEEEE00 up to 16+1 instructionsn Branches
n Only if not evident (eg. eg. B <imm>)n No address == previous addressn Exceptions, instruction sets, processor state
n Synchronisation packetsn Data packetsn PTM protocol
n One bit per conditional branch
8

Issues
n Requires memory contents for decompressionn Multitasking OSn JIT enginesn Self-modifying code (kernel runtime patching, kprobes, dynamic trace events)
n Parallel and out-of-order excecution
9

Additional features
n Filteringn Addressn CONTEXTIDn VMID
n Trigerringn Addressn DBG <imm>n Countern Sequencer
n Timestampingn Correlation (synchronisation)
10

Linux perf
11

Linux perf framework
n PMU driversn Many use cases, eg. statisticsn Sampling profiler
n Periodic PC (IP) samplingn Timer or PMU counter overflow interruptn Typical sampling rate 1kHz (every 1ms)
12
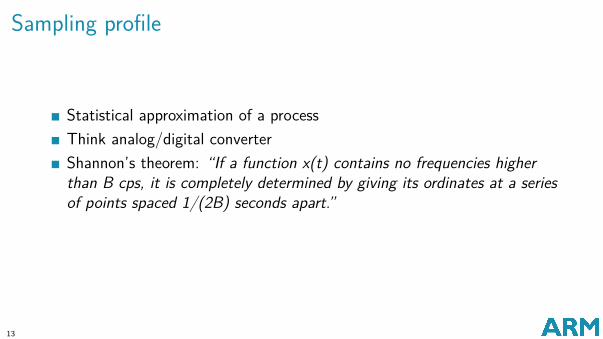
Sampling profile
n Statistical approximation of a processn Think analog/digital convertern Shannon’s theorem: “If a function x(t) contains no frequencies higher
than B cps, it is completely determined by giving its ordinates at a seriesof points spaced 1/(2B) seconds apart.”
13

CoreSight Linux framework
n Developed by Mathieu Poirier at Linaron Based on 2012 code from Code Auroran At v7 stage now (http://lwn.net/Articles/614232/)n Control trace components via sysfs
n Enable sink, enable source, dump buffer contents
n Separate decodersn Full series at http://git.linaro.org/kernel/coresight.git
14

Intel PT
n “an exciting new feature coming in future processors” (2013)n Integrating with perf
n Auxiliary buffersn Decoder integrated with user space tool
n Kernel portions at v4 stage now (http://lwn.net/Articles/609010/)n Full series at
https://github.com/virtuoso/linux-perf/tree/intel_pt
15

Let’s hack!
16

Particularly pathologic example
n Rotate JPEG file
/ # time taskset 4 ./gm convert -rotate 90 in.jpg out.jpgreal 0m 0.01suser 0m 0.01ssys 0m 0.00s
17

Can it go faster?/ # time perf record -F 1000 -e cpu-clock \
taskset 4 ./gm convert -rotate 90 in.jpg out.jpg[ perf record: Woken up 1 times to write data ][ perf record: Captured and wrote 0.001 MB perf.data (~50 samples) ]real 0m 0.27suser 0m 0.14ssys 0m 0.13s
n It was:
real 0m 0.01suser 0m 0.01ssys 0m 0.00s
18

Report# Samples: 17 of event 'cpu-clock'# Event count (approx.): 17000000## Overhead Command Shared Object Symbol# ........ ....... ................. ........................#
17.65% gm [kernel.kallsyms] [k] filemap_map_pages5.88% taskset [kernel.kallsyms] [k] filemap_map_pages5.88% gm gm [.] LocaleCompare5.88% gm gm [.] forward_DCT_float5.88% gm gm [.] encode_mcu_huff5.88% gm gm [.] ycc_rgb_convert5.88% gm gm [.] decode_mcu_DC_first5.88% gm gm [.] decode_mcu_AC_refine
19

Report, cont.
5.88% gm gm [.] jpeg_fdct_16x165.88% gm gm [.] _IO_link_in5.88% gm gm [.] malloc5.88% gm gm [.] strncpy5.88% gm [kernel.kallsyms] [k] lock_acquire5.88% gm [kernel.kallsyms] [k] lock_release5.88% gm [kernel.kallsyms] [k] unmap_single_vma
20

Let’s have a closer look…
n Cortex-A7 ETM 3.5n Instructions onlyn Cycle accuraten Captured with DStream & ARM DS-5n 10MB of binary trace data
21

What can we see there?n Decoded into text formatn 890MB filen What to look for:
ELF Header:Entry point address: 0x96dd
8360: 000096dd 0 FUNC GLOBAL DEFAULT 6 _start
8845: 0012ac44 0 FUNC GLOBAL DEFAULT 9 _fini
22
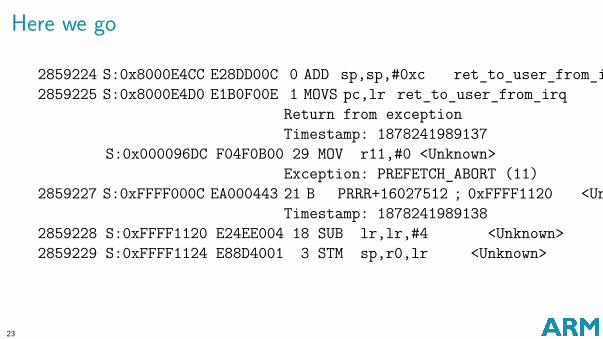
Here we go
2859224 S:0x8000E4CC E28DD00C 0 ADD sp,sp,#0xc ret_to_user_from_irq2859225 S:0x8000E4D0 E1B0F00E 1 MOVS pc,lr ret_to_user_from_irq
Return from exceptionTimestamp: 1878241989137
S:0x000096DC F04F0B00 29 MOV r11,#0 <Unknown>Exception: PREFETCH_ABORT (11)
2859227 S:0xFFFF000C EA000443 21 B PRRR+16027512 ; 0xFFFF1120 <Unknown>Timestamp: 1878241989138
2859228 S:0xFFFF1120 E24EE004 18 SUB lr,lr,#4 <Unknown>2859229 S:0xFFFF1124 E88D4001 3 STM sp,r0,lr <Unknown>
23

Here we go again2878794 S:0x8000E4D0 E1B0F00E 1 MOVS pc,lr ret_to_user_from_irq
Return from exceptionTimestamp: 1878241990817
2878795 S:0x000096DC F04F0B00 175 MOV r11,#0 <Unknown>2878796 S:0x000096E0 F04F0E00 40 MOV lr,#0 <Unknown>2878797 S:0x000096E4 BC02 4 POP r1 <Unknown>2878798 S:0x000096E6 466A 1 MOV r2,sp <Unknown>[...]2878804 S:0x000096F6 4B04 1 LDR r3,[pc,#16] ; [0x9708] = 0xB114687C <Unknown>2878805 S:0x000096F8 F0DAFDF4 0 BL __libc_start_main ; 0xE42E4 <Unknown>
S:0x000E42E4 E92D45F0 324 PUSH r4-r8,r10,lr __libc_start_mainException: PREFETCH_ABORT (11)
2878807 S:0xFFFF000C EA000443 21 B PRRR+16027512 ; 0xFFFF1120 <Unknown>
24

Going down
9747820 S:0x0012AC44 E91D4008 153 PUSH r3,lr <Unknown>9747821 S:0x0012AC48 E8BD8008 2 POP r3,pc <Unknown>9747822 S:0x000E9AA2 E7BF 9 B __run_exit_handlers+28 ; 0xE9A24 __run_exit_handlers9747823 S:0x000E9A24 6873 3 LDR r3,[r6,#4] __run_exit_handlers9747824 S:0x000E9A26 EB061403 3 ADD r4,r6,r3,LSL #4 __run_exit_handlers9747825 S:0x000E9A2A B173 1 CBZ r3,__run_exit_handlers+66 ; 0xE9A4A __run_exit_handlers
25

The end of the process9747990 S:0x000FD536 4C12 2 LDR r4,[pc,#72] ; [0xFD580] = 0x64C55B39 _Exit9747991 S:0x000FD538 E004 0 B _Exit+24 ; 0xFD544 _Exit9747992 S:0x000FD544 4618 1 MOV r0,r3 _Exit9747993 S:0x000FD546 F04F0CF8 1 MOV r12,#0xf8 _Exit9747994 S:0x000FD54A F7E7F9C9 0 BL __libc_do_syscall ; 0xE48E0 _Exit9747995 S:0x000E48E0 B580 1 PUSH r7,lr __libc_do_syscall9747996 S:0x000E48E2 4667 2 MOV r7,r12 __libc_do_syscall9747997 S:0x000E48E4 DF00 1 SVC #0x0 __libc_do_syscall
Exception: SUPERVISOR_CALL (10)
n #0xf8 is __NR_exit_group
26

Focus on the task
n It’s all interesting…n …but the goal is to see a cycle accurate profile of the processn Limit data scope
n Filter out kernel addresses (or cheat using entry/exit points)n Filter out other contexts (or cheat by protecting CPU)n Collate migrated data (or cheat by setting affinity)n Generate memory map with DSOs (or cheat by linking statically)
n Convert into perf data stream
27

perf.data
n Starts with headern Description of all eventsn Followed by data records …
n selection of samplesn by default: PERF_SAMPLE_IP, PERF_SAMPLE_TID, PERF_SAMPLE_TIME,
PERF_SAMPLE_PERIODn generated on every timer/counter interrupt
n …interleaved with system informationn eg. PERF_RECORD_MMAP, PERF_RECORD_COMM, PERF_RECORD_EXIT,
PERF_RECORD_FORK
28
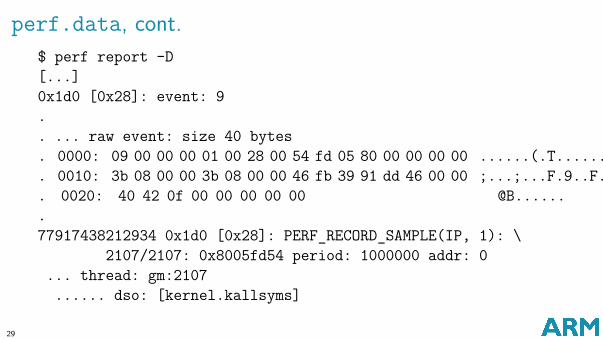
perf.data, cont.$ perf report -D[...]0x1d0 [0x28]: event: 9.. ... raw event: size 40 bytes. 0000: 09 00 00 00 01 00 28 00 54 fd 05 80 00 00 00 00 ......(.T........ 0010: 3b 08 00 00 3b 08 00 00 46 fb 39 91 dd 46 00 00 ;...;...F.9..F... 0020: 40 42 0f 00 00 00 00 00 @B.......77917438212934 0x1d0 [0x28]: PERF_RECORD_SAMPLE(IP, 1): \
2107/2107: 0x8005fd54 period: 1000000 addr: 0... thread: gm:2107...... dso: [kernel.kallsyms]
29

The Hack
n Replace data records with trace-based onesn reducing number of samples, from 40 to 24 bytes per record (attribute
modification needed)n generating multiple samples, one per cycle used (175 samples if instruction took
175 cycles to execute)
n 192MB big perf.data
30

The Hack, cont.0x1f0 [0x18]: event: 9. ... raw event: size 24 bytes. 0000: 09 00 00 00 02 00 18 00 dc 96 00 00 00 00 00 00 ................. 0010: 3b 08 00 00 3b 08 00 00 ;...;...0x1f0 [0x18]: PERF_RECORD_SAMPLE(IP, 2): \
2107/2107: 0x96dc period: 1 addr: 0... thread: :2107:2107...... dso: <not found>0x208 [0x18]: event: 9. ... raw event: size 24 bytes
. 0000: 09 00 00 00 02 00 18 00 dc 96 00 00 00 00 00 00 ................. 0010: 3b 08 00 00 3b 08 00 00 ;...;...0x208 [0x18]: PERF_RECORD_SAMPLE(IP, 2): \
2107/2107: 0x96dc period: 1 addr: 0... thread: :2107:210731
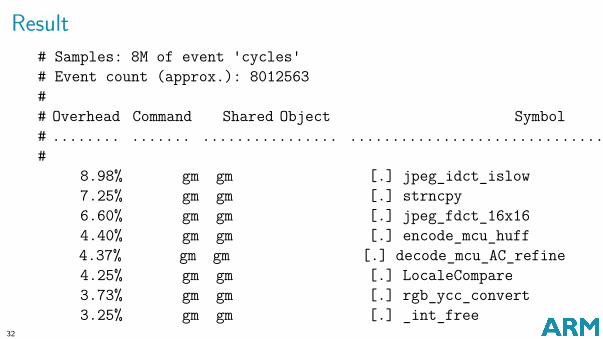
Result# Samples: 8M of event 'cycles'# Event count (approx.): 8012563## Overhead Command Shared Object Symbol# ........ ....... ................ ..................................#
8.98% gm gm [.] jpeg_idct_islow7.25% gm gm [.] strncpy6.60% gm gm [.] jpeg_fdct_16x164.40% gm gm [.] encode_mcu_huff4.37% gm gm [.] decode_mcu_AC_refine4.25% gm gm [.] LocaleCompare3.73% gm gm [.] rgb_ycc_convert3.25% gm gm [.] _int_free
32

Result, cont3.17% gm gm [.] memset3.15% gm gm [.] jpeg_gen_optimal_table3.01% gm gm [.] malloc2.63% gm gm [.] _int_malloc2.63% gm gm [.] forward_DCT_float2.59% gm gm [.] ycc_rgb_convert2.43% gm gm [.] jpeg_fdct_float
2.29% gm gm [.] __pthread_mutex_unlock_usercnt2.25% gm gm [.] __memcpy_neon2.19% gm gm [.] pthread_mutex_lock1.74% gm gm [.] ReadJPEGImage1.72% gm gm [.] encode_mcu_gather1.61% gm gm [.] WriteJPEGImage1.39% gm gm [.] vfprintf
33

Result, cont1.32% gm gm [.] consume_data1.21% gm gm [.] forward_DCT1.06% gm gm [.] RegisterMagickInfo0.88% gm gm [.] UnregisterMagickInfo0.87% gm gm [.] decode_mcu_AC_first0.81% gm gm [.] strlen0.73% gm gm [.] SyncCacheNexus0.64% gm gm [.] strcpy0.53% gm gm [.] jpeg_fill_bit_buffer0.49% gm gm [.] decode_mcu_DC_first0.40% gm gm [.] _IO_default_xsputn0.35% gm gm [.] _init
0.34% gm gm [.] jpeg_make_d_derived_tbl0.33% gm gm [.] DestroyMagickInfo
34

Result, cont0.33% gm gm [.] QueryColorDatabase0.32% gm gm [.] GetGeometry0.31% gm gm [.] SetNexus0.31% gm gm [.] free0.29% gm gm [.] __strchrnul0.27% gm gm [.] ____strtod_l_internal0.27% gm gm [.] .divsi3_skip_div0_test0.24% gm gm [.] SetCacheNexus0.23% gm gm [.] access_virt_barray0.23% gm gm [.] compress_output0.22% gm gm [.] ____strtol_l_internal0.21% gm gm [.] UnlockSemaphoreInfo0.21% gm gm [.] AcquireCacheNexus0.21% gm gm [.] format_message
35

Result, cont
[...]
36

Result, cont0.00% gm gm [.] ___fini_from_thumb0.00% gm gm [.] jpeg_destroy_compress0.00% gm gm [.] __feupdateenv0.00% gm gm [.] IdentityAffine0.00% gm gm [.] __dcgettext0.00% gm gm [.] _setjmp0.00% gm gm [.] DestroyMagickResources0.00% gm gm [.] jpeg_free_small0.00% gm gm [.] fprintf0.00% gm gm [.] DestroySemaphore0.00% gm gm [.] jpeg_mem_term0.00% gm gm [.] start_pass_downsample0.00% gm gm [.] malloc_info0.00% gm gm [.] __stpcpy
37

Result, cont
n 616 lines of reportn perf annotate works as well!
38

Summary
39

Summary
n Proof of conceptn Can help with pathological casesn Scaling issuesn Powerful but need to by “civilised”n Nearest future
n Drivers in mainlinen perf tool decoder integration
40

Thank You
The trademarks featured in this presentation are registered and/or unregistered trademarks of ARMLimited (or its subsidiaries) in the EU and/or elsewhere. All rights reserved. All other marks featuredmay be trademarks of their respective owners.
41


![MOV Instruction MOV destination,source MOV AX,BX MOV SUM,EAX MOV EDX,ARRAY[EBX][ESI] MOV CL,5 MOV DL,[BX]](https://static.fdocuments.net/doc/165x107/5a4d1b787f8b9ab0599b8123/mov-instruction-mov-destinationsource-mov-axbx-mov-sumeax-mov-edxarrayebxesi.jpg)