
Cyber-physical-system-based smart water system to prevent ...
13
RESEARCH Open Access Cyber-physical-system-based smart water system to prevent flood hazards Tsun-Hua Yang 1,2 , Sheng-Chi Yang 1 , Hong-Ming Kao 1* , Ming-Chang Wu 1 and Hao-Ming Hsu 3 * Correspondence: hmkao@narlabs. org.tw 1 Taiwan Typhoon and Flood Research Institute, National Applied Research Laboratories, 11F, No. 97, Sec. 1, Roosevelt Rd, Taipei 100, Taiwan Full list of author information is available at the end of the article Abstract Background: Extreme weather and climate events such as super typhoons and unprecedented recorded high intensity rainfall events have increased in recent years due to climate change. Such extreme weather events generate floods and cause loss of life and property. Therefore, efficient strategies and measures for flood mitigation and prevention are essential. Computer-aided techniques can increase the speed of emergency response and reduce the impacts of a flood. Methods: This study applied the cyber-physical system concept to develop a smart flood information system, called Dayu Smart Water System. The system includes an on-site monitoring network and software for rapid flood modeling to provide updated information. With the utilization of Internet of Things and artificial intelligence, the system not only provides forecast information but also plays an active role by enabling users to take emergency response measures before, during, and after a flood. The system is aimed at accelerating emergency responses during a flood without requiring any human intervention. Results: The system was deployed in a high-tech industrial park in central Taiwan. Experimental results revealed that the system could increase the response efficiency of the emergency operations center during a few extreme events in 2017. To enable the system to respond to a wide range of flood induced threats in a more effective manner, a few advanced functions are under development and discussed in this paper. Conclusions: This study utilized Dayu Smart Water System that integrates on-site monitoring sensors and advanced modeling tools to provide optimal flood forecasts. However, the proposed system has implemented only the first three levels—connection, conversion, and cyber levels. The higher the number of levels is, the more added value is the system provides. The fourth and fifth levels, namely the cognition and configuration levels, were not discussed in the study. Further developments in these two levels will be conducted. Keywords: Cyber-physical system, Internet of things, Artificial intelligence, Flood warning Background Various disasters such as typhoons, floods, and earthquakes may occur simultaneously and cause catastrophic loss of life and property. In certain scenarios, disasters can be sequential, in that the first disaster may trigger the second one, which may trigger sub- sequent disasters (EISNER, 2014). Historical events such as the Thailand flood in 2011 and Fukushima Daiichi nuclear disaster in 2011 are examples of such scenarios. For Smart Water © The Author(s). 2018 Open Access This article is distributed under the terms of the Creative Commons Attribution 4.0 International License (http://creativecommons.org/licenses/by/4.0/), which permits unrestricted use, distribution, and reproduction in any medium, provided you give appropriate credit to the original author(s) and the source, provide a link to the Creative Commons license, and indicate if changes were made. Yang et al. Smart Water (2018) 3:1 https://doi.org/10.1186/s40713-018-0008-3
Transcript of Cyber-physical-system-based smart water system to prevent ...

RESEARCH Open Access
Cyber-physical-system-based smart watersystem to prevent flood hazardsTsun-Hua Yang1,2, Sheng-Chi Yang1, Hong-Ming Kao1*, Ming-Chang Wu1 and Hao-Ming Hsu3
* Correspondence: [email protected] Typhoon and FloodResearch Institute, National AppliedResearch Laboratories, 11F, No. 97,Sec. 1, Roosevelt Rd, Taipei 100,TaiwanFull list of author information isavailable at the end of the article
Abstract
Background: Extreme weather and climate events such as super typhoons andunprecedented recorded high intensity rainfall events have increased in recent yearsdue to climate change. Such extreme weather events generate floods and cause lossof life and property. Therefore, efficient strategies and measures for flood mitigationand prevention are essential. Computer-aided techniques can increase the speed ofemergency response and reduce the impacts of a flood.
Methods: This study applied the cyber-physical system concept to develop a smartflood information system, called Dayu Smart Water System. The system includes anon-site monitoring network and software for rapid flood modeling to provideupdated information. With the utilization of Internet of Things and artificialintelligence, the system not only provides forecast information but also plays anactive role by enabling users to take emergency response measures before, during,and after a flood. The system is aimed at accelerating emergency responses during aflood without requiring any human intervention.
Results: The system was deployed in a high-tech industrial park in central Taiwan.Experimental results revealed that the system could increase the response efficiencyof the emergency operations center during a few extreme events in 2017. To enablethe system to respond to a wide range of flood induced threats in a more effectivemanner, a few advanced functions are under development and discussed in thispaper.
Conclusions: This study utilized Dayu Smart Water System that integrates on-sitemonitoring sensors and advanced modeling tools to provide optimal flood forecasts.However, the proposed system has implemented only the first threelevels—connection, conversion, and cyber levels. The higher the number of levels is,the more added value is the system provides. The fourth and fifth levels, namely thecognition and configuration levels, were not discussed in the study. Furtherdevelopments in these two levels will be conducted.
Keywords: Cyber-physical system, Internet of things, Artificial intelligence, Flood warning
BackgroundVarious disasters such as typhoons, floods, and earthquakes may occur simultaneously
and cause catastrophic loss of life and property. In certain scenarios, disasters can be
sequential, in that the first disaster may trigger the second one, which may trigger sub-
sequent disasters (EISNER, 2014). Historical events such as the Thailand flood in 2011
and Fukushima Daiichi nuclear disaster in 2011 are examples of such scenarios. For
Smart Water
© The Author(s). 2018 Open Access This article is distributed under the terms of the Creative Commons Attribution 4.0 InternationalLicense (http://creativecommons.org/licenses/by/4.0/), which permits unrestricted use, distribution, and reproduction in any medium,provided you give appropriate credit to the original author(s) and the source, provide a link to the Creative Commons license, andindicate if changes were made.
Yang et al. Smart Water (2018) 3:1 https://doi.org/10.1186/s40713-018-0008-3

example, the Thailand flood in 2011 caused over hundreds of deaths, and millions of
people were affected. The economic damage was estimated to be over US$40 billion,
according to a World Bank survey (Mahul, 2017). Taiwan is located in the northwest-
ern Pacific Ocean and is struck by typhoons three to four times a year. Typhoon
Morakot in 2009 is another example of such scenarios. This typhoon first engendered a
considerable amount of rainfall and subsequently triggered large-scale landslides,
resulting in more than hundreds of deaths in the south of Taiwan. Extreme weather
and climate events such as super typhoons and unprecedented high-intensity rainfall
events will attract more attention in the future because of the impact of climate change.
Structural measures, including the construction of structures such as dams and river
bifurcation, are proven to be effective for flood mitigation. However, the failure of
structural measures may cause greater disasters. Nonstructural measures such as early
warning systems can enable first responders to take necessary actions for reducing
damage and losses. Most early warning systems only provide passive information such
as flood forecasts or real-time observations (Thielen et al., 2009; Lopez-Trujillo, 2010;
Yang et al., 2015).
The rapid development of artificial intelligence (AI) and Internet of Things (IoT)
can transform early warning systems from passive information provides to active
systems that implement necessary actions during a disaster. AI has been applied to
disaster forecasting, prevention, and mitigation. For example, Augello et al. (2016)
used an agent model and a monitoring network to propose preventive measures
and provide alerts before the occurrence of an event. A chatbot was created at the
front end of the system to interact with users. Various studies have proved that AI
can accelerate complicated processes and generate efficient solutions not only in
disaster-related fields but also in many other fields (e.g., Monostori 2003; Alemdar
et al., 2017). IoT was introduced in 2005 and is mostly applied to supply chain
management, environmental monitoring, and other nonstress environments. Yang
et al. (2015) identified that the IoT technology can match identified information
requirements and provide added value to emergency response operations in terms
of obtaining efficient cooperation, accurate situational awareness, and complete re-
source visibility. Therefore, this study utilized AI and IoT to develop a cyber-
physical-system (CPS)-based smart water system—called Dayu Smart Water System
(DayuSWS)—that integrates on-site monitoring sensors and advanced modeling
tools to provide optimal flood forecasts. In addition, the system analyzes all the
collected information and forecasts to trigger active actions based on the situation;
for example, the system controls the start or stop function of water pumps. The
remainder of this paper is organized as follows. Study area section briefly describes
the study area in which the system was deployed. Components of the CPS-based
smart flood information system section explains the concept of a CPS and its ap-
plication in the study. Case and discussion section presents the case study and dis-
cussion. Finally, Conclusions section concludes the paper.
Study area
The Huawei Science Park, located in central Taiwan, was selected as the study area.
The red line shows the boundary of the park in Fig. 1. The yellow circles and the blue
arrows indicate the water level gauge locations and the flow direction, respectively. The
Yang et al. Smart Water (2018) 3:1 Page 2 of 13

DayuSWS was deployed in the park to conduct observations, provide forecasts, and
take actions. The park has an area of approximately 97 ha and has six optoelectronic
and biotechnological manufactories. The land is characterized by a gently sloped sur-
face from the northeast toward the southwest, with the average slope being 0.002.
Storm water is stored in detention ponds before its release to the river, because of
current legal restrictions. Therefore, two detention ponds, namely pond A and pond B,
were set at the lowest point of the Huawei Science Park to store flood water for a
period of 50 years (designed rainfall intensity: 101.8 mm/h), as illustrated in Fig. 1. The
drainage system collects all the rain water within the Huawei Science Park and eventu-
ally transfers it to pond A. The storm water in pond A is released only if the water level
in this pond is higher than that of the Hsinchuangzhi drainage (please find the location
in Fig. 1). During Typhoon Kong-rey in 2013, the water level in pond A was approxi-
mately 20 m (maximum water level: 20.56 m), implying that flooding risk still exists
because of climate change and developments in the area. In addition, on September 26,
2016, a 5 × 5 m2 digital surface model (DSM) was obtained using an unmanned aerial
vehicle (UAV) with enhanced GPS technology. This DSM information was used to
develop all subsequent models and conduct all simulations.
MethodsComponents of the CPS-based smart flood information system
A 5C architecture—a connection level, conversion level, cyber level, cognition level,
and configuration level (Fig. 2)—was used as the guideline to achieve CPS (Lee et
al., 2015), one of crucial technologies of industry 4.0. Monostori et al. (2016) men-
tioned that CPS is one of the most notable advances in the development of com-
puter science and information and communication technologies. Moreover, CPS are
broadly applied in manufacturing, decision-making, and energy-related industries
Fig. 1 Study area—Huawei Science Park
Yang et al. Smart Water (2018) 3:1 Page 3 of 13
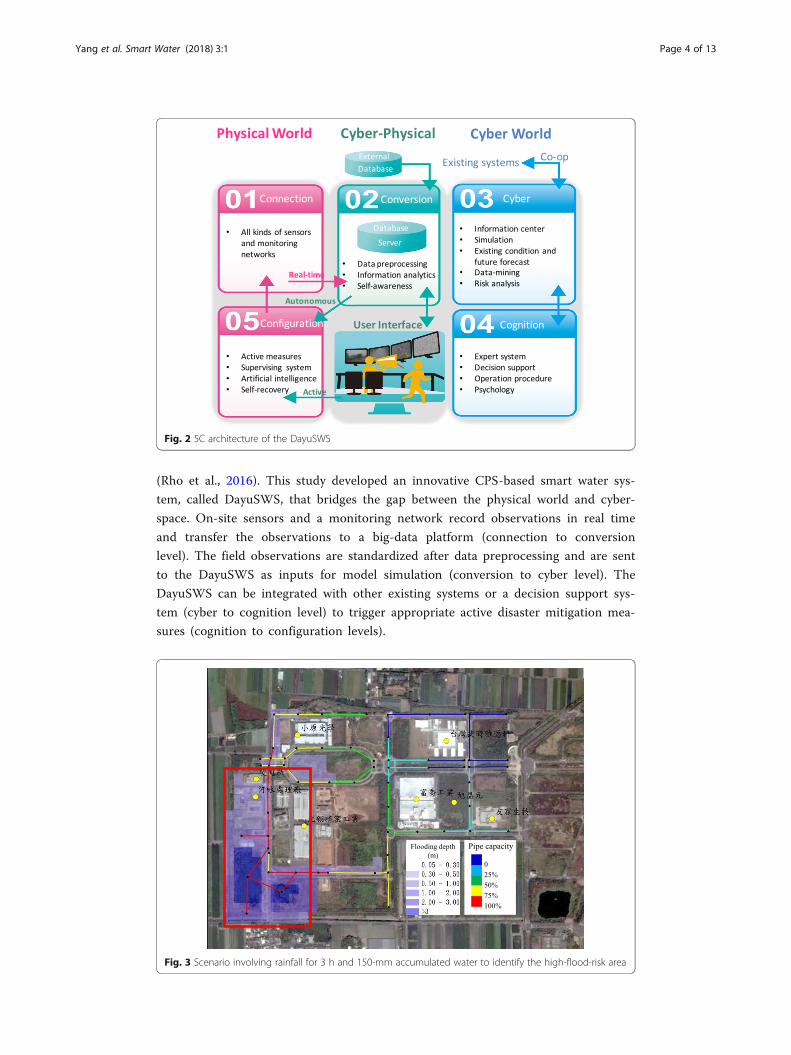
(Rho et al., 2016). This study developed an innovative CPS-based smart water sys-
tem, called DayuSWS, that bridges the gap between the physical world and cyber-
space. On-site sensors and a monitoring network record observations in real time
and transfer the observations to a big-data platform (connection to conversion
level). The field observations are standardized after data preprocessing and are sent
to the DayuSWS as inputs for model simulation (conversion to cyber level). The
DayuSWS can be integrated with other existing systems or a decision support sys-
tem (cyber to cognition level) to trigger appropriate active disaster mitigation mea-
sures (cognition to configuration levels).
Fig. 2 5C architecture of the DayuSWS
Fig. 3 Scenario involving rainfall for 3 h and 150-mm accumulated water to identify the high-flood-risk area
Yang et al. Smart Water (2018) 3:1 Page 4 of 13

Connection level
The connection level comprises the on-site sensors. Various types of sensors were in-
stalled on the basis of the study’s requirements. The connection level is the first level of
the DayuSWS that initiates all system functions. Therefore, the information recorded
by this level is crucial to trigger the other levels. The sensors were set up after carefully
analyzing the locations to ensure that the collected information is suitable. A scenario
involving rainfall for 3 h and 150-mm accumulated rain water, with no water outflow
from the park, was considered in this study. The simulated results are presented in
Fig. 3. The results revealed the west side of the park to have a high risk of flooding,
which is consistent with the topology of the area. Because all the vital facilities such as
power and water treatment plants are located on the west side of the park, a total of
six water gauges were installed on this side, as shown in Fig. 1. Figure 4 is the pictures
of all on-site gauges: the gauge locations from left to right and beginning at the top cor-
respond to the numbered locations in Fig. 1. Gauges 5 and 6 were installed to monitor
the water levels in pond A and the Hsinchuangzhi drainage, respectively, and are cru-
cial to understanding the water exchange between the park and outside area. Gauge
four was installed to monitor the water level in pond B. The rain water collected on the
east side is monitored by gauge three and then transferred to pond B. Moreover, gauges
one and two were installed to monitor the water collected on the upper side of the park
(red rectangle in Fig. 3). A rainfall gauge was installed at location 6 to monitor the
park’s rainfall. The real-time observations of all the sensors are wirelessly transferred to
the big-data platform at an interval of 10 min.
Cyber level
The connection and conversion levels transform real-time observations to useful infor-
mation for decision-makers. The information obtained is highly accurate because it is
based on on-site observations. However, information with an adequate lead time could
not be provided. Therefore, the cyber level is employed to provide forecasts with a lon-
ger lead time. In this study, the cyber level was determined to provide flood forecasts
Fig. 4 On-site water gauges set up at particular locations
Yang et al. Smart Water (2018) 3:1 Page 5 of 13

with a lead time of 6 h. To obtain the forecasts, a 1D–1D dual drainage model was
included, with rainfall forecasts in numerical format serving as the model input. The
details are discussed in the following subsections.
Numerical rainfall forecasts
To provide more reliable and timely flood forecasts, rainfall forecast information is
crucial. In this study, high-resolution numerical rainfall forecast information from
an ensemble numerical weather prediction system in Taiwan was used. The ensem-
ble numerical weather prediction system fabricated by the Taiwan Typhoon and
Flood Research Institute (TTFRI) consists of more than 20 ensemble units that are
individual numerical weather prediction models with different model configura-
tions. Therefore, a collection of more than 20 numerical rainfall forecasts can be
obtained from this system for the same location and time. This system collects
worldwide observation data such as temperature, wind, surface pressure, and rela-
tive humidity from satellites, atmospheric sounding devices, buoys, aviation routine
weather reports, ships, and other available sources. The collected data are then
used as boundary or initial conditions for the ensemble units. Then, rainfall fore-
casts in numerical format are generated according to these real-time weather con-
ditions. The ensemble system aims to provide 72-h numerical rainfall forecasts and
generates four runs per day at a 5-km spatial resolution. Hsiao et al. (2012, 2013),
Yang et al. (2015), and Wu and Lin (2017) have provided additional details on the
ensemble numerical weather prediction system. Moreover, a statistical technique
for effectively integrating ensemble forecasts is applied in the proposed system to
improve the accuracy of 1- to 24-h rainfall forecasts. Through an artificial neural
network (ANN)-based statistical technique, more than 20 ensemble rainfall fore-
casts are integrated to yield one accurate rainfall forecast. Our preliminary experi-
ments revealed that improved 24-h rainfall forecasts were obtained through the
ANN-based integration technique (Wu et al., 2016). Moreover, to further improve
Fig. 5 Data processing flowchart for the DayuSWS to provide 72-h rainfall forecasts
Yang et al. Smart Water (2018) 3:1 Page 6 of 13

the accuracy of short-term rainfall forecasts (i.e., 1- to 6-h rainfall forecasts), real-
time radar observation data are included. A radar data assimilation technique,
namely the three-dimensional variational data assimilation (3DVar) system, is used.
When the 3DVar system is used to rectify the modeled background errors, im-
proved 1- to 6-h rainfall forecasts are obtained. Such forecasts are valuable for
warning concerning floods due to convective storms. More details concerning the
3DVar system were provided by Sun et al. (2016). The proposed system uses the
aforementioned rainfall forecasts as model inputs to generate flooding forecasts.
The data processing flowchart is illustrated in Fig. 5. First, the ensemble mean of
all the ensemble units in the TTFRI ensemble numerical weather prediction system
is used to yield 1- to 72-h rainfall forecasts. Among the obtained forecasts, 1- to
24-h rainfall forecasts are then replaced by the improved forecasts yielded by the
ANN-based integration technique. Finally, the 1- to 6-h rainfall forecasts are re-
placed by the improved forecasts yielded by the 3DVar system.
Conversion level 1D–1D dual drainage model
This section briefly describes the overall structure of the 1D–1D dual drainage model
utilized in the proposed system. The proposed model was retrieved from the Storm
Water Management Model (SWMM), which is an open-source model that has been
widely adopted in many academic studies (Hsu et al., 2000; Chang et al., 2015). For the
initial rainfall-runoff process, the rainfall information is first applied to the RUNOFF
module of the SWMM to calculate the inflow discharges of manholes. Next, the infor-
mation of the inflows at the manholes is directly used as input to the 1D–1D model to
simulate the interaction between the below-ground storm sewer flows and the above-
ground street flows (Fig. 6). After the 1D–1D model simulations, the surcharges from
the manholes are considered as point sources to rapidly identify the high-risk surface
inundation areas.
Governing equation of the RUNOFF module The RUNOFF module of the SWMM
conceptualizes a catchment, which pertains to the input rainfall and output discharge,
as a nonlinear reservoir. In this representation, the catchment has an inflow due to
rainfall and an outflow due to evaporation and infiltration (Fig. 7). According to the
Fig. 6 1D–1D dual drainage model
Yang et al. Smart Water (2018) 3:1 Page 7 of 13
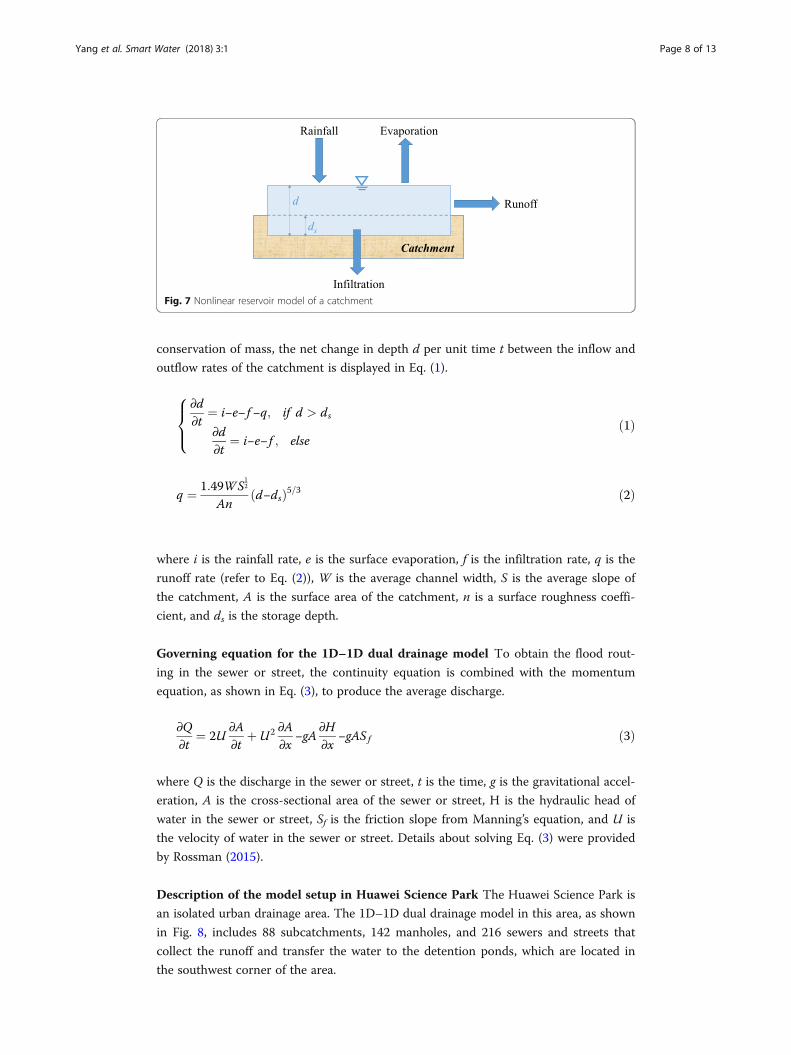
conservation of mass, the net change in depth d per unit time t between the inflow and
outflow rates of the catchment is displayed in Eq. (1).
∂d∂t
¼ i−e− f −q; if d > ds
∂d∂t
¼ i−e− f ; else
8><
>:ð1Þ
q ¼ 1:49WS12
And−dsð Þ5=3 ð2Þ
where i is the rainfall rate, e is the surface evaporation, f is the infiltration rate, q is the
runoff rate (refer to Eq. (2)), W is the average channel width, S is the average slope of
the catchment, A is the surface area of the catchment, n is a surface roughness coeffi-
cient, and ds is the storage depth.
Governing equation for the 1D–1D dual drainage model To obtain the flood rout-
ing in the sewer or street, the continuity equation is combined with the momentum
equation, as shown in Eq. (3), to produce the average discharge.
∂Q∂t
¼ 2U∂A∂t
þ U2 ∂A∂x
−gA∂H∂x
−gAS f ð3Þ
where Q is the discharge in the sewer or street, t is the time, g is the gravitational accel-
eration, A is the cross-sectional area of the sewer or street, H is the hydraulic head of
water in the sewer or street, Sf is the friction slope from Manning’s equation, and U is
the velocity of water in the sewer or street. Details about solving Eq. (3) were provided
by Rossman (2015).
Description of the model setup in Huawei Science Park The Huawei Science Park is
an isolated urban drainage area. The 1D–1D dual drainage model in this area, as shown
in Fig. 8, includes 88 subcatchments, 142 manholes, and 216 sewers and streets that
collect the runoff and transfer the water to the detention ponds, which are located in
the southwest corner of the area.
Fig. 7 Nonlinear reservoir model of a catchment
Yang et al. Smart Water (2018) 3:1 Page 8 of 13

Case and discussionFigure 9 displays an example of an integrated system output of the DayuSWS. The
connection level (01) provides users with information such as the current water
level in the storm drainage system and real-time videos from two monitoring cam-
eras. Three colors are used to provide warning information and to communicate
with users concerning an upcoming situation. Green represents that “the situation
is safe,” yellow represents that “the drainage pipeline is 50% full,” and red repre-
sents that “the drainage pipeline is 100% full and flood will occur shortly.” The
conversion level (02) provides location-specific information pertaining to the
Fig. 8 Layout of the model setup in Huawei Science Park
Fig. 9 Example of DayuSWS output: 01 is the connection level, 02 is the conversion level, and 03 and 04are the cyber levels
Yang et al. Smart Water (2018) 3:1 Page 9 of 13

expected time in which the pipeline will be 100% full (red) or pipeline will be 50%
full (blue). The results are visualized to facilitate the communication process. The
cyber level 03 provides the subsequent 6-h forecast simulation results pertaining to
the water level on roads and areas that can be flooded. The flooded area is only
shown when the water level is higher than the curbs of the associated roads. The
cyber level 04 provides flood forecast at the county level with a lead time of 72 h
for precautionary purposes. The users can use this information to predict a disaster
and identify its possible impact.
A few events occurred since the establishment of the DayuSWS in May 2017. The
greatest event occurred on June 2, 2017 and was a high-rainfall event during the mon-
soon season (locally known as the Meiyu season). The Central Weather Bureau (CWB)
reported that more than 100 locations in Taiwan experienced more than 230 mm of
rainfall between early June 2 and early June 3, 2017. Some locations in northern Taiwan
experienced more than 600 mm of rainfall during the same period. This rainfall event
resulted in major flooding and mudslides. The study area experienced approximately
395 mm of rainfall in 24 h. Figure 10 shows the radar observation obtained from the
CWB and the rainfall distribution of the study area at the location of the Huawei rain-
fall gauge. The highest rainfall intensity of 49.5 mm/h was observed on June 3 at 5 am.
The period with the most severe rainfall was from 2 am to 8 am on June 3, with ap-
proximately 300 mm being accumulated in 6 h.
The DayuSWS monitored the park area and provided the forecasts from 9 pm
on June 2, 2017. The results showed only a few bodies of standing water on the
roads in the park but no significant floods. The system issued a warning message
on June 3 at 7 am (Fig. 11). During the end of the event (Fig. 10), the storm
drainage pipelines were almost 100% full. Ponds A and B (Fig. 1) are designed to
collect flood water for 50 years, and the storm sewage system is built to store
water for 25 years. The warning that the pipelines were full indicated that the two
detention ponds were almost full. If rainfall had continued, the park would be
flooded. Nevertheless, a levee breach was found in the upstream portion of the
study area (Fig. 12); thus, the flood water flowed to the upstream portion of the
study area that contained farmlands, averting further damage to the downstream
areas. During the event, the system provided accurate monitoring data and trans-
formed the data to useful information at the connection and conversion levels. The
5.5
1 03
15
0.5
41.5
1012
46.548.5
46.549.5
28.5
37
41.5
13.5
0 0 0 0.5 0 0 00
10
20
30
40
50
60
) rh/m
m(llafniaR
Huwei raingauge station
6/221:00
6/309:00
Fig. 10 Radar observation data from CWB (left) and the rainfall distribution for the study area (right) at theHuawei rainfall gauge location
Yang et al. Smart Water (2018) 3:1 Page 10 of 13

users could take immediate measures based on the information. If a forecast with
a 6-h lead time was provided to users at the cyber level, they could plan emer-
gency responses in advance to prevent or mitigate the impact of the predicted
floods. The second greatest event that hit the study area was Typhoon Haitang on
July 30, 2017. The accumulated rainfall was 211 mm from 7 pm on July 30 to
7 pm on July 31. The highest rainfall hour was 4 am on July 31. During the ty-
phoon, only one warning message was issued, when the water level in the
Hsinchuangzgi drainage was above the yellow level. However, the system predicted
that no flooding would occur due to the typhoon, and no flood was witnessed.
Thus, no damage was reported during Typhoon Haitang.
ConclusionsThe study proposes an innovative CPS-based smart water system for providing
real-time flood observations and forecasts with a 6-h lead time. The system inte-
grates AI and IoT technologies to transform observed data to useful information.
The system not only provides monitoring data to users but also enables them to
actively take necessary measures to mitigate the impacts of floods. The system was
implemented in a science park located in central Taiwan. A few events tested the
capabilities of the system and proved the system’s potential for future applications
in disaster prevention and mitigation. However, the CPS concept is developed on
Fig. 12 Photographs taken at various locations during the June 2, 2017 event when the detention pondswere almost full compared with the pictures in Fig. 4. The upstream area was flooded due to a leveebreach and the downstream area was not flooded during the event
Fig. 11 Yellow and red lines are the locations 2 and 4, respectively. Both of them reached the red level ofdanger (water depth = 20.5 m), which implies that the storm drainage pipeline is almost 100% full
Yang et al. Smart Water (2018) 3:1 Page 11 of 13

the basis of the 5C levels, and the system has implemented only the first three
levels—connection, conversion, and cyber levels. The higher the number of levels
is, the more added value is the system provides. The fourth and fifth levels, namely
the cognition and configuration levels, were not discussed in the study. Further de-
velopments in these two levels will be conducted. For example, optimized operat-
ing rules for water pumps can be identified on the basis of future flood forecasts
by using AI techniques. The optimized operation rules can mitigate or decrease
the flooding area of a flood by using the minimum cost. This feature belongs to
the cognition level. The water pumps can be automatically operated using the IoT
through any optimized operating rule. Thus, the system can replace users and can
perform an active role in taking necessary response measures; this belongs to the
configuration level. Other applications such as providing optimized traffic route in-
formation by employing UAVs during a flood will also be included in the future
applications. The CPS-based system has proved its potential to help in decision-
making processes during a disaster. Future applications will offer more help to
users and increase the efficiency of disaster relief. More applications of AI and IoT
will be employed in next-generation hazard-related response systems.
AcknowledgementsThe research was part of plan (grant no. 105f600191) funded by the Central Taiwan Science Park, Taiwan. The authorswould like to thank its supporting.
FundingThe Central Taiwan Science Park (grant no. 105f600191).
Availability of data and materialsSo far, the authors would not share research-related data or materials because we will do extended studies. We hopeyou can understand us. Many thanks!
Authors’ contributionsThe manuscript demonstrates a smart water system that integrates the concept of CPS and IOT. The purpose of thissystem is to provide more efficient and reliable flood forecasts and help decision-makers rapidly respond the threat ofthe flood. The system has been implemented in the Central Taiwan Science Park (CTSP). The experimental resultsrevealed that the system could increase the response efficiency of the emergency operations center during a fewextreme events in 2017. Thank you for your consideration of my work!. All authors read and approved the finalmanuscript.
Competing interestsThe authors declare that they have no competing interests.
Publisher’s NoteSpringer Nature remains neutral with regard to jurisdictional claims in published maps and institutional affiliations.
Author details1Taiwan Typhoon and Flood Research Institute, National Applied Research Laboratories, 11F, No. 97, Sec. 1, RooseveltRd, Taipei 100, Taiwan. 2Department of Civil and Disaster Prevention Engineering, National United University, No. 2,Lien Da, Nan Shih Li, Miaoli 360, Taiwan. 3Polytech Nice Sophia, University of Nice Sophia Antipolis, 06410 Biot, France.
Received: 27 November 2017 Accepted: 8 February 2018/
ReferencesAlemdar H, Leroy V, Prost-Boucle A, Pétrot F (2017) Ternary neural networks for resource-efficient AI applications. In
neural networks (IJCNN), 2017 international joint conference on (pp. 2547-2554). IEEEAugello A, Maniscalco U, Pilato G, Vella F (2016) Disaster prevention virtual advisors through soft sensor paradigm. In:
Pietro G, Gallo L, Howlett R, Jain L (eds) Intelligent Interactive Multimedia Systems and Services 2016. Smartinnovation, systems and technologies, vol 55. Springer, Cham
Chang TJ, Wang CH, Chen AS (2015) A novel approach to model dynamic flow interactions between storm sewersystem and overland surface for different land covers in urban areas. J Hydrol 524:662–679
Eisner R (2014) Managing the risk of compound disasters. Chapter 5. In: Disaster risk management in Asia and thePacific. Routledge, London, UK
Yang et al. Smart Water (2018) 3:1 Page 12 of 13

Hsiao LF, Chen DS, Kuo YH, Guo YR, Yeh TC, Hong JS, Fong CT, Lee CS (2012) Application of WRF 3DVAR to operationaltyphoon prediction in Taiwan: impact of outer loop and partial cycling approaches. Weather Forecast 27(5):1249–1263
Hsiao LF, Yang MJ, Lee CS, Kuo HC, Shih DS, Tsai CC, Wang CJ, Chang LY, Chen DYC, Feng L, Hong JS, Fong CT, ChenDS, Yeh TC, Huang CY, Guo WD, Lin GF (2013) Ensemble forecasting of typhoon rainfall and floods over amountainous watershed in Taiwan. J Hydrol 506:55–68
Hsu MH, Chen SH, Chang TJ (2000) Inundation simulation for urban drainage basin with storm sewer system. J Hydrol234:21–37
Lee J, Bagheri B, Kao HA (2015) A cyber-physical systems architecture for industry 4.0-based manufacturing systems.Manufacturing Letters 3:18–23
Lopez-Trujillo D (2010) Real time flood alert system (RTFAS) for Puerto Rico. US Department of Interior, US GeologicalSurvey
Mahul O (2017) Toward a regional approach for disaster risk finance in Asia. ICRM Symposium 2017, 3-4 August 2017,Dermatol Sin
Monostori L (2003) AI and machine learning techniques for managing complexity, changes and uncertainties inmanufacturing. Eng Appl Artif Intell 16(4):277–291
Monostori L, Kádár B, Bauernhansl T, Kondoh S, Kumara S, Reinhart G, Sauer O, Schuh G, Sihn W, Ueda K (2016) Cyber-physical systems in manufacturing. CIRP Annals-Manufacturing Technology 65(2):621–641
Rho S, Vasilakos A, Chen W (2016) Cyber physical systems technologies and applications. Futur Gener Comput Syst 56:436–437
Rossman LA (2015) Storm water management model. User’s manual Ver. 5.1. U. S. Environmental Protection AgencySun JZ, Wang HL, Tong WX, Zhang Y, Lin CY, Xu DM (2016) Comparison of the impacts of momentum control variables on
high-resolution variational data assimilation and precipitation forecasting. Mon Weather Rev 144(1):149–169Thielen J, Bartholmes J, Ramos MH, de Roo A (2009) The European flood alert system – part 1: concept and
development. Hydrol Earth Syst Sci 13:125–140Wu MC, Lin GF (2017) The very short-term rainfall forecasting for a mountainous watershed by means of an ensemble
numerical weather prediction system in Taiwan. J Hydrol 546:60–70Wu MC, Lin GF, Hwang LR, Chen DYC, Chiang CC, Wang YC (2016) Optimal integration of the ensemble forecasts from
an ensemble quantitative precipitation forecast experiment. Procedia Eng 154:1291–1297Yang TH, Yang SC, Ho JY, Lin GF, Hwang GD, Lee CS (2015) Flash flood warnings using the ensemble precipitation
forecasting technique: a case study on forecasting floods in Taiwan caused by typhoons. J Hydrol 520:367–378
Yang et al. Smart Water (2018) 3:1 Page 13 of 13


![[UniInfo 2014] Cost of cyber crime and how to prevent it](https://static.fdocuments.net/doc/165x107/55c09f74bb61ebb37c8b4816/uniinfo-2014-cost-of-cyber-crime-and-how-to-prevent-it.jpg)