Cyanotoxin Management Plan Template and Example Plans · Cyanotoxin Management Plan Template and...
199
Cyanotoxin Management Plan Template and Example Plans November 2016
Transcript of Cyanotoxin Management Plan Template and Example Plans · Cyanotoxin Management Plan Template and...

Cyanotoxin Management Plan Template and Example Plans
November 2016

i
Office of Water (4607M) EPA 810-B-16-006 November 2016

ii
Disclaimer
This document was prepared by the U.S. Environmental Protection Agency (USEPA) as an informational resource for public water systems and primacy agencies to prepare for and respond to the risk of cyanotoxins in finished water.
This document is not a regulation; it is not legally enforceable; and it does not confer legal rights or impose legal obligations on any party, including USEPA, States, or the regulated community. While the USEPA has made every effort to ensure the accuracy of the discussion in this document, the obligations of the regulated community are determined by statutes, regulations or other legally binding requirements. The recommendations discussed are not a substitute for applicable legal requirements. In the event of a conflict between the discussion in this document and any statute or regulation, this document would not be controlling.
Although this document describes suggestions for managing cyanotoxin issues in raw and finished water and provides examples of how five utilities are managing their risks, the recommendations described in the template and activities included in the examples may not be appropriate for all situations and alternative approaches may be applicable.
Mention of trade names, commercial products, specific methods and treatment for cyanotoxins does not constitute an USEPA endorsement or recommendation for use.
Questions concerning this document should be addressed to:
Hannah Holsinger USEPA OGWDW, SRMD, Standards and Risk Reduction Branch 1200 Pennsylvania Ave., NW MC 4607M Washington, DC 20460 (202) 564-0403, [email protected]

iii
Acknowledgements
EPA’s Office of Ground Water and Drinking Water would like to thank the Association of State Drinking Water Administrators, the States of California, New York, Ohio and Oregon for their contributions to this document.
This document was developed by the USEPA Office of Ground Water and Drinking Water in partnership with the States of California, New York, Ohio and Oregon, Highlands Mutual Water Company, Village of Perry Water System, Akron Water Supply Bureau, Ottawa County Regional Water System, City of Myrtle Creek, The Cadmus Group, Inc. and USEPA: Office of Research and Development, Region 2, Region 5, Region 9 and Region 10.
The following individuals helped to develop and review this document: • Hannah Holsinger, USEPA, OW • Katherine Foreman, USEPA, OW • Ryan Albert, USEPA, OW • Rachel Carlson, USEPA, OW • James (Bo) Williams, USEPA, OW • Karen Sklenar, The Cadmus Group, Inc. • Lesley D’Anglada, USEPA, OW • Nicholas Dugan, USEPA, ORD • Crystal Rodgers-Jenkins, USEPA, OW • Phil Oshida, USEPA, OW • Kenneth Rotert, USEPA, OW • Lili Wang, USEPA, OW • Deborah Vacs Renwick, USEPA, OW • Thomas Waters, USEPA, OW
Highlands Mutual Water Company-Example Plan • Norm Birdsey, Highlands Mutual Water Company • Jeff Davis, Highlands Mutual Water Company • Susan Keydel, USEPA, Region 9 • Amy Little, California State Water Resources Control Board • Sheri Miller, California State Water Resources Control Board
Village of Perry Water System-Example Plan
• Arlene Anderson, USEPA, Region 2 • Jeff Drain, Village of Perry • Hyland Hartsough, NY Department of Health • James Hyde, NY Department of Health • Michael Lowy, USEPA, Region 2 • Andrew Meyer, Wyoming County Health Department • Lloyd Wilson, NY Department of Health
iv
Akron Water Supply Bureau • Valerie Bosscher, USEPA, Region 5 • Wendy Drake, USEPA, Region 5 • Jessica Glowczewski, Akron Water Supply Bureau • Heather Raymond, Ohio EPA
Ottawa County Regional Water System • Valerie Bosscher, USEPA, Region 5 • Wendy Drake, USEPA, Region 5 • Kelly Frey, Ottawa County, Ohio • Mike Jividen, Ottawa County Regional Water System • Jeff Kukay, Ottawa County Regional Water System • Heather Raymond, Ohio EPA • Ron Wetzel, Ottawa County Regional Water System
City of Myrtle Creek • Rochelle Labiosa, USEPA, Region 10 • Casey Lyon, Oregon Health Authority • Sean Negherbon, City of Myrtle Creek

v
Cyanotoxin Management Plan Template Table of Contents
Abbreviations and Acronyms ...................................................................................................................... vi
Introduction ............................................................................................................................................... viii
Sample Template for System Use .............................................................................................................. T.1
Example Cyanotoxin Management Plans
Highlands Mutual Water Company Management Plan .............................................................. E1.1
Village of Perry Water System Management Plan ...................................................................... E2.1
Akron Water Supply Bureau Management Plan ......................................................................... E3.1
Ottawa County Regional Water Supply Management Plan ........................................................ E4.1
City of Myrtle Creek Management Plan ..................................................................................... E5.1
vi
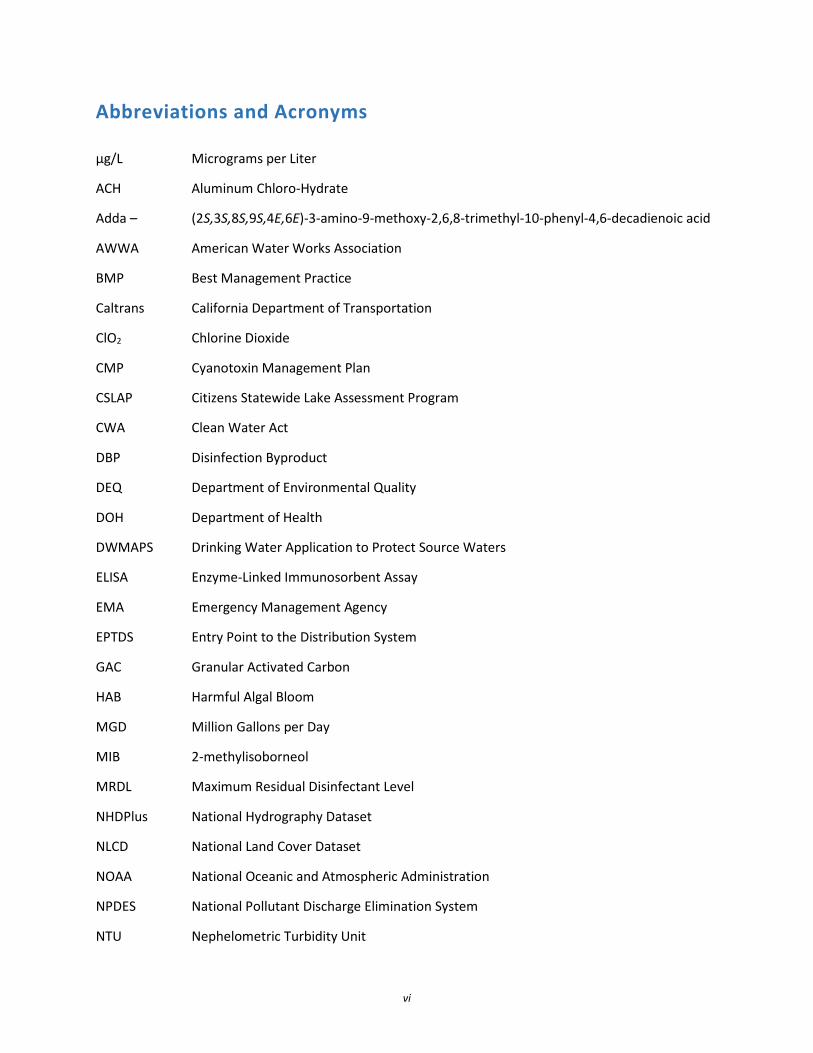
Abbreviations and Acronyms
µg/L Micrograms per Liter
ACH Aluminum Chloro-Hydrate
Adda – (2S,3S,8S,9S,4E,6E)-3-amino-9-methoxy-2,6,8-trimethyl-10-phenyl-4,6-decadienoic acid
AWWA American Water Works Association
BMP Best Management Practice
Caltrans California Department of Transportation
ClO2 Chlorine Dioxide
CMP Cyanotoxin Management Plan
CSLAP Citizens Statewide Lake Assessment Program
CWA Clean Water Act
DBP Disinfection Byproduct
DEQ Department of Environmental Quality
DOH Department of Health
DWMAPS Drinking Water Application to Protect Source Waters
ELISA Enzyme-Linked Immunosorbent Assay
EMA Emergency Management Agency
EPTDS Entry Point to the Distribution System
GAC Granular Activated Carbon
HAB Harmful Algal Bloom
MGD Million Gallons per Day
MIB 2-methylisoborneol
MRDL Maximum Residual Disinfectant Level
NHDPlus National Hydrography Dataset
NLCD National Land Cover Dataset
NOAA National Oceanic and Atmospheric Administration
NPDES National Pollutant Discharge Elimination System
NTU Nephelometric Turbidity Unit

vii
NYS DEC New York State Department of Environmental Conservation
NYSFOLA New York State Federation of Lake Associations
OCRWS Ottawa County Regional Water System
OHA Oregon Health Authority
PAC Powdered Activated Carbon
PETG Polyethylene terephthalate glycol
PUR Partnership for Umpqua Rivers
qPCR Quantitative Polymerase Chain Reaction
SCADA Supervisor Control and Data Acquisition
SUNY ESF SUNY College of Environmental Science and Forestry
SWRCB State Water Resources Control Board
TMDL Total Maximum Daily Load
TOC Total Organic Carbon
USEPA United States Environmental Protection Agency
USGS US Geological Survey
WRF Water Research Foundation
WTP Water Treatment Plant
WWTP Waste Water Treatment Plan

viii
Introduction
Cyanobacteria, formerly known as blue-green algae, naturally occur in surface waters. Under certain conditions such as warmer water temperatures and increased nutrients (nitrogen and phosphorus) cyanobacteria are able to grow rapidly, producing “blooms” referred to as harmful algal blooms or HABs. HABs can produce toxins known as cyanotoxins, which can be harmful to humans and animals. Conventional water treatment (consisting of coagulation, sedimentation, filtration and chlorination) can generally remove intact cyanobacterial cells and low levels of cyanotoxins from source waters. However, public water systems may face challenges in providing drinking water during a severe bloom event when there are high levels of cyanobacteria and cyanotoxins in source waters. With planning and active management, public water systems can reduce the risks of cyanotoxins occurring in finished drinking water.
The United States Environmental Protection Agency (USEPA) developed this cyanotoxin management plan (CMP) template and partnered with five utilities to develop example CMPs to support states, tribes and public water systems in preparing for and managing the risks from cyanotoxins to drinking water. The CMP template can be used by utilities to build system-specific cyanotoxin management plans as they deem appropriate. The template contains potential steps for monitoring, treatment, communication and long-term activities.
Ready-To-Use Template
The CMP template was developed to parallel the steps in the USEPA 2015 Recommendations for Public Water Systems to Manage Cyanotoxins in Drinking Water. The template was further refined as a result of the information gathered while collaborating with the five partner utilities to develop their system-specific plans. The recommendations document can serve as a resource for public water systems developing system-specific CMPs. Another available resource includes the utility action guide, Managing Cyanotoxins in Drinking Water: A Technical Guidance Manual for Drinking Water Professionals, developed by the American Water Works Association (AWWA) and the Water Research Foundation (WRF) available through both http://www.awwa.org/ and http://www.waterrf.org. As a public water system develops its plan, both documents can serve as useful sources of information to support a given public water system’s approach.
The template is provided in both an editable version (available on USEPA’s website at: https://www.epa.gov/ground-water-and-drinking-water/cyanotoxins-drinking-water) and within this document (found on p. T.1). The editable version will allow systems to develop a plan by directly adding text to the template and selecting resources as they deem appropriate, to create a system-specific CMP responsive to their individual systems and situations. The template depicts the following steps that public water systems could take to manage cyanotoxins in their drinking water systems:
Step 1: Assess Source Water. The template introduces considerations for assessing source water for vulnerability to HABs, including a number of factors: watershed characteristics, historic water quality information and pollution sources. Various sources could be used to gather this information, including state and local source watershed assessments, as well as online resources.
ix
Step 2: Preparation, Monitoring for Early Warning Signs and Immediate Actions. The template introduces considerations for possible actions to prepare for bloom and cyanotoxin occurrences including conducting training, acquiring monitoring and treatment equipment and materials, identifying necessary points of contact, monitoring early warning signs of a bloom and taking any immediate actions if a bloom is suspected.
Step 3: Raw Water Cyanotoxin Monitoring and Treatment Adjustments. The template introduces considerations for initial cyanotoxin monitoring in the raw water if a bloom is suspected near the intake and any treatment adjustments that may be necessary to ensure cyanotoxins do not reach the finished water.
Step 4: Finished Water Cyanotoxin Monitoring and Treatment Adjustments. The template introduces considerations for addressing cyanotoxin detections in the raw water and finished water sampling, including any additional treatment adjustments. Treatment adjustments and additions improve the likelihood of cyanotoxins being removed from the raw water to prevent finished water cyanotoxin contamination.
Step 5: Continued Finished Water Cyanotoxin Monitoring, Treatment Adjustments and Public Communication. The template introduces considerations for finished water monitoring treatment adjustments, which improve the likelihood that cyanotoxins are removed from the finished water. The section also includes where the utility can outline their process for public communication based on finished water monitoring results.
Opportunities to plan possible communication activities are included within each step. For example, possible communication could include contacting public water systems using the same source water if a bloom is suspected, or contacting local and state officials and the public if cyanotoxins are detected in finished water. To support public water systems, states and local governments in developing, as they deem appropriate, their own materials for communicating cyanotoxin risks to the public, USEPA developed a risk communication toolbox.
Example Plans
Using the template described above as a general guide, the USEPA partnered with utilities to support the development of five example CMPs. All five example CMPs generally follow the approach outlined in the template previously discussed and present information from a variety of different systems with varying sizes, source water types and treatment strategies. All five partner utilities had history of bloom occurrences in their source waters. Systems developing system-specific plans can see these plans as examples of how other systems are confronting their cyanotoxin challenges. Table 1 provides an overview of characteristics of the five partner utilities’ systems.
Please note, these five partner utilities’ CMPs are provided as examples and were developed in partnership with the utilities. Not all contents of the CMPs are appropriate to transfer to other systems. By presenting these plans, EPA is not endorsing how the systems manage their cyanotoxin risks.

x
Table 1. Characteristics of the five partner utilities’ systems.
State System Source Population
Served (Approx.)
Treatment
Powdered activated carbon
California Highlands
Mutual Water Company
Clear Lake 6,200 (PAC), permanganate, ozone,
clarification, filtration, granular activated carbon (GAC),
chlorination, corrosion control
New York Village of Perry Water System Silver Lake 3,700
Coagulation, flocculation, sedimentation, filtration, GAC, permanganate, chlorination,
fluoridation, corrosion control
Ohio Akron Water Supply Bureau Lake Rockwell 280,000
Permanganate, PAC, coagulation, chlorine dioxide, flocculation, sedimentation,
rapid sand filtration, chlorination, corrosion control,
fluoridation
Ohio Ottawa County Regional Water
System Lake Erie 25,000
Permanganate, PAC, coagulation, clarification,
filtration, chlorination, corrosion control, fluoridation
Oregon City of Myrtle Creek
South Umpqua
River 3,400
Infiltration gallery, coagulation, microfiltration, GAC, UV,
chlorination
Considerations for Plan Development
The template can assist public water systems in developing their own CMPs, recognizing the best approach will vary on a case-by-case basis. As they deem appropriate, public water systems may want to see the plans as examples of how other systems have planned to manage cyanotoxins. Described below are five themes that emerged from the example plans that are potential approaches to addressing cyanotoxins in drinking water.
Robust cyanotoxins monitoring approaches to managing blooms
Akron Water Supply Bureau and Ottawa County Regional Water System represent systems that have robust monitoring programs for both cyanotoxins and their indicators as a way to manage the risks of cyanotoxins in drinking water. To comply with Ohio state regulations, these systems, along with all other public water systems using surface water in Ohio, must routinely monitor source and finished water for total microcystins weekly or bi-weekly, depending on the season. Ohio’s regulation requires the frequency of monitoring at both raw and finished water sampling points to increase if microcystins are detected in raw and/or finished water sampling points. Routine raw water genomic cyanobacteria screening (through quantitative polymerase chain reaction (qPCR)) is also required bi-weekly. Additionally, Akron Water Supply Bureau and Ottawa County Regional Water System use a sonde to

xi
measure the cyanobacterial indicators chlorophyll-a and phycocyanin in the source water. These two systems’ example plans use an approach to managing cyanotoxins through early detection as a way to inform early treatment adjustments to decrease the risk of cyanotoxins breaking through to finished water.
Source water assessment and protection approaches to managing blooms
Highlands Mutual Water Company’s CMP provides an example with a more in-depth source water evaluation including identifying source water protection areas, detailing source water characteristics, evaluating land use characteristics within the watershed, reviewing historical cyanobacteria and cyanotoxin occurrences and evaluating point and nonpoint sources of pollution in the source water. Additionally, Highlands Mutual Water Company and Akron Water Supply Bureau’s plans also include enhanced source water protection strategies to prevent cyanotoxins in drinking water sources.
Source water management approaches to managing blooms
Akron Water Supply Bureau treats its source water with a commercial algaecide to decrease cyanobacterial blooms when cyanobacterial populations are increasing in the source water. Treatment occurs in a targeted fashion to avoid treating the entire lake. Akron Water Supply Bureau’s plan can be used as an example of a plan where the primary approach to ensuring algal toxins do not contaminate the finished water is through source water mitigation strategies for algae and cyanobacteria.
Smaller system approaches to managing blooms
The City of Myrtle Creek and Village of Perry represent smaller systems with historical problems with bloom occurrence. These small systems encounter challenges with managing cyanotoxins that may be similar to other small systems. These systems rely on indicators of blooms, such as visual observations of conditions in the source water and observations of changes in the treatment plant, rather than having their own routine cyanotoxin monitoring and screening program. Monitoring for microcystins in these systems is often only performed if a bloom is suspected in their source waters though source water and plant indicators or through coordination with state and local monitoring programs that monitor their source waters. Additionally, in the case of the City of Myrtle Creek, microcystins test strips are used for much of the raw water quality monitoring.
Enhanced treatment approaches
In addition to the above characteristics, all example plans include the systems’ plan to use enhanced treatment barriers to protect finished water from cyanotoxin contamination. Most of the systems either discontinue the use of pre-oxidation (e.g., pre-chlorination or pre-zonation) or use pre-oxidation with caution (e.g., use a low dose permanganate). Additionally, most of the systems use powdered activated carbon (PAC) and/or granular activated carbon (GAC) to treat cyanotoxins. For example, Highlands Mutual Water Company, Akron Water Supply Bureau and Ottawa County Regional Water System use PAC. The Village of Perry Water System, City of Myrtle Creek and Highlands Mutual Water Company use GAC for mitigating cyanotoxins. In addition, most systems developed strategies to optimize their existing coagulation and filtration processes for cell removal and enhance their post chlorination capacity to oxidize toxins.

xii
Summary
For those systems vulnerable to HAB events in their source water, the CMP template can provide a roadmap to support plan development, as the system deems appropriate. It provides an opportunity for public water systems to use a template that can be tailored to address system-specific conditions, recognizing the best approaches vary based on source water conditions and system characteristics. The five partner utilities’ plans following the template (found in sections E1-E5) are examples of how other systems are managing cyanotoxin risks to their drinking water. Other sources of information, including USEPA’s 2015 Recommendations for Public Water Systems to Manage Cyanotoxins in Drinking Water, USEPA’s Water Treatment Optimization for Cyanotoxins and AWWA’s and WRF’s Managing Cyanotoxins in Drinking Water: A Technical Guidance Manual for Drinking Water Professionals, can serve as additional resources to support public water systems in their cyanotoxin management efforts.

This page has been intentionally left blank.

T.1
Cyanotoxins Management Plan
Insert cover photo.
[Your Water System]
Enter Public Water System Contact Information and Address. Enter Publication Date.

T.2
Instructions for Using Template The template is intended to assist states, tribes and water utilities in developing their own cyanotoxin management plans specific for their locations. The template includes potential steps for monitoring, treatment and communication activities. However, systems should evaluate their system-specific conditions as the most appropriate course of action will vary for each water system depending on the type of system and conditions of the source water. To support systems as they develop their plans, five system-specific cyanotoxin management plans were developed to provide examples for utilities to see as they develop system-specific plans for their utility. Bolded language below provides instructions for filling out the template; gray language provides prompts for systems to include their system-specific language; and italicized language offers examples of types of information that may be useful.

T.3
Table of Contents
Instructions for Using Template................................................................................................................. T.2
Table of Contents ....................................................................................................................................... T.3
Appendices ................................................................................................................................................. T.4
Template Overview .................................................................................................................................... T.5
Management Steps for Determining a Public Water System’s Exposure to Cyanotoxins ......................... T.5
Cyanotoxin Management Plan Executive Summary .................................................................................. T.7
[Your Water System] Overview ............................................................................................................. T.8 Source Water ........................................................................................................................................ T.8 Treatment Process ................................................................................................................................ T.8 Routine Water Quality Monitoring ....................................................................................................... T.8
Step 1: Assess Source Water .................................................................................................................... T.10
1.1 Identify Source Water Protection Areas ........................................................................................ T.10 1.2 Create Inventory of HABs Risk Factors ........................................................................................... T.11 Source Water Characteristics .............................................................................................................. T.11 Water Quality Parameters .................................................................................................................. T.12 Point Sources of Nutrients and Other Contaminants ......................................................................... T.13 Nonpoint Sources of Nutrients and Other Contaminants .................................................................. T.13 Climate and Weather .......................................................................................................................... T.14 Other Source Water Management Activities ...................................................................................... T.14
1.3 Assess Vulnerability........................................................................................................................ T.14
Step 2: Preparation, Monitoring for Early Warning Signs and Immediate Actions ................................. T.16
2.1 Preparation .................................................................................................................................... T.16 Prepare Staff and Equipment for Monitoring ..................................................................................... T.16 Prepare Treatment Adjustments ........................................................................................................ T.16 Communications ................................................................................................................................. T.16 Establish Communication Plan with Other Source Water Users ........................................................ T.17 Communication with Stakeholders ..................................................................................................... T.17
2.2 Monitoring for Early Warning Signs ............................................................................................... T.17 Early Indicators or a Cyanobacterial Bloom ........................................................................................ T.17
2.3 Immediate Actions if a Bloom is Suspected ................................................................................... T.17 Monitoring Actions in Response to Early Warning Signs .................................................................... T.17 Treatment Adjustments in Response to Early Warning Signs............................................................. T.18 Communication Actions in Response to Early Warning Signs ............................................................ T.18 Source Water Mitigation Actions in Response to Early Warning Signs .............................................. T.18
Step 3: Raw Water Cyanotoxin Monitoring and Treatment Adjustments ............................................... T.19

T.4
Monitoring if Cyanobacteria are Identified or Suspected ................................................................... T.19 Operational Adjustments Based on Raw Water Cyanotoxin Measurements ...................................... T.19 Communications Based on Raw Water Cyanotoxin Measurements ................................................... T.19
Step 4: Finished Water Cyanotoxin Monitoring and Treatment Adjustments ........................................ T.20
Finished Water Cyanotoxin Monitoring ............................................................................................... T.20 Treatment Adjustments ....................................................................................................................... T.20 Communications .................................................................................................................................. T.20
Step 5: Continued Finished Water Cyanotoxin Monitoring, Treatment Adjustments and Public Communication ........................................................................................................................................ T.21
Continued Finished Water Cyanotoxin Monitoring ............................................................................. T.21 Treatment and Operations .................................................................................................................. T.21 Communications .................................................................................................................................. T.21
Long-Term Activities ................................................................................................................................ T.23
Appendices
Appendix A Cyanotoxin Management Flowchart .................................................................................... T.24
Appendix B Contacts and Stakeholder Information ................................................................................ T.25
Appendix C Notifying the Public of Cyanotoxins in their Water .............................................................. T.26

Template Cyanotoxin Management Plan - Template Overview T.5
Template Overview Cyanobacteria naturally occur in surface waters. Under certain conditions, such as warmer water temperatures and increased nutrients (nitrogen and phosphorus), cyanobacteria can grow rapidly producing “blooms” referred to as harmful algal blooms or HABs. HABs can pose a significant potential threat to human and ecological health. Cyanobacteria have the potential to produce toxins (known as cyanotoxins) that can cause adverse health effects in humans and animals through the contamination of waterways used for recreational purposes and drinking water supplies.
The United States Environmental Protection Agency (USEPA) encourages public water systems to consider how likely their systems may be to encounter HABs in their source waters. Systems with source waters that are susceptible to HABs could benefit from developing a system-specific cyanotoxin management plan (CMP) prior to a HAB event. Public water systems may want to periodically evaluate and modify their CMPs as their understanding of the specific challenges related to HABs facing their system evolves.
USEPA presents a possible approach to developing a CMP for drinking water systems in the 2015 document Recommendations for Public Water Systems to Manage Cyanotoxins in Drinking Water. The approach includes components for determining if and when a public water system is vulnerable to cyanotoxins, monitoring for cyanotoxins, treatment actions and communication strategies. The potential management steps are intended to provide a stepwise approach that allows a public water system, as it deems appropriate, to take actions to reduce the likelihood of cyanotoxin occurrence in its finished water.
Management Steps for Determining a Public Water System’s Exposure to Cyanotoxins Monitoring, treatment and communication are key elements of a CMP and play important roles during each step. An overview of each element is provided below.
Monitoring. Source water and system observations can inform a water system’s decisions about if and when to start cyanotoxin monitoring in raw and finished water, when and how to adjust treatment plant operations and when to communicate with external stakeholders and the public. USEPA does not currently regulate cyanotoxins and public water systems are not required to monitor for cyanotoxins in their drinking water (unless required by their state or primacy agency). Sampling locations and frequencies are useful to include in a CMP. Water systems that monitor may want to consider maintaining their records, as historical data can be valuable to a water system (and nearby systems) for determining if and when the water system is vulnerable to cyanotoxins. Details on monitoring and related resources are discussed in each of this CMP’s steps.
Treatment. A water system is encouraged to identify its treatment strategies for controlling cyanotoxins, and to do so in the context of its other drinking water treatment goals (e.g., turbidity control, disinfection byproduct (DBP) control, disinfection, taste and odor control, corrosion control, etc.). A water system can evaluate its existing treatment capabilities and make any needed short- and long-term improvements before the bloom season in order to be prepared to respond when cyanotoxins are detected. Treatment adjustments have been identified and included in the description of how to proceed for each step of this CMP. USEPA’s Water Treatment Optimization for Cyanotoxins is an available resource describing cyanotoxin optimization techniques.

Template Cyanotoxin Management Plan - Template Overview T.6
Communication. Communication is an integral part of each step of a CMP. Important communications to consider as part of a plan include sharing of information with the primacy agency, contract laboratories, neighboring drinking water systems utilizing the same source waters, local officials, drinking water stakeholders and the public. For public communications, communication strategies could take into consideration the media and non-English speakers, as well as segments of the public that are likely to take the greatest interest in messaging on cyanotoxins (such as parents of bottle-fed infants and other young children under the age of six years old). Partnerships to help communicate with sensitive populations, such as day care centers, pediatricians and dialysis centers, would also be helpful to identify in the plan. The plan can include contact information and instructions on when and how to communicate with stakeholders and the public. USEPA’s Cyanotoxin Risk Communication Toolbox is an available resource to assist with communicating the risks from cyanotoxins in drinking water.
For additional information about monitoring, treatment and communications see EPA’s 2015 Recommendations for Public Water Systems to Manage Cyanotoxins in Drinking Water.

Template Cyanotoxin Management Plan – Executive Summary T.7
Cyanotoxin Management Plan Executive Summary [Your Water System] has developed this Cyanotoxins Management Plan (CMP) to provide an action plan to prepare for and mitigate risks from harmful algal blooms (HABs) and cyanotoxins in order to protect public drinking water from cyanotoxin contamination. This document provides steps and documents activities to prepare for and identify a potential HAB occurrence and make treatment and operational adjustments to remove cyanotoxins from the water. This document also includes steps to provide timely information and (as appropriate) an advisory to the water system’s customers, and to document information about occurrences of HABs so that information can be used to minimize the effect of HABs on the water system in the future. This plan also contains possible future activities the utility could engage in to mitigate the risks from HABs and cyanotoxins, such as long-term source water protection activities. A detailed flowchart of the CMP can be found in Appendix A.
The steps outlined in this CMP include:
Step 1: Assess Source Water Step 2: Preparation, Monitoring for Early Warning Signs and Immediate Actions if a Bloom is Suspected Step 3: Raw Water Cyanotoxin Monitoring and Treatment Adjustments Step 4: Finished Water Cyanotoxin Monitoring and Treatment Adjustments Step 5: Continued Finished Water Cyanotoxin Monitoring, Treatment Adjustments and Public Communication
Template Cyanotoxin Management Plan – Overview T.8
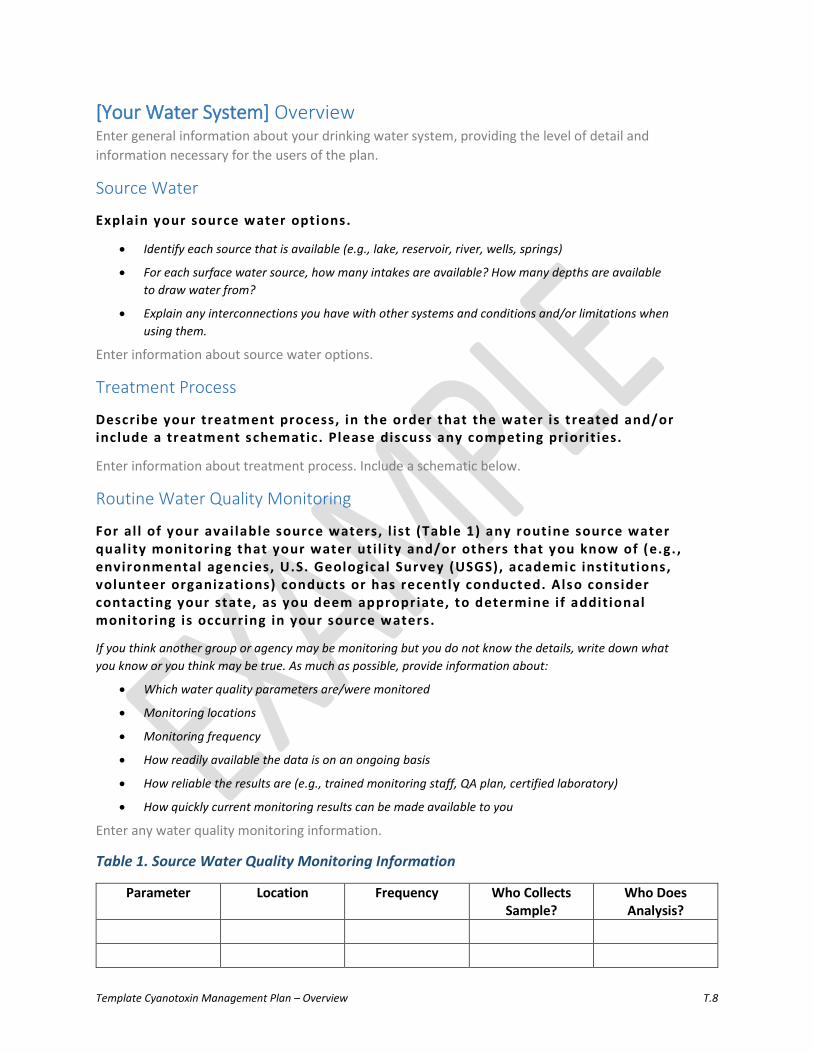
[Your Water System] Overview Enter general information about your drinking water system, providing the level of detail and information necessary for the users of the plan.
Source Water
Explain your source water options.
• Identify each source that is available (e.g., lake, reservoir, river, wells, springs)
• For each surface water source, how many intakes are available? How many depths are availableto draw water from?
• Explain any interconnections you have with other systems and conditions and/or limitations whenusing them.
Enter information about source water options.
Treatment Process
Describe your treatment process, in the order that the water is treated and/or include a treatment schematic. Please discuss any competing priorit ies.
Enter information about treatment process. Include a schematic below.
Routine Water Quality Monitoring
For al l of your avai lable source waters, l ist (Table 1) any routine source water quality monitoring that your water uti l ity and/or others that you know of (e.g. , environmental agencies, U.S. Geological Survey (USGS), academic institutions, volunteer organizations) conducts or has recently conducted. Also consider contacting your state, as you deem appropriate, to determine if additional monitoring is occurring in your source waters.
If you think another group or agency may be monitoring but you do not know the details, write down what you know or you think may be true. As much as possible, provide information about:
• Which water quality parameters are/were monitored
• Monitoring locations
• Monitoring frequency
• How readily available the data is on an ongoing basis
• How reliable the results are (e.g., trained monitoring staff, QA plan, certified laboratory)
• How quickly current monitoring results can be made available to you
Enter any water quality monitoring information.
Table 1. Source Water Quality Monitoring Information
Parameter Location Frequency Who Collects Sample?
Who Does Analysis?

Template Cyanotoxin Management Plan - Overview T.9
Enter Treatment Plant Schematic Heading
Enter treatment plant schematic.

Template Cyanotoxin Management Plan – Step 1 T.10
Step 1: Assess Source Water Evaluating available data on source water supports making a weight of evidence determination about the vulnerability to cyanotoxins. If a public water system determines that its source water is vulnerable, the water system proceeds to Step 2. If a public water system determines its source water is not vulnerable to cyanotoxins, the water system may want to consider periodically reassessing its source water as watershed characteristics could change over time.
1.1 Identify Source Water Protection Areas A source water assessment is an evaluation of a drinking water source to determine its susceptibility to contamination. The first step of any source water assessment is to delineate (map) the areas of water and land that drain into the water supply that are to be evaluated for contaminant sources. This is called the Source Water Protection Area.
Delineate your Source Water Protection Area and describe the methods and resources used to do so.
How to delineate your Source Water Protection Area:
State resources
• States completed Source Water Assessments in the early 2000s, which delineate Source Water Protection Areas for each system in the state. You can access your state’s Assessment and Service Planning Area maps by contacting your state’s source water staff. Please note information may have changed since their original development although some Source Water Assessments may have been updated.
• Many states have online mapping tools for Source Water Protection Areas.
Enter available state resources and source water protection area information.
Drinking Water Application to Protect Source Waters (DWMAPS)
• DWMAPS is a tool to help you quickly delineate a source water protection area based on mean water flow. Use the “Upstream” toolbar in DWMAPS to select your system’s location and trace catchments upstream. You can trace your Service Planning Area based on:
o Time of travel, e.g., 24 hours by mean flow from the stream reach. This method is useful for timing bloom response.
o Fixed distance, e.g., 15 miles along streamline, or 15 miles of setback around an intake. While not technically sophisticated, this method is easy to implement.
o Modeling uses surface runoff models to estimate the pathway of pollutants during rainfall and from point source outfalls. DWMAPS does not model specific pollutants.
• Zone of Concern
o Some states use a tiered zoning approach to map their source water protection areas. For example, water systems in the Ohio River Valley Water Sanitation Commission define multiple zones: the least critical zone is the entire Ohio River Basin and the most critical is all catchments within ¼ mile upstream of an intake. You can use DWMAPS or other modeling tools to quickly delineate zones of concern.

Template Cyanotoxin Management Plan – Step 1 T.11
Map 1: Delineation of source water protection area (yellow) based on 24 hours’ time of travel, DWMAPS
Enter Source Water Protection Area delineation methods. Enter description of map. A map can be created using DWMAPS (https://www.epa.gov/sourcewaterprotection/dwmaps) or other available mapping programs. For use of DWMAPS, navigate DWMAPS extent to the water systems intake location. Click Layers button in top right selection panel. Click the check box next to Catchments layer under Hydrography and Watersheds section. Click Legend button in top right selection panel. Use Snipping Tool application to extract map to JPEG file. A DWMAPS user guide is also available to assist in creating maps.
Enter Map Heading
Insert map image.
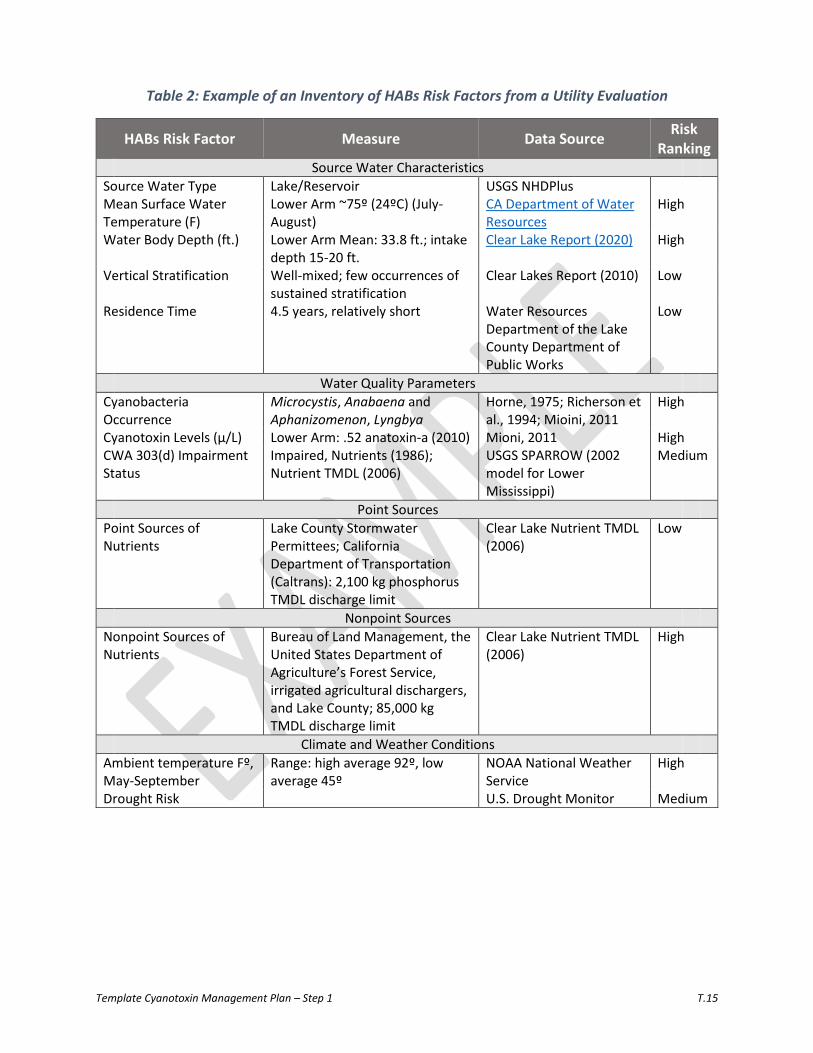
1.2 Create Inventory of HABs Risk Factors The next step is to create an inventory of possible HABs risk factors within your source water protection area(s). An example of a table of risk factors created by a utility is provided following the discussion on risk factors in Table 2. Information on the following factors can help you determine if and when blooms may occur.
Source Water Characteristics In general, fast flowing, nutrient-poor rivers are less vulnerable to HABs than nutrient-rich lakes and reservoirs. You may also consider factors such as vertical stratification, light intensity, wind patterns and

Template Cyanotoxin Management Plan – Step 1 T.12
mixing (see Appendix A of Recommendations for Public Water Systems to Manage Cyanotoxins in Drinking Water for more information).
• Is your source water ground or surface water?
• Is it fast-flowing, slow-moving or still water?
• Is it nutrient (phosphorus and nitrogen) rich?
To investigate source water characteristics:
If needed, consult your state water quality office, local monitoring data from nearby utilities or federal databases for source water information.
• Useful resources include Source Water Assessments and Lake Management Plans, as well as Clean Water Act 303(d) and 305(b) Integrated Reports, Nonpoint Source Management Plans and 319 grant proposals, and Total Maximum Daily Load (TMDL) analyses. For example see DWMAPS or WATERS.
• National Hydrography Dataset (NHDPlus) provides information on surface water and watershed characteristics.
For each source, identify any l imitations to using that source (e.g. , water quantity, water quality, operational l imitations, permit restrictions, costs).
Enter general information about source water type and include any source water limitations.
Describe or map land use within the watershed.
Evaluate land use using DWMAPS or another tool to view the National Land Cover Dataset (NLCD) or other land use classification tools. NLCD uses satellite data to classify land cover across the United States by 16 land use types. Use NLCD to determine where agriculture (hay/pastureland, cultivated crops) or urban development may affect your source water.
Enter a description of land use within the watershed.
Water Quality Parameters Water quality parameters can help to determine if the source water has had a history of blooms. Parameters to look for include:
• Cyanobacterial cell counts (including dominant cyanobacterial species) • Nitrogen and phosphorus levels • Chlorophyll-a levels • Phycocyanin levels • Zebra mussel population • Fish kills due to hypoxia • Presence of blooms and scums on the water
To investigate water quality:
• Search water quality databases, outlined here: http://sourcewatercollaborative.org/assess-protect-drinking-water-sources/find-data-in-my-area/.
• Useful resources include Source Water Assessments and Lake Management Plans, as well as Clean Water Act 303(d) and 305(b) Integrated Reports.

Template Cyanotoxin Management Plan – Step 1 T.13
• If needed, consult your state water quality office for more information about local monitoring data from nearby utilities, water quality volunteer or academic institutions and for additional information about federal databases for water quality data.
Provide a brief explanation of historical algae, cyanobacteria and cyanotoxin events in your source water. Describe any information used to conduct your evaluation.
Enter information on historical algae, cyanobacteria and cyanotoxin events in source water. Include predominant species of algae and/or cyanobacteria when possible.
Point Sources of Nutrients and Other Contaminants It is important to inventory all potential sources of contamination discharging into your source water. This inventory can point to critical HABs contributors.
Point sources of phosphorus and nitrogen can include:
• Permitted dischargers of nutrients under the National Pollutant Discharge Elimination System (NPDES)
• Publically owned treatment works • Combined sewer overflows
To create an inventory:
1. Use DWMAPS (Geographic Information System or GIS) layers or “Upstream” toolbar) to locate NPDES dischargers and publically owned treatment works. DWMAPS is synchronized with EPA’s Enforcement and Compliance History Online, which tracks facilities that have violated permit limits and may discharge excessive nutrients into your source water
2. Use EPA’s Discharge Monitoring Report database for more detailed facility information on small and large NPDES dischargers and treatment plants
Describe point sources of nutrients and other contaminants.
Enter any point sources of pollution, specifically sources of phosphorus and nitrogen.
Nonpoint Sources of Nutrients and Other Contaminants Nonpoint sources can include:
• Agricultural uses including animal and crop production (manure, pesticide and fertilizer) runoff • Urban stormwater or domestic runoff • Failing septic systems • Landfills/dumps • Atmospheric deposition
To create an inventory:
• Useful state resources include Source Water Assessments and Lake Management Plans, as well as Clean Water Act 303(d) and 305(b) Integrated Reports and Total Maximum Daily Load information.
• EPA’s Nitrogen and Phosphorus Data Access Tool displays nutrient data by watershed across the U.S., combining metrics from USEPA and USGS research programs.

Template Cyanotoxin Management Plan – Step 1 T.14
Describe nonpoint sources of nutrients and other contaminants.
Enter any nonpoint sources of pollution, specifically sources of phosphorus and nitrogen.
Climate and Weather Warm ambient and source water temperatures, heavy rainfall and runoff, drought and calmer wind often favor bloom growth. The climate of your geographic location can also impact temperature, stratification and turbulence in the water column, which affects bloom timing and occurrence. Research your area’s bloom history and consult with other water systems to track climatic and temporal patterns.
Describe the cl imate and typical weather conditions in your area.
Include descriptions of precipitation and temperature throughout the year.
Enter climate and weather conditions.
Other Source Water Management Activities
Describe any source water management activit ies such as an act ive watershed management program or other protection and improvement activit ies underway in your source waters. Include a description of how your water uti l ity’s interests are represented by these efforts ( i f represented).
Briefly describe source water protection efforts being carried out in your watershed (e.g., agricultural best management practices, conservation easements, streambank restoration, storm water runoff controls, wastewater treatment plant upgrades, environmental education and outreach) and who is making those efforts.
Enter a description of watershed management program.
Describe any previously implemented (or current implementation) of source water protection activit ies (perhaps derived from your last source water assessment).
Explain if you have any partners in these efforts, what the expected outcomes were, how the activities were financed and if there are any additional activities planned.
Enter information about your source water protection activities.
1.3 Assess Vulnerability A weight of evidence approach can be used to determine if the source water is vulnerable to HABs based on source water characteristics and HABs risk factors. Possible methods to evaluate vulnerability include:
• Build off of your inventory from Step 1.1 and Step 1.2 and assign risk “rankings” compared to risk-reducing “rankings” for the watershed. As an example, The California Drinking Water Source Assessment and Protection Program outlines this method for quantifying your Susceptibility here. Examples are shown in Table 2 below.
Enter a description of source water vulnerability including whether or not the source water has be determined to be vulnerable to HABs. See Section 1 and Appendix A of USEPA’s Recommendations for Public Water Systems to Manage Cyanotoxins in Drinking Water.
If you have determined that your source water is vulnerable go to Step 2.
Template Cyanotoxin Management Plan – Step 1 T.15
Table 2: Example of an Inventory of HABs Risk Factors from a Utility Evaluation
HABs Risk Factor Measure Data Source Risk Ranking
Source Water Characteristics Source Water Type Lake/Reservoir USGS NHDPlus Mean Surface Water Temperature (F)
Lower Arm ~75º (24ºC) (July-August)
CA Department of Water Resources
High
Water Body Depth (ft.) Lower Arm Mean: 33.8 ft.; intake depth 15-20 ft.
Clear Lake Report (2020) High
Vertical Stratification Well-mixed; few occurrences of sustained stratification
Clear Lakes Report (2010) Low
Residence Time 4.5 years, relatively short Water Resources Department of the Lake County Department of Public Works
Low
Water Quality Parameters Cyanobacteria Occurrence
Microcystis, Anabaena and Aphanizomenon, Lyngbya
Horne, 1975; Richerson et al., 1994; Mioini, 2011
High
Cyanotoxin Levels (µ/L) Lower Arm: .52 anatoxin-a (2010) Mioni, 2011 High CWA 303(d) Impairment Status
Impaired, Nutrients (1986); Nutrient TMDL (2006)
USGS SPARROW (2002 model for Lower Mississippi)
Medium
Point Sources Point Sources of Nutrients
Lake County Stormwater Permittees; California Department of Transportation (Caltrans): 2,100 kg phosphorus TMDL discharge limit
Clear Lake Nutrient TMDL (2006)
Low
Nonpoint Sources Nonpoint Sources of Nutrients
Bureau of Land Management, the United States Department of Agriculture’s Forest Service, irrigated agricultural dischargers, and Lake County; 85,000 kg TMDL discharge limit
Clear Lake Nutrient TMDL (2006)
High
Climate and Weather Conditions Ambient temperature Fº, May-September
Range: high average 92º, low average 45º
NOAA National Weather Service
High
Drought Risk U.S. Drought Monitor Medium
Template Cyanotoxin Management Plan – Step 2 T.16
Step 2: Preparation, Monitoring for Early Warning Signs and Immediate Actions 2.1 Preparation You have determined that [Your Water System] is potentially vulnerable to cyanotoxins. Possible next steps include preparing for possible cyanobacterial blooms and cyanotoxin occurrence. A water system can prepare by: determining when blooms are most likely to occur, contingency planning in the event alternative sources of water are needed, evaluating the current treatment process to determine susceptibility and vulnerabilities, communication with other water utilities with the same source water, monitoring source waters, preparing for treatment adjustments and ordering necessary laboratory equipment, or establishing contracts with outside laboratories. Preparation can also involve establishing communication plans in order to be prepared for any public communication as appropriate or required by the state. Preparation can also include establishing and documenting sampling procedures, testing procedures and quality assurance procedures.
Prepare Staff and Equipment for Monitoring For tips on monitoring and sampling see Sections 2.2, 3.1, 4.1, 5.1 and Appendix A of USEPA’s Recommendations for Public Water Systems to Manage Cyanotoxins in Drinking Water, USEPA’s Online Source Water Quality Monitoring for Water Quality Surveillance and Response Systems, and American Water Works Association (AWWA) and Water Research Foundation (WRF)’s Managing Cyanotoxins in Drinking Water: A Technical Guidance Manual for Drinking Water Professionals. Preparing for monitoring can involve preparing your utility lab for monitoring, such as ordering necessary supplies. It can also involve setting up contract labs, as appropriate, prior to bloom season in order to allow for rapid monitoring response if a bloom has occurred.
[Your Water System] wil l carry out the fol lowing activit ies in order to be prepared for the monitoring steps described in this plan:
Enter monitoring preparation steps.
Prepare Treatment Adjustments For tips on treatment adjustments see Sections 2.4, 3.3, 4.3, 5.3 and Appendix E of USEPA’s Recommendations for Public Water Systems to Manage Cyanotoxins in Drinking Water, USEPA’s Water Treatment Optimization for Cyanotoxins and Section II of AWWA and WRF’s Managing Cyanotoxins in Drinking Water: A Technical Guidance Manual for Drinking Water Professionals.
[Your Water System] wil l carry out the fol lowing activit ies in order to be more prepared to treat its source water during a HAB:
Enter treatment preparation steps.
Communications For tips on communication see Sections 2.3, 3.2, 5.2 and Appendix D of USEPA’s Recommendations for Public Water Systems to Manage Cyanotoxins in Drinking Water, USEPA’s Drinking Water Cyanotoxin Risk Communication Toolbox, Section IV of AWWA and WRF’s Managing Cyanotoxins in Drinking Water:

Template Cyanotoxin Management Plan – Step 2 T.17
A Technical Guidance Manual for Drinking Water Professionals and Centers for Disease Control’s Drinking Water Advisory Communication Toolbox.
Establish Communication Plan with Other Source Water Users
Describe any uti l it ies using the same source water as your uti l ity.
Do you communicate with one another? Do you have an organized method for communicating? Are there specific reasons or conditions when you contact one another? Explain briefly.
Enter a description of interactions with other neighboring utilities or other source water users.
Communication with Stakeholders
[Your Water System] wil l carry out the fol lowing activit ies in order to be more prepared for the communications steps described in this plan:
Do you have any pre-prepared public communication materials? Do you have a method for communicating with stakeholders?
Enter communication preparation steps.
2.2 Monitoring for Early Warning Signs Based on historical blooms in [insert source water source], there may be a time of year and other conditions that prompt you to watch closely for signs of blooms. Early indicators, like challenges to normal treatment schedules or changes in other water quality parameters, can serve as early warning signs of impending blooms. Early warning signs that operators can look for during the system’s normal operation are identified in this section, including routine water quality monitoring, as well as follow-up activities if any of the early warning signs are observed.
Early Indicators of a Cyanobacterial Bloom
Describe specific conditions related to your source water or treatment system that are early indicators of a cyanobacterial bloom.
(Some examples could include: reduced Secchi disk depth in source water, increased turbidity, color change, taste and odor complaints, geosmin and/or MIB (2-methylisoborneol) occurrence, shortened filter run times, increased disinfectant demand, weakening thermocline, cyanobacteria detects, toxin-producing cyanobacterial gene detects (quantitative polymerase chain reaction (qPCR)), increased cyanobacterial biomass and/or cell counts, changes in cyanobacteria/algae community composition, cyanotoxin detects, phycocyanin and chlorophyll-a)
Enter any early indicators of a cyanobacterial bloom that you have noticed in the source water.
2.3 Immediate Actions if a Bloom is Suspected Monitoring Actions in Response to Early Warning Signs
Describe monitoring actions to take in response to early warning signs.
Enter sampling actions, if any, that will be taken.

Template Cyanotoxin Management Plan – Step 2 T.18
Describe additional immediate observation/monitoring steps to take if any of the early warning signs identif ied above are detected.
Enter any additional sampling or monitoring actions including water type and methods. Include any language about the transition to Step 3 and/or Step 4, if applicable as an immediate action.
Treatment Adjustments in Response to Early Warning Signs
Describe immediate treatment adjustments ( i f any) to make if a cyanobacterial bloom is beginning to take place in your source water.
Enter treatment adjustments, if any, that will occur. Include any language about the transition to Step 3 and/or Step 4, if applicable as an immediate action.
Communication Actions in Response to Early Warning Signs
Describe immediate communication actions ( i f any) to take i f cyanobacteria are identif ied in source water sample(s) including those that are potential cyanotoxin producers.
Enter communication actions, if any, that will be taken.
Source Water Mitigation Actions in Response to Early Warning Signs
Describe the use, either by you or anyone else, of algaecides, coagulants or other chemicals to treat your source water before it enters your treatment plant. Include detai ls on what treatment is used, how often and under what conditions. (Note, waterbody management strategies, such as algaecides or introduction of predator species, may have downstream unintended consequences. State regulations may also apply.)
Enter list of source water mitigation activities, if any.

Template Cyanotoxin Management Plan – Step 3 T.19
Step 3: Raw Water Cyanotoxin Monitoring and Treatment Adjustments If a cyanobacterial bloom is observed or inferred during Step 2, [Your Water System] begins sampling.
In cases where raw water monitoring (Step 3) is determined necessary by visual confirmation of blooms near the intake (for example microscopically confirmed cyanobacteria) or other indications of a bloom near the intake, the public water system may want to consider continuing raw water sampling until the bloom is no longer visually identifiable or indicators are no longer observed.
A water system may want to communicate with some of its stakeholders and adjust treatment or system operations based on raw water monitoring cyanotoxin results.
Monitoring if Cyanobacteria are Identified or Suspected Describe monitoring actions to take if cyanobacteria are identif ied or suspected in source water located near the intake.
Enter raw water monitoring actions and methods used.
Operational Adjustments Based on Raw Water Cyanotoxin Measurements Describe operational adjustments to make to your treatment ( i f any) based on source water cyanobacteria or raw water cyanotoxin measurements.
Enter a description of operational treatment adjustments, if any.
Communications Based on Raw Water Cyanotoxin Measurements
Describe communication actions to take if cyanotoxins are detected in the raw water.
Enter communication actions, if any.
If monitoring results indicate the presence of cyanotoxins in the raw water, [Your Water System] continues to Step 4.
Enter a description of how quickly the system will move to Step 4.
If no cyanotoxins are found in the raw water, [Your Water System] intends to continue to monitor or watch closely for blooms (Step 2).

Template Cyanotoxin Management Plan – Step 4 T.20
Step 4: Finished Water Cyanotoxin Monitoring and Treatment Adjustments Detecting and positively confirming cyanotoxins in the finished water indicates that cyanotoxins have broken through the treatment barriers. It is important to evaluate the performance of individual unit processes across the treatment train to help understand what is happening in the treatment train and identify possible treatment breakdown. Public water systems likely will want to continue implementing treatment strategies described in Steps 2 or 3 and consider further testing and adjustments to improve treatment performance.
Finished Water Cyanotoxin Monitoring Describe finished water monitoring including which methods wil l be used.
Enter monitoring steps and methods used.
Describe what additional monitoring wil l occur i f cyanotoxins are not found in f inished water including any monitoring to occur in the source or raw water.
Enter additional monitoring your system will carry out, if any.
Treatment Adjustments In addition to the treatment adjustments l i sted in Step 3, describe what additional treatment steps wil l occur.
Enter additional treatment steps, if any.
Communications Describe what communications [Your Water System] wil l carry out i f cyanotoxins are present in f inished water.
Enter communication activities, if any.
If cyanotoxins were detected in any of the entry point or distribution system samples, [Your Water System] proceeds to Step 5.
Template Cyanotoxin Management Plan – Step 5 T.21
Step 5: Continued Finished Water Cyanotoxin Monitoring, Treatment Adjustments and Public Communication Step 5 can contain communication actions, treatment actions and additional monitoring based on the concentrations of cyanotoxins found in the finished water. Having clearly described actions in this fifth step enables a public water system to act quickly if cyanotoxins are confirmed in its finished water.
Continued Finished Water Cyanotoxin Monitoring Describe what additional monitoring steps [Your Water System] wil l take if cyanotoxins are detected in the finished water including which methods wil l be used.
Enter monitoring steps and methods you intend to use.
• Include any toxin levels that [Your Water System] wil l use to decide whether to conduct additional cyanotoxin sampling.
• Include analytical method that [Your Water System] wil l use when having additional samples analyzed.
Analyses carried out by the laboratory are typically considered more reliable tests than those carried out using test strips and therefore, are useful when confirmation samples need to be taken to inform management decisions.
Enter a description of the toxin level that would indicate a need for additional sampling and describe the additional sampling and which method will be used.
Describe what monitoring steps [Your Water System] wil l take if the additional sampling does not detect cyanotoxins.
Enter monitoring steps.
Treatment and Operations Describe any treatment steps [Your Water System] wil l take.
Enter treatment adjustments or additions, if any.
Communications Describe any communication steps [Your Water System] wil l take if any of the distr ibution system samples or the entry point sample(s) tested during additional sampling are at or exceed any established toxin levels.
Enter communication steps, if any, and include with who and when communication will take place. Include communication action items based on level of cyanotoxins detected, if any.
Template Cyanotoxin Management Plan – Step 5 T.22
Describe any communication steps [Your Water System] wil l take if the additional sample results for al l the samples are below an established toxin level in the entry point to the distr ibution system or in the distr ibution system.
Enter communication steps, if any, and include communication action items based on levels of cyanotoxins detected, if any.
Describe any communication steps [Your Water System] wil l take if al l of the additional sample results for al l samples show no cyanotoxin detects.
Enter communication steps, if any.

Template Cyanotoxin Management Plan - Long-Term Activities T.23
Long-Term Activities Describe any long-term plans for prevention, mitigation and management of the r isks to drinking water from HABs such as treatment and monitoring activit ies, source water protection and mitigation activit ies and enhanced coordination with stakeholders.
Enter any long-term activities.

Template Cyanotoxin Management Plan – Appendix A T.24
Appendix A Cyanotoxin Management Flowchart

Template Cyanotoxin Management Plan – Appendix B T.25
Appendix B Contacts and Stakeholder Information
Provide names and contact information (office and mobile phone numbers, email address, affiliation) for the most appropriate contacts. Names may be repeated if the person will serve more than one role.
Laboratory Contact Information Enter your laboratory’s name, phone number and any other contact information that will be needed to contact the lab in case of an occurrence of HABs.
Stakeholders Not all cyanotoxin management plans are the same, but the basic concepts of designing a plan are similar to those of other environmental or sustainability programs. For any plan to be successful it is important to involve utility management, the utility employees and all interested stakeholders early and often. A joint management/employee/stakeholder committee could be used to ensure the plan is implemented correctly. Examples of stakeholders include: primacy agency, local officials, emergency managers, other government agencies such as health departments, nearby public water systems and hospitals.
Agency/Company Position Contact Name Contact Phone Contact Email

Template Cyanotoxin Management Plan – Appendix C T.26
Appendix C Notifying the Public of Cyanotoxins in their Water
At the time of publication of this document, public water systems are not currently required to notify their customers of any bloom or cyanotoxin occurrence and are not required to include detections as part of a system’s Consumer Confidence Report under any National Primary Drinking Water Regulations. Systems should consider consulting with their state or primacy agency to determine if they are subject to any state or tribal notification requirements. Although not currently required by federal regulations, water systems may want to consider communicating with their consumers if cyanotoxins in finished water are confirmed in additional samples. This communication may be received more positively if the water systems have engaged in prior communication with the public about HABs. A water system is encouraged to tailor its communications based on the cyanotoxin levels detected.
In fall 2016, the USEPA released the drinking water cyanotoxin risk communication toolbox. This toolbox is a ready-to-use, “one-stop-shop” to support public water systems, states and local governments in developing, as they deem appropriate, their own risk communication materials. It includes editable worksheets, press release templates, social media posts and other quick references. The materials focus on communicating risk and providing background information to the public prior to and during a drinking water cyanotoxin contamination event as well as general information on harmful algal blooms and cyanotoxins. For the full toolbox please see USEPA's Cyanotoxin Risk Communication Toolbox. Below are some sample templates from that toolbox that are ready-to-use for cyanotoxin Drinking Water Advisories. Brackets ( [ ] ) are included as prompts to fill in system-specific information. There are three template options available, one for each of the following scenarios, when toxin levels1 in finished drinking water are:
• Greater than the USEPA’s Health Advisory level for everyone, meaning levels are greater than both the Health Advisory levels for infants and young children under the age of six and those for children six years and older through adults;
• Greater than the USEPA’s Health Advisory level for infants and young children under the age of six, but less than or equal to the Health Advisory level for children six years and older through adults;
• Less than or equal to the USEPA’s Health Advisory level for everyone, meaning levels are less than or equal to Health Advisory levels for infants and young children under the age of six and therefore they are also less than the Health Advisory levels for children six years and older through adults.
As means of an example, the USEPA’s Health Advisory levels for microcystins and cylindrospermopsin are used as cyanotoxin levels that inform public communication decisions in these Drinking Water Advisories. Materials can be edited to include any information determined appropriate by states and public water systems such as different cyanotoxin levels that inform public communication decisions.
1 The U.S. Environmental Protection Agency’s Health Advisory levels are the following: less than or equal to 0.3 micrograms per liter for microcystins and less than or equal 0.7 micrograms per liter for cylindrospermopsin in drinking water for children under the age of six years old. Children six years and older through adults, the recommended Health Advisory levels for drinking water is less than or equal to 1.6 micrograms per liter for microcystins and less than or equal 3.0 micrograms per liter for cylindrospermopsin.

Template Cyanotoxin Management Plan – Appendix C T.27
DRINKING WATER ADVISORY [CYANOTOXIN NAME] is present in [WATER SYSTEM NAME]
DO NOT DRINK THE TAP WATER [Date issued]
Why is there an advisory? • [Cyanotoxin name], a toxin produced by cyanobacteria (formerly known as blue-green algae)
was detected in the drinking water from [System name] on [date].• Elevated levels of toxins have been detected in [source name] that supplies water to
[geographic area, cities, counties, distribution system segments, etc.].• [System name] is taking the following actions to reduce [cyanotoxin name] levels: [list
actions such as: adjusting treatment, changing source, etc.].• Samples collected on [dates] show [cyanotoxin name] in the drinking water at [levels and/or
ranges], which are above the U.S. Environmental Protection Agency’s [cyanotoxin name] national drinking water Health Advisory of [level].
What should I do?
• Do Not Drink the tap water.• [Alternative sources of water] should be used for drinking, making infant formula, making ice
and preparing food and beverages.• Do Not Boil the tap water. Boiling the water will not destroy cyanotoxins and may increase the
toxin levels.• Everyone may use tap water for showering, bathing, washing hands, washing dishes, flushing
toilets, cleaning and doing laundry. However, infants and young children under the age of sixshould be supervised while bathing and during other tap water-related activities to preventaccidental ingestion of water.
• Drinking water containing [cyanotoxin name] at levels exceeding the national drinking waterHealth Advisories can put you at risk of various adverse health effects including upset stomach,vomiting and diarrhea as well as liver and kidney damage. Seek medical attention if you orfamily members are experiencing illness.
• Animals may be vulnerable to adverse health effects of [cyanotoxin name] at the detected levelsindicated above; consider providing animals alternative sources of water. Contact a veterinarianif animals show signs of illness.
• If you, your family members or your animals have experienced adverse cyanotoxin-relatedhealth effects, please contact [State or local Health Department] to report the illness.
What is being done?
• [System name] is working closely with local and state public health and emergency responseagencies to address the situation and to quickly to reduce [cyanotoxin name] levels in tap water.
• [System name] will post an updated advisory when: the [cyanotoxin] levels are less than orequal to the national drinking water Health Advisories, this Do Not Drink Advisory is liftedand/or if there are any changes to the conditions of this Do Not Drink Advisory.

Template Cyanotoxin Management Plan – Appendix C T.28
• For more information please contact [contact information] or visit [website].
Please share this information with all the other people who drink this water, especially those who may not have received this notice directly (for example, people in apartments, nursing homes, schools and businesses). You can do this by posting this notice in a public place or distributing copies by hand.
This notice is being sent to you by [system]. State Water System ID#: ___________ Date distributed: ______

Template Cyanotoxin Management Plan – Appendix C T.29
DRINKING WATER ADVISORY [CYANOTOXIN NAME] is present in [WATER SYSTEM NAME]
INFANTS, YOUNG CHILDREN AND OTHER VULNERABLE POPULATIONS: DO NOT DRINK THE TAP
WATER
[Date issued] Why is there an advisory?
• [Cyanotoxin name], a toxin produced by cyanobacteria (formerly known as blue-green algae), was detected in the drinking water from [System name] on [date].
• Elevated levels of toxins have been detected in [source name] that supplies water to[geographic area: cities, counties, distribution system segments, etc.].
• [System name] is taking the following actions to reduce [cyanotoxin name] levels: [list actions such as adjusting treatment, changing source, etc.].
• Samples collected on [dates] show [cyanotoxin name] in the drinking water at [levels and/or ranges], which are above the U.S. Environmental Protection Agency’s [cyanotoxin name] national drinking water Health Advisory for vulnerable populations (listed below) of [level].
What should I do?
• The following vulnerable populations should Not Drink the tap water because they may bevulnerable to the effects of [cyanotoxin name]:
o Infants,o Young children under the age of six,o Pregnant women and nursing mothers,o Those with pre-existing liver conditions,o Those receiving dialysis treatment, ando As a precautionary measure, the elderly and other sensitive populations should consider
following these advisory instructions.• Vulnerable populations, listed above, should use [alternative sources of water] for drinking,
making infant formula, making ice and preparing food and beverages.• Do Not Boil the tap water. Boiling the water will not destroy toxins and may increase the toxin
levels.• Individuals not considered to be in the vulnerable category, as listed above, may drink the
water.• Everyone may use tap water for showering, bathing, washing hands, washing dishes, flushing
toilets, cleaning and doing laundry. However, infants and young children under the age of sixshould be supervised while bathing and during other tap water-related activities to preventaccidental ingestion of water.
• Vulnerable populations, as listed above, who drink water containing [cyanotoxin name] at levelsexceeding the national drinking water Health Advisories are at risk of various adverse health

Template Cyanotoxin Management Plan – Appendix C T.30
effects including upset stomach, vomiting and diarrhea as well as liver and kidney damage. Seek medical attention if you or family members are experiencing illness.
• Animals may be vulnerable to adverse health effects of [cyanotoxin name] at the detected levels indicated above; consider providing animals alternative sources of water. Contact a veterinarian if animals show signs of illness.
• If you, your family members, or your animals have experienced adverse cyanotoxin-related health effects, please contact [State or local Health Department] to report the illness.
What is being done?
• [System name] is working closely with local and state public health and emergency response agencies to address the situation and quickly reduce [cyanotoxin name] levels in tap water.
• [System name] will post an updated advisory when: the [cyanotoxin] levels are less than or equal to the national drinking water Health Advisories, this Do Not Drink Advisory is lifted and/or if there are any changes to the conditions of this Do Not Drink Advisory.
• For more information please contact [contact information] or visit [website].
Please share this information with all the other people who drink this water, especially those who may not have received this notice directly (for example, people in apartments, nursing homes, schools and businesses). You can do this by posting this notice in a public place or distributing copies by hand.
This notice is being sent to you by [system]. State Water System ID#: ___________ Date distributed: ______

Template Cyanotoxin Management Plan – Appendix C T.31
DRINKING WATER ADVISORY LIFTED for [WATER SYSTEM NAME]
Everyone May Drink the Tap Water
[Date issued] Why is the advisory lifted?
• Drinking water advisory issued on [date] for [System name] that supplies water to [geographic area: cities, counties, distribution system segments, etc.] has been lifted.
• Samples collected on [dates] shows [cyanotoxin name] in the drinking water at [levels and/or ranges], which are [less than or equal to] the U.S. Environmental Protection Agency’s[cyanotoxin name] national drinking water Health Advisory of [level].
• [System name] took the following actions to reduce [cyanotoxin name] levels: [list actions such as adjusting treatment, changing source, etc.].
What should I do?
• Everyone may resume using the tap water for all uses.• [Insert any suggested activities for customers when resuming consumption of their tap water].• [Insert any actions taken by public water supply to reduce risks of cyanotoxins in drinking water
in the future].
Please share this information with all the other people who drink this water, especially those who may not have received this notice directly (for example, people in apartments, nursing homes, schools and businesses). You can do this by posting this notice in a public place or distributing copies by hand.
This notice is being sent to you by [system]. State Water System ID#: ___________ Date distributed: ______

This page has been intentionally left blank
E1.1
Cyanotoxins Management Plan
Highlands Mutual Water Company Clearlake, Cal ifornia
November, 2016

E1.2
Table of Contents Executive Summary .............................................................................................................................. E1.4 Highlands Mutual Water Company Overview ..................................................................................... E1.5 Source Water ...................................................................................................................................... E1.5 Treatment Process .............................................................................................................................. E1.5 Routine Water Quality Monitoring ..................................................................................................... E1.6
Cyanotoxin Management Plan ............................................................................................................. E1.6
Step 1: Assess Source Water .................................................................................................................... E1.9
1.1 Identify Source Water Protection Areas ........................................................................................ E1.9 1.2 Create an Inventory of HABs Risk Factors .................................................................................... E1.11 1.2.1 Source Water Characteristics ................................................................................................... E1.11 Land Use ............................................................................................................................................ E1.12 1.2.2 Water Quality Parameters ....................................................................................................... E1.13 Historical Cyanobacteria and Cyanotoxin Events in Source Water .................................................. E1.13 Presence of Toxic Cyanobacteria in Clear Lake ................................................................................. E1.13 Presence of Cyanotoxins in Clear Lake ............................................................................................. E1.14 Nutrients ........................................................................................................................................... E1.15 1.2.3 Point Sources of Pollution ........................................................................................................ E1.15 1.2.4 Nonpoint Sources of Pollution ................................................................................................. E1.16 1.2.5 Climate and Weather ............................................................................................................... E1.17
1.3 Assess Vulnerability...................................................................................................................... E1.18
Step 2: Preparation, Monitoring for Early Warning Signs and Immediate Actions ............................... E1.19
2.1 Preparation .................................................................................................................................. E1.19 Prepare Staff and Equipment for Monitoring ................................................................................... E1.19
Prepare for Treatment Adjustments .................................................................................................. E1.19 Communications ............................................................................................................................... E1.20 Establish Communication Plan with other Source Water Users ....................................................... E1.20 Communication with Stakeholders ................................................................................................... E1.20
2.2 Monitoring the Early Warning Signs ............................................................................................ E1.21 Early Indicators of a Cyanobacterial Bloom ...................................................................................... E1.21
2.3 Immediate Actions if a Bloom is Suspected ................................................................................. E1.22 Monitoring Actions in Response to Early Warning Signs .................................................................. E1.22 Communication Actions in Response to Early Warning Signs .......................................................... E1.22 Source Water Mitigation Actions in Response to Early Warning Signs ............................................ E1.22
Step 3: Raw Water Cyanotoxin Monitoring and Treatment Adjustments ............................................. E1.23
Monitoring if Cyanobacteria are Identified or Suspected ................................................................. E1.23 Operational Adjustments Based on Raw Water Cyanotoxin Measurements .................................... E1.23 Communications Based on Raw Water Cyanotoxin Measurements ................................................. E1.24
Step 4: Finished Water Cyanotoxin Monitoring and Treatment Adjustments ...................................... E1.25

E1.3
Finished Water Microcystins Monitoring .......................................................................................... E1.25 Treatment .......................................................................................................................................... E1.26 Communications ................................................................................................................................ E1.26
Step 5: Continued Finished Water Cyanotoxin Monitoring, Treatment Adjustments and Public Communication ...................................................................................................................................... E1.27
Continued Finished Water Microcystins Monitoring ......................................................................... E1.27 Treatment .......................................................................................................................................... E1.27 Communications ................................................................................................................................ E1.28
Long-Term Activities .............................................................................................................................. E1.29
Treatment Activities ........................................................................................................................... E1.29 Monitoring Activities .......................................................................................................................... E1.29 Source Water Protection Management Approaches ......................................................................... E1.29
References ............................................................................................................................................. E1.31
Appendices Appendix A Cyanotoxin Management Flowchart .................................................................................. E1.32
Appendix B Contacts and Stakeholder Information .............................................................................. E1.33
Appendix C Notifying the Public of Cyanotoxins in their Water ............................................................ E1.34

Highlands Mutual Water Company Cyanotoxin Management Plan – Executive Summary E1.4
Executive Summary Highlands Mutual Water Company, with the support of the State of California and the United States Environmental Protection Agency (USEPA), has developed this Cyanotoxins Management Plan (CMP) to prepare for and mitigate risks from harmful algal blooms (HABs) and cyanotoxins occurring in Clear Lake in order to protect public drinking water from cyanotoxin contamination. This document provides steps and documents activities to prepare for and identify a potential HAB occurrence, make treatment and operational adjustments to remove cyanotoxins from drinking water, provide timely information and (as appropriate) an advisory to the water system’s customers and document information about occurrences of HABs so that information can be used to minimize the effect of HABs on the water system in the future. This plan also contains possible future activities the utility could engage in to mitigate the risks from HABs and cyanotoxins, such as long-term source water protection activities.
The steps and activities outlined in this CMP include:
Step 1: Assess Source Water Step 2: Preparation, Monitoring for Early Warning Signs and Immediate Actions Step 3: Raw Water Cyanotoxin Monitoring and Treatment Adjustments Step 4: Finished Water Cyanotoxin Monitoring and Treatment Adjustments Step 5: Continued Finished Water Cyanotoxin Monitoring, Treatment Adjustments and Public Communication
In addition to the five steps above, long-term activities are also discussed to enhance the utility’s ability to prevent, mitigate and manage the risks from cyanotoxin occurrence in source and finished waters.
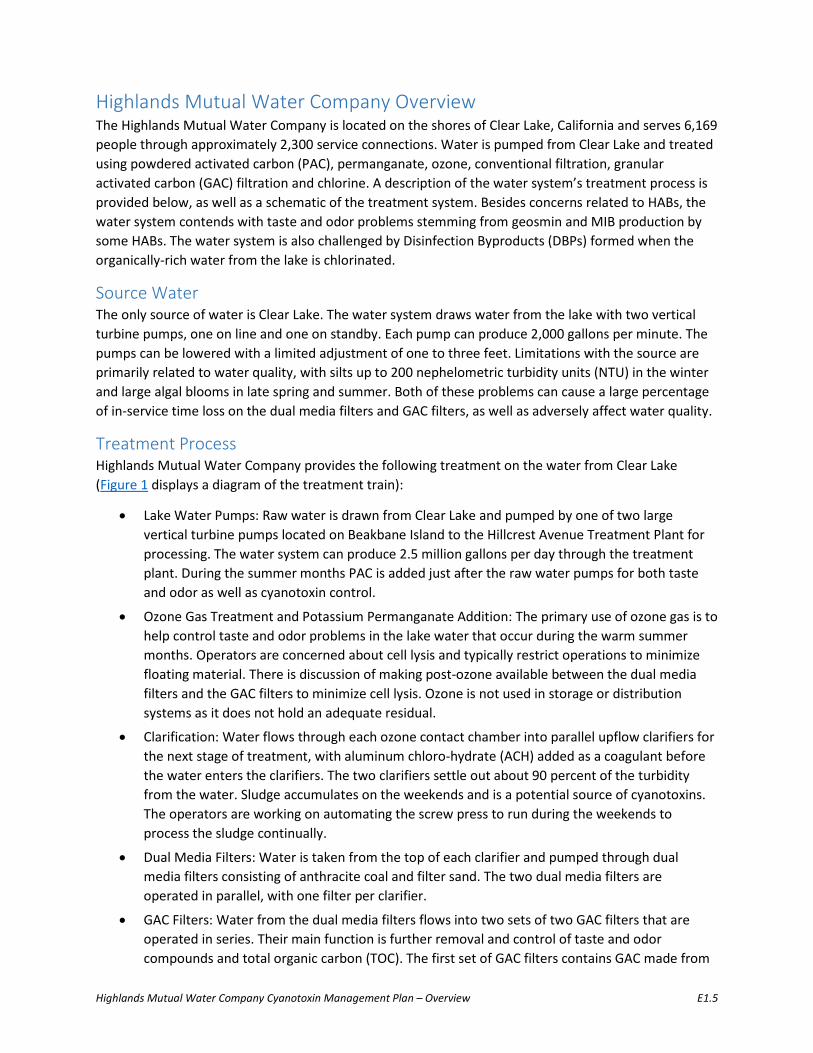
Highlands Mutual Water Company Cyanotoxin Management Plan – Overview E1.5
Highlands Mutual Water Company Overview The Highlands Mutual Water Company is located on the shores of Clear Lake, California and serves 6,169 people through approximately 2,300 service connections. Water is pumped from Clear Lake and treated using powdered activated carbon (PAC), permanganate, ozone, conventional filtration, granular activated carbon (GAC) filtration and chlorine. A description of the water system’s treatment process is provided below, as well as a schematic of the treatment system. Besides concerns related to HABs, the water system contends with taste and odor problems stemming from geosmin and MIB production by some HABs. The water system is also challenged by Disinfection Byproducts (DBPs) formed when the organically-rich water from the lake is chlorinated.
Source Water The only source of water is Clear Lake. The water system draws water from the lake with two vertical turbine pumps, one on line and one on standby. Each pump can produce 2,000 gallons per minute. The pumps can be lowered with a limited adjustment of one to three feet. Limitations with the source are primarily related to water quality, with silts up to 200 nephelometric turbidity units (NTU) in the winter and large algal blooms in late spring and summer. Both of these problems can cause a large percentage of in-service time loss on the dual media filters and GAC filters, as well as adversely affect water quality.
Treatment Process Highlands Mutual Water Company provides the following treatment on the water from Clear Lake (Figure 1 displays a diagram of the treatment train):
• Lake Water Pumps: Raw water is drawn from Clear Lake and pumped by one of two large vertical turbine pumps located on Beakbane Island to the Hillcrest Avenue Treatment Plant for processing. The water system can produce 2.5 million gallons per day through the treatment plant. During the summer months PAC is added just after the raw water pumps for both taste and odor as well as cyanotoxin control.
• Ozone Gas Treatment and Potassium Permanganate Addition: The primary use of ozone gas is to help control taste and odor problems in the lake water that occur during the warm summer months. Operators are concerned about cell lysis and typically restrict operations to minimize floating material. There is discussion of making post-ozone available between the dual media filters and the GAC filters to minimize cell lysis. Ozone is not used in storage or distribution systems as it does not hold an adequate residual.
• Clarification: Water flows through each ozone contact chamber into parallel upflow clarifiers for the next stage of treatment, with aluminum chloro-hydrate (ACH) added as a coagulant before the water enters the clarifiers. The two clarifiers settle out about 90 percent of the turbidity from the water. Sludge accumulates on the weekends and is a potential source of cyanotoxins. The operators are working on automating the screw press to run during the weekends to process the sludge continually.
• Dual Media Filters: Water is taken from the top of each clarifier and pumped through dual media filters consisting of anthracite coal and filter sand. The two dual media filters are operated in parallel, with one filter per clarifier.
• GAC Filters: Water from the dual media filters flows into two sets of two GAC filters that are operated in series. Their main function is further removal and control of taste and odor compounds and total organic carbon (TOC). The first set of GAC filters contains GAC made from

Highlands Mutual Water Company Cyanotoxin Management Plan – Overview E1.6
coconut shells, the second set contains GAC made from lignite. The filter media is changed every three to five years.
• Chlorine Disinfection: The final stage of the water treatment process involves the injection of chlorine for disinfection. Sodium hypochlorite is injected before water enters the clearwell, in order for adequate disinfection CT to be achieved. The pH of water can vary from 7.7 to 9.7 depending on the size of the algal bloom and type of algae (or cyanobacteria) in the lake. The water system does not have a disinfection profile or benchmark. The plant is considered equivalent to conventional treatment and is credited with 2.5 log reduction of Giardia lamblia cysts. Therefore, the plant is required to achieve 0.5 log inactivation of Giardia lamblia cysts through disinfection. The plant typically operates to achieve a detectable residual in the distribution system between 1.6 and 1.8 mg/L chlorine residual at the entrance to the distribution system.
The water system recycles its backwash water within a month, not to exceed 10% of instantaneous production with a target of 2 NTU and filters water to waste before putting its filters back on line after a backwash. The water system pre-chlorinates only for operational reasons. Pre-chlorination is not necessary in order for the water system to achieve its required disinfection CT. When filter problems start occurring due to algae and cyanobacteria in the raw water, the water system begins to pre-chlorinate because adding chlorine seems to help with filter performance. However, pre-chlorination may cause cell lysing and needs to be used with caution. Most of the time, however, the water system does not pre-chlorinate in order to prevent total trihalomethanes and haloacetic acid formation in the clarifiers.
Routine Water Quality Monitoring Raw water is monitored by the water system for alkalinity, TOC, pH and turbidity at the raw water pump discharge. Some samples are sent to a certified lab and the results are returned within 7 to 10 working days. Turbidity and pH results that are measured in the plant are available immediately. A scientist from the Elem Colony Tribe tests the lake water for microcystins biweekly using ELISA (Enzyme-Linked Immunosorbent Assay) method in the lab. Beginning in the summer of 2016, the water system will use test strips during alternate weeks to ensure that source water microcystins analysis takes place on a weekly basis throughout the bloom season (May through October).
Table 1. Raw Water Monitoring
Parameter Location Frequency Who Collects Who Does Sample? Analysis?
Alkalinity Raw Water Pump Discharge
Monthly Highlands MWC Lab TOC Monthly Operator Lab pH Pre-Ozone Tower Daily Operator Plant Turbidity Pre-Ozone Tower 15-min SCADA Plant Microcystins Raw Water Pump Bi-Weekly Operator Test Strip
Discharge Microcystins Clear Lake Bi-Weekly Elem Colony Tribe Lab
Cyanotoxin Management Plan Highlands Mutual Water Company and the State of California, with the support of the United States Environmental Protection Agency has developed a Cyanotoxins Management Plan (CMP) detailed in the

Highlands Mutual Water Company Cyanotoxin Management Plan – Overview E1.7
steps below. This CMP provides an action plan to prepare for and mitigate risks from harmful algal blooms (HABs) and cyanotoxins occurring in Clear Lake in order to protect public drinking water from cyanotoxin contamination. The plan includes immediate steps discussing monitoring and treatment should HABs and cyanotoxins occur as well as long-term steps the system can engage in to protect source waters and to fully evaluate treatment capabilities. A detailed flowchart of the CMP can be found in Appendix A.

Highlands Mutual Water Company Cyanotoxin Management Plan – Overview E1.8
Figure 1. Schematic Diagram of the Treatment System

Highlands Mutual Water Company Cyanotoxin Management Plan – Step 1 E1.9
Step 1: Assess Source Water 1.1 Identify Source Water Protection Areas A source water assessment is an evaluation of a drinking water source to determine the susceptibility to contamination. The first step of any source water assessment is to delineate (map) the areas of water and land that drain into the water supply that are to be evaluated for contaminant sources. This is called the Source Water Protection Area (State Water Resources Control Board, 1990).
Highlands Mutual Water Company delineated its Clear Lake Source Water Protection Area using the following methods and resources:
1. 2012 Clear Lake Watershed Sanitary Survey: The water provider referenced the techniques and survey areas described within the 2012 Clear Lake Watershed Sanitary Survey, a report completed by Clear Lake drinking water utilities which summarizes the state of the Clear Lake watershed and the effect of watershed activities on source water quality. The 2012 Sanitary Survey area encompasses the Clear Lake watershed area that drains to Clear Lake and Cache Creek upstream of the Cache Creek Dam. This coincides with the US Geological Survey (USGS) National Hydrography Dataset HUC10 watershed (determined using the USGS National Map). The Survey delineates “Protection Zones” within the survey area based on radial distance around each water system intake. Higher priority Protection Zones represent area in 2,500-foot proximity to a specific intake (Forsgren Associates, Inc., 2012).
2. Clear Lake Integrated Watershed Management Plan: Highlands also reviewed the Clear Lake Integrated Watershed Management Plan, which was produced for the County of Clear Lake in 2013. The project boundary for this management plan encompasses the HUC10 watershed area, which corresponds with the survey area of the 2012 Sanitary Survey (Lake County, 2010).
3. Drinking Water Mapping Application to Protect Source Waters (DWMAPS): DWMAPS is an online mapping tool for assessing source waters and source water protection planning. The “Find Potential Sources of Contamination” toolbar in DWMAPS maps catchment areas upstream of an intake, and displays point sources of contamination located within the catchment areas.
DWMAPS was used to search a fixed distance of 10 miles upstream of its intake (distance coincides with length of Lower Arm). However, given the size of the Clear Lake watershed, the water system used a two-tiered system for delineating its source water protection area: the Clear Lake watershed (defined as the HUC10 watershed area) is a source water protection area (Tier 1—see Map 1 below), but the zone of higher concern is the area immediately upstream (15 miles) of the intake (Tier II—delineated by DWMAPS, see Map 2 below). The purpose of these zones is to define portions of the watershed where activities have a higher risk of contaminating the source water and where waterbody and watershed conditions should be more closely evaluated. The water system can focus a thorough evaluation within Tier II, the zone of higher concern. This tiered approach is consistent with the methods utilized in the 2012 Sanitary Survey and described in the Drinking Water Source Assessment and Protection Program document from the California State Water Resources Control Board Division of Drinking Water (formerly the California Department of Public Health Drinking Water Program).

Highlands Mutual Water Company Cyanotoxin Management Plan – Step 1 E1.10
Map 1. Tier I Source Water Protection Area: USGS HUC 10 watershed 1802011603. Map extracted from Clear Lake Integrated Watershed Management Plan: http://www.co.lake.ca.us/Assets/WaterResources/Clear+Lake+Integrated+Watershed+Management+Plan/11+Plate+4+Clear+Lake+Watershed+Surface+Water+Resources.pdf)
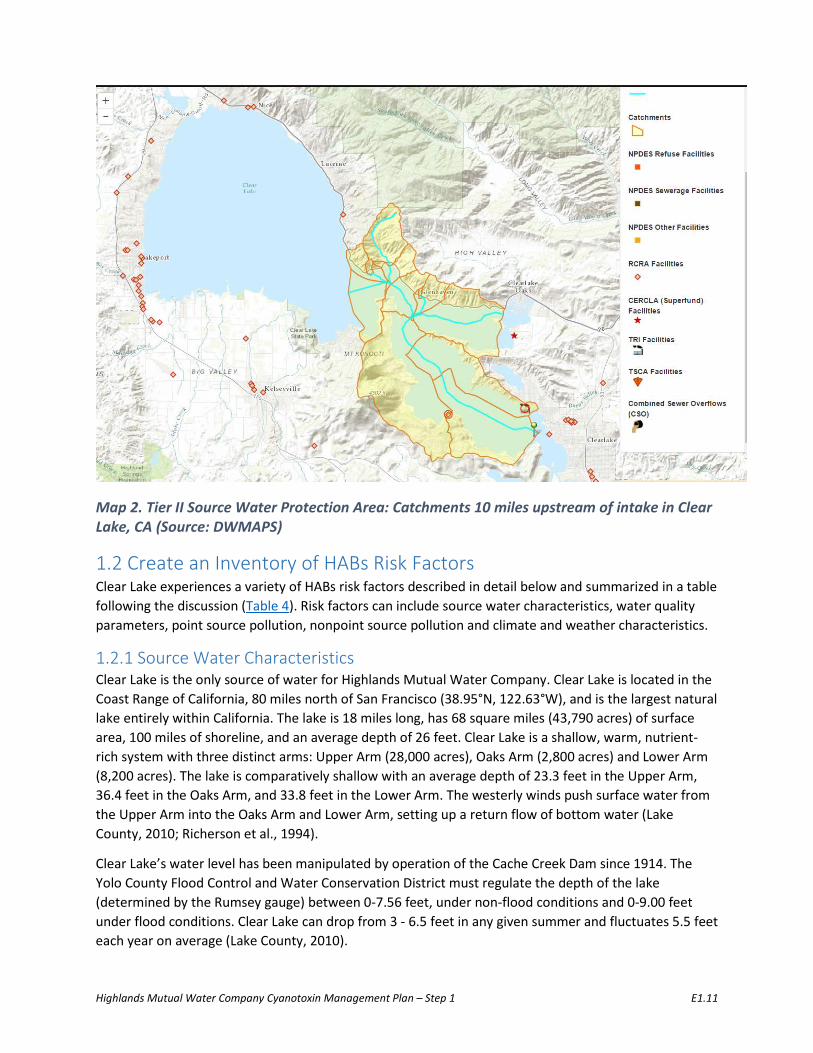
Highlands Mutual Water Company Cyanotoxin Management Plan – Step 1 E1.11
Map 2. Tier II Source Water Protection Area: Catchments 10 miles upstream of intake in Clear Lake, CA (Source: DWMAPS)
1.2 Create an Inventory of HABs Risk Factors Clear Lake experiences a variety of HABs risk factors described in detail below and summarized in a table following the discussion (Table 4). Risk factors can include source water characteristics, water quality parameters, point source pollution, nonpoint source pollution and climate and weather characteristics.
1.2.1 Source Water Characteristics Clear Lake is the only source of water for Highlands Mutual Water Company. Clear Lake is located in the Coast Range of California, 80 miles north of San Francisco (38.95°N, 122.63°W), and is the largest natural lake entirely within California. The lake is 18 miles long, has 68 square miles (43,790 acres) of surface area, 100 miles of shoreline, and an average depth of 26 feet. Clear Lake is a shallow, warm, nutrient-rich system with three distinct arms: Upper Arm (28,000 acres), Oaks Arm (2,800 acres) and Lower Arm (8,200 acres). The lake is comparatively shallow with an average depth of 23.3 feet in the Upper Arm, 36.4 feet in the Oaks Arm, and 33.8 feet in the Lower Arm. The westerly winds push surface water from the Upper Arm into the Oaks Arm and Lower Arm, setting up a return flow of bottom water (Lake County, 2010; Richerson et al., 1994).
Clear Lake’s water level has been manipulated by operation of the Cache Creek Dam since 1914. The Yolo County Flood Control and Water Conservation District must regulate the depth of the lake (determined by the Rumsey gauge) between 0-7.56 feet, under non-flood conditions and 0-9.00 feet under flood conditions. Clear Lake can drop from 3 - 6.5 feet in any given summer and fluctuates 5.5 feet each year on average (Lake County, 2010).

Highlands Mutual Water Company Cyanotoxin Management Plan – Step 1 E1.12
The lake is generally well-mixed with stable temperature stratification between surface and deeper waters only occurring for short periods during the hot summer periods when wind patterns are calm (Winder et al. 2010); maximum surface water temperatures in July and August are typically near 75°F (24°C) and average 40 °F (4.5°C) in the winter months (Richerson et al., 1994; Lake County, 2010). Prevailing winds and the lake’s modest depth facilitate vertical mixing. Numerous gas vents and subsurface springs help induce mixing in the lake as well (Lake County, 2010). Residence time of the lake (the time it would take to empty at the average annual outflow) is about 4.5 years, which is relatively short (Richerson et al., 1994).
Land Use Some land uses, including urban and agricultural uses, have been associated with sources of nutrients (nitrogen and phosphorus) that can contribute to higher occurrences of HABs and cyanotoxins. The water provider referred to the 2012 Sanitary Survey, the Clear Lake Integrated Watershed Management Plan, the Total Maximum Daily Load (TMDL) for Nutrients in Clear Lake, and DWMAPS to gather information on land cover and land use for the Clear Lake watershed.
The Clear Lake watershed (HUC10) includes an area of approximately 450 square miles (282,138 acres) (USGS National Map Viewer). Much of the watershed consists of undeveloped lands. This includes the Bureau of Land Management Cow Management Recreation Area and the U.S. Forest Service Mendocino National Forest. Together, public lands make up 24% of the Clear Lake watershed (Lake County, 2010). Irrigated and non-irrigated agriculture account for the largest use of developed lands (Forsgren Associates, Inc., 2012). Agricultural and urban land uses in the Clear Lake watershed are primarily located in the lowland areas adjacent to the lake. The largest municipality is the town of Clearlake (population 13,100), which is located at the end of the Lower Arm. Urban areas cover less than 2.5% of the total watershed land area (Sanitary Survey, 2012). Table 2 below describes land use in Clear Lake’s watershed (Tetra Tech, 2004).

Highlands Mutual Water Company Cyanotoxin Management Plan – Step 1 E1.13
Table 2. Land Use in Clear Lake’s Watershed
Land Use Category Total Land Area (Acres)
Percent Total
Bare rock/sand/clay 966 0.34 Deciduous forest Deciduous shrub land
110,029 48, 390
39.00 17.15
Emergent herbaceous wetlands Grassland/herbaceous
90 65,824
0.03 23.33
High intensity commercial/industrial/transportation High intensity residential Low intensity residential Mixed forest
646 2 4,794 23,053
0.23 <0.01 1.70 8.17
Open Water (not including Clear Lake) Other grasses (urban, recreational) Pasture/hay
1,491 141 9, 683
0.53 0.05 3.43
Planted/cultivated (orchards, vineyards, groves) Quarries/strip mines/gravel pits Row crops
16, 583 58 6
5.86 0.02 <0.01
Small grains Transitional Woody wetlands
1 429 1
<0.01 0.15 <0.01
Source: Total Maximum Daily Load (TMDL) for Nutrients in Clear Lake, Tetra Tech, 2004
1.2.2 Water Quality Parameters Historical Cyanobacteria and Cyanotoxin Events in Source Water The next step in assessing source water vulnerability to HABs and cyanotoxins is to review source water quality parameters, notably past occurrence of cyanobacteria and cyanotoxin events within the source water protection area. Historical occurrence of HABs, cyanobacterial cell occurrence and cyanotoxins in a source water protection area is a good indication that a surface water system is vulnerable to future occurrences of HABs, and may provide evidence of the potential timing, location and intensity of these blooms.
Presence of Toxic Cyanobacteria in Clear Lake Clear Lake is a productive lake where the presence of suspended algae and aquatic vegetation occurs naturally. Several major research efforts, the Clear Lake Algal Research Unit (1970-1990), the Clean Lakes Report (1994), and the Central Valley Regional Water Quality Control Board reports (2011, 2012) indicate recurrent seasonal blooms of toxic species of blue-green algae (cyanobacteria) in Clear Lake. These blooms form noxious, scum-forming mats that can cause considerable degradation of the lakeshore and surface environment of Clear Lake (Forsgren Associates, Inc., 2012). The magnitude and composition of the blooms varies substantially from year to year (Richerson et al., 1994). Algae problems are most serious at the eastern end of the Lake where prevailing winds can push floating algae into huge rotting mats that produce strong odors. Blooms typically occur in Clear Lake from April to November.
The research indicates that Clear Lake has been seriously impaired by seasonal blooms of scum-forming cyanobacteria for much of the past century, but that blooms became more of a problem in the second half of the 20th century (1970-1990) (Richerson et al., 1994) (Mioni and Kudela, 2011). During this

Highlands Mutual Water Company Cyanotoxin Management Plan – Step 1 E1.14
period, researchers found that several genera of cyanobacteria dominated the scum forming algae in Clear Lake: Anabaena, Aphanizomenon and Microcystis. Microcystis blooms were documented in both the Oaks Arm and Lower Arm, with the largest blooms occurring in the Lower Arm in 1991. Aphanizomenon showed similar trends and was the dominant scum former up to 1985, when it suddenly became much less abundant. Anabaena was never responsible for blooms on the scale of Microcystis and Aphanizomenon in any arm but was a common component of the midsummer scums throughout the record (Mioni and Kudela, 2011). Microcystis and Anabaena were noted to occur from late summer to early fall. Aphanizomenon were noted to reach a peak in late spring and early summer, and late fall, but have also been observed blooming in winter months (Lake County, 2010). Lyngbya was not observed until 1984 and the first large bloom event dominated by this mat-forming filamentous cyanobacteria was not observed until 2009 (Mioni and Kudela, 2011).
The Clear Lake Nutrient Total Maximum Daily Load Update (2012) notes that blooms occurred with less frequency from the early 1990s until 2004, but that massive algal blooms and nuisance conditions were present in several years since 2004, most notably in the summer and fall months of 2009, 2010 and 2011 (Central Valley Regional Water Quality Control Board, 2012).
Research in 2010 and 2011 by University of California - Santa Cruz researcher Dr. Cecile Mioni for the Central Valley Regional Water Quality Control Board identified presence of Mycrocystis aeruginosa, Aphanizomenon flos-aquae, Anabaena lemmermanii, Synechococcus, all of which are capable of producing cyanotoxins. Aphanizomenon was noted to have occurred primarily in early summer, Mycrosystis in early and late summer, Anabaena throughout the summer and Lyngbya throughout the summer. Within the Lower Arm, Lyngbya cincinnati and Anabaena spiroides were the two dominant cyanobacterial species (Mioni et al., 2012).
The Big Valley Rancheria Band of Pomo Indians and the Elem Indian Colony have collaborated since fall 2014 to monitor cyanobacteria and cyanotoxin occurrence in Clear Lake. The Elem Indian Colony is monitoring drinking water sources in the Lower Arm for six of the seventeen surface water treatment plants around the lake.
The State of California Water Quality Monitoring Council maintains a webmap which displays locations of HAB incidents that have been voluntary reported including a bloom reported in June 2016.
Presence of Cyanotoxins in Clear Lake Fish kills and neurological disorders in eight domestic cats were reported in the Clear Lake area in 1989 following an exceptionally dense cyanobacterial bloom (Microcystis, Anabaena and Aphanizomenon) (Mioni and Kudela, 2011). These events prompted a special toxicological and epidemiological studies program by the California Department of Health Services (called the California Department of Public Health after 2007). Microcystin toxins were the only toxins examined and were detected over the course of this special study (Mioni and Kudela, 2011). Although recurrent cyanobacterial blooms have plagued Clear Lake for the past century, this is the only toxicology survey available prior to the 2010 and 2011 research by University of California - Santa Cruz under Cecile Mioni and Rapheal Kudela. This 2010 study found low levels of microcystins, below the recreational advisory limit of 8 µg/L for the State of California, however in several samples the microcystins concentrations exceeded the WHO advisory limit for drinking water (1 µg/L) and USEPA’s Health Advisory levels for total microcystins in drinking water. Anatoxin-a was detected in two of the samples collected in the lower arm in August 2010. At both collection sites, anatoxin-a was well below the suggested action levels for recreational use (50

Highlands Mutual Water Company Cyanotoxin Management Plan – Step 1 E1.15
µg/L). Saxitoxins were below the detection limit or not present in the lake surface water (using Abraxis ELISA kits only) (Mioni and Kudela, 2011).
Nutrients Clear Lake has been assessed for attainment of surface water quality standards under Section 305(b) of the Clean Water Act (CWA). Based on this assessment, Clear Lake was listed as an impaired waterbody due to nutrients (phosphorus and nitrogen) under Section 303(d) of the CWA. A nutrient TMDL was developed by the Central Valley Regional Water Quality Control Board in 2006 in response to the impairment listing. The TMDL defines targets for nutrient loading to Clear Lake and outlines strategies for reducing nutrient loading, specifically of phosphorous, derived from sediment erosion, which will ultimately reduce algal growth (Central Valley Regional Water Quality Control Board, 2012).
The TMDL notes that there may be other factors, in addition to nutrients, affecting cyanobacterial blooms, including concentrations of sulfate, iron availability and ecological dynamics.
For additional information on Clear Lake water quality (such as nutrient concentrations, temperature, iron, turbidity, chlorophyll-a, phycocyanin) and other factors controlling algal blooms, see the Clear Lake historical Data Analysis, Clear Lake Report; Central Valley Water Quality Control Board, Control of Nutrients in Clear Lake report; Harmful cyanobacteria blooms and their toxins in Clear Lake and the Sacramento-San Joaquin Delta (California) report; Causes and Control of Algal Blooms in Clear Lake; and the Clear Lake Integrated Watershed Management Plan. For additional water quality information, see the CA State Water Resources Control Board website.
1.2.3 Point Sources of Pollution The water system created an inventory of possible precursors to HABs within its source water protection area using the USEPA DWMAPS tool (Map 1). Phosphorus and nitrogen are drivers of algal and cyanobacterial growth in lakes and reservoirs. Sources of phosphorus and nitrogen can include discharge of domestic and industrial wastewater, septic systems and runoff from agricultural and urban lands.
A query of the USEPA DWMAPS tool as well as the USEPA Discharge Monitoring Report for nitrogen and phosphorus loading indicates that there are no National Pollutant Discharge Elimination System (NPDES) permitted wastewater dischargers or Combined Sewer Overflows within 10 miles upstream of Clear Lake. However, the Clear Lake TMDL set specific phosphorous load limits for several point source dischargers within the Clear Lake watershed. Point source dischargers, Lake County Storm Water Permittees (Lake County, Cities of Clearlake and Lakeport), and the California Department of Transportation (Caltrans), were given a waste load allocation of 2,000 kg and 100 kg per year, respectively. This is a small portion of the combined total point and nonpoint source phosphorous load allocation of 87,100 kg per year. Caltrans maintains a statewide Stormwater Program, which identifies how Caltrans will comply with the provisions of its NPDES permit and its Municipal Separate Storm Sewer System permit (MS4) (California State Water Resources Control Board, 2012). Table 3 below describes Clear Lake annual phosphorus loading.
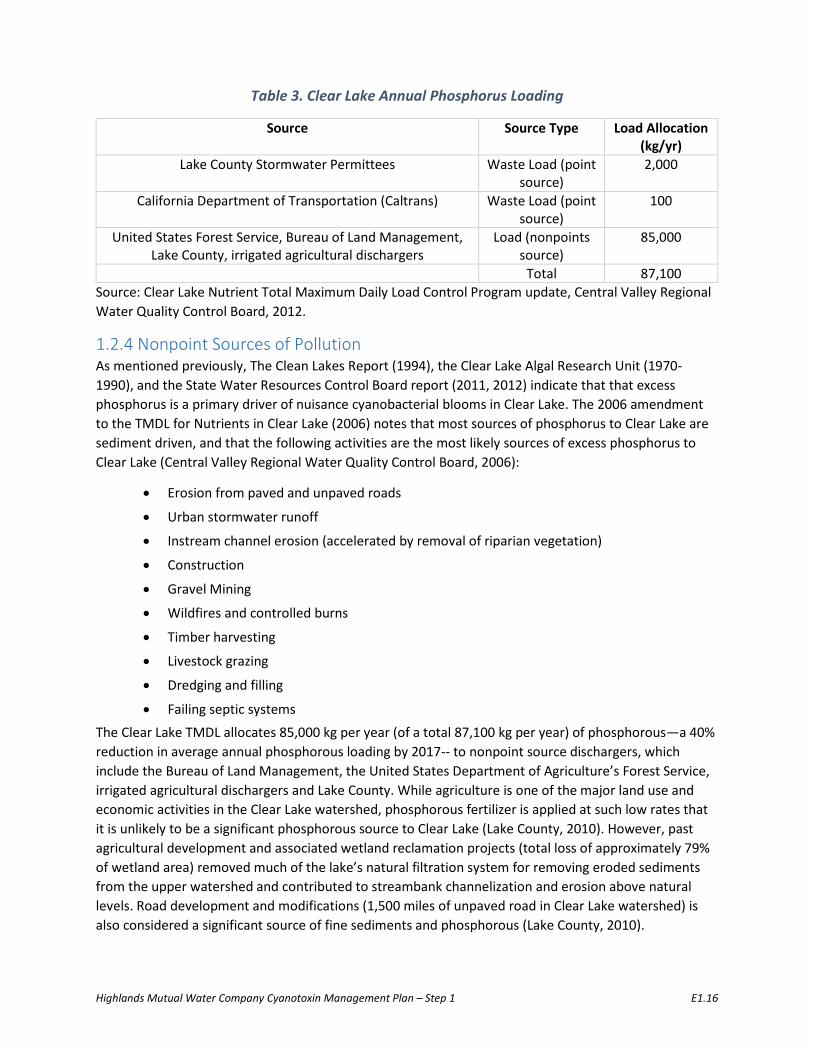
Highlands Mutual Water Company Cyanotoxin Management Plan – Step 1 E1.16
Table 3. Clear Lake Annual Phosphorus Loading
Source Source Type Load Allocation (kg/yr)
Lake County Stormwater Permittees Waste Load (point source)
2,000
California Department of Transportation (Caltrans) Waste Load (point source)
100
United States Forest Service, Bureau of Land Management, Lake County, irrigated agricultural dischargers
Load (nonpoints source)
85,000
Total 87,100 Source: Clear Lake Nutrient Total Maximum Daily Load Control Program update, Central Valley Regional Water Quality Control Board, 2012.
1.2.4 Nonpoint Sources of Pollution As mentioned previously, The Clean Lakes Report (1994), the Clear Lake Algal Research Unit (1970-1990), and the State Water Resources Control Board report (2011, 2012) indicate that that excess phosphorus is a primary driver of nuisance cyanobacterial blooms in Clear Lake. The 2006 amendment to the TMDL for Nutrients in Clear Lake (2006) notes that most sources of phosphorus to Clear Lake are sediment driven, and that the following activities are the most likely sources of excess phosphorus to Clear Lake (Central Valley Regional Water Quality Control Board, 2006):
• Erosion from paved and unpaved roads
• Urban stormwater runoff
• Instream channel erosion (accelerated by removal of riparian vegetation)
• Construction
• Gravel Mining
• Wildfires and controlled burns
• Timber harvesting
• Livestock grazing
• Dredging and filling
• Failing septic systems The Clear Lake TMDL allocates 85,000 kg per year (of a total 87,100 kg per year) of phosphorous—a 40% reduction in average annual phosphorous loading by 2017-- to nonpoint source dischargers, which include the Bureau of Land Management, the United States Department of Agriculture’s Forest Service, irrigated agricultural dischargers and Lake County. While agriculture is one of the major land use and economic activities in the Clear Lake watershed, phosphorous fertilizer is applied at such low rates that it is unlikely to be a significant phosphorous source to Clear Lake (Lake County, 2010). However, past agricultural development and associated wetland reclamation projects (total loss of approximately 79% of wetland area) removed much of the lake’s natural filtration system for removing eroded sediments from the upper watershed and contributed to streambank channelization and erosion above natural levels. Road development and modifications (1,500 miles of unpaved road in Clear Lake watershed) is also considered a significant source of fine sediments and phosphorous (Lake County, 2010).

Highlands Mutual Water Company Cyanotoxin Management Plan – Step 1 E1.17
A summary of phosphorous reducing activities by TMDL regulated entities can be found at the California Central Valley Regional Water Quality Control Board website.
1.2.5 Climate and Weather Clear Lake is located within Lake County, CA, which is typified by warm, dry summers and moist, cool winters. Clear Lake is prone to periodic drought, at times severe. Recent notable droughts occurred from 1976-1977 and 1986-1992 (Lake County, 2010). During winter months (December-February), average high temperatures are in the 50s (Fahrenheit) and average lows are in the 30s (Fahrenheit) (Lake County, 2010). Temperatures below freezing can occur throughout the watershed, although they are less common adjacent to Clear Lake. Summer average high temperatures at lake level are in the low 90s (Fahrenheit), but can reach over 100°F. On most nights during the summer, there is significant cooling (by 30-40°F) (Lake County, 2010).
Most precipitation in the Clear Lake watershed occurs as rainfall with minor amounts of snow at the highest elevations. Prevailing winds blow from the west and northwest during most of the year and bring winter Pacific storms to the watershed during the rainy season (September-May). Average annual precipitation at lake level is about 30 inches, with most precipitation occurring between December and March (Lake County, 2010). In wet years, or during strong storm events, stream-flows tend to be extremely “flashy”; that is, they are subject to very rapid rises and fluctuation in flow (Forsgren Associates, Inc., 2012).
Table 4. Summary of Clear Lake HABs Risk Factors
HABS Risk Factor Measure Data Source Risk Ranking
Source Water Characteristics Source Water Type Mean Surface Water Temperature (F) Water Body Depth (ft) Vertical Stratification Residence Time
Lake/Reservoir Lower Arm ~ 75°F (24°C) (July-August) Lower Arm Mean: 33.8 ft Well-mixed; few occurrences of sustained stratification 4.5 years, relatively short
USGS NHDPlus CA Department of Water Resources Clear Lake Report (2010) Lake County Richerson et al., 1994
High High High Low Low
Water Quality Parameters Cyanobacteria Occurrence Cyanotoxin Levels (µ/L) Nutrient Enrichment: CWA 303(d) Impairment Status
Microcystis, Anabaena, Aphanizomenon, Lyngbya Lower Arm: .52 anatoxin-a (2010) Impaired, Nutrients (1986); Nutrient TMDL (2006)
Horne, 1975; Richerson et al., 1994; Mioni and Kudela, 2011 Mioni and Kudela, 2011 Clear Lake Nutrient TMDL (2006)
High High Medium
Point Sources Point Sources of Nutrients
Lake County Stormwater Permittees; California Department of Transportation (Caltrans): 2,100 kg phosphorous TMDL discharge limit
Clear Lake Nutrient TMDL (2006)
Low
Nonpoint Sources
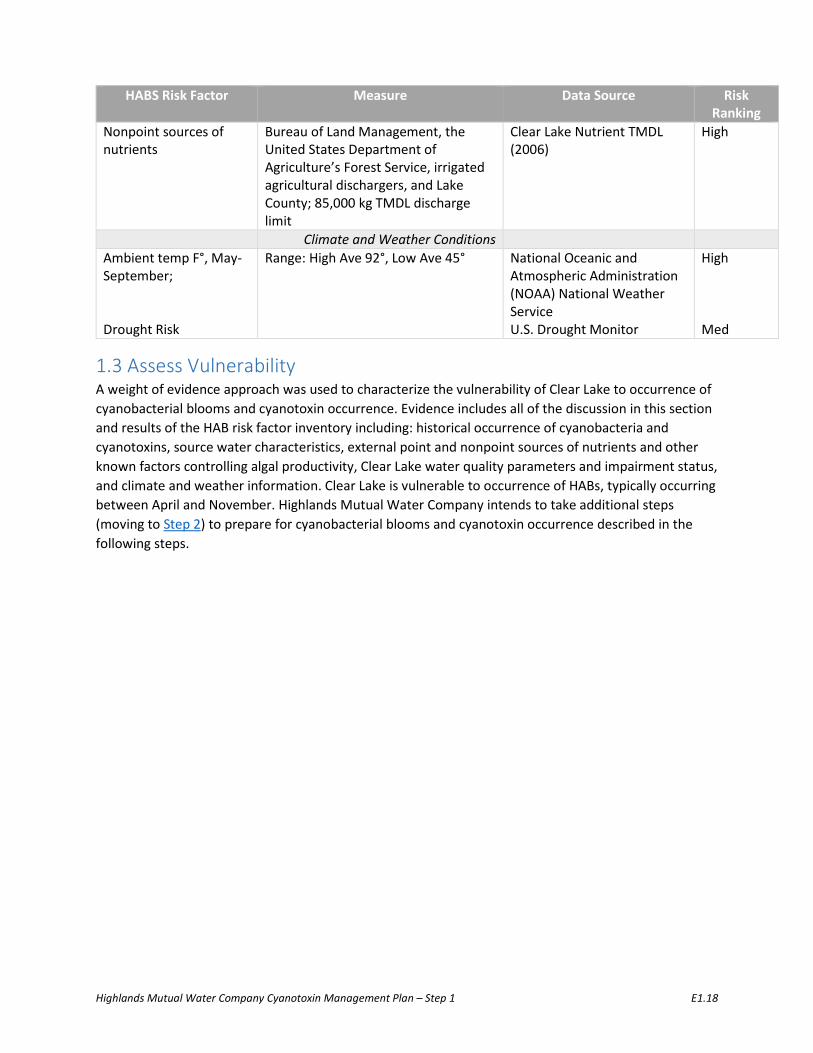
Highlands Mutual Water Company Cyanotoxin Management Plan – Step 1 E1.18
HABS Risk Factor Measure Data Source Risk Ranking
Nonpoint sources of nutrients
Bureau of Land Management, the United States Department of Agriculture’s Forest Service, irrigated agricultural dischargers, and Lake County; 85,000 kg TMDL discharge limit
Clear Lake Nutrient TMDL (2006)
High
Climate and Weather Conditions Ambient temp F°, May- September; Drought Risk
Range: High Ave 92°, Low Ave 45°
National Oceanic and Atmospheric Administration (NOAA) National Weather Service U.S. Drought Monitor
High Med
1.3 Assess Vulnerability A weight of evidence approach was used to characterize the vulnerability of Clear Lake to occurrence of cyanobacterial blooms and cyanotoxin occurrence. Evidence includes all of the discussion in this section and results of the HAB risk factor inventory including: historical occurrence of cyanobacteria and cyanotoxins, source water characteristics, external point and nonpoint sources of nutrients and other known factors controlling algal productivity, Clear Lake water quality parameters and impairment status, and climate and weather information. Clear Lake is vulnerable to occurrence of HABs, typically occurring between April and November. Highlands Mutual Water Company intends to take additional steps (moving to Step 2) to prepare for cyanobacterial blooms and cyanotoxin occurrence described in the following steps.

Highlands Mutual Water Company Cyanotoxin Management Plan – Step 2 E1.19
Step 2: Preparation, Monitoring for Early Warning Signs and Immediate Actions 2.1 Preparation Since Highlands Mutual Water Company determined that its source water is vulnerable to cyanobacterial blooms, the next step is to consider how to prepare for blooms and cyanotoxin occurrence. Preparation includes preparing to monitor raw and finished waters such as ordering necessary laboratory equipment or establishing contracts with outside laboratories, preparing for treatment adjustments and establishing communication plans including communication with other water utilities with the same source water.
Prepare Staff and Equipment for Monitoring The water system will carry out the following activities in order to be prepared for the monitoring steps described in this plan:
1. Train operators on algae and cyanobacteria identification, counting and identification of gas vacuoles.
2. Train operators on how to use microcystins test strips.
• Establish sampling procedures
• Establish testing procedures
• Establish quality assurance procedures
• Document all sampling, testing and quality assurance procedures
3. Enter into an agreement with a laboratory that can reliably and promptly analyze samples using the Adda-specific ELISA test.
4. Establish a procedure for submitting Adda-specific ELISA samples to the identified laboratory.
• Document all sampling, testing and quality assurance procedures for lab samples
• Have coolers, chain of custody forms and shipping labels on site and ready for use
• Ensure that the appropriate bottles (glass or polyethylene terephthalate glycol, minimum 100 mL volume) are on site for the Adda-specific ELISA sampling in the event that such sampling is required
• Also have sodium thiosulfate available for quenching disinfected samples as soon as they are collected
Prepare for Treatment Adjustments Highlands Mutual Water Company will carry out the following activities in order to be more prepared to treat its source water during a HAB:
1. Ensure all required materials for cyanotoxin treatment are available.
2. Consider either:
• Moving the ozone application point from before the upflow clarifier to after the mixed media filters (but before the GAC) to reduce the risk of toxin release, or

Highlands Mutual Water Company Cyanotoxin Management Plan – Step 2 E1.20
• Introducing the option of two ozone injection points: the existing one before the clarifier and a new one between the media filters and the GAC.
3. Begin tracking chlorine CT daily using a spreadsheet or computer program. This will allow the water system to know how much chlorine CT is in place when different microcystins concentrations are measured in the raw water (and how much microcystins protection is being provided through chlorination).
4. Begin testing for ammonia in the raw water, upflow clarifier effluent (before 2nd chlorine injection point), and before the clear well (before the 3rd chlorine injection point).
5. Measure free and total chlorine to see if the free chlorine is at least 80 percent of the total chlorine; if not, the water system may be making chloramines. While this is not directly a cyanotoxins concern, it may be related to the presence of cyanobacterial activity in the treatment plant (e.g., the upflow clarifier).
6. Evaluate the toxin removal capacity of the current treatment process using jar tests spiked with varying levels of toxins.
Communications Establish Communication Plan with other Source Water Users Several water utilities draw their water from the lake; a few also have wells. A large tributary enters the lake at the northern end, and water systems located in this area often experience algal problems prior to the water systems farther south. Highlands Mutual Water Company draws water from the southeastern part of the lake. As a result, communication among the lake’s various water system operators provides an important warning of impending HABs. During the summer months, Highlands Mutual Water Company operators are in constant communication with the other two water systems with which they are interconnected. They share information related to chemical doses, physical problems with the water, and how the water is reacting to sedimentation and filtration. The system’s operators are also in contact with water companies at the northern end of the lake to try to get early warning of water quality problems they may soon face.
Communication with Stakeholders The water system will carry out the following activities in order to be more prepared for the communications steps described in this plan:
1. Develop a stakeholders list (Appendix B) and reevaluate on a recurring basis to maintain an up-to-date list.
2. Add language to the water system’s consumer confidence report asking home and clinic dialysis customers to contact the water system so they can be added to the stakeholders list and receive early warning about potential microcystins contamination of the finished water. Explanations of when stakeholders will be contacted about a HAB are provided in Step 5 of this plan.
3. Prepare a public health advisory template that is available and ready for use if necessary. Also prepare another notice that would be issued to lift an existing public health advisory. Explanations of when a public health advisory will be issued or lifted are provided in Step 5 of this plan. (See Appendix C for draft template)

Highlands Mutual Water Company Cyanotoxin Management Plan – Step 2 E1.21
4. Prepare and have available a “Frequently Asked Questions” outreach document for water consumers and have copies available in the office where customers pay their bills and/or include it with their bills. (See example in USEPA’s Cyanotoxin Risk Communication Toolbox).
2.2 Monitoring the Early Warning Signs Based on historical bloom occurrence in Clear Lake, Highlands Mutual Water Company begins looking for signs of blooms in April. Signs of bloom occurrence include early indicators such as drinking water treatment operational challenges. Identified in this section are early warning signs that operators can look for during the system’s normal operation, routine water quality monitoring, as well as follow-up activities if any of the early warning signs are observed.
Early Indicators of a Cyanobacterial Bloom The water system operators have identified several early warning signs that a cyanobacterial bloom is likely to occur in the very near future (or has begun to occur). The following early warning signs are a combination of observations of conditions in the lake itself and in the treatment plant:
• Visual observations show cyanobacteria mats forming (depending on cyanobacteria or algae type)
• Algae rising to the surface or gathering on the tules (bulrushes) during daily visual inspections of the lake at the intake from April through November
• Algae buildup on equipment in the plant
• Sludge coming off the screw press begins looking green
• Raw water pH shows a strong, sharper daily swing, or raw water pH >9 (before PAC addition)
• Raw water pH swings from day to night
• Raw water pH probe’s sample cell has algal growth and an odor
• Coagulant dose increases
• Filter performance degrades
• Backwashing of the carbon filters is needed twice as often
• Strainers for the pump control plug with algae or cyanobacteria and cause operational challenges
• Individual filter effluent turbidity is slow to respond or stabilize at the beginning of a filter run
• Increased differential pressure across filter beds
• Odor in the raw water and odor coming off the lake strengthens
• Chlorine demand increases
• Other water utilities call and report problems, especially the water utilities in the northern part of the lake
• Weekly routine raw water monitoring results show presence of cyanotoxins
In addition, the state will soon be providing the water system with an on-line fluorometer. While it has not been installed yet, it is anticipated that fluorometric readings at the source will show increased

Highlands Mutual Water Company Cyanotoxin Management Plan – Step 2 E1.22
chlorophyll-a or phycocyanin. Once the fluorometer has been installed and readings have been observed, the water system will see if HAB levels of concern can be identified.
2.3 Immediate Actions if a Bloom is Suspected Monitoring Actions in Response to Early Warning Signs If there are any early indicators of a cyanobacterial bloom, the following actions will be immediately taken:
1. Immediately collect a source water sample at the intake before PAC is added. Ideally, collect samples that represent several depths or collect a composite sample that represents the entire water column. The sample should be collected before PAC addition because it will be inspected through the microscope and there should be no interference. Identify the algae present in the sample using water company microscope:
• Refer to the algae keys and any catalog of previous algae identified in Clear Lake.
• Check with Elem Colony Tribe to confirm algae and/or cyanobacteria identifications and utilize Greenwater Laboratories if still unable to identify.
2. If cyanobacteria are identified, also check whether gas vacuoles are present. When gas vacuoles are present, the cyanobacteria are more difficult to remove in the upflow clarifier.
3. Move to Step 3.
Communication Actions in Response to Early Warning Signs Call neighboring water utilities to see if they are having problems and to let them know what Highlands Mutual Water Company has found.
Source Water Mitigation Actions in Response to Early Warning Signs Lake County treats Clear Lake with the aquatic herbicide Sonar for weed control two or three times per year. No other in-lake mitigation measures are currently taken.

Highlands Mutual Water Company Cyanotoxin Management Plan – Step 3 E1.23
Step 3: Raw Water Cyanotoxin Monitoring and Treatment Adjustments If a cyanobacterial bloom is identified during Step 2, the Highlands Mutual Water Company plans to begin monitoring water quality in multiple locations, adjusting treatment and communicating with utilities that are using the same source water.
Monitoring if Cyanobacteria are Identified or Suspected Analyze samples for microcystins as soon as possible using test strips using the following steps:
1. Test a raw water sample as soon as possible for microcystins using a test strip. The sample should be collected before PAC has been added. If the raw water sample collected has ≥0.3 µg/L microcystins using the test strip go to #2(a) and 2(b).
2. (a) Use test strips to measure microcystins at both of the following locations:
• Source water before PAC addition (again, 2nd sample) • Entry point to the distribution system (EPTDS)
AND (b) Use test strips to sample at each of the following locations, following the flow of water until microcystins are not detected: • After permanganate is added • After the clarifier • After the media filters • After the first set of GAC filters (the “new” GAC filters) • After the second set of GAC filters (the “old” GAC filters) • The mixture of sampling water and filter-to-waste water
3. Track weekly routine sampling results, discussed under routine water quality monitoring in the overview, and follow # 2a-b if a weekly raw water sample has ≥0.3 µg/L microcystins
It is important to monitor the performance of individual unit processes across the treatment train to help understand what is happening in the treatment train or identify possible treatment breakdown. If either monitoring determined necessary by a suspected bloom or routine monitoring results indicate the presence of cyanotoxins in the raw water, additional confirmation sampling (#2 above) will take place before Highland Mutual Water Company continues to Step 4. Follow-up sampling will take place within 24 hours after the first detection of cyanotoxins in the raw water collected. If the follow-up sampling continues to show cyanotoxins in the raw water, Highlands Mutual Water Company continues to Step 4.
Operational Adjustments Based on Raw Water Cyanotoxin Measurements Highlands Mutual Water Company does not wait for finished water cyanotoxin detections to adjust treatment, but rather begins making treatment adjustments when cyanobacteria are detected in the raw water. The following are treatment adjustments that will be made when cyanobacteria or
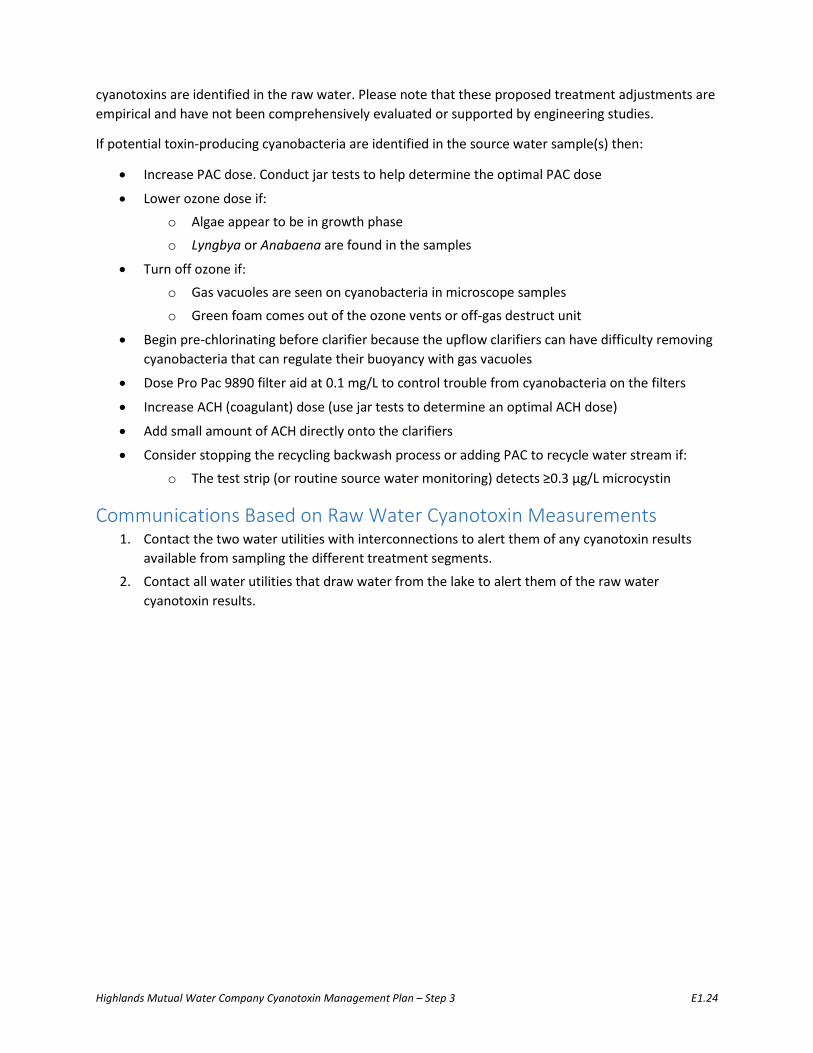
Highlands Mutual Water Company Cyanotoxin Management Plan – Step 3 E1.24
cyanotoxins are identified in the raw water. Please note that these proposed treatment adjustments are empirical and have not been comprehensively evaluated or supported by engineering studies.
If potential toxin-producing cyanobacteria are identified in the source water sample(s) then:
• Increase PAC dose. Conduct jar tests to help determine the optimal PAC dose
• Lower ozone dose if: o Algae appear to be in growth phase
o Lyngbya or Anabaena are found in the samples
• Turn off ozone if: o Gas vacuoles are seen on cyanobacteria in microscope samples
o Green foam comes out of the ozone vents or off-gas destruct unit
• Begin pre-chlorinating before clarifier because the upflow clarifiers can have difficulty removing cyanobacteria that can regulate their buoyancy with gas vacuoles
• Dose Pro Pac 9890 filter aid at 0.1 mg/L to control trouble from cyanobacteria on the filters
• Increase ACH (coagulant) dose (use jar tests to determine an optimal ACH dose)
• Add small amount of ACH directly onto the clarifiers
• Consider stopping the recycling backwash process or adding PAC to recycle water stream if:
o The test strip (or routine source water monitoring) detects ≥0.3 µg/L microcystin
Communications Based on Raw Water Cyanotoxin Measurements 1. Contact the two water utilities with interconnections to alert them of any cyanotoxin results
available from sampling the different treatment segments.
2. Contact all water utilities that draw water from the lake to alert them of the raw water cyanotoxin results.

Highlands Mutual Water Company Cyanotoxin Management Plan – Step 4 E1.25
Step 4: Finished Water Cyanotoxin Monitoring and Treatment Adjustments Detecting and positively confirming cyanotoxins in the finished water indicates that cyanotoxins have broken through the treatment barriers. Again, it is important to monitor the performance of individual unit processes across the treatment train to help understand what is happening in the treatment train or identify possible treatment breakdown. If cyanotoxins have been detected in the finished water, Highlands Mutual Water Company should continue implementing the treatment strategies described in Step 3 and carry out the additional testing and treatment adjustments described in this section.
Finished Water Microcystins Monitoring If finished water monitoring is determined necessary by Step 3, take a sample from the EPTDS. If this sample is ≥0.3 µg/L microcystins using the test strip, sample at the following locations as soon as possible:
1. Repeat the monitoring at the EPTDS as soon as possible with a test strip
2. Repeat the monitoring with test strips at the following locations: • Source water before PAC addition
• After permanganate is added
• After ozone is used
• After the clarifier
• After the media filters
• After the first set of GAC filters (the “new” GAC filters)
• After the second set of GAC filters (the “old” GAC filters) 3. If the repeat sample tests are negative, test water at the EPTDS a third time as soon as possible
with a test strip
4. If 2 out of the 3 entry point samples are ≥0.3 µg/L total microcystins using the test strips, lab-based Adda-specific ELISA samples will be collected as soon as possible at the following locations (samples should contain sufficient quenching agent to consume any residual oxidant):
• Raw water before PAC addition
• EPTDS
• Four routine coliform monitoring sites
• Dialysis center
5. Also collect Adda-specific ELISA samples after each of the following treatment steps (samples should contain sufficient quenching agent to consume any residual oxidant):
• After permanganate is added
• After ozone is used
• After the clarifier
• After the media filters
• After the first set of GAC filters (the “new” GAC filters)

Highlands Mutual Water Company Cyanotoxin Management Plan – Step 4 E1.26
• After the second set of GAC filters (the “old” GAC filters)
• The mixture of instrument waste stream and filter-to-waste
6. If any of the Adda-specific ELISA samples in the distribution system conducted by the laboratory are positive (≥0.3 µg/L) go to Step 5
Treatment In addition to the treatment adjustments listed in Step 3, Highlands Mutual Water Company will conduct the following additional treatment optimization activities:
1. Increase chlorine dose before clearwell (i.e., second injection point) if test strip monitoring indicates microcystins have made it through the GAC filters
2. Monitor raw water pH closely to ensure proper chemical dosages
3. Use turbidity and UV254 readings to track plant performance for particle and organics removal
Communications Highlands Mutual Water Company will carry out the following communications as soon as possible if Adda-specific ELISA results are equal to or exceed the 0.3 µg/L microcystins level:
1. Call the laboratory (Greenwater Laboratories) to let them know samples will be coming for Adda-specific ELISA analysis or EPA Method 544
2. Notify stakeholders that preliminary results show microcystins levels ≥0.3 µg/L while waiting for confirmation samples from the laboratory
3. Fill out the previously prepared public notice template to have it ready should the public notification step be reached in Step 5 (Appendix C)

Highlands Mutual Water Company Cyanotoxin Management Plan – Step 5 E1.27
Step 5: Continued Finished Water Cyanotoxin Monitoring, Treatment Adjustments and Public Communication Step 5 contains communication actions, treatment actions and additional monitoring that should be carried out based on the concentrations of cyanotoxins confirmed in the finished water. This fifth step enables Highlands Mutual Water Company to act quickly if cyanotoxins are confirmed in the finished water.
Continued Finished Water Microcystins Monitoring If any Adda-specific ELISA or EPA Method 544 results exceed ≥0.3 µg/L microcystins, conduct the following monitoring:
1. Continue monitoring the raw water tap before PAC addition and water from the EPTDS using test strips
• Flush around any distribution system sites that tested positive, measuring the effectiveness of the flushing using test strips
When the test strip results are >0.3 µg/L, conduct the following monitoring:
1. Collect Adda-specific ELISA lab based samples as soon as possible at:
• Raw water sample tap
• EPTDS
• Four routine total coliform monitoring sites
• Dialysis center
2. Also collect Adda-specific ELISA samples at each of the following treatment steps:
• After permanganate is added
• After ozone is used
• After the clarifier
• After the media filters
• After the first set of GAC filters (the “new” GAC filters)
• After the second set of GAC filters (the “old” GAC filters)
• The mixture of sampling water and filter-to-waste
Highlands Mutual Water Company will continue looking for early warning signs (Step 2) for cyanotoxins when all Adda-specific ELISA results are below <0.3 µg/L.
Treatment If any Adda-specific ELISA Result is at or above 0.3 µg/L Highlands Mutual Water Company will, in addition to the treatment optimization steps identified in earlier steps of this plan, conduct jar testing to optimize PAC and coagulation/flocculation processes and evaluate the condition of the GAC media.

Highlands Mutual Water Company Cyanotoxin Management Plan – Step 5 E1.28
Communications Highlands Mutual Water Company will provide the following notifications:
• If the follow-up distribution system confirmation samples or the entry point samples tested with the Adda-specific ELISA lab based method exceeds 0.3 µg/L:
o Notify stakeholders that microcystins levels ≥0.3 µg/L have been confirmed in the finished water.
o Issue public health advisory system-wide (even if the toxin is only found in one distribution system pressure zone).
• If microcystins are detected in raw water samples with the Adda-specific ELISA lab-based method but not detected at the EPTDS or in the distribution system, Highlands Mutual Water Company will:
o Notify stakeholders that microcystins remain a concern in the raw water but microcystins levels ≥0.3 µg/L were not confirmed in the finished water.
• If Adda-specific ELISA results for all distribution samples are below 0.3 µg/L, Highlands Mutual Water Company will:
o Lift the public health advisory if it has been issued.
Highlands Mutual Water Company Cyanotoxin Management Plan – Long-Term Activities E1.29
Long-Term Activities Additional long-term activities can be undertaken by Highland Mutual Water Company to better understand treatment effectiveness, develop a cohesive monitoring program, explore monitoring other cyanotoxins of concern in addition to microcystins and engage in additional source water protection activities.
Treatment Activities Evaluation of treatment adjustments will require jar testing. The Highlands Mutual Water Company may consider conducting jar tests to determine proper doses of chemicals (such as ozone, ACH and filter aid) or media (PAC) for control of cyanotoxins while achieving other treatment goals (e.g., control of taste and odor, removal of DBP precursors, etc.). In addition, the Highlands Mutual Water Company will need to evaluate the effectiveness of these treatment adjustments based on sampling results and refine these approaches as appropriate.
Monitoring Activities Consider establishing a cohesive, routine raw water and in-plant process control sampling and monitoring protocol for HABs. Consider monitoring the distribution of the toxin in the cells of the clarifier sludge to determine percentage of intra- or extra-cellular during onset and/or peak of blooms to assess clarifier rake speed/check if adequate. Also consider monitoring the pre-ozone dosage using microscopy to assess cell condition to determine cell lysis or limit to 2.7 µg/L.
Additionally, consider learning more about cylindrospermopsin and anatoxin-a test strips. If appropriate (based on lake monitoring results and information about the test strips, their cost, detection levels, and accuracy), work them into the cyanotoxins management plan.
Source Water Protection Management Approaches • Identify all ongoing monitoring, committees, government programs and other organized
watershed management activities taking place related to Clear Lake. For each of these provide activity descriptions, milestone dates, lists of key players and funding sources. Identify ways Clear Lake’s water utilities could become more involved and the benefits to the water utilities of greater involvement. Prioritize which of these may be the most helpful for furthering the specific interests of the water utilities in the watershed.
• The Highlands Mutual Water Company could assist water quality efforts in the watershed by identifying its role in Clear Lake’s Watershed Management Plan, or by working with county and state officials to identify an appropriate role, which may be in the form of an activity such as providing additional water quality monitoring.
• Development of a well-designed network of monitoring sites would help provide greater understanding of the water quality and cyanobacteria/algae dynamics in Clear Lake partnering with other utilities and/or state agencies. A monitoring strategy could be developed that uses targeted sampling to gather as much relevant information as possible. In addition, it would be beneficial to understand the differences among vegetative covers and land uses in terms of nutrient and sediment export. The monitoring strategy should take into account watershed size and consider other aspects of monitoring design in order to effectively determine loadings/impacts to the lake, such as intake location.

Highlands Mutual Water Company Cyanotoxin Management Plan – Long-Term Activities E1.30
• Apply for State Revolving Funds (or other funding sources) to improve source water quality.
• In April 2016, in partnership with the State of California, the utility and interested stakeholders conducted an evaluation of activities the utility could engage in to enhance source water protection. The evaluation determined what additional steps could be taken by the utility to mitigate HAB occurrence. The result of the evaluation was that the utility could include additional activities in the upcoming watershed sanitary survey related to nutrient pollution in source waters. Based on a review of the last (2012) watershed sanitary survey, it was identified that it would also be helpful to address nutrient loading and associated water quality problems in Clear Lake in greater detail in the 2017 Watershed Sanitary Survey.

Highlands Mutual Water Company Cyanotoxin Management Plan - References E1.31
References CVRWQCB (Central Valley Regional Water Quality Control Board). 2006. Amendment to the Water Quality Control Plan for the Sacramento River and San Joaquin Basins for the Control of Nutrients in Clear Lake. Staff Report June 2006.
CVRWQCB (Central Valley Regional Water Quality Control Board). 2012. Clear Lake Nutrient Total Maximum Daily Load Control Program 5-Year Update, Final Report. September, 2012.
CVRWQCB (Central Valley Regional Water Quality Control Board). 2013. The Clear Lake Nutrient TMDL Implementation Handout. February 7, 2013.
Forsgren Associates, Inc. 2007. Clear Lake Watershed Sanitary Survey 2007 Update.
Forsgren Associates, Inc. 2012. Clear Lake Watershed Sanitary Survey 2012 Update.
Lake County Water Resources Department. 2010. Clear Lake Integrated Watershed Management Plan. http://www.co.lake.ca.us/Government/Directory/Water_Resources/watershedplan/CLIWMP_Docs.htm (accessed 08.30.16).
Mioni, C., Kudela, R. 2011. Algal toxins bioassessment—Clear Lake, July/August 2010. April 2011.
Mioni, C., Kudela, R., Baxa, D. 2012. Harmful cyanobacteria blooms and their toxins in Clear Lake and the Sacramento San Joaquin Delta (California). April 2012.
Richerson, P.J., T.H. Suchanek and S.J. Why. 1994. The Causes and Control of Algal Blooms in Clear Lake, Clean Lakes Diagnostic/Feasibility Study for Clear Lake, California. Report prepared for Lake County Flood Control and Water Conservation District, California Department of Water Resources, and United States Environmental Protection Agency. Division of Environmental Studies, University of California, Davis, CA.
State Water Resources Control Board (SWRCB), 1999. Drinking Water Source Assessment and Protection (DWSAP) Program. State Water Resources Control Board, January, 1999.
Tetra Tech. 2004. Total Maximum Daily Load for Nutrients in Clear Lake, Lake County, California, Technical Report. Prepared for the Central Valley Regional Water Quality Control Board. December 1, 2004.
Winder, M., Reuter, J., Schladow, G. 2010. “Clear Lake Report: Clear Lake Historical Data Analysis”. Report prepared Lake County Public Water District. University of California, Davis, CA.

Highlands Mutual Water Company Cyanotoxin Management Plan – Appendix A E1.32
Appendix A Cyanotoxin Management Flowchart

Highlands Mutual Water Company Cyanotoxin Management Plan – Appendix B E1.33
Appendix B Contacts and Stakeholder Information
Agency/Company Title Contact Name Contact Phone Contact Email Local/State Organizations Lake County Public
Health Officer
Central Valley Water Board
Mendocino District Office, State Drinking Water Field Office Branch, SWRCB
District Engineer
City of Clearlake Foreman City of Clearlake Public
Works Director
Medical Facilities Dialysis Center Medical Facilities Medical Facilities Hospitals Hospitals Veterinarians Veterinarians Tribal Communication Elem Indian Colony Environ-
mental Director
Big Valley Rancheria Band of Pomo Indians
Neighboring Public Water Systems Konocti County Water District
Golden State Water Company

Highlands Mutual Water Company Cyanotoxin Management Plan – Appendix C E1.34
Appendix C Notifying the Public of Cyanotoxins in their Water
The State of California has provided the following draft template (in English and Spanish) for Highlands Mutual Water Company to use, as appropriate, when issuing a do not drink advisory:
English version:
LETTERHEAD OR INSERT HIGHLANDS WATER COMPANY LOGO
IMPORTANT INFORMATION REGARDING YOUR DRINKING WATER Low Levels of Cyanotoxins Found in Treated Drinking Water
____________________________________________________ Low levels of [specific cyanotoxin] were found in your treated drinking water. [specific cyanotoxin] is a cyanotoxin. Cyanotoxins are created by bacteria known as cyanobacteria or blue-green algae. Under certain environmental conditions, the cyanobacteria can create harmful algal blooms that can create a health risk if ingested. However, not all ‘blooms’ produce these cyanotoxins. Your treated drinking water was sampled to determine if cyanotoxins were present when a suspected bloom was occurring. The sampling was conducted on [date]. The test results confirmed on [date] showed cyanotoxins are present in your treated drinking water and may present a health risk. As a result, we are changing our treatment operations to lower concentrations of [specific cyanotoxin] as quickly as possible.
What should I do?
• Use bottled drinking water for the preparation of baby formula, cooking, and asyour source of drinking water for humans and pets until further notice. Boilingwater will not remove the cyanotoxins.
• Seek medical treatment immediately if a person, pet, or livestock might have beenexposed to cyanotoxins. Common symptoms of exposure to cyanotoxins include:eye irritation, skin rash, mouth ulcers, vomiting, diarrhea, and cold or flu-likesymptoms.
• Use this water for showering (avoid swallowing the water), washing dishes,cleaning, laundry, watering gardens, and flushing toilets.
What is being done?
We are working hard to correct this problem, and do not expect this problem to last more than [number of days]. We will notify you when the water is acceptable for drinking. More information can be found at: [link].
For questions, please contact: INSERT NAME at [(xxx) xxx-xxxx].

Highlands Mutual Water Company Cyanotoxin Management Plan – Appendix C E1.35
Date Distributed: Month Day, Year
Spanish version:
LETTERHEAD OR INSERT HIGHLANDS WATER COMPANY LOGO
INFORMACIÓN IMPORTANTE SOBRE SU AGUA POTABLE Se Encontraron Nivel Bajos de Cianotoxinas en Agua Potable
Tratada Se encontraron bajos niveles de [specific cyanotoxin] en su agua potable tratada. La/el [specific cyanotoxin] es una cianotoxina. Las cianotoxinas son creadas por bacterias conocidas como cianobacterias o algas verde-azules. Bajo ciertas condiciones ambientales, las cianobacterias pueden crear floraciones de algas nocivas que pueden crear un riesgo para la salud si son ingeridas. Sin embargo, no todas la ‘floraciones’ producen estas cianotoxinas. Se tomaron muestras de su agua potable tratada para determinar si había cianotoxinas presentes en su agua cuando había sospecha de floración. El muestreo se llevó a cabo el [date]. Los resultados de las pruebas confirmados en [date] muestran que hay cianotoxinas presentes en su agua potable tratada y pueden presentar un riesgo para la salud. Como resultado, vamos a cambiar nuestras operaciones de tratamiento para disminuir las concentraciones de [specific cyanotoxin ] tan pronto como sea posible.
¿Qué debo de hacer?
• Hasta nuevo aviso, use agua potable embotellada para preparar la fórmulainfantil, para cocinar y como fuente de agua potable para los seres humanos ymascotas. Las cianotoxinas no se eliminan hirviendo el agua.
• Busque tratamiento médico inmediatamente si una persona, mascota, o ganadopodrían haber estado expuestos a cianotoxinas. Los síntomas comunes dehaber estado expuesto a cianotoxinas incluyen: irritación de los ojos, ronchas,úlceras en la boca, vómito, diarrea y síntomas de resfriado o gripe.
• Evitando tragar agua, puede usar esta agua para bañarse, para lavar lostrastes, limpiar, lavar la ropa, regar jardines y para el inodoro.
¿Qué se está haciendo?
Estamos trabajando diligentemente para corregir este problema y no se espera que éste problema dure más de [number of days]. Nosotros le notificaremos cuando el agua se pueda usar para beber. Puede encontrar más información en: [link].
Para preguntas, puede contactar a: INSERT NAME al [(xxx) xxx-xxxx].

This page has been intentionally left blank
E2.1
Cyanotoxins Management Plan
Village of Perry Water System
Perry, New York November, 2016

E2.2
Table of Contents Executive Summary .............................................................................................................................. E2.4 Village of Perry Water System Overview ............................................................................................. E2.5 Source Water ...................................................................................................................................... E2.5 Treatment Process .............................................................................................................................. E2.5 Routine Water Quality Monitoring ..................................................................................................... E2.6
Cyanotoxin Management Plan ............................................................................................................. E2.7
Step 1: Assess Source Water .................................................................................................................... E2.9
1.1 Identify Source Water Protection Areas ........................................................................................ E2.9 1.2 Create an Inventory of HABs Risk Factors ...................................................................................... E2.9 1.2.1 Source Water Characteristics ..................................................................................................... E2.9 Land Use .............................................................................................................................................. E2.9 1.2.2 Water Quality Parameters ....................................................................................................... E2.10 Historical Cyanobacteria and Cyanotoxin Events in the Source Water ............................................ E2.11 Nutrients ........................................................................................................................................... E2.11 Point and Nonpoint Sources of Pollution .......................................................................................... E2.11
1.3 Assess Vulnerability...................................................................................................................... E2.11
Step 2: Preparation, Monitoring for Early Warning Signs and Immediate Actions ............................... E2.12
2.1 Preparation .................................................................................................................................. E2.12 Prepare Staff and Equipment for Monitoring ................................................................................... E2.12 Prepare for Treatment Adjustments ................................................................................................. E2.12 Communications ............................................................................................................................... E2.12 Establish Communication Plan with other Source Water Users ....................................................... E2.13 Communication with Stakeholders ................................................................................................... E2.13
2.2 Monitoring the Early Warning Signs ............................................................................................ E2.13 Early Indicators of a Cyanobacterial Bloom ...................................................................................... E2.13 Communication: Early Indicators of a Cyanobacterial Bloom .......................................................... E2.14
2.3 Immediate Actions if a Bloom is Suspected ................................................................................. E2.14 Monitoring Actions in Response to Early Warning Signs .................................................................. E2.14 Communication Actions in Response to Early Warning Signs .......................................................... E2.14 Source Water Mitigation Actions in Response to Early Warning Signs ............................................ E2.14
Step 3: Raw Water Cyanotoxin Monitoring and Treatment Adjustments ............................................. E2.15
Monitoring if Cyanobacteria are Identified or Suspected ................................................................. E2.15 Operational Adjustments Based on Raw Water Cyanotoxin Measurements .................................... E2.15 Communications Based on Raw Water Cyanotoxin Measurements ................................................. E2.15
Step 4: Finished Water Cyanotoxin Monitoring and Treatment Adjustments ...................................... E2.16
Monitoring ......................................................................................................................................... E2.16
E2.3
Treatment .......................................................................................................................................... E2.16 Communications ................................................................................................................................ E2.16
Step 5: Continued Finished Water Cyanotoxin Monitoring, Treatment Adjustments and Public Communication ...................................................................................................................................... E2.17
Finished Water Microcystins Monitoring .......................................................................................... E2.17 Treatment .......................................................................................................................................... E2.17 Communications ................................................................................................................................ E2.17
Long-Term Activities .............................................................................................................................. E2.18
Monitoring Activities .......................................................................................................................... E2.18 Treatment Activities ........................................................................................................................... E2.18 Source Water Protection Management Approaches ......................................................................... E2.18
Appendices
Appendix A Cyanotoxin Management Flowchart .................................................................................. E2.19
Appendix B Contacts and Stakeholder Information .............................................................................. E2.20
Appendix C Notifying the Public of Cyanotoxins in their Water ............................................................ E2.22

Village of Perry Water System Cyanotoxin Management Plan - Executive Summary E2.4
Executive Summary The Village of Perry Water System, with the support of the State of New York and the United States Environmental Protection Agency (USEPA), developed this Cyanotoxins Management Plan (CMP) to prepare for and mitigate risks from harmful algal blooms (HABs) and cyanotoxins occurring in Silver Lake and to protect public drinking water from cyanotoxin contamination. This document provides steps and activities to prepare for and identify a potential HAB occurrence, make treatment and operational adjustments to remove cyanotoxins from source waters, provide timely information and (as appropriate) an advisory to the water system’s customers, and document information about occurrences of HABs so that information can be used to minimize the effect of HABs on the water system in the future. This plan also contains possible future activities the Village of Perry Water System could engage in to mitigate the risks from HABs and cyanotoxins, such as long-term source water protection activities.
The steps outlined in this CMP include:
Step 1: Assess Source Water Step 2: Preparation, Monitoring for Early Warning Signs and Immediate Actions Step 3: Raw Water Cyanotoxin Monitoring and Treatment Adjustments Step 4: Finished Water Cyanotoxin Monitoring and Treatment Adjustments Step 5: Continued Finished Water Cyanotoxin Monitoring, Treatment Adjustments and Public Communication
In addition to the five steps above long-term activities are also discussed to enhance the utility’s ability to prevent, mitigate and manage the risks from cyanotoxin occurrence in source and drinking waters.

Village of Perry Water System Cyanotoxin Management Plan - Overview E2.5
Village of Perry Water System Overview The Village of Perry Water System serves the Village and Town of Perry and the Town of Castile, all in Wyoming County, for a total of 1,660 service connections and 3,673 people. On average, the system produces approximately 475,000 gallons per day of finished water, with a peak flow of 660,000 gallons per day. Peak production typically occurs around July 4th, when the plant runs 24 hours a day, seven days a week to meet demand. While the Village has a permit restricting lake withdrawals to two million gallons per day, the current plant is likely not capable of treating that much water in a day.
The Village has a 750,000-gallon elevated storage tank as well as a 150,000-gallon storage tank with a chlorine booster station located on the way from the Village to the Town of Perry. Altogether, the system has 1.5 - 2 days of finished water storage. The distribution system has one pressure zone.
A description of the water system’s treatment process is provided below, as well as a schematic of the treatment system. In addition to concerns related to HABs, the water system contends with taste and odor problems stemming from geosmin or MIB production by cyanobacteria growing in its primary source, Silver Lake.
Source Water The Village of Perry uses Silver Lake as its primary source of water. There are two intakes referred to as Intake 1 and Intake 2. Perry only uses Intake 1. Intake 2 is located in shallower water and its valve is cemented shut. The maximum depth of the lake is approximately 33 feet. There are no interconnections with other municipalities and there is no backup supply. Silver Lake is located in Wyoming County.
Silver Lake is a Class A lake under New York State’s lake classification system. According to this lake classification system, its best intended use is as a potable water supply. The lake is also used for contact recreation, non-contact recreation and is protected for its aquatic life and aesthetics. Residents and visitors access the lake for power boating, fishing and swimming through residential shoreline access and a state launch near the southern end of the lake. Silver Lake is stocked by New York State with about 4.2 million 0.5-inch walleye annually.
Treatment Process Two low lift pumps bring water from Silver Lake to the treatment plant. The Village of Perry Water System then provides the following treatment:
Clarification: Water flows from the pumps to an upflow clarifier where the following chemicals are added directly into the water as it enters:
• The coagulant, PCH180, at a rate of 22 gallons per day
• Orthophosphate for corrosion control at a rate of 2 gallons per day
• Pre-chlorination to kill off algae and cyanobacteria in the raw water at a rate of 0.2-0.6 mg/L using 12.5% sodium hypochlorite solution
Water leaving the upflow clarifier must maintain a turbidity of no more than 0.1 nephelometric turbidity units (NTU) to meet treatment goals.
Filtration: Water that has passed through the upflow clarifier then flows to one of three filters that are operated in parallel. Each filter is capped with 18 inches of granular activated carbon (GAC), below which are two feet of sand. The GAC in each filter is replaced every three years. There are three filter beds and GAC is replaced in one filter bed a year, rotating among the three beds. The GAC is primarily
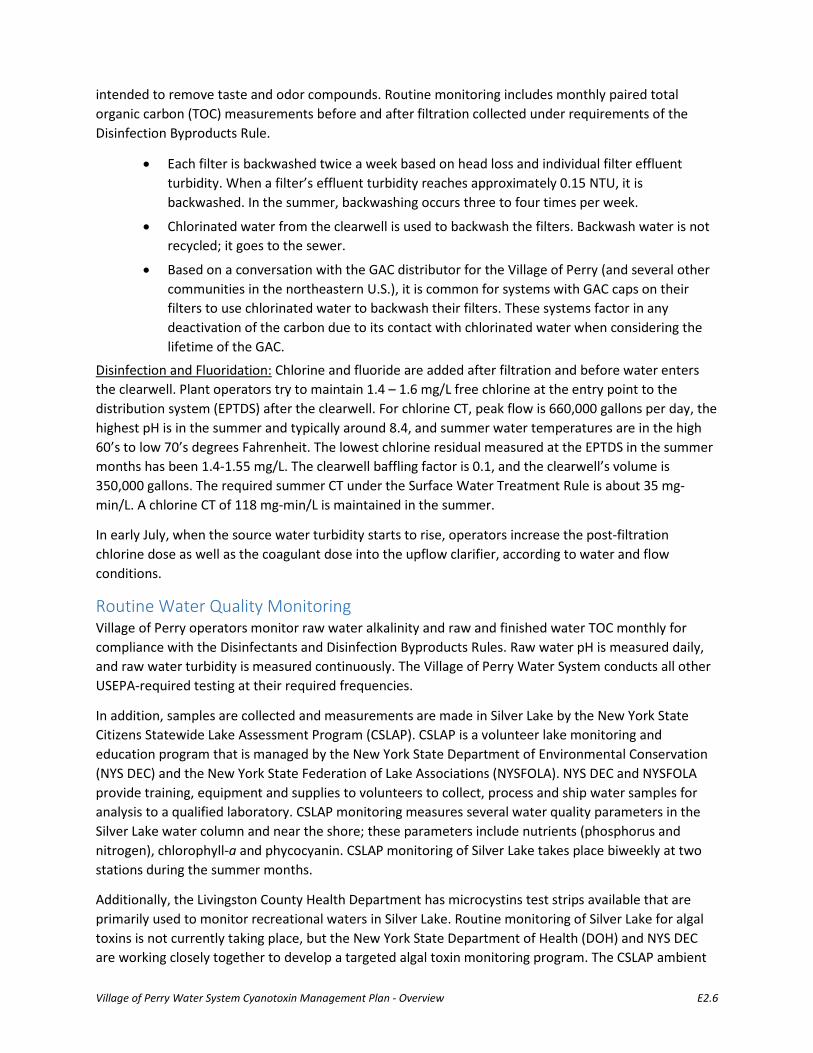
Village of Perry Water System Cyanotoxin Management Plan - Overview E2.6
intended to remove taste and odor compounds. Routine monitoring includes monthly paired total organic carbon (TOC) measurements before and after filtration collected under requirements of the Disinfection Byproducts Rule.
• Each filter is backwashed twice a week based on head loss and individual filter effluent turbidity. When a filter’s effluent turbidity reaches approximately 0.15 NTU, it is backwashed. In the summer, backwashing occurs three to four times per week.
• Chlorinated water from the clearwell is used to backwash the filters. Backwash water is not recycled; it goes to the sewer.
• Based on a conversation with the GAC distributor for the Village of Perry (and several other communities in the northeastern U.S.), it is common for systems with GAC caps on their filters to use chlorinated water to backwash their filters. These systems factor in any deactivation of the carbon due to its contact with chlorinated water when considering the lifetime of the GAC.
Disinfection and Fluoridation: Chlorine and fluoride are added after filtration and before water enters the clearwell. Plant operators try to maintain 1.4 – 1.6 mg/L free chlorine at the entry point to the distribution system (EPTDS) after the clearwell. For chlorine CT, peak flow is 660,000 gallons per day, the highest pH is in the summer and typically around 8.4, and summer water temperatures are in the high 60’s to low 70’s degrees Fahrenheit. The lowest chlorine residual measured at the EPTDS in the summer months has been 1.4-1.55 mg/L. The clearwell baffling factor is 0.1, and the clearwell’s volume is 350,000 gallons. The required summer CT under the Surface Water Treatment Rule is about 35 mg-min/L. A chlorine CT of 118 mg-min/L is maintained in the summer.
In early July, when the source water turbidity starts to rise, operators increase the post-filtration chlorine dose as well as the coagulant dose into the upflow clarifier, according to water and flow conditions.
Routine Water Quality Monitoring Village of Perry operators monitor raw water alkalinity and raw and finished water TOC monthly for compliance with the Disinfectants and Disinfection Byproducts Rules. Raw water pH is measured daily, and raw water turbidity is measured continuously. The Village of Perry Water System conducts all other USEPA-required testing at their required frequencies.
In addition, samples are collected and measurements are made in Silver Lake by the New York State Citizens Statewide Lake Assessment Program (CSLAP). CSLAP is a volunteer lake monitoring and education program that is managed by the New York State Department of Environmental Conservation (NYS DEC) and the New York State Federation of Lake Associations (NYSFOLA). NYS DEC and NYSFOLA provide training, equipment and supplies to volunteers to collect, process and ship water samples for analysis to a qualified laboratory. CSLAP monitoring measures several water quality parameters in the Silver Lake water column and near the shore; these parameters include nutrients (phosphorus and nitrogen), chlorophyll-a and phycocyanin. CSLAP monitoring of Silver Lake takes place biweekly at two stations during the summer months.
Additionally, the Livingston County Health Department has microcystins test strips available that are primarily used to monitor recreational waters in Silver Lake. Routine monitoring of Silver Lake for algal toxins is not currently taking place, but the New York State Department of Health (DOH) and NYS DEC are working closely together to develop a targeted algal toxin monitoring program. The CSLAP ambient

Village of Perry Water System Cyanotoxin Management Plan - Overview E2.7
lake water samples that are collected are analyzed by the Upstate Freshwater Institute for nutrients and other general water quality analytes, and HAB toxins are analyzed by SUNY College of Environmental Science and Forestry (SUNY ESF), located in Syracuse. New York State’s Wadsworth Laboratories in Albany performs HAB toxin analysis on raw and finished drinking water samples as dictated by bloom related water quality concerns.
Table 1. Raw Water Routine Monitoring
Parameter Location Frequency Who Collects Sample?
Who Does Analysis?
Alkalinity Raw Water Pump Monthly Village of Perry Commercial Lab TOC Discharge Monthly Operators Commercial Lab pH1 Daily Plant
Temperature Daily Plant Turbidity2 Continuously Plant
Chlorophyll-a Nutrients
Phycocyanin Total Microcystins
Silver Lake Bi-Weekly Citizens Statewide Lake Assessment Program (CSLAP)
Upstate Freshwater Institute analyzes nutrients, general
water quality analytes
SUNY ESF analyzes
microcystins for CSLAP samples
Total Microcystins Raw and finished water
As needed Village of Perry Operators
Wadsworth Laboratories
analyzes microcystins for raw
and finished drinking water
samples collected by Village of Perry
1Raw water pH values range from approximately 7.2 to 8.3 depending on the season 2Raw water turbidity ranges from 1.0 to 2.5 NTU
Cyanotoxin Management Plan The Village of Perry developed this Cyanotoxins Management Plan (CMP) detailed in the steps below. This CMP provides an action plan to prepare for and mitigate risks from harmful algal blooms (HABs) and cyanotoxins occurring in Silver Lake in order to protect public drinking water from cyanotoxin contamination. The plan includes immediate steps discussing monitoring and treatment should HABs and cyanotoxins occur as well as long-term steps the system can engage in to protect source and drinking waters and to fully evaluate treatment capabilities. A detailed flowchart of the CMP process can be found in Appendix A.

Village of Perry Water System Cyanotoxin Management Plan – Overview E2.8
Figure 1. Schematic Diagram of the Treatment System

Village of Perry Water System Cyanotoxin Management Plan – Step 1 E2.9
Step 1: Assess Source Water 1.1 Identify Source Water Protection Areas A source water assessment is an evaluation of a drinking water source to determine the susceptibility to contamination. The first step of a source water assessment is to delineate (map) the areas of water and land that drain into the water supply that are to be evaluated for contaminant sources. This is called the Source Water Protection Area.
The Village of Perry delineated its Silver Lake Source Water Protection Area using the Drinking Water Application to Protect Source Waters (DWMAPs). Map 1 shows catchments within 15 miles upstream of Intake #1 on Silver Lake in addition to land use indicators in the watershed
Map 1: Source Water Protection Area for Silver Lake, Intake #1
1.2 Create an Inventory of HABs Risk Factors 1.2.1 Source Water Characteristics The Village of Perry uses Silver Lake as its primary source of water. There are two intakes referred to as Intake 1 and Intake 2. Perry only uses Intake 1. Intake 2 is located in shallower water and its valve is cemented shut. The maximum depth of the lake is approximately 33 feet. There are no interconnections with other municipalities and there is no backup supply. Silver Lake is located in Wyoming County.
Land Use The drainage area around Silver Lake is predominantly agricultural or urban land cover. According to the Total Maximum Daily Load (TMDL) modeling efforts, cropped agriculture and hay/pasture land

Village of Perry Water System Cyanotoxin Management Plan – Step 1 E2.10
contribute approximately 84% of the total phosphorus load to Silver Lake, groundwater phosphorus contributes approximately 12%, and septic systems make up roughly 2%. The remaining 2% of phosphorus contributions come from sources such as urban areas, stream bank erosion and forested land. The Silver Lake phosphorus TMDL can be found at http://www.dec.ny.gov/docs/water_pdf/tmdlsilvfinal10.pdf. A combination of models were used to determine mean annual phosphorus loading to the lake and the extent to which these various loads must be reduced to meet the water quality target. In this case, the water quality target is the narrative phosphorus standard as determined by NYS DEC. Map 2 indicates land use types surrounding Silver Lake.
Map 2: Land Use in the Silver Lake Source Water Protection Area
1.2.2 Water Quality Parameters Silver Lake has been assessed for attainment of surface water quality standards under Section 305(b) of the Clean Water Act (CWA). Based on this assessment, Silver Lake was listed as an impaired waterbody due to phosphorus under Section 303(d) of the CWA. A phosphorus TMDL was developed in response to the impairment listing. The TMDL defines targets for phosphorus loading to Silver Lake and outlines strategies for reducing phosphorus loading, which will ultimately reduce algal growth.
Local stakeholders have already invested in major watershed phosphorus load reduction projects to improve the water quality of Silver Lake. Some projects and initiatives to decrease loadings include: transitioning a large portion of the shoreline properties from septic systems to sewers to address failing septic tanks and The Silver Lake Commission and the Wyoming County Soil and Water Conservation District have been working together with farmers in the watershed to develop Nutrient Management Plans and implement agricultural Best Management Practices (BMPs).
One source of funding for implementing the TMDL is CWA nonpoint source program (Section 319) grant funds. A $1.3 million Section 319 grant project was initiated in 2012 to protect the Silver Lake drinking water source by reducing phosphorus, nitrogen and sediment loading to the lake by implementing BMPs and upgrading facilities on nine farms in the watershed. Additionally, the Silver Lake watershed falls

Village of Perry Water System Cyanotoxin Management Plan – Step 1 E2.11
within the working region of the Triple Divide Watershed Coalition, an alliance that seeks to protect the public drinking water sources in Alleghany, Genesee and Susquehanna River regions. The Triple Divide Watershed Coalition is an interstate organization that serves to protect public drinking water sources from degradation of source water quantity or quality by evaluating susceptibility to contamination, working to minimize or eliminate potential threats, creating long-range protection strategies, supporting local planning and inter-governmental cooperation, encouraging public education initiatives, and any other activity to protect and preserve drinking water resources for future generations. The Coalition’s web site is https://goh2o.net/tripledividewatershed.
Historical Cyanobacteria and Cyanotoxin Events in the Source Water Silver Lake has experienced a number of cyanobacterial blooms, with blooms historically becoming more intense as the water temperature in the lake increases. In 2015, there was a bloom from July 6th until Labor Day. However, warm weather is not a necessity; in 2014 there was a bloom in October when the water temperature was approximately 50 degrees Fahrenheit. In 2015, CSLAP sampling measured microcystins levels as high as 7.2 µg/L in open water and 815 µg/L along the shoreline. These results are consistent with longer-term CSLAP monitoring which indicate that algal toxin levels can vary significantly within blooms and from shoreline to lake with often much higher levels found in the shoreline blooms than in open swimming water (http://www.dec.ny.gov/docs/water_pdf/cslrpt15silverlw.pdf).
Nutrients Phosphorus and nitrogen are drivers of algal and cyanobacterial growth in lakes and reservoirs. As discussed above, CSLAP sampling efforts confirm nutrient-rich conditions in Silver Lake, with the concentration of phosphorus in the lake exceeding the state guidance value for phosphorus, increasing the potential for algal bloom formation. In 1998, Silver Lake was added to the NYS DEC CWA Section 303(d) list of impaired waterbodies that do not meet water quality standards due to phosphorus impairments. The majority of the phosphorus load to the lake is from agricultural sources, with smaller percentages of sources from groundwater, septic and urban sources as well as from stream bank erosion and forested land. Based on this listing, a TMDL for phosphorus is being developed for the lake to address the impairment (http://www.dec.ny.gov/docs/water_pdf/tmdlsilvfinal10.pdf).
Point and Nonpoint Sources of Pollution A query of the USEPA DWMAPS tool indicates that there is one National Pollutant Discharge Elimination System (NPDES) permitted wastewater discharger within 15 miles upstream of Silver Lake: Silver Lake Marine Incorporated. There are no Combined Sewer Overflows within 15 miles upstream of Silver Lake. Silver lake experiences nonpoint pollution of nutrients through runoff from urban and agriculture land uses as discussed above.
1.3 Assess Vulnerability A weight of evidence approach was used to characterize Silver Lake as vulnerable to HABs and cyanotoxin occurrence (move to Step 2). Evidence includes all of the discussion in this section including: the dominant land uses in the watershed contributing to phosphorus pollution, the existing phosphorus TMDL in the lake and the historical occurrence of HABs in Silver Lake.
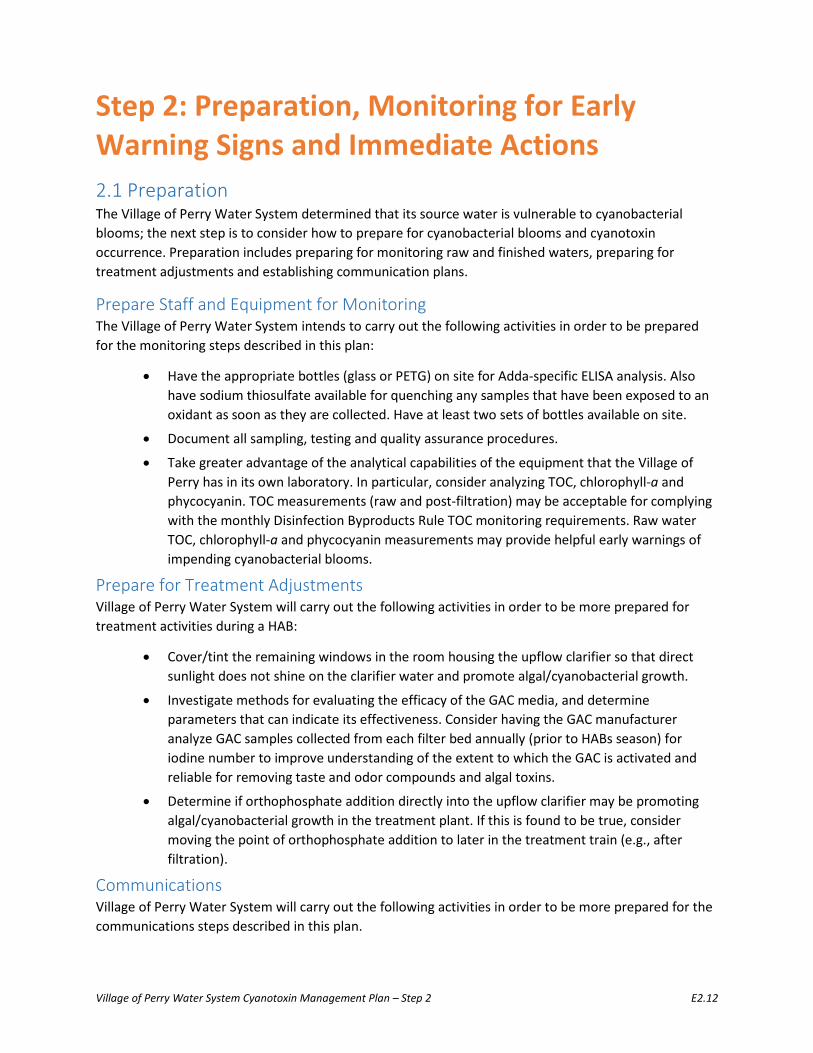
Village of Perry Water System Cyanotoxin Management Plan – Step 2 E2.12
Step 2: Preparation, Monitoring for Early Warning Signs and Immediate Actions 2.1 Preparation The Village of Perry Water System determined that its source water is vulnerable to cyanobacterial blooms; the next step is to consider how to prepare for cyanobacterial blooms and cyanotoxin occurrence. Preparation includes preparing for monitoring raw and finished waters, preparing for treatment adjustments and establishing communication plans.
Prepare Staff and Equipment for Monitoring The Village of Perry Water System intends to carry out the following activities in order to be prepared for the monitoring steps described in this plan:
• Have the appropriate bottles (glass or PETG) on site for Adda-specific ELISA analysis. Also have sodium thiosulfate available for quenching any samples that have been exposed to an oxidant as soon as they are collected. Have at least two sets of bottles available on site.
• Document all sampling, testing and quality assurance procedures.
• Take greater advantage of the analytical capabilities of the equipment that the Village of Perry has in its own laboratory. In particular, consider analyzing TOC, chlorophyll-a and phycocyanin. TOC measurements (raw and post-filtration) may be acceptable for complying with the monthly Disinfection Byproducts Rule TOC monitoring requirements. Raw water TOC, chlorophyll-a and phycocyanin measurements may provide helpful early warnings of impending cyanobacterial blooms.
Prepare for Treatment Adjustments Village of Perry Water System will carry out the following activities in order to be more prepared for treatment activities during a HAB:
• Cover/tint the remaining windows in the room housing the upflow clarifier so that direct sunlight does not shine on the clarifier water and promote algal/cyanobacterial growth.
• Investigate methods for evaluating the efficacy of the GAC media, and determine parameters that can indicate its effectiveness. Consider having the GAC manufacturer analyze GAC samples collected from each filter bed annually (prior to HABs season) for iodine number to improve understanding of the extent to which the GAC is activated and reliable for removing taste and odor compounds and algal toxins.
• Determine if orthophosphate addition directly into the upflow clarifier may be promoting algal/cyanobacterial growth in the treatment plant. If this is found to be true, consider moving the point of orthophosphate addition to later in the treatment train (e.g., after filtration).
Communications Village of Perry Water System will carry out the following activities in order to be more prepared for the communications steps described in this plan.

Village of Perry Water System Cyanotoxin Management Plan – Step 2 E2.13
Establish Communication Plan with other Source Water Users The Towns of Perry and Castile purchase water from the Village of Perry Water System. Other large users of Silver Lake’s water are a splash park, a farm in the Gardeau Water District (Castile serves Gardeau), and the Silver Lake Institute’s Camp Asbury (primarily used on the weekends). The Village of Mt. Morris Water System also uses Silver Lake as its supply and has its own intake further north on the lake. Mt. Morris is located in Livingston County and is therefore regulated and supported by the Livingston County Health Department. The Village of Perry will communicate with operators from Mt. Morris, Town of Perry and Town of Castile to find out best practices to coordinate on communicating the conditions in the Lake.
Communication with Stakeholders • Establish a communication system with programs that are monitoring stations in Silver Lake
to determine when blooms may be occurring. Communications should include: CSLAP, NYS DEC and Livingston County Health Department. Determine how to receive the biweekly CSLAP monitoring results for two stations on Silver Lake during the summer months.
• Complete the stakeholders list in Appendix B and ensure it continues to be up-to-date. Consider adding language to the water system’s annual water quality report asking home dialysis and dialysis center customers to contact the water system so they can be added to the stakeholders list and receive early warning about potential microcystins contamination of the finished water. Explanations of when stakeholders will be contacted about a HAB are provided in Step 5 of this plan.
• Prepare a public health advisory template that is available and ready for use if necessary. Also prepare another notice that would be issued to lift an existing public health advisory (examples are located in Appendix C). Explanations of when a public health advisory will be issued or lifted are provided in Step 5 of this plan.
2.2 Monitoring the Early Warning Signs Based on historical bloom occurrence in Silver Lake, the Village of Perry Water System begins looking for signs of blooms in April. This section identifies early warning signs that the operators can look for during the system’s normal operation.
Early Indicators of a Cyanobacterial Bloom The Village of Perry Water System operators have identified early warning signs that a cyanobacterial bloom is likely to occur in the very near future (or has begun to occur). The following early warning signs are a combination of observations of conditions in the lake itself and in the treatment plant:
• Sunny, hot days that increase water temperature
• A spike in raw water turbidity
• An obvious odor event
• A spike in raw water pH
• Sludge blanket in the upflow clarifier begins to look greener
• High turbidity in clarifier effluent results in an increase in coagulant dose
• Decreased filter runtimes
• Increased finished water chlorine demand

Village of Perry Water System Cyanotoxin Management Plan – Step 2 E2.14
Communication: Early Indicators of a Cyanobacterial Bloom Communication with monitoring programs monitoring for either blooms or cyanotoxins can help indicate to the utility that the lake may be experiencing a bloom.
2.3 Immediate Actions if a Bloom is Suspected Monitoring Actions in Response to Early Warning Signs
• If any early indicator is observed in the lake itself and in the treatment plant and/or if Wyoming County Health Department, New York State DOH, or CSLAPs monitoring results indicate a cyanobacterial bloom in Silver Lake:
o Operators will collect a paired sample set (raw and EPTDS) (moving directly to Steps 3 and 4, simultaneously) and send the paired set of samples to Wadsworth Laboratories for total microcystins testing using Adda-specific ELISA analysis.
o Operator will photograph the lake at the intake when he collects the raw water sample for microcystins analysis. The photographs will be used to inform operators of what the lake conditions look like when total microcystins are (and are not) detected in the water.
Communication Actions in Response to Early Warning Signs The Village of Perry’s lead operator, will communicate with operators from Mt. Morris, Town of Perry and Town of Castile to keep them up-to-date of findings. Village of Perry contacts Wyoming County Health Department when samples are collected and sent to Wadsworth Laboratories.
Source Water Mitigation Actions in Response to Early Warning Signs Silver Lake is not treated with any in-lake mitigation actions aimed to eliminate the bloom.

Village of Perry Water System Cyanotoxin Management Plan – Step 3 E2.15
Step 3: Raw Water Cyanotoxin Monitoring and Treatment Adjustments Monitoring if Cyanobacteria are Identified or Suspected Silver Lake has a strong history of cyanobacterial blooms. If a bloom is suspected the system monitors the raw and finished water (EPTDS) for microcystins. This is indicated in Step 2 as an immediate action simultaneously with Step 4.
Operational Adjustments Based on Raw Water Cyanotoxin Measurements If cyanotoxins are identified in the raw water sample(s) then:
• Consider reducing or eliminating pre-oxidation
• Increase the coagulant dose at the upflow clarifier for cell removal
• Increase chlorine dose in water entering the clearwell, but not to exceed the maximum residual disinfectant level (MRDL) of 4.0 mg/L
Please note that these proposed operational adjustments and those discussed below are empirical and have not been comprehensively evaluated or supported by engineering studies. Evaluation of treatment adjustments will require jar testing. As discussed in long-term activities, the Village of Perry will need to evaluate the toxin removal capacity of its current treatment process using jar tests spiked with varying levels of toxins to simulate different operational conditions. In addition, the Village of Perry will need to evaluate the effectiveness of these treatment adjustments based on sampling results and refine these approaches as appropriate.
Communications Based on Raw Water Cyanotoxin Measurements • Wadsworth Labs will process the samples and within 24 hours get the results to:
o New York State DOH – Albany o New York State DOH – Regional Office
o Wyoming County Health Department
o Livingston County Health Department
• Wyoming County Health Department will notify the Village of Perry of the sampling results.
• The Village of Perry will notify the lead operator at the Mt. Morris Water Department of the sampling results
If any raw water sample is ≥0.3 µg/L total microcystins during Step 3 monitoring, continue Step 4 (as indicated in Step 2, Step 3 and Step 4 will be completed simultaneously).

Village of Perry Water System Cyanotoxin Management Plan – Step 4 E2.16
Step 4: Finished Water Cyanotoxin Monitoring and Treatment Adjustments Monitoring As indicated in Step 2, if blooms are suspected immediate actions will include evaluating finished as well as raw water samples.
Treatment In addition to the treatment adjustments listed in Step 3, Village of Perry Water System will conduct the following additional treatment optimization activity:
• Increase the chlorine dose in the clearwell (without allowing the chlorine concentration at the EPTDS to exceed the MRDL of 4.0 mg/L).
Communications Carry out the following communications as soon as possible if the first EPTDS sample collected (i.e. the unconfirmed sample) contains ≥ 0.3 µg/L total microcystins:
• Call the laboratory to let them know the follow up sample will be coming for analysis and results will be needed as soon as possible.
• Fill out the previously prepared public notice template to have it ready should the public notification step be reached in Step 5.

Village of Perry Water System Cyanotoxin Management Plan - Step 5 E2.17
Step 5: Continued Finished Water Cyanotoxin Monitoring, Treatment Adjustments and Public Communication Detecting cyanotoxins in the finished water indicates that cyanotoxins have broken through the treatment barriers. Step 5 contains communication actions, treatment actions and additional monitoring to be carried out based on the concentrations of cyanotoxins confirmed in the finished water. This fifth step enables the Village of Perry Water System to act quickly if cyanotoxins are confirmed in the finished water.
Finished Water Microcystins Monitoring If the first EPTDS sample collected contains ≥0.3 µg/L total microcystins using the Adda-specific ELISA test at Wadsworth Laboratories:
• Collect a second sample at the EPTDS (with the addition of a quencing agent), as soon as possible and send the sample to Wadsworth Laboratories for analysis using the Adda-specific ELISA method.
• This sample will be considered the confirmation sample. If the EPTDS confirmation sample is <0.3 µg/L total microcystins but total microcystins are still detected in the sample:
• New York State DOH scientists or engineers will determine if more EPTDS samples can be tested by Wadsworth Laboratories (i.e., whether there is lab capacity).
If the confirmation sample collected at the EPTDS is ≥ 0.3 µg/L microcystins, conduct the following monitoring:
• Resample at a frequency and locations that are still to be determined.
Treatment Continue treatment adjustments described in Steps 3 and 4.
Communications If the EPTDS confirmation sample result is <0.3 µg/L total microcystins or a non-detect:
• New York State DOH will notify Wyoming County Health Department as soon as possible, and Wyoming County Health Department will notify the Village of Perry operator. The Village of Perry will then continue looking for early warning signs (return to Step 2).
If the EPTDS confirmation sample is ≥ 0.3 µg/ L total microcystins, provide the following notifications:
• Notify finished water stakeholders that microcystins levels ≥0.3 µg/L total microcystins have been confirmed in the finished water.
• Issue public health advisory (see Appendix C)
• Report finished water results in the Village of Perry’s Annual Water Quality Report.
• If a public health advisory is issued, the public health advisory will not be lifted until: o At least two EPTDS samples have <0.3 µg/L total microcystins using Adda-specific
ELISA lab based test.

Village of Perry Water System Cyanotoxin Management Plan – Long-Term Activities E2.18
Long-Term Activities Additional long-term activities can be undertaken by the Village of Perry to better understand treatment capabilities and engage in additional source water protection activities.
Monitoring Activities Consider conducting monitoring throughout the treatment train to help understand how each process is performing and help guide adjustments and optimization for cyanotoxins. Consider establishing a routine raw and in-plant process control sampling/monitoring protocol for HABs. This could be sampling for cyanotoxins directly, or measuring indicators, such as chlorophyll-a or phycocyanin, or a formal plan for monitoring and trending the early indicators mentioned in this section. Establishing a baseline for these parameters (by trending the data) during routine operation and understanding how each unit treatment process responds can help when a HAB does occur and operators are faced with making potential treatment adjustments. Planning, documenting and conducting a monitoring protocol would be good preparation for a HAB and provide good information during a HAB to support treatment optimization.
Work with the Wyoming County and Livingston County Health Departments and the Village of Mount Morris Water System to purchase test strips and pilot the use of cyanotoxin test strips to determine if they can be incorporated into the management plan. Since the test strips have a short shelf life, it may be beneficial to share their cost and usage with the other organizations. Note, test strips may be useful for screening and optimizing plant operations; however, they will not be used for public notification purpose, as these will be determined by sample results from regular lab methods.
Since the algal blooms seem to blow around Silver Lake depending on the wind speed and direction, determine if there is a weather station at the marina and if/how real-time wind information can be accessed.
Treatment Activities Evaluate the toxin removal capacity of its current treatment process using jar tests spiked with varying levels of toxins to simulate different operational conditions. In addition, the Village of Perry can evaluate the effectiveness of these operational treatment adjustments and optimization based on sampling results and refine these approaches as appropriate.
Source Water Protection Management Approaches The Wyoming County Water Resource Authority and the Village of Perry’s Administrator, both sit on the Silver Lake Commission board. Additional ways the Village of Perry could also engage with source water protection partners includes working with the Triple Divide Watershed Coalition to identify roles it could play in the TMDL process, or the Village of Perry could contact county and state officials to identify an appropriate role for them, which may be in the form of an activity such as providing additional water quality monitoring.
The Village of Perry Water System’s chief operator believes recreational boat traffic on Silver Lake contributes to water quality challenges at the treatment plant. Evaluate and document the impact of the boat traffic on the treatment plant. Explore ways to reduce boat traffic in the vicinity of the treatment plant’s intake could be considered.

Village of Perry Water System Cyanotoxin Management Plan – Appendix A E2.19
Appendix A Cyanotoxin Management Flowchart

Village of Perry Water System Cyanotoxin Management Plan - Appendix B E2.20
Appendix B Contacts and Stakeholder Information
Stakeholders Agency/Company Title Contact Name Contact Phone Contact Email
NYS Dept. of Health – Bureau of Water Supply Protection, Albany
NYS Dept. of Health Regional Office
Wyoming County Health Department
Livingston County Health Department
Neighboring Public Water Systems Town of Perry Water System
Town of Castile Water System
Mt. Morris Water Department
Stakeholders Whom Wyoming County Health Dept. Will Contact Silver Lake Association Camp Arthur Hough YMCA Camp Asbury Emerling Farm Veterinarians in the region Medical doctors in the region
Wyoming County Soil and Water Conservation District
Perry Central School Calvary Church Private School
Licensed Daycares Registered Dialysis Centers

Village of Perry Water System Cyanotoxin Management Plan - Appendix C E2.22
Appendix C Notifying the Public of Cyanotoxins in their Water
At the time of publication of this document, public water systems are not currently required to notify their customers of any bloom or cyanotoxin occurrence and are not required to include detections as part of a system’s Consumer Confidence Report under any National Primary Drinking Water Regulations. Systems should consider consulting with their state or primacy agency to determine if they are subject to any state or tribal notification requirements. Although not currently required by federal regulations, water systems may want to consider communicating with their consumers if cyanotoxins in finished water are confirmed in additional samples. This communication may be received more positively if the water systems have engaged in prior communication with the public about HABs. A water system is encouraged to tailor its communications based on the cyanotoxin levels detected.
In fall 2016, the USEPA released the drinking water cyanotoxin risk communication toolbox. This toolbox is a ready-to-use, “one-stop-shop” to support public water systems, states and local governments in developing, as they deem appropriate, their own risk communication materials. It includes editable worksheets, press release templates, social media posts and other quick references. The materials focus on communicating risk and providing background information to the public prior to and during a drinking water cyanotoxin contamination event as well as general information on harmful algal blooms and cyanotoxins. For the full toolbox please the USEPA's Cyanotoxin Risk Communication Toolbox. Below are some sample templates from that toolbox that are ready-to-use for cyanotoxin Drinking Water Advisories. Brackets ( [ ] ) are included as prompts to fill in system-specific information. There are three template options available, one for each of the following scenarios, when toxin levels in finished drinking water are:
• Above the U.S. Environmental Protection Agency’s Health Advisory level for children six years and older and adults;
• Above the U.S. Environmental Protection Agency’s Health Advisory level for infants and young children under the age of six, but less than or equal to the Health Advisory level for children six years and older and adults;
• Less than or equal to the U.S. Environmental Protection Agency’s Health Advisory level for infants and young children under the age of six, and a Drinking Water Advisory is lifted.
As means of an example, these United States Environmental Protection Agency’s Health Advisory levels for microcystins and cylindrospermopsin are used as cyanotoxin levels that inform public communication decisions in these Drinking Water Advisories. Materials can be edited to include any information determined appropriate by states and public water systems such as different cyanotoxin levels that inform public communication decisions.

Village of Perry Water System Cyanotoxin Management Plan - Appendix C E2.23
DRINKING WATER ADVISORY [CYANOTOXIN NAME] is present in [WATER SYSTEM NAME]
DO NOT DRINK THE TAP WATER [Date issued]
Why is there an advisory? • [Cyanotoxin name], a toxin produced by cyanobacteria (formerly known as blue-green algae)
was detected in the drinking water from [System name] on [date].• Elevated levels of toxins have been detected in [source name] that supplies water to
[geographic area, cities, counties, distribution system segments, etc.].• [System name] is taking the following actions to reduce [cyanotoxin name] levels: [list
actions such as: adjusting treatment, changing source, etc.].• Samples collected on [dates] show [cyanotoxin name] in the drinking water at [levels and/or
ranges], which are above the U.S. Environmental Protection Agency’s [cyanotoxin name] national drinking water Health Advisory of [level].
What should I do?
• Do Not Drink the tap water.• [Alternative sources of water] should be used for drinking, making infant formula, making ice
and preparing food and beverages.• Do Not Boil the tap water. Boiling the water will not destroy cyanotoxins and may increase the
toxin levels.• Everyone may use tap water for showering, bathing, washing hands, washing dishes, flushing
toilets, cleaning and doing laundry. However, infants and young children under the age of sixshould be supervised while bathing and during other tap water-related activities to preventaccidental ingestion of water.
• Drinking water containing [cyanotoxin name] at levels exceeding the national drinking waterHealth Advisories can put you at risk of various adverse health effects including upset stomach,vomiting and diarrhea as well as liver and kidney damage. Seek medical attention if you orfamily members are experiencing illness.
• Animals may be vulnerable to adverse health effects of [cyanotoxin name] at the detected levelsindicated above; consider providing animals alternative sources of water. Contact a veterinarianif animals show signs of illness.
• If you, your family members or your animals have experienced adverse cyanotoxin-relatedhealth effects, please contact [State or local Health Department] to report the illness.
What is being done?
• [System name] is working closely with local and state public health and emergency responseagencies to address the situation and to quickly to reduce [cyanotoxin name] levels in tap water.
• [System name] will post an updated advisory when: the [cyanotoxin] levels are less than orequal to the national drinking water Health Advisories, this Do Not Drink Advisory is liftedand/or if there are any changes to the conditions of this Do Not Drink Advisory.

Village of Perry Water System Cyanotoxin Management Plan - Appendix C E2.24
• For more information please contact [contact information] or visit [website].
Please share this information with all the other people who drink this water, especially those who may not have received this notice directly (for example, people in apartments, nursing homes, schools and businesses). You can do this by posting this notice in a public place or distributing copies by hand.
This notice is being sent to you by [system]. State Water System ID#: ___________ Date distributed: ______
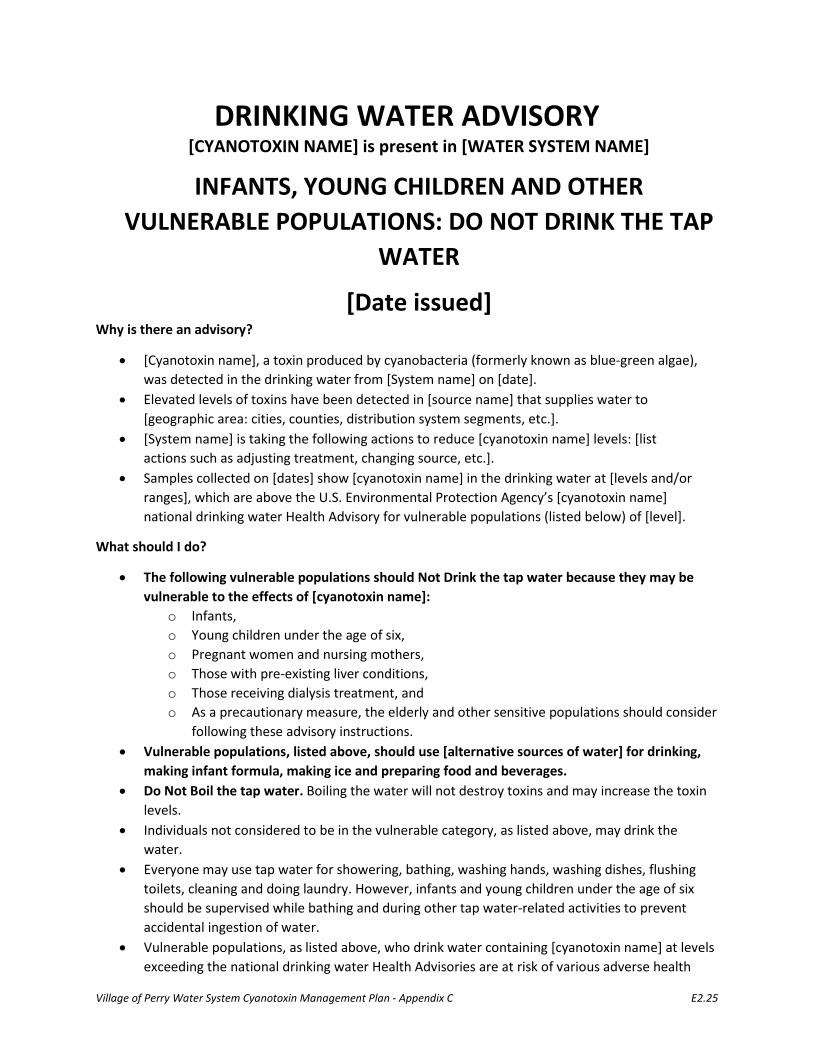
Village of Perry Water System Cyanotoxin Management Plan - Appendix C E2.25
DRINKING WATER ADVISORY [CYANOTOXIN NAME] is present in [WATER SYSTEM NAME]
INFANTS, YOUNG CHILDREN AND OTHER VULNERABLE POPULATIONS: DO NOT DRINK THE TAP
WATER
[Date issued] Why is there an advisory?
• [Cyanotoxin name], a toxin produced by cyanobacteria (formerly known as blue-green algae), was detected in the drinking water from [System name] on [date].
• Elevated levels of toxins have been detected in [source name] that supplies water to[geographic area: cities, counties, distribution system segments, etc.].
• [System name] is taking the following actions to reduce [cyanotoxin name] levels: [list actions such as adjusting treatment, changing source, etc.].
• Samples collected on [dates] show [cyanotoxin name] in the drinking water at [levels and/or ranges], which are above the U.S. Environmental Protection Agency’s [cyanotoxin name] national drinking water Health Advisory for vulnerable populations (listed below) of [level].
What should I do?
• The following vulnerable populations should Not Drink the tap water because they may bevulnerable to the effects of [cyanotoxin name]:
o Infants,o Young children under the age of six,o Pregnant women and nursing mothers,o Those with pre-existing liver conditions,o Those receiving dialysis treatment, ando As a precautionary measure, the elderly and other sensitive populations should consider
following these advisory instructions.• Vulnerable populations, listed above, should use [alternative sources of water] for drinking,
making infant formula, making ice and preparing food and beverages.• Do Not Boil the tap water. Boiling the water will not destroy toxins and may increase the toxin
levels.• Individuals not considered to be in the vulnerable category, as listed above, may drink the
water.• Everyone may use tap water for showering, bathing, washing hands, washing dishes, flushing
toilets, cleaning and doing laundry. However, infants and young children under the age of sixshould be supervised while bathing and during other tap water-related activities to preventaccidental ingestion of water.
• Vulnerable populations, as listed above, who drink water containing [cyanotoxin name] at levelsexceeding the national drinking water Health Advisories are at risk of various adverse health

Village of Perry Water System Cyanotoxin Management Plan - Appendix C E2.26
effects including upset stomach, vomiting and diarrhea as well as liver and kidney damage. Seek medical attention if you or family members are experiencing illness.
• Animals may be vulnerable to adverse health effects of [cyanotoxin name] at the detected levelsindicated above; consider providing animals alternative sources of water. Contact a veterinarianif animals show signs of illness.
• If you, your family members, or your animals have experienced adverse cyanotoxin-relatedhealth effects, please contact [State or local Health Department] to report the illness.
What is being done?
• [System name] is working closely with local and state public health and emergency responseagencies to address the situation and quickly reduce [cyanotoxin name] levels in tap water.
• [System name] will post an updated advisory when: the [cyanotoxin] levels are less than orequal to the national drinking water Health Advisories, this Do Not Drink Advisory is liftedand/or if there are any changes to the conditions of this Do Not Drink Advisory.
• For more information please contact [contact information] or visit [website].
Please share this information with all the other people who drink this water, especially those who may not have received this notice directly (for example, people in apartments, nursing homes, schools and businesses). You can do this by posting this notice in a public place or distributing copies by hand.
This notice is being sent to you by [system]. State Water System ID#: ___________ Date distributed: ______
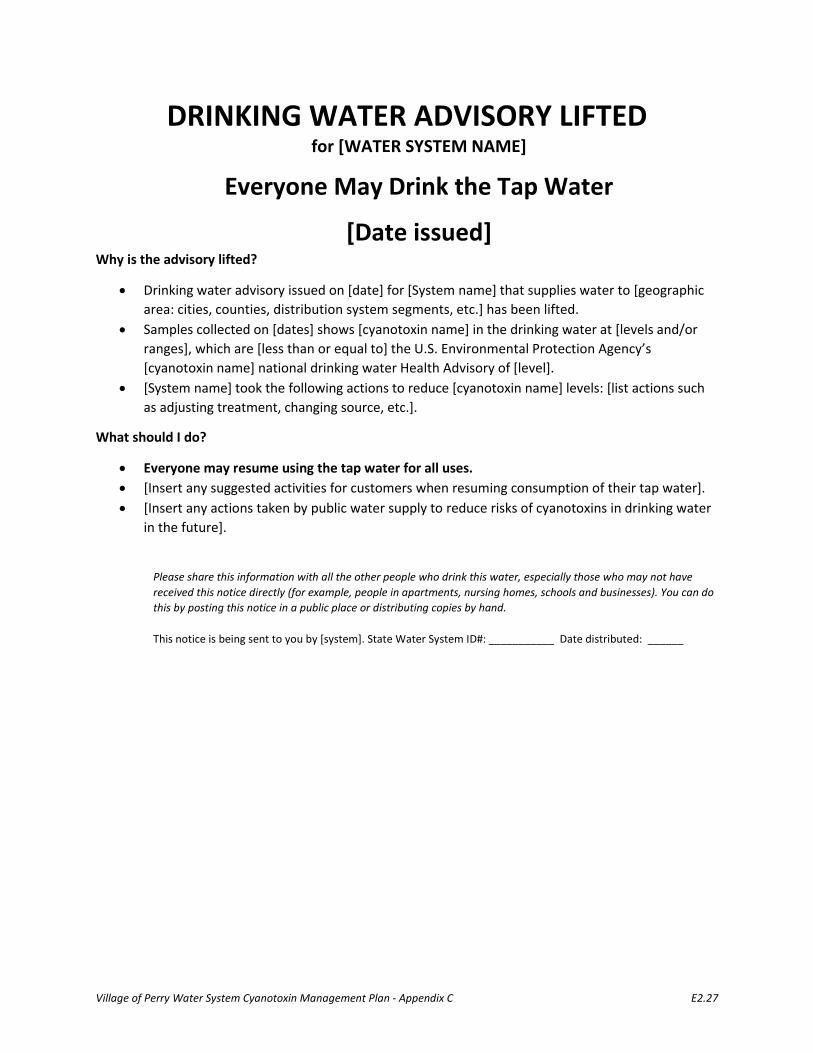
Village of Perry Water System Cyanotoxin Management Plan - Appendix C E2.27
DRINKING WATER ADVISORY LIFTED for [WATER SYSTEM NAME]
Everyone May Drink the Tap Water
[Date issued] Why is the advisory lifted?
• Drinking water advisory issued on [date] for [System name] that supplies water to [geographic area: cities, counties, distribution system segments, etc.] has been lifted.
• Samples collected on [dates] shows [cyanotoxin name] in the drinking water at [levels and/or ranges], which are [less than or equal to] the U.S. Environmental Protection Agency’s[cyanotoxin name] national drinking water Health Advisory of [level].
• [System name] took the following actions to reduce [cyanotoxin name] levels: [list actions such as adjusting treatment, changing source, etc.].
What should I do?
• Everyone may resume using the tap water for all uses.• [Insert any suggested activities for customers when resuming consumption of their tap water].• [Insert any actions taken by public water supply to reduce risks of cyanotoxins in drinking water
in the future].
Please share this information with all the other people who drink this water, especially those who may not have received this notice directly (for example, people in apartments, nursing homes, schools and businesses). You can do this by posting this notice in a public place or distributing copies by hand.
This notice is being sent to you by [system]. State Water System ID#: ___________ Date distributed: ______

E3.1
Cyanotoxins Management Plan
Akron Water Supply Bureau Kent, Ohio
November, 2016

E3.2
Table of Contents Executive Summary .................................................................................................................................. E3.4 Akron Water Supply Bureau Overview .................................................................................................... E3.5
Source Water ...................................................................................................................................... E3.6 Treatment Process .............................................................................................................................. E3.7 Routine Water Quality Monitoring ................................................................................................... E3.8
Cyanotoxin Management Plan ............................................................................................................... E3.11
Step 1: Assess Source Water .................................................................................................................. E3.13
1.1 Identify Source Water Protection Areas ...................................................................................... E3.13 1.2 Create an Inventory HABs Risk Factors ........................................................................................ E3.13 1.2.1 Source Water Characteristics ................................................................................................... E3.13 Land Use ............................................................................................................................................ E3.14 1.2.2 Water Quality Parameters ....................................................................................................... E3.14 Historical Cyanobacteria and Cyanotoxin Events in Source Water .................................................. E3.14 Nutrients ........................................................................................................................................... E3.14 Point and Nonpoint Sources of Pollution .......................................................................................... E3.14
1.3 Assess Vulnerability...................................................................................................................... E3.15
Step 2: Preparation, Monitoring for Early Warning Signs and Immediate Actions ............................... E3.16
2.1 Preparation .................................................................................................................................. E3.16 Prepare Staff and Equipment for Monitoring ................................................................................... E3.16 Prepare for Treatment Adjustments ................................................................................................. E3.16 Communications ............................................................................................................................... E3.17 Water Utilities with the Same Source Water .................................................................................... E3.17 Communication with Stakeholders ................................................................................................... E3.17
2.2 Monitoring the Early Warning Signs ............................................................................................ E3.17 Early Indicators of a Cyanobacterial Bloom ...................................................................................... E3.17
2.3 Immediate Actions if a Bloom is Suspected ................................................................................. E3.18 Monitoring Actions in Response to Early Warning Signs .................................................................. E3.18 Communication Actions in Response to Early Warning Signs .......................................................... E3.18 Source Water Mitigation Actions in Response to Early Warning Signs ............................................ E3.18
Step 3: Raw Water Cyanotoxin Monitoring and Treatment Adjustments ............................................. E3.20
Monitoring if Cyanobacteria are Identified or Suspected ................................................................. E3.20 Operational Adjustments Based on Raw Water Cyanotoxin Measurements .................................... E3.20 Communications Based on Source Water Cyanotoxin Measurements ............................................ .E3.20
Step 4: Finished Water Cyanotoxin Monitoring and Treatment Adjustments ...................................... E3.21
Finished Water Microcystins Monitoring .......................................................................................... E3.21 Treatment .......................................................................................................................................... E3.21 Communications ................................................................................................................................ E3.22
E3.3
Step 5: Continued Finished Water Cyanotoxin Monitoring, Treatment Adjustments and Public Communication ...................................................................................................................................... E3.23
Continued Finished Water Microcystins Monitoring ......................................................................... E3.23 Communications ................................................................................................................................ E3.23
Long-Term Activities .............................................................................................................................. E3.24
Monitoring Activities .......................................................................................................................... E3.24 Source Water Protection Management Approaches ......................................................................... E3.24
Appendices Appendix A Cyanotoxin Management Flowchart .................................................................................. E3.26
Appendix B Contacts and Stakeholder Information .............................................................................. E3.27
Appendix C Notifying the Public of Cyanotoxins in their Water ............................................................ E3.28
Appendix D Ohio State Monitoring Requirements ................................................................................ E3.30

Akron Water Supply Bureau Cyanotoxin Management Plan – Executive Summary E3.4
Executive Summary The Akron Water Supply Bureau, with the support of the State of Ohio and the United States Environmental Protection Agency (USEPA), developed this Cyanotoxins Management Plan (CMP) to prepare for and mitigate risks from harmful algal blooms (HABs) and cyanotoxins occurring in Lake Rockwell (also referred to as Rockwell Reservoir) and to protect public drinking water from cyanotoxin contamination. This document provides steps and documents activities to prepare for and identify a potential HAB occurrence, make treatment and operational adjustments to remove cyanotoxins from the water, provide timely information and (as appropriate) an advisory to the water system’s customers, and document information about occurrences of HABs so that information can be used to minimize the effect of HABs on the water system in the future. This plan also contains possible future activities the utility could engage in to mitigate the risks from HABs and cyanotoxins, such as long-term source water protection activities.
The steps outlined in this CMP include:
Step 1: Assess Source Water Step 2: Preparation, Monitoring for Early Warning Signs and Immediate Actions Step 3: Raw Water Cyanotoxin Monitoring and Treatment Adjustments Step 4: Finished Water Cyanotoxin Monitoring and Treatment Adjustments Step 5: Continued Finished Water Cyanotoxin Monitoring, Treatment Adjustments and Public Communication
In addition to the five steps above, long-term activities are also discussed to enhance the utility’s ability to prevent, mitigate and manage the risks from cyanotoxin occurrence in source and finished waters.

Akron Water Supply Bureau Cyanotoxin Management Plan – Overview E3.5
Akron Water Supply Bureau Overview The Akron Water Supply Bureau serves 280,000 people in Summit County, OH and draws its water from Lake Rockwell, which is fed by upstream East Branch and LaDue Reservoirs via the Cuyahoga River. Water from Lake Rockwell is treated at a nearby treatment plant, and then pumped eleven miles to Akron through three transmission mains into equalizing reservoirs. It is then distributed to more than 95,000 households. The treatment plant’s average production is 35 million gallons per day (MGD), with two in-ground finished water reservoirs and several standpipes.
The Water Supply Bureau consists of 3 divisions: the Watershed Division; the Water Plant Division; and the Water Distribution Division. Each Division has the following responsibilities:
The Watershed Division
• Source water quality protection and security
• Management of four raw water reservoirs and nearly 20,000 acres of City owned property
• Administration of limited recreational programs
• Public education programs focused on water treatment and watershed protection
• Implementation of an USEPA approved Watershed Control Program Water Plant Division
• Operation and maintenance of an Ohio Environmental Protection Agency (EPA) Class IV drinking water treatment facility
• Regulatory compliance responsibilities including an on-site certified laboratory
• Supervisor Control and Data Acquisition (SCADA) System
• Current and past Consumer Confident Reports
Water Distribution Division
• Operation and maintenance of a more than 1,200 mile water distribution system serving approximately 280,000 customers
• Operation and maintenance of multiple pump stations, finished water holding reservoirs, elevated tanks and standpipes
• Industrial and residential meter reading and backflow protection

Akron Water Supply Bureau Cyanotoxin Management Plan – Overview E3.6
Source Water
Lake Rockwell is located in Franklin Township, Portage County, Ohio. The reservoir was formed when the Upper Cuyahoga River was dammed in 1915. Lake Rockwell holds approximately two billion gallons of water. The elevation of the Reservoir is 1,052 ft. above mean sea level at the spillway crest. Flashboards are installed in the spring and removed in the fall and bring the elevation up to 1053.5 ft. above mean sea level during the summer months. Discharge is controlled through three valves in the dam gatehouse and spilled water exits back out into the Middle Cuyahoga River.

Akron Water Supply Bureau Cyanotoxin Management Plan – Overview E3.7
Lake Rockwell has one active intake. This intake draws the water in through a syphon tank. A second intake is not being used due to its location in proximity to the bottom of the lake with reduced water quality and because it does not have the ability to feed pre-treatment chemicals into the structure. The third intake can be used but powdered activated carbon (PAC) and chlorine dioxide (ClO2) cannot be fed into the intake. It is currently used as a bypass feeding water downstream of the spillway. The hydraulic residence time of Lake Rockwell is two to four weeks.
There are two upstream secondary source water reservoirs, East Branch and LaDue. The secondary reservoirs are used to supplement the water in Lake Rockwell. There is no additional redundant source water. While quantity is usually not an issue, in the summer months water quality can be impaired due to algal and cyanobacterial blooms, which can limit treatment options.
Reservoir Management The Akron Water Supply Bureau treats the source water with a commercial chelated copper algaecide (Cutrine Ultra) to decrease cyanobacterial blooms when cyanobacterial populations are start increasing. Treatment occurs in a targeted fashion so the entire lake does not need to be treated. Treating source water for algae like this is Akron Water Supply Bureau’s primary approach to ensuring algal toxins do not make it to finished water.
Treatment Process A schematic of drinking water treatment provided by the Akron Water Supply Bureau is presented in Figure 1. Once water enters the plant, it is treated by one of four parallel treatment trains. The hydraulic residence time of the plant is eight to twelve hours. The following treatment process is provided:
1. Filter Screens: Water first passes through filter screens that keep out fish and large debris. The screens are cleaned three times a week with compressed air blowing through them to keep clean of debris.
2. Potassium Permanganate: Potassium permanganate is added at the intake well to control odor and color problems. The system feeds about 0.5 mg/L but can feed up to 1.2 mg/L. Water travels a quarter of a mile from the intake well to the treatment plant, which provides enough contact time for the permanganate to oxidize manganese, iron and taste and odor compounds.
3. PAC: PAC is sometimes added at the intake to remove taste and odor compounds and cyanotoxins. The low dose of PAC is 3 mg/L; however the plant has the capacity to increase that dose up to 50 mg/L if needed. The PAC is selected on a yearly basis using jar testing and fluorescence analysis (note: Akron Water Supply Bureau currently uses fluorescence analysis to measure organics removal to determine coagulant dose).
4. Coagulation, ClO2 and Flocculation: Alum is added as a coagulant and mixed rapidly to form flocs in the water. ClO2 is added at one of three points in the intake (one location just before the flash mix as well as at two locations within the intake closer to the intake itself) to disinfect the water and oxidize iron, manganese and organic chemicals associated with taste and odor problems (note: Figure 1 shows ClO2 being injected into the rapid mixer, which is discontinued). The benefit of ClO2 over chlorine is that it does not form harmful trihalomethanes or haloacetic acids when combined with organic chemicals as elemental chlorine can. (ClO2 is discontinued during a HAB event due to concerns with cell lysing.)
5. Settled water: Sodium hypochlorite is added at the end of the basins prior to filtration to improve filter performance.

Akron Water Supply Bureau Cyanotoxin Management Plan – Overview E3.8
6. Sedimentation: Floc particles settle in one of several sedimentation basins. Sludge is removed from the basins and dried in drying basins before it is hauled away. By the end of the sedimentation step, approximately 99% (2-log) of the particles in the water have been removed.
7. Filtration: Akron’s plant has 25 rapid sand filters that generally filter flows up to 2 MGD each. The filter media consists of anthracite coal and fine sand.
8. Sodium Hypochlorite, Zinc Orthophosphate, Fluoride and Caustic Addition: Sodium hypochlorite is added for secondary disinfection. Zinc orthophosphate is added for corrosion control. Fluoride, in the form of hydrofluorosilicic acid, is added to reduce tooth decay. Caustic soda is added for corrosion control by adjusting the pH in the water.
In addition to algal issues, the Akron Water Supply Bureau provides additional treatment and protection for Cryptosporidium. The Bureau has developed and implemented a Watershed Control Plan and optimizes its filtration in order to reduce the risk of Cryptosporidium in the finished water.
Routine Water Quality Monitoring The Akron Water Supply Bureau completes Watershed Control Program annual reports, which have the most up to date sampling locations, procedures and data that is compiled and sent to the Ohio EPA. The reports are developed to comply with the Long Term 2 Enhanced Surface Water Treatment Rule. Monthly stream sampling at 19 points in the watershed includes: temperature, dissolved oxygen, ammonia, total phosphorus, fecal coliform and total suspended solids. In addition, the Akron Water Supply Bureau monitors all three reservoirs routinely, as summarized in Table 1 below. The Akron Water Supply Bureau collects some of its own data and therefore it is immediately available for analysis. The staff who conduct the sampling are certified lab analysts or are under the supervision of certified lab analysts.
Table 1. Routine Raw Water Quality Monitoring
Parameter Locations Frequency Who Collects Sample?
Who Does Analysis?
Temperature pH
Dissolved Oxygen Conductivity Chlorophyll-a Phycocyanin
Gate houses at LaDue and East
Branch Reservoirs; intake pier at Lake
Rockwell from November through March and during summer, at both
intake pier and mid-lake, near mouth of Eckert Ditch; every
meter of depth from surface to
floor
Once a month in winter, more often if conditions
that deviate from expected baseline are
observed, minimum twice per month, but usually once a week in summer
Akron Water Supply Bureau
personnel
Akron Water Supply Bureau personnel
using a sonde
qPCR for Microcystin Intake, Mid-lake Once a month in winter, more often if conditions
that deviate from expected baseline are
observed, minimum twice per month, but usually once a week in summer
Akron Water Supply Bureau
personnel
Akron Water Supply Bureau personnel

Akron Water Supply Bureau Cyanotoxin Management Plan – Overview E3.9
Parameter Locations Frequency Who Collects Sample?
Who Does Analysis?
Algal/Cyanobacterial Identification
Intake, Mid-lake Once a month in winter, more often if conditions
that deviate from expected baseline are
observed, minimum twice per month, but usually once a week in summer
Akron Water Supply Bureau
Personnel
Akron Water Supply Bureau personnel
Fluorescence Basins, tap Weekly Akron Water Supply Bureau
Personnel
Akron Water Supply Bureau Personnel
Geosmin and MIB Intake (weekly), intake and EPTDS (if complaint driven or results have been high), Secondary
Reservoirs
Weekly, when receive complaints or results are high, and every time they
collect a raw water microcystins sample
Akron Water Supply Bureau
personnel
Akron Water Supply Bureau personnel
Visual inspection Intake and at Eckert Ditch from the shore each day
Daily Akron Water Supply Bureau
personnel
Akron Water Supply Bureau personnel
At the LaDue and East Branch Reservoirs, monitoring occurs at the gate house. In the winter – roughly November through March – monitoring at Lake Rockwell occurs at the intake pier. During the summer months, samples are collected at both the intake pier and mid-lake, just downstream from where the Eckert Ditch tributary enters into the Lake. Each reservoir is profiled using a sonde unit to obtain measurements at every meter of depth from surface to floor for temperature, pH, dissolved oxygen, conductivity, chlorophyll-a and phycocyanin. Additional samples are collected if a visible bloom or surface scum is detected on Lake Rockwell.
During the winter, monitoring is conducted once per month unless conditions are met to indicate the need for increased monitoring frequency, such as abnormal pH, dissolved oxygen or turbidity levels coming into the plant that deviate from expected baseline levels. In the summer, monitoring is conducted at a minimum of twice per month, but generally takes place closer to once per week.
Akron Water Supply Bureau also measures fluorescence in the raw water and settled water to decide on coagulant dose. They work with the University of Akron to determine these measurements.
The Akron Water Supply Bureau tests their water for geosmin and MIB paired with a raw water total microcystins sample. They sample the intake weekly and increase the PAC dose if they receive customer complaints from the “super tasters” (or those most likely to comment on water taste) or if the geosmin or MIB results are high. When they look into taste and odor, they pair intake and entry point to the distribution system (EPTDS) samples for taste and odor compound analysis. They visually inspect the water at the intake and at Eckert Ditch from the shore each day.
Beginning in June 2016, Akron was required to start weekly monitoring for raw water total microcystins in order to comply with Ohio EPA’s new cyanotoxin regulation. Table 2 below summarizes the total microcystins monitoring schedule for complying with this new regulation. In summary, Ohio’s requirement establishes monitoring requirements for public water systems using surface water including routine weekly source and finished water monitoring for microcystins from May 1 to October

Akron Water Supply Bureau Cyanotoxin Management Plan – Overview E3.10
31. Routine total microcystins monitoring drops to biweekly source water monitoring from November 1 through April 30 (total microcystins detections will indicate the need for increased monitoring). If total microcystins levels greater than 5 μg/L are found in the raw water, the public water system must increase monitoring to three days a week. Section A(2)(d) of Ohio’s regulation requires the frequency of monitoring at both raw and finished water sampling points to be increased to daily if microcystins are detected at finished water sampling points.
The Akron Water Supply Bureau has two main EPTDS, and alternates between them for their required weekly microcystins sampling. The system also samples at a subset of the Disinfection Byproducts (DBP) Rule monitoring locations in the distribution system, rotating around the DBP sites.
Table 2. Ohio Total Microcystins Monitoring Requirements
Location Analysis1 During Which Months?
Monitoring Category
Frequency2
Raw Water Cyanobacteria/cyanotoxin genetic screening (qPCR for 16S, mycF, sxtA and cyrA genes)
Year-Round Routine Once every 2 weeks (at the same time as routine total microcystins sample)
Raw and Finished Water
Total Microcystins May 1st – October 31st
Routine Weekly
Raw and Finished Water
Total Microcystins November 1st – April 30th
Routine Weekly unless not detected in at least 2 consecutive weekly samples from both raw and finished water sampling points. Then frequency is reduced to one sample from each raw water sampling point at least once every 2 weeks.
Raw and Finished Water
Total Microcystins November 1st – April 30th
Routine if there is a detection
If detected at raw water sampling point, weekly monitoring at raw and finished water sampling points will begin no later than 24 hours following detection.3
Raw and Finished Water
Total Microcystins Year-Round Increased Routine (3 days a week)
3 days a week, beginning no later than the following week, if microcystins exceed 5 µg/L at raw water sampling point.3
Raw and Finished Water
Total Microcystins Year-Round Increased Routine (Daily)
Daily, if microcystins detected at finished water sampling point. Daily monitoring will include analysis within 24 hours of sample collection.3
1Total microcystins measured by the Ohio EPA Total (Extracellular and Intracellular) Microcystins - ADDA by ELISA Analytical Methodology.

Akron Water Supply Bureau Cyanotoxin Management Plan – Overview E3.11
2See Ohio EPA’s regulation in Appendix D for details about what monitoring is required if monitoring results exceed the action level. 3See Ohio EPA’s regulation in Appendix D for details about how to return to routine monitoring.
Cyanotoxin Management Plan Akron Water Supply Bureau developed this Cyanotoxins Management Plan (CMP) detailed in the steps below. This CMP provides an action plan to prepare for and mitigate risks from Harmful Algal Blooms (HABs) and cyanotoxins occurring in Lake Rockwell in order to protect public drinking water from cyanotoxin contamination. The plan includes immediate steps discussing monitoring and treatment should HABs and cyanotoxins occur as well as long-term steps the system can engage in to protect source waters and to fully evaluate treatment capabilities. A detailed flowchart of the CMP can be found in Appendix A.

Akron Water Supply Bureau Cyanotoxin Management Plan - Overview E3.12
Figure 1. Schematic Diagram of the Treatment System

Akron Water Supply Bureau Cyanotoxin Management Plan – Step 1 E3.13
Step 1: Assess Source Water 1.1 Identify Source Water Protection Areas Map 1 below delineates (maps) the watershed for Lake Rockwell.
Map 1. Akron water supply reservoirs and land use (http://www.epa.state.oh.us/portals/35/tmdl/upCuy_final_090304.pdf)
1.2 Create an Inventory of HABs Risk Factors 1.2.1 Source Water Characteristics

Akron Water Supply Bureau Cyanotoxin Management Plan – Step 1 E3.14
Phosphorus and nitrogen are drivers of algal and cyanobacterial growth in lakes and reservoirs. Sources of phosphorus and nitrogen can include discharge of domestic and industrial wastewater, septic systems and runoff from agricultural and urban lands.
Land Use Map 1 and Map 2 detail land uses within the Lake Rockwell watershed.
1.2.2 Water Quality Parameters Lake Rockwell is within the Cuyahoga River Basin, which has been assessed for attainment of surface water quality standards under Section 305(b) of the Clean Water Act (CWA). Based on these assessments, the Cuyahoga River Basin was listed as impaired for phosphorus and sediment under Section 303(d) of the CWA, and has had a Total Maximum Daily Load (TMDL) developed in response to the impairment listing. The Cuyahoga River Basin TMDL includes the main stem of the Cuyahoga River as well as its feeder stream (Eckert Ditch). The TMDL defines targets for nutrient loading to the Cuyahoga River and outlines strategies for reducing phosphorus and sediment loading, which will ultimately reduce algal and cyanobacterial growth.
Historical Cyanobacteria and Cyanotoxin Events in Source Water Monitoring of Akron’s source water has found microcystins on several occasions and toxin-producing genera of cyanobacteria including Anabaena, Aphanizomenon, Planktothrix, Microcystis and occasionally Lyngbya. The Akron Water Supply Bureau expects blooms 1-2 weeks after a rain event that is followed by hot, sunny weather and little wind. Normally Akron staff see a succession of dominant algal populations, beginning with diatoms until early May, followed by a brief period of green algae. As temperatures increase and Lake Rockwell stratifies, the phytoplankton population shifts toward cyanobacteria, resulting in a bloom by mid-May or June. That bloom will then die off, but another will take its place after a week or two of sun and lower turbidity water. The cycles do not slow down until the beginning of October, when the cyanobacteria population declines and diatoms become the dominant phytoplankton. Blooms typically start at the shallow northern end of the reservoir, then often progress and migrate south toward the dam, in keeping with the lake’s detention time. Taste and odor issues are occasionally a precursor to blooms, but since Akron staff monitor for bloom presence on the lake often, they normally catch blooms starting before the taste and odor compounds make it to the plant.
Nutrients Point and Nonpoint Sources of Pollution Map 1 shows the delineation of Akron’s water supplies, as well as land use in the watershed. Nutrient pollution within the Lake Rockwell drainage areas results from both urban land cover and agricultural land cover as both point and nonpoint source pollution. The USEPA Drinking Water Mapping Application to Protect Source Waters (DWMAPS) tool indicates that there are 11 National Pollutant Discharge Elimination System (NPDES) permitted wastewater dischargers and no Combined Sewer Overflows within 15 miles upstream of the intake (Map 2). There are also additional NPDES dischargers further upstream in the Upper Cuyahoga River Basin. However, the Upper Cuyahoga TMDL report cites only four significant NDPES dischargers in the Upper Cuyahoga River Basin (Hans Rothenbuhler and Sons, Middlefield Waste Water Treatment Plant (WWTP), Burton WWTP and Mantua WWTP). In addition to agricultural nonpoint source pollution, stormwater runoff is another significant source of nonpoint

Akron Water Supply Bureau Cyanotoxin Management Plan – Step 1 E3.15
urban nutrient pollution as cited in the Upper Cuyahoga River Basin TMDL report. The report can be found at http://www.epa.state.oh.us/portals/35/tmdl/upCuy_final_090304.pdf
Map 2. 24 hours upstream of Lake Rockwell/Cuyahoga intake and land use, point sources in watershed
1.3 Assess Vulnerability A weight of evidence approach was used to characterize the source water’s vulnerability to HABs and cyanotoxin occurrence. Evidence includes all of the discussion in this section including: the land uses that contribute to nutrient pollution in the watershed, the existing phosphorus and sediment TMDL in Lake Rockwell and the historical occurrence of HABs in Akron’s source water. Given these lines of evidence, Lake Rockwell has been considered vulnerable to cyanobacteria and cyanotoxins (continue to Step 2).

Akron Water Supply Bureau Cyanotoxin Management Plan – Step 2 E3.16
Step 2: Preparation, Monitoring for Early Warning Signs and Immediate Actions 2.1 Preparation Akron Water Supply Bureau determined that its source water is vulnerable to cyanobacterial blooms. The next step is to consider how to prepare for cyanobacterial blooms and cyanotoxin occurrence. Preparation includes: preparing for monitoring raw and finished waters, preparing for treatment adjustments and establishing communication plans in order communicate with stakeholders as quickly as needed.
Prepare Staff and Equipment for Monitoring The Akron Water Supply Bureau will carry out the following activities in order to be prepared for the monitoring steps described in this plan:
• Ensure that the Akron Water Supply Bureau’s procedure for submitting microcystins samples to the laboratory complies with all of the new Ohio regulation’s sampling, analytical and reporting methods as discussed in Appendix D.
• Have coolers, chain of custody forms and shipping labels on site and ready for use.
• Ensure that the appropriate bottles (glass or PETG) are on site for sampling.
• Have sodium thiosulfate available for quenching any samples that have been exposed to an oxidant as soon as they are collected.
• Document all sampling, testing and quality assurance procedures. • Install another sonde anchored mid-lake that reports data to SCADA so that operators can
observe real-time data in order to make informed treatment decisions. A sonde installed further north in the lake would provide real-time early warning of water quality changes that have taken place in the lake but are not yet apparent at the intake. Tying the sonde into the water system’s SCADA would enable the system to set alarms at water quality thresholds that may indicate the need for operational or treatment changes.
Prepare for Treatment Adjustments Akron Water Supply Bureau will carry out the following activities in order to be more prepared to treat its source water during a HAB:
• Develop a treatment optimization protocol (a requirement by the Ohio EPA for systems with raw or finished water microcystins detections).
• Work with the University of Akron to determine the optimal PAC type and dose through jar tests and to perform fluorescence studies for the DBP control. Akron Water Supply Bureau currently uses fluorescence analysis to measure organics removal in the raw water and settled water to decide on coagulant dose, in consultation with the University of Akron.
• Continue to stay prepared by ensuring that their finished water storage tanks are fully turning over and remain full.
• Utilize reservoir management strategies (including algaecide application) to proactively control cyanobacteria populations. Note: Ohio EPA’s pesticide general permit restricts

Akron Water Supply Bureau Cyanotoxin Management Plan – Step 2 E3.17
algaecide application to severe blooms (>100,000 cyanobacteria cells/ml or visible scums) that cover greater than 20% of a drinking water reservoir or are within 500 yards of an active intake.
Communications Water Utilities with the Same Source Water No other public water systems use the same surface water sources as the City of Akron.
Communication with Stakeholders The Akron Water Supply Bureau will carry out the following activities in order to be more prepared for the communications steps described in this plan:
• Meet with consecutive systems to review what they have to do if microcystins are detected in Akron’s finished water. Akron will provide sampling bottles and collect samples. (Action items are described in Ohio EPA’s Public Water System Harmful Algal Bloom Response Strategy available at http://epa.ohio.gov/Portals/28/documents/HABs/PWS_HAB_Response_Strategy.pdf).
• Update the advisories currently in the Emergency Operating Plan (current plan on actions to take in emergency situations with all contaminants) with the required ones from the Ohio EPA regulation.
2.2 Monitoring the Early Warning Signs The Akron Water Supply Bureau anticipates blooms to occur one to two weeks after rain events that are followed by hot, sunny weather and little wind. Historical sampling results have exhibited increased E. coli counts and increased nitrogen and phosphorus concentrations upstream of the source water under these conditions. Normally, Akron Water Supply Bureau operators observe a succession of dominant algal populations, beginning with diatoms until early May, followed by a brief period of green algae. As temperatures increase and the reservoir stratifies thermally, they see a shift toward cyanobacteria, resulting in a bloom by mid-May or June. That bloom will then die off, but another will take its place after a week or two of sun and lower turbidity water. The cycles typically do not slow down until the beginning of October, when the flora returns to diatoms. Primary reservoir monitoring is conducted visually and confirmed with sonde phycocyanin readings.
Early Indicators of a Cyanobacterial Bloom The Akron Water Supply Bureau’s operators have identified early warning signs that a cyanobacterial bloom is likely to occur in the very near future (or has begun to occur). The following early warning signs are a combination of observations of conditions in the lake itself and in the treatment plant:
• Visual confirmation that there is a bloom present on the source water. Blooms normally start at the shallow northern end of the reservoir, then progress and migrate south towards the dam.
• Taste and odor issues are occasionally a precursor to blooms, but since observation on the lake occurs so often, typically the Akron Water Supply Bureau watershed staff identify blooms starting before the taste and odor compounds reach the plant.
• Unexpected increase in either pH or dissolved oxygen at the intake.
• Increase in chlorophyll-a or phycocyanin levels.

Akron Water Supply Bureau Cyanotoxin Management Plan – Step 2 E3.18
• When the water temperature reaches 25 degrees Celsius the Akron Water Supply Bureau watches closely for elevated phycocyanin (2,000 to 5,000 cells/mL with conversion). The Akron Water Supply Bureau uses a conversion for phycocyanin measurements, with values of 7,000-10,000 cells/mL in the raw water serving as a cause for concern. (2,000-5,000 cells/mL acts as a baseline and 7,000-10,000 cells/mL points to the beginning of a bloom.)
2.3 Immediate Actions if a Bloom is Suspected Monitoring Actions in Response to Early Warning Signs
• Conduct weekly routine quantitative polymerase chain reaction (qPCR) analyses paired with reservoir monitoring, collecting samples from the dam and mid-lake. Sample every week and run the qPCR analyses in-house.
o If the qPCR determines a potential microcystins producer is present, sample for microcystins at the same location; send to the laboratory in Cleveland for Adda-specific ELISA analysis. (qPCR tests for the presence of the DNA for producing microcystin.)
o If a qPCR test result is positive, it means that cyanobacteria that can produce microcystins are present. It does not, however, mean the toxin is present.
• Sample source water with both profiles and surface water samples at mid-lake and at the dam, close to the intake, using a sonde.
o If the water temperature is high, the pH is abnormal, or phycocyanin is high, collect a sample and look at it under a microscope. Identify the algae or cyanobacteria, but do not count.
o When there seem to be approximately 20,000 cells/mL (phycocyanin-derived number) or microcystins have been identified, then count the cells. The Akron Water Supply Bureau uses a conversion for phycocyanin measurements, with values of 8-10 cells/mL in the raw water serving as a cause for concern.
• If a bloom is suspected or when routine raw water monitoring is required continue to Step 3 (See Appendix D for monitoring requirements)
Communication Actions in Response to Early Warning Signs Monitoring results are recorded into the water utility’s minutes to coordinate with the Operations Group in the Water Treatment Division. The Operations Group meets daily and includes bureau employees in various positions such as operators, managers, engineers and maintenance. The Watershed Division works with the treatment plant management to make decisions about when to apply algaecide.
Source Water Mitigation Actions in Response to Early Warning Signs Discuss the appropriateness of applying algaecide with the watershed group and consult with the Watershed Superintendent. General decisions are made with these general guidelines:
• Treatment does not occur when cell counts are too high due to concerns of cell lysing.
• If cyanobacteria counts are > 30,000-40,000 cells/mL:
o If found at Eckert Ditch (stream that feeds into Lake Rockwell), apply algaecide. o If next to the dam (near the intake), flush water over the dam, algaecide is not used.

Akron Water Supply Bureau Cyanotoxin Management Plan – Step 2 E3.19
• The Akron Water Supply Bureau treats the source water with copper based algaecide when cyanobacteria populations are between 5,000 and 100,000 cells/mL. Treatment does not occur when cell counts are too high (i.e. greater than 100,000 cells/mL) due to concerns of cell lysing.
• The system applies algaecide roughly two to four times per month at the discretion of the Watershed Superintendent.
• Algaecide treatment is applied only at problem areas based on the sonde monitoring data, rather than treating the entire lake.

Akron Water Supply Bureau Cyanotoxin Management Plan – Step 3 E3.20
Step 3: Raw Water Cyanotoxin Monitoring and Treatment Adjustments If a cyanobacterial bloom or its indicators are observed during Step 2, the Akron Water Supply Bureau plans to begin analyzing samples in raw water for total microcystins as soon as possible in addition to the required raw monitoring. If monitoring results indicate the presence of cyanotoxins in the raw water Akron Water Supply Bureau continues to Step 4.
Akron Water Supply Bureau will communicate with its stakeholders and adjust its treatment or operations based on raw water monitoring cyanotoxin results, as described in this section.
Monitoring if Cyanobacteria are Identified or Suspected 1. If any of the following conditions occur: high cyanobacteria counts detected in the source water
(> 30,000-40,000 cells/mL), cyanobacteria identified in source water as potential toxin producers, and source water samples showed qPCR presence for the toxin producing gene:
• Sample the raw water for microcystins; send to the laboratory in Cleveland for Adda-specific ELISA analysis.
2. If microcystins are present in the raw water:
• Sample at the EPTDS; samples are sent to the laboratory in Cleveland for Adda-specific ELISA analysis (Step 4).
• Ohio EPA protocol contains detailed information for increased monitoring (Appendix D).
Operational Adjustments Based on Raw Water Cyanotoxin Measurements
1. If potential toxin-producing cyanobacteria are identified in the source water sample(s) or microcystins are detected in the raw water:
• Add PAC when MIB and geosmin levels rise or if cyanobacteria populations begin increasing. Begin adding PAC to the intake at 15 mg/L or greater, based on the optimal dose established in Step 2.
Communications Based on Source Water Cyanotoxin Measurements Communicate the results with treatment plant management to ensure treatment is being optimized.
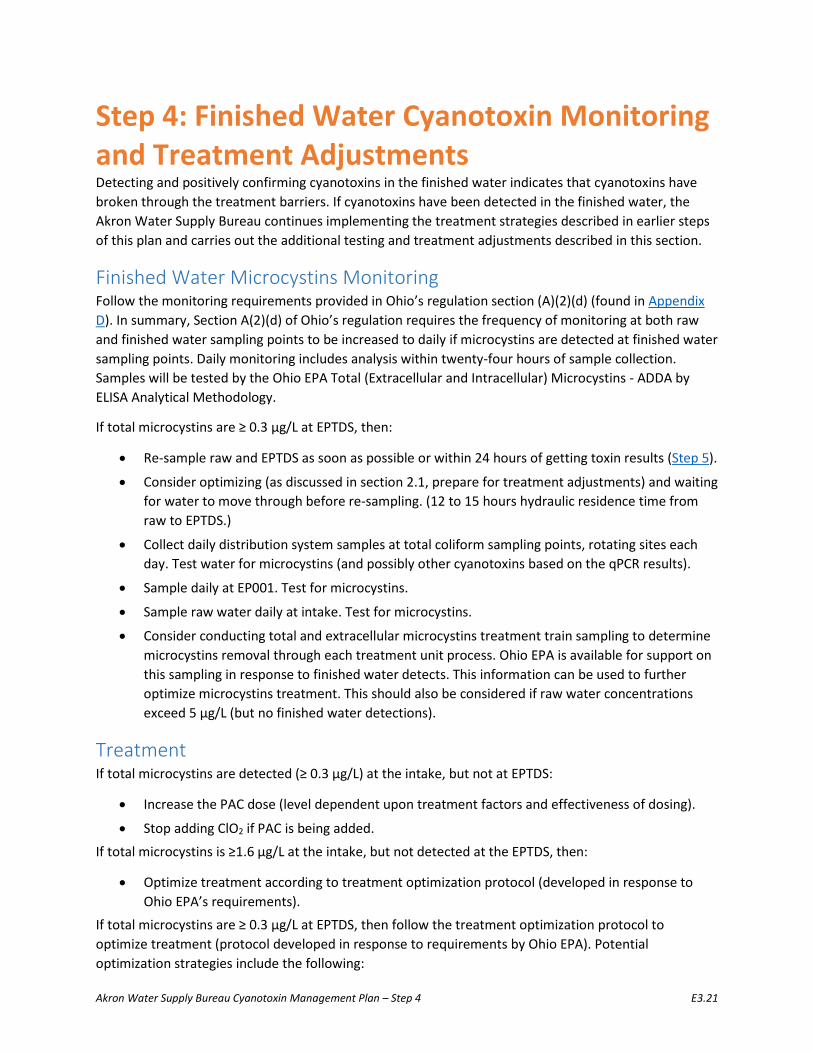
Akron Water Supply Bureau Cyanotoxin Management Plan – Step 4 E3.21
Step 4: Finished Water Cyanotoxin Monitoring and Treatment Adjustments Detecting and positively confirming cyanotoxins in the finished water indicates that cyanotoxins have broken through the treatment barriers. If cyanotoxins have been detected in the finished water, the Akron Water Supply Bureau continues implementing the treatment strategies described in earlier steps of this plan and carries out the additional testing and treatment adjustments described in this section.
Finished Water Microcystins Monitoring Follow the monitoring requirements provided in Ohio’s regulation section (A)(2)(d) (found in Appendix D). In summary, Section A(2)(d) of Ohio’s regulation requires the frequency of monitoring at both raw and finished water sampling points to be increased to daily if microcystins are detected at finished water sampling points. Daily monitoring includes analysis within twenty-four hours of sample collection. Samples will be tested by the Ohio EPA Total (Extracellular and Intracellular) Microcystins - ADDA by ELISA Analytical Methodology.
If total microcystins are ≥ 0.3 µg/L at EPTDS, then:
• Re-sample raw and EPTDS as soon as possible or within 24 hours of getting toxin results (Step 5).
• Consider optimizing (as discussed in section 2.1, prepare for treatment adjustments) and waiting for water to move through before re-sampling. (12 to 15 hours hydraulic residence time from raw to EPTDS.)
• Collect daily distribution system samples at total coliform sampling points, rotating sites each day. Test water for microcystins (and possibly other cyanotoxins based on the qPCR results).
• Sample daily at EP001. Test for microcystins.
• Sample raw water daily at intake. Test for microcystins.
• Consider conducting total and extracellular microcystins treatment train sampling to determine microcystins removal through each treatment unit process. Ohio EPA is available for support on this sampling in response to finished water detects. This information can be used to further optimize microcystins treatment. This should also be considered if raw water concentrations exceed 5 µg/L (but no finished water detections).
Treatment If total microcystins are detected (≥ 0.3 µg/L) at the intake, but not at EPTDS:
• Increase the PAC dose (level dependent upon treatment factors and effectiveness of dosing).
• Stop adding ClO2 if PAC is being added.
If total microcystins is ≥1.6 µg/L at the intake, but not detected at the EPTDS, then:
• Optimize treatment according to treatment optimization protocol (developed in response to Ohio EPA’s requirements).
If total microcystins are ≥ 0.3 µg/L at EPTDS, then follow the treatment optimization protocol to optimize treatment (protocol developed in response to requirements by Ohio EPA). Potential optimization strategies include the following:

Akron Water Supply Bureau Cyanotoxin Management Plan – Step 4 E3.22
• Discontinue the use of ClO2 and pre-filtration chlorination to avoid cell lysis. If necessary, use permanganate at doses less than 1 mg/L to minimize cell lysis and follow-up with PAC to adsorb any toxin released that is not destroyed by permanganate.
• Adjust the coagulant dose based on the pre-established jar testing/fluorescence analysis in Step 2.
• Increase the sludge removal frequency from the sedimentation basins to avoid dissolved toxin release from decaying cells.
• Shorten filter runs, if possible, and backwash more frequently to remove cells captured in the filter bed to avoid lysing.
• Maintain the clearwell water pH between 7 and 8.
• Increase a chlorine residual (with consideration to DBP formation) and maximize contact time with chlorine in the clearwell. Maintain CT values on the order of 20 mg.min/L as a general recommendation, although this target can vary under site specific conditions such as pH, chlorine dose and residual and temperature.
• Minimize pump changes and perform pump rate adjustment using variable-frequency drives. Reduce plant flow if in town reservoir levels permit.
Communications Information regarding notification is contained in the Emergency Operating Plan that describes how the utility will communicate with stakeholders in the event of an emergency (for all contaminants). Appendix C also discusses Ohio EPA’s public notification requirement for microcystins detects in finished drinking water.
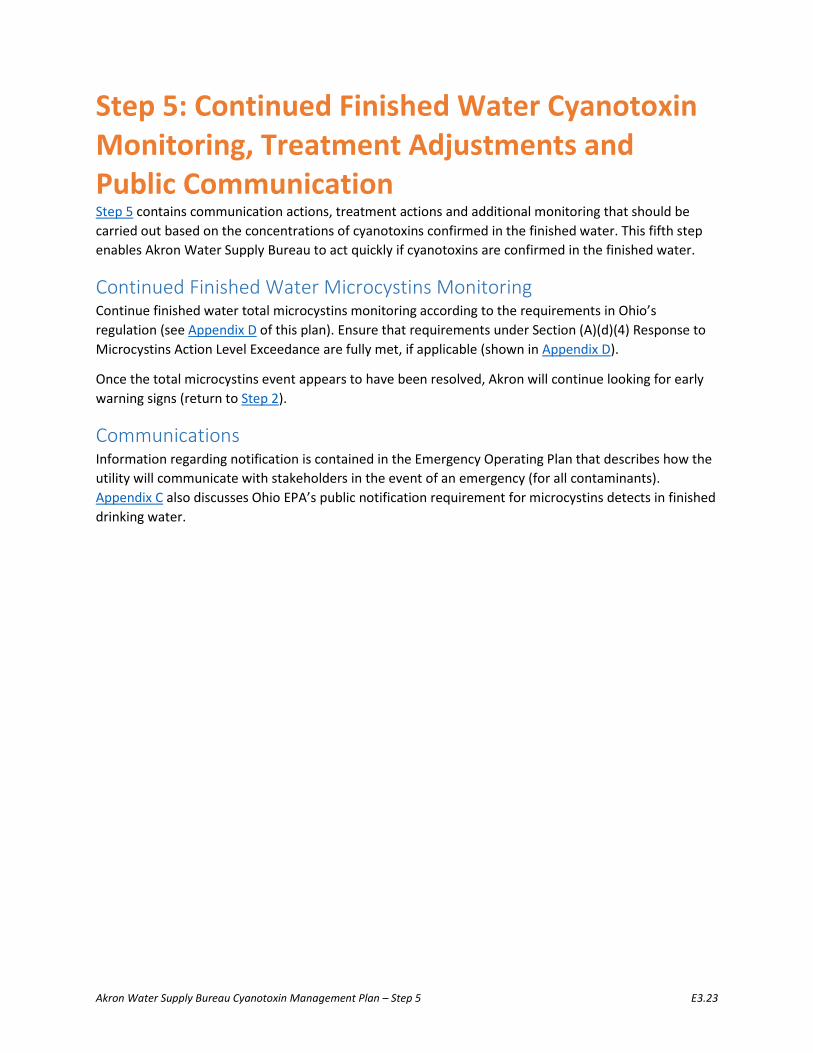
Akron Water Supply Bureau Cyanotoxin Management Plan – Step 5 E3.23
Step 5: Continued Finished Water Cyanotoxin Monitoring, Treatment Adjustments and Public Communication Step 5 contains communication actions, treatment actions and additional monitoring that should be carried out based on the concentrations of cyanotoxins confirmed in the finished water. This fifth step enables Akron Water Supply Bureau to act quickly if cyanotoxins are confirmed in the finished water.
Continued Finished Water Microcystins Monitoring Continue finished water total microcystins monitoring according to the requirements in Ohio’s regulation (see Appendix D of this plan). Ensure that requirements under Section (A)(d)(4) Response to Microcystins Action Level Exceedance are fully met, if applicable (shown in Appendix D).
Once the total microcystins event appears to have been resolved, Akron will continue looking for early warning signs (return to Step 2).
Communications Information regarding notification is contained in the Emergency Operating Plan that describes how the utility will communicate with stakeholders in the event of an emergency (for all contaminants). Appendix C also discusses Ohio EPA’s public notification requirement for microcystins detects in finished drinking water.

Akron Water Supply Bureau Cyanotoxin Management Plan – Long-Term Activities E3.24
Long-Term Activities Additional long-term activities can be undertaken by Akron Water Supply Bureau to better understand treatment effectiveness, be aware of cyanotoxin challenges in addition to microcystin, and engage in additional source water protection activities.
Monitoring Activities Akron Water Supply Bureau could consider establishing a routine raw and in-plant process control sampling/monitoring protocol for HABs. This could be sampling for cyanotoxins directly, or measuring indicators, such as chlorophyll-a or phycocyanin, or a formal plan for monitoring and trending the early indicators mentioned in this section. Establishing a baseline for these parameters (by trending the data) during routine operation and understanding how each unit treatment process responds can help when a HAB does occur and operators are faced with making potential treatment adjustments. Planning, documenting and conducting a monitoring protocol would be good preparation for a HAB and provide good information during a HAB to support treatment optimization. Some specific related activities include:
• Develop a database to record the qPCR and microcystins sample results to determine the correlation of the data. Akron has recently begun to analyze water samples collected for algal and cyanobacterial identification for the microcystin myc genes using qPCR. If microcystin qPCR results indicate the presence of the myc genes, then the water sample is analyzed for microcystins. If the qPCR results indicate an absence of the myc genes, the water sample may not be analyzed for microcystins. As more data are collected, Akron will evaluate the effectiveness of this step at guiding decisions about microcystins monitoring.
• Consider investigating whether taste and odor compounds are effective indicators of cyanotoxins (currently under evaluation in conjunction with the University of Akron).
• Install another sonde anchored mid-lake (installation of buoy anticipated spring 2017) that reports data to SCADA so that operators can observe real-time data in order to make informed treatment decisions. A sonde installed further north in the lake would provide real-time early warning of water quality changes that have taken place in the lake but are not yet apparent at the intake. Tying the sonde into the water system’s SCADA would enable the system to set alarms at water quality thresholds that may indicate the need for operational or treatment changes.
Source Water Protection Management Approaches • Review Akron’s Source Water Assessment Plan, Watershed Control Plan and Drinking Water
Protection Plan to optimize watershed management and protection related to nutrient loading, algal biomass, taste and odor production and cyanotoxin production.
• Actively watch for legislation that could impact watershed protection and proactively represent Akron Water Supply Bureau’s interests.
• Continue to be involved with professional organizations like American Water Works Association, Water Research Foundation, Water Environment Federation and with other water utilities. Continue to build a support network. Keep supporting Algal Identification Workshop and Dealing with Cyanobacteria, Algal Toxins, and Taste and Odor Compounds Workshop (hosted by Stone labs).

Akron Water Supply Bureau Cyanotoxin Management Plan – Long-Term Activities E3.25
• Carry out more outreach to educate, inform and share information about watershed protection.
• If the Bureau decides to dredge Lake Rockwell in the future, try to apply phosphorus control methods at the same time (maybe alum application).
• Work closely with University of Akron and other researchers to: o Improve understanding of nutrient loading in watersheds
o Develop a hydrologic and eventually predictive model for Lake Rockwell
o Algaecide study (In progress) o Nutrient study (In progress)

Akron Water Supply Bureau Cyanotoxin Management Plan – Appendix A E3.26
Appendix A: Cyanotoxin Management Flowchart

Akron Water Supply Bureau Cyanotoxin Management Plan – Appendix B E3.27
Appendix B Contacts and Stakeholder Information
Laboratory Contact Information Northeast Ohio Regional Sewer District (NEORSD), Cleveland, Ohio
Stakeholders Agency/Company Title Contact Name Contact Phone Contact Email Akron Water Supply Bureau
Cyanotoxins Management Plan (CMP) Team Leader
Akron Water Supply Bureau
Source Water Protection Manager
Akron Water Supply Bureau
Treatment Operator
Akron Water Supply Bureau
Distribution System Operator
City of Akron Public Service Director Akron Water Supply Bureau
Water System/Municipality Spokesperson
Summit County Health Commissioner Bureau of Environmental Health
Chief
Bureau of Environmental Health
Assistant Chief
Ohio EPA HAB Coordinator Ohio EPA Northeast
NE District HAB Coordinator
Akron Beacon Journal
Journalist
Northeast Ohio Regional Sewer District
Manager of Analytical Services

Akron Water Supply Bureau Cyanotoxin Management Plan – Appendix C E3.28
Appendix C Notifying the Public of Cyanotoxins in their Water
Ohio public water systems have specific requirements for making public notification under certain water quality conditions. The Ohio requirements are provided here. In addition, the Ohio regulation requires public water systems to address microcystin detections in their Consumer Confidence Reports. Details related to that requirement, as well as the required Health Effects Language, are also provided here.
3745-90-06 Harmful algal blooms - tier 1 public notification and consumer confidence reports.
This rule applies to all public water systems, including consecutive water systems.
(A) Tier 1 public notification.
(1) A public water system shall issue tier 1 public notification in accordance with rule 3745-81-32 of the Administrative Code when any of the following occur:
(a) A microcystins action level established paragraph (A)(1) or (A)(2) in rule 3745-90-02 of the Administrative Code is exceeded in a repeat sample collected at the finished water sampling point in accordance with rule 3745-90-03 of the Administrative Code, unless the director agrees in writing that the timeline for notification may be extended or public notification is not necessary, based on extenuating circumstances, until additional results are received.
(b) If required by the director based on the results of resamples, distribution system samples or daily samples collected in accordance with paragraph (A)(4), (B) or (C)(2) of rule 3745-90-03 of the Administrative Code.
(c) Failure to conduct resampling or repeat sampling in accordance with paragraph (A)(4)(a), (A)(4)(b), (C)(2)(a) or (C)(2)(b) of rule 3745-90-03 of the Administrative Code, unless the director agrees in writing that the timeline for notification may be extended or public notification is not necessary.
(2) The public notification shall include applicable content in accordance with paragraph (E) of rule 3745-81-32 of the Administrative Code, the action level exceeded and the standard health effects language in paragraph (C) of this rule.
(3) The director may allow the system to limit distribution of the public notice in accordance with paragraph (A)(2) of rule 3745-81-32 of the Administrative Code.
(4) Unless otherwise specified by the director based on public health and safety considerations, tier 1 public notification shall remain in effect until the following occur:

Akron Water Supply Bureau Cyanotoxin Management Plan – Appendix C E3.29
(a) Microcystins concentrations are below the action level in two consecutive samples collected a minimum of twenty-four hours apart at the finished water sampling point.
(b) Microcystins concentrations are below the action level in one set of samples collected at the distribution sampling points.
(B) Consumer confidence report.
Each community public water system which exceeds a microcystins action level established in paragraph (A)(1) or (A)(2) of rule 3745-90-02 of the Administrative Code in a sample collected at a finished water sampling point in a daily, resample or repeat sample, or a distribution sampling point collected within their own community water system in accordance with rule 3745-90-03 of the Administrative Code shall include the following in the consumer confidence report required by Chapter 3745-96 of the Administrative Code:
(1) The microcystins action level.
(2) The range of levels detected and highest single measurement of microcystins concentration in samples collected at finished water sampling points and distribution sampling points.
(3) Information regarding the major source of the contaminant: "Produced by some naturally occurring cyanobacteria, also known as blue-green algae, which under certain conditions (i.e., high nutrient concentration and high light intensity) may produce microcystins."
(4) Standard health effects language in paragraph (C) of this rule.
(C) Standard health effects language.
The following standard health effects language shall be used in public notification and consumer confidence reports: "Consuming water containing concentrations of microcystins over the action level may result in abnormal liver function, diarrhea, vomiting, nausea, numbness or dizziness. Children younger than school age, pregnant women, nursing mothers, the elderly, immune-compromised individuals, those with pre-existing liver conditions and those receiving dialysis treatment may be more susceptible than the general population to the health effects of microcystins."
Effective: 06/01/2016 Five Year Review (FYR) Dates: 06/01/2021 Promulgated Under: 119.03 Statutory Authority: 3745.50, 6109.04 Rule Amplifies: 3745.50, 6109.04

Akron Water Supply Bureau Cyanotoxin Management Plan – Appendix D E3.30
Appendix D Ohio State Monitoring Requirements
3745-90-03 Harmful algal blooms - monitoring.
This rule applies to all surface water systems and consecutive water systems receiving water from a surface water source. Seasonal systems shall monitor in accordance with this rule during the system's operating season.
(A) Surface water systems.
(1) Cyanobacteria screening.
Surface water systems shall monitor with a minimum of one sample from each raw water sampling point at least once every two weeks for cyanobacteria screening. Cyanobacteria samples shall be collected at the same time as the routine microcystins sample.
(2) Routine microcystins monitoring.
(a) Routine microcystins monitoring requirements between May first and October thirty-first.
Surface water systems shall monitor with a minimum of one sample from each raw water sampling point and one sample from each finished water sampling point at least weekly for microcystins analysis.
(b) Routine microcystins monitoring requirements between November first and April thirtieth.
(i) Surface water systems shall continue to monitor in accordance with paragraph (A)(2)(a) of this rule unless microcystins are not detected in at least two consecutive weekly samples from both the raw water sampling point and the finished water sampling point, then the microcystins monitoring frequency is reduced to a minimum of one sample from each raw water sampling point at least once every two weeks.
(ii) If microcystins are detected at a raw water sampling point, weekly monitoring at that raw water sampling point and the finished water sampling point shall be conducted beginning no later than twenty-four hours following the detection. When microcystins are not detected in at least two consecutive weekly samples from both the raw water sampling point and the finished water sampling point, then

Akron Water Supply Bureau Cyanotoxin Management Plan – Appendix D E3.31
monitoring once every two weeks may resume in accordance with paragraph (A)(2)(b)(i) of this rule.
(c) Increased routine microcystin monitoring (three days per week).
The frequency of monitoring at both raw water sampling points and finished water sampling points shall be increased to three days a week, beginning no later than the following week, if microcystins exceed five micrograms per liter (ug/L) at the raw water sampling point, unless an alternate frequency has been established as part of the approved cyanotoxin general plan in accordance with rule 3745-90-05 of the Administrative Code.
Routine monitoring in accordance with paragraphs (A)(2)(a) and (A)(2)(b) of this rule may resume once the following occur:
(i) Microcystins concentrations are equal to or less than five ug/L in two consecutive samples from the raw water sampling point that are collected at least one day apart.
(ii) Microcystins concentration is non-detect at finished water sampling points.
(iii) If samples were collected at distribution sampling points in accordance with this rule, microcystins are not detected at any distribution sampling point.
(d) Increased routine microcystins monitoring (daily).
The frequency of monitoring at both raw water sampling points and finished water sampling points shall be increased to daily if microcystins are detected at finished water sampling points collected in accordance with this rule, or distribution sampling points collected in accordance with this rule. Daily monitoring shall include analysis within twenty-four hours of sample collection.
Routine monitoring may resume in accordance with paragraphs (A)(2)(a) and (A)(2)(b) of this rule if the two most recent consecutive daily samples from the raw water sampling point are equal to or less than five ug/L, or in accordance with paragraph (A)(2)(c) of this rule if either of the two most recent consecutive daily samples from the raw water sampling point are greater than five ug/L, once the following occur:
(i) Microcystins are not detected in two consecutive daily samples collected at the finished water sampling point.

Akron Water Supply Bureau Cyanotoxin Management Plan – Appendix D E3.32
(ii) If samples were collected at distribution sampling points in accordance with this rule, microcystins are below the action level at distribution sampling points.
(3) Revised cyanobacteria screening or routine microcystins monitoring frequency.
The cyanobacteria screening or routine microcystins monitoring frequency may be revised (decreased, increased or discontinued) at the discretion of the director. When establishing the revised schedule, the director may consider cyanobacteria screening data collected in accordance with this rule, microcystins data, and other information provided by the public water system including data from other screening tools (such as phycocyanin sensors or phytoplankton enumeration) and treatment information. Surface water systems shall monitor in accordance with the revised cyanobacteria screening or routine microcystins monitoring schedule established by the director.
(4) Response to microcystins action level exceedance.
If microcystins exceed an action level established in paragraph (A)(1) or (A)(2) of rule 3745-90-02 of the Administrative Code in routine samples collected at the finished water sampling point, the public water system shall do the following:
(a) As soon as possible, but no later than twenty-four hours after receiving the results of the initial action level exceedance, collect one resample from each raw water sampling point and one resample from each finished water sampling point. Analysis of resamples must be completed within twenty-four hours of collection. These resamples satisfy the requirement for daily samples as set forth in paragraph (A)(2)(d) of this rule.
(b) Within twenty-four hours of collecting the resamples, collect one repeat sample from each raw water sampling point and one repeat sample from each finished water sampling point. Analysis of repeat samples must be completed within twenty-four hours of collection. These repeat samples satisfy the requirement for daily samples as set forth in paragraph (A)(2)(d) of this rule.
(c) If the microcystins concentration exceeds the action level in the resample or repeat sample collected at any finished water sampling point in accordance with paragraph (A)(4)(a) or (A)(4)(b) of this rule, as soon as practical but no later than three hours after receiving the resample or repeat sample results, the surface water system shall notify all consecutive systems served by the water system. The surface water system with the action level exceedance, and all consecutive water systems served by the water system, shall within twenty-four hours of receiving the resample or repeat sample results, collect samples at representative distribution sampling points in accordance with the contingency plan required by rule 3745-85-01 of the Administrative Code. Additional distribution system monitoring may be required by the director based on sampling results and other relevant circumstances. Analysis of

Akron Water Supply Bureau Cyanotoxin Management Plan – Appendix D E3.33
distribution samples must be completed within twenty-four hours of collection.
(d) Conduct routine daily monitoring in accordance with paragraph (A)(2)(d) of this rule.
(B) Consecutive water systems receiving water from an in-state surface water system.
Within twenty-four hours of receiving notification of an action level exceedance in accordance with paragraph (A)(4)(c) or (C)(2)(c) of this rule, the consecutive water system shall collect samples at representative distribution sampling points in accordance with the contingency plan required by rule 3745-85-01 of the Administrative Code. Additional distribution system monitoring may be required by the director based on sampling results and other relevant circumstances. Analysis of distribution samples must be completed within twenty-four hours of collection.
(C) Consecutive water systems receiving water from an out-of-state surface water source.
(1) Routine microcystins monitoring.
(a) Routine microcystins monitoring requirements between May first and October thirty-first.
Consecutive water systems receiving water from an out-of-state surface water source shall monitor with a minimum of one sample from each finished water sampling point at least weekly for microcystins analysis.
(b) Routine microcystins monitoring requirements between November first and April thirtieth.
Consecutive water systems receiving water from an out-of-state surface water source shall monitor with a minimum of one sample from each finished water sampling point at least once every two weeks for microcystins analysis.
(c) Increased routine microcystins monitoring (daily).
The frequency of monitoring at finished water sampling points shall be increased to daily if microcystins are detected at finished water sampling points collected in accordance with this rule, or distribution sampling points collected in accordance with this rule. Daily monitoring shall include analysis within twenty-four hours of sample collection.
Routine monitoring may resume in accordance with paragraph (C)(1)(a) or (C)(1)(b) of this rule once the following occur:
(i) Microcystins are not detected in two consecutive daily samples collected at the finished water sampling point.

Akron Water Supply Bureau Cyanotoxin Management Plan – Appendix D E3.34
(ii) If samples were collected at distribution sampling points in accordance with this rule, microcystins are below the action level at distribution sampling points.
(d) Revised routine microcystins monitoring frequency.
The routine microcystins monitoring frequency may be revised (decreased, increased or discontinued) at the discretion of the director. When establishing the revised schedule, the director may consider microcystins data, and other information provided by the public water system including data from screening tools (such as phycocyanin sensors or phytoplankton enumeration) and treatment information. Consecutive water systems shall monitor in accordance with the revised routine microcystins monitoring schedule established by the director.
(2) Response to microcystins action level exceedance.
If microcystins exceed an action level established in paragraph (A)(1) or (A)(2) of rule 3745-90-02 of the Administrative Code in routine samples collected at the finished water sampling point, the public water system shall do the following:
(a) As soon as possible, but no later than twenty-four hours after receiving the results of the initial action level exceedance, collect one resample from each finished water sampling point. Analysis of resamples must be completed within twenty-four hours of collection. This resample satisfies the requirement for daily samples as set forth in paragraph (C)(1)(c) of this rule.
(b) Within twenty-four hours of collecting the resamples, collect one repeat sample from each finished water sampling point. Analysis of repeat samples must be completed within twenty-four hours of collection. This repeat sample satisfies the requirement for daily samples as set forth in paragraph (C)(1)(c) of this rule.
(c) If the microcystins concentration exceeds the action level in the resample or repeat sample collected at any finished water sampling point in accordance with paragraph (C)(2)(a) or (C)(2)(b) of this rule, as soon as practical but no later than three hours after receiving the resample or repeat sample results, the public water system shall notify all consecutive systems served by the water system. The public water system with the action level exceedance, and all consecutive water systems served by the water system, shall within twenty-four hours of receiving the resample or repeat sample results, collect samples at representative distribution sampling points in accordance with the contingency plan required by rule 3745-85-01 of the Administrative Code. Additional distribution system monitoring may be required by the director based on sampling results and other relevant circumstances. Analysis of distribution samples must be completed within twenty-four hours of collection.

Akron Water Supply Bureau Cyanotoxin Management Plan – Appendix D E3.35
(d) Conduct routine daily monitoring in accordance with paragraph (C)(1)(c) of this rule.
(D) Monitoring extension.
Upon a request from a public water system, the director may agree to extend the twenty-four hour monitoring requirement for daily, resample, repeat or distribution samples required pursuant to this rule on a case-by-case basis when the public water system has a logistical problem collecting samples within twenty-four hours or analyzing samples in accordance with the requirements of this chapter. When an extension is agreed to by the director, the director shall specify in writing how much time the public water system has to monitor. Examples of potential logistical problems include, but are not limited to:
(1) Extreme weather conditions create unsafe travel or on-site conditions for the person collecting the sample.
(2) Limited certified laboratory capacity on weekends and holidays.
(E) Violations.
Failure to comply with routine and distribution monitoring requirements in paragraph (A)(1), (A)(2), (A)(3), (A)(4)(c), (B), (C)(1) or (C)(2)(c) of this rule is a monitoring violation and requires the public water system to provide Tier 3 public notification in accordance with rule 3745-81-32 of the Administrative Code. Failure to comply with resample and repeat sample requirements in paragraph (A)(4)(a), (A)(4)(b), (C)(2)(a) or (C)(2)(b) of this rule is a monitoring violation and requires the public water system to provide a tier 1 public notification accordance with rule 3745-81-32 of the Administrative Code.
Effective: 06/01/2016 Five Year Review (FYR) Dates: 06/01/2021 Promulgated Under: 119.03 Statutory Authority: 3745.50, 6109.04 Rule Amplifies: 3745.50, 6109.04

This page has been intentionally left blank

E4.1
Cyanotoxins Management Plan
Ottawa County Regional Water System
Port Cl inton, Ohio November, 2016

E4.2
Table of Contents Executive Summary .............................................................................................................................. E4.4 Ottawa County Regional Water System Overview .............................................................................. E4.5 Source Water ...................................................................................................................................... E4.5 Treatment Process .............................................................................................................................. E4.5 Routine Water Quality Monitoring ..................................................................................................... E4.5
Cyanotoxin Management Plan ............................................................................................................. E4.8
Step 1: Assess Source Water .................................................................................................................. E4.10
1.1 Identify Source Water Protection Areas ...................................................................................... E4.10 1.2 Create Inventory of HABs Risk Factors ......................................................................................... E4.10 1.2.1 Source Water Characteristics ................................................................................................... E4.10 Land Use ............................................................................................................................................ E4.11 1.2.2 Water Quality Parameters ....................................................................................................... E4.11 Historical Cyanobacteria and Cyanotoxin Events in Source Water .................................................. E4.11 Nutrients ........................................................................................................................................... E4.11 Point and Nonpoint Sources of Pollution .......................................................................................... E4.12
1.3 Assess Vulnerability...................................................................................................................... E4.12
Step 2: Preparation, Monitoring for Early Warning Signs and Immediate Actions ............................... E4.13
2.1 Preparation .................................................................................................................................. E4.13 Prepare Staff and Equipment for Monitoring ................................................................................... E4.13 Prepare for Treatment Adjustments ................................................................................................. E4.13 Communications ............................................................................................................................... E4.14 Establish Communication Plan with other Source Water Users ....................................................... E4.14
2.2 Monitoring the Early Warning Signs ............................................................................................ E4.14 Early Indicators of a Cyanobacterial Bloom ...................................................................................... E4.14
2.3 Immediate Actions if Bloom is Suspected .................................................................................... E4.15 Monitoring Actions in Response to Early Warning Signs .................................................................. E4.15 Treatment adjustments in Response to Early Warning Signs ........................................................... E4.15 Communication Actions in Response to Early Warning Signs .......................................................... E4.16
Step 3: Raw Water Cyanotoxin Monitoring and Treatment Adjustments ............................................. E4.17
Monitoring if Cyanobacteria are Identified or Suspected ................................................................. E4.17 Operational Adjustments Based on Source Water Cyanotoxin Measurements ................................ E4.17 Communications Based on Source Water Cyanotoxin Measurements ............................................. E4.17
Step 4: Finished Water Cyanotoxin Monitoring and Treatment Adjustments ...................................... E4.18
Finished Water Microcystins Monitoring .......................................................................................... E4.18 Treatment .......................................................................................................................................... E4.18 Communications ................................................................................................................................ E4.18

E4.3
Step 5: Continued Finished Water Cyanotoxin Monitoring, Treatment Adjustments and Public Communication ...................................................................................................................................... E4.19
Continued Finished Water Microcystins Monitoring ......................................................................... E4.19 Treatment and Operations ................................................................................................................ E4.19 Communications ................................................................................................................................ E4.19
Long-Term Activities .............................................................................................................................. E4.21
Enhancing Monitoring and Analytical Methods................................................................................. E4.21 Source Water Protection Management Approaches ......................................................................... E4.21
Appendices Appendix A Cyanotoxin Management Flowchart .................................................................................. E4.22
Appendix B Contacts and Stakeholder Information .............................................................................. E4.23
Appendix C Notifying the Public of Cyanotoxins in their Water ............................................................ E4.24
Appendix D Ohio State Monitoring Requirements ................................................................................ E4.27
Ottawa County Regional Water System Cyanotoxin Management Plan – Executive Summary E4.4
Executive Summary Ottawa County Regional Water System (OCRWS), with the support of the State of Ohio and the United States Environmental Protection Agency (USEPA), has developed this Cyanotoxins Management Plan (CMP) to prepare for and mitigate risks from harmful algal blooms (HABs) and cyanotoxins occurring in Lake Erie and the Portage River in order to protect public drinking water from cyanotoxin contamination. This document provides steps and establishes activities to prepare for and identify a potential HAB occurrence, make treatment and operational adjustments to remove cyanotoxins from the water, provide timely information and (as appropriate) an advisory to the water system’s customers, and document information about occurrences of HABs so that information can be used to minimize the effect of HABs on the water system in the future. This plan also contains possible future activities the utility could engage in to mitigate the risks from HABs and cyanotoxins, such as long-term source water protection activities.
The steps outlined in this CMP include:
Step 1: Assess Source Water Step 2: Preparation, Monitoring for Early Warning Signs and Immediate Actions Step 3: Raw Water Cyanotoxin Monitoring and Treatment Adjustments Step 4: Finished Water Cyanotoxin Monitoring and Treatment Adjustments Step 5: Continued Finished Water Cyanotoxin Monitoring, Treatment Adjustments and Public Communication
In addition to the five steps above long-term activities are also discussed to enhance the utility’s ability to prevent, mitigate and manage the risks from cyanotoxin occurrence in source and finished waters.

Ottawa County Regional Water System Cyanotoxin Management Plan – Overview E4.5
Ottawa County Regional Water System Overview The Ottawa County Regional Water System (OCRWS) serves approximately 25,000 customers with water collected from intakes on Lake Erie and the Portage River. The treatment plant is designed to treat nine million gallons of water per day (MGD), but can be expanded to 18 MGD at the present site. The water serves, in part, seven townships in Ottawa County: Danbury, Catawba Island, Erie, Salem, Portage, Harris and Bay, as well as the City of Port Clinton and the Village of Oak Harbor. The system has three 500,000 gallon finished water storage tanks. Altogether, these tanks have approximately 12 to 20 hours of finished water storage. OCRWS has one pressure zone.
Source Water OCRWS has two intakes: the Lake Erie intake and the Portage River intake. The Portage River intake (emergency intake) is used primarily when ice is beginning to form on Lake Erie and the water at the lake’s intake is temporarily restricted due to frazil ice. The Portage River intake is near the mouth of Lake Erie. The Lake Erie intake is their primary intake. Water entering the two intakes is piped into the raw water wetwell.
Treatment Process A schematic of OCRWS’ treatment is provided below. The OCRWS plant is a conventional plant consisting of the following treatment steps:
• Permanganate Addition: Raw water entering the pump house is fed sodium permanganate after the sampling well. The sodium permanganate is in contact with the water a significant distance from the pump house to the treatment plant (9800 feet of a 24-inch diameter pipe). The raw water entering the plant maintains a permanganate residual of 0.3 mg/L. However, OCRWS plant is considering lowering this residual level if algal cells are being lysed.
• Pre-treatment Basins: Once water reaches the treatment plant, it enters one of four pre-treatment basins. Powdered activated carbon (PAC) or chlorine can be fed directly into the pre-treatment basins.
• Coagulation, PAC and Rapid Mix: Water leaves the pre-treatment basins and passes through one of two rapid mix basins, where aluminum chloro-hydrate (ACH) and PAC are added and thoroughly mixed with the water.
• Clarification: Once the ACH and PAC have been added and thoroughly mixed with the water, the water flows into one of three upflow solids contact type clarifier, where a sludge blanket removes particles and some organic matter.
• Filtration: Water is then filtered by one of eight cluster type dual media sand filters.
• Disinfection, Corrosion Control and Fluoridation: After filtration, chlorine, caustic soda and fluoride are added to the water before it enters one of two clearwells. The water pH entering the clearwells is typically approximately 7.7 – 7.9, but can be as high as 8.2.
• Disinfection CT: Water leaves the clearwells after it has achieved sufficient disinfection CT and enters the distribution system. Water leaving the clearwell is considered the entry point to the distribution system (EPTDS).
Routine Water Quality Monitoring A well in the pump house contains a sonde that measures turbidity, pH, phycocyanin and chlorophyll-a. Total organic carbon (TOC), alkalinity, total microcystins and Cryptosporidium are also sampled at this

Ottawa County Regional Water System Cyanotoxin Management Plan – Overview E4.6
location and samples are collected for phytoplankton identification. The raw water alkalinity is around 100 mg/L as CaCO3 and Disinfection Byproducts (DBPs) are not a compliance problem. Operators check the Langelier Index at the clearwell and the elevated water storage tanks when they conduct DBP monitoring. A summary of routine raw water quality monitoring is provided in Table 1 below.
Beginning in June 2016, OCRWS was required to start monitoring raw water total microcystins weekly in order to comply with Ohio EPA’s new cyanotoxin regulation. Table 2 summarizes the total microcystins monitoring schedule for complying with this new regulation. Prior to the regulation taking effect, OCRWS voluntarily sampled for microcystins weekly during the summer Lake Erie Microcystis bloom season. The current lab analyzing total microcystins samples for Ottawa County is the Oregon Water Treatment Plant (WTP) with the Toledo WTP serving as a backup lab. OCRWS also begins monitoring if the water temperature reaches 20 degrees Celsius. After collecting samples, they look at the water through a microscope on site to identify the algae and cyanobacteria and to determine whether or not growth is heavy (i.e., if algae/cyanobacteria are covering the plate). This assessment is conducted with lake water once a week and with raw water samples collected from the intake twice a week. OCRWS operators use an algae binder with information from past algae and cyanobacterial events to document what they see. They take photographs and fill out a phytoplankton identification form formerly known as the “Sandusky Form.”
Every morning, OCRWS reviews satellite data1 and predicted bloom movement and watches the color near the intakes. This system works well on clear days; however, when the weather is overcast it is difficult to make observations.
Table 1. Routine Raw Water Quality Monitoring
Parameter Location Frequency Who Collects Sample?
Who Does Analysis?
Turbidity Raw Water Pump Daily Sonde N/A pH Raw Water Pump
Phycocyanin Raw Water Pump Chlorophyll-a Raw Water Pump Microcystins Weekly* Operators Lab
TOC Monthly Operators Lab Alkalinity
Temperature Monthly
Daily Operators Plant
Plant Relative biomass Satellite coverage Daily Operators Operators interpret
*See table with (Table 2) Ohio’s Microcystins Monitoring Requirements
1 Produced from the National Oceanic and Atmospheric Administration (NOAA’s) National Centers for Coastal Ocean Science Great Lakes Environmental Research Laboratory, the National Weather Service, and the Cleveland Center for Operational Oceanographic Products and Service as part of an Experimental Lake Erie Harmful Algal Bloom Bulletin.

Ottawa County Regional Water System Cyanotoxin Management Plan – Overview E4.7
Table 2. Ohio Microcystins Monitoring Requirements
Location Analysis1 During Which Months?
Monitoring Category
Frequency2
Raw Water Cyanobacteria/cyanotoxin genetic screening (qPCR for 16S, mycF, sxtA and cyrA genes)
Year-Round Routine Once every 2 weeks (at the same time as routine microcystins sample)
Raw and Finished Water
Total Microcystins May 1st – October 31st
Routine Weekly
Raw and Finished Water
Total Microcystins November 1st – April 30th
Routine Weekly unless not detected in at least 2 consecutive weekly samples from both raw and finished water sampling points. Then frequency is reduced to one sample from each raw water sampling point at least once every 2 weeks.
Raw and Finished Water
Total Microcystins November 1st – April 30th
Routine if there is a detection
If detected at raw water sampling point, weekly monitoring at raw and finished water sampling points will begin no later than 24 hours following detection.3
Raw and Finished Water
Total Microcystins Year-Round Increased Routine (3 days a week)
3 days a week, beginning no later than the following week, if microcystins exceed 5 µg/L at raw water sampling point.3
Raw and Finished Water
Total Microcystins Year-Round Increased Routine (Daily)
Daily, if microcystins detected at finished water sampling point. Daily monitoring will include analysis within 24 hours of sample collection.3
1 Total microcystins measured by the Ohio EPA Total (Extracellular and Intracellular) Microcystins – Adda by ELISA Analytical Methodology. 2See Ohio EPA’s regulation in Appendix D for details about what monitoring is required if monitoring results exceed the action level. 3See Ohio EPA’s regulation in Appendix D for details about how to return to routine monitoring.
In addition, Lake Erie water monitoring occurs through a variety of sources which provide their findings to OCRWS, including:
• Ohio EPA’s NW District HAB Coordinator serves as a primary point person and actively contacts water utilities if she sees or hears of blooms.
• Jet Express, a boating operation nearby notifies OCRWS of impending blooms when their captain sees blooms near the lake intake.

Ottawa County Regional Water System Cyanotoxin Management Plan – Overview E4.8
• A local marina contacts OCRWS if they see a bloom.
• The Ottawa County Health Department monitors some beaches for HAB events.
• There is also a mechanism for citizen observation and reporting using a state procedure and form.
• The Sanitary Engineer Association of Ohio is a county-organized entity that serves as a vehicle for information exchange, but is not a key participant in water quality monitoring.
Cyanotoxin Management Plan OCRWS developed this Cyanotoxins Management Plan (CMP) detailed in the steps below. This CMP provides for actions to prepare for and mitigate risks from harmful algal blooms (HABs) and cyanotoxins occurring in Lake Erie in order to protect public drinking water from cyanotoxin contamination. The plan includes immediate steps discussing monitoring and treatment should HABs and cyanotoxins occur as well as long-term steps the system can engage in to protect source waters and to fully evaluate treatment capabilities. A detailed flowchart of the CMP can be found in Appendix A.

Ottawa County Regional Water System Cyanotoxin Management Plan – Overview E4.9
Figure 1. Schematic Diagram of the Treatment System

Ottawa County Regional Water System Cyanotoxin Management Plan – Step 1 E4.10
Step 1: Assess Source Water 1.1 Identify Source Water Protection Areas Map 1 below from the USEPA Drinking Water Application to Protect Source Waters (DWMAPS) tool shows western Lake Erie, the primary source water for OCRWS. Map 1 also displays several waters that are impaired for nutrients draining into Lake Erie near Port Clinton.
Map 1. Source water protection area with impaired waters for nutrients, Ottawa County
1.2 Create Inventory of HABs Risk Factors 1.2.1 Source Water Characteristics Many of the streams draining to Lake Erie near Port Clinton have been assessed for attainment of surface water quality standards under Section 305(b) of the Clean Water Act (CWA). Based on these assessments, many have been listed as impaired streams due to nutrient-related (phosphorus and nitrogen) issues, under Section 303(d) of the CWA. Multiple Total Maximum Daily Load (TMDL) in the region have been developed in response to the impairment listings. The TMDL defines targets for nutrient loading to Lake Erie and outlines strategies for reducing nutrient loading, which will ultimately reduce algal and cyanobacterial growth. The western Lake Erie basin shoreline assessment unit is also currently listed as impaired for the public drinking water supply use due to algae impacts (the state uses cyanotoxin indicators of algae impairment).
One source of funding for implementing the TMDL is the CWA nonpoint source program (Section 319) grant funds. An approximately $250,000 Section 319 grant project was initiated in 2014 to increase the use of cover crops, improve agricultural drainage systems, develop nutrient management plans and increase the use of conservation tillage in the Portage River watershed to reduce nutrient loading to the river. Additionally, Ohio has a statewide program, the Ohio Balanced Growth Program, that aims to link land-use

Ottawa County Regional Water System Cyanotoxin Management Plan – Step 1 E4.11
planning to the health of Lake Erie, the Ohio River and Ohio’s other watersheds and drinking water source areas.
Land Use Map 2 shows the land uses within the Portage River watershed and Lake Erie watershed near the OCRWS intake.
Map 2. Lake Erie and Portage River Watersheds near OCRWS and their Land Uses (http://www.epa.ohio.gov/portals/35/tmdl/Portage_Report_Final.pdf ).
1.2.2 Water Quality Parameters Historical Cyanobacteria and Cyanotoxin Events in Source Water OCRWS’ primary source of water is western Lake Erie, which has a well-documented history of yearly cyanobacterial blooms during the warm summer months that produce elevated levels of microcystins. A review of OCRWS’ 2014 and 2015 microcystins monitoring results showed that microcystins were detected on several occasions at the lake’s intake in the summer, with concentrations highest in mid-late August and detections continuing through September. The highest 2015 microcystins concentration measured was 12.1 µg/L microcystins on July 7th at the OCRWS intake.
Nutrients Phosphorus and nitrogen are drivers of algal and cyanobacterial growth in lakes and reservoirs. Sources of phosphorus and nitrogen can include discharge of domestic and industrial wastewater, septic systems and runoff from agricultural and urban lands.
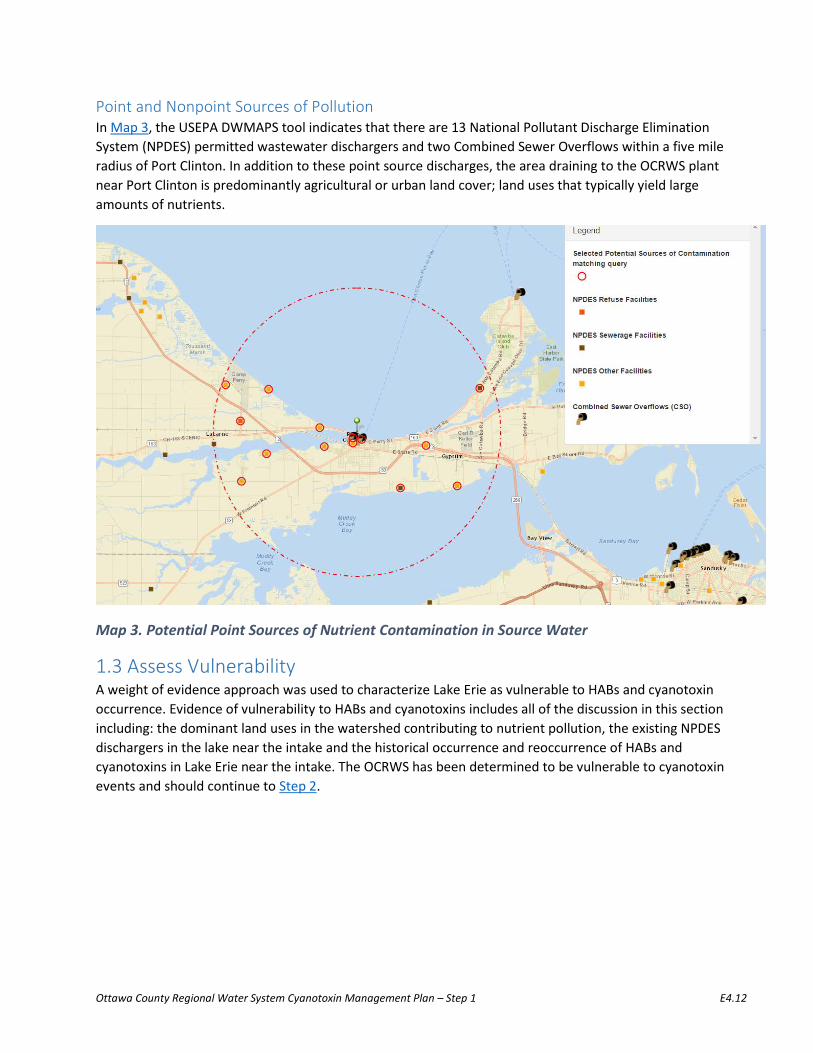
Ottawa County Regional Water System Cyanotoxin Management Plan – Step 1 E4.12
Point and Nonpoint Sources of Pollution In Map 3, the USEPA DWMAPS tool indicates that there are 13 National Pollutant Discharge Elimination System (NPDES) permitted wastewater dischargers and two Combined Sewer Overflows within a five mile radius of Port Clinton. In addition to these point source discharges, the area draining to the OCRWS plant near Port Clinton is predominantly agricultural or urban land cover; land uses that typically yield large amounts of nutrients.
Map 3. Potential Point Sources of Nutrient Contamination in Source Water
1.3 Assess Vulnerability A weight of evidence approach was used to characterize Lake Erie as vulnerable to HABs and cyanotoxin occurrence. Evidence of vulnerability to HABs and cyanotoxins includes all of the discussion in this section including: the dominant land uses in the watershed contributing to nutrient pollution, the existing NPDES dischargers in the lake near the intake and the historical occurrence and reoccurrence of HABs and cyanotoxins in Lake Erie near the intake. The OCRWS has been determined to be vulnerable to cyanotoxin events and should continue to Step 2.

Ottawa County Regional Water System Cyanotoxin Management Plan – Step 2 E4.13
Step 2: Preparation, Monitoring for Early Warning Signs and Immediate Actions 2.1 Preparation OCRWS determined that its source water is vulnerable to cyanobacterial blooms; the next step is to prepare for cyanobacterial blooms and cyanotoxin occurrence. Preparation includes preparing for monitoring raw and finished waters, preparing for treatment adjustments and establishing communication plans.
Prepare Staff and Equipment for Monitoring OCRWS will carry out the following activities in order to be prepared for the monitoring steps described in this plan:
• Train operators on identifying elevated blue-green algae (rfu) and pH levels from sonde.
• Keep monitoring equipment properly calibrated, calibrate sonde two times per year.
• Ensure that the procedure for submitting total microcystins samples to the laboratory complies with all of the Ohio EPA’s regulation for sampling, analytical and reporting methods.
• Have coolers, chain of custody forms and shipping labels on site and ready for use.
• Ensure that the appropriate bottles (glass or PETG) are onsite for sampling.
• Also have sodium thiosulfate available for quenching any samples that have been exposed to an oxidant as soon as they are collected.
• Document all sampling, testing and quality assurance procedures.
Prepare for Treatment Adjustments OCRWS will carry out the following activities in order to be more prepared to treat its source water during a HAB:
• Prepare and finalize a Treatment Optimization Protocol for OCRWS (Treatment Optimization Protocol is a requirement by the Ohio Environmental Protection Agency for systems with microcystins in their source water).
• Educate all operators about the treatment barriers in the optimization protocol, actions that need to be carried out to ensure those barriers are optimized and effective and conditions that indicate the need for treatment and operational adjustments.
• Based on existing literature, estimate chlorine CT conditions that the treatment plant could meet that could help provide protection from finished water microcystins detections.
• Based on existing literature and results of a recent Comprehensive Performance Evaluation for cyanotoxins, estimate appropriate PAC dosage to be used under varying raw water microcystins concentrations, to help provide protection from finished water microcystins detections.
• Conduct jar testing during HABs to help optimize coagulant dose, potassium permanganate feed rate and carbon feed rate for microcystins removal.

Ottawa County Regional Water System Cyanotoxin Management Plan – Step 2 E4.14
Communications Establish Communication Plan with other Source Water Users Several plants share the same western basin of Lake Erie source water. Water system personnel from these systems frequently communicate through phone calls, emails and text. Additionally, the OCRWS has an interconnection with Carroll Township, and they may provide a maximum amount of 100,000 gallons per day. Typically, OCRWS can serve Carroll Township more water than Carroll Township serves OCRWS. The Lake Erie Water Plant Group allows the lake’s water users to communicate with one another. The group consists of about 20 communities and meets quarterly. Officers are elected to run the group. In addition to facilitating communication within members, the group also works with Ohio AWWA.
OCRWS will carry out the following activities in order to be more prepared for the communications steps described in this plan:
• Complete a stakeholders list (Appendix B) and reevaluate the list on a recurring basis to maintain an up-to-date list.
• Review the public advisory language in OCRWS’ Emergency Response Plan and update it so it is consistent with the Health Effects language in Ohio’s regulation. Ensure that the Emergency Response Plan’s actions in response to total microcystins detections are also consistent with the requirements in Ohio’s regulation.
• Add the language that is required by Ohio’s regulation to OCRWS’ consumer confidence report template, if appropriate.
• Prepare a public health advisory template that is available and ready for use if necessary. Also prepare another notice that would be issued to lift an existing public health advisory. Develop a public health advisory and procedure that is consistent with Tier 1 Public Notification requirements and the other requirements of Ohio’s regulation (see Appendix C of this plan). Explanations of when a public health advisory will be issued or lifted are provided in Step 5 of this plan.
• Coordinate with other monitoring agencies on how to receive information about early warning signs.
2.2 Monitoring the Early Warning Signs Based on historical bloom occurrence in western Lake Erie, OCRWS operators begin looking for signs of blooms in the early summer months. This section identifies early warning signs that the operators can look for during the system’s normal operation.
Early Indicators of a Cyanobacterial Bloom • When the OCRWS’s raw water temperature reaches 22 degrees Celsius, operators watch the
National Oceanic and Atmospheric Administration-produced satellite views for evidence of HABs (depicted as colored pixels on the maps).
• Operators check the Lake Erie water current data and monitor the sonde data daily for any indications of a bloom, including increases in:
o pH
o Phycocyanin

Ottawa County Regional Water System Cyanotoxin Management Plan – Step 2 E4.15
o Chlorophyll-a
• Operators have identified several early warning signs that a cyanobacterial bloom is likely to occur in the very near future (or has begun to occur). The following early warning signs are a combination of observations of conditions in the lake itself and in the treatment plant:
o Visual presence of scums and discoloration of source water near the intake
o Odor events
o Increased raw water pH
o Increased chlorine demand in the clearwell o Increased temperature
o Increased turbidity from the clarifier effluent
o Shorter filter runs
o Filters blind off (clogging) o Visual observations of changes in the upflow clarifiers
o Upflow clarifier sludge color and odor
o Increased sodium permanganate demand
• View the sonde data of other neighboring plants.
• Open communication about water quality and potential blooms with the below organizations or groups that also use and study Lake Erie:
o Ohio EPA’s NW District HAB Coordinator
o Jet Express o A local marina
o The Ottawa County Health Department
o Citizen science monitoring
o Neighboring water operators
2.3 Immediate Actions if Bloom is Suspected Monitoring Actions in Response to Early Warning Signs
• If a bloom is suspected or when routine raw water monitoring is required continue to Step 3 (see Appendix D for monitoring requirements).
Treatment Adjustments in Response to Early Warning Signs • Perform jar testing to optimize the coagulant dose by measuring turbidity, UV 254 and visual
observations of settling and particle removal.
• Optimizing the removal of intact cyanobacterial cells is an extremely important treatment step for controlling microcystins in the finished water.
• Visually monitor all plant operations to make sure all equipment is functioning as designed and chemicals are being dosed at the optimum amount to provide the best treatment.
• Optimal chemical doses and equipment settings are provided in the Treatment Optimization Protocol.

Ottawa County Regional Water System Cyanotoxin Management Plan – Step 2 E4.16
Communication Actions in Response to Early Warning Signs • Contact neighboring water operators and ask them about their water quality and if they
have seen early indicators of a cyanobacterial bloom/cyanotoxin event. Communicate to neighboring operators about the potential for a bloom.

Ottawa County Regional Water System Cyanotoxin Management Plan – Step 3 E4.17
Step 3: Raw Water Cyanotoxin Monitoring and Treatment Adjustments If a cyanobacterial bloom or its indicators are observed during Step 2, the OCRWS plans to begin analyzing samples in raw water for total microcystins as soon as possible in addition to the required raw monitoring. If monitoring results indicate the presence of cyanotoxins in the raw water OCRWS continues to Step 4. Follow-up sampling will take place within 24 hours after the first detection of cyanotoxins in the raw water.
OCRWS will communicate with its stakeholders and adjust its treatment or operations based on raw water monitoring cyanotoxin results, as described in this section.
Monitoring if Cyanobacteria are Identified or Suspected In addition to routine water monitoring required by Ohio EPA, collect raw water samples in the raw water wetwell (including a quenching agent as needed) as soon as possible after early warning signs of cyanobacteria are present, and send them to the laboratory for total microcystins analysis.
Operational Adjustments Based on Source Water Cyanotoxin Measurements If potential toxin-producing cyanobacteria are identified in the source water sample(s) (through cell identification) then:
• Potentially lower the permanganate dose in the pump station to achieve a residual level of less than 0.3 mg/L entering the plant (to avoid cell lysing).
• Increase the PAC dose to at least 10 mg/L in the rapid mix and contact management for further instructions. Lower the sludge level in the clarifier.
• Add a filter aid to the water entering the filters. Shorten filter runs for more frequent backwashing. Lower the caustic soda dose to decrease the pH below 8.0, preferably 7.6-7.7.
• Potentially increase the chlorine residual level in the clearwells to 2.2-2.3 mg/L in plant tap. Adjust clearwells to an elevated level to achieve the maximum contact time with the free chlorine.
Communications Based on Source Water Cyanotoxin Measurements Every raw sample and finished result goes to OCRWS and to the Ottawa County Emergency Management Agency (EMA), who has a distribution list for making further notifications. Additional communications based on the raw water microcystins results are explained in the OCRWS’ Emergency Response Plan. The Emergency Response Plan contact list includes elected officials, large customers, schools, nursing homes, hospitals, etc.

Ottawa County Regional Water System Cyanotoxin Management Plan – Step 4 E4.18
Step 4: Finished Water Cyanotoxin Monitoring and Treatment Adjustments Detecting and positively confirming cyanotoxins in the finished water indicates that cyanotoxins have broken through the treatment barriers. If cyanotoxins are detected in the finished water, OCRWS will move to continued finished water monitoring in Step 5.
Finished Water Microcystins Monitoring OCRWS continues to follow the monitoring requirements provided in Ohio’s regulation section (A)(2)(d), also included in Appendix D. A general description of those regulations follows: Ohio’s requirement in Chapter 3745-90 (Harmful Algal Blooms) of the Administrative Code establishes monitoring requirements for public water systems using surface water including routine weekly source and finished water monitoring for microcystins from May 1 to October 31. Routine microcystins monitoring drops to biweekly source water monitoring from November 1 through April 30 (microcystins detections will determine the need for increased monitoring). If microcystins levels greater than 5 μg/L are found in the raw water, the public water system must increase monitoring to three days a week.
Section A(2)(d) of Ohio’s regulation requires the frequency of monitoring at both raw water sampling points and finished water sampling points to be increased to daily if microcystins are detected at finished water sampling points. Daily monitoring shall include analysis within twenty-four hours of sample collection.
Consider conducting total and extracellular microcystins treatment train sampling to determine microcystins removal through each treatment unit process. Ohio EPA is available for support on this sampling in response to finished water detects. This information can be used to further optimize microcystins treatment. This should also be considered if raw water concentrations exceed 5 µg/L (but no finished water detections).
Treatment Continue to take the operational steps identified in Step 3 and follow the Treatment Optimization Protocol developed to meet the Ohio EPA’s requirement.
Communications OCRWS will carry out the following communications as soon as possible if cyanotoxins are detected in finished water:
• The HAB coordinator will notify local authorities, including Ottawa County Commissioners, City of Port Clinton, Village of Oak Harbor, Ottawa County EMA, Ottawa County Health Department, Ottawa County Sheriff’s Department, Ohio EPA, local hospitals, nursing homes, schools, large customers, news agencies and others.

Ottawa County Regional Water System Cyanotoxin Management Plan – Step 5 E4.19
Step 5: Continued Finished Water Cyanotoxin Monitoring, Treatment Adjustments and Public Communication Step 5 contains communication actions, treatment actions and additional monitoring that should be carried out based on the concentrations of cyanotoxins confirmed in the finished water. This fifth step enables the OCRWS to act quickly if cyanotoxins are confirmed in the finished water.
Continued Finished Water Microcystins Monitoring • Continue finished water microcystins monitoring according to the requirements in Ohio’s
regulation (see Appendix D of this plan). Ensure that requirements under Section (A)(4) (4) Response to Microcystins Action Level Exceedance are fully met, if applicable.
• Once the microcystins event appears to have been resolved (i.e. no toxin detects in raw or finished water with lab based methods, no visual blooms), OCRWS will continue monitoring for early warning signs (return to Step 2).
Treatment and Operations • The water departments in Ottawa County, Port Clinton and Oak Harbor may isolate one of
their elevated storage tanks and have the water in those tanks analyzed for microcystins. Any tank that tests at or below 1.6 μg/L for microcystins will remain isolated and will be used for the distribution of safe drinking water for the citizens (for individuals older than 6-years) into containers, in conjunction with several other sites. It must be noted that, if any of the overhead storage tanks test above 1.6 μg/L for microcystins, that tank will not be used as a drinking water distribution point.
• Local and state agencies will coordinate with Ottawa County EMA, local water haulers, the National Guard, local volunteers, etc. to set up water distribution locations for Ottawa County customers at the Ottawa County Fairgrounds, Erie/Ottawa County Airport, Camp Perry and the Danbury Township Waste Water Treatment Plant. The State of Ohio EMA and local American Red Cross will be contacted to help provide bottled water in the event of a toxin problem lasting more than a day. Ottawa County Commissioners may impose water restrictions on water consumption, if needed.
• In the event of any cyanotoxin detection in the plant tap, the water plant will review all treatment plant operations to make sure they are performing well in removing microcystins during the treatment process. The OCRWS water system has alternative sources of potable water from Carroll Township and the Village of Marblehead, but the quantity of water is very limited. If OCRWS exceeds the limit for microcystins and Carroll Township water does not, the interconnection will be opened from Carroll Township to provide water to customers along Lakeshore Drive to the Portage River.
Communications • OCRWS will immediately notify Ohio EPA of any finished water microcystins detection.

Ottawa County Regional Water System Cyanotoxin Management Plan – Step 5 E4.20
• OCRWS will notify the Safety Service Director for the City of Port Clinton and the Administrator of the Village of Oak Harbor to brief them on the situation. An emergency meeting will be convened by the Ottawa County Commissioners, Ottawa County EMA and the Ottawa County Health Department to discuss current water quality and to see if any further actions may be warranted. The Ottawa County Sanitary Engineer, Ottawa County EMA director, or another appointed representative will act as the spokesperson during any such HAB event.
• Ohio EPA’s regulation requires a public water system to issue Tier 1 public notification when a microcystins action level is exceeded in a repeat sample collected at the finished water sampling point, unless an exemption is granted by the Ohio EPA director based on extenuating circumstances or additional sampling results. OCRWS will make Tier 1 public notification according to Ohio EPA’s public notification requirements after the repeat (third) finished water detection above the action level. Public notification requirements are provided in Appendix C of this plan.

Ottawa County Regional Water System Cyanotoxin Management Plan – Long-Term Activities E4.21
Long-Term Activities Additional long-term activities can be undertaken by OCRWS to better understand treatment effectiveness, be aware of cyanotoxin challenges in addition to microcystin and engage in additional source water protection activities.
Enhancing Monitoring and Analytical Methods • Explore using phycocyanin and chlorophyll-a levels as indicators of microcystins. ELISA total
microcystins results have been found to generally correlate well with phycocyanin. In the long-term, OCRWS hopes to be able to identify phycocyanin levels that bracket a range of concern based on past total microcystins and phycocyanin values.
• Consider enhancing the lab testing and results in order to identify intracellular and extracellular fractions of the total microcystins measured in the water.
Source Water Protection Management Approaches Identify any ongoing monitoring, committees, government programs and other organized watershed management activities taking place related to western Lake Erie and the Portage River and how OCRWS could become more involved. Prioritize which of these may be the most helpful for furthering the specific interests of OCRWS and its neighboring water utilities.
The Ottawa County Water District could work with the Ohio Balanced Growth Program to identify roles it could play in TMDL implementation, or could contact county and state officials to identify an appropriate role, which may be in the form of an activity such as providing additional water quality monitoring.

Ottawa County Regional Water System Cyanotoxin Management Plan – Appendix A E4.22
Appendix A Cyanotoxin Management Flowchart

Ottawa County Regional Water System Cyanotoxin Management Plan – Appendix B E4.23
Appendix B Contacts and Stakeholder Information
Laboratory Contact Information Oregon Water Treatment Plant
Toledo Water Treatment Plant (backup lab)
Stakeholders Agency/Company Title Contact Name Contact Phone Contact Email OCWRS Cyanotoxins
Management Plan (CMP) Team Leader
OCWRS Source Water Protection Manager
OCWRS Treatment Operators
OCWRS Distribution Operators
Ottawa County City Sanitary Engineer
Ottawa County Water System Spokesperson
OCHD Ottawa County Health Department
Ohio Health Department
State Health Department Public Water System Contact
Ohio EPA Ohio EPA Northwest District
Ottawa County Ottawa County Emergency Management Director

Ottawa County Regional Water System Cyanotoxin Management Plan – Appendix C E4.24
Appendix C Notifying the Public of Cyanotoxins in their Water
Ohio public water systems have specific requirements for making public notification under certain water quality conditions. The Ohio requirements are provided here. In addition, the Ohio regulation requires public water systems to address microcystins detections in their Consumer Confidence Reports. Details related to that requirement, as well as the required Health Effects Language, are also provided here. Ohio EPA also provided Health Advisory templates.
3745-90-06 Harmful algal blooms – tier 1 public notification and consumer confidence reports.
This rule applies to all public water systems, including consecutive water systems.
(A) Tier 1 public notification.
(1) A public water system shall issue tier 1 public notification in accordance with rule 3745-81-32 of the Administrative Code when any of the following occur:
(a) A microcystins action level established paragraph (A)(1) or (A)(2) in rule 3745-90-02 of the Administrative Code is exceeded in a repeat sample collected at the finished water sampling point in accordance with rule 3745-90-03 of the Administrative Code, unless the director agrees in writing that the timeline for notification may be extended or public notification is not necessary, based on extenuating circumstances, until additional results are received.
(b) If required by the director based on the results of resamples, distribution system samples or daily samples collected in accordance with paragraph (A)(4), (B) or (C)(2) of rule 3745-90-03 of the Administrative Code.
(c) Failure to conduct resampling or repeat sampling in accordance with paragraph (A)(4)(a), (A)(4)(b), (C)(2)(a) or (C)(2)(b) of rule 3745-90-03 of the Administrative Code, unless the director agrees in writing that the timeline for notification may be extended or public notification is not necessary.
(2) The public notification shall include applicable content in accordance with paragraph (E) of rule 3745-81-32 of the Administrative Code, the action level exceeded and the standard health effects language in paragraph (C) of this rule.
(3) The director may allow the system to limit distribution of the public notice in accordance with paragraph (A)(2) of rule 3745-81-32 of the Administrative Code.

Ottawa County Regional Water System Cyanotoxin Management Plan – Appendix C E4.25
(4) Unless otherwise specified by the director based on public health and safety considerations, tier 1 public notification shall remain in effect until the following occur:
(a) Microcystins concentrations are below the action level in two consecutive samples collected a minimum of twenty-four hours apart at the finished water sampling point.
(b) Microcystins concentrations are below the action level in one set of samples collected at the distribution sampling points.
(B) Consumer confidence report.
Each community public water system which exceeds a microcystins action level established in paragraph (A)(1) or (A)(2) of rule 3745-90-02 of the Administrative Code in a sample collected at a finished water sampling point in a daily, resample or repeat sample, or a distribution sampling point collected within their own community water system in accordance with rule 3745-90-03 of the Administrative Code shall include the following in the consumer confidence report required by Chapter 3745-96 of the Administrative Code:
(1) The microcystins action level.
(2) The range of levels detected and highest single measurement of microcystins concentration in samples collected at finished water sampling points and distribution sampling points.
(3) Information regarding the major source of the contaminant: "Produced by some naturally occurring cyanobacteria, also known as blue-green algae, which under certain conditions (i.e., high nutrient concentration and high light intensity) may produce microcystins."
(4) Standard health effects language in paragraph C) of this rule.
(C) Standard health effects language.
The following standard health effects language shall be used in public notification and consumer confidence reports: "Consuming water containing concentrations of microcystins over the action level may result in abnormal liver function, diarrhea, vomiting, nausea, numbness or dizziness. Children younger than school age, pregnant women, nursing mothers, the elderly, immune-compromised individuals, those with pre-existing liver conditions and those receiving dialysis treatment may be more susceptible than the general population to the health effects of microcystins."
Effective: 06/01/2016 Five Year Review (FYR) Dates: 06/01/2021

Ottawa County Regional Water System Cyanotoxin Management Plan – Appendix C E4.26
Promulgated Under: 119.03 Statutory Authority: 3745.50, 6109.04 Rule Amplifies: 3745.50, 6109.04

Ottawa County Regional Water System Cyanotoxin Management Plan – Appendix D E4.27
Appendix D Ohio State Monitoring Requirements
3745-90-03 Harmful algal blooms - monitoring.
This rule applies to all surface water–systems and consecutive water systems receiving water from a surface water source. Seasonal systems shall monitor in accordance with this rule during the system's operating season.
(A) Surface water systems.
(1) ’yanobacteria screening.
Surface water systems shall monitor with a minimum of one sample from each raw water sampling point at least once every two weeks for cyanobacteria screening. Cyanobacteria samples shall be collected at the same time as the routine microcystins sample.
(2) Routine microcystins monitoring.
(a) Routine microcystins monitoring requirements between May first and October thirty-first.
Surface water systems shall monitor with a minimum of one sample from each raw water sampling point and one sample from each finished water sampling point at least weekly for microcystins analysis.
(b) Routine microcystins monitoring requirements between November first and April thirtieth.
(i) Surface water systems shall continue to monitor in accordance with paragraph (A)(2)(a) of this rule unless microcystins are not detected in at least two consecutive weekly samples from both the raw water sampling point and the finished water sampling point, then the microcystins monitoring frequency is reduced to a minimum of one sample from each raw water sampling point at least once every two weeks.
(ii) If microcystins are detected at a raw water sampling point, weekly monitoring at that raw water sampling point and the finished water sampling point shall be conducted beginning no later than twenty-four hours following the detection. When microcystins are not detected in at least two consecutive weekly samples from both the raw water sampling point and the finished water sampling point, then monitoring once every two weeks may resume in accordance with paragraph (A)(2)(b)(i) of this rule.

Ottawa County Regional Water System Cyanotoxin Management Plan – Appendix D E4.28
(c) Increased routine microcystin monitoring (three days per week).
The frequency of monitoring at both raw water sampling points and finished water sampling points shall be increased to three days a week, beginning no later than the following week, if microcystins exceed five micrograms per liter (ug/L) at the raw water sampling point, unless an alternate frequency has been established as part of the approved cyanotoxin general plan in accordance with rule 3745-90-05 of the Administrative Code.
Routine monitoring in accordance with paragraphs (A)(2)(a) and (A)(2)(b) of this rule may resume once the following occur:
(i) Microcystins concentrations are equal to or less than five ug/L in two consecutive samples from the raw water sampling point that are collected at least one day apart.
(ii) Microcystins concentration is non-detect at finished water sampling points.
(iii) If samples were collected at distribution sampling points in accordance with this rule, microcystins are not detected at any distribution sampling point.
(d) Increased routine microcystins monitoring (daily).
The frequency of monitoring at both raw water sampling points and finished water sampling points shall be increased to daily if microcystins are detected at finished water sampling points collected in accordance with this rule, or distribution sampling points collected in accordance with this rule. Daily monitoring shall include analysis within twenty-four hours of sample collection.
Routine monitoring may resume in accordance with paragraphs (A)(2)(a) and (A)(2)(b) of this rule if the two most recent consecutive daily samples from the raw water sampling point are equal to or less than five ug/L, or in accordance with paragraph (A)(2)(c) of this rule if either of the two most recent consecutive daily samples from the raw water sampling point are greater than five ug/L, once the following occur:
(i) Microcystins are not detected in two consecutive daily samples collected at the finished water sampling point.
(ii) If samples were collected at distribution sampling points in accordance with this rule, microcystins are below the action level at distribution sampling points.

Ottawa County Regional Water System Cyanotoxin Management Plan – Appendix D E4.29
(3) Revised cyanobacteria screening or routine microcystins monitoring frequency.
The cyanobacteria screening or routine microcystins monitoring frequency may be revised (decreased, increased or discontinued) at the discretion of the director. When establishing the revised schedule, the director may consider cyanobacteria screening data collected in accordance with this rule, microcystins data, and other information provided by the public water system including data from other screening tools (such as phycocyanin sensors or phytoplankton enumeration) and treatment information. Surface water systems shall monitor in accordance with the revised cyanobacteria screening or routine microcystins monitoring schedule established by the director.
(4) Response to microcystins action level exceedance.
If microcystins exceed an action level established in paragraph (A)(1) or (A)(2) of rule 3745-90-02 of the Administrative Code in routine samples collected at the finished water sampling point, the public water system shall do the following:
(a) As soon as possible, but no later than twenty-four hours after receiving the results of the initial action level exceedance, collect one resample from each raw water sampling point and one resample from each finished water sampling point. Analysis of resamples must be completed within twenty-four hours of collection. These resamples satisfy the requirement for daily samples as set forth in paragraph (A)(2)(d) of this rule.
(b) Within twenty-four hours of collecting the resamples, collect one repeat sample from each raw water sampling point and one repeat sample from each finished water sampling point. Analysis of repeat samples must be completed within twenty-four hours of collection. These repeat samples satisfy the requirement for daily samples as set forth in paragraph (A)(2)(d) of this rule.
(c) If the microcystins concentration exceeds the action level in the resample or repeat sample collected at any finished water sampling point in accordance with paragraph (A)(4)(a) or (A)(4)(b) of this rule, as soon as practical but no later than three hours after receiving the resample or repeat sample results, the surface water system shall notify all consecutive systems served by the water system. The surface water system with the action level exceedance, and all consecutive water systems served by the water system, shall within twenty-four hours of receiving the resample or repeat sample results, collect samples at representative distribution sampling points in accordance with the contingency plan required by rule 3745-85-01 of the Administrative Code. Additional distribution system monitoring may be required by the director based on sampling results and other relevant circumstances. Analysis of distribution samples must be completed within twenty-four hours of collection.
(d) Conduct routine daily monitoring in accordance with paragraph (A)(2)(d) of this rule.
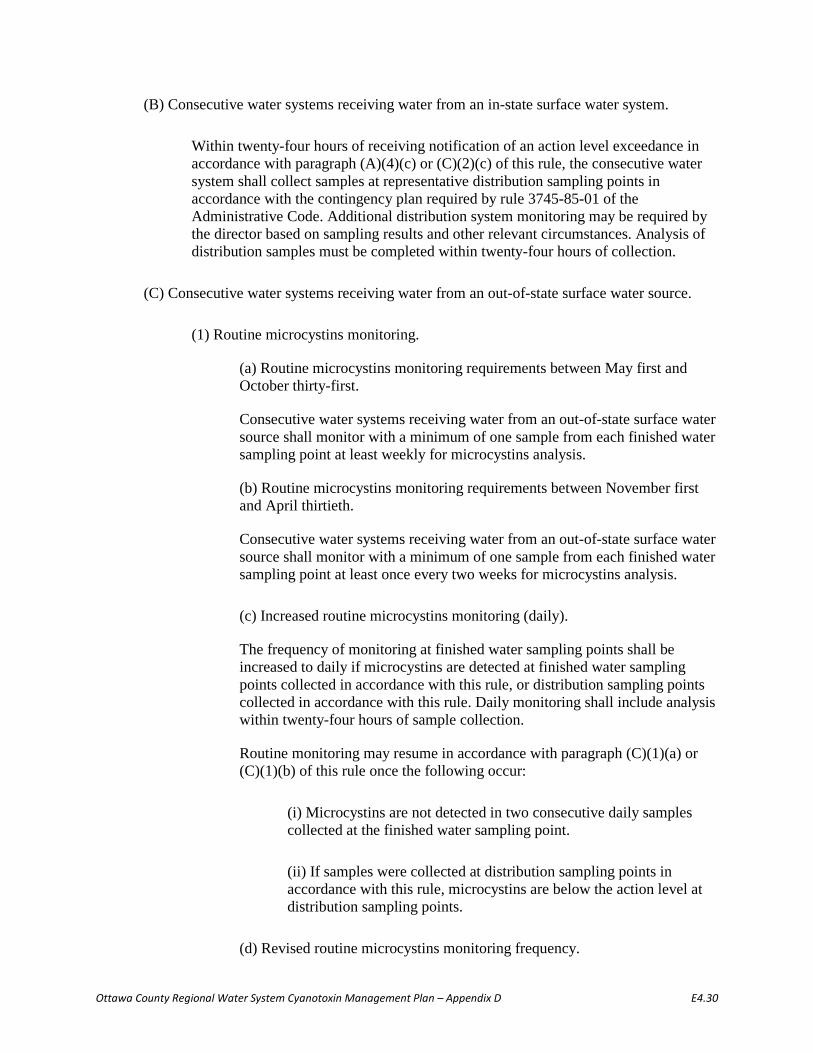
Ottawa County Regional Water System Cyanotoxin Management Plan – Appendix D E4.30
(B) Consecutive water systems receiving water from an in-state surface water system.
Within twenty-four hours of receiving notification of an action level exceedance in accordance with paragraph (A)(4)(c) or (C)(2)(c) of this rule, the consecutive water system shall collect samples at representative distribution sampling points in accordance with the contingency plan required by rule 3745-85-01 of the Administrative Code. Additional distribution system monitoring may be required by the director based on sampling results and other relevant circumstances. Analysis of distribution samples must be completed within twenty-four hours of collection.
(C) Consecutive water systems receiving water from an out-of-state surface water source.
(1) Routine microcystins monitoring.
(a) Routine microcystins monitoring requirements between May first and October thirty-first.
Consecutive water systems receiving water from an out-of-state surface water source shall monitor with a minimum of one sample from each finished water sampling point at least weekly for microcystins analysis.
(b) Routine microcystins monitoring requirements between November first and April thirtieth.
Consecutive water systems receiving water from an out-of-state surface water source shall monitor with a minimum of one sample from each finished water sampling point at least once every two weeks for microcystins analysis.
(c) Increased routine microcystins monitoring (daily).
The frequency of monitoring at finished water sampling points shall be increased to daily if microcystins are detected at finished water sampling points collected in accordance with this rule, or distribution sampling points collected in accordance with this rule. Daily monitoring shall include analysis within twenty-four hours of sample collection.
Routine monitoring may resume in accordance with paragraph (C)(1)(a) or (C)(1)(b) of this rule once the following occur:
(i) Microcystins are not detected in two consecutive daily samples collected at the finished water sampling point.
(ii) If samples were collected at distribution sampling points in accordance with this rule, microcystins are below the action level at distribution sampling points.
(d) Revised routine microcystins monitoring frequency.
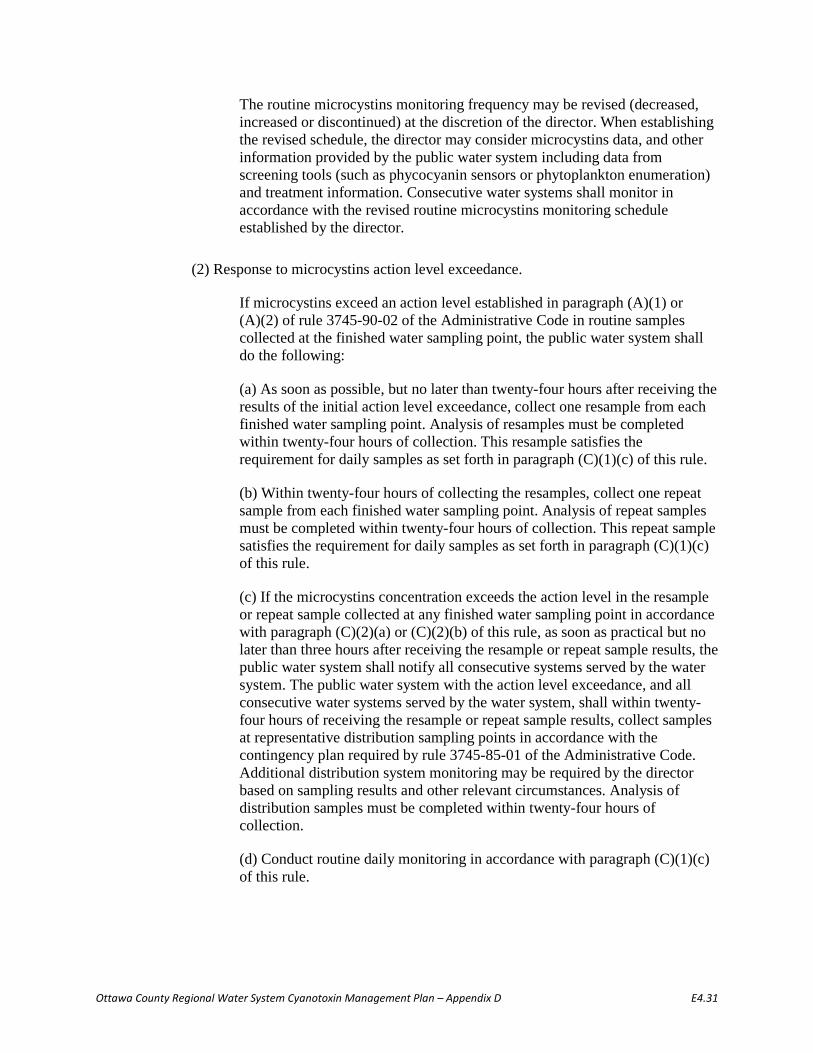
Ottawa County Regional Water System Cyanotoxin Management Plan – Appendix D E4.31
The routine microcystins monitoring frequency may be revised (decreased, increased or discontinued) at the discretion of the director. When establishing the revised schedule, the director may consider microcystins data, and other information provided by the public water system including data from screening tools (such as phycocyanin sensors or phytoplankton enumeration) and treatment information. Consecutive water systems shall monitor in accordance with the revised routine microcystins monitoring schedule established by the director.
(2) Response to microcystins action level exceedance.
If microcystins exceed an action level established in paragraph (A)(1) or (A)(2) of rule 3745-90-02 of the Administrative Code in routine samples collected at the finished water sampling point, the public water system shall do the following:
(a) As soon as possible, but no later than twenty-four hours after receiving the results of the initial action level exceedance, collect one resample from each finished water sampling point. Analysis of resamples must be completed within twenty-four hours of collection. This resample satisfies the requirement for daily samples as set forth in paragraph (C)(1)(c) of this rule.
(b) Within twenty-four hours of collecting the resamples, collect one repeat sample from each finished water sampling point. Analysis of repeat samples must be completed within twenty-four hours of collection. This repeat sample satisfies the requirement for daily samples as set forth in paragraph (C)(1)(c) of this rule.
(c) If the microcystins concentration exceeds the action level in the resample or repeat sample collected at any finished water sampling point in accordance with paragraph (C)(2)(a) or (C)(2)(b) of this rule, as soon as practical but no later than three hours after receiving the resample or repeat sample results, the public water system shall notify all consecutive systems served by the water system. The public water system with the action level exceedance, and all consecutive water systems served by the water system, shall within twenty-four hours of receiving the resample or repeat sample results, collect samples at representative distribution sampling points in accordance with the contingency plan required by rule 3745-85-01 of the Administrative Code. Additional distribution system monitoring may be required by the director based on sampling results and other relevant circumstances. Analysis of distribution samples must be completed within twenty-four hours of collection.
(d) Conduct routine daily monitoring in accordance with paragraph (C)(1)(c) of this rule.

Ottawa County Regional Water System Cyanotoxin Management Plan – Appendix D E4.32
(D) Monitoring extension.
Upon a request from a public water system, the director may agree to extend the twenty-four hour monitoring requirement for daily, resample, repeat or distribution samples required pursuant to this rule on a case-by-case basis when the public water system has a logistical problem collecting samples within twenty-four hours or analyzing samples in accordance with the requirements of this chapter. When an extension is agreed to by the director, the director shall specify in writing how much time the public water system has to monitor. Examples of potential logistical problems include, but are not limited to:
(1) Extreme weather conditions create unsafe travel or on-site conditions for the person collecting the sample.
(2) Limited certified laboratory capacity on weekends and holidays.
(E) Violations.
Failure to comply with routine and distribution monitoring requirements in paragraph (A)(1), (A)(2), (A)(3), (A)(4)(c), (B), (C)(1) or (C)(2)(c) of this rule is a monitoring violation and requires the public water system to provide Tier 3 public notification in accordance with rule 3745-81-32 of the Administrative Code. Failure to comply with resample and repeat sample requirements in paragraph (A)(4)(a), (A)(4)(b), (C)(2)(a) or (C)(2)(b) of this rule is a monitoring violation and requires the public water system to provide a tier 1 public notification accordance with rule 3745-81-32 of the Administrative Code.
Effective: 06/01/2016 Five Year Review (FYR) Dates: 06/01/2021 Promulgated Under: 119.03 Statutory Authority: 3745.50, 6109.04 Rule Amplifies: 3745.50, 6109.04

E5.1
Cyanotoxins Management Plan
City of Myrtle Creek
Myrtle Creek, Oregon November, 2016

E5.2
Table of Contents Executive Summary .............................................................................................................................. E5.4 City of Myrtle Creek Overview ............................................................................................................. E5.5 Source Water ...................................................................................................................................... E5.5 Treatment Process .............................................................................................................................. E5.5 Routine Water Quality Monitoring ..................................................................................................... E5.6
Cyanotoxin Management Plan ............................................................................................................. E5.6
Step 1: Assess Source Water .................................................................................................................... E5.8
1.1 Identify Source Water Protection Areas ........................................................................................ E5.8 Land Use .............................................................................................................................................. E5.8
1.2 Create Inventory of HABs Risk Factors ........................................................................................... E5.9 1.2.1 Source Water Characteristics ..................................................................................................... E5.9 1.2.2 Water Quality Parameters ....................................................................................................... E5.10 Historical Cyanobacteria and Cyanotoxin Events in Source Water .................................................. E5.10 Nutrients ........................................................................................................................................... E5.10 Assess Vulnerability .......................................................................................................................... E5.10
Step 2: Preparation, Monitoring for Early Warning Signs and Immediate Actions ............................... E5.11
2.1 Preparation .................................................................................................................................. E5.11 Prepare Staff and Equipment for Monitoring ................................................................................... E5.11 Prepare for Treatment Adjustments ................................................................................................. E5.12 Communications ............................................................................................................................... E5.12 Establish Communication Plan with other Source Water Users ....................................................... E5.12 Communication with Stakeholders ................................................................................................... E5.12
2.2 Monitor the Early Warning Signs ................................................................................................. E5.13 Early Indicators of a Cyanobacterial Bloom ...................................................................................... E5.13
2.3 Immediate Actions if a Bloom is Suspected ................................................................................. E5.13 Monitoring Actions in Response to Early Warning Signs .................................................................. E5.13 Treatment adjustments in Response to Early Warning Signs ........................................................... E5.13 Communication Actions in Response to Early Warning Signs .......................................................... E5.14
Step 3: Raw Water Cyanotoxin Monitoring and Treatment Adjustments ............................................. E5.15
Monitoring if Cyanobacteria are Identified or Suspected ................................................................. E5.15 Operational Adjustments Based on Source Water Cyanotoxin Measurements ................................ E5.15 Communications Based on Source Water Cyanotoxin Measurements ............................................. E5.15
Step 4: Finished Water Cyanotoxin Monitoring and Treatment Adjustments ...................................... E5.16
Finished Water Total Microcystins Monitoring ................................................................................. E5.16 Treatment .......................................................................................................................................... E5.16 Communications ................................................................................................................................ E5.16
E5.3
Step 5: Continued Finished Water Cyanotoxin Monitoring, Treatment Adjustments and Public Communication ...................................................................................................................................... E5.17
Continued Finished Water Microcystins Monitoring ......................................................................... E5.17 Treatment .......................................................................................................................................... E5.17 Communications ................................................................................................................................ E5.17
Long-Term Activities .............................................................................................................................. E5.19
Monitoring Activities .......................................................................................................................... E5.19 Source Water Protection Management Approaches ......................................................................... E5.19 Treatment Activities ........................................................................................................................... E5.19
Appendices Appendix A Cyanotoxin Management Flowchart .................................................................................. E5.20
Appendix B Contacts and Stakeholder Information .............................................................................. E5.21
Appendix C Notifying the Public of Cyanotoxins in their Water ............................................................ E5.22

City of Myrtle Creek Cyanotoxin Management Plan – Executive Summary E5.4
Executive Summary City of Myrtle Creek, with the support of the State of Oregon and the United States Environmental Protection Agency (USEPA), developed this Cyanotoxins Management Plan (CMP) to prepare for and mitigate risks from harmful algal blooms (HABs) and cyanotoxins occurring in the South Umpqua River order to protect public drinking water from cyanotoxin contamination. This document provides steps and documents activities to prepare for and identify a potential HAB occurrence, make treatment and operational adjustments to remove cyanotoxins from the water, provide timely information and (as appropriate) an advisory to the water system’s customers, and document information about occurrences of HABs so that information can be used to minimize the effect of HABs on the water system in the future. This plan also contains possible future activities the utility could engage in to mitigate the risks from HABs and cyanotoxins, such as long-term source water protection activities.
The steps outlined in this CMP include:
Step 1: Assess Source Water Step 2: Preparation, Monitoring for Early Warning Signs and Immediate Actions Step 3: Raw Water Cyanotoxin Monitoring and Treatment Adjustments Step 4: Finished Water Cyanotoxin Monitoring and Treatment Adjustments Step 5: Continued Finished Water Cyanotoxin Monitoring, Treatment Adjustments and Public Communication
In addition to the five steps above long-term activities are also discussed to enhance the utility’s ability to prevent, mitigate and manage the risks from cyanotoxin occurrence in source and drinking waters.

City of Myrtle Creek Cyanotoxin Management Plan – Overview E5.5
City of Myrtle Creek Overview The City of Myrtle Creek’s water system serves 3,460 people finished water through approximately 1,400 service connections. The water system relies on two developed surface water sources to supply its water needs: the South Umpqua River and the Springbrook springs. Treatment facilities include two filtration plants, one at the confluence of the South Umpqua River and Myrtle Creek and one in the Springbrook springs, which consists of 8 springs and the Harrison-Young Canyon. South Umpqua River water, which is the primary source of water for the system, is filtered by microfiltration, polished seasonally with Granular Activated Carbon (GAC) filtration, and disinfected with both UV and chlorine. The City of Myrtle Creek’s distribution system consists of two 1 MG storage tanks and one 0.5 MG storage tank, with a working volume of 137,000 gallons, for a total of 2.137 MG of storage. A description of the water system’s treatment process is provided below, as well as a schematic of the treatment system.
Source Water The South Umpqua River is the city’s primary source from late spring to January. Springbrook springs is the other source, which is used all year and produces almost half of the treated water over the year. Since the springs rely heavily on rainfall and seasonal water rights for the springs apply, the Springbrook springs produce almost all the water from February to April. The amount sourced from the river and springs varies from year to year.
In the winter, source waters are subject to high turbidity, while in the summer they experience high temperatures as well as taste and odor events. High levels of E. coli have also consistently been found in this source water and Cryptosporidium has been detected, leading the City of Myrtle Creek to provide additional treatment (microfiltration and UV) to protect consumers.
The taste and odor problems possibly stem from geosmin or MIB production by algae. During the summer months, the dissolved oxygen and pH measurements from the source water are often outside the ranges that are healthy for aquatic life uses. Nutrient levels are also high, contributing to the growth of HABs. In the summer after it rains, the water from small pools in the river where algae are attached to the South Umpqua river bottom, referred to as “frog pools,” are washed downriver, creating a pulse of algae in the water column.
Treatment Process City of Myrtle Creek provides the following treatment on water from the South Umpqua River: (Figure 1 displays a diagram of the treatment train):
• Infiltration gallery: Water is collected in an infiltration gallery in the river that removes some turbidity before the water is pumped by 3 turbine pumps to the treatment plant.
• Coagulant addition: Aluminum chloro-hydrate (ACH) is injected into the transmission line that carries the water from the river to the treatment plant. The ACH is stored in the treatment plant and a feed line returns from the plant to the injection point. This allows enough time for the ACH to fully mix with the water before filtration.
• Roughing filters: When it enters the treatment plant building, water passes through 300 µm mesh Amiad screens, which serve as roughing filters. A streaming current meter is located before the Amiad screens, but it is not currently relied upon for operational decisions.

City of Myrtle Creek Cyanotoxin Management Plan – Overview E5.6
• Microfiltration: Water that has passed through the Amiad screens flows through 0.1 µm microfiltration units.
• GAC: In the summer months, filtered water passes through a GAC vessel for taste and odor (and possibly cyanotoxin) removal. The empty bed contact time for the GAC is 7.1 min at a design flow of 1400 gallons per minute. The GAC units are brought into service when the South Umpqua River’s water temperature reaches 70°F or if a taste and odor event occurs, typically between June and October. Total Organic Carbon (TOC) is measured before and after the GAC units once every two weeks while they are in operation. The GAC filters are currently only being backwashed once during the time they are in operation.
• UV disinfection: Water leaves the GAC filters and undergoes UV disinfection in the treatment plant.
• Chlorination: Water is chlorinated with sodium hypochlorite before flowing into the 160,000 gallon clearwell, where disinfection CT is achieved. The required chlorine CT for Surface Water Treatment Rule compliance is 14 mg-min/L. Chlorine CT is measured and recorded daily. Based on records from August 2015, the normal chlorine CT range for that month was 76.7 to 153.4 mg-min/L.
Routine Water Quality Monitoring Raw water is monitored at the Myrtle Creek treatment plant for pH, temperature, turbidity and alkalinity. Source water and finished water TOC are measured monthly. TOC is also measured before and after the GAC units when they are in operation. In addition, samples are collected and measurements are made for cyanobacterial cell counts and total microcystins in the South Umpqua River by the Partnership for Umpqua Rivers (PUR). Either the State of Oregon or the PUR notify the City of Myrtle Creek’s operators if high cyanobacterial counts or cyanotoxins are found in the river. A summary of routine water quality monitoring is provided in Table 1 below.
Table 1. Raw Water Routine Monitoring
Parameter Location Frequency Who Collects Sample?
Who Does Analysis?
Alkalinity Raw Water Pump Monthly Myrtle Creek Plant TOC Discharge Monthly Operator Lab pH Daily Plant
Temperature Daily Plant Turbidity Daily Plant
Cyanobacterial Cells South Umpqua River PUR Microcystins South Umpqua River PUR Lab
Cyanotoxin Management Plan City of Myrtle Creek developed a Cyanotoxins Management Plan (CMP) detailed in the steps below. This CMP provides an action plan to prepare for and mitigate risks from harmful algal blooms (HABs) and cyanotoxins occurring in the South Umpqua River in order to protect public drinking water from cyanotoxin contamination. The plan includes immediate steps discussing monitoring and treatment should HABs and cyanotoxins occur, as well as long-term steps the system can engage in to protect source waters and to fully evaluate treatment capabilities. A detailed flowchart of the CMP can be found in Appendix A.

City of Myrtle Creek Cyanotoxin Management Plan – Overview E5.7
Figure 1. Schematic Diagram of the Treatment System

City of Myrtle Creek Cyanotoxin Management Plan – Step 1 E5.8
Step 1: Assess Source Water 1.1 Identify Source Water Protection Areas The source water protection area for City of Myrtle Creek within the South Umpqua River was evaluated using EPA’s online mapping tool, Drinking Water Mapping Application to Protect Source Waters (DWMAPS).
Map 1 shows the delineation of the South Umpqua River source water protection area, as well as point sources of contamination located nearby (see “Inventory” below). The source water protection area includes all catchments 15 miles upstream of the Umpqua River intake.
Map 1. Source Water Protection Area for the South Umpqua River Intake and Potential Point Sources (prepared in DWMAPs: https://www.epa.gov/sourcewaterprotection/dwmaps)
Land Use Map 2 shows the land use and land cover in the larger South Umpqua River Watershed which includes the source water protection area. The majority of the land cover in the South Umpqua River Watershed is forested, with agricultural and urban land use less prevalent. Even though it is a less dominate land use, urban point sources are the primary drivers of elevated nutrient (phosphorus and nitrogen) levels in the South Umpqua Watershed. Wastewater treatment plants in the watershed provide approximately 85% of the nutrient loading while only 5% of the flow. A smaller percentage of nutrient pollution comes from nonpoint source pollution from surrounding urban and agricultural areas (http://www.deq.state.or.us/WQ/TMDLs/docs/umpquabasin/umpqua/chpt4nut.pdf).

City of Myrtle Creek Cyanotoxin Management Plan – Step 1 E5.9
Map 2. Land use in the South Umpqua River Watershed (Excerpted from: http://www.deq.state.or.us/WQ/TMDLs/docs/umpquabasin/umpqua/chpt4nut.pdf)
1.2 Create Inventory of HABs Risk Factors 1.2.1 Source Water Characteristics The South Umpqua River is the city’s primary source from late spring to January. In the winter it is subject to high turbidity, while in the summer it experiences high temperatures as well as taste and odor events. High levels of E. coli have also consistently been found in this source water and Cryptosporidium has been detected, leading the City of Myrtle Creek to provide additional treatment (microfiltration and UV) to protect consumers.
Streams in the South Umpqua River watershed have been assessed for attainment of surface water quality standards under Section 305(b) of the Clean Water Act (CWA). Based on these assessments, several streams have been listed as impaired under Section 303(d) of the CWA. The South Umpqua River specifically was listed as impaired for aquatic weeds/algae. The Total Maximum Daily Load (TMDL) defines targets for nutrient loading and chlorophyll-a concentrations in the South Umpqua River and outlines strategies for reducing nutrient loading and chlorophyll-a concentrations, which will ultimately reduce algal growth.
One source of funding for implementing the TMDL is CWA nonpoint source program (Section 319) grant funds. There have been three local Section 319 granted projects in the Lower South Myrtle Creek watershed totaling approximately $100,000 in funding to help improve water quality monitoring efforts.
The watershed has two active watershed committees. The larger, more active watershed council is the PUR. The other is the South Umpqua Rural Community Partnership. Both tend to focus primarily on activities that promote fish habitat. Myrtle Creek could play a role supporting the TMDL and water quality improvement process by engaging with these local watershed committees and supporting other efforts.

City of Myrtle Creek Cyanotoxin Management Plan – Step 1 E5.10
1.2.2 Water Quality Parameters Historical Cyanobacteria and Cyanotoxin Events in Source Water Cyanotoxins have been actively addressed in the South Umpqua River for the past ten years. A dog’s death from exposure to fatal levels of cyanotoxins after swimming in water near Lawson Bar brought attention to the toxin issue in surface waters. Now a permanent HAB recreational advisory is posted by Oregon Health Authority on this section of the South Umpqua River.
Nutrients Phosphorus and nitrogen are drivers of algal and cyanobacterial growth in lakes, rivers and reservoirs. Sources of phosphorus and nitrogen can include discharge of domestic and industrial wastewater, septic systems and runoff from agricultural and urban lands.
A query of the USEPA DWMAPS tool indicates that there are four National Pollutant Discharge Elimination System (NPDES) permitted wastewater dischargers and no Combined Sewer Overflows within 15 miles upstream of Myrtle Creek. According to the 2006 Umpqua Basin TMDL, which applies to the entire South Umpqua River Watershed, wastewater treatment plants are the primary drivers of elevated nutrient levels in the watershed. A smaller percentage of total nutrient pollution comes from surrounding urban and agricultural areas, including such sources as urban runoff, agricultural runoff, livestock, failing septic systems, illegal discharges and streambank erosion. To access the Umpqua Basin TMDL report, go to http://www.deq.state.or.us/WQ/TMDLs/docs/umpquabasin/umpqua/chpt4nut.pdf.
Assess Vulnerability A weight of evidence approach was used to characterize whether the utility’s source water is considered vulnerable to HAB and cyanotoxin occurrence. Evidence incorporates all of the discussion in this section including previous bloom occurrences, positive toxin results from limited historical cyanotoxin monitoring, and the fact that the South Umpqua River is listed as impaired and has a TMDL for aquatic weeds/algae. The City of Myrtle Creek has been determined to be vulnerable to cyanotoxin events and should continue to Step 2.

City of Myrtle Creek Cyanotoxin Management Plan – Step 2 E5.11
Step 2: Preparation, Monitoring for Early Warning Signs and Immediate Actions 2.1 Preparation The City of Myrtle Creek has determined that its source water is vulnerable to cyanobacterial blooms and has considered how to prepare for cyanobacterial blooms and cyanotoxin occurrence. Preparation includes preparing for monitoring raw and finished waters, preparing for treatment adjustments and establishing communication plans.
Prepare Staff and Equipment for Monitoring City of Myrtle Creek intends to carry out the following activities in order to be prepared for the monitoring steps described in this plan:
• Train operators on algae/cyanobacteria identification, counting and identification of gas vacuoles.
• Explore if there are local or regional algae/cyanobacteria genera keys already available from watershed groups, academics, states and other groups. If not, consider setting up a microscope and try to start preparing an algae key that is specific to algae/cyanobacteria genera found in the South Umpqua River.
• Buy a set of microcystins test strips and pilot them to determine if they can be incorporated into the management plan as described here. Consider sharing the cost of the test strips with other South Umpqua River water utilities. Be sure to have test strips that can reliably measure at or below 0.3 µg/L total microcystins and test strips that can measure at or above 3.5 µg/L total microcystins.
• Train operators on how to use microcystins test strips.
• Establish and document sampling and testing procedures.
• Establish and document quality assurance procedures.
• Enter into an agreement with a laboratory that can reliably and promptly analyze samples using the Adda-specific ELISA lab-based test. o Establish a procedure for submitting samples to the identified laboratory for Adda-
specific ELISA analysis. Consider preparing written sampling instructions.
o Document all sampling, testing and quality assurance procedures for lab samples.
o Have coolers, chain of custody forms and shipping labels on site and ready for use.
o Ensure that the appropriate bottles (glass or PETG) are on site for the Adda-specific ELISA samples.
o Also have sodium thiosulfate available for quenching any samples that have been exposed to an oxidant as soon as they are collected.
• Work to build relationships with researchers at Oregon State in Corvallis and Southern Oregon University.
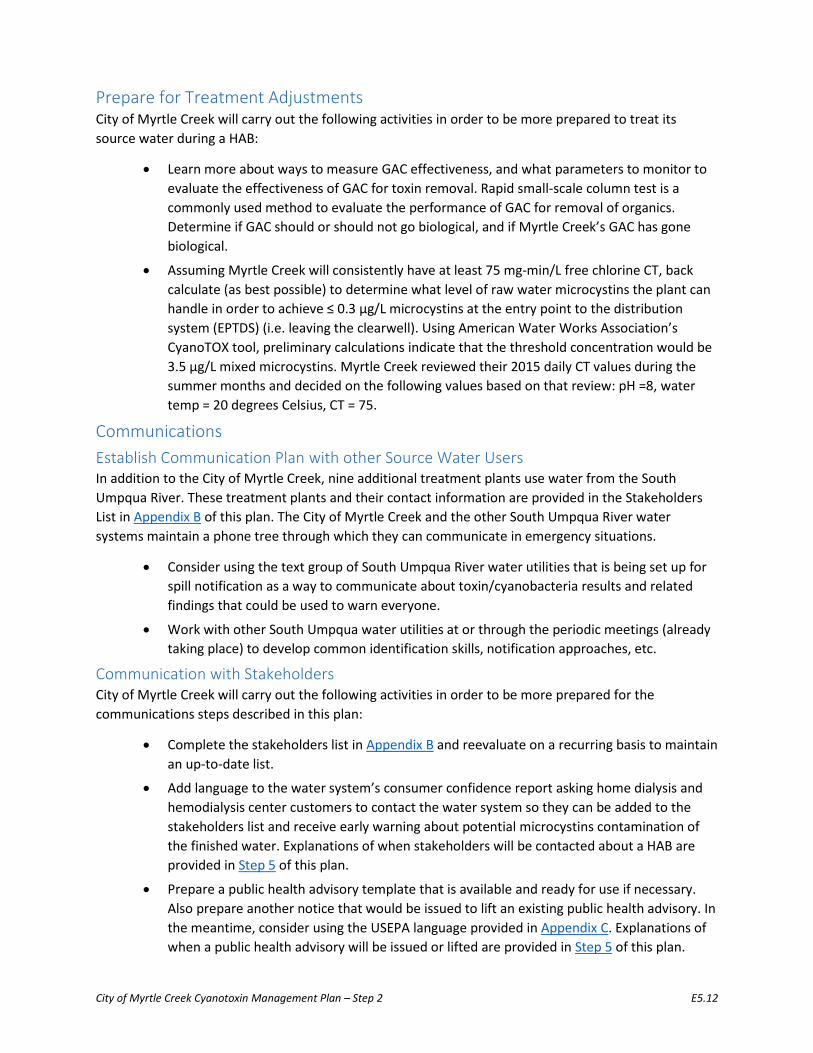
City of Myrtle Creek Cyanotoxin Management Plan – Step 2 E5.12
Prepare for Treatment Adjustments City of Myrtle Creek will carry out the following activities in order to be more prepared to treat its source water during a HAB:
• Learn more about ways to measure GAC effectiveness, and what parameters to monitor to evaluate the effectiveness of GAC for toxin removal. Rapid small-scale column test is a commonly used method to evaluate the performance of GAC for removal of organics. Determine if GAC should or should not go biological, and if Myrtle Creek’s GAC has gone biological.
• Assuming Myrtle Creek will consistently have at least 75 mg-min/L free chlorine CT, back calculate (as best possible) to determine what level of raw water microcystins the plant can handle in order to achieve ≤ 0.3 µg/L microcystins at the entry point to the distribution system (EPTDS) (i.e. leaving the clearwell). Using American Water Works Association’s CyanoTOX tool, preliminary calculations indicate that the threshold concentration would be 3.5 µg/L mixed microcystins. Myrtle Creek reviewed their 2015 daily CT values during the summer months and decided on the following values based on that review: pH =8, water temp = 20 degrees Celsius, CT = 75.
Communications Establish Communication Plan with other Source Water Users In addition to the City of Myrtle Creek, nine additional treatment plants use water from the South Umpqua River. These treatment plants and their contact information are provided in the Stakeholders List in Appendix B of this plan. The City of Myrtle Creek and the other South Umpqua River water systems maintain a phone tree through which they can communicate in emergency situations.
• Consider using the text group of South Umpqua River water utilities that is being set up for spill notification as a way to communicate about toxin/cyanobacteria results and related findings that could be used to warn everyone.
• Work with other South Umpqua water utilities at or through the periodic meetings (already taking place) to develop common identification skills, notification approaches, etc.
Communication with Stakeholders City of Myrtle Creek will carry out the following activities in order to be more prepared for the communications steps described in this plan:
• Complete the stakeholders list in Appendix B and reevaluate on a recurring basis to maintain an up-to-date list.
• Add language to the water system’s consumer confidence report asking home dialysis and hemodialysis center customers to contact the water system so they can be added to the stakeholders list and receive early warning about potential microcystins contamination of the finished water. Explanations of when stakeholders will be contacted about a HAB are provided in Step 5 of this plan.
• Prepare a public health advisory template that is available and ready for use if necessary. Also prepare another notice that would be issued to lift an existing public health advisory. In the meantime, consider using the USEPA language provided in Appendix C. Explanations of when a public health advisory will be issued or lifted are provided in Step 5 of this plan.

City of Myrtle Creek Cyanotoxin Management Plan – Step 2 E5.13
• Prepare and have available a “Frequently Asked Questions” outreach document for water consumers – have copies available in the office where customers pay their bills and/or include it with their bills. Use USEPA’s Cyanotoxin Risk Communication Toolbox as a resource for FAQs.
2.2 Monitor the Early Warning Signs Based on historical bloom occurrence in the South Umpqua River, City of Myrtle Creek begins looking for signs of blooms in the early summer months. Early indicators that a bloom may be occurring include drinking water treatment operational challenges. Other early warning signs of bloom occurrence that operators can look for during the system’s normal operation are identified in this section. Also included in this section are follow-up activities if any of the early warning signs are observed.
Early Indicators of a Cyanobacterial Bloom City of Myrtle Creek operators have identified several early warning signs that a cyanobacterial bloom is likely to occur in the very near future (or has begun to occur). The following early warning signs are a combination of observations of conditions in the river itself and in the treatment plant:
• Water temperature in the river is above 70°F (approximately 20°C).
• A summer rain is scheduled that may raise the river level high enough to flush nutrients and the “frog pools” down river.
• Algal mats appear to be forming at Lawson Bar.
• PUR or Oregon Department of Environmental Quality (DEQ)/Oregon Health Authority (OHA) notifies Myrtle Creek that high cyanobacteria counts or cyanotoxins were detected in the South Umpqua River.
2.3 Immediate Actions if a Bloom is Suspected Monitoring Actions in Response to Early Warning Signs
• During the summer months, visit Lawson Bar at least once a week and visually check the river for algal mat formation. If algal mats seem to be forming at Lawson Bar, check on them more frequently.
o The algal mats are considered an indicator that cyanotoxins may be likely present in source waters.
o If a bloom is suspected continue to Step 3.
Treatment adjustments in Response to Early Warning Signs • If it is a week when TOC is not scheduled to be measured before and after the GAC and any
of the early indicators is/are present (other than water temperature), measure TOC before and after the GAC.
o TOC removal across the GAC is being used as an indicator of GAC effectiveness. If TOC removal is less than 60%, then the City of Myrtle Creek will backwash the GAC.
• If a summer rain event is expected that may raise the river level high enough to flush the “frog pools”, then before the rain begins, adjust the finished water storage tank set points so the tanks are filled enough that the plant does not have to run during the river rise.

City of Myrtle Creek Cyanotoxin Management Plan – Step 2 E5.14
Communication Actions in Response to Early Warning Signs
Check with other water utilities and raw water stakeholders to see if they have observed any early signs of cyanobacteria, taste and odor or cyanotoxins in the river water.

City of Myrtle Creek Cyanotoxin Management Plan – Step 3 E5.15
Step 3: Raw Water Cyanotoxin Monitoring and Treatment Adjustments Monitoring if Cyanobacteria are Identified or Suspected If conditions favoring a cyanobacterial bloom are observed during Step 2, the City of Myrtle Creek plans to begin analyzing samples for microcystins as soon as possible using test strips or ELISA.
1. Test the raw water at the intake for microcystins with a test strip or ELISA under either or both of these conditions:
• If the mats observed at Lawson Bar start bubbling and they are located on the same side of the river as the City of Myrtle Creek’s intake.
• If the PUR or Oregon DEQ/OHA notifies Myrtle Creek that high cyanobacteria counts or cyanotoxins were detected in the South Umpqua River.
2. If a raw water test strip or ELISA sample is ≥0.3 µg/L for total microcystins during Step 3 monitoring, go to Step 4.
Operational Adjustments Based on Source Water Cyanotoxin Measurements City of Myrtle Creek does not wait for finished water cyanotoxin detections to adjust treatment, but rather begins making treatment adjustments when cyanobacteria or cyanotoxins are detected in the raw water. If potential toxin-producing cyanobacteria are identified in the source water test samples that are collected and analyzed for cyanobacteria cell identification by PUR or Oregon DEQ/OHA (see Step 3 above) then do the following:
• Turn on GAC if it is not on already.
• Check TOC removal across the GAC. If <60% TOC is being removed, backwash the GAC filter.
• Ensure chlorine CT is ≥ 75 mg-min/L in the clearwell.
• If the CT was low, increase the chlorine dose before the clearwell to correct CT so that it is ≥ 75 mg-min/L.
Please note that these potential operational adjustments are empirical and have not been comprehensively evaluated or supported by engineering studies. Evaluation of treatment adjustments will require jar testing, which is outside the scope of this project. As discussed in long-term activities, the City of Myrtle Creek can evaluate the toxin removal capacity of the current treatment process using jar tests spiked with varying levels of toxins to simulate different operational conditions. In addition, the City of Myrtle Creek can evaluate the effectiveness of these treatment adjustments based on sampling results and refine these approaches as appropriate.
Communications Based on Source Water Cyanotoxin Measurements • Notify raw water stakeholders, including other public water systems using the South
Umpqua, of any available toxin results and explain the follow-up monitoring and treatment adjustments that are being made.
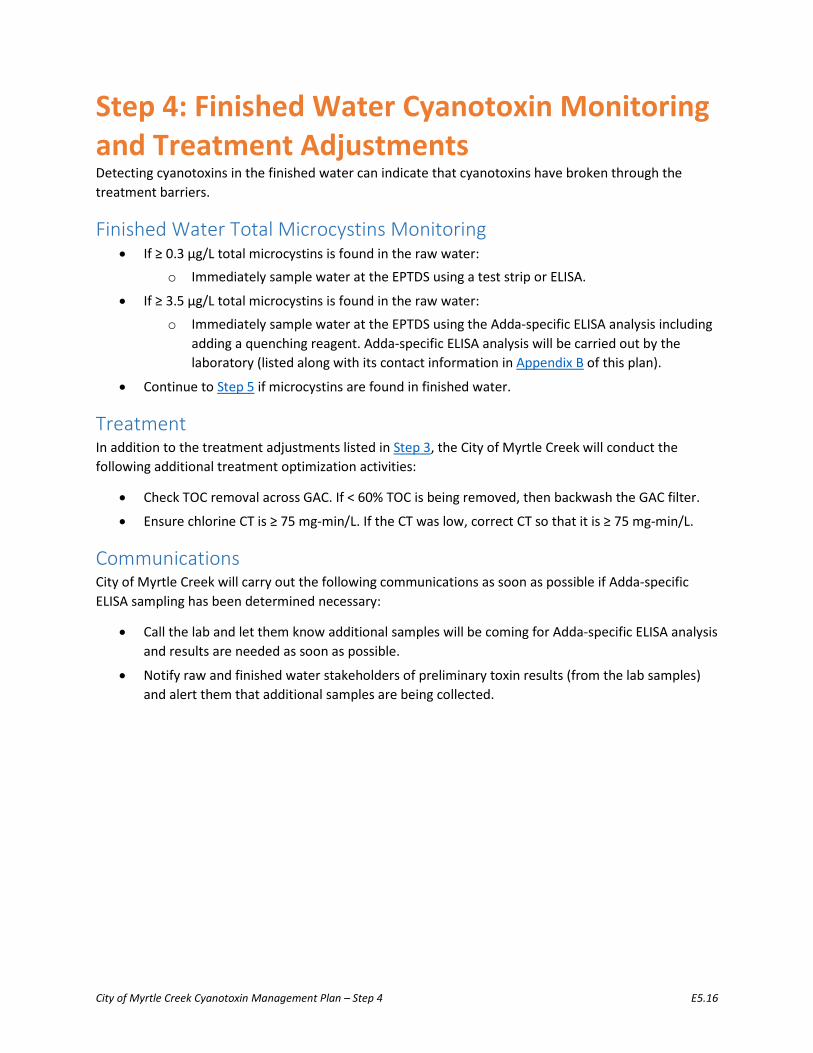
City of Myrtle Creek Cyanotoxin Management Plan – Step 4 E5.16
Step 4: Finished Water Cyanotoxin Monitoring and Treatment Adjustments Detecting cyanotoxins in the finished water can indicate that cyanotoxins have broken through the treatment barriers.
Finished Water Total Microcystins Monitoring • If ≥ 0.3 µg/L total microcystins is found in the raw water:
o Immediately sample water at the EPTDS using a test strip or ELISA.
• If ≥ 3.5 µg/L total microcystins is found in the raw water:
o Immediately sample water at the EPTDS using the Adda-specific ELISA analysis including adding a quenching reagent. Adda-specific ELISA analysis will be carried out by the laboratory (listed along with its contact information in Appendix B of this plan).
• Continue to Step 5 if microcystins are found in finished water.
Treatment In addition to the treatment adjustments listed in Step 3, the City of Myrtle Creek will conduct the following additional treatment optimization activities:
• Check TOC removal across GAC. If < 60% TOC is being removed, then backwash the GAC filter.
• Ensure chlorine CT is ≥ 75 mg-min/L. If the CT was low, correct CT so that it is ≥ 75 mg-min/L.
Communications City of Myrtle Creek will carry out the following communications as soon as possible if Adda-specific ELISA sampling has been determined necessary:
• Call the lab and let them know additional samples will be coming for Adda-specific ELISA analysis and results are needed as soon as possible.
• Notify raw and finished water stakeholders of preliminary toxin results (from the lab samples) and alert them that additional samples are being collected.

City of Myrtle Creek Cyanotoxin Management Plan – Step 5 E5.17
Step 5: Continued Finished Water Cyanotoxin Monitoring, Treatment Adjustments and Public Communication Step 5 contains communication actions, treatment actions and additional monitoring that should be carried out based on the concentrations of cyanotoxins in the finished water. This fifth step enables the City of Myrtle Creek to act quickly if cyanotoxins are present in the finished water.
Continued Finished Water Microcystins Monitoring If the sample from the EPTDS is ≥ 0.3 µg/L total microcystins using the test strip or ELISA:
• Immediately collect a follow-up sample at the EPTDS for Adda-specific ELISA analysis. Adda-specific ELISA analysis will be carried out by the laboratory (listed along with its contact information in Appendix B of this plan).
If an Adda-specific ELISA result for the follow-up sample collected at the EPTDS exceeds 0.3 µg/L total microcystins, conduct the following monitoring:
• Use the test strips or ELISA to sample raw water daily until clear (or below detection limit).
• Use test strips or ELISA at the EPTDS until measurements are consistently <0.3 µg/L for total microcystins.
When the test strip or ELISA results for raw water are < 0.3 µg/L total microcystins consistently, and EPTDS strip results or ELISA are also all < 0.3 µg/L total microcystins, conduct the following monitoring:
• Collect a follow-up sample at the EPTDS for Adda-specific ELISA analysis to verify that the microcystins event is over (until microcystins are below detection limit in the finished water).
City of Myrtle Creek will conduct the following monitoring when test strip results and Adda-specific ELISA results suggest the situation has been addressed (microcystins no longer detected in raw or finished water):
• Continue looking for early warning signs (return to Step 2).
Treatment City of Myrtle Creek will complete the following treatment optimization step if any Adda-specific ELISA result is at or above 0.3 µg/L total microcystins:
• If the CT was low, correct CT.
Communications City of Myrtle Creek will provide the following notifications:
• If the follow up entry point sample tested with the Adda-specific ELISA lab based method exceeds 0.3 µg/L total microcystins:
o Notify state regulators and other stakeholders of the toxin results.
o Issue drinking water advisory.

City of Myrtle Creek Cyanotoxin Management Plan – Step 5 E5.18
• If the finished water Adda-specific ELISA follow-up sample is < 0.3 µg/L total microcystins:
o If in place, lift the drinking water advisory.

City of Myrtle Creek Cyanotoxin Management Plan – Long-Term Activities E5.19
Long-Term Activities Monitoring Activities Consider establishing a routine raw and in-plant process control sampling and monitoring protocol for HABs. This could be sampling for cyanotoxins directly (including other cyanotoxins in addition to microcystins such as anatoxin-a), or measuring indicators, such as chlorophyll-a or phycocyanin, or a formal plan for monitoring and trending the early indicators mentioned in Step 2. Establishing a baseline for these parameters (by trending the data) during routine operation and understanding how each unit treatment process responds can help when a HAB does occur and operators are faced with making potential treatment adjustments. Planning, documenting and conducting a monitoring protocol would be good preparation for a HAB and provide good information during a HAB to support treatment optimization.
Source Water Protection Management Approaches Additional long-term activities can be undertaken by City of Myrtle Creek to engage in additional source water protection activities such as identifying all ongoing monitoring, committees, government programs and other organized watershed management activities taking place related to the South Umpqua River watershed. For each of these, provide activity descriptions, milestone dates, lists of key players, funding sources, ways South Umpqua River water utilities could become more involved, and the benefits to the water utilities of greater involvement. Prioritize which of these may be the most helpful for furthering the specific interests of the water utilities in the watershed.
Treatment Activities Evaluate the toxin removal capacity of the current treatment process using jar tests spiked with varying levels of toxins.

City of Myrtle Creek Cyanotoxin Management Plan – Appendix A E5.20
Appendix A Cyanotoxin Management Flowchart

City of Myrtle Creek Cyanotoxin Management Plan – Appendix B E5.21
Appendix B Contacts and Stakeholder Information
Stakeholders Agency/Company Title Contact Name Contact Phone Contact Email City of Myrtle Creek
CMP Team Leader
City of Myrtle Creek
Source Water Protection Manager
Treatment Operator City of Myrtle Creek
Distribution System Operator
Laboratory Contact Person
City of Myrtle Creek
City/Town Representative
City of Myrtle Creek
Water System/Municipality Spokesperson
Local Health Department PWS Contact

City of Myrtle Creek Cyanotoxin Management Plan – Appendix C E5.22
Appendix C Notifying the Public of Cyanotoxins in their Water
At the time of publication of this document, public water systems are not currently required to notify their customers of any bloom or cyanotoxin occurrence and are not required to include detections as part of a system’s Consumer Confidence Report under any National Primary Drinking Water Regulations. They should consult with their state or primacy agency to determine if they are subject to any state or tribal notification requirements. Although not currently required, water systems may want to consider communicating with their consumers if cyanotoxins in finished water are confirmed in additional samples. This communication may be received more positively if the water systems have engaged in prior communication with the public about HABs. A water system is encouraged to tailor its communications based on the cyanotoxin levels detected.
The state of Oregon has provided the following template for use when issuing a do not drink advisory:
Do Not Drink Water Advisory
Important Information About Your Drinking Water
[System] Has Levels of Algae toxin Above Drinking Water acute toxicity values
(Water System Name) routinely monitors for the presence of contaminants in our finished drinking water that is provided through our treatment and distribution system. Our water system recently exceeded the Oregon Health Authority’s acute toxicity value for a cyanotoxin [toxin detected, date sampled and value detected] which is a by-product of certain algae species that naturally grow in water. Although this is not currently a regulated contaminant, as our customers, you have a right to know this acute toxicity value was exceeded, what you should do, and what we are doing to correct this situation.
What should I do?
Drinking water above the acute toxicity value of [x] µg/L of [toxin] is not advised. You may want to use an alternative (e.g., bottled) water supply. If you have specific health concerns, consult your doctor.
What does this mean?
Human health effects from cyanotoxins are diverse and may include skin rashes and lesions, vomiting, gastroenteritis, conjunctivitis, headaches, eye, ear and throat irritations, abdominal cramps, nausea, diarrhea, fever, sore throat or hay fever-like symptoms. [Long-term exposure to microcystin can lead to damage to the liver, including cancer].
What is being done?
[Water system name] continues to work with [Insert Water Body Manager] to monitor and test the algal bloom for harmful toxins. In addition [water system name] is adjusting their treatment process to more successfully mitigate for the presence of cyanotoxins. Weekly testing will continue until toxin levels are below the acute toxicity values.
For more information, please contact [name of contact] at [phone number] or [mailing address].

City of Myrtle Creek Cyanotoxin Management Plan – Appendix C E5.23
Please share this information with all the other people who drink this water, especially those who may not have received this notice directly (for example, people in apartments, nursing homes, schools, and businesses). You can do this by posting this notice in a public place or distributing copies by hand or mail.
This notice is being sent to you by [system]. State Water System ID#: ___________.
Date distributed: _________.


![Press Release€¦ · Web viewResidents may resume using the tap water for all purposes. [Cyanotoxin name], a toxin produced by cyanobacteria (formerly known as blue-green algae),](https://static.fdocuments.net/doc/165x107/5f26cf67eab7ff5bfd74f457/press-release-web-view-residents-may-resume-using-the-tap-water-for-all-purposes.jpg)