CY2020 NOISE MANAGEMENT AND AIRLINE TRAFFIC REPORT
10
CY2020 NOISE MANAGEMENT AND AIRLINE TRAFFIC REPORT
Transcript of CY2020 NOISE MANAGEMENT AND AIRLINE TRAFFIC REPORT

CY2020 NOISE MANAGEMENT
AND AIRLINE TRAFFIC REPORT

2
STL Airport Noise Management Report CY 2020
The Airport Noise Management Report provides the CY 2020 summary of St. Louis Lambert International Airport’s operations and noise complaints. The data in this report is from L3Harris, Inc. and not from FAA Air Traffic. This report is illustrative of trends and distribution and should not be construed as official traffic counts.
CY 2020
There were 38 noise complaints received in the CY 2020 compared to the 121 noise complaints in CY 2019. The noise complaints were from 15 communities. Residents complained about loud, low, and frequent aircraft over their homes. There were complaints about military departures during the early morning hours, and touch and go operations by Boeing during the day. Residents to the west of the Airport in St. Charles and Bridgeton complained about pre-dawn cargo arrivals interrupting sleep. Several complainants expressed concern over small aircraft (mostly from local flight schools) circling their homes. Others complained about local TV station and police helicopters. There were 11 complaints about night-time operations designated as the hours of 10p.m. to 7a.m. and 27 were about day-time operations (7 a.m. to 10 p.m.). Landings and take-offs (operations) during the day time hours accounted for 89.2 percent of the operations while 10.8 percent of the operations occurred during the night time period. The chart below shows number of complaints by zip code. Not all complainant zip codes are shown on the map below because some complainants did not state where they were calling from or the their location is outside of the map boundaries below.
N O I S E C O M P L A I N T S
Qtr. Zip Calls Zip Calls Zip Calls Zip Calls Zip Calls Zip Calls Zip Calls Zip Calls Zip Calls Zip Calls
1st 63044 2 63074 2 63105 2 63134 2 UNK 1 - - - - - - - - - -
2nd 63005 4 63021 1 63114 1 63130 1 63134 2 63135 1 63303 1 - - -
3rd 63044 1 63043 1 63042 1 63303 2 - - - - - - -
4th 63104 1 63114 1 63131 1 63135 2 63303 3 63304 1 63301 2 - - - - - -
1

3
STL CY 2020 Noise and Airline Traffic Report
The runways at St. Louis Lambert International Airport are: 12R/30L (11,019’x200’), 12L/30R (9,003’x150’), 11/29 (9,001’x150’), and 6/24 (7,607’x150’).
R U N W AY I D E N T I F I C A T I O N
P E R M A N E N T N O I S E M O N I T O R I N G S I T E S
Site 5
Site 1
Site 13
Site 7
Site 8
Benedetta Bridgeton
5555
Site 1
Ferguson Lane, Bridgeton Athletic
Site 3
Villa Rosa Auriesville Hazelwood
Site 5
Belfore Loganberry Bel-Ridge
Site 7
Emerling Cool Valley
5555
Site 8
North Hills Country Club Pasadena Pk
Site 11
Bellwood Kirkland
Normandy
Site 12
North Hills Brotherton Ferguson
Site 13
The DNL (Day-Night average sound level) metric describes the total noise exposure during a given period. In
computing DNL, an extra weighting of 10dB is assigned to any sound levels occurring between the hours of 10 pm
to 7 am. The FAA has established 65 DNL as the threshold above which aircraft noise is considered to be incom-
patible with residential use. The eight noise monitoring sites are recording levels lower than 65 DNL.
Site 12
Site 3
Site 11
2
29
12L
30L 30R
6 12R
24
11
4
O P E R A T I O N S B Y R U N W A Y
STL CY2020 Noise and Airline Traffic Report
There were 124,246 operations in CY 2020 compared to 192,209 operations in CY 2019, a decrease of –35.4 percent according to L3Harris data*. Runway 30R was the most used runway for arrivals at 22.3 percent (27,697) followed by Runway 12L at 12.9 percent (16,147). For departures, Runway 30L had 19.1 percent (23,690) followed by Runway 12R at 18.5 percent (22,939). In the 2020, there were 122,927 (98.9 percent) operations in which the runway was identified and 1,319 operations (1.1 percent) where the runways were not identified.
*The L3Harris Airport Noise and Operation Management System (ANOMS) collects FAA air traffic data from the National Airspace System (NAS) and permanent noise monitoring data and correlates flight tracks, noise monitoring events and noise complaints. The ANOMS provides illustrative trends and should not be construed as official traffic counts.
3

5
STL 2019 Noise and Airline Traffic Report
O P E R A T I O N S B Y A I R L I N E
The top twenty airlines in 2020 including major carriers, regional carriers, and general aviation business jet aircraft accounted for 87.3 percent of all operations. Shown in the chart below are the top 20 Part 121 commercial airlines, two general aviation business charter jets (Gamma Charters and Netjets Aviation), and two cargo airlines (UPS and FedEx) for 2020. The 2020 group includes nine regional commercial passenger jet airlines. Regional carriers accounted for 17.1 percent of the operations in 2020. Southwest and Frontier are the only major airlines that are not partnered with the regional airlines at St. Louis Lambert International Airport.
There were 79 Part 121 and Part 135 airlines that utilized the Airport during this period. Part 121 airlines are commercial airlines with more than 30 seats and Part 135 airlines are planes with less than 30 seats.
*The L3Harris Airport Noise and Operation Management System (ANOMS) collects FAA air traffic data from the National Airspace System (NAS) and permanent noise monitoring data and correlates flight tracks, noise monitoring events and noise complaints. The ANOMS provides illustrative trends and should not be construed as official traffic counts.
4

6
STL CY 2020 Noise and Airline Traffic Report
O P E R A T I O N S B Y C A T E G O R Y O F S E R V I C E
A look at some of the categories shows a decrease in operations from CY2019 to CY 2020. Essential Air Service decreased 5.9 percent in CY 2020 from the same period in CY 2019. Commercial narrow body oper-ations were down 38.4 percent with commercial operations starting to fall in April and continuing to slide throughout 2020 due to the pandemic. Charter operations are used by businesses and companies to move employees and passengers via general aviation business jets. There was a decrease of 25.4 percent in char-ter operations reported by L3Harris from 2019. Commercial cargo widebody aircraft, used to move goods to warehouses for distribution, increased 23.5 percent from 2019. Amazon added more cargo service in St. Lou-is in response to more people buying online rather than in person shopping. Amazon also added several dis-tribution centers throughout the St. Louis area. Military operations are filtered but L3Harris has changed its reporting to include reporting more military operations. This reporting that accounts for the increase in military operations for 2020. Overall, total operations in 2020, as reported in the L3Harris data* were down 35.4 per-cent from 2019.
*The L3Harris Airport Noise and Operation Management System (ANOMS) collects FAA air traffic data from the National Airspace System (NAS) and permanent noise monitoring data and correlates flight tracks, noise monitoring events and noise complaints. The ANOMS provides illustrative trends and should not be construed as official traffic counts.
5

7
STL CY2020 Noise and Airline Traffic Report
O P E R A T I O N S B Y T Y P E O F S E R V I C E
Commercial Passenger, Commercial Cargo, General Aviation, and Military are the four categories of opera-tions. The L3Harris data* also includes unknown operations category for aircraft that were not identified by either the airline or aircraft equipment type, or both. Commercial passenger operations were at 86.9 percent of the total operations in 2020 as compared to 91.6 percent of the operations in 2019. L3Harris data showed the general aviation category, which includes business jets, propeller and helicopter operations at 7.2 percent of reported operations in 2020 compared to 5.9 percent in 2019. In 2020, commercial cargo was reported as 4.2 percent of all operations compared to 2.1 percent in 2019. Military operations were 0.8 percent of all op-erations in 2020, however, not all military operations are reported in the data. In 2020, L3Harris began report-ing more military operations than in previous years.
*The L3Harris Airport Noise and Operation Management System (ANOMS) collects FAA air traffic data from the National Airspace System (NAS) and permanent noise monitoring data and correlates flight tracks, noise monitoring events and noise complaints. The ANOMS provides illustrative trends and should not be construed as official traffic counts
6

8
STL CY2020 Noise and Airline Traffic Report
O P E R A T I O N S B Y A I R C R A F T
Shown below are top fifteen aircraft operating at St. Louis Lambert Airport in 2020. In 2020, the Boeing 737-700 (37,226 operations) decreased by 37.6 percent and the Boeing 737-800 decreased by 26.9 percent from the same period in 2019. All passenger services declined. Only cargo operations increased during 2020. Moving into the top 15 aircraft at the Airport in 2020 was the Tecnam P 2012 aircraft used by Cape Air and the Embraer 170 aircraft used by the regional carrier Republic Airlines. Seven of the top fifteen aircraft at the Airport are operated by regional carriers. There were 233 known aircraft types that landed at St. Louis Lam-bert International Airport during this period according to Harris data*.
*The L3Harris Airport Noise and Operation Management System (ANOMS) collects FAA air traffic data from the National Airspace System (NAS) and permanent noise monitoring data and correlates flight tracks, noise monitoring events and noise complaints. The ANOMS provides illustrative trends and should not be construed as official traffic counts.
7

9
There were 124,246 operations recorded in CY 2020 compared to 192,209 operations in CY 2019, a decrease of 35.4 percent. The chart below shows the total percentages of use for known runways for this period. The most utilized runway for departures was Runway 30L (19.3 percent). The most utilized runway for arrivals was Runway 30R ( 22.5 percent). The crosswind runway 6-24 was the least used runway for this period. The Distribution of Traffic (Eastbound vs. Westbound ) for 2020 was 47.0 percent eastbound and 53.0 percent westbound operations.
*The L3Harris Airport Noise and Operation Management System (ANOMS) collects FAA air traffic data from the National Airspace System (NAS) and permanent noise monitoring data and correlates flight tracks, noise monitoring events and noise complaints. The ANOMS provides illustrative trends and should not be con-strued as official traffic counts
D I S T R I B U T I O N OF T R A F F I C
STL CY2020 Noise and Airline Traffic Report
8
10
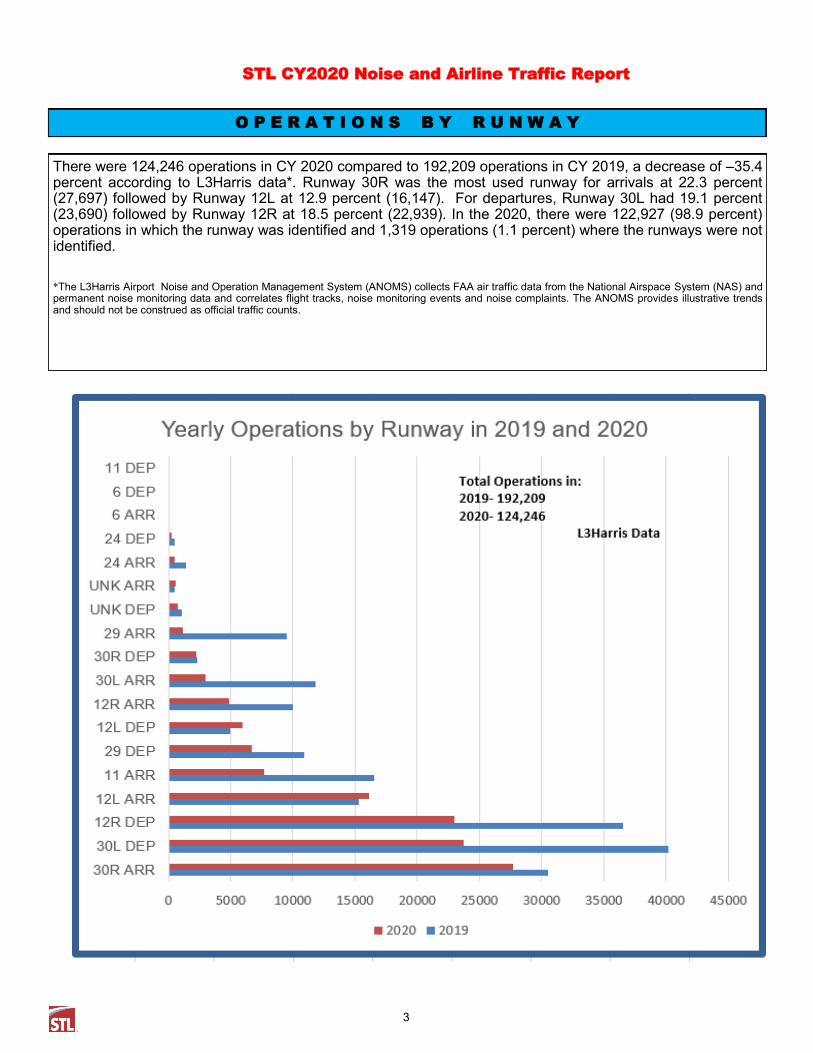
CY 2020
Peak Day Operation
STL CY2020 Noise and Airline Traffic Report
Airport Noise Management Office
Airport Planning & Development
St. Louis Lambert International Airport®
P.O. Box 10212
St. Louis, MO 63145
Noise Complaint Hot Line (314) 551-5070 — [email protected] — Fax: (314) 551-5013
Publication of St. Louis Lambert International Airport Noise Management Office
Departures—Red
Arrivals—Blue
9
Peak Day Operation of 2020
588 Operations on February 19, 2020