CVEN 3400 – Structural Testing Laboratory Lab 5: Slump ... 3400 – Structural Testing Laboratory...
1
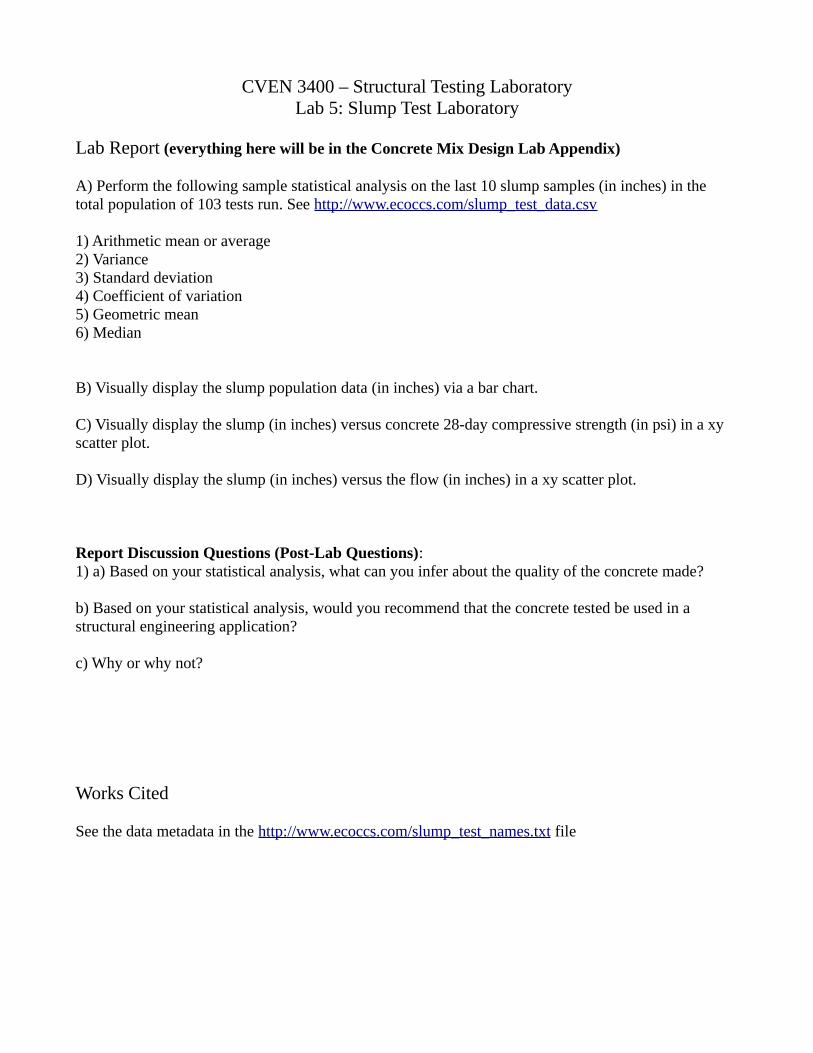
CVEN 3400 – Structural Testing Laboratory Lab 5: Slump Test Laboratory Lab Report (everything here will be in the Concrete Mix Design Lab Appendix) A) Perform the following sample statistical analysis on the last 10 slump samples (in inches) in the total population of 103 tests run. See http://www.ecoccs.com/slump_test_data.csv 1) Arithmetic mean or average 2) Variance 3) Standard deviation 4) Coefficient of variation 5) Geometric mean 6) Median B) Visually display the slump population data (in inches) via a bar chart. C) Visually display the slump (in inches) versus concrete 28-day compressive strength (in psi) in a xy scatter plot. D) Visually display the slump (in inches) versus the flow (in inches) in a xy scatter plot. Report Discussion Questions (Post-Lab Questions): 1) a) Based on your statistical analysis, what can you infer about the quality of the concrete made? b) Based on your statistical analysis, would you recommend that the concrete tested be used in a structural engineering application? c) Why or why not? Works Cited See the data metadata in the http://www.ecoccs.com/slump_test_names.txt file
Transcript of CVEN 3400 – Structural Testing Laboratory Lab 5: Slump ... 3400 – Structural Testing Laboratory...
CVEN 3400 – Structural Testing LaboratoryLab 5: Slump Test Laboratory
Lab Report (everything here will be in the Concrete Mix Design Lab Appendix)
A) Perform the following sample statistical analysis on the last 10 slump samples (in inches) in the total population of 103 tests run. See http://www.ecoccs.com/slump_test_data.csv 1) Arithmetic mean or average2) Variance3) Standard deviation4) Coefficient of variation5) Geometric mean6) Median
B) Visually display the slump population data (in inches) via a bar chart.
C) Visually display the slump (in inches) versus concrete 28-day compressive strength (in psi) in a xy scatter plot.
D) Visually display the slump (in inches) versus the flow (in inches) in a xy scatter plot.
Report Discussion Questions (Post-Lab Questions):1) a) Based on your statistical analysis, what can you infer about the quality of the concrete made?
b) Based on your statistical analysis, would you recommend that the concrete tested be used in a structural engineering application?
c) Why or why not?
Works Cited
See the data metadata in the http://www.ecoccs.com/slump_test_names.txt file