Customer satisfaction and different evaluation of it by ...
22
Full Terms & Conditions of access and use can be found at http://www.tandfonline.com/action/journalInformation?journalCode=rero20 Economic Research-Ekonomska Istraživanja ISSN: 1331-677X (Print) 1848-9664 (Online) Journal homepage: http://www.tandfonline.com/loi/rero20 Customer satisfaction and different evaluation of it by companies Petr Suchánek & Maria Králová To cite this article: Petr Suchánek & Maria Králová (2018) Customer satisfaction and different evaluation of it by companies, Economic Research-Ekonomska Istraživanja, 31:1, 1330-1350, DOI: 10.1080/1331677X.2018.1484786 To link to this article: https://doi.org/10.1080/1331677X.2018.1484786 © 2018 The Author(s). Published by Informa UK Limited, trading as Taylor & Francis Group Published online: 24 Jun 2018. Submit your article to this journal Article views: 101 View Crossmark data
Transcript of Customer satisfaction and different evaluation of it by ...

Full Terms & Conditions of access and use can be found athttp://www.tandfonline.com/action/journalInformation?journalCode=rero20
Economic Research-Ekonomska Istraživanja
ISSN: 1331-677X (Print) 1848-9664 (Online) Journal homepage: http://www.tandfonline.com/loi/rero20
Customer satisfaction and different evaluation ofit by companies
Petr Suchánek & Maria Králová
To cite this article: Petr Suchánek & Maria Králová (2018) Customer satisfaction and differentevaluation of it by companies, Economic Research-Ekonomska Istraživanja, 31:1, 1330-1350, DOI:10.1080/1331677X.2018.1484786
To link to this article: https://doi.org/10.1080/1331677X.2018.1484786
© 2018 The Author(s). Published by InformaUK Limited, trading as Taylor & FrancisGroup
Published online: 24 Jun 2018.
Submit your article to this journal
Article views: 101
View Crossmark data

Economic REsEaRch-Ekonomska istRaživanja, 2018voL. 31, no. 1, 1330–1350https://doi.org/10.1080/1331677X.2018.1484786
Customer satisfaction and different evaluation of it by companies
Petr Sucháneka and Maria Králováb
aDepartment of corporate Economy, masaryk University Faculty of Economics and administration, Brno, czech Republic; bDepartment of applied mathematics and computer science, masaryk University Faculty of Economics and administration, Brno, czech Republic
ABSTRACTThe aim of this article is to evaluate customer satisfaction from the perspective of companies in comparison with the perspective of the customers themselves. From the perspective of the company it is necessary to know customer satisfaction, as it is reflected in the company’s performance. The research shows that there are significant differences in the evaluation of customer satisfaction from the perspective of companies and from the perspective of their customers, and that these differences are also reflected in the differences in the performance of the companies. The self-evaluation of companies tends to be overestimated in relation to the evaluation of companies by their customers, regardless of whether the companies are high-performing or low-performing. Customers are better able to distinguish the high-performing companies from the low-performing ones, since the high-performing companies received better evaluation from customers. In contrast, in the self-evaluation of companies, there were no statistically significant differences between the high-performing and low-performing companies. Companies evaluate customer satisfaction incorrectly regardless of their level of performance. Even if the evaluation of customer satisfaction from the company’s perspective is generally overestimated in comparison with the view of customers, some factors of satisfaction are, at least concerning the trends, in agreement with both perspectives, that is, those of the customers and the companies.
1. Introduction
Customer satisfaction (C.S.) has an impact on the performance and profitability of a com-pany. Numerous studies have demonstrated this effect indirectly through customer loy-alty (Fornell, 1992; Rust & Keiningham, 1994; Rust, Zahorik, & Keiningham, 1995). It has, however, also been demonstrated that C.S. has a direct, positive impact on business performance (B.P.) represented by the return on investment (R.O.I.) indicator for goods
KEYWORDSself-evaluation of enterprises; customer satisfaction; product quality; company performance; financial ratios; customisation
JEL CLASSIFICATIONSL25; L66; m21
ARTICLE HISTORYReceived 11 may 2016 accepted 26 january 2018
© 2018 the author(s). Published by informa Uk Limited, trading as taylor & Francis Group.this is an open access article distributed under the terms of the creative commons attribution-noncommercial License (http://creativecommons.org/licenses/by-nc/4.0/), which permits unrestricted non-commercial use, distribution, and reproduction in any medium, provided the original work is properly cited.
CONTACT Petr suchánek [email protected]
OPEN ACCESS

ECONOMIC RESEARCH-EKONOMSKA ISTRAŽIVANJA 1331
(Anderson, Fornell, & Rust, 1997), or the C.S. impact on selected performance indicators for both manufacturing and service companies (Morgan & Rego, 2006). Our research is specifically interested in companies producing goods, where a positive relationship between C.S. and B.P. can be expected (Anderson, Fornell, & Lehmann, 1994; Anderson et al., 1997; Ittner & Larcker, 1998; Morgan & Rego, 2006).
There is no uniform view of researchers on the directness or indirectness of the rela-tionship between C.S. and B.P. (Saeidi, Sofian, Saeidi, Saeidi, & Saeidi, 2015). Nevertheless, it is significant for us that researchers do agree on the existence of a relationship between C.S. and B.P.
Since C.S. affects B.P., it is important for a company and its leadership to know the extent of satisfaction of its customers. The importance of this relationship emphasises the fact that C.S. affects future performance, i.e., the relationship between C.S. and performance is, from a time perspective, considered to be long-term (Morgan & Rego, 2006; Williams & Naumann, 2011). In addition, if higher C.S. leads to higher performance, the need to know the level of C.S. is even stronger. Due to the fact that C.S. is one of the key components in the competitiveness of a company (Saeidi et al., 2015), and because at the same time this satisfaction strongly influences the competitiveness of the company (Krajňáková, Navikaite, & Navickas, 2015), increased C.S. leads to increased competitiveness. For this reason, it is necessary for the company to know the real satisfaction level of its customers.
Businesses that sell their products through a distribution network do not have direct contact with their customers and do not know them. Although the company management is in contact with the customers (distributors) to whom it distributes its goods, due to the erroneous perception of C.S., which has been shown in research (Dedeoğlu & Demirer, 2015; Tsang & Qu, 2000), they do not have correct information about C.S. Therefore, if food companies do not carry out their own research into the satisfaction of the end customer, there exists the risk that the management of these companies is viewing the satisfaction of the end customers erroneously and cannot therefore increase their efficiency, or they fail to even realise that the B.P. could be higher.
What happens when the management of a company does not know the real C.S. or, more precisely, when the measurement of C.S. as identified by the company’s management differs from the actual level of the company’s C.S.? Where the relationship between C.S. and performance is positive, it is possible to infer that a lower rate of C.S. than expected will be the reason for lower performance and, conversely, a higher degree of C.S. than expected will be the reason for higher performance (Busacca & Padula, 2005; Mittal, Ross, & Baldasare, 1998). In the case of lower C.S., there emerges a gap that can be negatively projected onto B.P. In the case of higher C.S., this gap reflects positively on performance. The difference in the customer’s perception of satisfaction and that of the company management and its employees has been the subject of research (Dedeoğlu & Demirer, 2015; Tsang & Qu, 2000). These studies, however, focus on services or on product sales (Dagli, 2014). The authors did not find any research that dealt with this difference in the case of products (and certainly not for the food industry).
If the company is not aware of lower C.S., it cannot use its potential to increase B.P. Moreover, if the rate of C.S. is so low that it can be considered to be dissatisfaction, the more it negatively affects B.P. (Mittal et al., 1998). If, on the other hand, the company is not aware of a higher level of C.S., the competitive advantage that arises from this higher

1332 P. SUCHÁNEK AND M. KRÁLOVÁ
satisfaction is not revealed. The management of the company will not therefore know the real cause of its higher performance.
Therefore, any incorrect perception of C.S. will jeopardise future competitiveness and business. To ensure long-term performance and business competitiveness it is thus nec-essary to know the true level of C.S. The aim of this article is to determine whether the evaluation of C.S. by company managers is in accordance with the evaluation of C.S. by the customers themselves.
Consideration of the gap that is expected between C.S. as perceived by company man-agement and their customers raises the question: to what extent does this gap, or the size of the influence of C.S., have on the area where the sales take place, i.e., with the seller.Some research has shown that C.S. has a considerable influence on the place of sale (Dagli, 2014). This question was not, however, dealt with in this research, which focused solely on exam-ining the differences in the perception of C.S. by company managers and their customers in the context of performance.
Other research (Arasli, Haktan Ekiz, & Turan Katircioglu, 2008; Arasli, Katircioglu, & Smadi, 2005b; Arasli, Mehtap-Smadi, & Turan Katircioglu, 2005a; Suvittawat, 2015), has shown that C.S. with a product is also affected by employees, i.e., C.S. with the employees and the actual sales process (including additional services). This research, however, focuses on services, where employee presence is necessary during their sale. In the case of man-ufacturing companies, company employees are not part of the sale of the product (in the case of indirect sales). Naturally, though, someone has to sell the company’s products, and they can then influence satisfaction with the product. The influence of employees from (outside) companies on C.S. with the company’s own product was not, however, the sub-ject of this research. The research is focused on an area of the food industry that produces products (goods) for daily consumption. For this reason we might expect a series of studies in the field of C.S. with food products. The opposite is, however, true. There are studies aimed at identifying and comparing customer value, but unrelated to B.P. (Toula, Grunert, & Krystallis, 2015). There are studies focused on products being launched on the market (Cardello, Schutz, & Lesher, 2007) and on product quality (Caswell, Bredahl, & Hooker, 1998). Other studies focus on the technology of production of food products (Senhui, Fletcher, & Rimal, 2005), or on improving the quality of food-product manufacture (Desai, Kotadiya, Makwana, & Patel, 2015).
Studies focused on C.S. are usually based on aggregate indices such as the American customer satisfaction index (A.C.S.I.), and C.S. is generally measured across sectors. The use of aggregate data such as the A.C.S.I. index, COMPUSTAT, etc. is problematic, however, because it is difficult to use at a company level. (Williams & Naumann, 2011).
In addition, the use of aggregate data leads to C.S. being ascertained without any direct connection to the companies where performance is being ascertained. Therefore, our research focused on specific selected companies and their customers so that the findings would be more informative and thus more easily applicable by company managers from the sector concerned.
We compare what the management of companies think about C.S. with the actual per-ceived satisfaction of the customers themselves. Furthermore, we investigate whether C.S., either supposed from the perspective of the companies, or real1 from the perspective of the customers themselves, is higher in companies with better financial performance. We also focus on the degree of association between the companies’ evaluation of C.S. and the real satisfaction of the customers themselves.

ECONOMIC RESEARCH-EKONOMSKA ISTRAŽIVANJA 1333
2. Customer satisfaction
Scientists and researchers have so far failed to agree on a common definition of C.S. (cf. Giese & Cote, 2000). This is related to various broad understandings and conceptions of C.S. Some definitions emphasise the comparison of what customers want, either in the form of goals or wishes, with what they get, and depend solely on the subjective evaluation of the customer. ‘Consumer satisfaction is defined as pleasurable fulfillment. That is, the consumer senses that consumption fulfils some need, desire, goal, or so forth and that this fulfillment is pleasurable’ (Oliver, 1999, p. 34). It is the customers who create the satisfaction criteria and it is also they who conduct the relevant comparisons. From this perspective, C.S. is a subjective value, which depends on the feelings of a particular customer.
Another definition brings an element of psychology into the concept of C.S. ‘Customer satisfaction is the psychological reaction of the customer with respect to his or her prior experience with the comparison between expected and perceived performance’ (Chang, Wang, & Yang, 2009, p. 427). Marketing, especially advertising, is indeed based on this. In this research, however, we have not dealt with the psychological state of mind of the customer when purchasing, so we will not elaborate on this any further.
Other definitions emphasise the influence of customer perception and stress the element of expectation in the form of a comparison as referred to above. This does not have to be related to the subjective and abstract criteria of C.S. directly, as given in the definition of satisfaction mentioned above, but rather indirectly, via comparison with previous consump-tion of the same product. ‘Consumer satisfaction/dissatisfaction in the consumer’s response in a particular consumption experience to the evaluation of the perceived discrepancy between prior expectations and the actual performance of the product as perceived after its acquisition’ (Day, 1984, p. 497). This is how the element of time enters into the definition of C.S. It is enough to follow C.S. in the long term, which means observing it over repeated purchases, and measuring whether C.S. has increased or decreased in comparison with previous purchases of the same product. This eliminates subjective C.S., as satisfaction can be followed via the product and as it changes. This approach was chosen in our research, where we interviewed customers who have long-term experience with the product. It also led to the inclusion of questions on the frequency of surveys of C.S. and the customers’ requirements.
‘The literature identifies two types of satisfactions: transactional and cumulative satisfac-tion’ (Spiteri & Dion, 2004, p. 679). Transactional C.S. can be defined as a specific purchase evaluation upon its implementation (cf. Oliver, 1993) and it is short-term, based on the evaluation of a single purchase.
Cumulative C.S. may be defined as the overall purchasing experience (cf. Fornell, 1992; Johnson & Fornell, 1991). It can be seen as long-term, based on repeated purchases and on overall customer experience with the product, including the evaluation of the selling or supplying party, meaning not only the manufacturer but also the retailer. This definition of C.S. is wider and fits into the framework of the definition of satisfaction as we understand it, for the purpose of our research. Due to the wider definition of cumulative satisfaction we had to include in our research other factors such as the range of the product offering in comparison to those of competitors, and the tradition of the company when compared to its competitors.

1334 P. SUCHÁNEK AND M. KRÁLOVÁ
We can summarise that C.S. is a subjective variable that arises from feelings, perceptions and a comparison of what customers get with what they expect to get. This makes the objective measurement of C.S. very difficult. This problem, however, can be solved by the long-term investigation of C.S. in the sense of researching a product that the customers have a certain experience of, i.e., they have bought it more than once. It should be borne in mind that for customers with repeated experience of the product there may be different variables of satisfaction that are more important for them than for new customers. At the same time, however, this kind of research, with regard to the concept of cumulative satis-faction, is broader and implies an examination of more diverse variables.
3. Methodological bases for the measurement of customer satisfaction
3.1. Hypothesis
C.S. is mostly positive in the way that it affects B.P. In order to increase C.S., it is especially necessary for the company to know the extent to which the customer is satisfied, and that the customer and the company are in agreement on the level of C.S. with regard to the factors used to evaluate C.S. In other words, what the company perceives as the level of satisfaction of its customers should be in accordance with how satisfied its customers actually are. Below, for the sake of brevity, we will refer to an individual company’s view of the satisfaction of its customers as the company’s ‘self-evaluation’ (C.S.E.). The term ‘evaluation of the companies by their customers’ (E.C.C.) will indicate C.S. with the products of individual enterprises. We can thus formulate the first tested hypothesis:
H1: C.S.E. and E.C.C. are the same for individual factors of satisfaction2.
If we expand on the hypothesis of the concordance of companies and their customers when evaluating C.S. and its impact on B.P., it can be assumed that the degree of consensus on the level of C.S. between customers and companies can vary between high-performing companies (H.P.C.) and low-performing companies (L.P.C.). It is expected that H.P.C. are more in agreement with their customers. This means that they are better able to enhance C.S. and hence B.P. Therefore, hypothesis H1 is tested separately in a group of H.P.C. and a group of L.P.C.:
H1a: Self-evaluation of H.P.C. and E.C.C. are the same for individual factors of satisfaction.
H1b: Self-evaluation of L.P.C. and E.C.C. are the same for individual factors of satisfaction.
In order to test the above hypotheses, the correspondence between the customer and the company with regard to C.S. is tested. In this context, the question arises whether the factors of satisfaction convey sufficient information to form a basis for distinguishing between H.P.C. and L.P.C., that is to say, whether the factors of satisfaction take different values for H.P.C. and L.P.C. Taking into account the positive impact of C.S. on B.P., it can be assumed that the evaluations of C.S. for H.P.C. will be higher than those of L.P.C. It is thus possible to formulate the following hypothesis:
H2a: The satisfaction factors observed in E.C.C. have higher values in H.P.C. than in L.P.C.
In this context, it is also interesting to enquire whether there is also a difference in the satisfaction of customers from the perspective of H.P.C. and L.P.C. On this basis, it is pos-sible to formulate the hypothesis:

ECONOMIC RESEARCH-EKONOMSKA ISTRAŽIVANJA 1335
H2b: The satisfaction factors observed in C.S.E. have higher values in H.P.C. than in L.P.C.
It is shown above that C.S.E., regardless of their level of performance, should coincide with E.C.C.3. It can be expected, however, that this assumption does not apply in all cir-cumstances and to all companies. With regard to feedback for businesses, it is interesting to discover the factors where C.S.E. and E.C.C. correspond. It is therefore possible to for-mulate the hypothesis:
H3: C.S.E. and E.C.C. are positively associated for certain individual factors.
3.2. Variables
As part of this research we draw on the quality of the product when measuring C.S. ‘It is generally accepted that customer satisfaction often depends on the quality of product or service offering’ (Jamal & Naser, 2003, p. 29). The research thus emphasises functional attributes such as quality, technical terms and price (Homburg & Rudolph, 2001). Based on the fact that C.S. is also strongly influenced by ‘conative constructs such as behavioral intention and repeat purchase behavior’ (Woodside, Frey, & Daly, 1989, p. 6), we have also included variables from this area in the research. ‘Customer satisfaction with a company’s products or services is often seen as the key to a company’s success and long-term compet-itiveness’ (Hennig-Thurau & Klee, 1997, p. 737). Thanks to the existence of a relationship between C.S. and business competitiveness, we have also included in the survey variables that assess precisely this competitive ability of the products in the companies surveyed. Competitiveness itself is not investigated as an independent field in the survey of C.S., and thus represents a widening of the perspective and scale of C.S. research.
C.S. is generally measured by an aggregate index, which is then referenced to perfor-mance (see Kristensen, Martensen, & Grønholdt, 2002). C.S. within the index is evaluated on the basis of research into the satisfaction of actual customers of the company. Based on investigation, indices were created for various sectors of the economy (Fornell, 1992). The first index was the Swedish Customer Satisfaction Barometer (Fornell, 1992). In subsequent years, other countries began to create their own indices.
The Czech Republic does not have its own index. The extended performance satisfac-tion index (E.P.S.I.) rating is used within Europe (see Eklöf & Westlund, 2002). The Czech Republic is one of more than twenty countries that are being evaluated under the E.P.S.I. rating (Eklöf & Selivanova, 2013). If a company wants to determine the value of the index observed in the country, they can only access older data (for selected services, not including the food industry), currently up to 2012.
The most widely used index is the A.C.S.I. index, which evaluates ‘customer expecta-tions, perceived quality, perceived value, customer satisfaction, customer complaints, and customer loyalty’ (Fornell, Ittner, & Larcker, 1995, p. 29). The E.P.S.I. rating works with the same variables (cf. Eklöf & Westlund, 2002). Therefore, our research included variables such as QUALITY, PRICE, SATISFACTION and COMPLAINT.
The variable QUALITY is conceived as quality in technical terms, and this quality is assessed on a 10-point scale: the greater the number of points, the higher the quality of the product. The variable thus corresponds to the above-mentioned variable of perceived quality. The PRICE variable is conceived as a comparison of the quality of the product in relation to its cost, where the proportion of quality to price is again judged on a 10-point

1336 P. SUCHÁNEK AND M. KRÁLOVÁ
scale: the greater the number of points, the better the quality in relation to the price paid. The design of this variable facilitates an assessment of the value of the product, and this variable corresponds to the perceived value. The variable SATISFACTION is designed as general C.S. with the product, and this satisfaction is also judged on a 10-point scale, the greater the number of points, the higher the satisfaction. The design of this variable cor-responds to the variable of C.S. The COMPLAINT variable is conceived as the number of product complaints. The frequency of claims is again converted into a 10-point scale, the lesser the number of points, the fewer the product complaints. The conception of this variable corresponds to the variable customer complaints.
Another variable that affects C.S. is the adaptation of the product to customer require-ments (Anderson et al., 1997; Du, Jiao, & Tseng, 2006). The ADAPTATION variable is conceived as a measure of customisation, where this measure is again judged on a 10-point scale, the greater the number of points, the greater the degree of adaptation of the product to the customer. The concept of this variable corresponds to the variable customisation, which is included in the A.C.S.I. index (Fornell, Johnson, Anderson, Cha, & Bryant, 1996).
The above-mentioned indices do not work with the competitiveness of an enterprise, but C.S. has an impact on the competitiveness of the company. ‘Customer satisfaction with a company’s products or services is often seen as the key to a company’s success and long-term competitiveness’ (Hennig-Thurau & Klee, 1997, p. 737). When identifying variables that can measure the competitiveness of the company, it is possible to draw on the Consumer’s Buying Decision Model (Dubrovski, 2001). It is obvious from the model that C.S. is related to the fact whether the product was actually purchased, as a customer buys a product on the basis of a comparison of the values of different competing products.
Therefore, we included in our research the variables C_QUALITY, C_TRADITION, C_FLEXIBILITY and C_SCALE, which allow us to assess the value of the product, as well as the value when compared with the competition. The C_QUALITY variable is conceived as the technical quality of the product in comparison with its competitors. It is therefore a modification of the above variable QUALITY. This variable is again assessed on a 10-point scale, the greater the number of points, the higher the technical quality in comparison with competing products. The C_FLEXIBILITY variable is conceived as a measure of the adaptation of the product to the customer compared to its competitors and therefore it is a modification of the above variable ADAPTATION. This variable is assessed on a six-point scale, the greater the number of points, the greater the degree of adaptation in comparison with a competing product.
C.S. is also affected by the range of services related to the product. Opinion on the influence of the product range of services on B.P. is not clear-cut; a wider range of services may not automatically mean better performance of increased costs (see Cusumano, Kahl, & Suarez, 2015). Studies confirm that in the long term, however, a greater range of services offered leads to a company’s better financial performance (Suarez, Cusumano, & Kahl, 2013). Therefore, our research included the variable C_SCALE. The range of services related to the product is ordinarily assessed in time within the company’s product. In the case of this research this was not possible, so to assess the range of services related to the product a comparison with the competition was used. The C_SCALE variable is thus conceived as the range of services related to the product when compared with the range of services related to the product of a competitor. This variable is evaluated on a 10-point scale, the greater the number of points, the greater the range compared with a competitor.

ECONOMIC RESEARCH-EKONOMSKA ISTRAŽIVANJA 1337
As this research is aimed at examining long-term satisfaction, a variable C_TRADITION is introduced that reflects long-term C.S. with the product when compared with the satis-faction of competitors’ products. This variable is assessed on a 10-point scale, with a greater number of points signifying a higher tradition of the company when compared with a com-petitor. In its essence, this variable reflects customer loyalty to the product and is associated with the brand, which allows the company to gain and retain its customers. The brand, at least in sales of food products, has an impact on C.S. (Rubio, Villasenor, & Oubina, 2015). Thus it also indirectly affects the competitiveness and the performance of the company.
The last two variables are to determine whether the companies conducted surveys of C.S. on a regular basis. The TIME_SATISFACTION variable measures the frequency of surveys of C.S. The REQUEST variable measures the frequency of surveys of customer requirements. These variables were also assessed on a 10-point scale, but their interpretation is different and is shown in Table 1.
When examining C.S., its impact on B.P. was also investigated. To measure the perfor-mance we used absolute indicators – generally turnover and profits, as well as ratios – usu-ally R.O.I. or return on assets (R.O.A.) (cf. Terpstra & Verbeeten, 2014). Ratio indicators generally have better explanatory power than absolute indicators, as they are not subject to the influence of company size. Therefore, we chose ratio indicators4. B.P. in relation to C.S. was principally investigated and assessed by the R.O.A. indicator. The relationship between the customer satisfaction barometer for Sweden and the R.O.I. indicator (Anderson et al., 1994) was also investigated and confirmed, as was that between the A.C.S.I. and R.O.A. (Ittner & Larcker, 1996). We therefore decided to measure B.P. using the R.O.A. indicator. This indicator evaluates B.P. as a whole, and if earnings before interest and taxes (E.B.I.T.) is utilised in its design, it makes it possible to evaluate the future potential of the B.P. The R.O.A. indicator also reflects the stakeholder value.
The authors’ findings suggest that it is better to assess performance by more than one indicator, as several ratio indicators are able to better classify B.P. (Suchánek & Králová, 2015). As there is a proven relationship between B.P. measured by the indicators R.O.A., return on equity (R.O.E.) and A.C.S.I. (Aksoy, Cooil, Groening, Keiningham, & Yalçin, 2008; Anderson, Fornell, & Mazvancheryl, 2004), we chose the R.O.E. indicator as the second indicator for evaluating performance in this research. R.O.E. reflects B.P.; this is the part that belongs to the owner, which means that it evaluates the company’s current performance for its owners. The R.O.E. indicator also reflects the shareholder value.
Table 1. interpretation of the scores of the variables REQUEst and timE_satisFaction.
source: authors.
Frequency of the surveys Number of points on the scalenever 1Every 2 years 21 year 34 months 42 months 51 month 62 weeks 71 week 82 days 9Every day 10

1338 P. SUCHÁNEK AND M. KRÁLOVÁ
With regard to the emphasis that researchers place on revenues when investigating B.P. in relation to C.S. (Aksoy et al., 2008; Ittner & Larcker, 1998; Swaminathan, Groening, Mittal, & Thomaz, 2014), we added another indicator to the two above, namely that of asset turnover, which takes into account the amount of sales of the company. This indicator evaluates the speed with which the enterprise is able to turn their assets, that is, change its property into money, and then back again into property. This indicator thus evaluates the performance from the viewpoint of activity in which the company engages in the market.
4. Research methodology and the sample surveyed
4.1. Procedure
The research data was obtained using two types of questionnaires. The first was completed by customers5 for the companies surveyed in Autumn 2013, and it was on this basis that the sample for E.C.C. was created. The second was completed by managers of these companies in Autumn 2013, and this formed the basis for creating the sample for C.S.E. The ques-tionnaire for companies was similar to the one for customers, and within this framework economic data was collected from the balance sheet and profit and loss account for 2012.
Both types of questionnaires were divided into areas devoted to the quality of prod-ucts (QUALITY, PRICE, COMPLAINT), to characteristics of customer buying behaviour (TIME_SATISFACTION, REQUEST, ADAPTATION, SATISFACTION) and to business competitiveness (C_QUALITY, C_TRADITION, C_FLEXIBILITY, C_SCALE).
4.2. Measurement
The questionnaires where the aforementioned variables are examined include a scale of answers to the questions, where a higher value indicates a better evaluation of the company. The only exception is the variable COMPLAINT, the point value of which is derived from the number of complaints per thousand items for the product in the last known year. In this case, a smaller value indicates a better evaluation of the company. For the variables REQUEST and TIME_SATISFACTION an interpretation of the scores is presented in Table 1.
B.P. was evaluated on the basis of financial ratios of profitability (R.O.E., R.O.A.) and of shares asset turnover (A.T.O.). The construction of the indicators was based on the meth-odology used by the authors in previous studies and is consistent with the structures used by the Ministry of Industry and Trade of the Czech Republic (Suchánek & Špalek, 2007).
The companies were divided into ‘high-performing’ and ‘low-performing’ ones. Enterprises with two out of the three indicators (R.O.A., R.O.E., A.T.O.) above the median6, after discarding a priori L.P.C. (Equity <0)7, are those that are regarded as high-performing in the study8. The remaining enterprises were regarded as low-performing by the study.
The statistical significance of the differences between C.S.E. and E.C.C. was, for individ-ual performance factors, derived from paired t-tests (c.f. Tsang & Qu, 2000). The statistical significance of the differences between H.P.C. and L.P.C. was evaluated by two-sample t-tests or by Wilcoxon rank sum tests. In addition, Spearman rank order correlation coefficients and derived tests were used as an association measure between C.S.E. and E.C.C.9 All the tests mentioned were conducted at the α = 10% significance level.

ECONOMIC RESEARCH-EKONOMSKA ISTRAŽIVANJA 1339
4.3. Sample
The research examined two samples (see Section 4.1, Procedure). The first sample consisted of companies in the food industry, with the second sample addressing the customers of these companies. The sample of surveyed companies comprised 80 companies, 77.9% of which were small businesses (with revenues up to €10 million), 14% were medium-sized companies (with revenues of €10–49 million) and 8.1% were large companies (with reve-nues above €49 million).
The sample of customers of the surveyed companies consisted of 5592 respondents. The sample consisted of 49.96% men and 50.04% women. All respondents were students aged 18–25 years. One company accounted for an average of 70 respondents. For each variable, the customer evaluation for any given company was represented by the average value of all respondents evaluating the same company.
5. Results
5.1. A comparison of the factors of CSCS based on self-evaluation and ECCECC
In the research we initially focused on the issue of self-evaluation and E.C.C. for individual factors, and we assumed that these evaluations would be the same (see H1). Table 2 presents an appraisal of the differences between self-evaluation and E.C.C. using sample means. The statistical significance of these differences was assessed on the basis of paired t-tests, and only complete cases were taken into account. A statistically significant difference was demonstrated for every variable apart from COMPLAINT. Therefore, it was only in the number of complaints that the test did not demonstrate a statistically significant difference between self-evaluation and E.C.C. For all other factors of satisfaction there was a significant difference between self-evaluation and E.C.C. Therefore, apart from the complaint factor, we have to reject hypothesis H1.
From the average figures in Table 2 it is clear that the average E.C.C. is worse than C.S.E. for all factors of satisfaction. This also applies to complaints, although the difference here is not statistically significant. With this variable, unlike with the others, a higher value means a worse evaluation of the company.
Table 2. average self-evaluation of companies, evaluation of companies by their customers and the differences for the individual factors of satisfaction.
m stands for sample means.source: authors.
Customer evalua-tion(M)
Enterprise evalua-tion(M)
Difference between cus-tomer evaluation (M) and enterprise evaluation (M) p-value
timE_satisFaction 1.770 6.417 −4,647 0.000REQUEst 1.719 6.143 −4,424 0.000aDaPtation 7.273 8.857 −1.584 0.000satisFaction 6.875 8.380 −1.506 0.000QUaLitY 6.380 8.533 −2.153 0.000PRicE 5.666 6.828 −1.162 0.000comPLaint 1.174 1.037 0.137 0.741c_QUaLitY 6.237 8.373 −2.136 0.000c_tRaDition 5.989 7.753 −1.764 0.000c_FLEXiBiLitY 5.598 8.059 −2.461 0.000c_scaLE 6.018 7.235 −1.217 0.000

1340 P. SUCHÁNEK AND M. KRÁLOVÁ
The biggest difference was observed in the assessments of TIME_SATISFACTION. Here the average value of 1.78 reported by customers can be loosely interpreted as a survey once every two years, while the value of 6.42 reported by companies can be loosely interpreted as once a month. A similarly large difference was also seen in REQUEST, with a similar interpretation.
In contrast, the greatest agreement prevailed in claims, where companies and their customers evaluated their number as a minimum. E.C.C. was worse in all quality fac-tors by approximately two scale points with regard to the technical design and technical performance compared to the competition, with regard to C_FLEXIBILITY, and finally ADAPTATION and C_TRADITIONS. E.C.C. diverged by approximately one scale point with the variables PRICE and C_SCALE.
5.2. A comparison of the factors of customer satisfaction based on self-evaluation and ECCECC in the context of HPCHPC and LPCLPC
Additionally, we focused on C.S.E. and E.C.C. for the individual factors of satisfaction sep-arately in groups of H.P.C. and L.P.C. (see H1a and H1b). We used Tables 3(a) and 3(b) to present an appraisal of the differences between the self-evaluation and E.C.C. separately for a group of H.P.C. and a group of L.P.C. The statistical significance of these differences was again assessed on the basis of paired t-tests, and only complete cases were taken into account.
In the group of H.P.C. there was a significant statistical difference in all variables, includ-ing the number of complaints – COMPLAINT. In the group of L.P.C. there was no statisti-cally significant difference, only in the number of complaints. For all other variables, C.S.E. and E.C.C. varied significantly. We thus have to reject hypotheses H1a and H1b.
Even when dividing the companies into H.P.C. and L.P.C., E.C.C. is for all factors of satisfaction worse than for C.S.E. The only exception is the number of complaints in the set of L.P.C. Here E.C.C. is better than C.S.E., but it is statistically insignificant.
It therefore appears that the classification of companies into H.P.C. and L.P.C. does not lead to any different conclusions than when all the companies were assessed together.
Table 3. (a) average self-evaluation of companies, evaluation of companies by their customers and the differences for the individual factors of satisfaction in a group of high-performing enterprises.
source: authors.
Customer evaluation H.P.C.(M)
Enterprise evaluation H.P.C.(M)
Difference between customer and enter-prise evaluations for
H.P.C. p-valuetimE_satisFaction 1.814 6.520 −4,706 0.000REQUEst 1.742 6.536 −4,794 0.000aDaPtation 7.330 8.800 −1.469 0.000satisFaction 6.963 8.455 −1.492 0.000QUaLitY 6.488 8.794 −2.306 0.000PRicE 5.689 6.656 −0.967 0.023comPLaint 1.158 0.295 0.863 0.001c_QUaLitY 6.365 8.618 −2.253 0.000c_tRaDition 6.109 8.061 −1.951 0.000c_FLEXiBiLitY 5.667 8.033 −2.366 0.000c_scaLE 6.062 7.516 −1.454 0.001
ECONOMIC RESEARCH-EKONOMSKA ISTRAŽIVANJA 1341
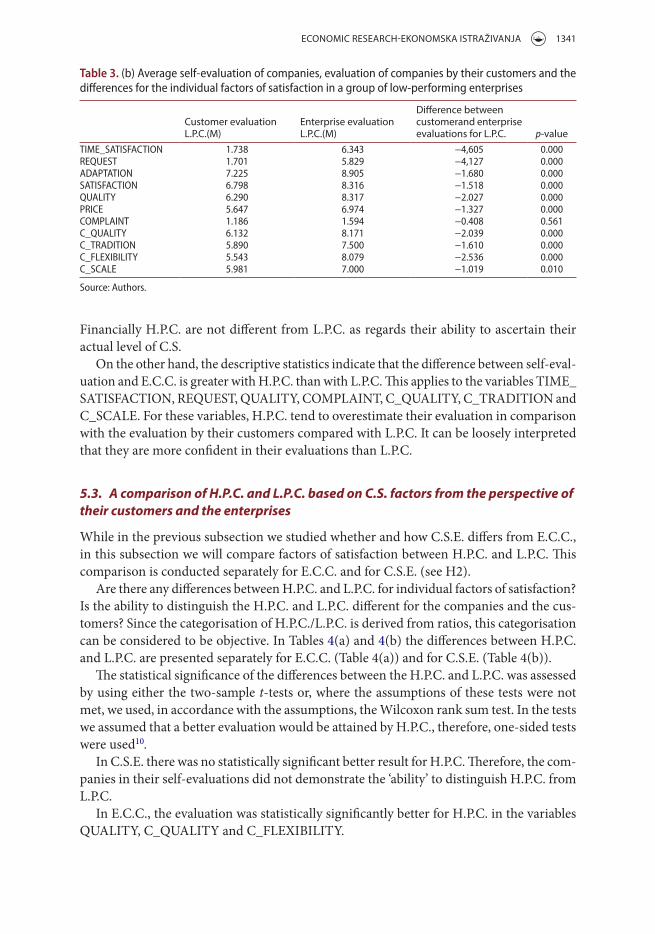
Financially H.P.C. are not different from L.P.C. as regards their ability to ascertain their actual level of C.S.
On the other hand, the descriptive statistics indicate that the difference between self-eval-uation and E.C.C. is greater with H.P.C. than with L.P.C. This applies to the variables TIME_SATISFACTION, REQUEST, QUALITY, COMPLAINT, C_QUALITY, C_TRADITION and C_SCALE. For these variables, H.P.C. tend to overestimate their evaluation in comparison with the evaluation by their customers compared with L.P.C. It can be loosely interpreted that they are more confident in their evaluations than L.P.C.
5.3. A comparison of H.P.C. and L.P.C. based on C.S. factors from the perspective of their customers and the enterprises
While in the previous subsection we studied whether and how C.S.E. differs from E.C.C., in this subsection we will compare factors of satisfaction between H.P.C. and L.P.C. This comparison is conducted separately for E.C.C. and for C.S.E. (see H2).
Are there any differences between H.P.C. and L.P.C. for individual factors of satisfaction? Is the ability to distinguish the H.P.C. and L.P.C. different for the companies and the cus-tomers? Since the categorisation of H.P.C./L.P.C. is derived from ratios, this categorisation can be considered to be objective. In Tables 4(a) and 4(b) the differences between H.P.C. and L.P.C. are presented separately for E.C.C. (Table 4(a)) and for C.S.E. (Table 4(b)).
The statistical significance of the differences between the H.P.C. and L.P.C. was assessed by using either the two-sample t-tests or, where the assumptions of these tests were not met, we used, in accordance with the assumptions, the Wilcoxon rank sum test. In the tests we assumed that a better evaluation would be attained by H.P.C., therefore, one-sided tests were used10.
In C.S.E. there was no statistically significant better result for H.P.C. Therefore, the com-panies in their self-evaluations did not demonstrate the ‘ability’ to distinguish H.P.C. from L.P.C.
In E.C.C., the evaluation was statistically significantly better for H.P.C. in the variables QUALITY, C_QUALITY and C_FLEXIBILITY.
Table 3. (b) average self-evaluation of companies, evaluation of companies by their customers and the differences for the individual factors of satisfaction in a group of low-performing enterprises
source: authors.
Customer evaluation L.P.C.(M)
Enterprise evaluation L.P.C.(M)
Difference between customerand enterprise evaluations for L.P.C. p-value
timE_satisFaction 1.738 6.343 −4,605 0.000REQUEst 1.701 5.829 −4,127 0.000aDaPtation 7.225 8.905 −1.680 0.000satisFaction 6.798 8.316 −1.518 0.000QUaLitY 6.290 8.317 −2.027 0.000PRicE 5.647 6.974 −1.327 0.000comPLaint 1.186 1.594 −0.408 0.561c_QUaLitY 6.132 8.171 −2.039 0.000c_tRaDition 5.890 7.500 −1.610 0.000c_FLEXiBiLitY 5.543 8.079 −2.536 0.000c_scaLE 5.981 7.000 −1.019 0.010

1342 P. SUCHÁNEK AND M. KRÁLOVÁ
For other factors of satisfaction, even the customers were unable to distinguish H.P.C. from L.P.C. to any statistical significance. Of note, however, is the fact that, from the cus-tomers’ perspective, for all factors of performance the evaluations are better for H.P.C. (see column four, a negative value for the variable COMPLAINT relates to the interpretation of the values in the opposite direction). This unambiguous conclusion is not possible for C.S.E. It seems, then, that customers are, after all, better able to distinguish the performance of H.P.C. and L.P.C. So we proved that hypothesis H2a is valid for the factors QUALITY, C_QUALITY and C_FLEXIBILITY.
Although statistical significance was only demonstrated for these factors, for all factors evaluated by customers the descriptive statistics came out in accordance with the expec-tations that H.P.C. would be better evaluated. Hypothesis H2b was not proved for any of the factors.
Table 4. (a) a comparison of high-performing and low-performing companies from the perspective of the customers’ satisfaction evaluation (comPLaint and c_scaLE were tested by Wilcoxon rank sum test; other variables by two-sample t-test).
source: authors.
Enterprise evalua-tion H.P.C.(M)
Enterprise evalua-tion H.P.C.(M)
Difference between H.P.C. and L.P.C. performance in
customers’ perspective
Two-sided p-value (t-test or Wilcoxon
test)timE_satisFaction 1.837 1.750 0.087 0.191REQUEst 1.770 1.715 0.055 0.437aDaPtation 7.331 7.229 0.102 0.237satisFaction 6.964 6.786 0.178 0.138QUaLitY 6.479 6.282 0.197 0.063PRicE 5.704 5.664 0.040 0.501comPLaint 1.148 1.190 −0.042 0.447c_QUaLitY 6.350 6.123 0.227 0.007c_tRaDition 6.057 5.896 0.161 0.231c_FLEXiBiLitY 5.652 5.545 0.107 0.089c_scaLE 6.053 5.994 0.059 0.840
Table 4. (b) a comparison of high-performing and low-performing companies from the perspective of the companies’ satisfaction evaluation (QUaLitY and comPLaint were tested by Wilcoxon rank sum test; other variables by two-sample t-test).
source: authors.
Enterprise evalua-tion H.P.C.(M)
Enterprise evalua-tion H.P.C.(M)
Difference between H.P.C. and L.P.C. performance in enterprises’ perspective
Two-sided p-value (t-test or Wilcoxon
test)timE_satisFaction 6.571 6.316 0.256 0.676REQUEst 6.400 5.872 0.528 0.324aDaPtation 8.711 8.870 −0.159 0.648satisFaction 8.333 8.333 0.000 1.000QUaLitY 8.622 8.378 0.244 0.146PRicE 6.743 6.929 −0.186 0.714comPLaint 0.275 1.510 −1.235 0.100c_QUaLitY 8.500 8.114 0.386 0.266c_tRaDition 8.056 7.558 0.497 0.307c_FLEXiBiLitY 7.909 8.073 −0.164 0.731c_scaLE 7.324 6.975 0.349 0.534

ECONOMIC RESEARCH-EKONOMSKA ISTRAŽIVANJA 1343
5.4. Measure of association of C.S.E. and E.C.C. based on the factors of customer satisfaction
In the last part of the research, it was ascertained how strongly C.S.E. and E.C.C. were asso-ciated with the individual factors of satisfaction (see H3). If we go back to the results from the first part of the research, we have shown that, apart from for the number of complaints, all the factors of satisfaction were evaluated as statistically significantly different from the perspective of customers and different from the perspective of the companies. Selected statistics also show a significantly lower rating from the customers’ perspective than from the companies’ perspective. This does not necessarily mean that E.C.C. and C.S.E. are not related. Perhaps it only reflects the more generally critical or pessimistic view of customers when compared to firms, but from both perspectives the trends can be in agreement.
For this purpose we ranked the companies from best to worst, with respect to the indi-vidual variables from the viewpoint of customers and companies, and we then investigated the rank dependence between the two orders. It was, therefore, appropriate to measure the degree of association between customer opinion and the opinion of companies using the Spearman R, and test if it is significantly different from zero against the alternative hypothesis that it is positive. This means that a better evaluation from the customer is associated with a better evaluation from the companies. If E.C.C. is similar to C.S.E., then the Spearman R is positive.
Tests were conducted for each variable separately, and these were for samples of all com-panies, for a sample of L.P.C. and for a sample of H.P.C. The listed p-values correspond to the right-tailed test. A statistically significant direct relationship between the E.C.C. and C.S.E. was demonstrated for the variables mentioned in Table 5.
Furthermore, within the variable TIME_SATISFACTION, for the sample of L.P.C., p = 0.104 (Spearman R = 0.218) it is just above a level of significance of 10%, so it can be considered that with this variable there might be a weak direct link between E.C.C. and the C.S.E. For the other variables, the Spearman sample coefficient was so small that it did not demonstrate a statistically significant positive correlation between the opinions of customers and the opinions of enterprises. Therefore, we proved that hypothesis H3 is valid for the above factors.
The result of this research shows that enterprises should improve their self-evalua-tions, especially for those factors that did not show a strong positive association with the evaluations of customers, namely, TIME_SATISFACTION, REQUEST, ADAPTATION, SATISFACTION, QUALITY, C_QUALITY and C_FLEXIBILITY. They should strive to do
Table 5. variables directly affecting the relationship between the evaluation of companies by their cus-tomers and the self-evaluation of companies.
source: authors.
Variable Sample p-value Spearman RPRicE all companies 0.004 0.314PRicE high-performing companies 0.00058 0.54comPLaint all companies 0.059 0.199c_tRaDition all companies 0.0138 0.257c_tRaDition Low-performing companies 0.0458 0.27c_scaLE all companies 0.038 0.216c_scaLE Low-performing companies 0.008 0.39

1344 P. SUCHÁNEK AND M. KRÁLOVÁ
this even more so as the factors QUALITY, C_QUALITY and C_FLEXIBILITY are, from the perspective of customers, significantly better for H.P.C. than for L.P.C.
6. Conclusions
Enterprises tend to overestimate themselves in their self-evaluations in relation to E.C.C., regardless of whether they are H.P.C. or L.P.C. Apart from the variable COMPLAINT, the differences between the C.S.E. and E.C.C. were statistically significant. The absolute numbers of the observed samples of E.C.C. are shifted to the left, that is, towards the lower values of the scale, away from C.S.E. This confirmed the hypotheses in the Introduction that with regard to C.S. there is a gap between the companies’ self-evaluation and that of their customers. Moreover, enterprises mistakenly believe that C.S. is higher than it actually is.
Customers are able to better differentiate H.P.C. from L.P.C., that is, they are ‘more sensi-tive’ in distinguishing between H.P.C. and L.P.C. Here it should be emphasised that H.P.C. attained better evaluations than L.P.C., thus the factors of satisfaction are actually positively associated with the B.P. With this we demonstrated the relationship between C.S. and B.P., which reflects the conclusions of previously conducted studies (cf. Anderson et al., 1997; Ittner & Larcker, 1998; Morgan & Rego, 2006).
Of course, we reached this result solely on the basis of E.C.C., not on the basis of C.S.E. For C.S.E. there were no statistically significant differences between H.P.C. and L.P.C. This suggests that companies wrongly evaluate C.S. regardless of their level of performance. For some factors of satisfaction, both C.S.E. and E.C.C. show similar trends, although they differ in absolute terms. For these variables, we can say that evaluation by customers is in accordance with the evaluation of companies.
For variables where there is no convergence, C.S.E. needs to improve in order to coin-cide with the customers’ perspective, all the more so given that for three of these variables customers showed a statistically significant ability to differentiate the level of B.P., namely for the variables QUALITY, C_QUALITY and C_FLEXIBILITY. Even for those variables where the ability of customers to distinguish was not statistically proven, when based on a sample mean, the evaluation of H.P.C. was better than for L.P.C. Therefore, particularly in the three areas above, the customers’ perspective of reality is more accurate and companies should seek both better self-evaluation and also higher scores for these factors in order to increase their financial performance. It can be concluded that if C.S. is rated highly in the above-mentioned variables, it positively influences B.P., which is in line with the conclusions of previously conducted studies (cf. Anderson et al., 1997, 2004; Williams & Naumann, 2011).
If C.S. affects B.P., it can be concluded that the company must adapt its product to the customer. Only by doing so can the company achieve higher C.S. and better performance. This relationship has also been shown in numerous studies (cf. Calantone, Vickery, & Dröge, 1995; Duray, 2002).
From our research it is clear that C.S. as assessed by the company is, at least, very impre-cise, that is to say it provides the company with a very imperfect and misleading view of C.S. This might also be a reason for a company’s performance either not improving at all or not as much as it could have improved if it had correctly evaluated the C.S. factors.
Different perceptions of C.S. lead to different expectations, and if C.S. is perceived to be higher by companies than by their customers, the companies’ expectations regarding the

ECONOMIC RESEARCH-EKONOMSKA ISTRAŽIVANJA 1345
product are higher than those of customers. This creates the risk that if these expectations are transferred to the customers, it will lead to the unfulfilled expectations of customers and hence to lower satisfaction and consequently to lower B.P. ‘It is also more or less generally agreed that positive disconfirmation (better than expected) results in satisfaction while negative disconfirmation (worse than expected) results in dissatisfaction’ (Day, 1984, p. 497).
It was discovered from the research (at least into services) that there is a difference between customer perception and expectation caused by ignorance of these expectations on the part of company employees (Arasli et al., 2005a, 2005b), which is then reflected in the company’s lower efficiency (Zeithaml, Berry, & Parasuraman, 1993). Due to the fact that the products of these companies are sold indirectly to the end customer, it is possible that shop staff (cf. Arasli et al., 2005a) and the shop itself (cf. Dagli, 2014) also have an influence in the difference in C.S. as it is perceived by the company management and the customer.
The research shows that companies overestimate C.S. in all areas. As a result they receive an inaccurate picture of C.S. This increases the risk of erroneous managerial decisions in C.S. and the likelihood of the company achieving a lower level of performance. On the basis of this research we can legitimately assume that at least part of the problem with performance is due to erroneous surveys into the satisfaction of their consumers, or by not processing properly the information obtained.
Even though the evaluation of C.S. by companies is generally overestimated when com-pared with the views of customers, some factors of satisfaction (price, complaints, tradition, range of services, and perhaps also the frequency of surveys of customer satisfaction) are, from both the perspective of the companies and the customers, in agreement, at least in terms of trends. Nevertheless, these account for only some of the factors that make up the overall picture of C.S.
It is necessary, however, to determine by how much C.S.E. and E.C.C. differ, so that this difference could be projected into the evaluation of the company (including its perfor-mance). This would make it possible to refine the future C.S.E. with regard to these factors and estimate their performance. In this respect, however, the problem may be the instability of customer evaluation over time in the surveyed country (here in the Czech Republic) (Eklöf & Selivanova, 2013).
At the same time, it is necessary to ascertain whether and to what extent the difference in the assessment of C.S. by the company and its customer is affected by the shop and its employees, i.e., by the satisfaction with this shop and its employees selling the product. Some research (Arasli et al., 2005b) indicates that the problem in the difference (gap) in the perception of C.S. could be caused by various segments within a group of customers, or whether these are private or state companies (Arasli et al., 2008). In the case of the Czech Republic and this research, however, we consider the group of customers to be homoge-nous, unlike the customers in north and south Cyprus (cf. Arasli et al., 2005b). Whether a company is state-owned or private is also irrelevant here as almost 100% of the companies in the food industry in the Czech Republic are private.
The research also shows that it is also appropriate to incorporate an assessment of the competitiveness of the company and its products into the evaluation of C.S. The variables assessing the competitive ability of the company proved to be just as relevant as the standard variables evaluating C.S. Thase variables assessing competitiveness are not yet an integral part of the commonly used models of evaluation of C.S., such as the A.C.S.I. model or the E.P.S.I. rating.

1346 P. SUCHÁNEK AND M. KRÁLOVÁ
7. Implications
7.1. Limitations of the research
One limitation of this study was the focus on customers – students who represent a spe-cific group of customers. It would, therefore, be useful to carry out the research on a more varied sample of respondents. Another limitation is the sample of food enterprises, which includes only a limited and specific part of market output. It would be advisable in the future to conduct research on a sample of service companies and also on samples of companies from other sectors, such as the manufacturing industry, so that the research would include services and other products.
7.2. Directions for future research
This research examined the food industry where students were the customers. Further research should, therefore, focus on customers who are not students. It would be suitable to choose a research sample structure in accordance with the population structure from the appropriate economy. It would also be suitable to expand the research to other areas of the manufacturing industry where products are sold indirectly (e.g., furniture, electronics goods, clothes, etc.).
Research with a more stratified sample of respondents from a sample of businesses in the food industry (or in other industries) would then not only have the potential to verify the gap between C.S. of business managers (employees) and their customers, but also to compare the size of this gap across businesses and sectors. An interesting study could also be the search for the causes of the aforementioned C.S. gap, including the discovery of the differences between the causes within a business or industry.
With regard to the influence of C.S. with the seller on the satisfaction of the product being sold, which has been proved by some research (Dagli, 2014), it is possible to carry out research in the context of C.S. with the relevant trader, i.e., to find out this satisfaction and its influence on C.S. with the relevant product. Also, in accordance with research by Suvittawat (2015), it is proposed to include into the research the impact of employees (salespeople) on C.S. with the product, as recommended by, for example, Arasli et al. (2005a), including the effect on the gap between C.S. from the point of view of the management of the company producing the product and, on the other hand, the satisfaction of its customers as perceived by the customers themselves.
7.3. Implications for managerial practice
Given that, for the most part, food products are not sold directly to the final consumer, the most important thing for company managers to know is that their information about consumer satisfaction (the end customers) is incorrect. The customer is not as satisfied as the management supposes. If the information about C.S. is incorrect (overestimated), then the view of product quality and the competitiveness of the company (overrated) is also erroneous. Due to the fact that C.S. is lower than management expects, the quality of the product and the competitiveness of the company are also lower. Consumers do not buy as many products as management expects, nor do they return and buy the product again. As

ECONOMIC RESEARCH-EKONOMSKA ISTRAŽIVANJA 1347
a result the sales, earnings and profitability of the company are not as large as they could be. The B.P. is, therefore, lower than the management might expect.
An incorrect identification of C.S. leads to an incorrect identification of competitive advantages. It is, therefore, essential that company management should not only investigate C.S., but also correctly identify this satisfaction. Only then can the product be better adapted to customers’ needs. By increasing C.S. the company can gain competitive advantage and improve the performance of the company.
In addition, the management must regularly identify the satisfaction and requirements of its customers, because C.S. changes over time. At the same time, it is appropriate to focus not only on the variables that detect C.S., but also on the variables assessing the competitive ability of the company compared with the competition.
Notes
1. We would like to emphasise the difference between the perception of C.S. of customers and company management. We start from the assumption that only a real customer can correctly evaluate C.S. and, from this point of view, customer evaluation is real. If differences exist in the evaluation of C.S. by customers and by the company management, then the management has a problem to solve and, from this point of view, the evaluation of C.S. by the management is not real or, to express it better, the perspective is misleading.
2. As the perception of product quality is a part of C.S., our hypothesis 1 was inspired by hypothesis 1 from Dedeoğlu and Demirer (2015, p. 135). In addition, as our research also includes B.P. our hypothesis 1 is further divided into hypotheses 1a and 1b in order to include the factor of B.P. Hypothesis 3 then augments hypotheses 1a and 1b by focusing directly on factors where there is an agreement between the customer and the management.
3. Hypotheses 2a and 2b were inspired by hypothesis H1 of Anderson et al. (Anderson et al., 1994, p. 56). As far as we know, there was no research into the difference in the view of C.S. by company management and their customers in the context of products.
4. Ratios have been used in, for example, Sun and Kim (2013).5. We instructed respondents that they had to answer the questionnaire for a company that they
knew. The company was randomly generated for the customer, and if they did not know it, another was generated until the respondent knew the company.
6. Medians of ratios were used, for example, in Katchova and Enlow (2013).7. The inclusion of a company with negative equity (Equity <0) among L.P.C. was carried out
mainly to avoid including the company among H.P.C. when there is not only negative equity, but also profit, and the R.O.E. variable will as a result be positive and high.
8. When assessing companies’ financial performance, we considered a complex approach based on a group of financial ratios to be much better than an approach based on just a single financial ratio. This complex approach acquires more information about companies’ financial performance than just a single financial ratio. When considering three variables (R.O.A., R.O.E., A.T.O.) instead of just one variable we may obtain eight possible results for a particular company: one extreme result is that the company performs above the medians of all ratios R.O.A., R.O.E., A.T.O.; another extreme result is when the company performs below all three medians. There are six further possibilities, however; for example, a company can perform above R.O.A. and R.O.E. medians but below the A.T.O. median, etc. Our target was not to get eight groups of companies rather just two groups of ‘better’ and ‘worse’ companies. For that reason eight possible outcomes were mapped into a sequence of three binary results: four better outcomes (111, 110, 101, 011) are referred to as ‘high performance’ and four worse outcomes (100, 010, 001, 000) are referred to as ‘low performance’. The unit stands for performance above the median and zero for performance below the median of the considered financial ratio. This fair approach does not give preference to any of the financial ratios and

1348 P. SUCHÁNEK AND M. KRÁLOVÁ
clearly separates companies into those that are better and those that are worse (with regard to the above-mentioned financial ratios simultaneously).
9. Pair comparisons were used in researching the differences between the opinions of managers and the customers of their companies by Tsang, Qu (2000). When researching these differences, a questionnaire was used.
10. The statement that ‘customers’ satisfaction performance is better in a group of H.P.C. rather than in a group of L.P.C.’ is associated with the alternative hypothesis, not the null hypothesis.
Acknowledgements
This paper is published as a part of specific research entitled Quality Management and Enterprise Competitiveness (MUNI/A/0799/2013).
Disclosure statement
No potential conflict of interest was reported by the authors.
Funding
This work was supported by the Quality Management and Enterprise Competitiveness [grant number MUNI/A/0799/2013].
References
Aksoy, L., Cooil, B., Groening, C., Keiningham, T. L., & Yalçin, A. (2008). The long-term stock market valuation of customer satisfaction. Journal of Marketing, 72, 105–122.
Anderson, E. W., Fornell, C., & Lehmann, D. R. (1994). Customer satisfaction, market share, and profitability: Findings from Sweden. Journal of Marketing, 58, 53–66.
Anderson, E. W., Fornell, C., & Rust, R. T. (1997). Customer satisfaction, productivity, and profitability: Differences between goods and services. Marketing science, 16, 129–145.
Anderson, E. W., Fornell, C., & Mazvancheryl, S. K. (2004). Customer satisfaction and shareholder value. Journal of Marketing, 68, 172–185.
Arasli, H., Mehtap-Smadi, S., & Turan Katircioglu, S. (2005). Customer service quality in the Greek Cypriot banking industry. Managing Service Quality: An International Journal, 15, 41–56.
Arasli, H., Katircioglu, S., & Smadi, S. M. (2005). Service quality in commercial banking: Empirical evidence from Turkish and Greek speaking areas of Cyprus. International Journal of Bank Marketing, 23, 508–526.
Arasli, H., Haktan Ekiz, E., & Turan Katircioglu, S. (2008). Gearing service quality into public and private hospitals in small islands: Empirical evidence from Cyprus. International Journal of Health Care Quality Assurance, 21, 8–23.
Busacca, B., & Padula, G. (2005). Understanding the relationship between attribute performance and overall satisfaction: Theory, measurement and implications. Marketing Intelligence & Planning, 23, 543–561.
Calantone, R. J., Vickery, S. K., & Dröge, C. (1995). Business performance and strategic new product development activities: An empirical investigation. Journal of Product Innovation Management, 12, 214–223.
Cardello, A. V., Schutz, H. G., & Lesher, L. L. (2007). Consumer perceptions of foods processed by innovative and emerging technologies: A conjoint analytic study. Innovative Food Science & Emerging Technologies, 8, 73–83.
Caswell, J. A., Bredahl, M. E., & Hooker, N. H. (1998). How quality management metasystems are affecting the food industry. Review of Agricultural Economics, 20, 547–557.

ECONOMIC RESEARCH-EKONOMSKA ISTRAŽIVANJA 1349
Chang, H. H., Wang, Y.-H., & Yang, W.-Y. (2009). The impact of e-service quality, customer satisfaction and loyalty on e-marketing: Moderating effect of perceived value. Total Quality Management, 20, 423–443.
Cusumano, M. A., Kahl, S. J., & Suarez, F. F. (2015). Services, industry evolution, and the competitive strategies of product firms. Strategic Management Journal, 36, 559–575.
Dagli, O. (2014). Consumer attributes and store perceptions: An integrated study of grocery shopping behavior in north Cyprus. International Journal of Economic Perspectives, 8, 50.
Day, R. L. (1984). Modeling choices among altemative response to dissatisfaction. In T. C. Kinnear (Ed.), Advances in Consumer Research, Vol. 11 (pp. 496–499). Provo, UT: Association for Consumer Research.
Dedeoğlu, B. B., & Demirer, H. (2015). Differences in service quality perceptions of stakeholders in the hotel industry. International Journal of Contemporary Hospitality Management, 27, 130–146.
Desai, D. A., Kotadiya, P., Makwana, N., & Patel, S. (2015). Curbing variations in packaging process through Six Sigma way in a large-scale food-processing industry. Journal of Industrial Engineering International, 11, 119–129.
Du, X., Jiao, J., & Tseng, M. M. (2006). Understanding customer satisfaction in product customization. The International Journal of Advanced Manufacturing Technology, 31, 396–406.
Dubrovski, D. (2001). The role of customer satisfaction in achieving business excellence. Total Quality Management, 12, 920–925.
Duray, R. (2002). Mass customization origins: Mass or custom manufacturing? International Journal of Operations & Production Management, 22, 314–328.
Eklöf, J., & Selivanova, I. (2013). EPSI rating international benchmark trends for customer satisfaction and society activity. Retrieved from http://www.epsi-czechrepublic.org/images/stories/results/press_epsi-13_economy-1.pdf.
Eklöf, J. A., & Westlund, A. H. (2002). The pan-European customer satisfaction index programme—Current work and the way ahead. Total Quality Management, 13, 1099–1106.
Fornell, C. (1992). A national customer satisfaction barometer: The Swedish experience. The Journal of Marketing, 56, 6–21.
Fornell, C., Ittner, C. D., & Larcker, D. F. (1995). Understanding and using the American Customer Satisfaction Index (ACSI): Assessing the financial impact of quality initiatives. Paper presented at IMPRO 95: Juran Institute’s Conference on Managing for Total Quality, Juran Institute, Wilton, CO.
Fornell, C., Johnson, M. D., Anderson, E. W., Cha, J., & Bryant, B. E. (1996). The American Customer Satisfaction Index: Nature, purpose, and findings. The Journal of Marketing, 60, 7–18.
Giese, J. L. & Cote, J. A. (2000). Defining consumer satisfaction. Academy of Marketing Science Review, 1, 1–22.
Hennig-Thurau, T., & Klee, A. (1997). The impact of customer satisfaction and relationship quality on customer retention: A critical reassessment and model development. Psychology & Marketing, 14, 737–764.
Homburg, Ch & Rudolph, B. (2001). Customer satisfaction in industrial markets: Dimensional and multiple role issues. Journal of Business Research, 52, 15–33.
Ittner, Ch D & Larcker, D. F. (1996). Measuring the impact of quality initiatives on firm financial performance. In Teror, D. P., & Ghosh, S. (Eds.), Advances in the management of organizational quality (Vol. 1: pp. 1–37). Greenwich, CO: JAI Press.
Ittner, Ch D & Larcker, D. F. (1998). Are nonfinancial measures leading indicators of financial performance? An analysis of customer satisfaction. Journal of Accounting Research, 36, 1–35.
Jamal, A., & Naser, K. (2003). Factors influencing customer satisfaction in the retail banking sector in Pakistan. International Journal of Commerce and Management, 13, 29–53.
Johnson, M. D., & Fornell, C. (1991). Framework for comparing customer satisfaction across individuals and product categories. Journal of Economic Psychology, 12, 267–286.
Katchova, A. L., & Enlow, S. J. (2013). Financial performance of publicly-traded agribusinesses. Agricultural Finance Review, 73, 58–73.
Krajňáková, E., Navikaite, A., & Navickas, V. (2015). Paradigm shift of small and medium-sized enterprises competitive advantage to management of customer satisfaction. Engineering Economics, 26, 327–332.

1350 P. SUCHÁNEK AND M. KRÁLOVÁ
Kristensen, K., Martensen, A., & Grønholdt, L. (2002). Customer satisfaction and business performance. In A. Neely (Ed.), Business performance measurement. Theory and practice (pp. 279–294). Cambridge: Cambridge University Press.
Mittal, V., Ross, W. T., & Baldasare, P. M. (1998). The asymmetric impact of negative and positive attribute-level performance on overall satisfaction and repurchase intentions. Journal of Marketing, 62, 33–47.
Morgan, N. A., & Rego, L. L. (2006). The value of different customer satisfaction and loyalty metrics in predicting business performance. Marketing Science, 25, 426–439.
Oliver, R. L. (1993). A conceptual model of service quality and service satisfaction: Compatible goals, different concepts. Advances in Services Marketing and Management, 2, 65–85.
Oliver, R. L. (1999). Whence consumer loyalty? The Journal of Marketing, 63, 33–44.Rubio, N., Villasenor, N., & Oubina, J. (2015). Consumer identification with store brands: Differences
between consumers according to their brand loyalty. BRQ Business Research Quarterly, 18, 111–126.Rust, R. T., & Keiningham, T. L. (1994). Return on quality: Measuring the financial impact of your
company’s quest for quality. Chicago, IL: Probus.Rust, R. T., Zahorik, A. J., & Keiningham, T. L. (1995). Return on quality (ROQ): Making service
quality financially accountable. Journal of Marketing, 59, 58–70.Saeidi, S. P., Sofian, S., Saeidi, P., Saeidi, S. P., & Saeidi, S. A. (2015). How does corporate social
responsibility contribute to firm financial performance? The mediating role of competitive advantage, reputation, and customer satisfaction. Journal of Business Research, 68, 341–350.
Senhui, H., Fletcher, S., & Rimal, A. (2005). Attitudes, acceptance, and consumption: The case of beef irradiation. Journal of Food Distribution Research, 36, 65–70.
Spiteri, J. M., & Dion, P. A. (2004). Customer value, overall satisfaction, end-user loyalty, and market performance in detail intensive industries. Industrial Marketing Management, 33, 675–687.
Suarez, F. F., Cusumano, M. A., & Kahl, S. J. (2013). Services and the business models of product firms: An empirical analysis of the software industry. Management Science, 59, 420–435.
Suchánek, P., & Králová, M. (2015). The possibility of evaluating an enterprise’s performance in terms of evaluating its customer satisfaction. In 2nd International Multidisciplinary Scientific Conference on Social Sciences & Arts SGEM 2015 (pp. 491–498). Sofia: SGEM International Multidisciplinary Scientific Conference on Social Sciences and Arts.
Suchánek, P., & Špalek, J. (2007). Financial measuring of the Czech Republic companies competitiveness. The Business Review, 9, 78–85.
Sun, K. A., & Kim, D. Y. (2013). Does customer satisfaction increase firm performance? An application of American Customer Satisfaction Index (ACSI). International Journal of Hospitality Management, 35, 68–77.
Suvittawat, A. (2015). Service quality at Thailand’s Siam Commercial Bank: Chonburi Province. International Journal of Economic Perspectives, 9, 21.
Swaminathan, V., Groening, C., Mittal, V., & Thomaz, F. (2014). How achieving the dual goal of customer satisfaction and efficiency in mergers affects a firm’s long-term financial performance. Journal of Service Research, 17, 182–194.
Terpstra, M., & Verbeeten, F. H. (2014). Customer satisfaction: Cost driver or value driver? Empirical evidence from the financial services industry. European Management Journal, 32, 499–508.
Toula, P., Grunert, K. G., & Krystallis, A. (2015). Consumer value perceptions of food products from emerging processing technologies: A cross-cultural exploration. Food Quality and Preference, 39, 95–108.
Tsang, N., & Qu, H. (2000). Service quality in China’s hotel industry: A perspective from tourists and hotel managers. International Journal of Contemporary Hospitality Management, 12, 316–326.
Williams, P., & Naumann, E. (2011). Customer satisfaction and business performance: A firm-level analysis. Journal of Services Marketing, 25, 20–32.
Woodside, A. G., Frey, L. L., & Daly, R. T. (1989). Linking service quality, customer satisfaction, and behavioral intention. Journal of Health Care Marketing, 9, 5–17.
Zeithaml, V. A., Berry, L. L., & Parasuraman, A. (1993). The nature and determinants of customer expectations of service. Journal of the Academy of Marketing Science, 21, 1–12.