
Customer-Oriented Planning Strategies for Active ...
76
C PER C PER Center for Advanced Power Engineering Research Customer-Oriented Planning Strategies for Active Distribution Systems David Lubkeman & Ning Lu North Carolina State University Ramtin Hadidi & Jesse Leonard Clemson University 1
Transcript of Customer-Oriented Planning Strategies for Active ...
C PER
C PERCenter for Advanced Power Engineering Research
Customer-Oriented Planning Strategies for Active Distribution Systems
David Lubkeman & Ning LuNorth Carolina State University
Ramtin Hadidi & Jesse LeonardClemson University
1
C PER
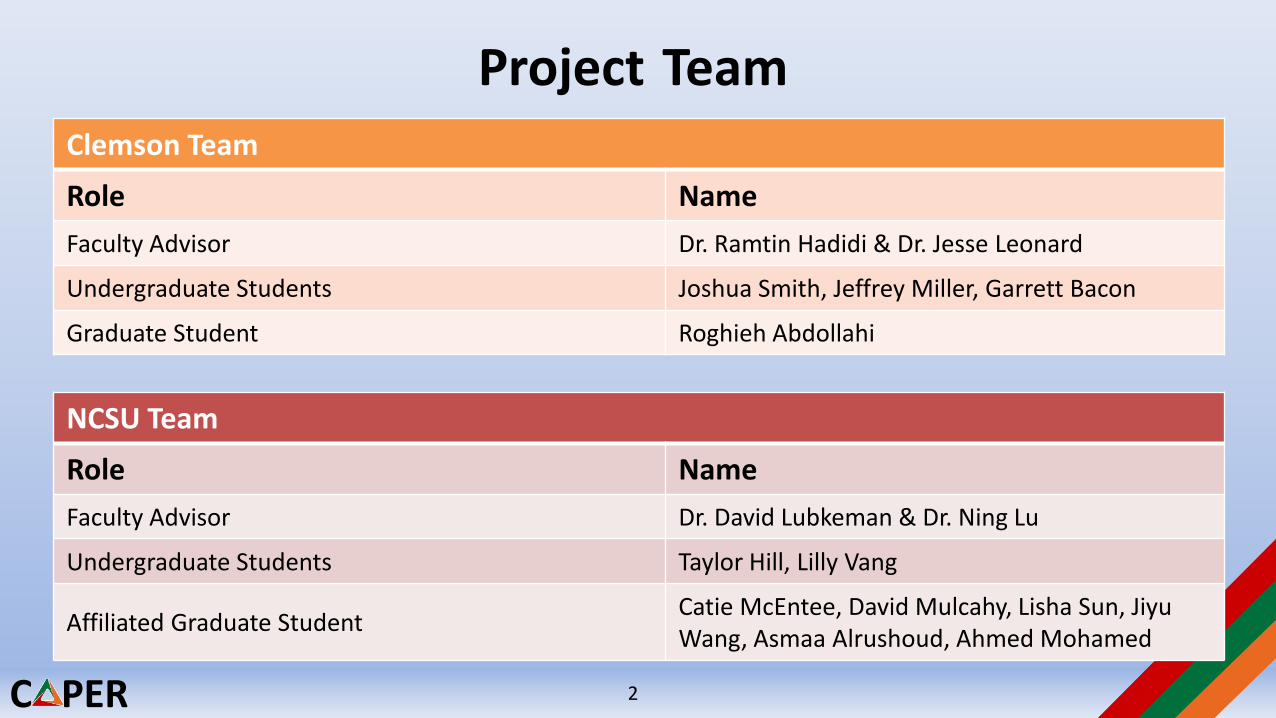
Project TeamClemson Team
Role NameFaculty Advisor Dr. Ramtin Hadidi & Dr. Jesse Leonard
Undergraduate Students Joshua Smith, Jeffrey Miller, Garrett Bacon
Graduate Student Roghieh Abdollahi
NCSU Team
Role NameFaculty Advisor Dr. David Lubkeman & Dr. Ning Lu
Undergraduate Students Taylor Hill, Lilly Vang
Affiliated Graduate Student Catie McEntee, David Mulcahy, Lisha Sun, JiyuWang, Asmaa Alrushoud, Ahmed Mohamed
2
C PER
Project Overview Current situation
Current approach to distribution planning somewhat utility-oriented in that itassumes utility owns and operates most generation and customers are passiveparticipants.
New Technology and Market InitiativesIn the future, customers owning distributed energy resources (DER) will result in an“active” distribution system, requiring new planning paradigms, with more focus oncustomer benefits and participation in the local energy market.
Proposed ProjectThis project aims to develop customer-oriented planning strategies for activedistribution systems that incorporate customers’ expectations and future grid impacts.
3
C PER
Project Benefits• Establish both customer-oriented and utility-oriented planning
model.
• Develop continuous power flow calculation methods and model dynamic responses of the active distribution system.
• Develop new active distribution system planning criteria.
Integration of smart PV inverters
Integration of energy storages
Integration of demand response resources
4
C PER
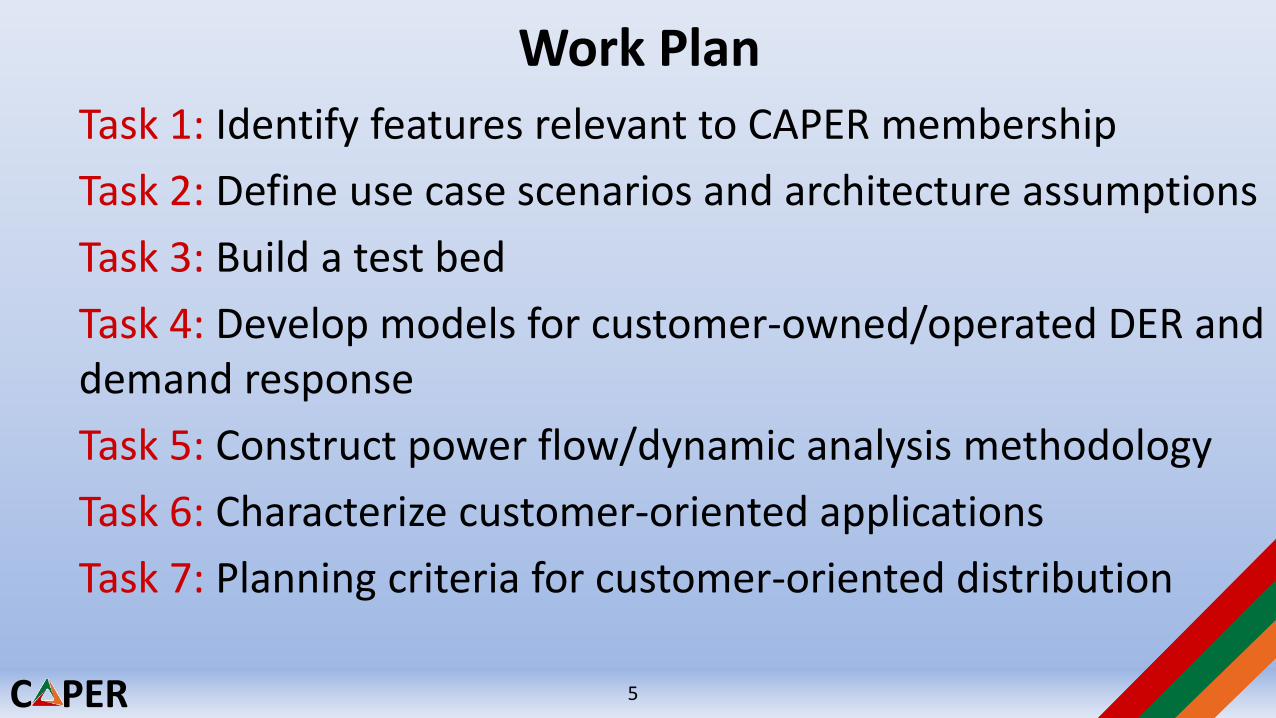
Task 1: Identify features relevant to CAPER membershipTask 2: Define use case scenarios and architecture assumptionsTask 3: Build a test bedTask 4: Develop models for customer-owned/operated DER and demand responseTask 5: Construct power flow/dynamic analysis methodologyTask 6: Characterize customer-oriented applicationsTask 7: Planning criteria for customer-oriented distribution
Work Plan
5
C PER
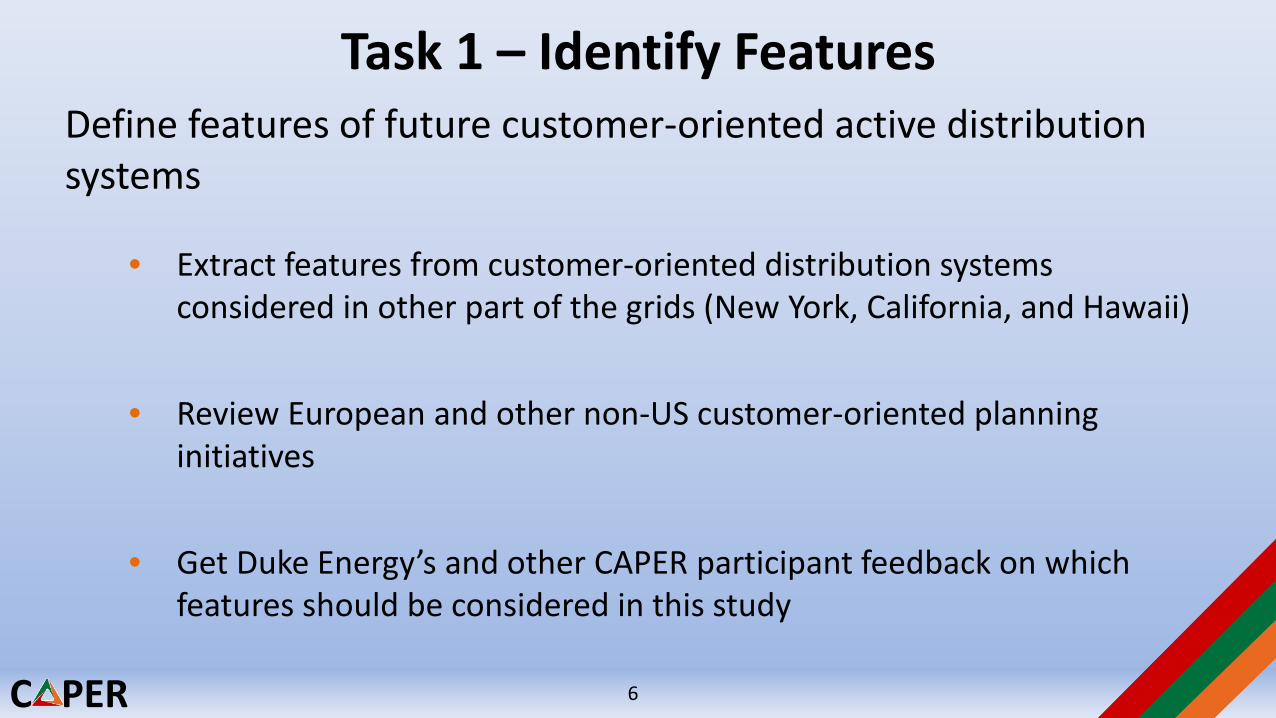
Task 1 – Identify FeaturesDefine features of future customer-oriented active distribution systems
• Extract features from customer-oriented distribution systems considered in other part of the grids (New York, California, and Hawaii)
• Review European and other non-US customer-oriented planning initiatives
• Get Duke Energy’s and other CAPER participant feedback on which features should be considered in this study
6
C PER
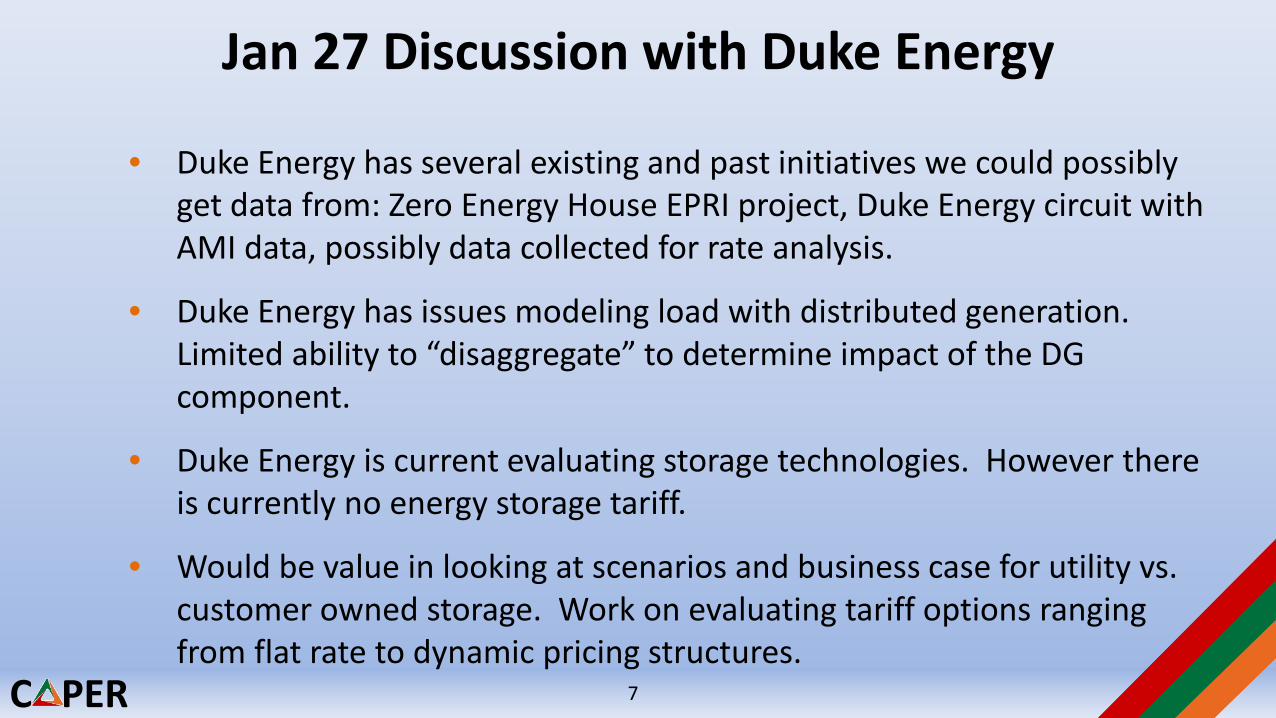
Jan 27 Discussion with Duke Energy
• Duke Energy has several existing and past initiatives we could possibly get data from: Zero Energy House EPRI project, Duke Energy circuit with AMI data, possibly data collected for rate analysis.
• Duke Energy has issues modeling load with distributed generation. Limited ability to “disaggregate” to determine impact of the DG component.
• Duke Energy is current evaluating storage technologies. However there is currently no energy storage tariff.
• Would be value in looking at scenarios and business case for utility vs. customer owned storage. Work on evaluating tariff options ranging from flat rate to dynamic pricing structures.
7
C PER
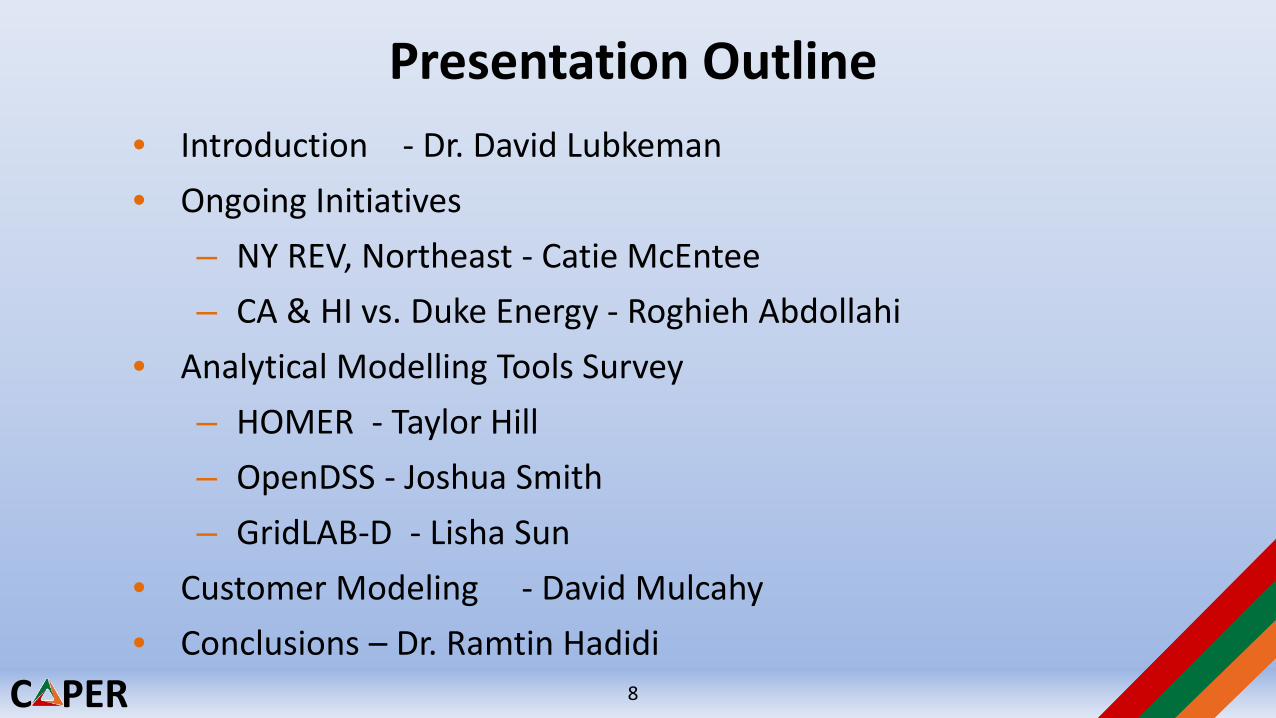
Presentation Outline• Introduction - Dr. David Lubkeman• Ongoing Initiatives
– NY REV, Northeast - Catie McEntee– CA & HI vs. Duke Energy - Roghieh Abdollahi
• Analytical Modelling Tools Survey – HOMER - Taylor Hill – OpenDSS - Joshua Smith – GridLAB-D - Lisha Sun
• Customer Modeling - David Mulcahy• Conclusions – Dr. Ramtin Hadidi
8
C PER
Literature Review: Initiatives in the Northeast
Catie McEntee
9
C PER
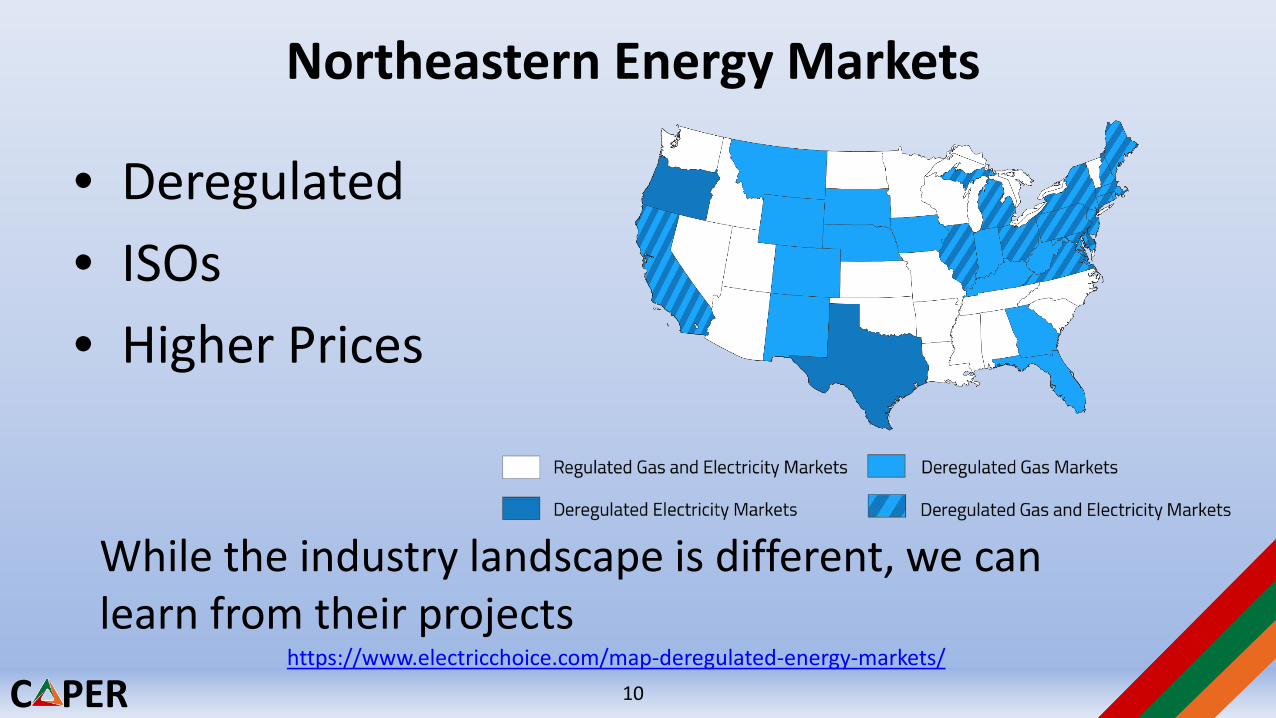
Northeastern Energy Markets
• Deregulated• ISOs• Higher Prices
While the industry landscape is different, we can learn from their projects
https://www.electricchoice.com/map-deregulated-energy-markets/10
C PER
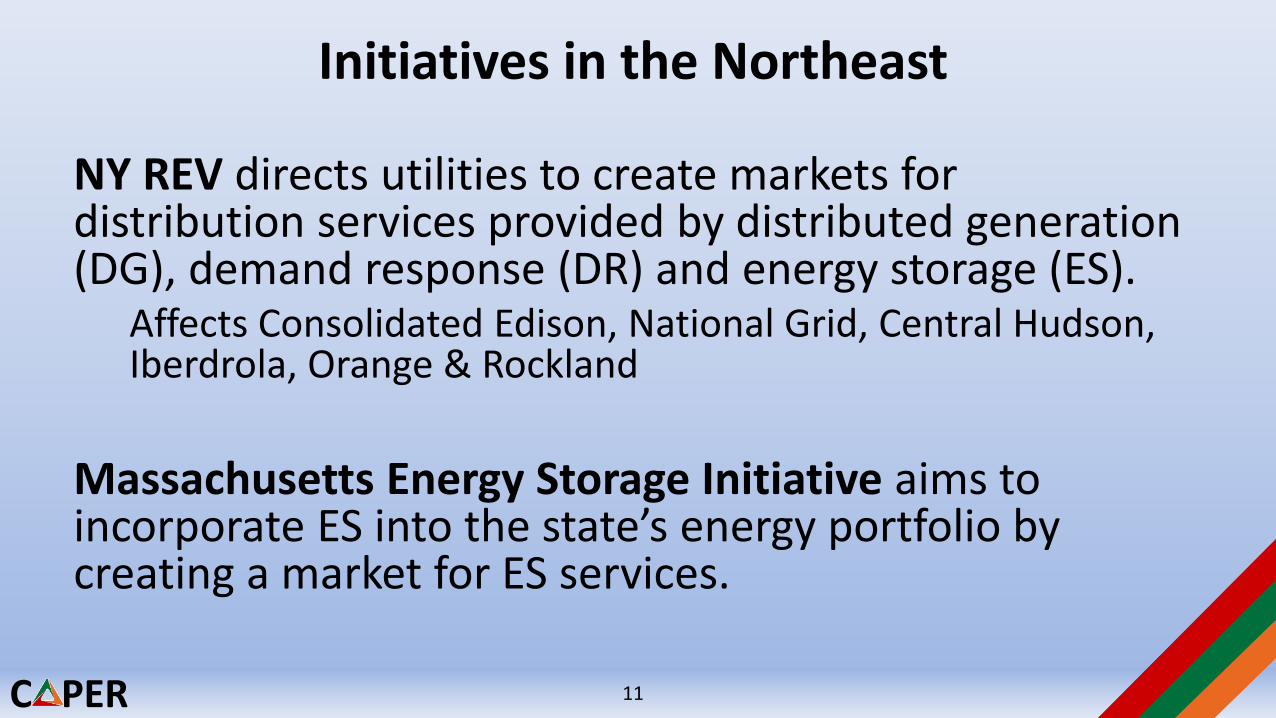
Initiatives in the Northeast
NY REV directs utilities to create markets for distribution services provided by distributed generation (DG), demand response (DR) and energy storage (ES).
Affects Consolidated Edison, National Grid, Central Hudson, Iberdrola, Orange & Rockland
Massachusetts Energy Storage Initiative aims to incorporate ES into the state’s energy portfolio by creating a market for ES services.
11
C PER
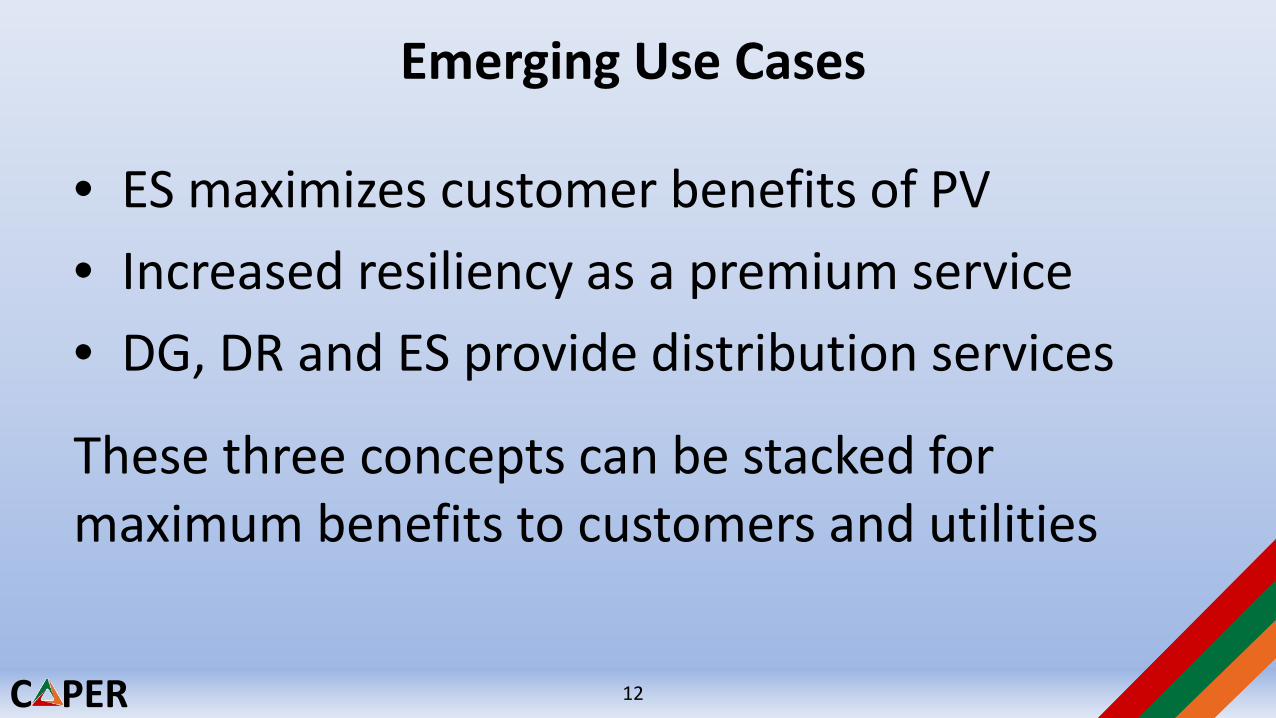
Emerging Use Cases
• ES maximizes customer benefits of PV• Increased resiliency as a premium service• DG, DR and ES provide distribution services
These three concepts can be stacked for maximum benefits to customers and utilities
12
C PER
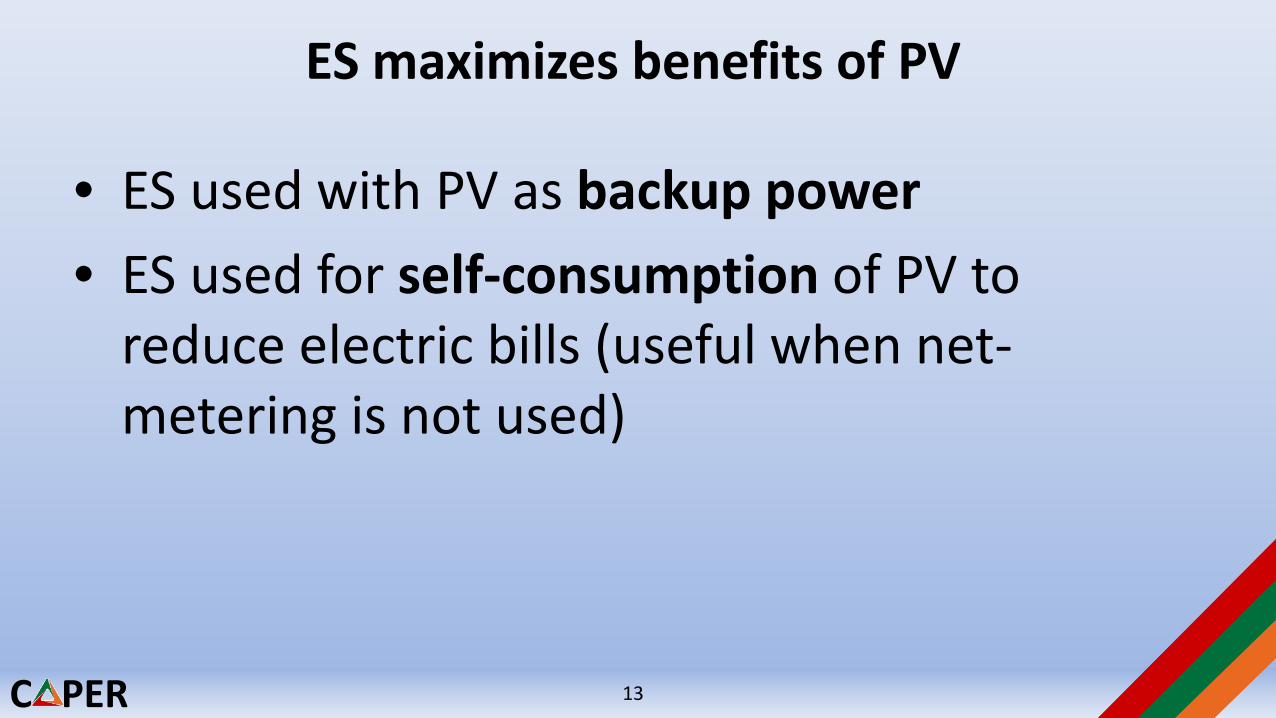
ES maximizes benefits of PV
• ES used with PV as backup power• ES used for self-consumption of PV to
reduce electric bills (useful when net-metering is not used)
13
C PER
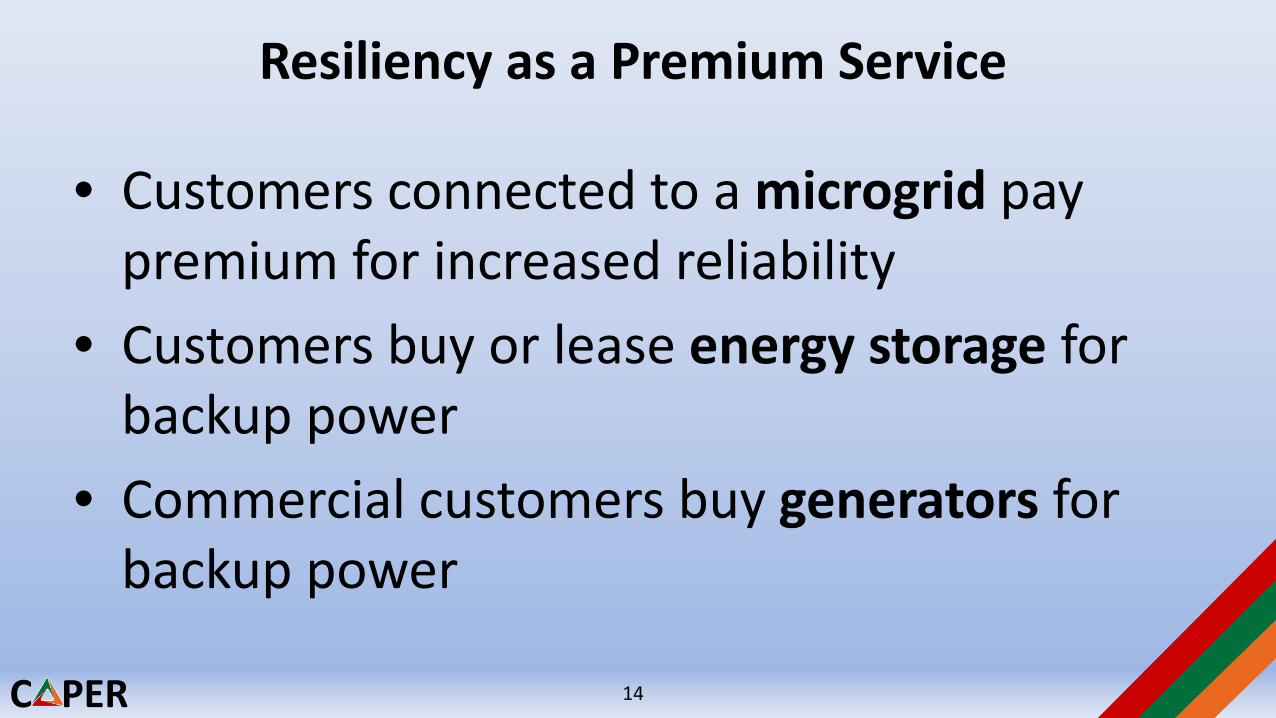
Resiliency as a Premium Service
• Customers connected to a microgrid pay premium for increased reliability
• Customers buy or lease energy storage for backup power
• Commercial customers buy generators for backup power
14
C PER
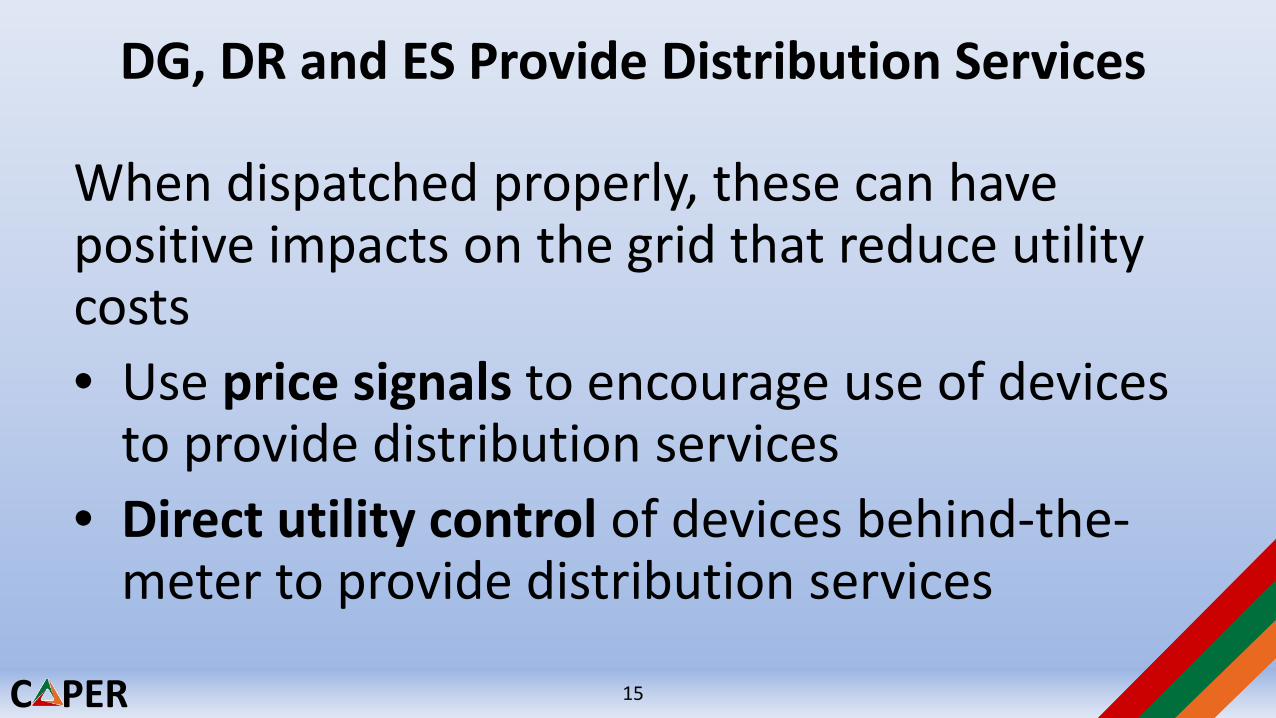
DG, DR and ES Provide Distribution Services
When dispatched properly, these can have positive impacts on the grid that reduce utility costs• Use price signals to encourage use of devices
to provide distribution services• Direct utility control of devices behind-the-
meter to provide distribution services
15

C PER
Stacking benefits
• Provide distribution services when the grid is on
• Provide backup power when the grid is out• Improve benefit-cost ratio for both customer
and utility
16
C PER
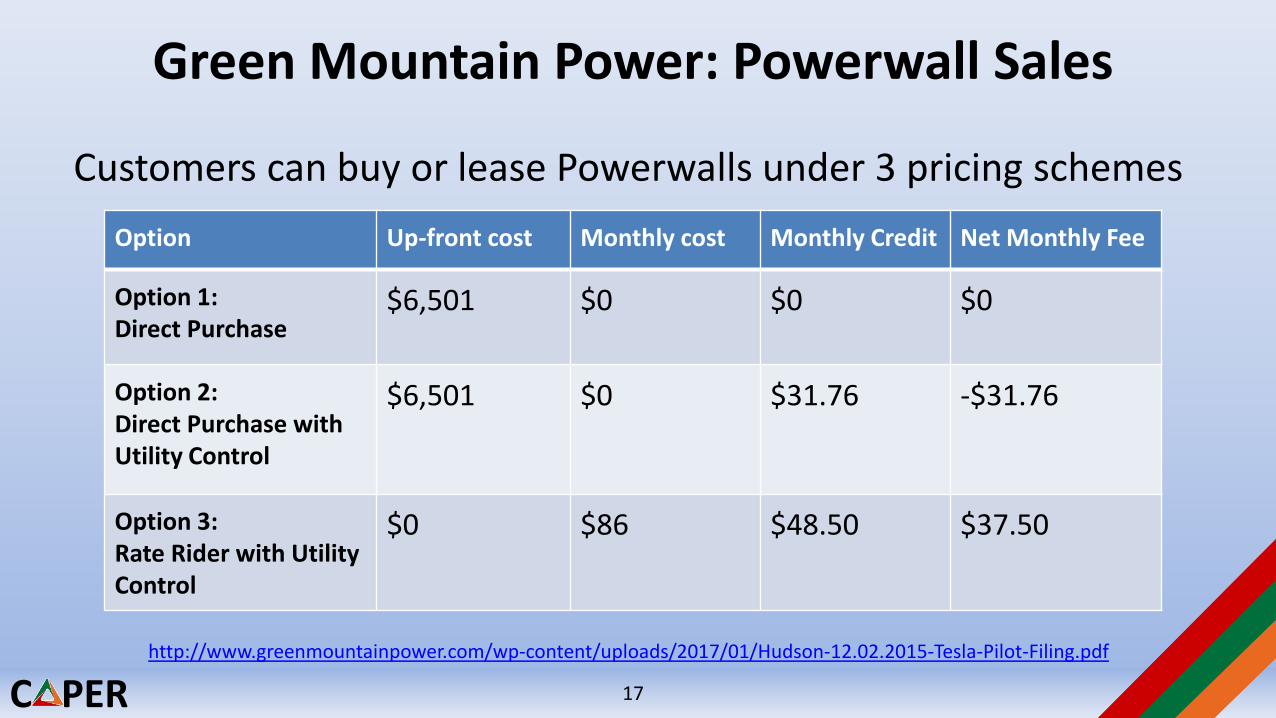
Green Mountain Power: Powerwall Sales
Customers can buy or lease Powerwalls under 3 pricing schemesOption Up-front cost Monthly cost Monthly Credit Net Monthly Fee
Option 1: Direct Purchase
$6,501 $0 $0 $0
Option 2: Direct Purchase with Utility Control
$6,501 $0 $31.76 -$31.76
Option 3: Rate Rider with Utility Control
$0 $86 $48.50 $37.50
http://www.greenmountainpower.com/wp-content/uploads/2017/01/Hudson-12.02.2015-Tesla-Pilot-Filing.pdf
17
C PER
Buffalo Niagara Medical Campus Distributed System Platform Engagement Tool
• Medical buildings already have backup generators
• Utility will pay customers to generate power during peak times
• Pricing is based on distribution system benefits
18
C PER
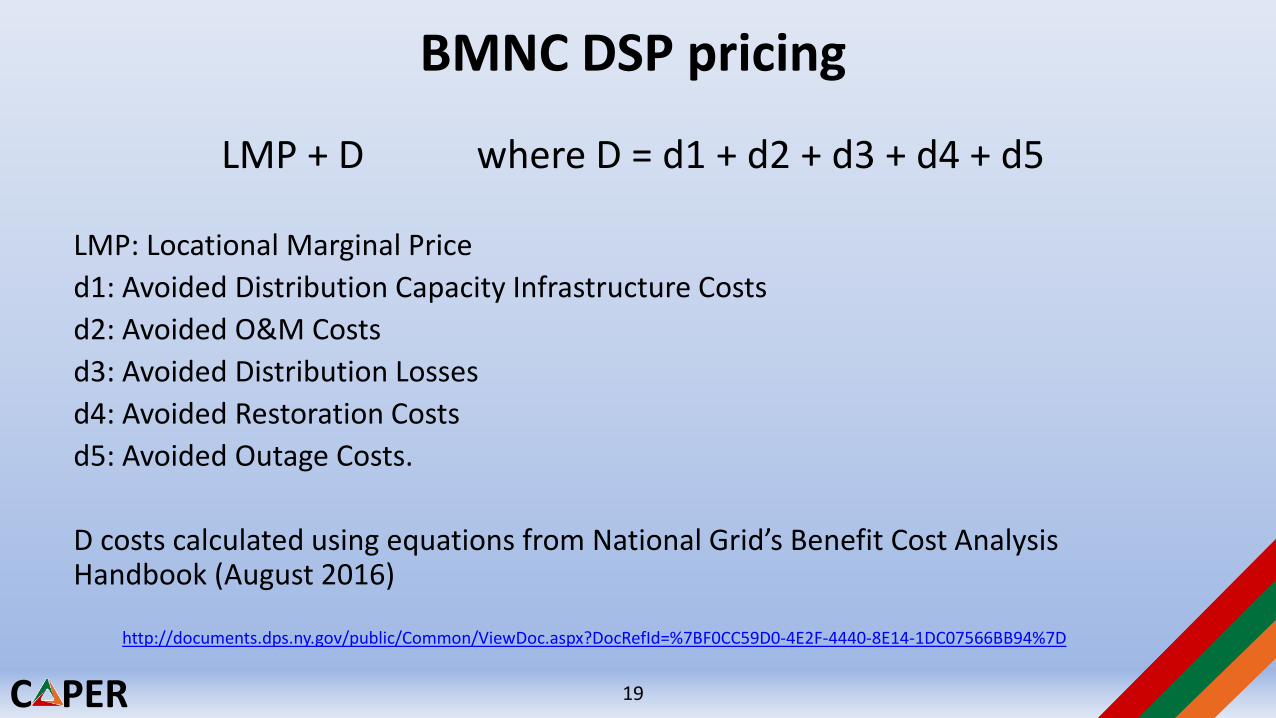
BMNC DSP pricing
LMP + D where D = d1 + d2 + d3 + d4 + d5
LMP: Locational Marginal Priced1: Avoided Distribution Capacity Infrastructure Costsd2: Avoided O&M Costsd3: Avoided Distribution Lossesd4: Avoided Restoration Costsd5: Avoided Outage Costs.
D costs calculated using equations from National Grid’s Benefit Cost Analysis Handbook (August 2016)
http://documents.dps.ny.gov/public/Common/ViewDoc.aspx?DocRefId=%7BF0CC59D0-4E2F-4440-8E14-1DC07566BB94%7D
19
C PER
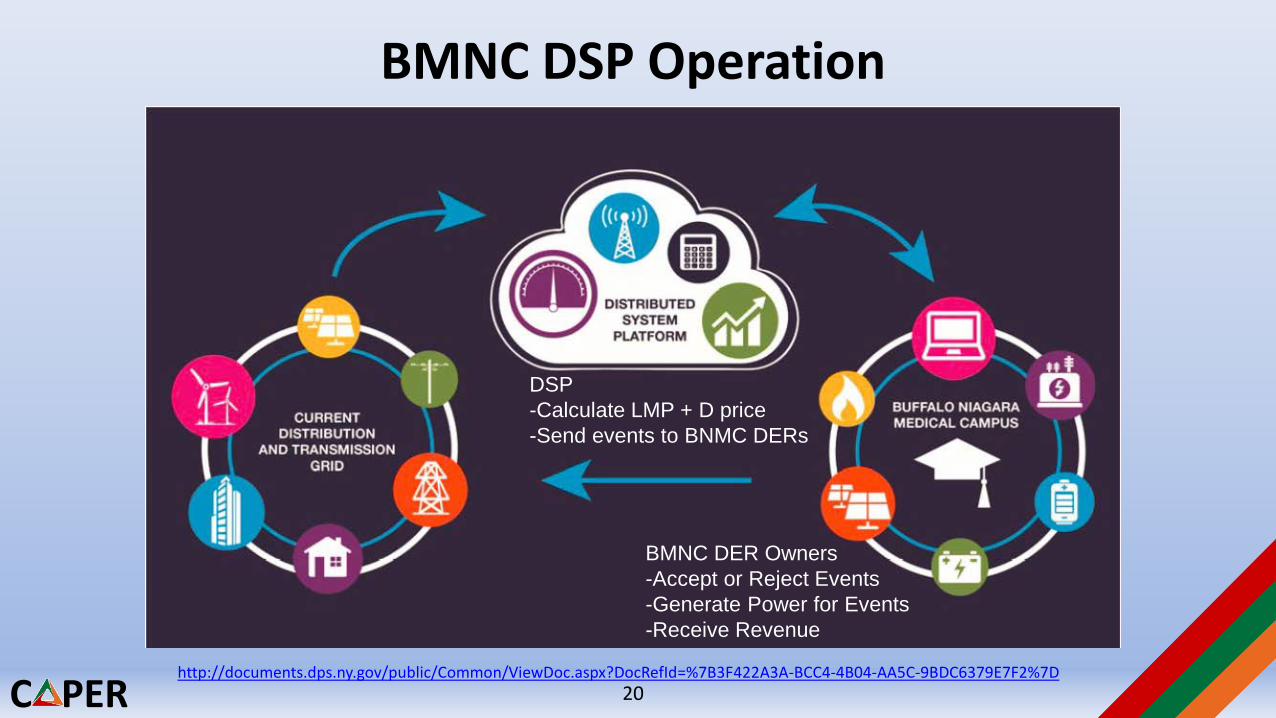
BMNC DSP Operation
DSP-Calculate LMP + D price-Send events to BNMC DERs
BMNC DER Owners-Accept or Reject Events-Generate Power for Events-Receive Revenue
http://documents.dps.ny.gov/public/Common/ViewDoc.aspx?DocRefId=%7B3F422A3A-BCC4-4B04-AA5C-9BDC6379E7F2%7D20
C PER
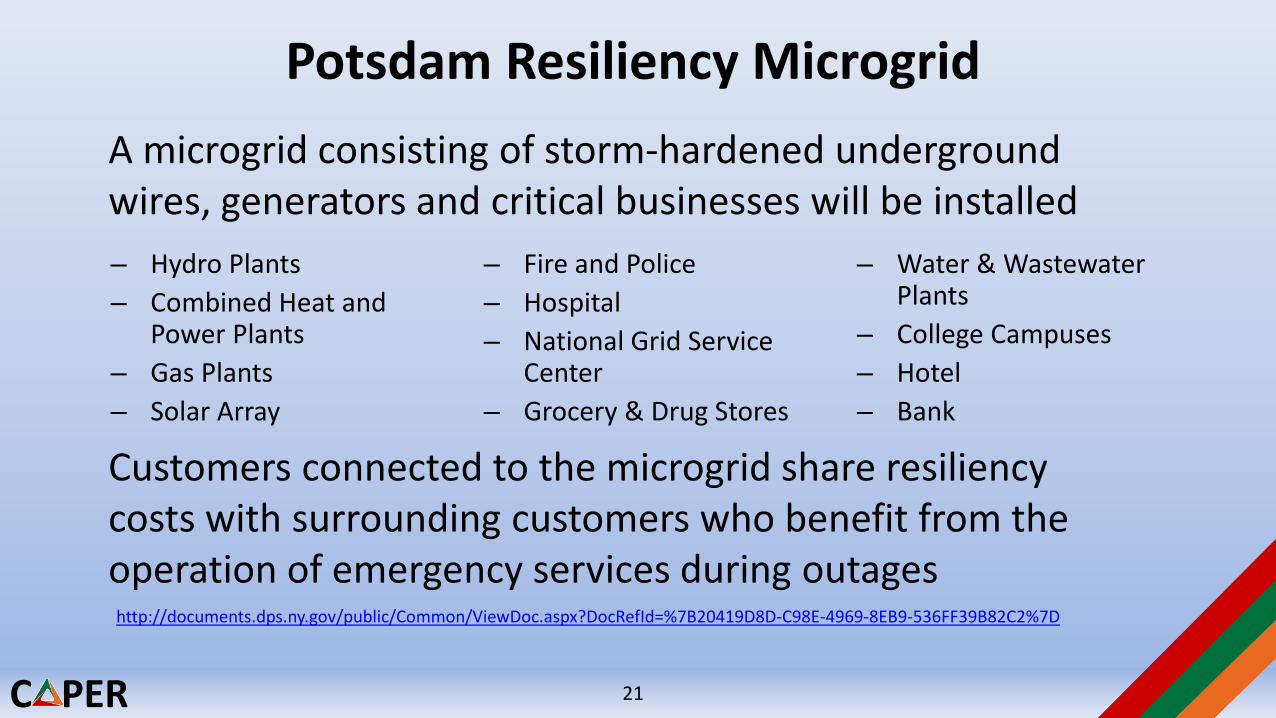
Potsdam Resiliency Microgrid
– Hydro Plants– Combined Heat and
Power Plants– Gas Plants– Solar Array
– Fire and Police– Hospital– National Grid Service
Center– Grocery & Drug Stores
– Water & Wastewater Plants
– College Campuses– Hotel– Bank
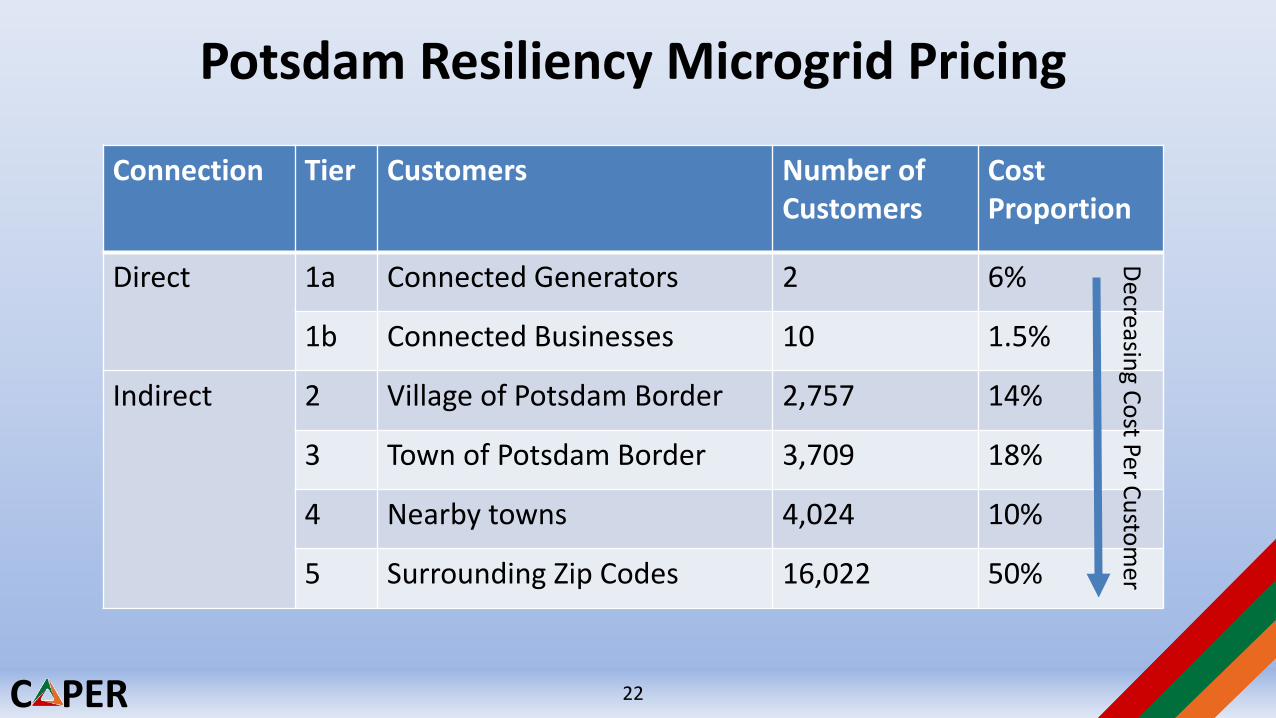
A microgrid consisting of storm-hardened underground wires, generators and critical businesses will be installed
Customers connected to the microgrid share resiliency costs with surrounding customers who benefit from the operation of emergency services during outageshttp://documents.dps.ny.gov/public/Common/ViewDoc.aspx?DocRefId=%7B20419D8D-C98E-4969-8EB9-536FF39B82C2%7D
21
C PER
Potsdam Resiliency Microgrid Pricing
Connection Tier Customers Number of Customers
Cost Proportion
Direct 1a Connected Generators 2 6%
1b Connected Businesses 10 1.5%
Indirect 2 Village of Potsdam Border 2,757 14%
3 Town of Potsdam Border 3,709 18%
4 Nearby towns 4,024 10%
5 Surrounding Zip Codes 16,022 50%
Decreasing Cost Per Customer
22
C PER
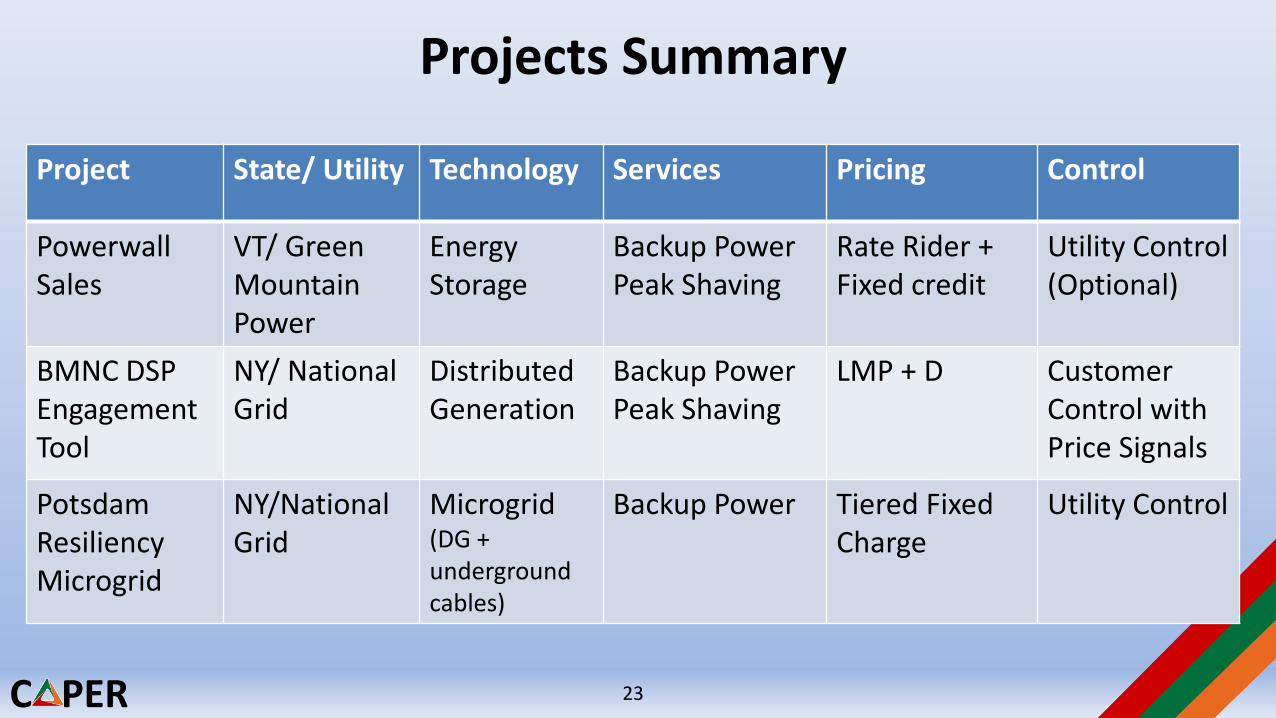
Project State/ Utility Technology Services Pricing Control
Powerwall Sales
VT/ Green Mountain Power
Energy Storage
Backup PowerPeak Shaving
Rate Rider + Fixed credit
Utility Control (Optional)
BMNC DSP Engagement Tool
NY/ National Grid
Distributed Generation
Backup PowerPeak Shaving
LMP + D Customer Control with Price Signals
Potsdam Resiliency Microgrid
NY/National Grid
Microgrid (DG + underground cables)
Backup Power Tiered Fixed Charge
Utility Control
Projects Summary
23
C PER
Next Steps
• Literature review on initiatives and projects outside the US (especially Europe)
• Narrow down use cases to model
24
C PER
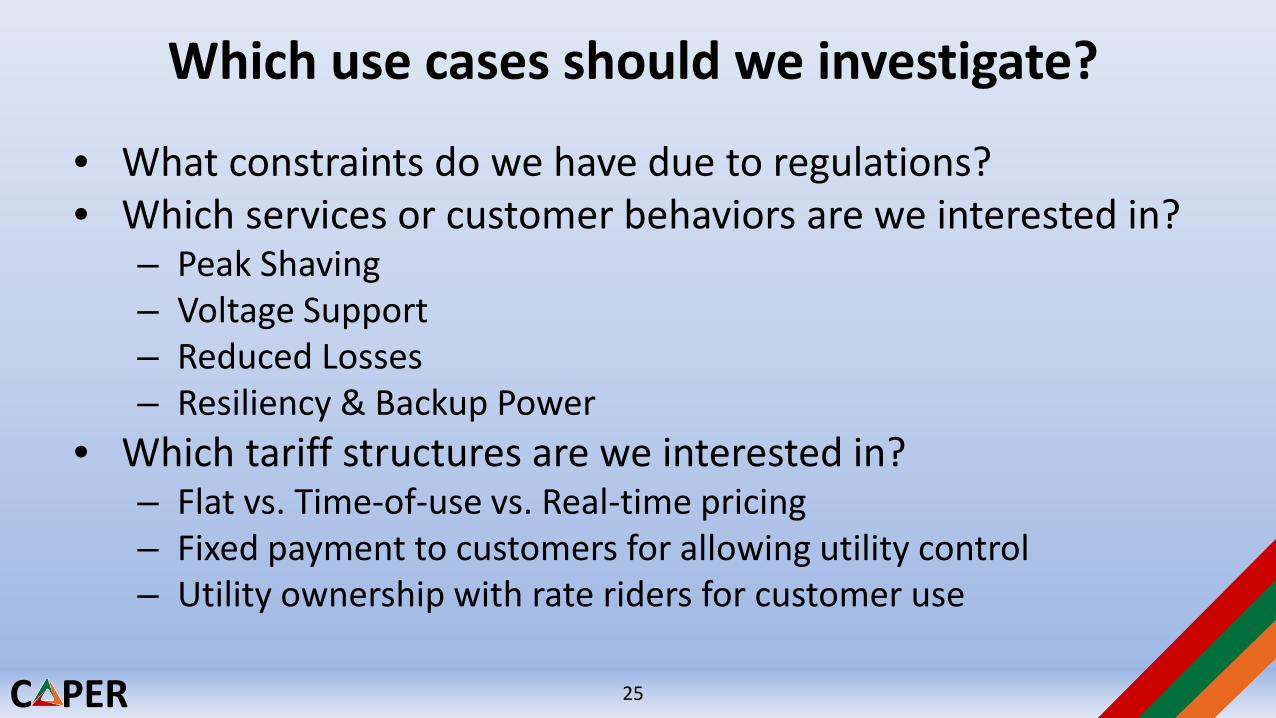
Which use cases should we investigate?
• What constraints do we have due to regulations?• Which services or customer behaviors are we interested in?
– Peak Shaving– Voltage Support– Reduced Losses– Resiliency & Backup Power
• Which tariff structures are we interested in?– Flat vs. Time-of-use vs. Real-time pricing– Fixed payment to customers for allowing utility control– Utility ownership with rate riders for customer use
25
C PER
Literature Review on Rate Structure
Roghieh Abdollahi, Jeffrey Miller, Garrett Bacon
26
C PER
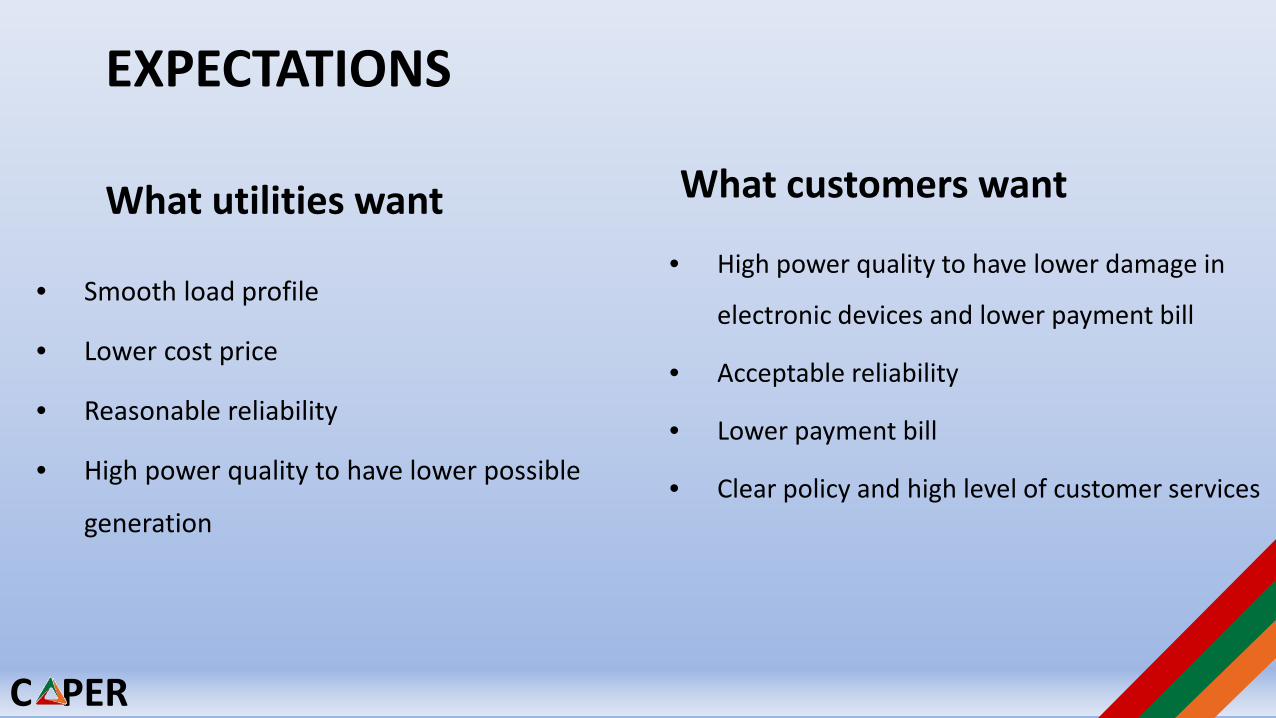
EXPECTATIONS
What utilities want
• Smooth load profile
• Lower cost price
• Reasonable reliability
• High power quality to have lower possible
generation
• High power quality to have lower damage in
electronic devices and lower payment bill
• Acceptable reliability
• Lower payment bill
• Clear policy and high level of customer services
What customers want
C PER
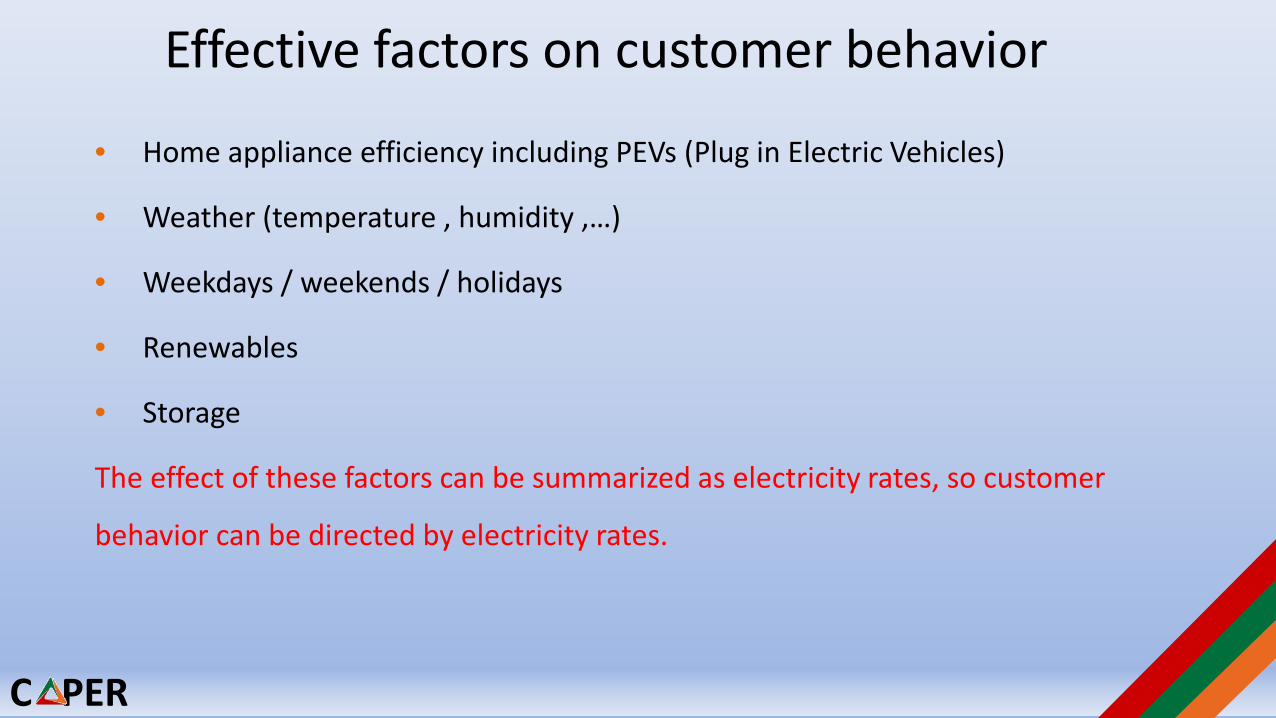
Effective factors on customer behavior
• Home appliance efficiency including PEVs (Plug in Electric Vehicles)
• Weather (temperature , humidity ,…)
• Weekdays / weekends / holidays
• Renewables
• Storage
The effect of these factors can be summarized as electricity rates, so customer
behavior can be directed by electricity rates.
C PER
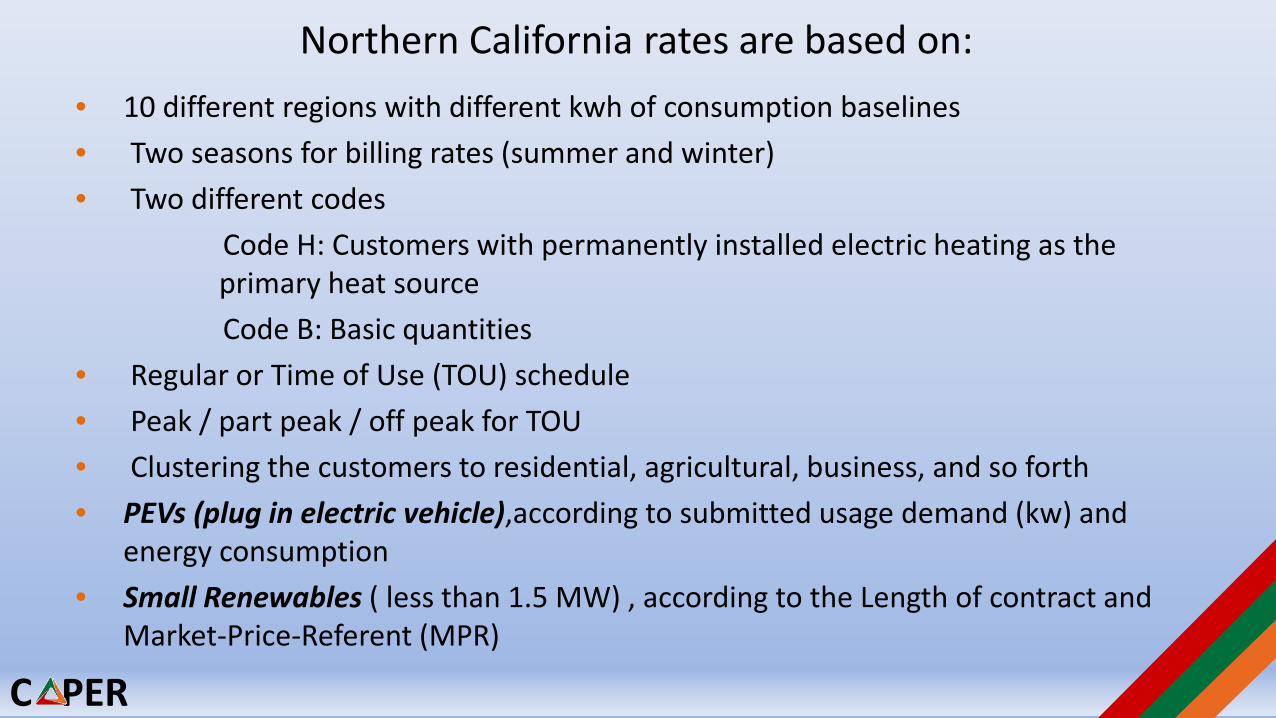
Northern California rates are based on:• 10 different regions with different kwh of consumption baselines • Two seasons for billing rates (summer and winter)• Two different codes
Code H: Customers with permanently installed electric heating as the primary heat source Code B: Basic quantities
• Regular or Time of Use (TOU) schedule• Peak / part peak / off peak for TOU• Clustering the customers to residential, agricultural, business, and so forth • PEVs (plug in electric vehicle),according to submitted usage demand (kw) and
energy consumption• Small Renewables ( less than 1.5 MW) , according to the Length of contract and
Market-Price-Referent (MPR)
C PER
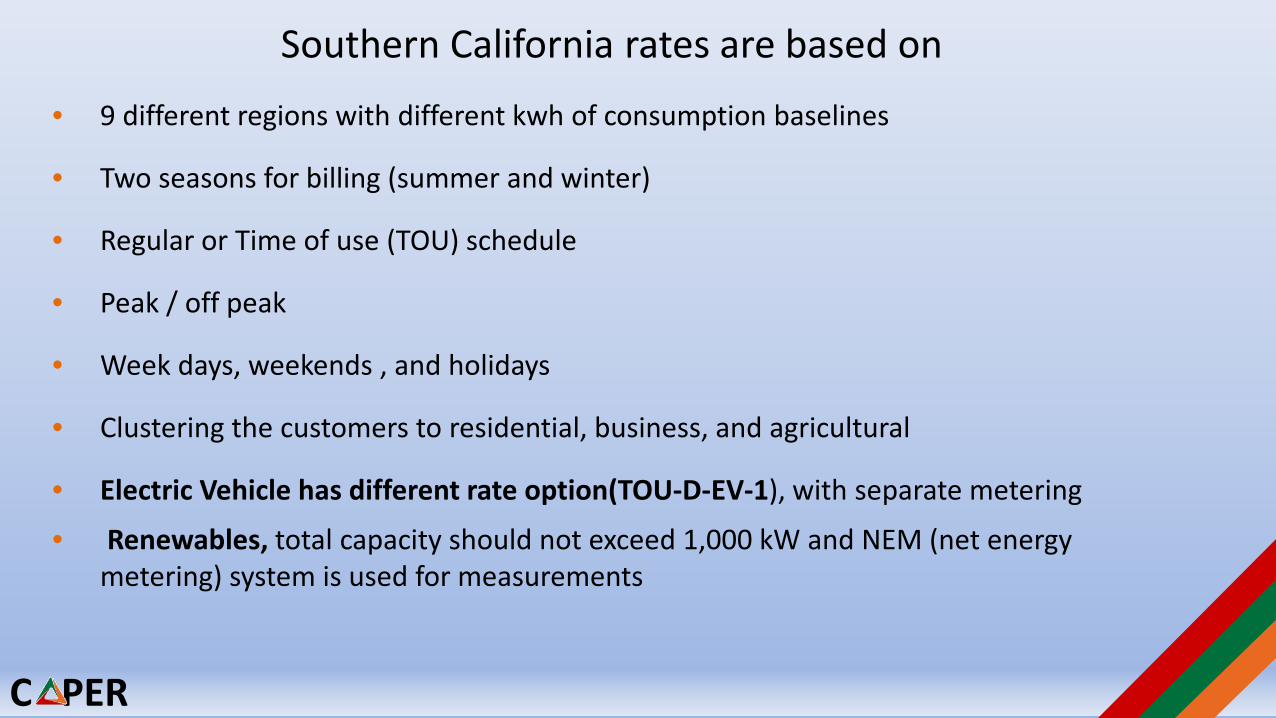
Southern California rates are based on
• 9 different regions with different kwh of consumption baselines
• Two seasons for billing (summer and winter)
• Regular or Time of use (TOU) schedule
• Peak / off peak
• Week days, weekends , and holidays
• Clustering the customers to residential, business, and agricultural
• Electric Vehicle has different rate option(TOU-D-EV-1), with separate metering
• Renewables, total capacity should not exceed 1,000 kW and NEM (net energy metering) system is used for measurements
C PER
Duke Energy
• Duke Energy contains Six states.South Carolina, North Carolina, Indiana, Florida, Ohio, and Kentucky.
• Duke energy has different policy for different states.
C PER
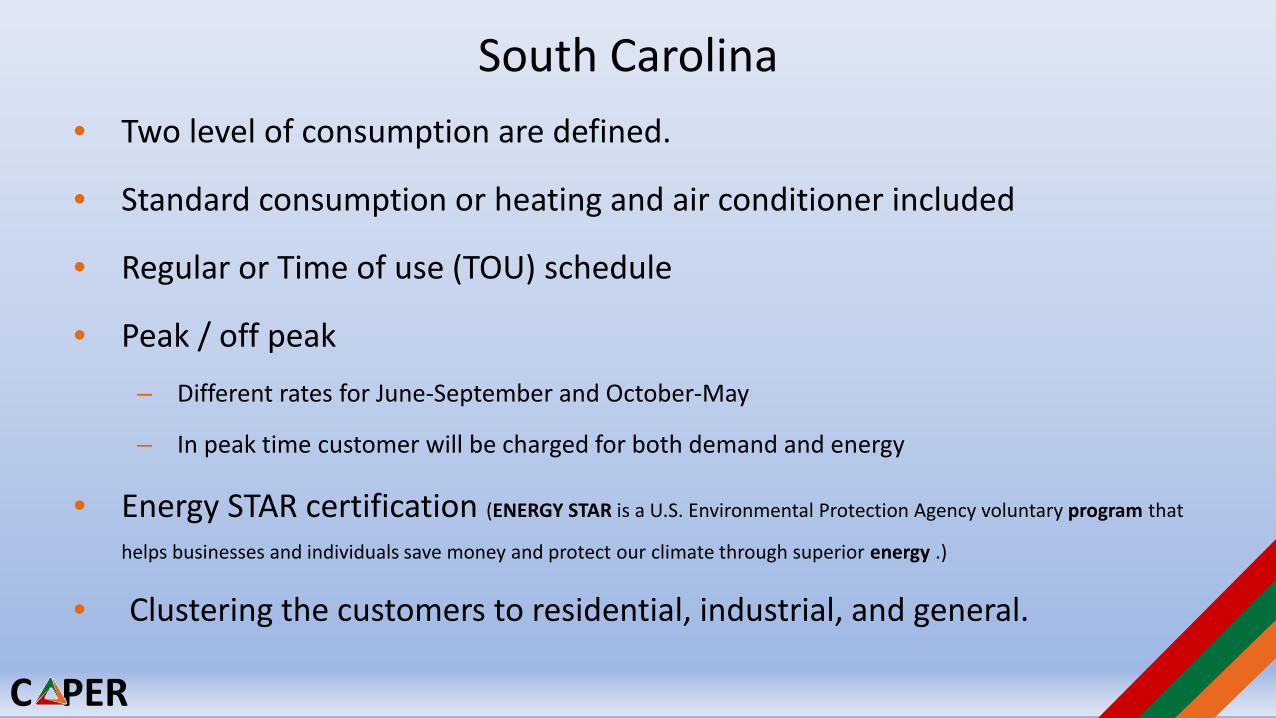
South Carolina• Two level of consumption are defined.
• Standard consumption or heating and air conditioner included
• Regular or Time of use (TOU) schedule
• Peak / off peak– Different rates for June-September and October-May
– In peak time customer will be charged for both demand and energy
• Energy STAR certification (ENERGY STAR is a U.S. Environmental Protection Agency voluntary program that
helps businesses and individuals save money and protect our climate through superior energy .)
• Clustering the customers to residential, industrial, and general.
C PER
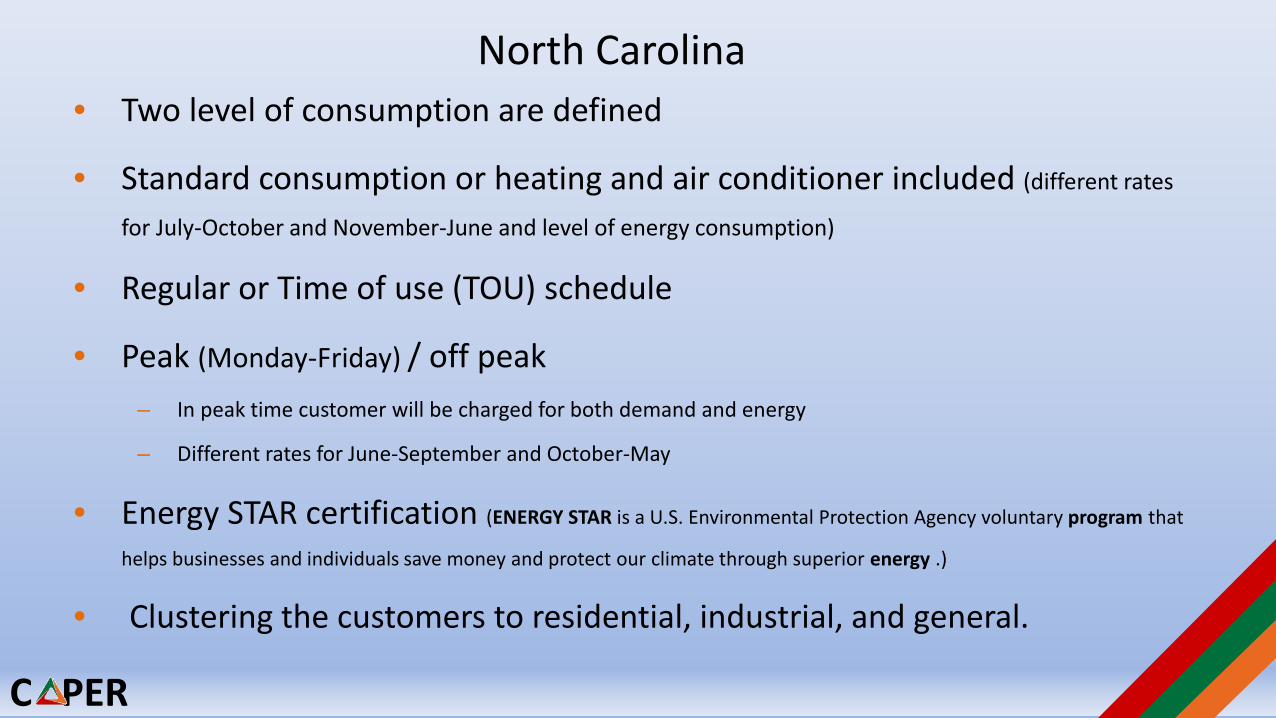
North Carolina• Two level of consumption are defined
• Standard consumption or heating and air conditioner included (different rates
for July-October and November-June and level of energy consumption)
• Regular or Time of use (TOU) schedule
• Peak (Monday-Friday) / off peak– In peak time customer will be charged for both demand and energy
– Different rates for June-September and October-May
• Energy STAR certification (ENERGY STAR is a U.S. Environmental Protection Agency voluntary program that
helps businesses and individuals save money and protect our climate through superior energy .)
• Clustering the customers to residential, industrial, and general.
C PER
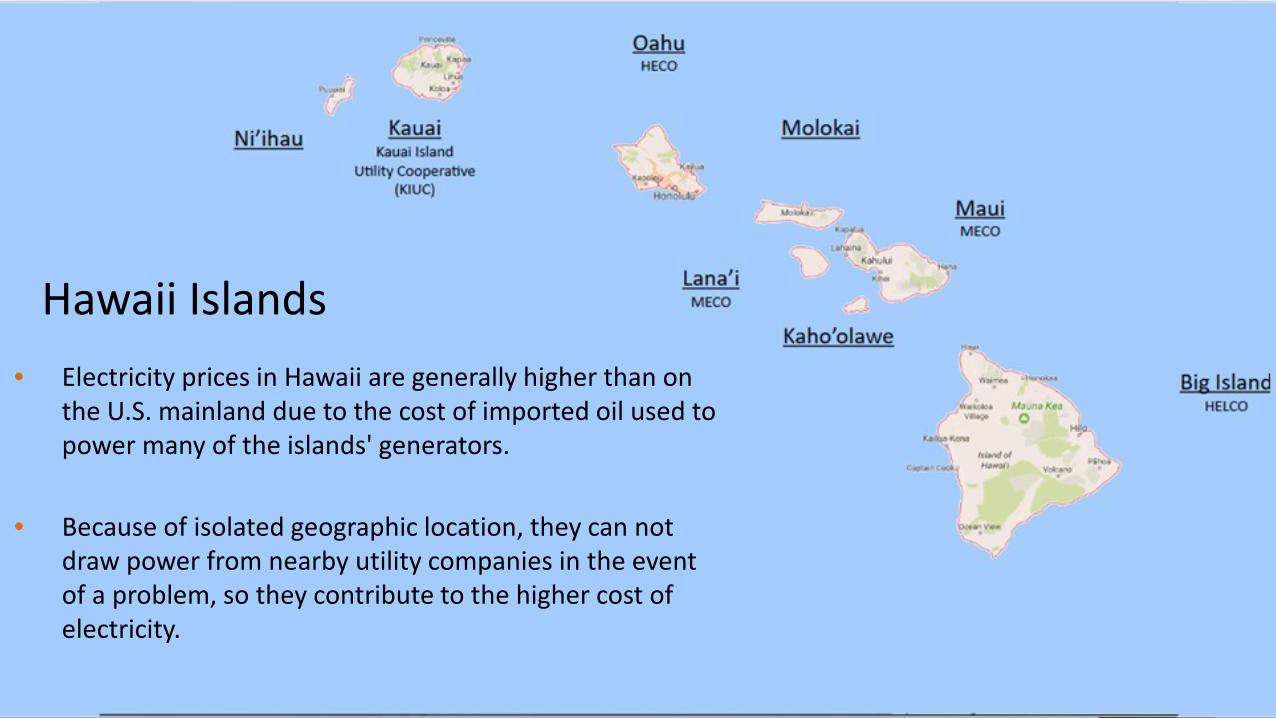
• Electricity prices in Hawaii are generally higher than on the U.S. mainland due to the cost of imported oil used to power many of the islands' generators.
• Because of isolated geographic location, they can not draw power from nearby utility companies in the event of a problem, so they contribute to the higher cost of electricity.
Hawaii Islands
C PER
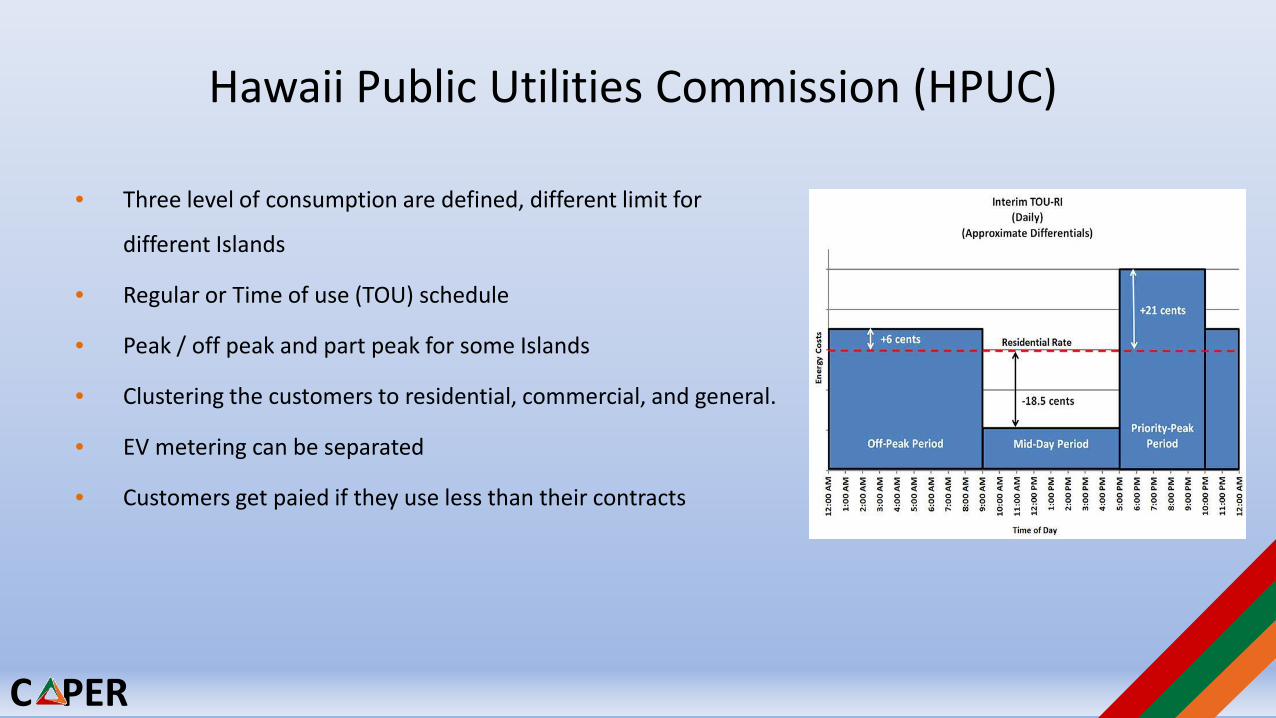
Hawaii Public Utilities Commission (HPUC)
• Three level of consumption are defined, different limit for
different Islands
• Regular or Time of use (TOU) schedule
• Peak / off peak and part peak for some Islands
• Clustering the customers to residential, commercial, and general.
• EV metering can be separated
• Customers get paied if they use less than their contracts
C PER
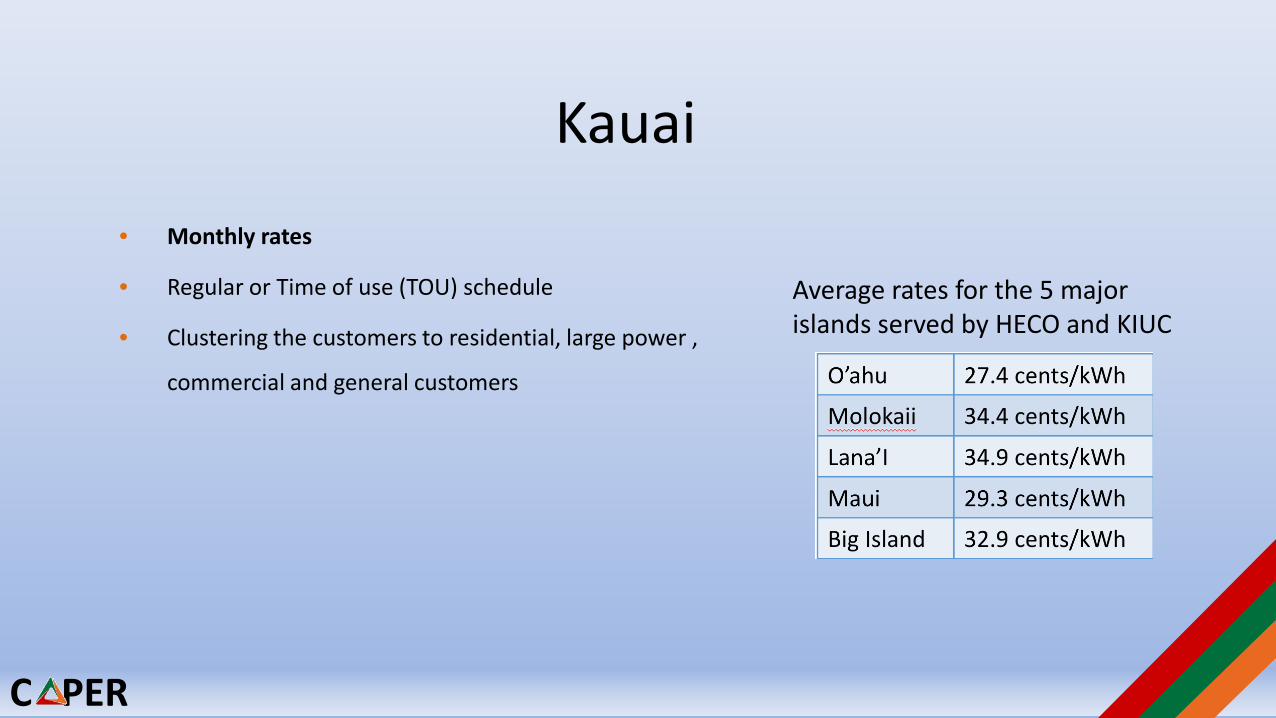
Kauai
Average rates for the 5 major islands served by HECO and KIUC
• Monthly rates
• Regular or Time of use (TOU) schedule
• Clustering the customers to residential, large power ,
commercial and general customers
C PER
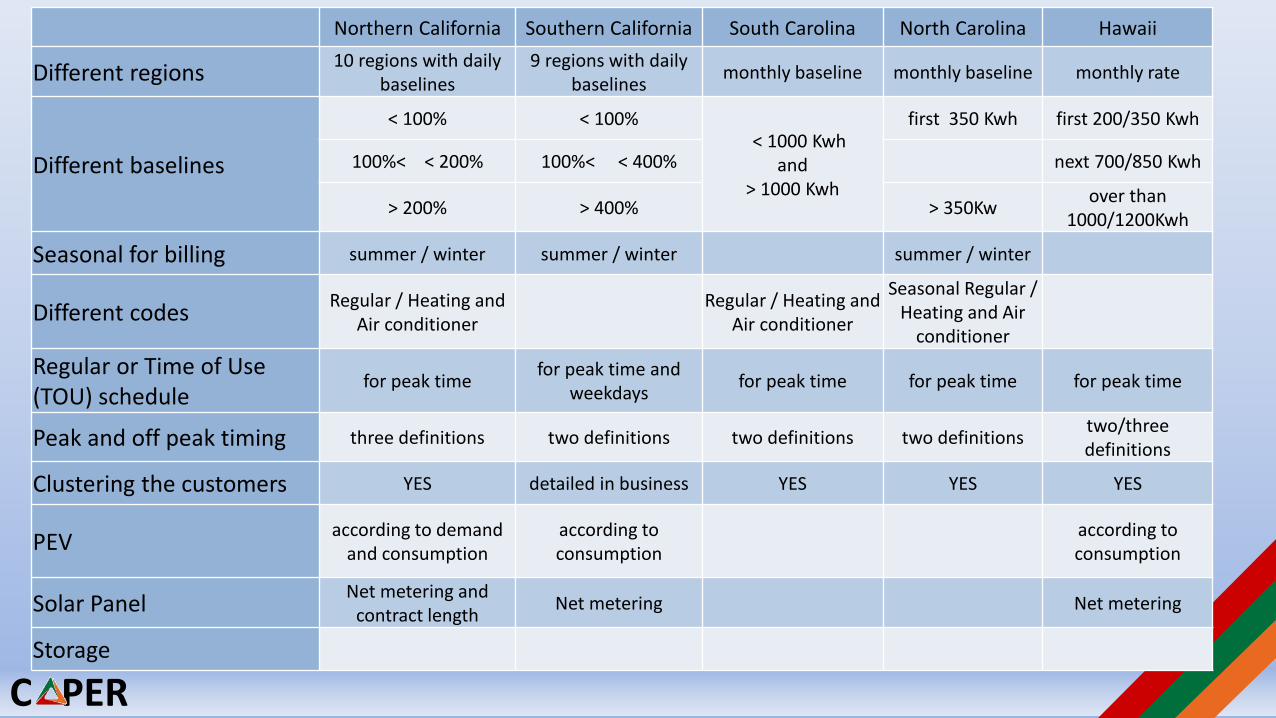
Northern California Southern California South Carolina North Carolina Hawaii
Different regions 10 regions with daily baselines
9 regions with daily baselines monthly baseline monthly baseline monthly rate
Different baselines
< 100% < 100%< 1000 Kwh
and > 1000 Kwh
first 350 Kwh first 200/350 Kwh
100%< < 200% 100%< < 400% next 700/850 Kwh
> 200% > 400% > 350Kw over than 1000/1200Kwh
Seasonal for billing summer / winter summer / winter summer / winter
Different codes Regular / Heating and Air conditioner
Regular / Heating and Air conditioner
Seasonal Regular / Heating and Air
conditioner
Regular or Time of Use (TOU) schedule
for peak time for peak time and weekdays for peak time for peak time for peak time
Peak and off peak timing three definitions two definitions two definitions two definitions two/three definitions
Clustering the customers YES detailed in business YES YES YES
PEV according to demand and consumption
according to consumption
according to consumption
Solar Panel Net metering and contract length Net metering Net metering
Storage
C PER
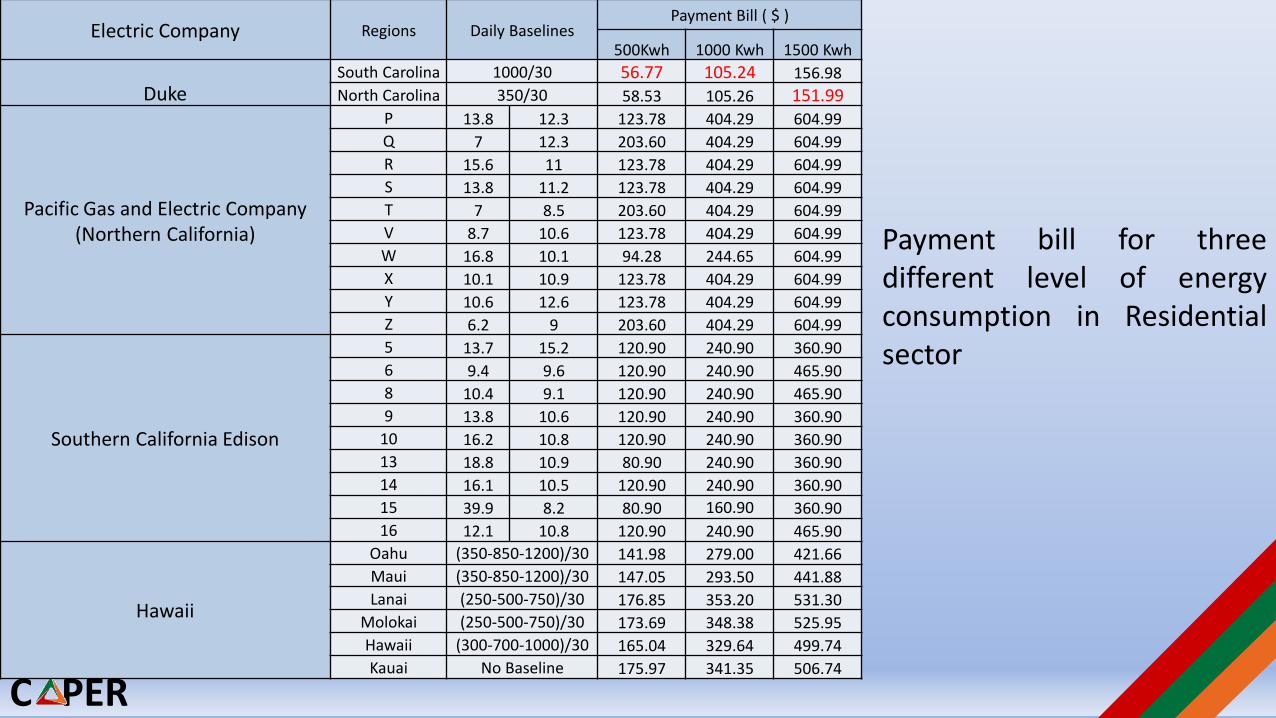
Payment bill for threedifferent level of energyconsumption in Residentialsector
Electric Company Regions Daily BaselinesPayment Bill ( $ )
500Kwh 1000 Kwh 1500 Kwh
DukeSouth Carolina 1000/30 56.77 105.24 156.98North Carolina 350/30 58.53 105.26 151.99
Pacific Gas and Electric Company (Northern California)
P 13.8 12.3 123.78 404.29 604.99Q 7 12.3 203.60 404.29 604.99R 15.6 11 123.78 404.29 604.99S 13.8 11.2 123.78 404.29 604.99T 7 8.5 203.60 404.29 604.99V 8.7 10.6 123.78 404.29 604.99W 16.8 10.1 94.28 244.65 604.99X 10.1 10.9 123.78 404.29 604.99Y 10.6 12.6 123.78 404.29 604.99Z 6.2 9 203.60 404.29 604.99
Southern California Edison
5 13.7 15.2 120.90 240.90 360.906 9.4 9.6 120.90 240.90 465.908 10.4 9.1 120.90 240.90 465.909 13.8 10.6 120.90 240.90 360.90
10 16.2 10.8 120.90 240.90 360.9013 18.8 10.9 80.90 240.90 360.9014 16.1 10.5 120.90 240.90 360.9015 39.9 8.2 80.90 160.90 360.9016 12.1 10.8 120.90 240.90 465.90
Hawaii
Oahu (350-850-1200)/30 141.98 279.00 421.66Maui (350-850-1200)/30 147.05 293.50 441.88Lanai (250-500-750)/30 176.85 353.20 531.30
Molokai (250-500-750)/30 173.69 348.38 525.95Hawaii (300-700-1000)/30 165.04 329.64 499.74Kauai No Baseline 175.97 341.35 506.74
C PER
Referenceshttp://www.pge.com/tariffs/index.pagehttps://www.sce.com/wps/portal/home/customer-servicehttps://www.duke-energy.com/home/billing/rateshttp://puc.hawaii.gov/http://puc.hawaii.gov/wp-content/uploads/2015/10/DER-Phase-1-DO-Summary.pdfhttp://www.haleakalasolar.com/hawaii-solar/hawaii-ends-net-metering-opens-door-solar-energy-storage/ -http://website.kiuc.coop/content/rateshttp://kiuc.coopwebbuilder2.com/sites/kiuc/files/PDF/rates/2017%20Rate%20Data.pdfhttps://www.hawaiianelectric.com/save-energy-and-money/time-of-use-programhttps://www.hawaiianelectric.com/save-energy-and-money/time-of-use-program/time-of-use-rate-historyhttps://www.hawaiianelectric.com/my-account/rates-and-regulations/effective-rate-summaryhttps://www.hawaiianelectric.com/my-account/rates-and-regulations
C PER
Residential PV Modeling with HOMERTaylor Hill
40
C PER
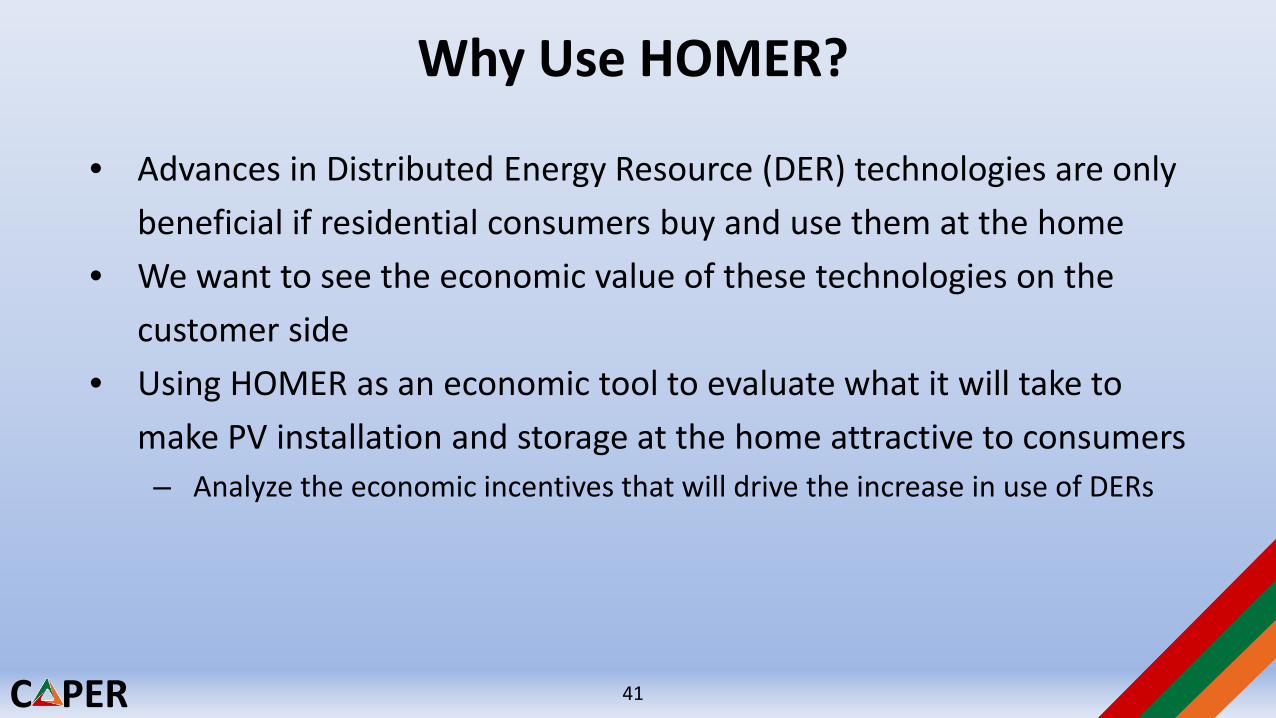
Why Use HOMER?
• Advances in Distributed Energy Resource (DER) technologies are only beneficial if residential consumers buy and use them at the home
• We want to see the economic value of these technologies on the customer side
• Using HOMER as an economic tool to evaluate what it will take to make PV installation and storage at the home attractive to consumers– Analyze the economic incentives that will drive the increase in use of DERs
41
C PER
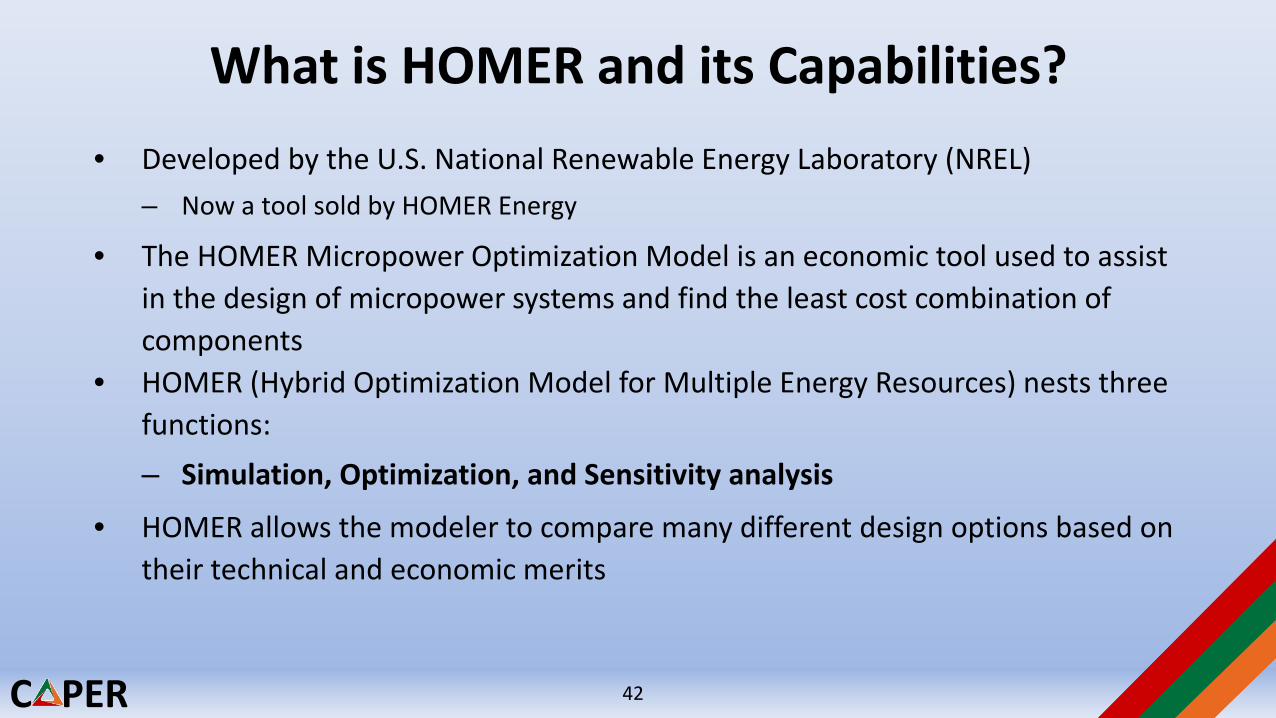
What is HOMER and its Capabilities?• Developed by the U.S. National Renewable Energy Laboratory (NREL)
– Now a tool sold by HOMER Energy
• The HOMER Micropower Optimization Model is an economic tool used to assist in the design of micropower systems and find the least cost combination of components
• HOMER (Hybrid Optimization Model for Multiple Energy Resources) nests three functions:– Simulation, Optimization, and Sensitivity analysis
• HOMER allows the modeler to compare many different design options based on their technical and economic merits
42
C PER
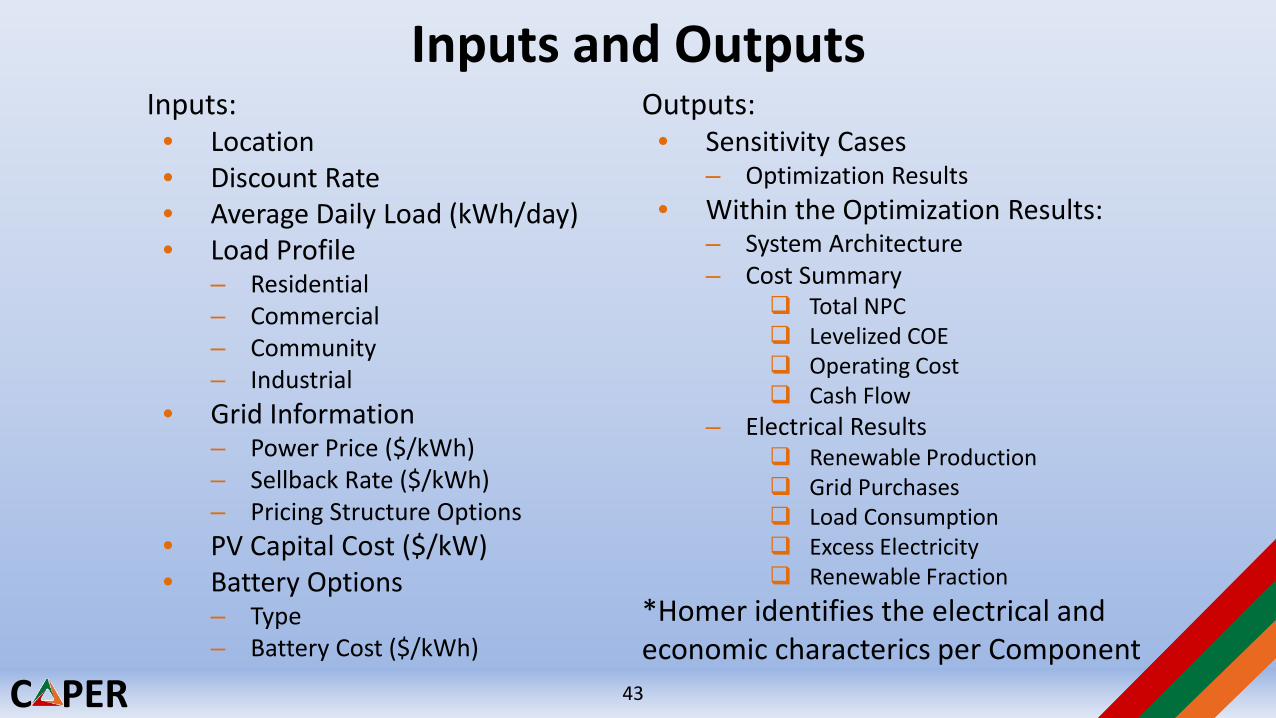
Inputs and OutputsInputs:• Location• Discount Rate• Average Daily Load (kWh/day)• Load Profile
– Residential– Commercial– Community– Industrial
• Grid Information– Power Price ($/kWh)– Sellback Rate ($/kWh)– Pricing Structure Options
• PV Capital Cost ($/kW)• Battery Options
– Type– Battery Cost ($/kWh)
Outputs:• Sensitivity Cases
– Optimization Results• Within the Optimization Results:
– System Architecture– Cost Summary
Total NPC Levelized COE Operating Cost Cash Flow
– Electrical Results Renewable Production Grid Purchases Load Consumption Excess Electricity Renewable Fraction
*Homer identifies the electrical and economic characterics per Component
43
C PER
Residential PV + Storage Example
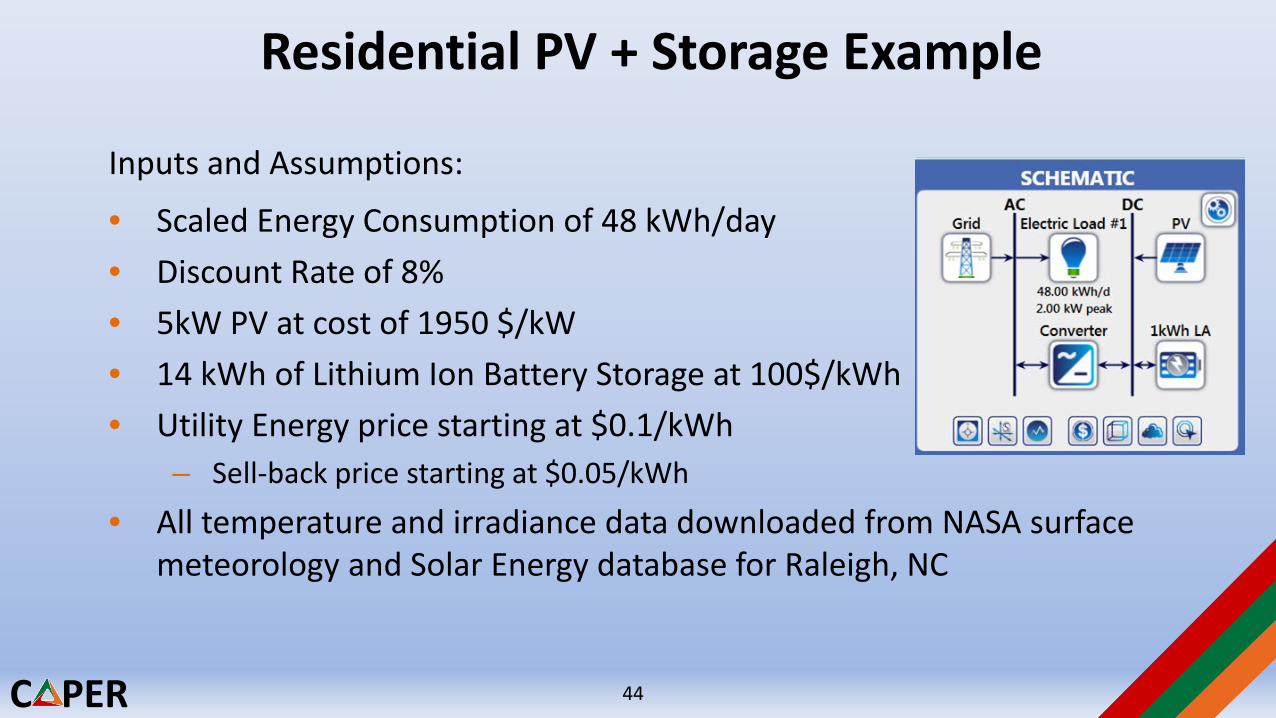
Inputs and Assumptions:
• Scaled Energy Consumption of 48 kWh/day• Discount Rate of 8%• 5kW PV at cost of 1950 $/kW• 14 kWh of Lithium Ion Battery Storage at 100$/kWh• Utility Energy price starting at $0.1/kWh
– Sell-back price starting at $0.05/kWh• All temperature and irradiance data downloaded from NASA surface
meteorology and Solar Energy database for Raleigh, NC
44
C PER
Residential PV + Storage Example
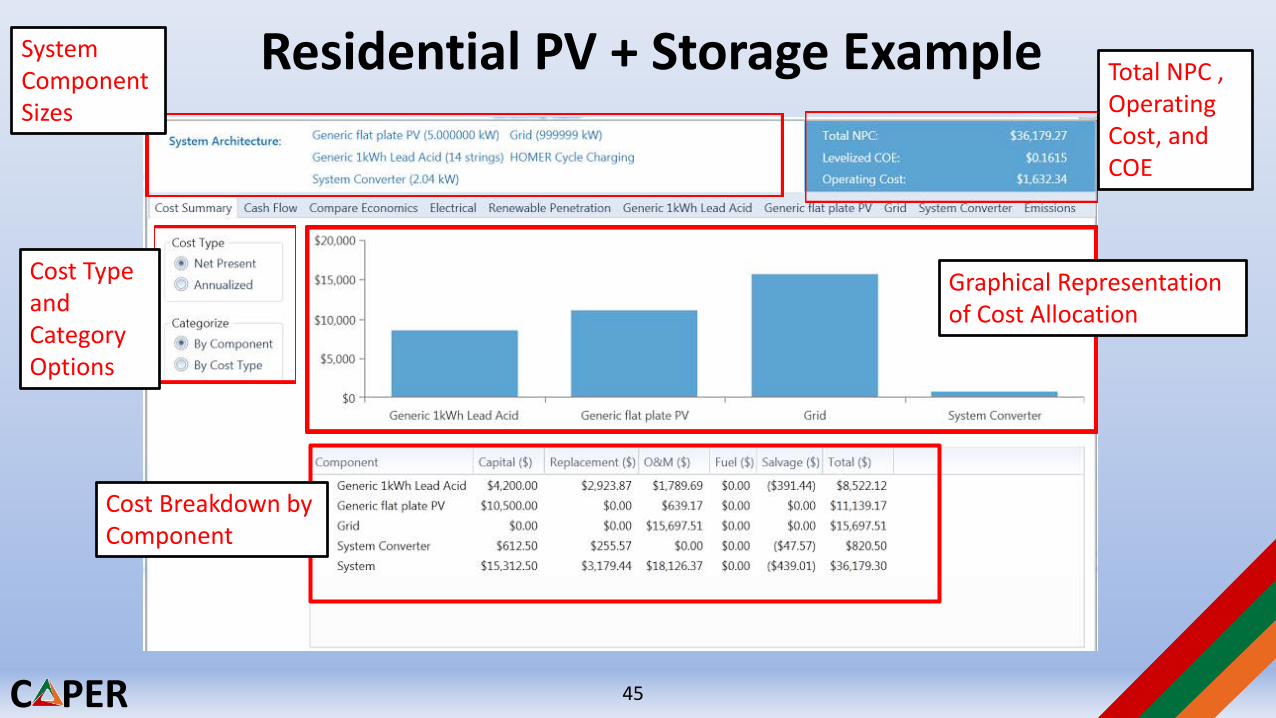
Cost Breakdown by Component
Graphical Representation of Cost Allocation
Cost Type and CategoryOptions
System Component Sizes
Total NPC , Operating Cost, and COE
45
C PER
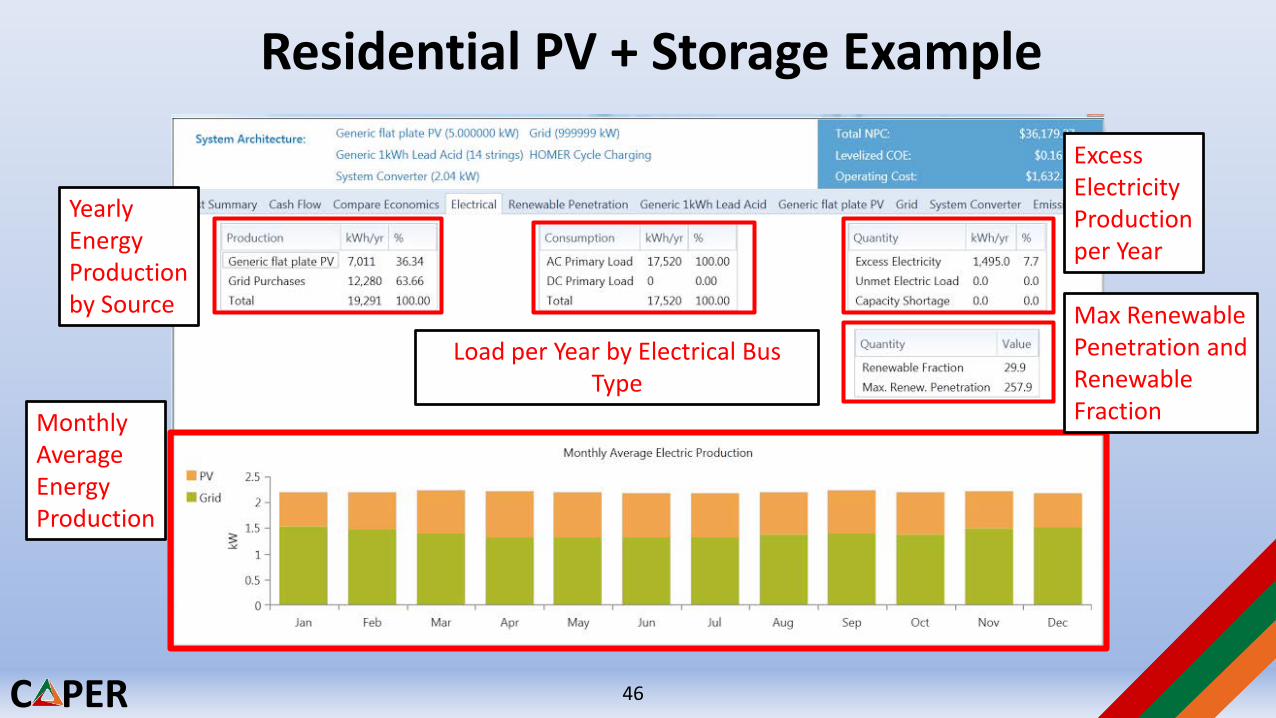
Residential PV + Storage Example
Monthly Average Energy Production
Yearly Energy Production by Source
Excess Electricity Production per Year
Max Renewable Penetration and Renewable Fraction
Load per Year by Electrical Bus Type
46
C PER
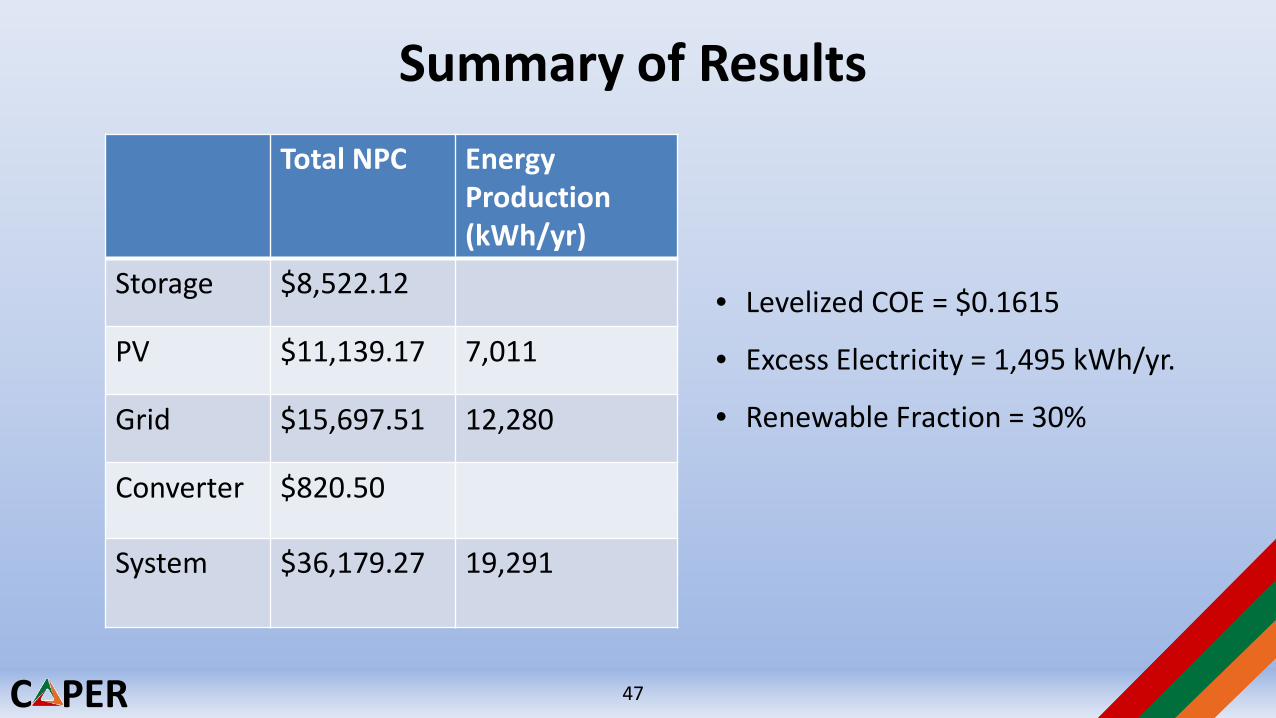
Summary of ResultsTotal NPC Energy
Production(kWh/yr)
Storage $8,522.12
PV $11,139.17 7,011
Grid $15,697.51 12,280
Converter $820.50
System $36,179.27 19,291
• Levelized COE = $0.1615
• Excess Electricity = 1,495 kWh/yr.
• Renewable Fraction = 30%
47
C PER
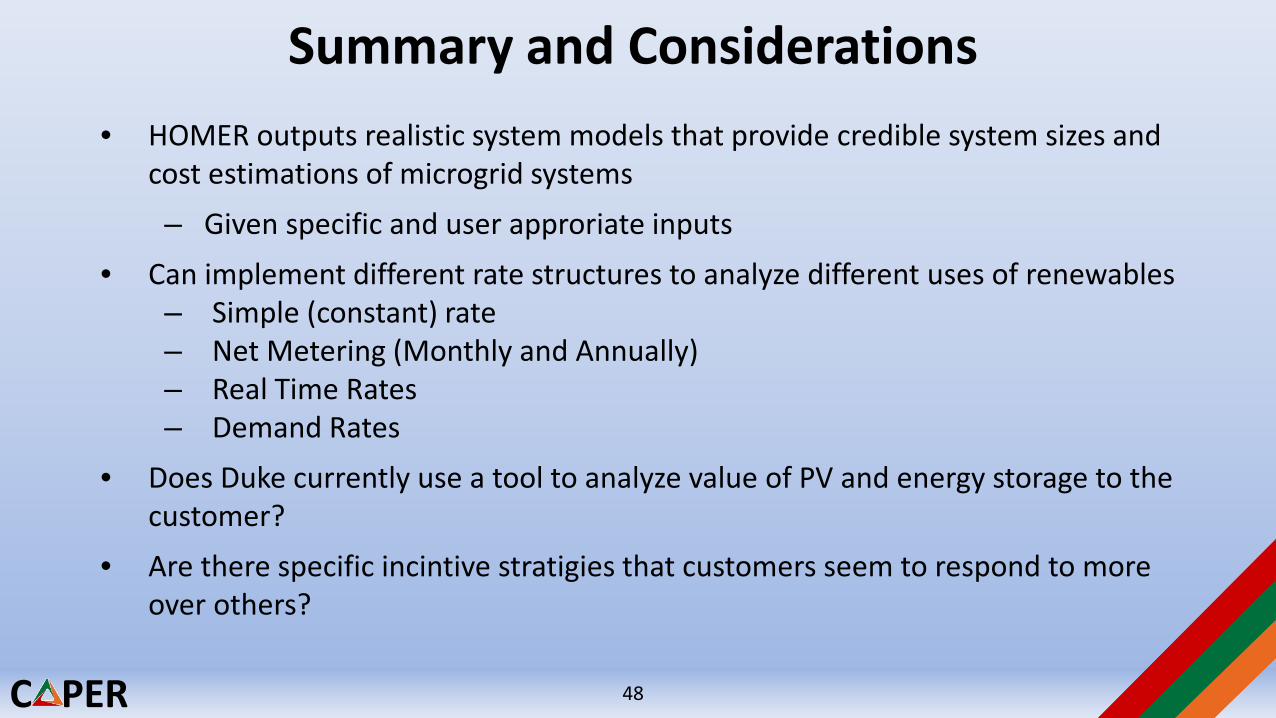
Summary and Considerations• HOMER outputs realistic system models that provide credible system sizes and
cost estimations of microgrid systems– Given specific and user approriate inputs
• Can implement different rate structures to analyze different uses of renewables– Simple (constant) rate– Net Metering (Monthly and Annually)– Real Time Rates– Demand Rates
• Does Duke currently use a tool to analyze value of PV and energy storage to the customer?
• Are there specific incintive stratigies that customers seem to respond to more over others?
48
C PER
Active Distribution Systems:Modelling in OpenDSS
Joshua Smith
49
C PER
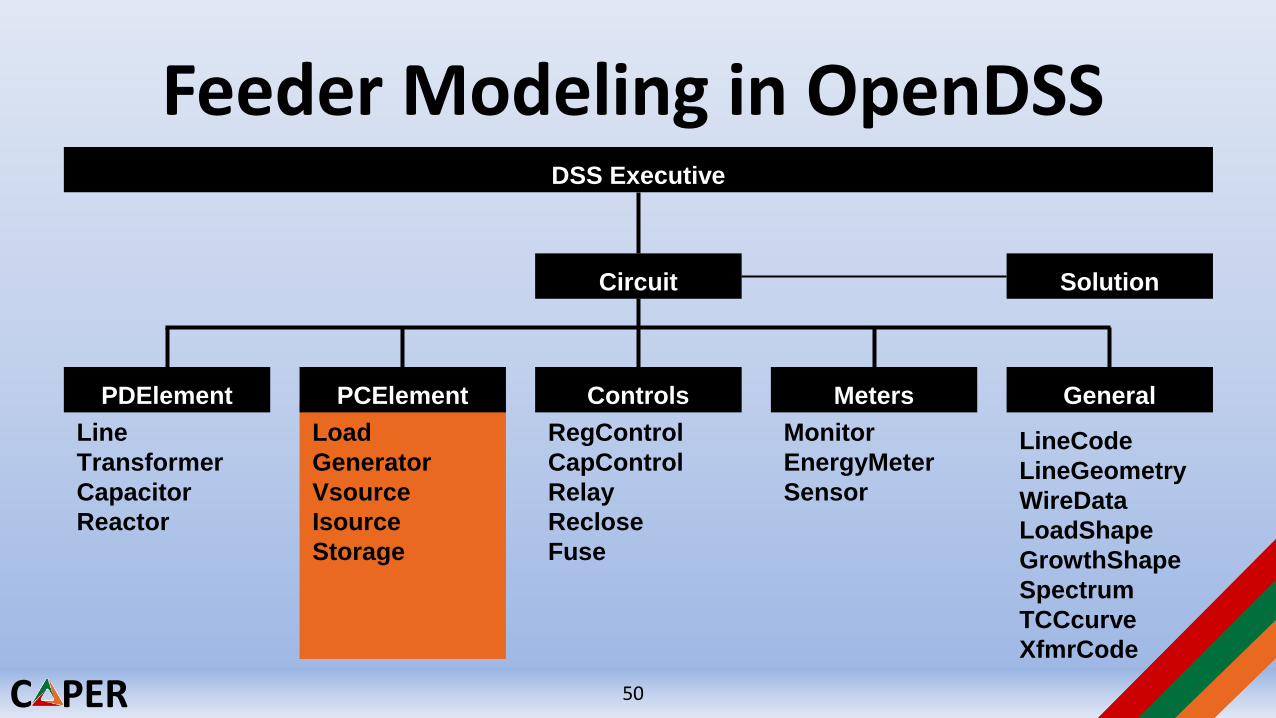
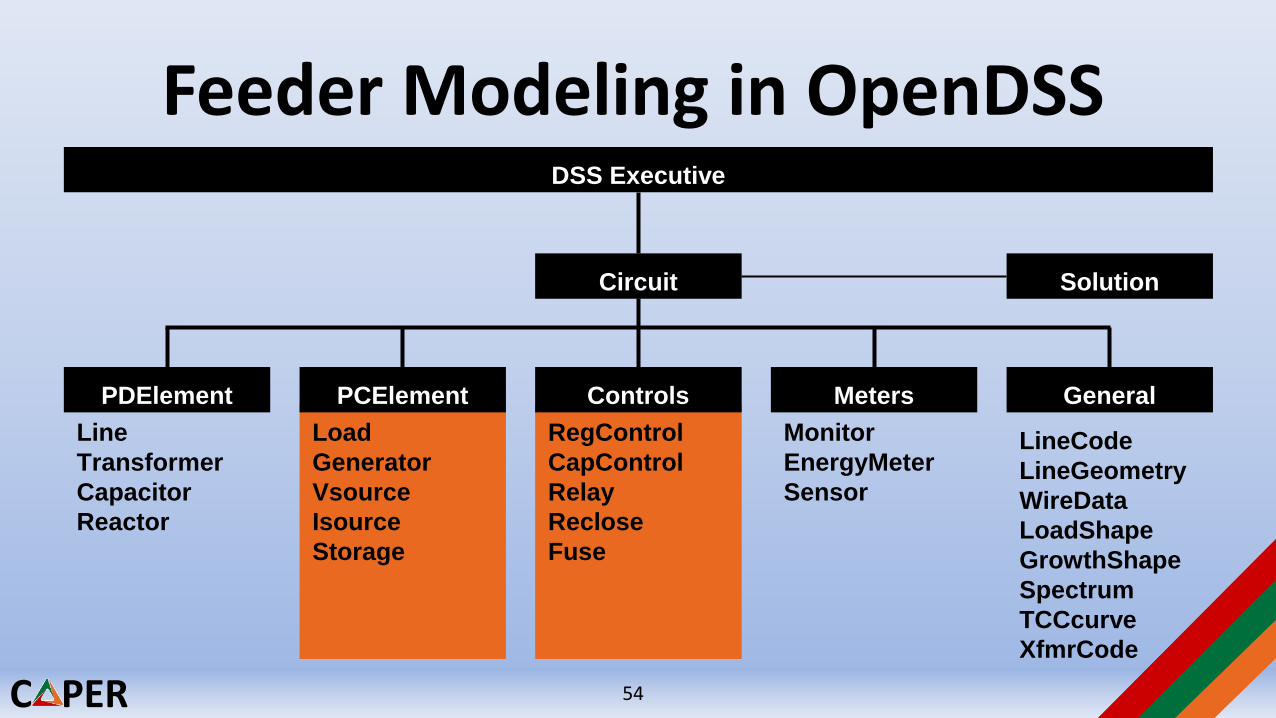
Feeder Modeling in OpenDSS
LineCodeLineGeometryWireDataLoadShapeGrowthShapeSpectrumTCCcurveXfmrCode
MonitorEnergyMeterSensor
RegControlCapControlRelayRecloseFuse
LoadGeneratorVsourceIsourceStorage
LineTransformerCapacitorReactor
PDElement PCElement Controls Meters General
Circuit Solution
DSS Executive
50
C PER
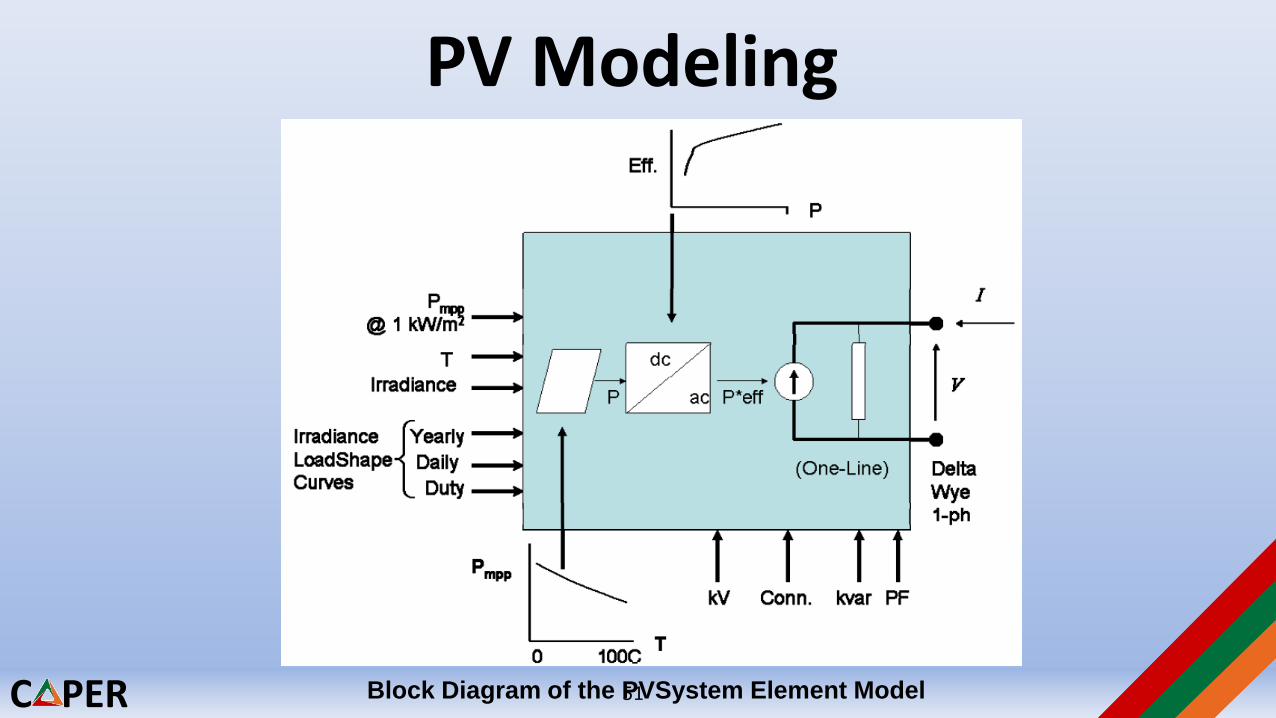
PV Modeling
Block Diagram of the PVSystem Element Model51
C PER
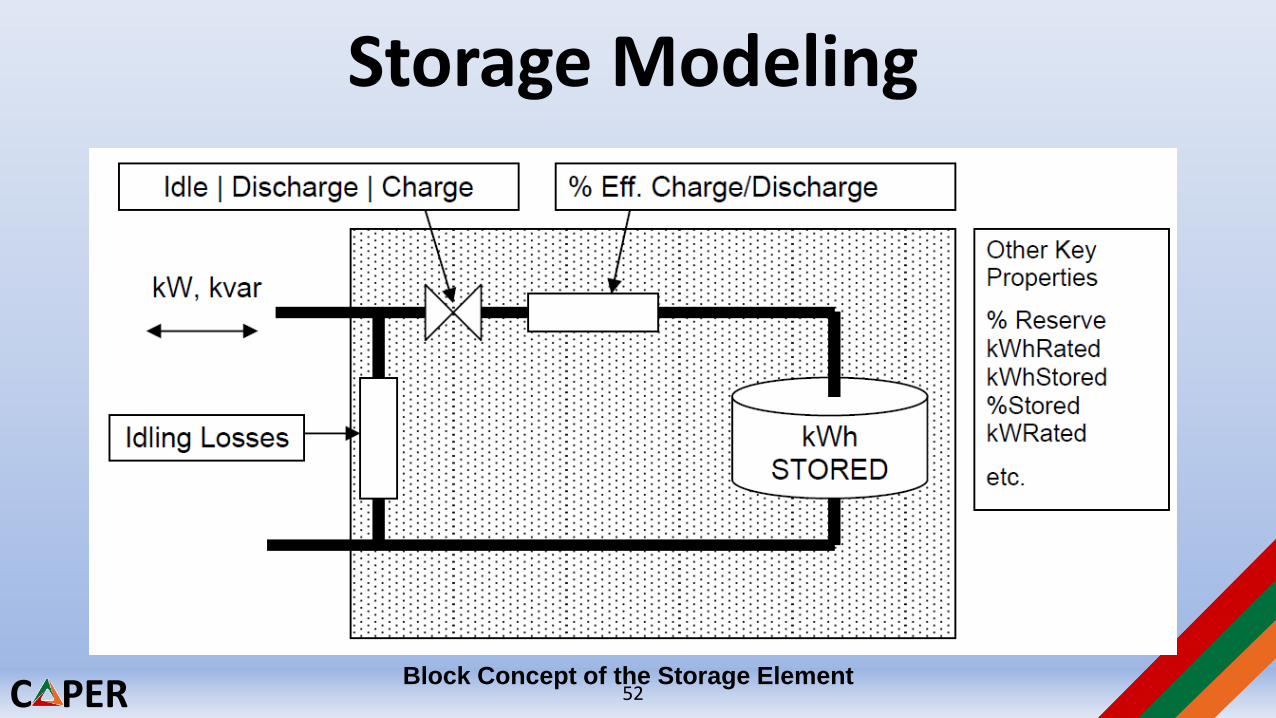
Storage Modeling
Block Concept of the Storage Element52
C PER
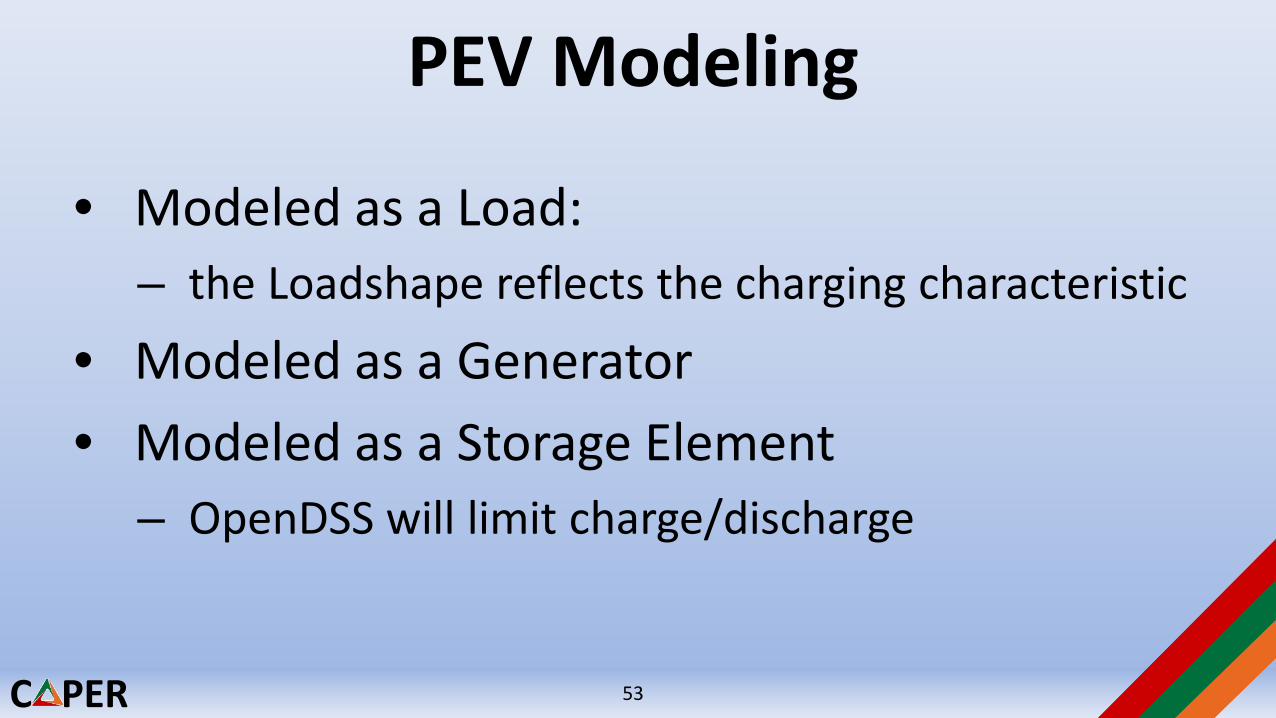
PEV Modeling
• Modeled as a Load:– the Loadshape reflects the charging characteristic
• Modeled as a Generator• Modeled as a Storage Element
– OpenDSS will limit charge/discharge
53
C PER
Feeder Modeling in OpenDSS
LineCodeLineGeometryWireDataLoadShapeGrowthShapeSpectrumTCCcurveXfmrCode
MonitorEnergyMeterSensor
RegControlCapControlRelayRecloseFuse
LoadGeneratorVsourceIsourceStorage
LineTransformerCapacitorReactor
PDElement PCElement Controls Meters General
Circuit Solution
DSS Executive
54
C PER
Modelling in GridLAB-D
Lisha Sun
55
C PER
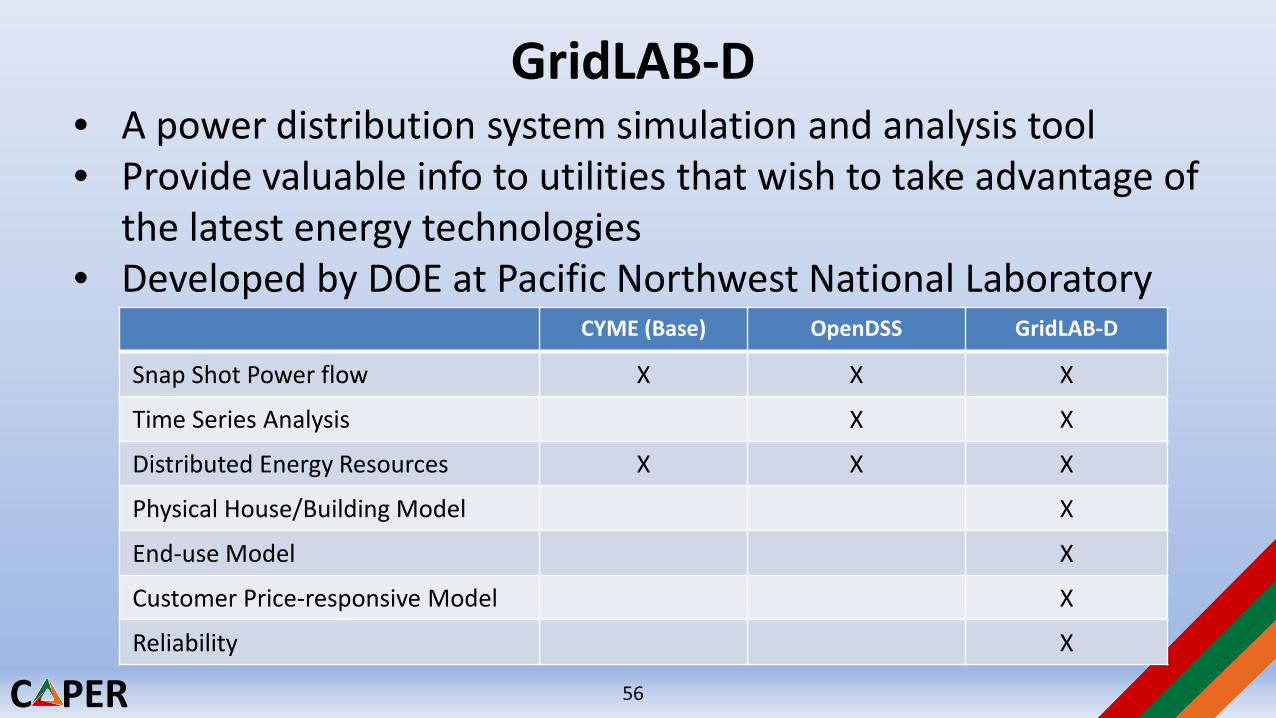
• A power distribution system simulation and analysis tool• Provide valuable info to utilities that wish to take advantage of
the latest energy technologies• Developed by DOE at Pacific Northwest National Laboratory
CYME (Base) OpenDSS GridLAB-D
Snap Shot Power flow X X X
Time Series Analysis X X
Distributed Energy Resources X X X
Physical House/Building Model X
End-use Model X
Customer Price-responsive Model X
Reliability X
GridLAB-D
56
C PER
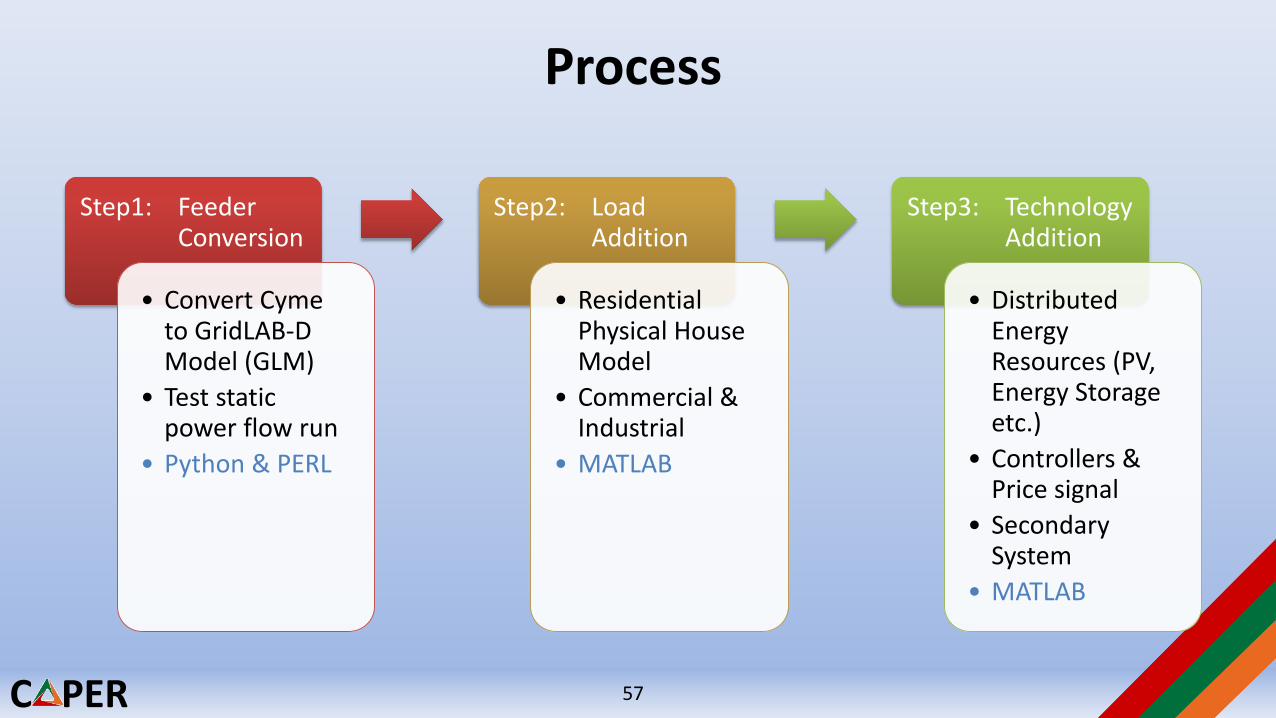
Process
Step1: Feeder Conversion
• Convert Cyme to GridLAB-D Model (GLM)
• Test static power flow run
• Python & PERL
Step2: Load Addition
• Residential Physical House Model
• Commercial & Industrial
• MATLAB
Step3: Technology Addition
• Distributed Energy Resources (PV, Energy Storage etc.)
• Controllers & Price signal
• Secondary System
• MATLAB
57
C PER
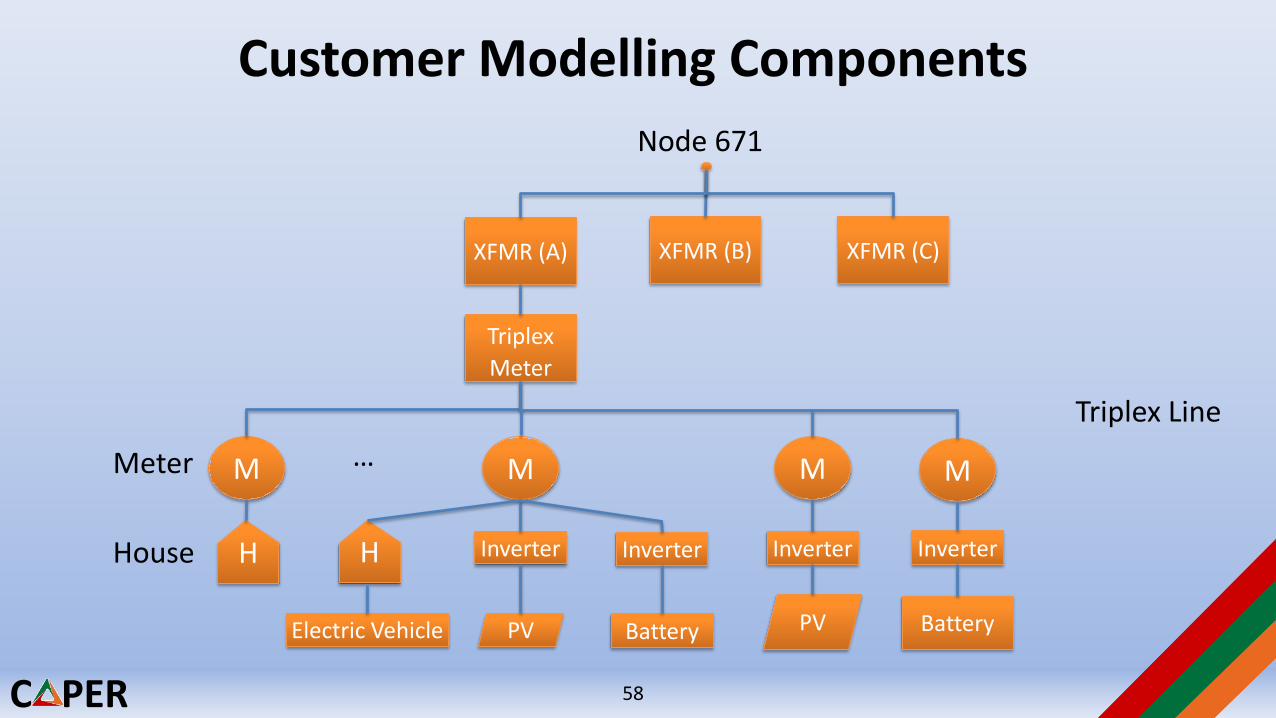
XFMR (A)
TriplexMeter
M MMeter
Triplex Line
H H
Node 671
PV
M
Inverter
Electric Vehicle
M
BatteryPV
Inverter
…
Inverter
Battery
Inverter
Customer Modelling Components
XFMR (B) XFMR (C)
House
58
C PER
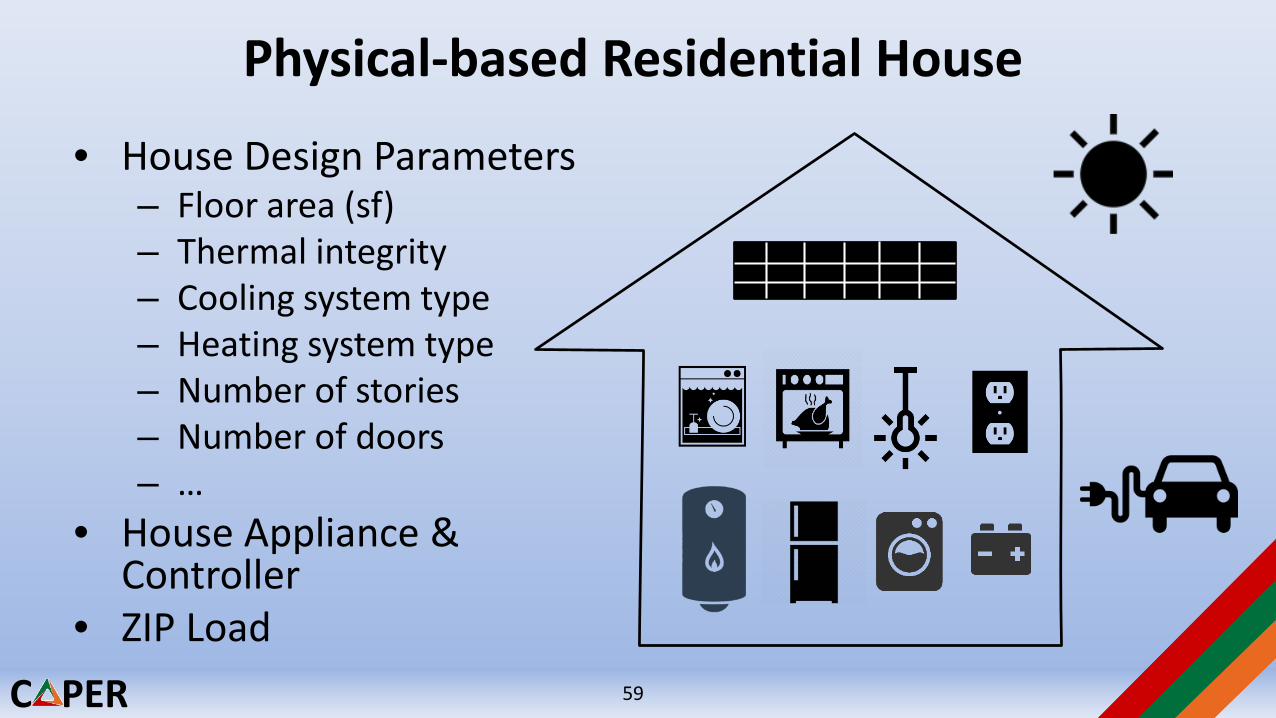
Physical-based Residential House
• House Design Parameters– Floor area (sf)– Thermal integrity– Cooling system type– Heating system type– Number of stories– Number of doors– …
• House Appliance & Controller
• ZIP Load59
C PER
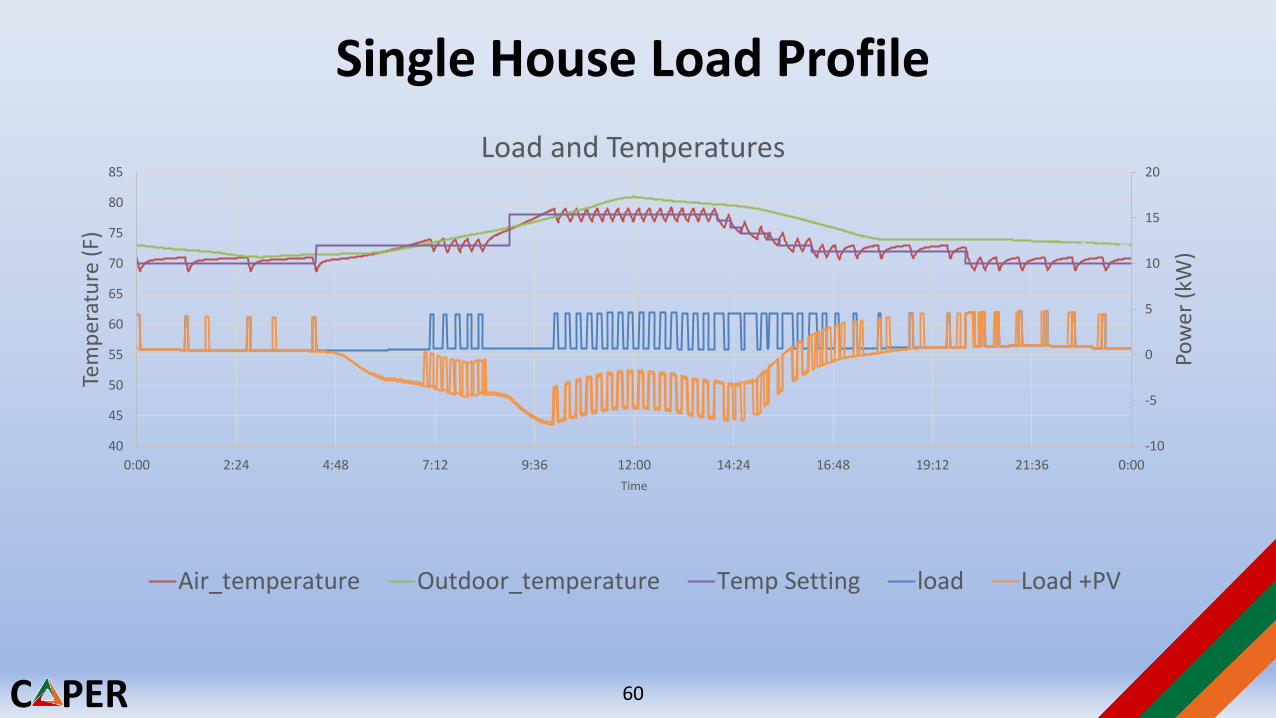
Single House Load Profile
-10
-5
0
5
10
15
20
40
45
50
55
60
65
70
75
80
85
0:00 2:24 4:48 7:12 9:36 12:00 14:24 16:48 19:12 21:36 0:00
Pow
er (k
W)
Tem
pera
ture
(F)
Time
Load and Temperatures
Air_temperature Outdoor_temperature Temp Setting load Load +PV
60
C PER
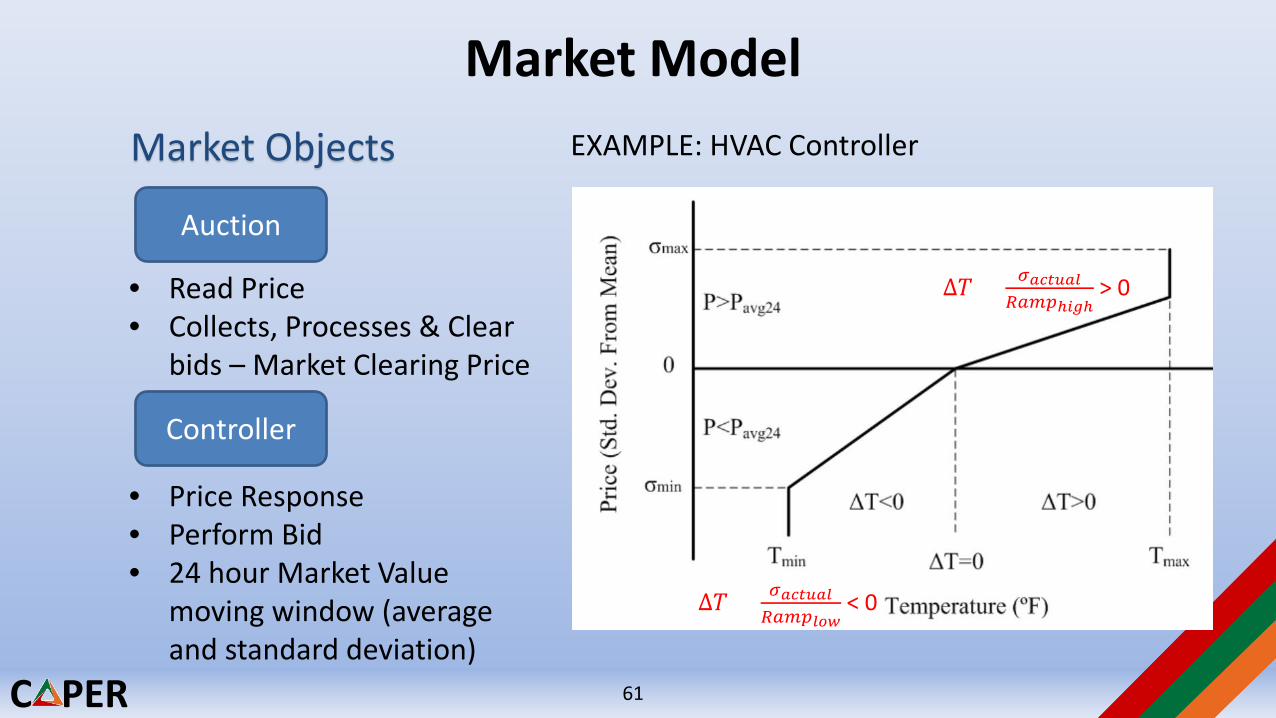
Market Model
Auction
Controller
Market Objects
• Price Response• Perform Bid• 24 hour Market Value
moving window (average and standard deviation)
• Read Price• Collects, Processes & Clear
bids – Market Clearing Price
EXAMPLE: HVAC Controller
∆𝑇𝑇 = 𝜎𝜎𝑎𝑎𝑎𝑎𝑎𝑎𝑎𝑎𝑎𝑎𝑎𝑎𝑅𝑅𝑅𝑅𝑅𝑅𝑅𝑅𝑎𝑎𝑙𝑙𝑙𝑙
< 0
∆𝑇𝑇 = 𝜎𝜎𝑎𝑎𝑎𝑎𝑎𝑎𝑎𝑎𝑎𝑎𝑎𝑎𝑅𝑅𝑅𝑅𝑅𝑅𝑅𝑅ℎ𝑖𝑖𝑖𝑖ℎ
> 0
61
C PER
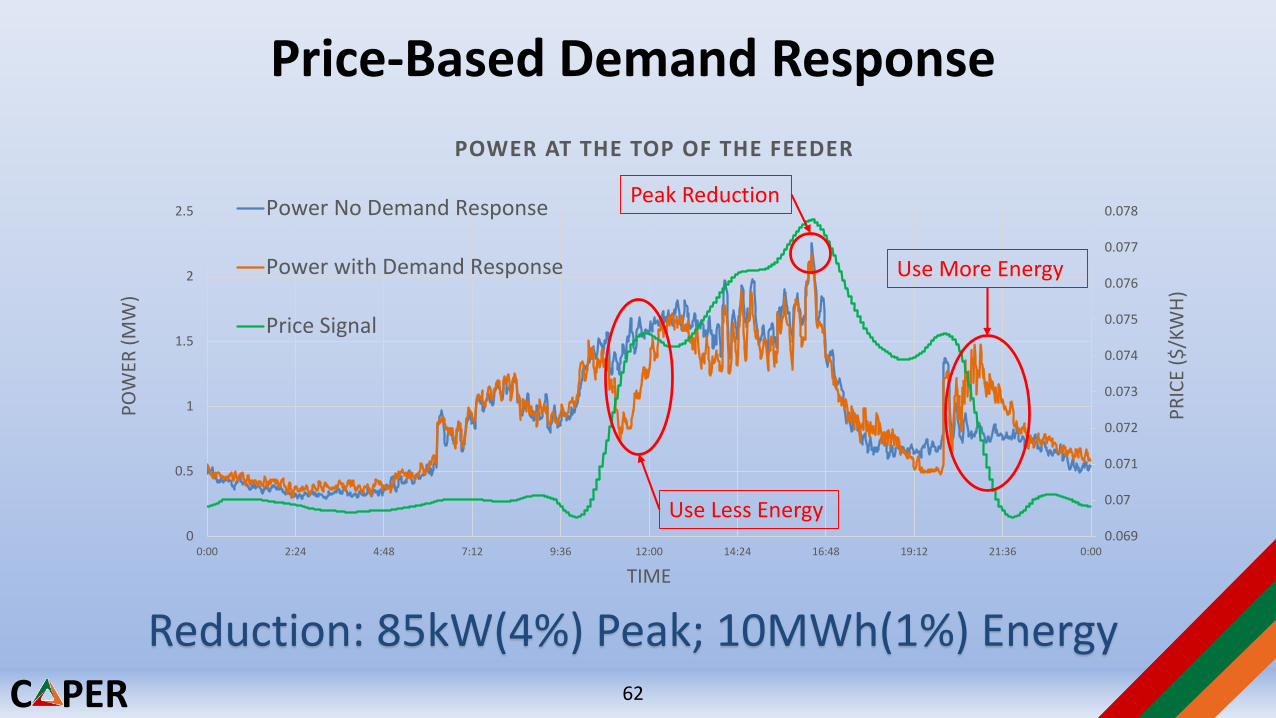
Price-Based Demand Response
0.069
0.07
0.071
0.072
0.073
0.074
0.075
0.076
0.077
0.078
0
0.5
1
1.5
2
2.5
0:00 2:24 4:48 7:12 9:36 12:00 14:24 16:48 19:12 21:36 0:00
PRIC
E ($
/KW
H)
POW
ER (M
W)
TIME
POWER AT THE TOP OF THE FEEDER
Power No Demand Response
Power with Demand Response
Price Signal
Reduction: 85kW(4%) Peak; 10MWh(1%) Energy
Peak Reduction
Use Less Energy
Use More Energy
62
C PER
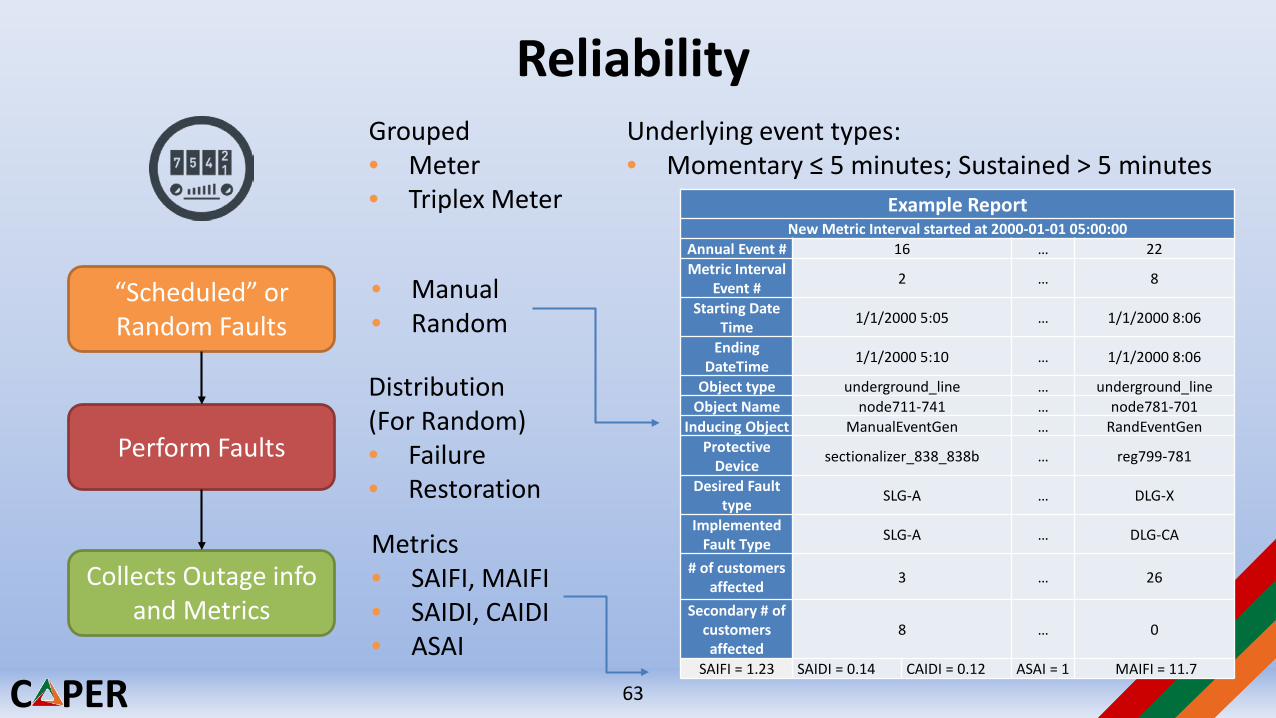
Reliability
“Scheduled” or Random Faults
Perform Faults
Collects Outage info and Metrics
• Manual • Random
Distribution(For Random)• Failure• Restoration
Metrics• SAIFI, MAIFI• SAIDI, CAIDI• ASAI
Grouped• Meter• Triplex Meter
Underlying event types:• Momentary ≤ 5 minutes; Sustained > 5 minutes
Example ReportNew Metric Interval started at 2000-01-01 05:00:00
Annual Event # 16 … 22Metric Interval
Event # 2 … 8
Starting Date Time 1/1/2000 5:05 … 1/1/2000 8:06
Ending DateTime 1/1/2000 5:10 … 1/1/2000 8:06
Object type underground_line … underground_lineObject Name node711-741 … node781-701
Inducing Object ManualEventGen … RandEventGenProtective
Device sectionalizer_838_838b … reg799-781
Desired Fault type SLG-A … DLG-X
Implemented Fault Type SLG-A … DLG-CA
# of customers affected 3 … 26
Secondary # of customers affected
8 … 0
SAIFI = 1.23 SAIDI = 0.14 CAIDI = 0.12 ASAI = 1 MAIFI = 11.7
63
C PER
Questions
• Any of the CAPER members using the same methodologies?
• Which features of GridLAB-D should we implement in this project?
• Is it reasonable for us to have access to customer information?
64
C PER
Customer Modeling
David Mulcahy
65
C PER
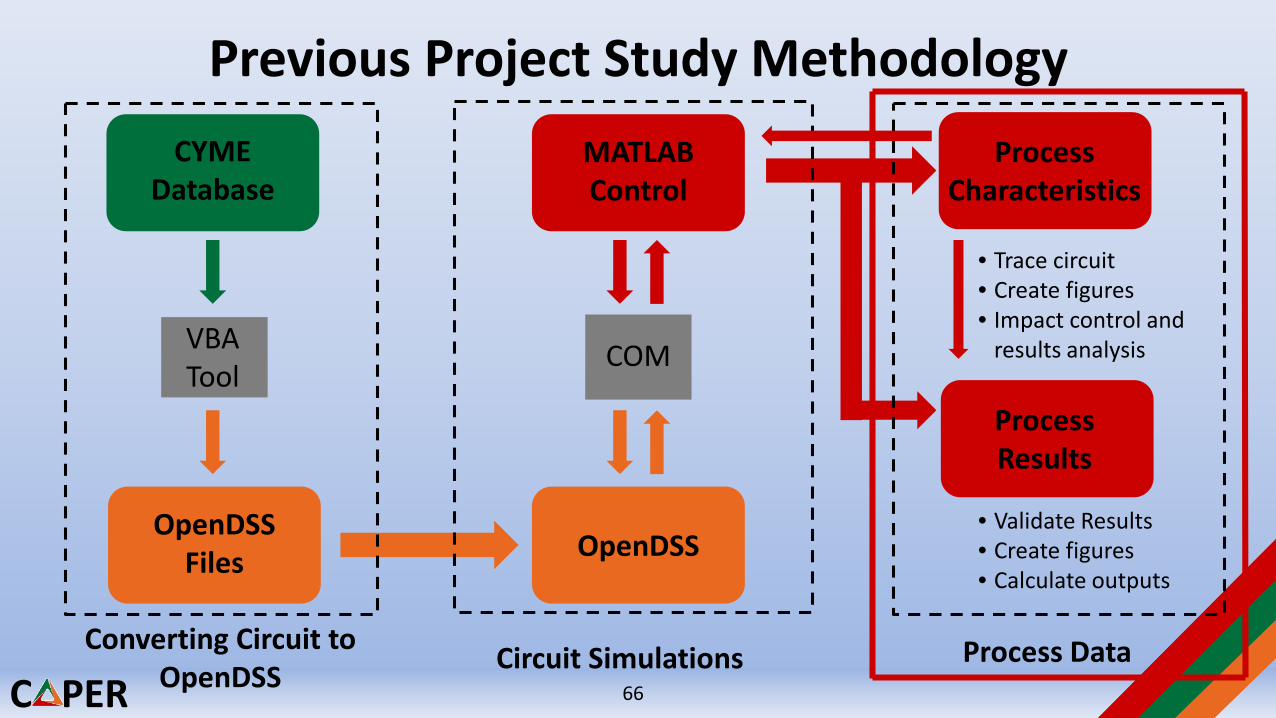
CYME Database
OpenDSSFiles
Converting Circuit to OpenDSS
OpenDSS
COMVBA Tool
MATLAB Control
Circuit Simulations
Process Characteristics
Process Results
• Validate Results• Create figures• Calculate outputs
Process Data
• Trace circuit• Create figures• Impact control and
results analysis
Previous Project Study Methodology
66
C PER
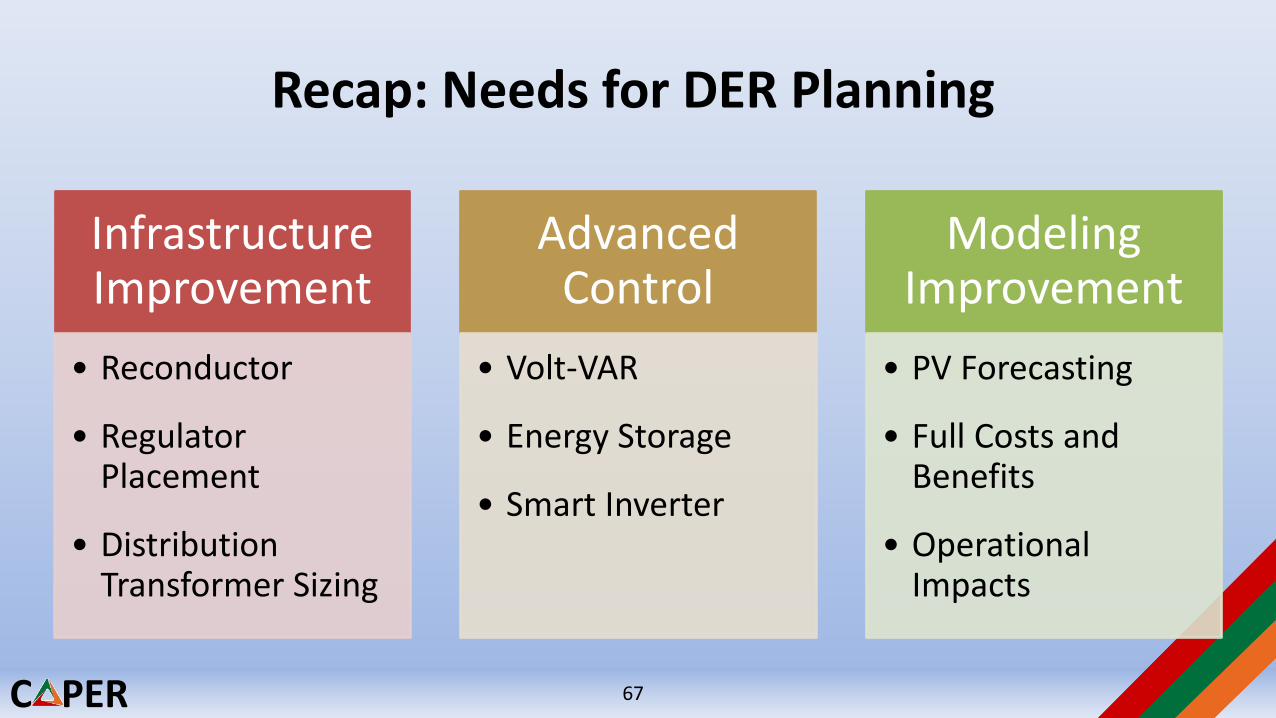
Recap: Needs for DER Planning
Infrastructure Improvement
• Reconductor
• Regulator Placement
• Distribution Transformer Sizing
Advanced Control
• Volt-VAR
• Energy Storage
• Smart Inverter
Modeling Improvement
• PV Forecasting
• Full Costs and Benefits
• Operational Impacts
67
C PER
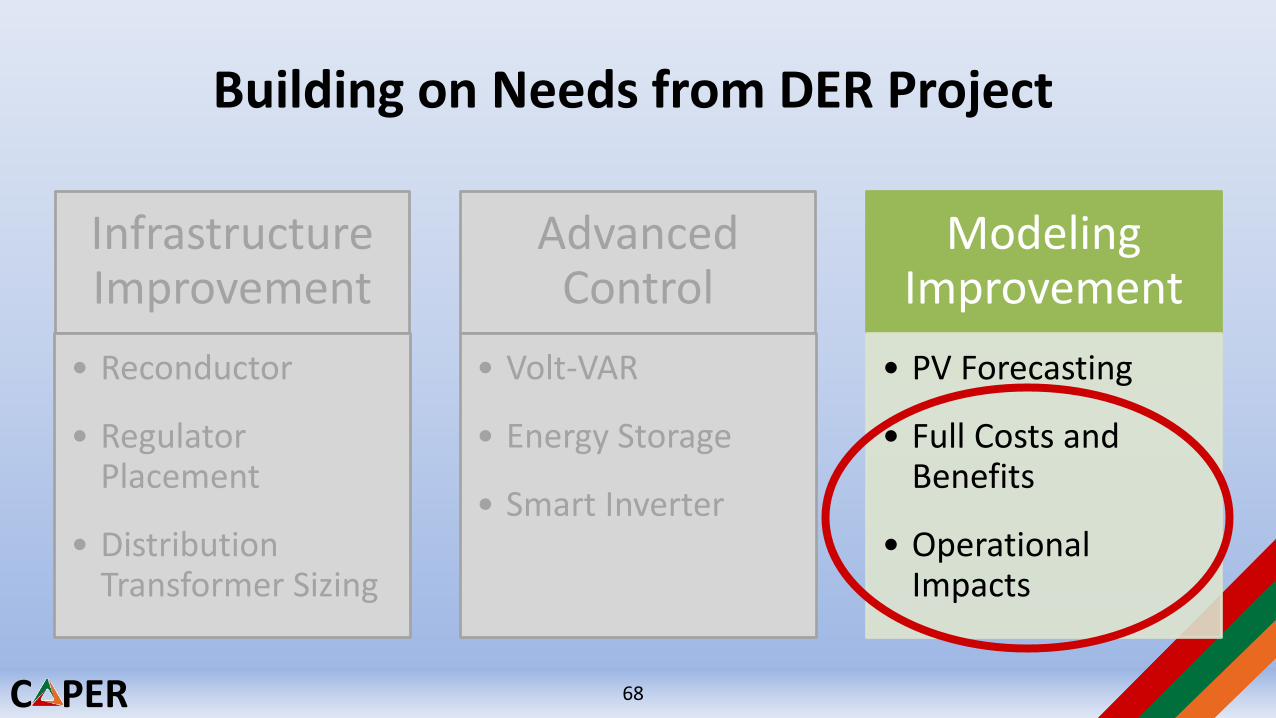
Building on Needs from DER Project
Infrastructure Improvement
• Reconductor
• Regulator Placement
• Distribution Transformer Sizing
Advanced Control
• Volt-VAR
• Energy Storage
• Smart Inverter
Modeling Improvement
• PV Forecasting
• Full Costs and Benefits
• Operational Impacts
68
C PER
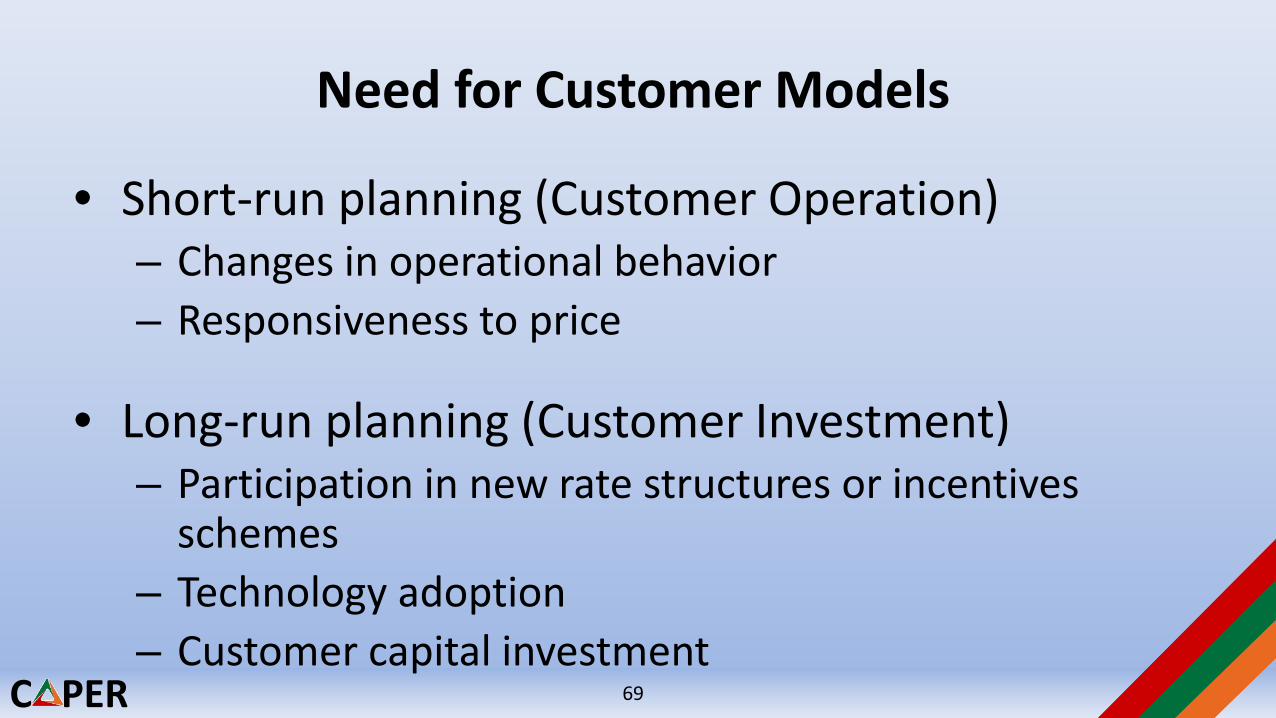
Need for Customer Models
• Short-run planning (Customer Operation)– Changes in operational behavior– Responsiveness to price
• Long-run planning (Customer Investment)– Participation in new rate structures or incentives
schemes– Technology adoption– Customer capital investment
69
C PER
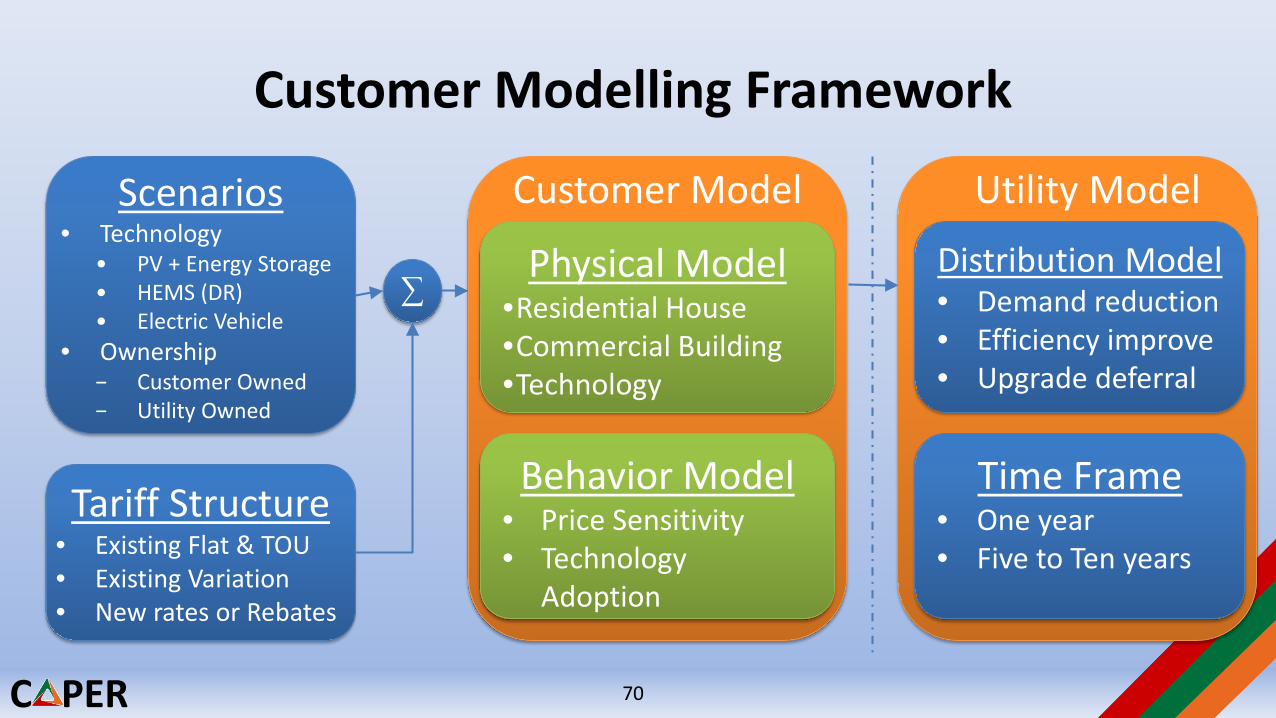
Customer Modelling Framework
Distribution Model• Demand reduction• Efficiency improve• Upgrade deferral
Scenarios• Technology
• PV + Energy Storage• HEMS (DR)• Electric Vehicle
• Ownership− Customer Owned− Utility Owned
Tariff Structure• Existing Flat & TOU• Existing Variation• New rates or Rebates
∑Physical Model
•Residential House•Commercial Building•Technology
Behavior Model• Price Sensitivity• Technology
Adoption
Customer Model Utility Model
Time Frame• One year• Five to Ten years
70
C PER
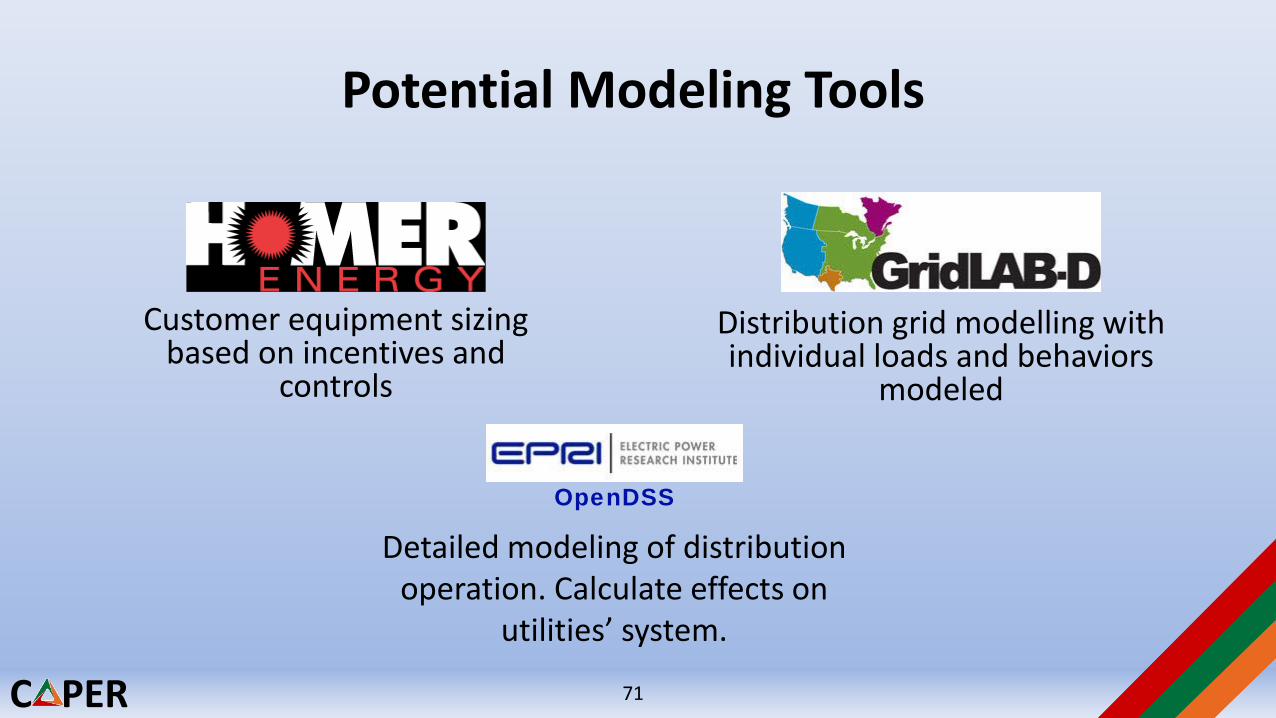
Potential Modeling Tools
Customer equipment sizing based on incentives and
controls
Distribution grid modelling with individual loads and behaviors
modeled
OpenDSS
Detailed modeling of distribution operation. Calculate effects on
utilities’ system.
71
C PER
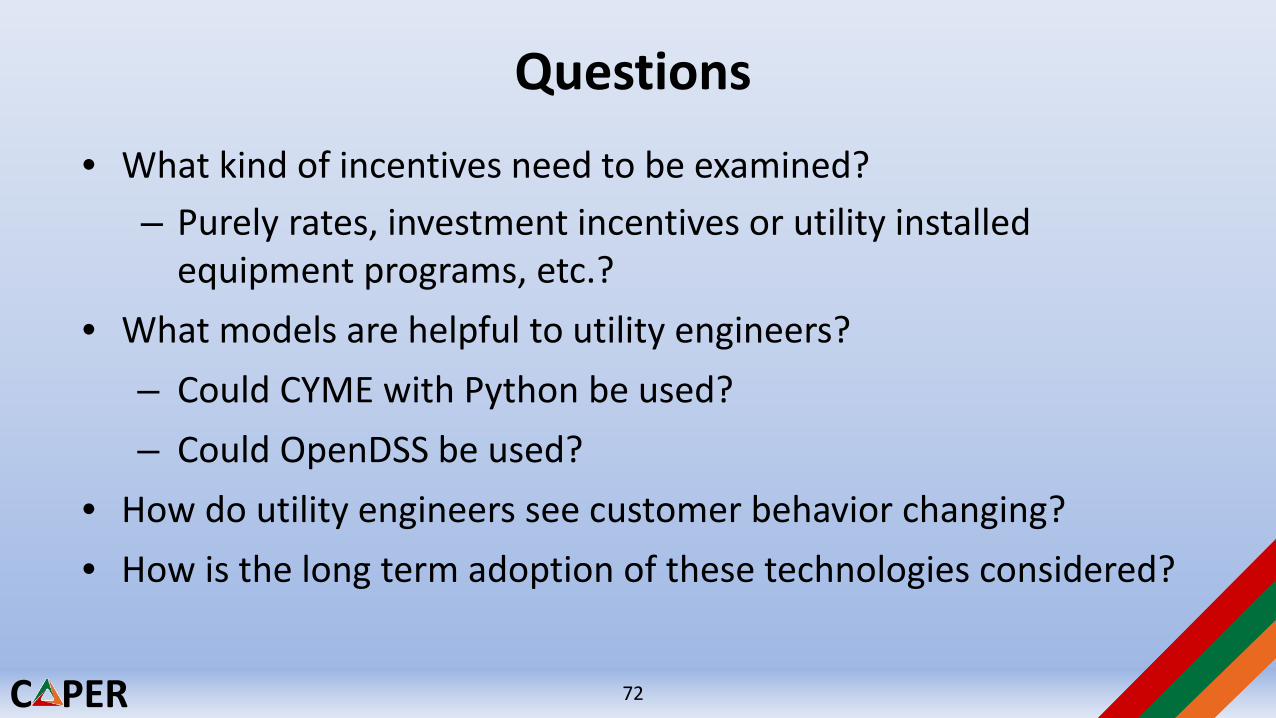
Questions• What kind of incentives need to be examined?
– Purely rates, investment incentives or utility installed equipment programs, etc.?
• What models are helpful to utility engineers?– Could CYME with Python be used?– Could OpenDSS be used?
• How do utility engineers see customer behavior changing?• How is the long term adoption of these technologies considered?
72
C PER
Conclusions
Dr. Ramtin Hadidi
73
C PER
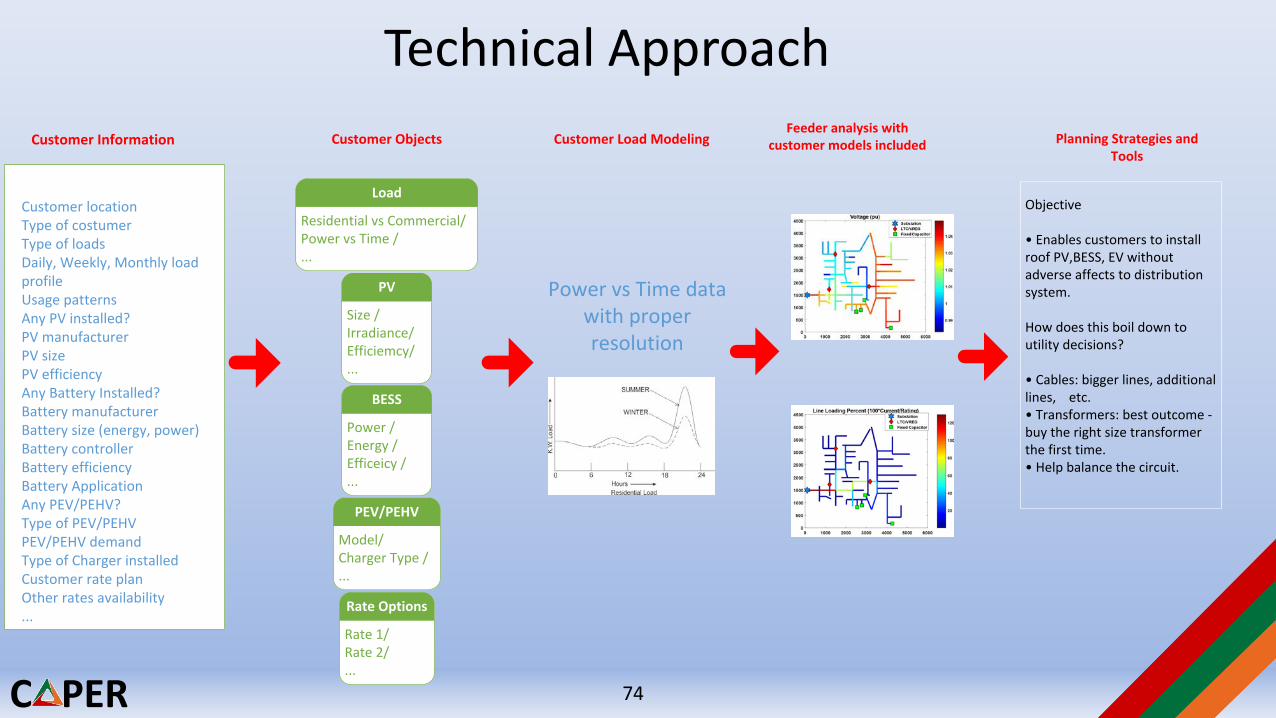
Customer Information
Customer locationType of costumerType of loadsDaily, Weekly, Monthly load profile Usage patternsAny PV installed?PV manufacturerPV sizePV efficiencyAny Battery Installed?Battery manufacturerBattery size (energy, power)Battery controllerBattery efficiencyBattery ApplicationAny PEV/PEHV?Type of PEV/PEHVPEV/PEHV demandType of Charger installed Customer rate planOther rates availability...
PV
Size / Irradiance/ Efficiemcy/...
Load
Residential vs Commercial/ Power vs Time / ...
BESS
Power / Energy / Efficeicy /...
PEV/PEHV
Model/Charger Type / ...
Rate Options
Rate 1/ Rate 2/...
Customer Objects Customer Load Modeling
Power vs Time data with proper resolution
Feeder analysis with customer models included Planning Strategies and
Tools
Objective
• Enables customers to install roof PV,BESS, EV without adverse affects to distribution system.
How does this boil down to utility decisions?
• Cables: bigger lines, additional lines, etc.• Transformers: best outcome - buy the right size transformer the first time.• Help balance the circuit.
Technical Approach
74
C PER
Data and Other Requirements
• Customer Information • Feeder Information• Software and Licensing • Factors to consider for planning studies
75
C PER
Thanks!
76