![Volume growth and rigidity of negatively curved manifolds ...Let us emphasize that if Xalso admits a uniform lattice then Xis a symmetric space of rank one (by [15], Corollary 9.2.2);](https://static.fdocuments.net/doc/165x107/5f0d0db67e708231d43872bb/volume-growth-and-rigidity-of-negatively-curved-manifolds-let-us-emphasize-that.jpg)
Curved Beam Computed Tomography based Structural Rigidity ...
13
Curved Beam Computed Tomography based Structural Rigidity Analysis of Bones with Simulated Lytic Defect: A Comparative Study with Finite Element Analysis Citation Oftadeh, R., Z. Karimi, J. Villa-Camacho, E. Tanck, N. Verdonschot, R. Goebel, B. D. Snyder, H. N. Hashemi, A. Vaziri, and A. Nazarian. 2016. “Curved Beam Computed Tomography based Structural Rigidity Analysis of Bones with Simulated Lytic Defect: A Comparative Study with Finite Element Analysis.” Scientific Reports 6 (1): 32397. doi:10.1038/srep32397. http:// dx.doi.org/10.1038/srep32397. Published Version doi:10.1038/srep32397 Permanent link http://nrs.harvard.edu/urn-3:HUL.InstRepos:29407628 Terms of Use This article was downloaded from Harvard University’s DASH repository, and is made available under the terms and conditions applicable to Other Posted Material, as set forth at http:// nrs.harvard.edu/urn-3:HUL.InstRepos:dash.current.terms-of-use#LAA Share Your Story The Harvard community has made this article openly available. Please share how this access benefits you. Submit a story . Accessibility
Transcript of Curved Beam Computed Tomography based Structural Rigidity ...

Curved Beam Computed Tomography based Structural Rigidity Analysis of Bones with Simulated Lytic Defect: A Comparative Study with Finite Element Analysis
CitationOftadeh, R., Z. Karimi, J. Villa-Camacho, E. Tanck, N. Verdonschot, R. Goebel, B. D. Snyder, H. N. Hashemi, A. Vaziri, and A. Nazarian. 2016. “Curved Beam Computed Tomography based Structural Rigidity Analysis of Bones with Simulated Lytic Defect: A Comparative Study with Finite Element Analysis.” Scientific Reports 6 (1): 32397. doi:10.1038/srep32397. http://dx.doi.org/10.1038/srep32397.
Published Versiondoi:10.1038/srep32397
Permanent linkhttp://nrs.harvard.edu/urn-3:HUL.InstRepos:29407628
Terms of UseThis article was downloaded from Harvard University’s DASH repository, and is made available under the terms and conditions applicable to Other Posted Material, as set forth at http://nrs.harvard.edu/urn-3:HUL.InstRepos:dash.current.terms-of-use#LAA
Share Your StoryThe Harvard community has made this article openly available.Please share how this access benefits you. Submit a story .
Accessibility

1Scientific RepoRts | 6:32397 | DOI: 10.1038/srep32397
www.nature.com/scientificreports
Curved Beam Computed Tomography based Structural Rigidity Analysis of Bones with Simulated Lytic Defect: A Comparative Study with Finite Element AnalysisR. Oftadeh1,2, Z. Karimi2, J. Villa-Camacho1, E. Tanck3, N. Verdonschot3, R. Goebel4, B. D. Snyder1, H. N. Hashemi2, A. Vaziri2 & A. Nazarian1
In this paper, a CT based structural rigidity analysis (CTRA) method that incorporates bone intrinsic local curvature is introduced to assess the compressive failure load of human femur with simulated lytic defects. The proposed CTRA is based on a three dimensional curved beam theory to obtain critical stresses within the human femur model. To test the proposed method, ten human cadaveric femurs with and without simulated defects were mechanically tested under axial compression to failure. Quantitative computed tomography images were acquired from the samples, and CTRA and finite element analysis were performed to obtain the failure load as well as rigidities in both straight and curved cross sections. Experimental results were compared to the results obtained from FEA and CTRA. The failure loads predicated by curved beam CTRA and FEA are in agreement with experimental results. The results also show that the proposed method is an efficient and reliable method to find both the location and magnitude of failure load. Moreover, the results show that the proposed curved CTRA outperforms the regular straight beam CTRA, which ignores the bone intrinsic curvature and can be used as a useful tool in clinical practices.
The skeleton is the third most common site of metastatic cancer, and nearly half of all cancers metastasize to bone1–3. Approximately 30–50% of bone metastases lead to pathologic fractures4, where the orthopaedic surgeon faces the dilemma of determining the probability of such an event, oftentimes based on subjective assessments of bone strength. Patients deemed to have a low risk of fracture are treated using nonsurgical approaches5,6, and operative treatment is reserved for cases of impending and pathological fractures in long bone and pelvic girdle metastases. Nevertheless, the scoring systems frequently used to evaluate fracture risk are now recognized to be inaccurate7. Therefore, there is a need for a reliable clinical tool to objectively assess fracture risk based on the material and geometric determinants of bone strength.
Computed tomography-based structural rigidity analysis (CTRA), which takes into account the material properties and structural organization of bone, can reliably predict failure load in rat and human bones with lytic defects8–14. However, CTRA calculations are derived from straight beam theory, where the influence of bone cur-vature on strength has not been considered . This influence has been shown to be significant in calculating bone fracture load15. Therefore, in current study, a new method for evaluating CTRA based on curved beam theory (curved CTRA) has been introduced. To that end, failure load predictions from curved CTRA, traditional CTRA
1Center for Advanced Orthopaedic Studies, Department of Orthopaedic Surgery, Beth Israel Deaconess Medical Center, Harvard Medical School, Boston, MA, USA. 2Department of Mechanical and Industrial Engineering, Northeastern University, Boston, MA, USA. 3Orthopaedic Research Laboratory, Radboud University Medical Center, Nijmegen, the Netherlands. 4Sport Science Program, Qatar University, Doha 2713, Qatar. Correspondence and requests for materials should be addressed to A.N. (email: [email protected])
Received: 19 January 2016
Accepted: 02 August 2016
Published: 02 September 2016
OPEN

www.nature.com/scientificreports/
2Scientific RepoRts | 6:32397 | DOI: 10.1038/srep32397
and Finite Element (FE) modeling has been compared to those of mechanical testing in an ex-vivo human model of femoral lytic defects. We hypothesize that curved beam CTRA will outperform traditional CTRA in terms of the accuracy of the predicated failure load and also the failure location and will correlate well with FEA and mechanical testing results.
Material and MethodsSpecimen Preparation. Following Institutional Review Board approval and in accordance with guidelines for use of cadaveric specimens with informed consents obtained, ten paired femurs from fresh frozen human cadavers (mean age 81.7 ± 10.65 years) were obtained from the Department of Anatomy at Radboud University Medical Center16,17. One of the femurs in each pair was left intact and assigned to the control group. The con-tralateral femur was assigned to the simulated lytic defect group, where one or more defects were created. Size and location of these lesions resembled clinical appearance of lytic metastatic lesions, as discussed with orthopedic oncologists. Lesion sizes and locations on defect femurs are shown in Table 1.
Imaging and Image Analysis. Quantitative computed tomography (QCT) images were acquired with the following settings: 120 kVp, 220 mA, slice thickness 3 mm, pitch 1.5, spiral and standard reconstruction, in-plane resolution 0.9375 mm (ACQSim, Philips, Eindhoven, The Netherlands)16. The femurs were scanned in a water basin, on top of a solid calibration phantom (Image Analysis, Columbia, KY, USA).
Mechanical Testing. Following imaging, the specimens underwent mechanical testing in a hydraulic mechanical testing system (MTS, Eden Prairie, MN, USA)16. The setup was designed to simulate single-limb stance-type loading conditions on the femur (Fig. 1A). A 30 mm diameter plastic cup with concave shape was used to apply the load to the femoral head. An axial load was applied on the head of the femur, with 10 N/s from 0 N until failure, while force and displacement of the plunger were recorded. The failure location of each femur was photographically documented.
Finite Element Analysis. Three dimensional (3D) models of the femurs were constructed using MATLAB (MathWorks Inc., Natick, MA, USA). The calcium-phosphate (Ca-P) density (ρ CHA) of each pixel in the CT scan was calculated using the calibrating phantoms18 (the pixels below 30 mg/ml were automatically removed), and a 3D model was constructed using mutually connected pixels19,20. Using the relationship ρash = 0.0633 + 0.887ρCHA
21, the Ca-P densities were transformed to bone mineral density (ρash). Then, the mineral densities were converted to tissue elastic modulus using empirically derived constitutive equations for cancellous22,23 and cortical24 bone. Elastic-perfectly plastic isotropic material behavior was assigned to model the mechanical behavior of bone mate-rial, and constrains and boundary conditions were applied to the model to mimic the mechanical testing exper-iments16. The developed models were imported to finite element (FE) software, ANSYS (Academic Research, Release 14.0, Cecil, PA, USA), which was used to perform the FE analysis. Each model was rotated to the cor-responding orientation of the femur in mechanical testing based on the position of the tantalum markers in the CT scans. Finite element analysis was conducted in displacement control, and the displacement was applied incrementally using a cup with 30 mm diameter consistent with the mechanical tests (Fig. 1B). The distal femur was fixed using two bundles of high-stiffness springs to imitate the experiments (Fig. 1B). Plastic behavior was excluded from the elements in the top surface in contact with cup to prevent unrealistic distortion. For each displacement increment (i.e. 0.025 mm), the total reaction force was calculated as the sum of all nodal forces in contact with the cup. The failure load in FE analysis was defined as the maximum total reaction force achieved during loading under displacement control. Failure location in the computational models was defined by the location of maximum effective plastic strain at the maximum total reaction force.
Structural Rigidity Analysis. CTRA determines bone rigidity and likelihood of failure based on the axial (EA), bending (EI), and torsional (GJ) rigidities of the weakest cross-section in the bone8. These parameters were evaluated at each transaxial cross-section by summing the rigidity of all pixels (Fig. 2).
The failure load of femoral bone subject to axial and bending moment can be obtained by assuming that planes stay plane in deformation, and shear deformation is neglected. For a general asymmetric cross section and assum-ing straight beam, the failure load can be expressed as:
Specimen
Lesion characteristics
Size (mm) Location
1 40 Med, prox
2 40 Med, shaft
3 22 Med, prox
4 40 Post, prox
5 45 Med, prox
6 40 Lat, prox
7 2 × 22 Med, prox & shaft
8 40 Ant, prox
9 22 Ant, prox
10 2 × 30 Ant, prox & shaft
Table 1. Artificial Lesion sizes and locations on defect femurs.

www.nature.com/scientificreports/
3Scientific RepoRts | 6:32397 | DOI: 10.1038/srep32397
ε=F D (1)c c c
Figure 1. Mechanical testing setup (1) the load is applied with plastic cup (2) the point of rotation and (3) All rotations are restricted except the rotation around the AP-axis16. (B) Representing finite element model.
Figure 2. Representation of the curve beam model. (ABCD section from right figure is shown on the left before and after deformation with corresponding strains).

www.nature.com/scientificreports/
4Scientific RepoRts | 6:32397 | DOI: 10.1038/srep32397
where Dc is the rigidity at the weakest bone cross-section and εc is the critical strain which identifies the fracture initiation. Using straight beam theory25, Dc can be defined as:
γ α β=
− +D
x y1
(2)c
st st c st c
where γst is associated with axial rigidity, and αst and βst are associated with bending rigidity of the cross section. xc and yc are coordinates of critical location in the weakest cross-section. γst, αst and β are defined as:
γρ
=∑E A
1( ) (3)
sti i i
α =+
−
D EI D EI
EI EI EI
( ) ( )
( ) ( ) ( ) (4)st
x x y xy
x y xy2
β =+
−
D EI D EI
EI EI EI
( ) ( )
( ) ( ) ( ) (5)st
y y x xy
x y xy2
where Dx and Dy are the distances, from the geometric centroid, to the applied load in x and y directions. Ei and ρi are the elastic modulus and density, respectively, at the ith location of the cross-section, and Ai is the incremental cross-sectional area (Fig. 2) and (EI)x, (EI)y and (EI)xy correspond to the bending rigidities of the cross-section respect to its centroid and can be defined as:
∑ ρ=EI E y A( ) ( ) (6)x i i i i2
∑ ρ=EI E x A( ) ( ) (7)y i i i i2
∑ ρ=EI E x y A( ) ( ) (8)xy i i i i i
The centroid of cross section is obtained from
∫∫
=⁎xx E dA
E dA (9)
i i i
i i
∫∫
=⁎yy E dA
E dA (10)i i i
i i
As the traditional CTRA is based on straight beam theory, its main disadvantage is that it does not account for the influence of intrinsic bone curvature. This influence is particularly important for structures, where the ratio of the radius of curvature to the depth of a beam is less than 526, and neglecting curvature effect can cause a meaningful underestimation of resulting stresses25. The intertrochanteric region of the human femur has the highest curvature, this ratio is around 127. Therefore, in this case, it is essential to account for bone curvature in CTRA analyses. Consider the sample human femur bone cross-section shown in Fig. 2. The curved cross sections are found based on iteratively find the tangent vectors of curve passing through the centroid of cross sections and perpendicular to them. The iteration stops when there is no change on the position of tangent vectors and subsequently the position of curved cross sections. Circumferential stress σθθ on the ABCD section can be found by balancing the resultant forces and moments (N, Mx and My) acting on the cross-section with circumferential stresses. Shear stress σrθ can be neglected compared to σθθ for thick cross sections25:
∫ σ= θθN dA (11)
∫ σ= −θθM R r dA( ) (12)x
∫ σ= θθM xdA (13)y
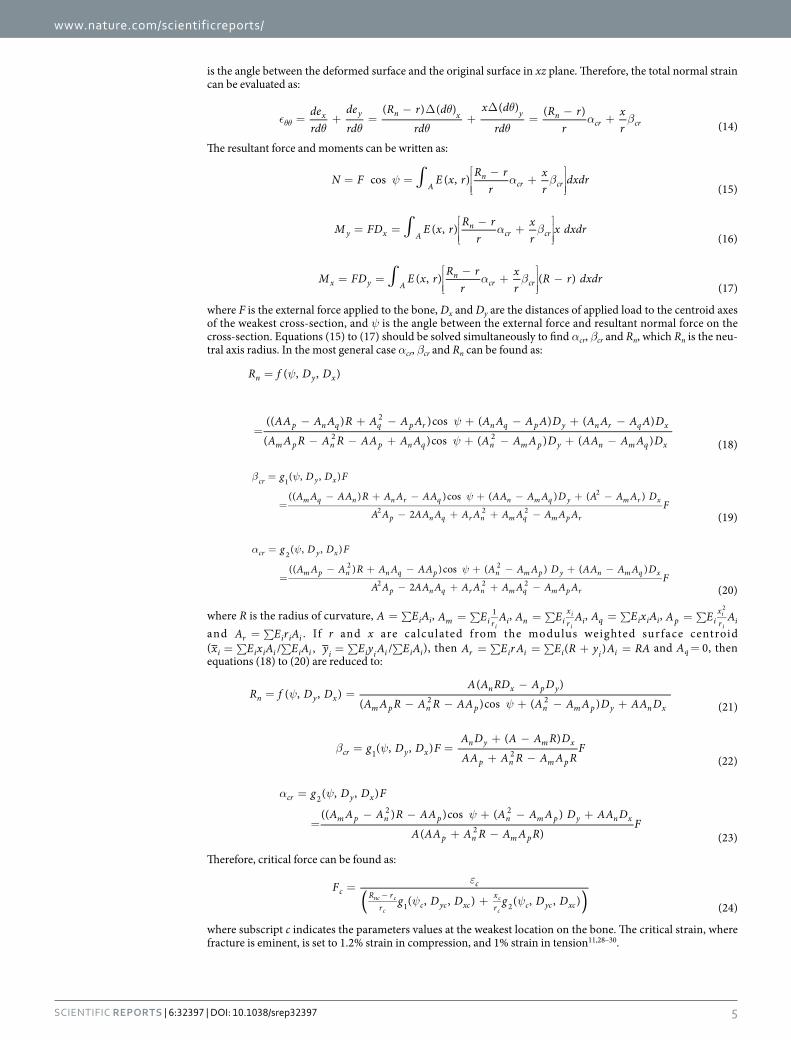
r is the distance of the center of curvature from an infinitesimal area (dA), and R is the distance of the center of curvature to the centroid of the whole cross-section. In Fig. 2, A′ B′ C′ D′ is a deformed shape of a curved element ABCD. The relative movement of typical point in yz plane due to deformation (dex) is equal to (Rn − r)Δ (dθ)x, where Rn neutral axis radius and Δ (dθ)x is the angle between the deformed surface and the original surface in yz plane. The relative movement of the point in xz plane due to deformation (dey) is equal to xΔ (dθ)y, where Δ (dθ)y
www.nature.com/scientificreports/
5Scientific RepoRts | 6:32397 | DOI: 10.1038/srep32397
is the angle between the deformed surface and the original surface in xz plane. Therefore, the total normal strain can be evaluated as:
θ θ
θ
θ
θ
θα β= + =
− ∆+∆
=−
+θθderd
derd
R r drd
x d
rdR r
rxr
( ) ( ) ( ) ( )(14)
x y n x y ncr cr
The resultant force and moments can be written as:
∫ψ α β= =
−
+
N F E x r R rr
xr
dxdrcos ( , )(15)A
ncr cr
∫ α β= =
−
+
M FD E x r R rr
xr
x dxdr( , )(16)y x A
ncr cr
∫ α β= =
−
+
−M FD E x r R r
rxr
R r dxdr( , ) ( )(17)x y A
ncr cr
where F is the external force applied to the bone, Dx and Dy are the distances of applied load to the centroid axes of the weakest cross-section, and ψ is the angle between the external force and resultant normal force on the cross-section. Equations (15) to (17) should be solved simultaneously to find αcr, βcr and Rn, which Rn is the neu-tral axis radius. In the most general case αcr, βcr and Rn can be found as:
ψ
ψ
ψ
=
=− + − + − + −
− − + + − + −
R f D D
AA A A R A A A A A A A D A A A A D
A A R A R AA A A A A A D AA A A D
( , , )
(( ) )cos ( ) ( )
( )cos ( ) ( ) (18)
n y x
p n q q p r n q p y n r q x
m p n p n q n m p y n m q x
2
2 2
β ψ
ψ
=
=− + − + − + −
− + + − (19)
g D D F
A A AA R A A AA AA A A D A A A D
A A AA A A A A A A A AF
( , , )
(( ) )cos ( ) ( )
2
cr y x
m q n n r q n m q y m r x
p n q r n m q m p r
12
2 2 2
α ψ
ψ
=
=− + − + − + −
− + + − (20)
g D D F
A A A R A A AA A A A D AA A A D
A A AA A A A A A A A AF
( , , )
(( ) )cos ( ) ( )
2
cr y x
m p n n q p n m p y n m q x
p n q r n m q m p r
22 2
2 2 2
where R is the radius of curvature, = ∑A E Ai i, = ∑A E Am i r i1
i, = ∑A E An i
xr i
i
i, = ∑A E x Aq i i i, = ∑A E Ap i
xr i
i
i
2
and = ∑A E r Ar i i i . If r and x are calculated from the modulus weighted surface centroid ( = ∑ ∑ = ∑ ∑x E x A E A y E y A E A/ , /i i i i i i i i i i i i), then = ∑ = ∑ + =A E r A E R y A RA( )r i i i i i and Aq = 0, then equations (18) to (20) are reduced to:
ψψ
= =−
− − + − +R f D D
A A RD A D
A A R A R AA A A A D AA D( , , )
( )
( )cos ( ) (21)n y x
n x p y
m p n p n m p y n x2 2
β ψ= =+ −
+ −g D D F
A D A A R D
AA A R A A RF( , , )
( )
(22)cr y x
n y m x
p n m p1 2
α ψ
ψ
=
=− − + − +
+ −
g D D F
A A A R AA A A A D AA D
A AA A R A A RF
( , , )
(( ) )cos ( )
( ) (23)
cr y x
m p n p n m p y n x
p n m p
22 2
2
Therefore, critical force can be found as:
ε
ψ ψ=
+−( )F
g D D g D D( , , ) ( , , ) (24)c
cR r
r c yc xcxr c yc xc1 2
nc c
c
c
c
where subscript c indicates the parameters values at the weakest location on the bone. The critical strain, where fracture is eminent, is set to 1.2% strain in compression, and 1% strain in tension11,28–30.

www.nature.com/scientificreports/
6Scientific RepoRts | 6:32397 | DOI: 10.1038/srep32397
An Ideal case. The capability of the proposed model was examined by considering an ideal case of a human femur. The results of straight beam and curved beam models were compared with results from finite element analysis. To simulate the bone femur shape, a hollow shaft with inside diameter (D1) of 16 mm and outside diam-eter (D2) of 32 mm was constructed. The finite element model was also constructed using ANSYS (Academic Research, Release 14.0, Cecil, PA, USA). The ratio of the radius of curvature to outside diameter (R/D2) was changed from 3 to 1000 in the three models to determine the effect of curvature on the maximum principal strain at the critical location. A nominal pressure of 1 Pa was applied at the top surface, while the bottom surface was fully restrained (Fig. 3A).
ResultsSchematic representation of hallow curved shaft used in the ideal case is shown in Fig. 3A. The results for the ideal case are shown in Fig. 3B, based on the difference of each model from FE analysis for the maximum prin-cipal strain. For small R/D2 ratios, the straight beam model is significantly biased, while the curved beam model
Figure 3. Ideal case (A) schematic representation of hallow curved shaft used in ideal case example with radius of curvature R, inner diameter D1 and outer diameter D2. (B) Percentage difference of critical strain in curved beam and straight beam model from that of finite element for various R/D2 (C–E) contour plot of maximum principal strain for hollow curved beam R/D2 = 3 based on straight beam (left figure), curved beam (middle figure) and finite element analysis (right figure).
Figure 4. Linear regression between failure loads predicted by (A) straight beam model (B) curved beam model and (C) Finite element analysis versus failure load from mechanical testing.

www.nature.com/scientificreports/
7Scientific RepoRts | 6:32397 | DOI: 10.1038/srep32397
exhibits a better correlation. As R/D2 increases, the two models converge. The strain contour plots for R/D2 = 3 are shown in Fig. 3C–E. Again, the curved beam model demonstrates a better correlation to FEA than the straight beam model.
Lesion sizes and locations on defect femurs are shown in Table 1. Mechanical testing setup, representing finite element model and Representation of the curve beam model are shown in Figs 1 and 2 respectively. The FE and curved beam CTRA models predicted the failure loads for intact femurs and femurs with lytic defects and exhib-ited a strong level of correlation with mechanical testing results (R2 = 0.91 and 0.87 against the line of equality, respectively; Fig. 4). On the other hand, the straight beam CTRA model overestimated the failure load in almost all cases and predicts larger failure loads than those reported from experiments. The regression analysis gives the negative coefficient of determination of − 0.9 against the line of equality which shows the line of equality does not follow the trend between the failure load from mechanical testing (Fmech) and straight CTRA (FStraight).
When using the best-fit linear regression, rigidity analysis obtained through curved beam CTRA demon-strated a strong correlation with the failure load obtained through mechanical testing (Fig. 5B,D,F). The coef-ficients of determination for the femurs were 0.89 for EA and 0.89 for EI and 0.73 for GJ, the torsional rigidity which is defined as the sum of GIx and GIy
12. For straight beam CTRA, the rigidities are not well correlated with experimental failure load, even when using the best-fit regression, as the coefficients of determination were 0.51
Figure 5. Linear regression between failure load from mechanical testing versus straight beam model (A) axial rigidity (C) bending rigidity (E) torsional rigidity and curved beam (B) axial rigidity (C) bending rigidity (F) torsional rigidity.

www.nature.com/scientificreports/
8Scientific RepoRts | 6:32397 | DOI: 10.1038/srep32397
for EA, 0.63 for EI and 0.59 for GJ (Fig. 5A,C,E). Note that Fig. 5C,D are plotted based on minimum bending rigidity (EImin) at each cross-section.
Since mechanical testing, FE analysis and both straight and curved beam CTRA measure failure load on the same specimens, the paired t-test approach has been chosen to assess the mean differences between the pairs. When considering all specimens, paired t-tests did not indicate differences between curved beam CTRA and mechanical testing with an average overestimation of 385 N for failure load (Table 2, P = 0.067). FE analysis demonstrated a mean difference of − 197 N compared to mechanical testing, which was not significant (P = 0.24). Straight beam CTRA showed a mean difference of − 3315 N when compared to mechanical testing (P < 0.001).
The Bland–Altman technique was applied to assess the agreement of straight beam CTRA, curved beam CTRA or FE-based failure load with the gold standard mechanical testing with limits of agreement determined as mean difference ± 1.96 standard deviations (i.e., 95% confidence interval of the difference)31,32. The Bland-Altman Method is based on plotting the difference of two parameters versus their average, in order to analyze the agree-ment between the two parameters in question. Bland–Altman analysis revealed that the limits of agreement defined as 95% confidence intervals were reasonable for FE and curved beam CTRA models (Fig. 6B,C). For example, the mean difference of − 385N for curved beam CTRA model failure load was associated with a preci-sion between − 2127 and 1355 N, implying that 95% of the time, curve beam model would provide an estimate of possible difference failure load in the range presented compared to the gold standard mechanical testing. For failure load predicted by curved CTRA (FCurve), the bias was constant across the magnitude of failure load as judged by non-significant correlation between the average versus the difference (r = 0.09, P = 0.71). FE analysis showed more accurate estimates of failure load than each of the two CTRA models (all P < 0.001, paired t-tests on the differences versus mechanical testing). The limits of agreement in the Bland–Altman plot indicate that the FE estimated failure load on average is nearly the same as mechanical testing (mean difference of − 197 N) and pro-vides estimates that are within the range of − 1631 to 1236 N (Fig. 6C, Table 2). Moreover, the bias throughout the magnitude of possible failure loads is constant as indicated by a non-significant correlation between the average versus the difference (r = 0.38, P = 0.10).
To further study differences in prediction of accuracy between the methods, the paired t-tests and Bland–Altman analysis were repeated for the intact and defect specimens separately (Table 2). Paired t-tests then showed a significant difference between mechanical testing and straight beam CTRA for both intact femurs and femurs with lytic defects. The difference between mechanical testing and FE model for the femurs with lytic defects was
Sample No.
Intact Defect
Mech FEA Curve Straight Mech FEA Curve Straight
1 7852 7416 8533 9318 3002 4149 2856 6163
2 5007 4501 6474 6626 1853 3367 1619 2077
3 5031 5173 5046 10785 2181 2034 2465 7227
4 4728 5197 4192 5587 2806 3541 2201 6462
5 4141 3281 6347 9202 1237 1421 1898 5117
6 4660 4886 4765 8587 3960 4981 5332 10740
7 11034 11477 11047 13861 3980 4976 5419 7134
8 7970 7372 8462 9669 5985 6055 6988 11992
9 6821 7132 7974 13491 6547 7254 6733 11611
10 10470 9029 8852 9827 8815 8787 8594 8899
Failure Load Average (N) 6771 ± 2498 6547 ± 2440 7169 ± 2170 8719 ± 2965 4037 ± 2394 4656 ± 2273 4410 ± 2508 9695 ± 2601
Bland-Altman method, 95% Cl − 1032 to 1482 − 2503 to 1707 − 7541 to 1693 − 1732 to 493 − 1776 to 1028 − 8052 to 641
Mean ± SD of difference vs. mechanical testing 225 ± 641 − 398 ± 1074 − 2924 ± 2356 − 619 ± 568 − 374 ± 715 − 3705 ± 2218
P-value (paired t-test) 0.2965 0.2714 0.0035 0.0072 0.1327 0.0005
Kendall Tau ranking coefficients (mechanical testing vs other methods)
0.82 0.73 0.51 0.91 0.87 0.56
Total
Mech FEA Curve Straight
Failure Load Average (N) 5404 ± 2764 5601 ± 2491 5790 ± 2685 7742 ± 3111
Bland-Altman method (N), 95% Cl − 1631 to 1236 − 2127 to 1355 − 7749 to 1120
Mean ± SD of difference vs. mechanical testing − 197 ± 731 − 385 ± 888 − 3315 ± 2262
P-value (paired t-test) 0.2419 0.067 2.8e-6
Kendall Tau ranking coefficients (mechanical testing vs other methods)
0.83 0.84 0.53
Table 2. Comparison of mechanical testing failure load vs. failure load found from FEA, Curve beam and straight beam model.

www.nature.com/scientificreports/
9Scientific RepoRts | 6:32397 | DOI: 10.1038/srep32397
also significant. In addition, for the curved beam CTRA the limits of agreement varied over the different analyses (total group and both subgroups), but the bias was constant (Table 2). On the other hand, for FE model the limits of agreement were constant for all groups, while the biases were different (Table 2). For the defect femurs, curved beam CTRA showed the smallest bias (− 374 N vs. − 619 N for FE and − 3705 N for straight CTRA), whereas FE showed a higher agreement among predictions (SD 568 N vs. 715 N for curved CTRA and 2218 N for straight CTRA). In addition, correlations between the experiments and the predictions by either FE or curved beam CTRA (all significant at the P = 0.05 level) (Table 2) were found to be high based on the Kendall rank test. This correlation was low for straight beam CTRA for all groups analyzed.
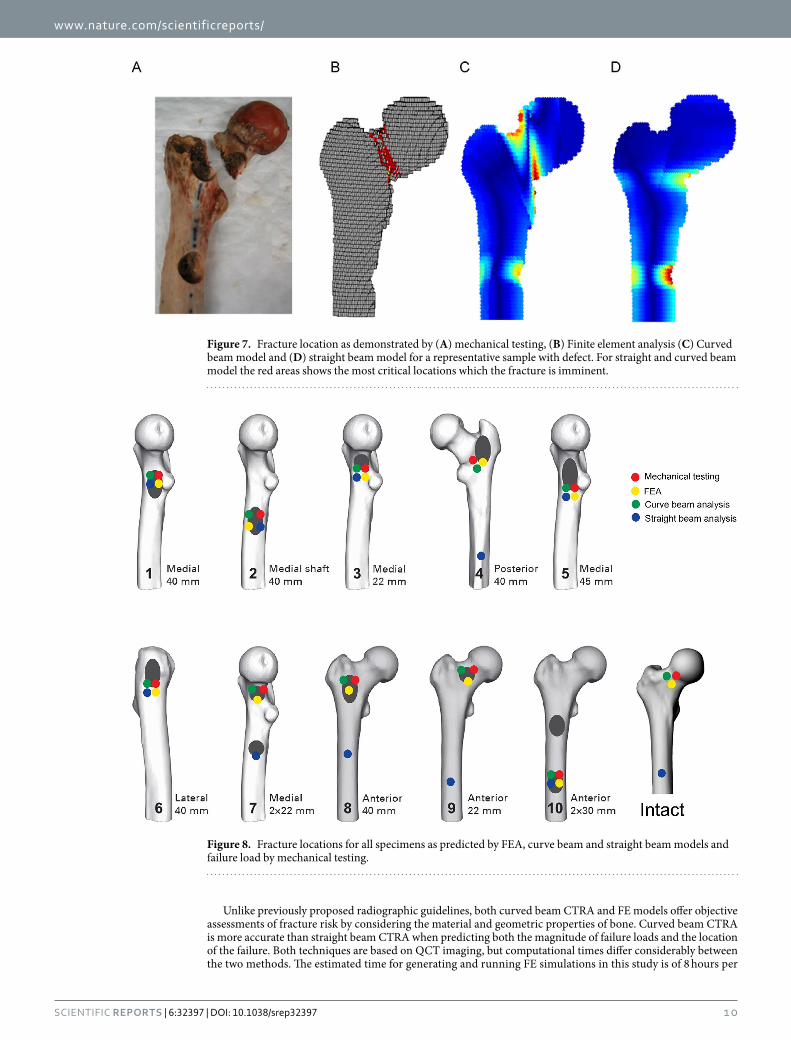
Fracture locations in the experiments were qualitatively compared to the fracture lines predicted by the FE model and failure location predicated by straight and curved beam CTRA models (Fig. 7 provides a graphic presentation of a representative specimen). The results indicated that the fracture locations were always directed through the lesion in the defect specimens. Overall, the fracture locations were reasonably well predicted by both FE and curve beam model as highlighted in Fig. 8. However, straight beam CTRA was inaccurate in four speci-mens with lytic defects and in all of the intact specimens.
DiscussionIn recent years, different diagnostic tools have been developed to address the difficulties to predict fracture risk in patients with metastatic bone lesions. The ideal screening test should consider bone as a structure whose mechanical behavior depends on both material and geometric properties. This study evaluated the accuracy of straight and curved beam CTRA models and FE analysis to predict failure load, which was determined through mechanical testing in paired femurs with and without simulated lytic lesions. We were able to demonstrate that predicted failure loads from curved beam CTRA and FE analysis were highly correlated with the actual failure load obtained through mechanical testing. There were no significant differences in prediction accuracy between the two modeling techniques.
The correlation coefficients between the FE analysis predicted and the experimental failure loads (R2 = 0.91) were similar to those obtained in other FE studies16,21,33,34. Similarly, relatively high correlation coefficients between curved beam CTRA and mechanical testing data were evidenced (R2 = 0.87). However, the correlation between straight beam CTRA and experimental failure load was very poor (R2 = − 0.9) and highly overestimated, since the model was unable to capture the influence of bone curvature in critical cross-sections.
In addition, relatively high correlation coefficients between curved beam CTRA rigidities and mechanical testing data were evidenced (R2 = 0.82 and 0.86 for EA and EI respectively). These results are comparable to those obtained by Hong et al.11, who showed high coefficients of determination when comparing reductions in failure loads versus reductions in axial, bending and torsional rigidity (R2 = 0.84, 0.80 and 0.71, respectively) in samples from whale trabecular bone. Similarly, Whealan et al.8 demonstrated the effectiveness of QCT derived measurements of rigidity for the prospective prediction of yield loads of vertebrae with simulated lytic lesions (rc = 0.74). Finally, by assessing fracture prediction through benign skeletal lesions in children and young adults, Snyder et al.9 indicated that bending and torsional rigidities were each highly significant predictors of fracture occurrence and combined, these measures could predict femoral fractures with 97% accuracy. The current results are improvements to previous models8,9,11 by considering rotation in two directions Δ (dθ)x and Δ (dθ)y and show better correlation with mechanical testing.
As seen from the rigidity results (Fig. 5), the coefficient of determination for GJ is lower than those of EA and EI. The reason for this lower R2 can be interpreted as bone structure tends to bend around the axis with lower EI in unsymmetrical loading. Therefore, Since the GJ has a linear relationship with minimum and maximum bending rigidity (GJ = (EImin + EImax)/(2 + 2ν))12, the presence of GImax in the summation reduces the correlation accuracy for GJ.
In the specimens with a simulated defect, curved beam CTRA seemed to have a higher accuracy (as the bias was lowest), whereas FE analysis showed a higher precision (due to smaller limits of agreement). This could indicate that FE calculations need a correction for bias. In contrast, curved CTRA will provide more accurate estimates of failure load on the group level. However, further studies using larger numbers of specimens are war-ranted to confirm our findings.
Figure 6. Bland–Altman plots for (A) straight beam model (B) curved beam model and (C) Finite element failure load versus mechanical testing failure load.
www.nature.com/scientificreports/
1 0Scientific RepoRts | 6:32397 | DOI: 10.1038/srep32397
Unlike previously proposed radiographic guidelines, both curved beam CTRA and FE models offer objective assessments of fracture risk by considering the material and geometric properties of bone. Curved beam CTRA is more accurate than straight beam CTRA when predicting both the magnitude of failure loads and the location of the failure. Both techniques are based on QCT imaging, but computational times differ considerably between the two methods. The estimated time for generating and running FE simulations in this study is of 8 hours per
Figure 7. Fracture location as demonstrated by (A) mechanical testing, (B) Finite element analysis (C) Curved beam model and (D) straight beam model for a representative sample with defect. For straight and curved beam model the red areas shows the most critical locations which the fracture is imminent.
Figure 8. Fracture locations for all specimens as predicted by FEA, curve beam and straight beam models and failure load by mechanical testing.
www.nature.com/scientificreports/
1 1Scientific RepoRts | 6:32397 | DOI: 10.1038/srep32397
sample, and a sophisticated and relatively complex FE software is required to estimate fracture risk. In contrast, curved beam CTRA takes only approximately 15 minutes to estimate fracture risk.
FE simulations are more appropriate for the implementation of complex loading conditions. The decrease in bone strength resulting from metastatic lesions is local and displays a large degree of variability between patients. As a result, forces that insert on the femur close to the lesion site can be more dangerous than larger forces such as the hip contact force. The modelling of such potentially important anatomical characteristics might be more straightforward using FE analysis.
Limitations of our study are shared with many previous works done in the field using ex-vivo models for the assessment of failure load prediction using non-invasive imaging methods. Evident differences exist between the metastatic lytic lesions that were artificially simulated in this study and those seen in patients in the clinical practice. In our case, regularly shaped defects were limited to cortical lesions, while metastatic bone lesions gen-erally show an irregular pattern and additionally involve trabecular tissue. However, QCT would be readily able to detect these irregularities and incorporate them into both algorithmic analytical processes, although accurately modeling the material properties of blastic metastatic tissue might be challenging. On a group level, curved beam CTRA and FE analysis accurately predict the femoral load capacity, but on the individual level there can be rather large over- and under-estimations of the femoral strength. These subject-specific over- and under-estimations should be improved before either of the methods can be implemented in clinical practice.
In summary, the results of our study showed that non-invasive subject-specific fracture risk assessment tech-niques correlate well with actual failure loads measured in mechanical testing experiments. This suggests that curved beam CTRA could be further developed into a tool that can be used in clinical practice. When ana-lyzing the defect femurs only, the results suggested that predictions by FEA are slightly more accurate on a subject-specific level, yet CTRA analysis can be conducted expediently by non-expert operators.
References1. Michaeli, D., Inoue, K., Hayes, W. & Hipp, J. Density predicts the activity-dependent failure load of proximal femora with defects.
Skeletal radiology 28, 90–95 (1999).2. Coleman, R. E. Clinical features of metastatic bone disease and risk of skeletal morbidity. Clinical Cancer Research 12, 6243s–6249s
(2006).3. Schulman, K. L. & Kohles, J. Economic burden of metastatic bone disease in the US. Cancer 109, 2334–2342 (2007).4. Jawad, M. U. & Scully, S. P. In brief: classifications in brief: Mirels’ classification: metastatic disease in long bones and impending
pathologic fracture. Clinical Orthopaedics and Related Research® 468, 2825–2827 (2010).5. Bickels, J., Dadia, S. & Lidar, Z. Surgical management of metastatic bone disease. The Journal of Bone & Joint Surgery 91, 1503–1516
(2009).6. Houston, S. & Rubens, R. The systemic treatment of bone metastases. Clinical orthopaedics and related research 312, 95–104 (1995).7. Van der Linden, Y. et al. Comparative analysis of risk factors for pathological fracture with femoral metastases results based on a
randomised trial of radiotherapy. Journal of Bone & Joint Surgery, British Volume 86, 566–573 (2004).8. Whealan, K. M., Kwak, S. D., Tedrow, J. R., Inoue, K. & Snyder, B. D. Noninvasive Imaging Predicts Failure Load of the Spine with
Simulated Osteolytic Defects*†. The Journal of Bone & Joint Surgery 82, 1240–1240 (2000).9. Snyder, B. D. et al. Predicting fracture through benign skeletal lesions with quantitative computed tomography. The Journal of Bone
& Joint Surgery 88, 55–70 (2006).10. Nazarian, A. et al. Application of structural rigidity analysis to assess fidelity of healed fractures in rat femurs with critical defects.
Calcified tissue international 86, 397–403 (2010).11. Hong, J., Cabe, G. D., Tedrow, J. R., Hipp, J. A. & Snyder, B. D. Failure of trabecular bone with simulated lytic defects can be predicted
non‐invasively by structural analysis. Journal of Orthopaedic Research 22, 479–486 (2004).12. Entezari, V. et al. Non-invasive assessment of failure torque in rat bones with simulated lytic lesions using computed tomography
based structural rigidity analysis. Journal of biomechanics 44, 552–556 (2011).13. Anez-Bustillos, L. et al. Finite element analysis and CT-based structural rigidity analysis to assess failure load in bones with
simulated lytic defects. Bone 58, 160–167 (2014).14. Rennick, J. A. et al. Finite element analysis and computed tomography based structural rigidity analysis of rat tibia with simulated
lytic defects. Journal of biomechanics 46, 2701–2709 (2013).15. Beck, T. J., Mourtada, F. A., Ruff, C. B., Scott Jr, W. W. & Kao, G. Experimental testing of a DEXA-derived curved beam model of the
proximal femur. Journal of Orthopaedic Research 16, 394 (1998).16. Tanck, E. et al. Pathological fracture prediction in patients with metastatic lesions can be improved with quantitative computed
tomography based computer models. Bone 45, 777–783 (2009).17. Derikx, L. et al. The assessment of the risk of fracture in femora with metastatic lesions Comparing case-specific finite element
analyses with predictions by clinical experts. Journal of Bone & Joint Surgery, British Volume 94, 1135–1142 (2012).18. Binkowski, M. et al. Densitometry test of bone tissue: Validation of computer simulation studies. Computers in biology and medicine
38, 755–764 (2008).19. Oftadeh, R. et al. Hierarchical analysis and multi-scale modelling of rat cortical and trabecular bone. Journal of The Royal Society
Interface 12, 20150070 (2015).20. Banijamali, S. M. A. et al. Effects of Different Loading Patterns on the Trabecular Bone Morphology of the Proximal Femur Using
Adaptive Bone Remodeling. Journal of biomechanical engineering 137, 011011 (2015).21. Keyak, J. H., Kaneko, T. S., Tehranzadeh, J. & Skinner, H. B. Predicting proximal femoral strength using structural engineering
models. Clinical orthopaedics and related research 437, 219–228 (2005).22. Rice, J., Cowin, S. & Bowman, J. On the dependence of the elasticity and strength of cancellous bone on apparent density. Journal of
biomechanics 21, 155–168 (1988).23. Oftadeh, R., Perez-Viloria, M., Villa-Camacho, J. C., Vaziri, A. & Nazarian, A. Biomechanics and mechanobiology of trabecular
bone: a review. Journal of biomechanical engineering 137, 010802 (2015).24. Snyder, S. M. & Schneider, E. Estimation of mechanical properties of cortical bone by computed tomography. Journal of Orthopaedic
Research 9, 422–431 (1991).25. Boresi, A. P., Schmidt, R. J. & Sidebottom, O. M. Advanced mechanics of materials. Vol. 6 (Wiley, New York, 1993).26. Cook, R. D. & Young, W. C. Advanced mechanics of materials. Vol. 2 (Prentice Hall Upper Saddle River, NJ, 1999).27. Mourtada, F. A., Beck, T. J., Hauser, D. L., Ruff, C. B. & Bao, G. Curved beam model of the proximal femur for estimating stress using
dual‐energy x‐ray absorptiometry derived structural geometry. Journal of Orthopaedic Research 14, 483–492 (1996).28. Keaveny, T. M., Wachtel, E. F., Ford, C. M. & Hayes, W. C. Differences between the tensile and compressive strengths of bovine tibial
trabecular bone depend on modulus. Journal of biomechanics 27, 1137–1146 (1994).

www.nature.com/scientificreports/
1 2Scientific RepoRts | 6:32397 | DOI: 10.1038/srep32397
29. Pistoia, W. et al. Estimation of distal radius failure load with micro-finite element analysis models based on three-dimensional peripheral quantitative computed tomography images. Bone 30, 842–848 (2002).
30. Snyder, B. D. et al. Noninvasive prediction of fracture risk in patients with metastatic cancer to the spine. Clinical Cancer Research 15, 7676–7683 (2009).
31. Bland, J. M. & Altman, D. Statistical methods for assessing agreement between two methods of clinical measurement. The lancet 327, 307–310 (1986).
32. Myles, P. & Cui, J. I. Using the Bland–Altman method to measure agreement with repeated measures. British journal of anaesthesia 99, 309–311 (2007).
33. Bessho, M. et al. Prediction of the strength and fracture location of the femoral neck by CT-based finite-element method: a preliminary study on patients with hip fracture. Journal of Orthopaedic science 9, 545–550 (2004).
34. Dragomir-Daescu, D. et al. Robust QCT/FEA models of proximal femur stiffness and fracture load during a sideways fall on the hip. Annals of biomedical engineering 39, 742–755 (2011).
AcknowledgementsThis work was supported in part by Beth Israel Deaconess Medical Center Department of Orthopaedic Surgery, the NIH LRP (L30 AR056606) (A.N.), and in part by a NPRP award (NPRP 5-086-2- 031) from the Qatar National Research Fund (a member of the Qatar Foundation) (R.O., R.G. and A.V).
Author ContributionsR.O. wrote the manuscript, developed the theory and conducted finite element analysis and developed the rigidity analysis framework. Z.K. developed the theory, conducted the finite element analysis. J.V.-C. developed the rigidity analysis framework. E.T. and N.V. conducted the experiments. R.G. developed the theory. B.D.S. developed the rigidity analysis framework and H.N.H. developed the theory. A.N. developed the theory, developed the rigidity analysis framework. A.V. conducted the finite element analysis. All Authors are contributed to reading and revision of the manuscript.
Additional InformationCompeting financial interests: The authors declare no competing financial interests.How to cite this article: Oftadeh, R. et al. Curved Beam Computed Tomography based Structural Rigidity Analysis of Bones with Simulated Lytic Defect: A Comparative Study with Finite Element Analysis. Sci. Rep. 6, 32397; doi: 10.1038/srep32397 (2016).
This work is licensed under a Creative Commons Attribution 4.0 International License. The images or other third party material in this article are included in the article’s Creative Commons license,
unless indicated otherwise in the credit line; if the material is not included under the Creative Commons license, users will need to obtain permission from the license holder to reproduce the material. To view a copy of this license, visit http://creativecommons.org/licenses/by/4.0/ © The Author(s) 2016