CURRENT TRENDS: COMPENSATION, INCENTIVES & BENEFITS · The current threshold a worker must hit to...
39
2015 – 2016 CURRENT TRENDS: 2015 2016 COMPENSATION, INCENTIVES & BENEFITS Presented By: Presented By: Harrington & Associates, Inc. Rewards Consulting Since 1986
Transcript of CURRENT TRENDS: COMPENSATION, INCENTIVES & BENEFITS · The current threshold a worker must hit to...

2015 – 2016
CURRENT TRENDS:
2015 2016
CURRENT TRENDS: COMPENSATION, INCENTIVES & BENEFITS
Presented By:Presented By:Harrington & Associates, Inc.
Rewards Consulting Since 1986

PROGRAM OVERVIEW
• Where We’ve Been & Where We’re Goingg• Major Issues In Compensation In 2016 • The More Things Change, The More They Stay The Same
• Survey Statistics • Base Salary Increase Budgets• Salary Structure Adjustments• Salary Structure Adjustments• Variable Pay

2015 – 2016 WHERE WE’VE BEEN & WHERE WE’RE GOINGN
• Low Inflation• Low Unemployment• High Job Growth
Factors that create upward pressure on wages.
Not this time!
We will explore why…

TRUSTED PREDICTORS???
Low InflationLow Unemployment
Hi h J b G hHigh Job GrowthMinimum Wage Changesg g

CONSUMER PRICE INDEX (CPI)
• In 2015 the CPI (12 months ending 12/15) was up only
( )
In 2015 the CPI (12 months ending 12/15) was up only 0.7%
• The index for all items less food and energy dropped to The index for all items less food and energy dropped to minus 0.1% December 2015
• Lower energy prices offset higher food prices to stabilize Lower energy prices offset higher food prices to stabilize the CPI over the last year.
• Lower energy costs are a significant factor in keeping gy g p ginflation in check.

2015: UNEMPLOYMENT LOWEST SINCE 20072015: UNEMPLOYMENT LOWEST SINCE 2007• Unemployment currently at 5.0%
• 12 month average unemployment rate between January 2014 and December 2015 • 12 month average unemployment rate between January 2014 and December 2015 was 5.3%,
• Unemployment rate remained steady at 5.0% for the last quarter of 2015

2015 vs 2016 JOB GROWTH
• 2015 US Job Growth 5.1% (12 months 10/14 – 9/15)2015 US Job Growth 5.1% (12 months 10/14 9/15)
• 15 states are expected to enjoy job growth • 15 states are expected to enjoy job growth from 2.1 to 4.0% in 2016
• The National Average is 1.8%

MINIMUM WAGE
National: 9 states increased their minimum wage in 2015 through automatic adjustments, while 11 states raised their minimums through j glegislative or ballot changes.
National: 5 states currently have no minimum wage laws.
Higher than National: 29 states and DC currently have minimum wage rates above the Federal minimum of $7.25 per hour.
Lower than National: 2 states with minimum wage rates below the Lower than National: 2 states with minimum wage rates below the Federal minimum of $7.25 per hour.
Often changes are “indexed” or have “follow-on” plans to continue adjusting minimum wage over a period of yearsminimum wage over a period of years.

PREDICTED FLSA CHANGES TO OVERTIME EXEMPTIONN
• The minimum salary threshold will rise … significantly. The current threshold a worker must hit to be overtime-exempt is $23 660 The threshold a worker must hit to be overtime-exempt is $23,660. The proposed rules seek an increase to $50,440. And while it may not climb quite that high, it will climb — likely to at least $40,000 or so.
• The threshold will automatically increase. For the first time ever, the ysalary threshold will be tied to an automatic-escalator, so it can keep pace with inflation — and so major legislative changes aren’t needed every time lawmakers want it to increase.
• The DOL is looking at making changes to the duties tests The DOL • The DOL is looking at making changes to the duties tests. The DOL hasn’t suggested changing the executive, administrative, professional, computer or outside sales duties tests yet. But the agency did specifically ask for comments on whether the tests should be changed and whether they’re working to screen out employees who are not bona fide white they re working to screen out employees who are not bona fide white collar exempt employees.

2015 FINANCIAL MARKET GROWTHN N
Period Annualized Growth Rates
From To DJIA S&P500 NASDAQJanuary 2, 2015 January 4, 2016 -2.23% -2.01% 3.72%January 4, 2016 January 28, 2016 -7.78% -5.93% -8.08%
• Not just the US• Most countries report marginal or no growth in the size of planned
increasesA f t i di ti d li i l th l• A few countries are predicting declines in salary growth plans
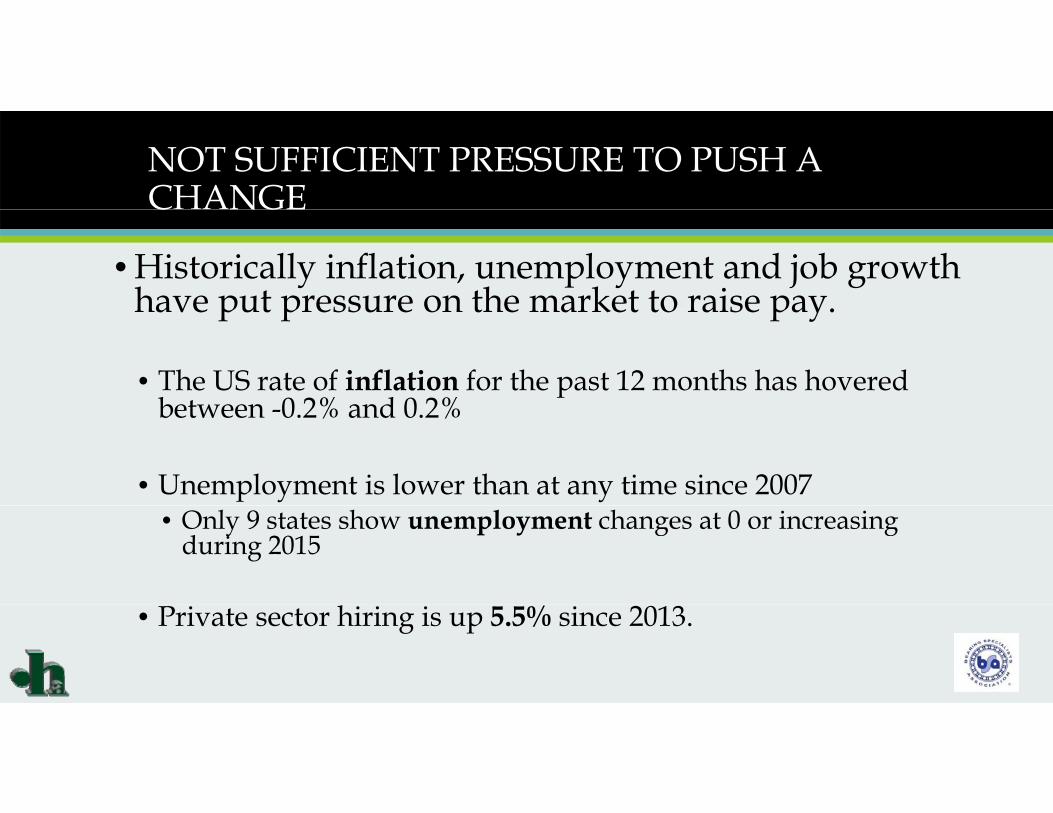
NOT SUFFICIENT PRESSURE TO PUSH A CHANGE
• Historically inflation, unemployment and job growth have put pressure on the market to raise pay
C NGE
have put pressure on the market to raise pay.
• The US rate of inflation for the past 12 months has hovered between 0 2% and 0 2%between -0.2% and 0.2%
• Unemployment is lower than at any time since 2007• Only 9 states show unemployment changes at 0 or increasing
during 2015
• Private sector hiring is up 5.5% since 2013.

WHY ARE THE KEY INDICATORS NOT TELLING THE EXPECTED STORY.
• Mismatch of skill sets• The jobs people are prepared to do are not the jobs
being created• We sent industrial and technical jobs abroad• Salary budgets lag the market a bitSalary budgets lag the market a bit• Pay growth is stagnant since 2011
Eff f H l h C C• Effects of Health-Care Costs

WHERE WE’VE BEEN WHERE WE’RE BEEN…WHERE WE RE GOING

WHERE WE’VE BEEN; WHERE WE’RE GOINGSALARY STRUCTURE ADJUSTMENTS
Between 2000 and 2009 salary structure adjustments averaged 2.4% each year.
SALARY STRUCTURE ADJUSTMENTS
2011 1.5% Average Structure Adjustment
SALARY STRUCTURE ADJUSTMENTS
2011 1.5% Average Structure Adjustment
2012 1.8% Average Structure Adjustment
2013 1.9% Average Structure Adjustment
2014 1.9% Average Structure Adjustment
2012 1.7% Average Structure Adjustment
2013 1.9% Average Structure Adjustment
2014 1.9% Average Structure Adjustmentg j
2015* 2.1% Average Structure Adjustment
2014 1.9% Average Structure Adjustment
2015 2.0% Average Structure Adjustment
2016* 2.1% Average Structure Adjustment
* Projected
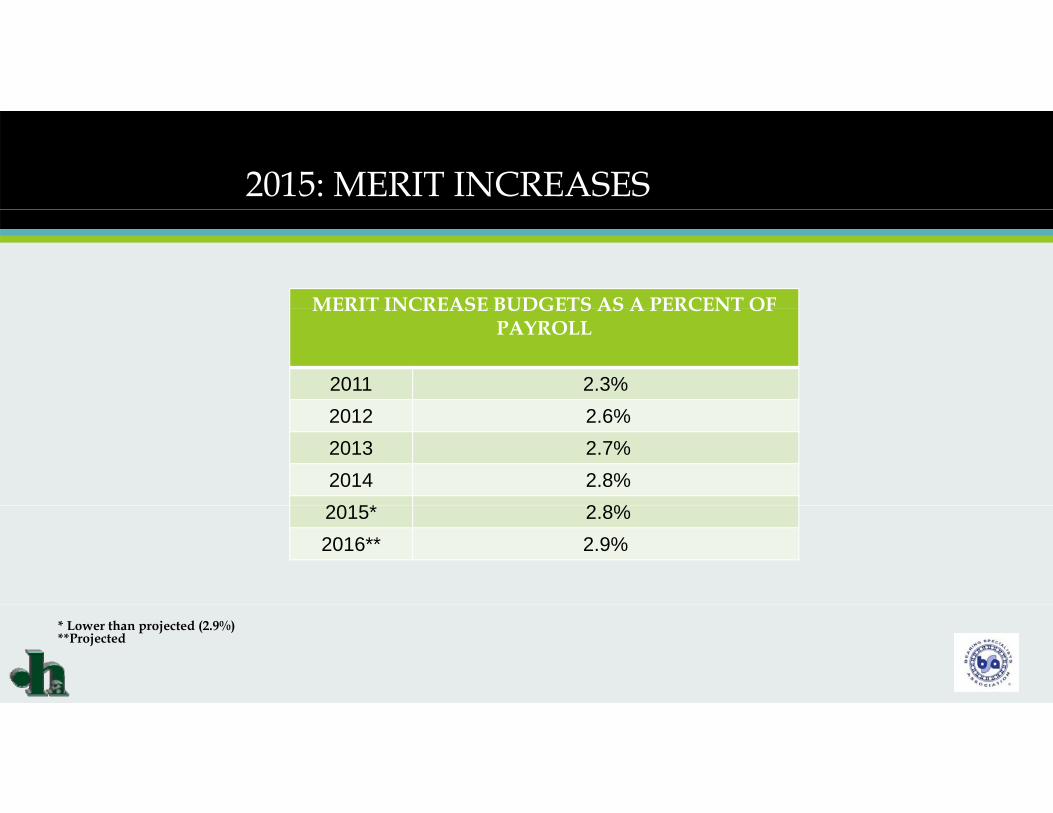
2015: MERIT INCREASES
MERIT INCREASE BUDGETS AS A PERCENT OF MERIT INCREASE BUDGETS AS A PERCENT OF PAYROLL
2011 2.3%2012 2.6%2013 2.7%2014 2.8%2015* 2 8%2015* 2.8%2016** 2.9%
* Lower than projected (2.9%)**Projected

2015: MERIT INCREASES
Employers continue to focus on pay-for-performance
TRENDS IN MERIT INCREASES LEVELS
Year
Average Percentage Increase Given Top Performers
Average PercentageIncrease Given Middle
Performers
Percentage Difference Between Increases Given
Top Performers vs. Middle Performers
2012 3.9% 2.7% 50%2013 4.0% 2.7% 48%2014 4.0% 2.7% 48%2015* 4.1% 2.8% 46%
Lowest performers consistently get an average of 0.6% though the median is 0%*Estimated

2015: PROMOTIONAL INCREASES
• Of companies that do not budget for promotional increases:for promotional increases:
• 66% pay for promotional increases ith i f i d
46%54%
with savings from vacancies and other payroll savings
Promotional increase budgetedPromotional increase not budgeted
• 24% pay from merit budgetPromotional increase not budgeted

VARIABLE PAY
• Organizational success continues to be the largest component of measures for variable pay plansof measures for variable pay plans
• Employers are not shifting from their continued belief in the value of variable pay with 83% reporting they use it. (Down slightly from 84% in 2014)
• A strong commitment remains to pay for performance with the usage of variable pay plan being used by an average of the usage of variable pay plan being used by an average of 80% of employers since 2006.
• Employers are paying more attention to retention as the p y p y geconomy improves.

SURVEY STATISTICS

BUDGET INCREASES

SALARY BUDGET INCREASES BY INDUSTRY -NATIONALN N
MAJOR INDUSTRY GROUPING (M )2014
A l 2015 P j d2015
A l 2016 P j dMAJOR INDUSTRY GROUPING (Mean) Actual 2015 Projected Actual 2016 Projected
Finance & Insurance 3.0% 3.1% 3.2% 3.2%
Manufacturing 2.9% 3.1% 3.0% 3.1%
Public Admin 2.7% 2.5% 2.7% 2.7%
Retail 2.9% 3.1% 3.0% 3.0%
Other Service 3.2% 3.1% 3.2% 3.2%
Transportation 3.2% 3.2% 2.9% 3.0%
Utilities 3 1% 3 1% 3 0% 3 0%Utilities 3.1% 3.1% 3.0% 3.0%
Wholesale 2.8% 3.2% 2.8% 3.0%
Health Care & Social Assist 2.5% 2.7% 2.7% 2.9%
Construction 3.7% 3.5% 2.9% 3.0%
Accommodation & Food Service 3.0% 2.9% 3.3% 3.4%

SALARY BUDGET INCREASES BY EMPLOYMENT SIZE - NATIONALN N N
BY ORGANIZATION SIZE (Mean) 2014 Actual 2015 Projected 2015 Actual 2016 Projected
1 - 499 Employees 3.2% 3.3% 3.3% 3.3%
500 - 2,499 Employees 3.1% 3.1% 3.1% 3.2%
2 500 - 9 999 Employees 2 9% 3 0% 2 9% 3 0%2,500 - 9,999 Employees 2.9% 3.0% 2.9% 3.0%
10,000 - 19,999 Employees 2.9% 3.0% 2.8% 3.0%
20,000+ Employees 2.7% 2.8% 2.9% 3.0%

SALARY BUDGET INCREASE BY REVENUE -NATIONALN N
BY REVENUE 2014 Actual 2015 Projected 2015 Actual 2016 ProjectedBY REVENUE 2014 Actual 2015 Projected 2015 Actual 2016 Projected
Up to $30 Mill 3.1% 3.2% 3.2% 3.4%
More than $30 Mill to $100 Mill 3.1% 3.2% 3.2% 3.3%
More than $100 Mill to $300 Mill 2 9% 3 0% 3 0% 3 1%More than $100 Mill to $300 Mill 2.9% 3.0% 3.0% 3.1%
More than $300 Mill to $600 Mill 3.1% 3.2% 3.1% 3.2%
More than $600 Mill to $1 Billion 3.0% 3.0% 3.0% 3.0%
More than $1 Billion to $3 Billion 3 0% 3 1% 2 9% 3 0%More than $1 Billion to $3 Billion 3.0% 3.1% 2.9% 3.0%
More than $3 Billion to $5 Billion 2.9% 3.0% 2.8% 2.9%
More than $5 Billion to $8 Billion 2.8% 3.0% 2.9% 3.0%
More than $8 Billion to $10 Billion 2 8% 3 0% 3 2% 3 3%More than $8 Billion to $10 Billion 2.8% 3.0% 3.2% 3.3%
More than $10 Billion 3.0% 3.0% 3.0% 3.0%

PERCENT OF EMPLOYEES RECEIVING INCREASES IN 2015IN 2015
PERCENTAGE OF EMPLOYEES RECEIVING A BASE SALARY INCREASE BY EMPLOYEE CATEGORY
90.0%
91.0%
92.0%PMMS OCT SMP OFFICERS / EXECUTIVES
86 0%
87.0%
88.0%
89.0%
OF
EMPL
OYE
ES
83.0%
84.0%
85.0%
86.0%
PER
CEN
TAG
E
82.0%2010 2011 2012 2013 2014 2015
YEAR
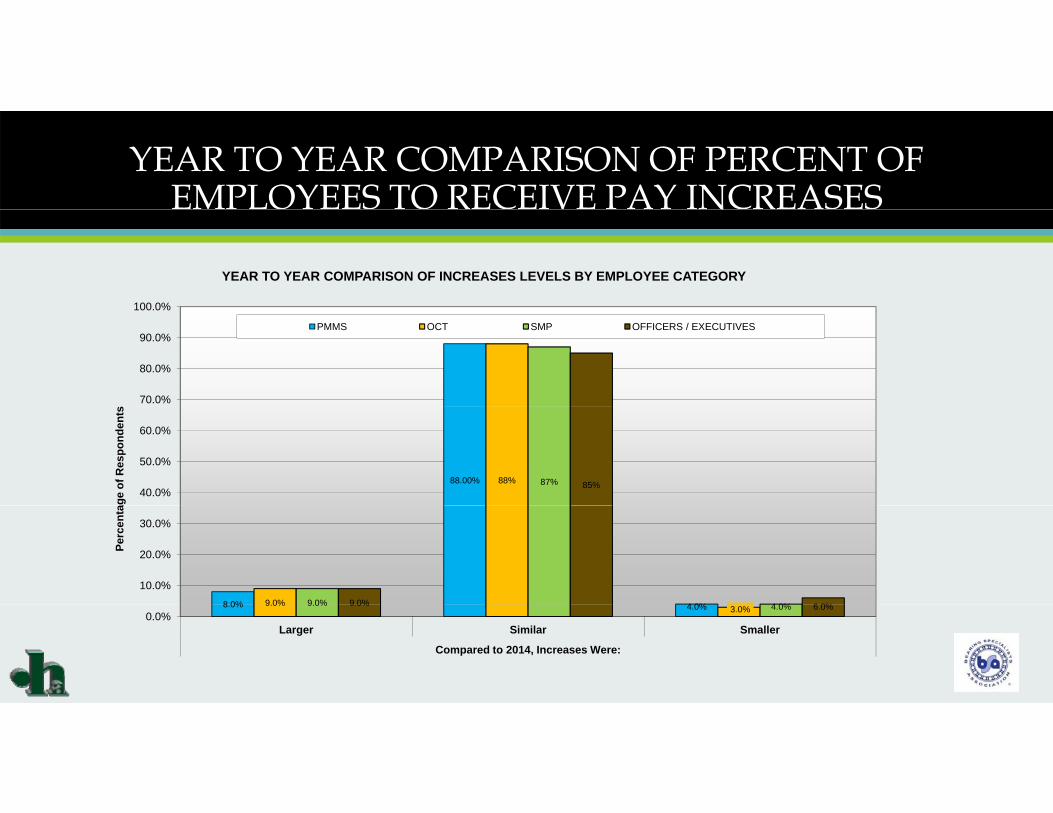
YEAR TO YEAR COMPARISON OF PERCENT OF EMPLOYEES TO RECEIVE PAY INCREASES N
100 0%
YEAR TO YEAR COMPARISON OF INCREASES LEVELS BY EMPLOYEE CATEGORY
70.0%
80.0%
90.0%
100.0%
s
PMMS OCT SMP OFFICERS / EXECUTIVES
88.00% 88% 87% 85%40.0%
50.0%
60.0%
age
of R
espo
nden
ts
8 0% 4 0%9 0% 9 0% 4 0%9 0% 6 0%
10.0%
20.0%
30.0%
Perc
enta
8.0% 4.0%9.0%3.0%
9.0% 4.0%9.0% 6.0%0.0%
Larger Similar Smaller
Compared to 2014, Increases Were:

YEAR TO YEAR COMPARISON OF PERCENTAGE OF EMPLOYEES BY PERFORMANCE RATING
4.5%
YEAR TO YEAR COMPARISON OF PERCENTAGE OF INCREASE GRANTED BY PERFORMANCE LEVEL
4.0% 4.1%3 0%
3.5%
4.0%
s
2014 Average Merit Increase Awarded by Performance Category
2015 Average Merit Increase Awarded by Performance Category
2.7% 2.8%2.0%
2.5%
3.0%
age
of R
espo
nden
ts
0.6% 0.6%0.5%
1.0%
1.5%
Perc
enta
0.0%High Middle Low
Percent of Increase Granted by Performance Category

RANGE STRUCTURE ADJUSTMENTS

15 YEAR PERSPECTIVE!SALARY & STRUCTURE INCREASES
National PMMS National OCT National SMPNational Officers / Executives National PMMS National OCT
SALARY BUDGETS VS. SALARY STRUCTURES
2015 Budget Actual 2.9% to 3.0%
10.0%
12.0%
National Officers / Executives National PMMS National OCTNational SMP National Officers / Executives Unemployment Trend
2015 Salary Structure Adj.1.8% to 2.0%
2016 Budget Projected3.0% to 3.1%
l d
6.0%
8.0%
RC
ENTA
GE
SALARY BUDGET TRENDS
UNEMPLOYMENT TREND
2016 Salary Structure Adj. Proposed
2.1%
2.0%
4.0%PER
SALARY STRUCTURE TRENDSCPI TREND
-2.0%
0.0%2003 2004 2005 2006 2007 2008 2009 2010 2011 2012 2013 2014 2015 2016
PROJECTEDYEAR
CPI TREND

VARIABLE PAY


AVERAGE PERCENT OF PAY BUDGETED FOR VARIABLE PAY IN 2014-2016
OFFICERS &2014 PMMS OCT EXEMPT EXECUTIVESAverage percent budgeted 5.3% 6.1% 12.6% 38.2%Average percent paid 5.1% 5.8% 12.9% 39.2%
2015Average percent budgeted 5.3% 6.0% 12.6% 38.3%
Projected percent paid 5.1% 6.0% 13.0% 38.6%
2016
Projected percent budgeted 5.4% 6.1% 12.7% 38.1%

REMINDER! MAKING VARIABLE PAY WORK FOR YOUMAKING VARIABLE PAY WORK FOR YOU• Create meaningful and measureable goals that are aligned with
business strategy business strategy
• Variable pay plans are most successful when devised to respond to the level of the positions eligible and to spread across the major
i i i f h i i ’ h b i priorities of the organization’s short-term business strategy
• Ensure clear and effective communication with employees
• Decide how results will be measured and be specific
• Ensure employees understand the expectations and measures
• Communicate performance results throughout the year

BENEFITS BRIEF(LY)

New Pending LegislationN g g
• The American Savings Act, introduced by Sen. Jeff Merkley (D-Ore.), would give every worker without access to a retirement savings plan through their employer the ability to save for retirement through their own, personal retirement savings account ( ll d h A i S i A ) i h i (called the American Savings Account) — with investments modeled on the TSP (Federal Government’s Thrift Savings Plan).
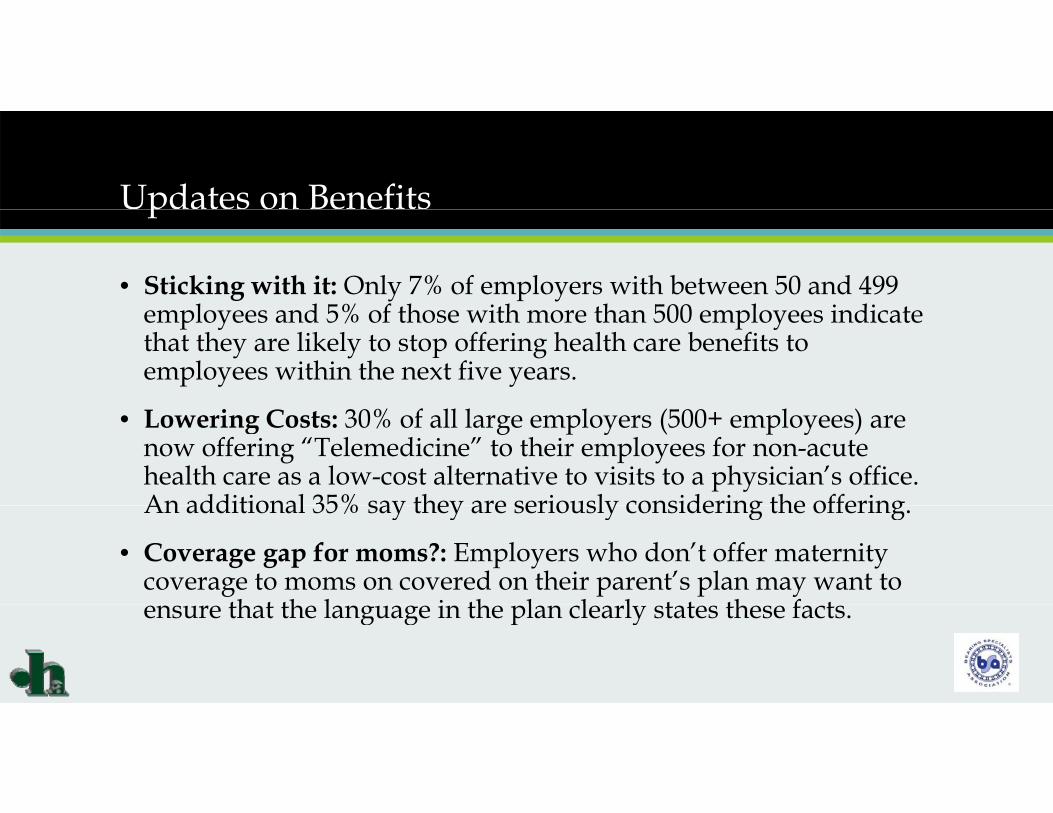
Updates on Benefitsp
• Sticking with it: Only 7% of employers with between 50 and 499 l d 5% f th ith th 500 l i di t employees and 5% of those with more than 500 employees indicate
that they are likely to stop offering health care benefits to employees within the next five years.
• Lowering Costs: 30% of all large employers (500+ employees) are now offering “Telemedicine” to their employees for non-acute health care as a low-cost alternative to visits to a physician’s office. An additional 35% say they are seriously considering the offeringAn additional 35% say they are seriously considering the offering.
• Coverage gap for moms?: Employers who don’t offer maternity coverage to moms on covered on their parent’s plan may want to
th t th l i th l l l t t th f tensure that the language in the plan clearly states these facts.

Updates on Benfitsp
• Critical Illness Coverage: A benefit now being offered to employees by about 45% f l l h h l d b k th i t diti l h lth i 45% of large employers who have scaled back their traditional health insurance offerings, as a companion feature to high-deductible plans that are fast increasing enrollment.
G d C fi ti S C 11% f l l • Gender Confirmation Surgery Coverage: 11% of large employers are now offering this coverage as they increasingly respond to workplace diversity, according to Mercer.
ACA R ti Th ACA’ i d dli d l d f ti • ACA Reporting: The ACA’s upcoming deadlines are now delayed for reporting minimum essential coverage and employer shared responsibility; the new due dates give employers nearly two extra months -- until March 31 -- to distribute information statements to individuals and three extra months -- until June 30 for many employers -- to submit transmittals to IRS with related data.
Hot Off The Presses!!!!
• Proposed regulations are going to be issued by the EEOC on today that will expand the EEO-1 report to include wage data for employees so that the Office of Federal Contract Compliance Programs (OFCCP) can monitor for pay discrepancies under the E l P AEqual Pay Act.
• This may be the time to ensure that your “house is in order” with respect to how you compensate employees.

This Place Drives Me Nuts!N
• Stress Reduction Programs• 78% of employers responding said stress is an issue among employees
• Employers seek long-term solutions rather than quick fix
• Augmenting wellness programs and EAP programs with resilience building Augmenting wellness programs and EAP programs with resilience building and mindfulness training programs• Determine the root cause of stress• Alter the way they view stressorsy y
• 22% of employers offering stress reduction programs
• 28% planning to implement new programs
• Computer based diagnostic and individualized solutions offering • Computer based diagnostic and individualized solutions offering

WE’RE HERE WHEN YOU NEED US…
Thank youThank you