Current Techniques and Challenges in the Design of Vacuum ... · Current Techniques and Challenges...
57
Current Techniques and Challenges Current Techniques and Challenges Current Techniques and Challenges Current Techniques and Challenges in the Design of Vacuum Pumps in the Design of Vacuum Pumps in the Design of Vacuum Pumps in the Design of Vacuum Pumps Leinsweiler Leinsweiler Leinsweiler Leinsweiler, 2011 , 2011 , 2011 , 2011- - -05 05 05 05- - -17 17 17 17 Magnus Magnus Magnus Magnus Janicki Janicki Janicki Janicki Oerlikon Leybold Vacuum, Cologne Oerlikon Leybold Vacuum, Cologne Oerlikon Leybold Vacuum, Cologne Oerlikon Leybold Vacuum, Cologne
Transcript of Current Techniques and Challenges in the Design of Vacuum ... · Current Techniques and Challenges...
Current Techniques and ChallengesCurrent Techniques and ChallengesCurrent Techniques and ChallengesCurrent Techniques and Challengesin the Design of Vacuum Pumpsin the Design of Vacuum Pumpsin the Design of Vacuum Pumpsin the Design of Vacuum Pumps
LeinsweilerLeinsweilerLeinsweilerLeinsweiler, 2011, 2011, 2011, 2011----05050505----17171717
Magnus Magnus Magnus Magnus JanickiJanickiJanickiJanicki
Oerlikon Leybold Vacuum, CologneOerlikon Leybold Vacuum, CologneOerlikon Leybold Vacuum, CologneOerlikon Leybold Vacuum, Cologne
64th IUVSTA Workshop 2Leinsweiler, 17.05.2011
Agenda
Introduction
Screw Vacuum Pumps
� Functional principle
� Design Problems
� Simulation with a Cell Model
� Challenges
Turbo Molecular Pump
� Function
� Design Problems
� Solutions via Simulation
� Monte Carlo Test Particle Method
� Laminar Flow Calculation
(Hagen-Poiseuille)
� 3D Monte Carlo Test Particle for stationary parts
� Challenges
64th IUVSTA Workshop 3Leinsweiler, 17.05.2011
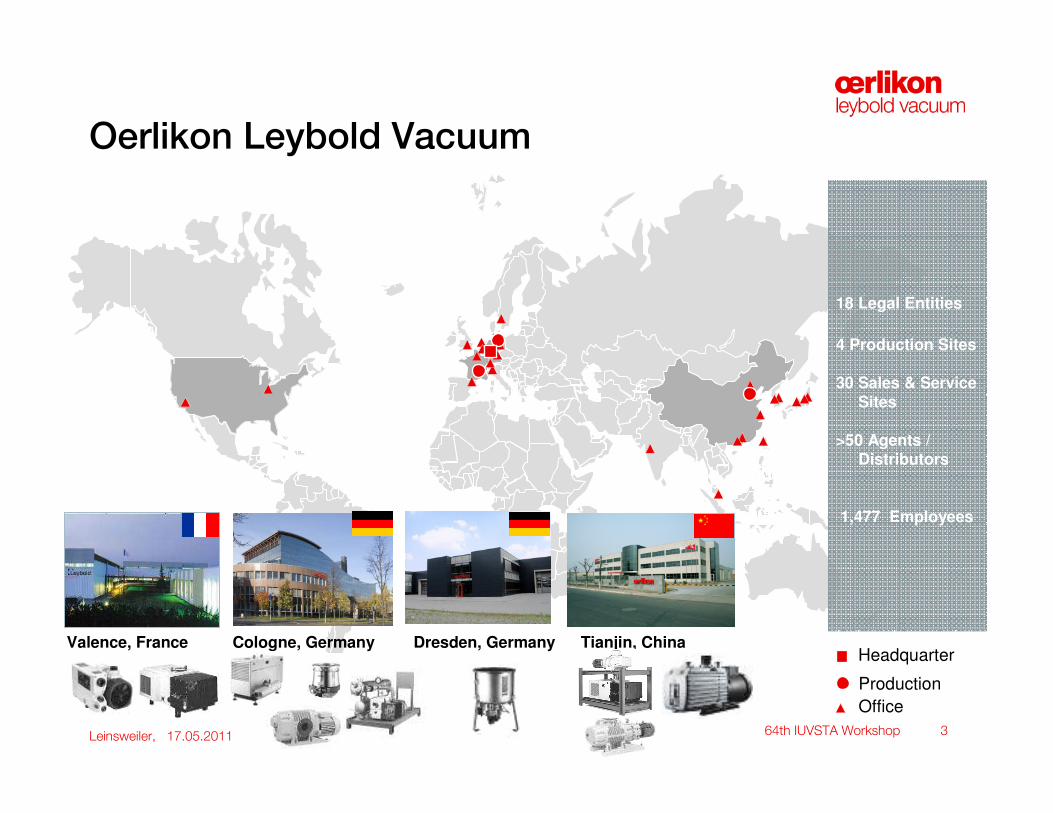
Headquarter
Production
Dresden, GermanyValence, France Cologne, Germany Tianjin, China
Office
18 Legal Entities
4 Production Sites
30 Sales & Service Sites
>50 Agents / Distributors
1,477 Employees
Oerlikon Leybold Vacuum

64th IUVSTA Workshop 4Leinsweiler, 17.05.2011
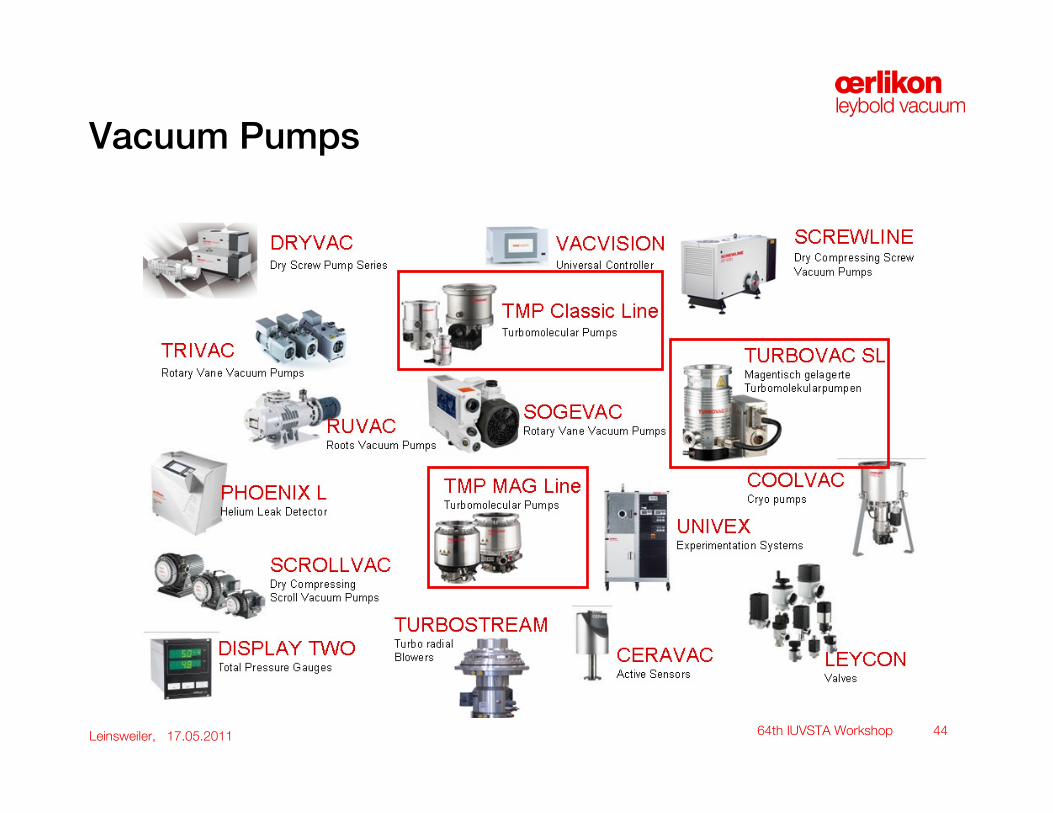
Vacuum Pumps

64th IUVSTA Workshop 5Leinsweiler, 17.05.2011
Screw Vacuum Pump
Screw vacuum pumps are used since the 80s
� Fore vacuum pump � compressing against
atmosphere
� High pumping capacity
� Inlet pressure from 10-3 mbar to 1000 mbar
� Two rotating screw without contact
� Dry pump � no contamination of gas or oil
� High energy efficiency due to inner
compression ratio
64th IUVSTA Workshop 6Leinsweiler, 17.05.2011
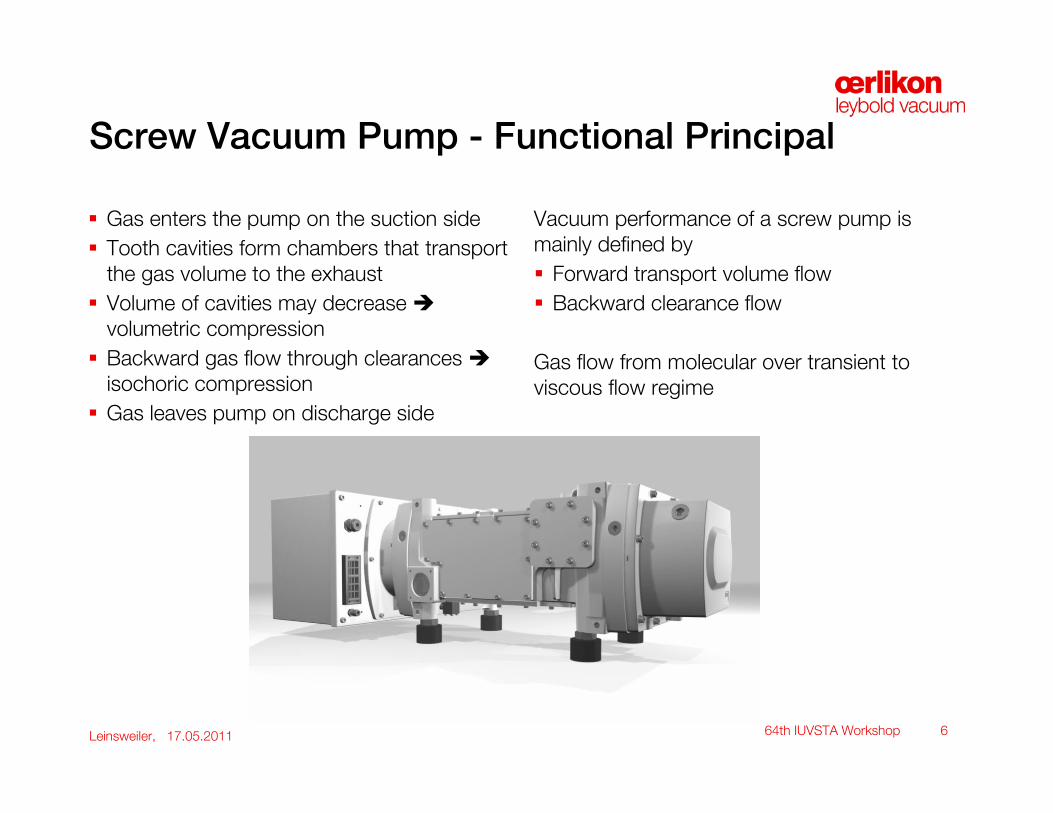
Screw Vacuum Pump - Functional Principal
� Gas enters the pump on the suction side
� Tooth cavities form chambers that transport
the gas volume to the exhaust
� Volume of cavities may decrease �
volumetric compression
� Backward gas flow through clearances �
isochoric compression
� Gas leaves pump on discharge side
Vacuum performance of a screw pump is
mainly defined by
� Forward transport volume flow
� Backward clearance flow
Gas flow from molecular over transient to
viscous flow regime
64th IUVSTA Workshop 7Leinsweiler, 17.05.2011
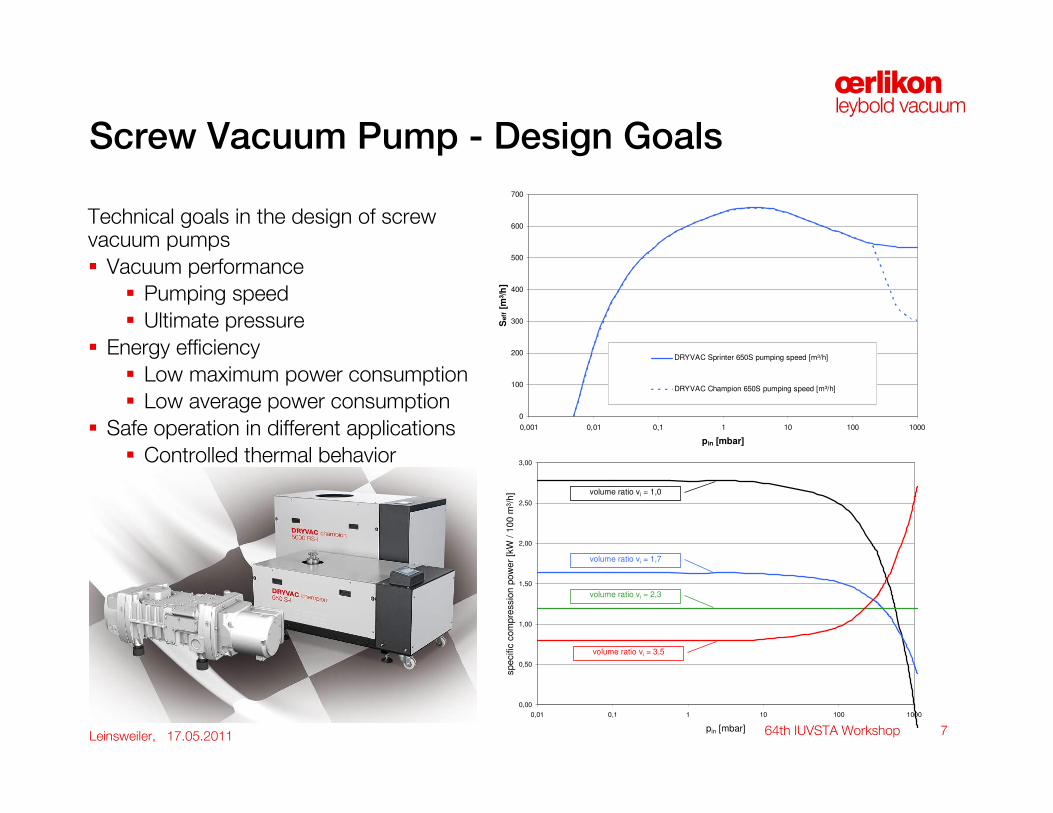
Screw Vacuum Pump - Design Goals
Technical goals in the design of screw vacuum pumps
� Vacuum performance
� Pumping speed
� Ultimate pressure
� Energy efficiency
� Low maximum power consumption
� Low average power consumption
� Safe operation in different applications
� Controlled thermal behavior
0,00
0,50
1,00
1,50
2,00
2,50
3,00
0,01 0,1 1 10 100 1000
pin [mbar]
spe
cific
com
pre
ssio
n p
ow
er
[kW
/ 1
00
m³/
h]
volume ratio vi = 1,7
volume ratio vi = 2,3
volume ratio vi = 3,5
volume ratio vi = 1,0
0
100
200
300
400
500
600
700
0,001 0,01 0,1 1 10 100 1000
pin [mbar]
Seff
[m
³/h
]
DRYVAC Sprinter 650S pumping speed [m³/h]
DRYVAC Champion 650S pumping speed [m³/h]

64th IUVSTA Workshop 8Leinsweiler, 17.05.2011
Cell Model for screw pumps
Simulation of the thermodynamic process of displacement machines with many cells
Approach:
trapped volumes are cells with homogenous gas conditions regarding
pressure
temperature
mixture
clearances are connections between cells
calculation of mass flow by time step model
transport
leakage through clearances
64th IUVSTA Workshop 9Leinsweiler, 17.05.2011
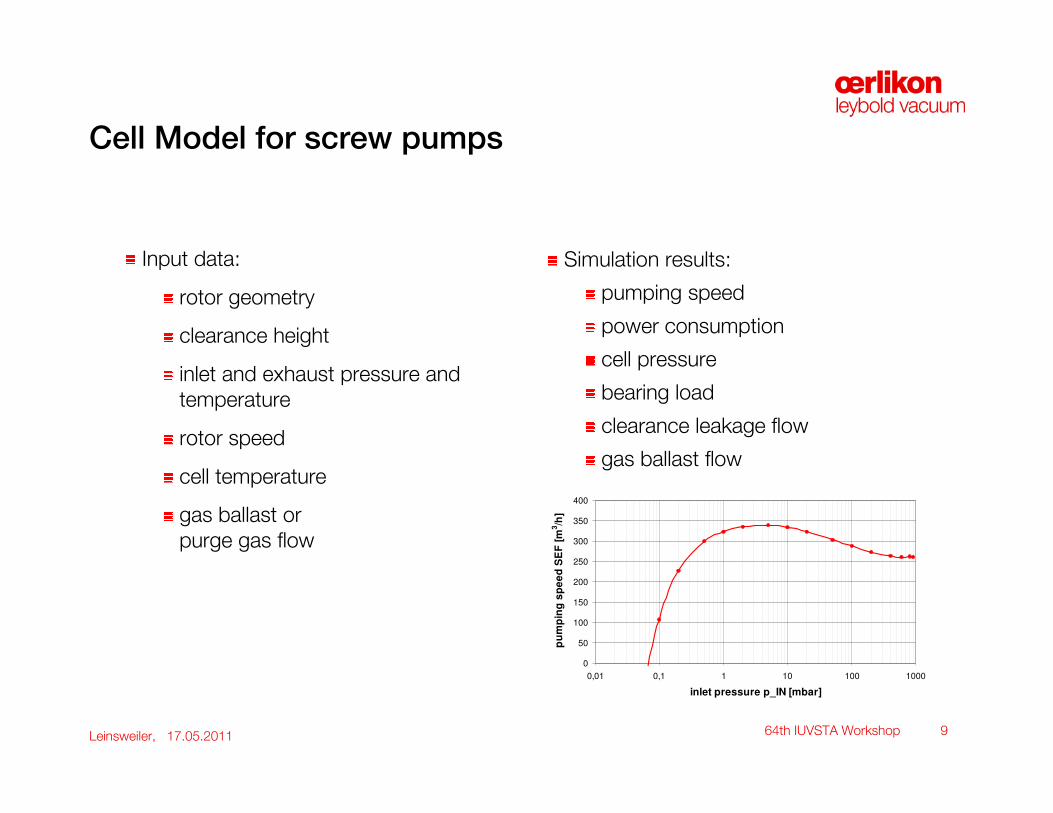
Cell Model for screw pumps
Input data:
rotor geometry
clearance height
inlet and exhaust pressure and
temperature
rotor speed
cell temperature
gas ballast or
purge gas flow
Simulation results:
pumping speed
power consumption
cell pressure
bearing load
clearance leakage flow
gas ballast flow
0
50
100
150
200
250
300
350
400
0,01 0,1 1 10 100 1000
inlet pressure p_IN [mbar]
pu
mp
ing
sp
ee
d S
EF
[m
3/h
]
64th IUVSTA Workshop 10Leinsweiler, 17.05.2011
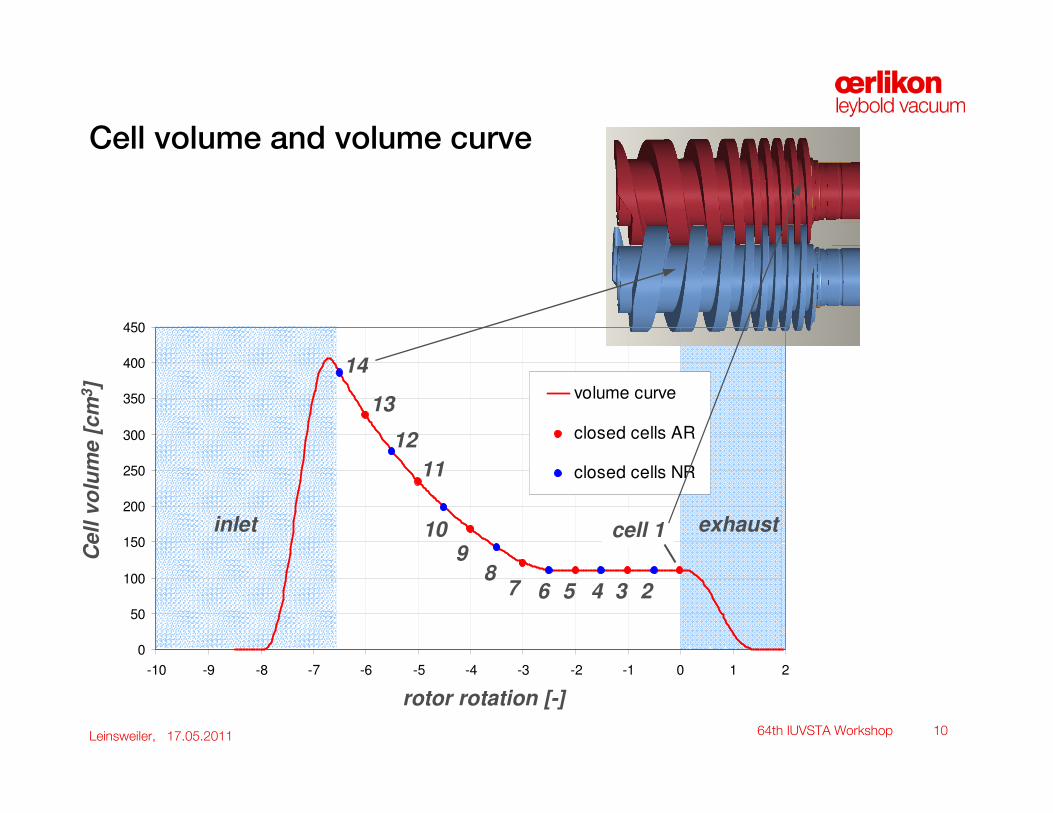
Cell volume and volume curve
0
50
100
150
200
250
300
350
400
450
-10 -9 -8 -7 -6 -5 -4 -3 -2 -1 0 1 2
volume curve
closed cells AR
closed cells NR
Cell
vo
lum
e[c
m3]
rotor rotation [-]
inlet exhaustcell 1
2345678
910
11
12
13
14

64th IUVSTA Workshop 11Leinsweiler, 17.05.2011
CTHCTHCTHCTH clearance tip to housing and CTR CTR CTR CTR clearance tip to root
y
x
CTH CTR
64th IUVSTA Workshop 12Leinsweiler, 17.05.2011
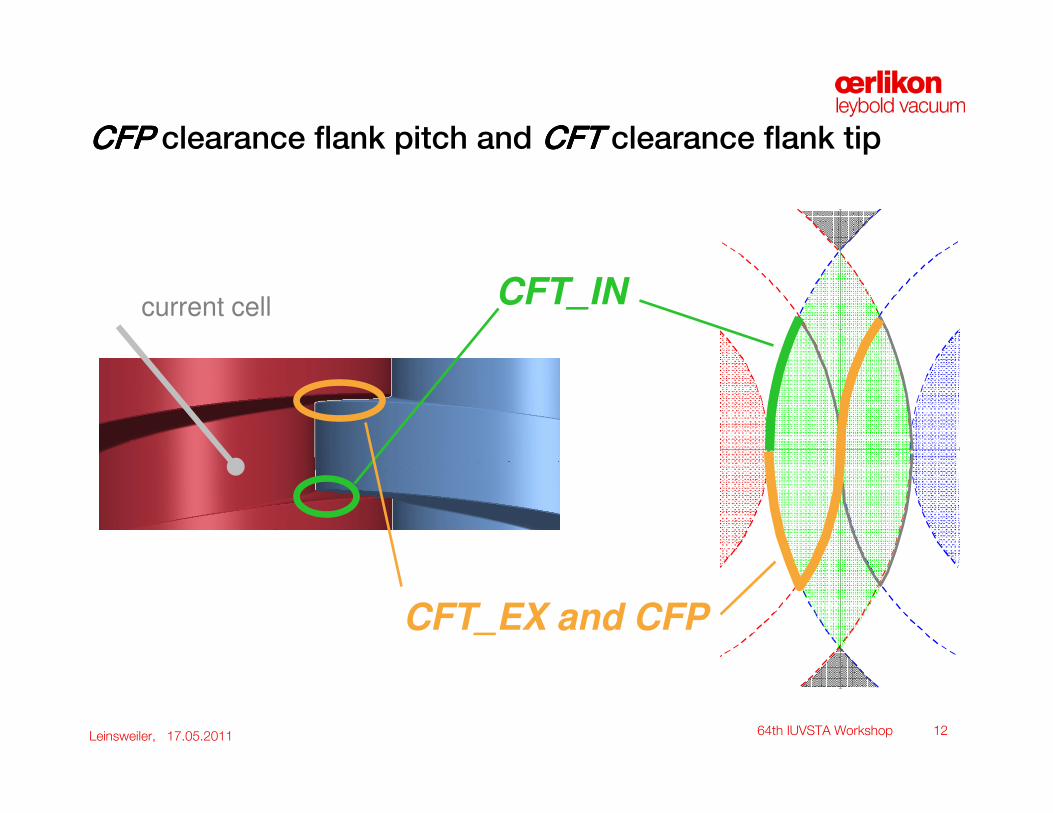
CFPCFPCFPCFP clearance flank pitch and CFT CFT CFT CFT clearance flank tip
CFT_IN
CFT_EX and CFP
current cell

64th IUVSTA Workshop 13Leinsweiler, 17.05.2011
CBH CBH CBH CBH clearance blow hole
CBH_IN
CBH_EX
current cell
CFT_IN
CFT_EX and CFP

64th IUVSTA Workshop 14Leinsweiler, 17.05.2011
CBT CBT CBT CBT clearance blow hole tail
CBH_IN CBH_EX
current cell
intersection edge
CBT_IN CBT_EX

64th IUVSTA Workshop 15Leinsweiler, 17.05.2011
Clearance area for constant clearance height
0
20
40
60
80
100
120
140
160
180
0 2 4 6 8 10 12 14
cell number n_WCE [-]
cle
ara
nce a
rea
A [
mm
2]
total area
CTH
CFT_IN
CTR
CFT_EX
CBH_IN
CBT_IN
CFP
CBH_EX
CBT_EX
cell 1cell 14
64th IUVSTA Workshop 16Leinsweiler, 17.05.2011
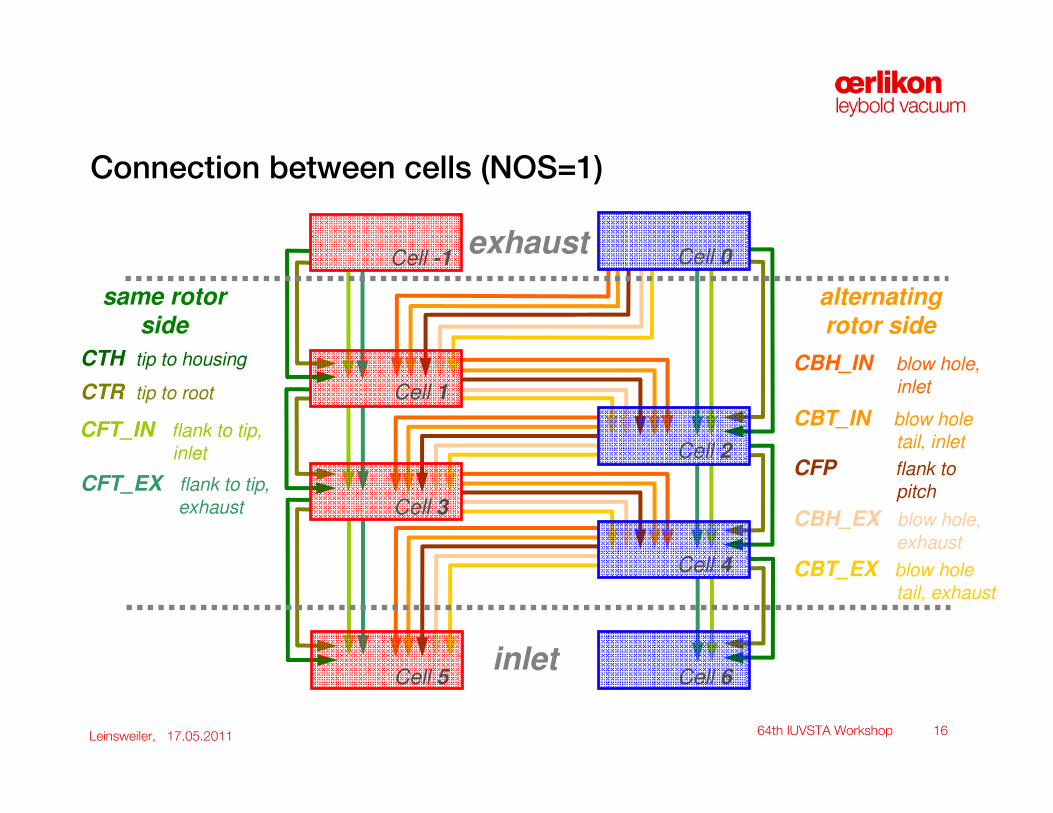
Connection between cells (NOS=1)
CTH tip to housing
CTR tip to root
CFT_IN flank to tip,
inlet
CFT_EX flank to tip,
exhaust
CBH_IN blow hole,
inlet
CBT_IN blow hole
tail, inlet
CFP flank to
pitch
CBH_EX blow hole,
exhaust
CBT_EX blow hole
tail, exhaust
same rotor
sidealternating
rotor side
Cell 6Cell 5inlet
Cell -1 Cell 0exhaust
Cell 1
Cell 3
Cell 2
Cell 4
64th IUVSTA Workshop 17Leinsweiler, 17.05.2011
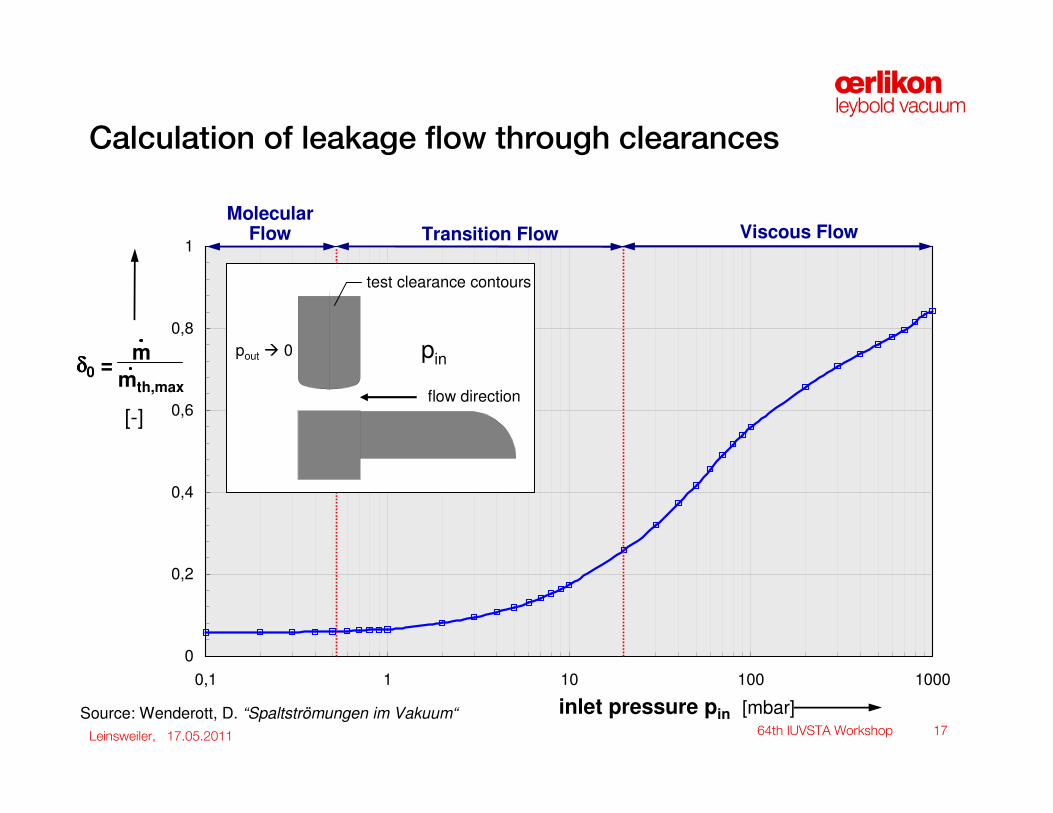
Calculation of leakage flow through clearances
0
0,2
0,4
0,6
0,8
1
0,1 1 10 100 1000
Source: Wenderott, D. “Spaltströmungen im Vakuum“ inlet pressure pin [mbar]
[-]
δδδδ0 =m
mth,max
Molecular Flow Viscous FlowTransition Flow
flow direction
pinpout � 0
test clearance contours
64th IUVSTA Workshop 18Leinsweiler, 17.05.2011
exhaust
inlet
1 V1 T1 p*1 m*
1
-1
4
T2
T4
T3
p*2
p*4
p*3
m*2
m*4
m*3
0
Tex
Tex
pex
pex
m-1
m0
6
2
3
5
V-1
V2
V4
V3
V0
V6
V5
Tin pin
Tin pin
m6
m5
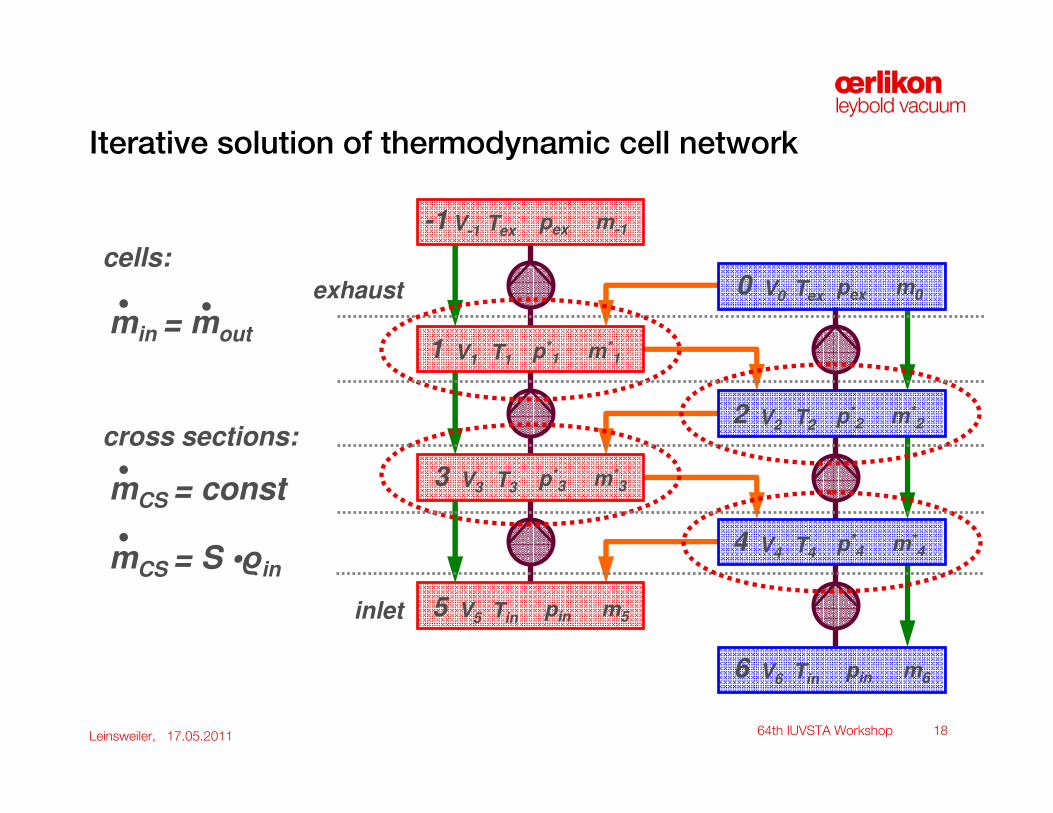
Iterative solution of thermodynamic cell network
min = mout
mCS = const
mCS = S •ϱin
cells:
cross sections:

64th IUVSTA Workshop 19Leinsweiler, 17.05.2011
Simulated pumping speed of SP250 @ 60Hz, cold start
Variation of discharge side housing gap heights +- 0,02 mm
0
50
100
150
200
250
300
350
400
0,01 0,1 1 10 100 1000
pin [mbar]
Seff [
m³/
h]
60 Hz, h_CTH,DS = 0,14 mm
60 Hz, h_CTH,DS = 0,16 mm
60 Hz, h_CTH,DS = 0,18 mm
64th IUVSTA Workshop 20Leinsweiler, 17.05.2011
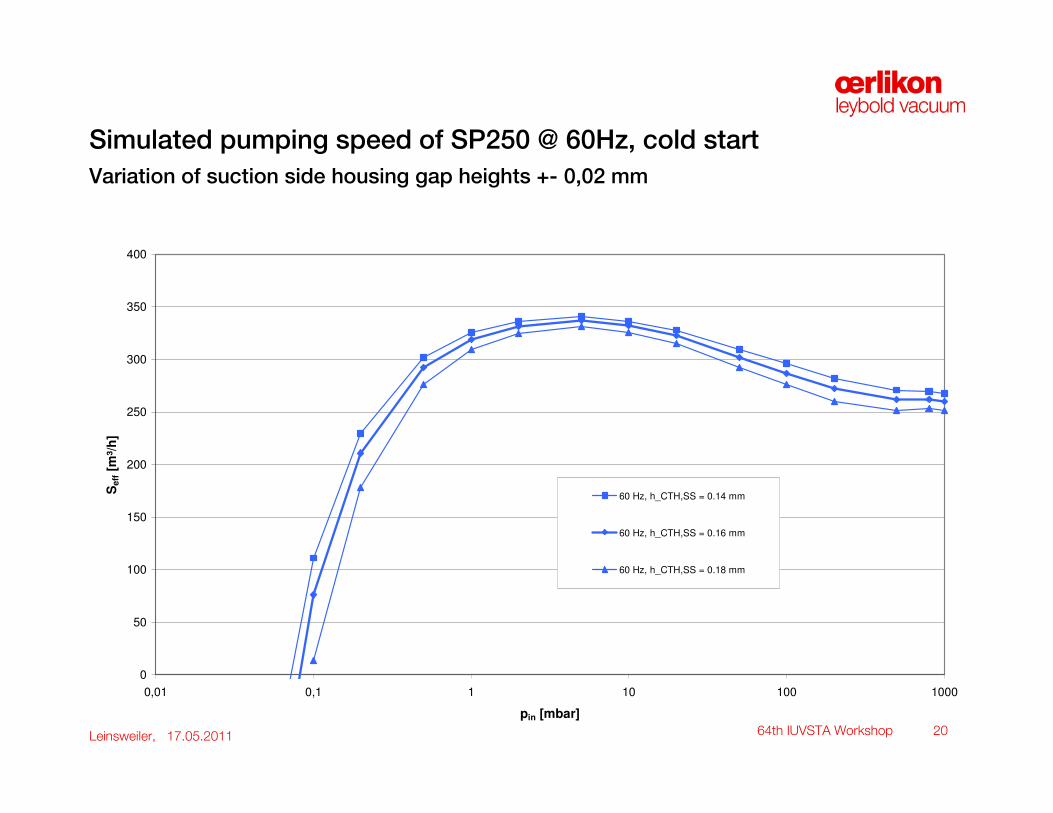
Simulated pumping speed of SP250 @ 60Hz, cold start
Variation of suction side housing gap heights +- 0,02 mm
0
50
100
150
200
250
300
350
400
0,01 0,1 1 10 100 1000
pin [mbar]
Seff [
m³/
h]
60 Hz, h_CTH,SS = 0.14 mm
60 Hz, h_CTH,SS = 0.16 mm
60 Hz, h_CTH,SS = 0.18 mm

64th IUVSTA Workshop 21Leinsweiler, 17.05.2011
Validation of the simulation tool
Validation of the simulation tools by experiments
� Measurement of the operating behaviour of a SP250
� in cold state � with cold clearances (known)
� pumping speed
� pressure measurement at 8 different stages
� rotor speed: 50 Hz, 60 Hz
(40 Hz, 30 Hz)
� pin = 0,001 .. 1000 mbar
� automated
Aim is the comparison of
� pumping speed curves
� compression curves
in simulation and measurement

64th IUVSTA Workshop 22Leinsweiler, 17.05.2011
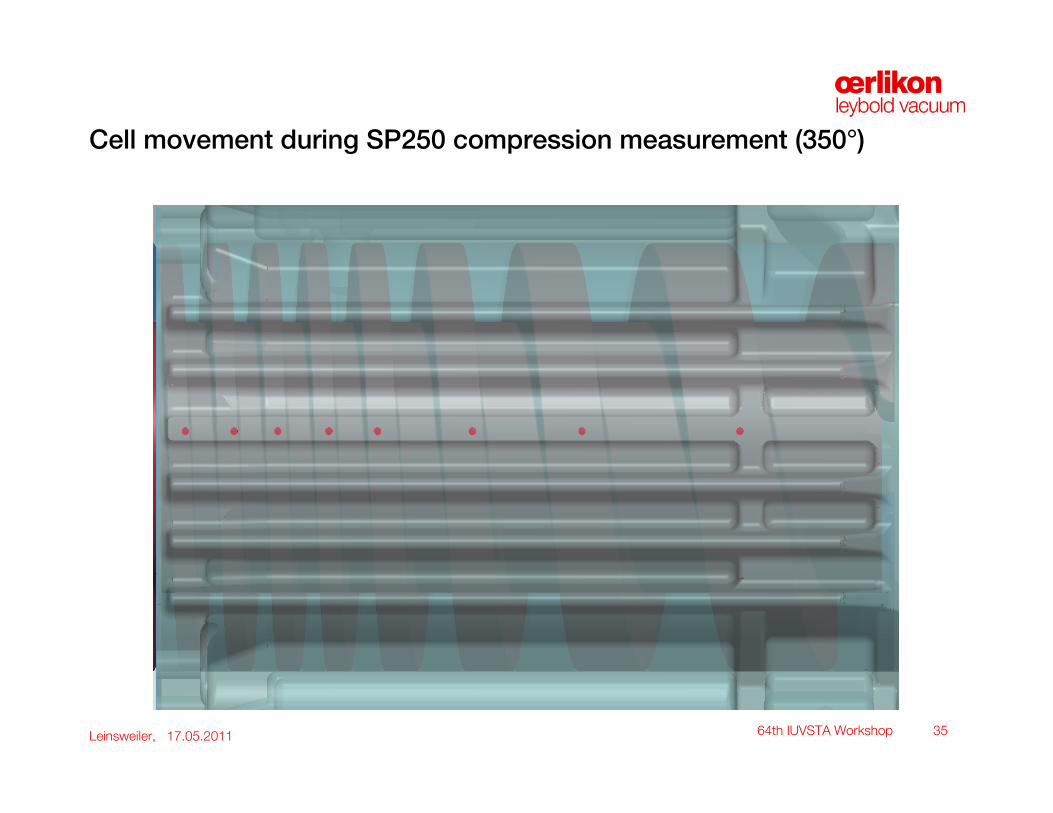
Position of sensor bores in pump housing
Lage der Druckmessstellen
0
50
100
150
200
250
300
350
400
450
-10 -9 -8 -7 -6 -5 -4 -3 -2 -1 0 1 2
Rotorumdrehungen [-]
Kam
me
rvo
lum
en
[c
m3
]
position of pressure sensor
volume of cells in model
volumencurve
64th IUVSTA Workshop 23Leinsweiler, 17.05.2011
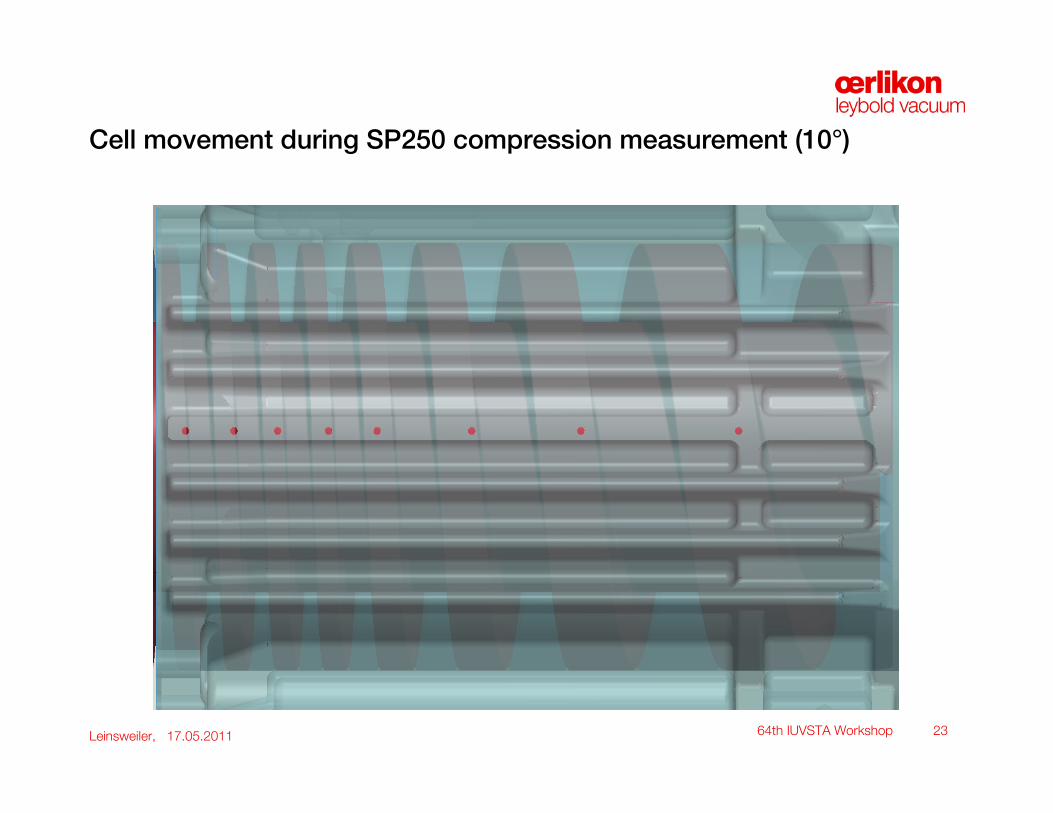
Cell movement during SP250 compression measurement (10°)

64th IUVSTA Workshop 24Leinsweiler, 17.05.2011
Cell movement during SP250 compression measurement (30°)

64th IUVSTA Workshop 25Leinsweiler, 17.05.2011
Cell movement during SP250 compression measurement (60°)
64th IUVSTA Workshop 26Leinsweiler, 17.05.2011
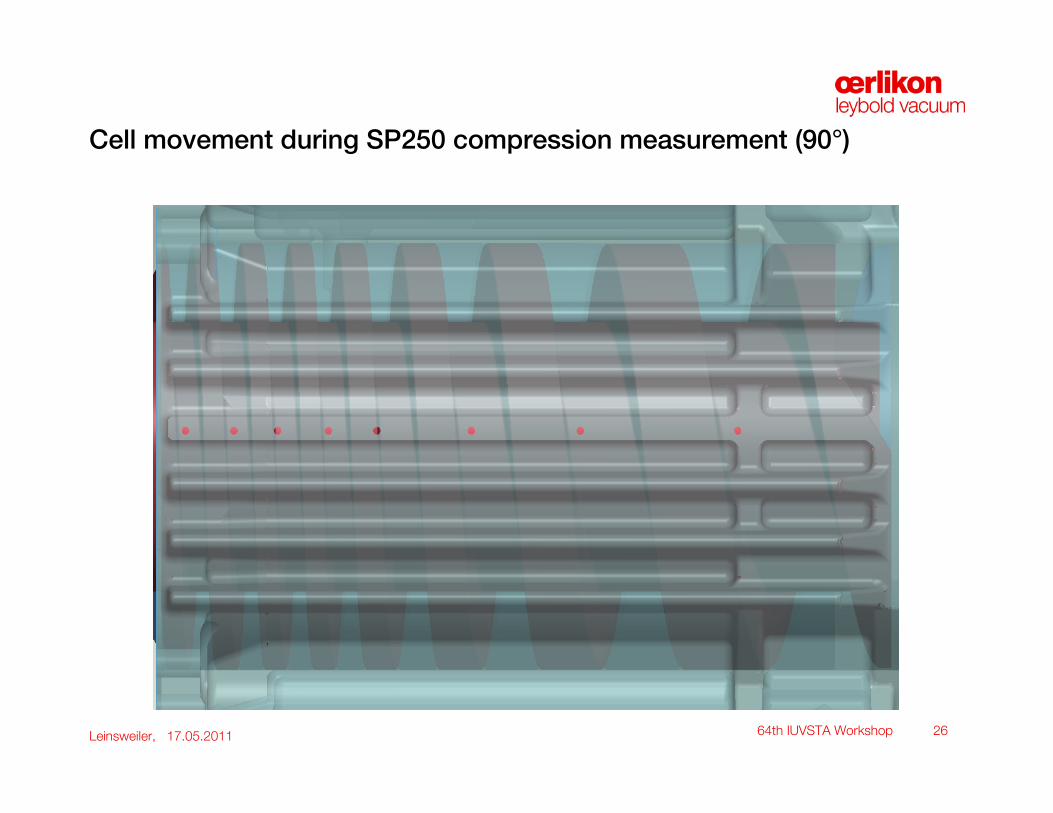
Cell movement during SP250 compression measurement (90°)

64th IUVSTA Workshop 27Leinsweiler, 17.05.2011
Cell movement during SP250 compression measurement (120°)

64th IUVSTA Workshop 28Leinsweiler, 17.05.2011
Cell movement during SP250 compression measurement (150°)
64th IUVSTA Workshop 29Leinsweiler, 17.05.2011
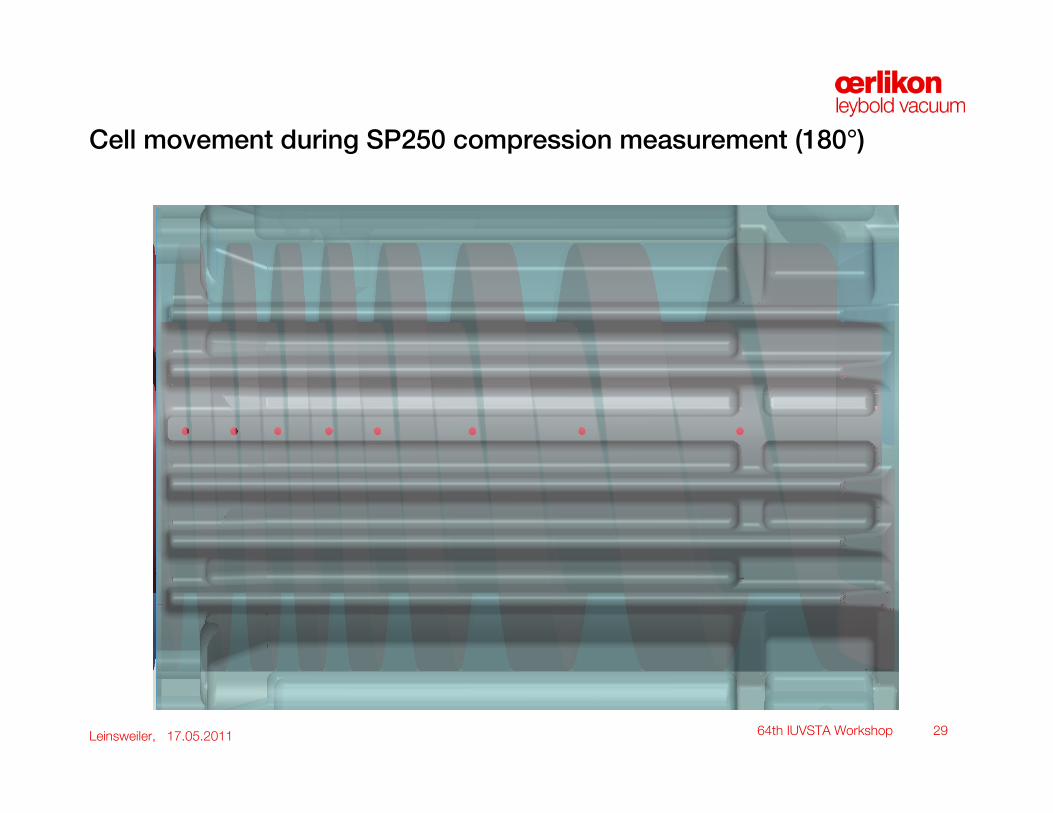
Cell movement during SP250 compression measurement (180°)

64th IUVSTA Workshop 30Leinsweiler, 17.05.2011
Cell movement during SP250 compression measurement (210°)
64th IUVSTA Workshop 31Leinsweiler, 17.05.2011
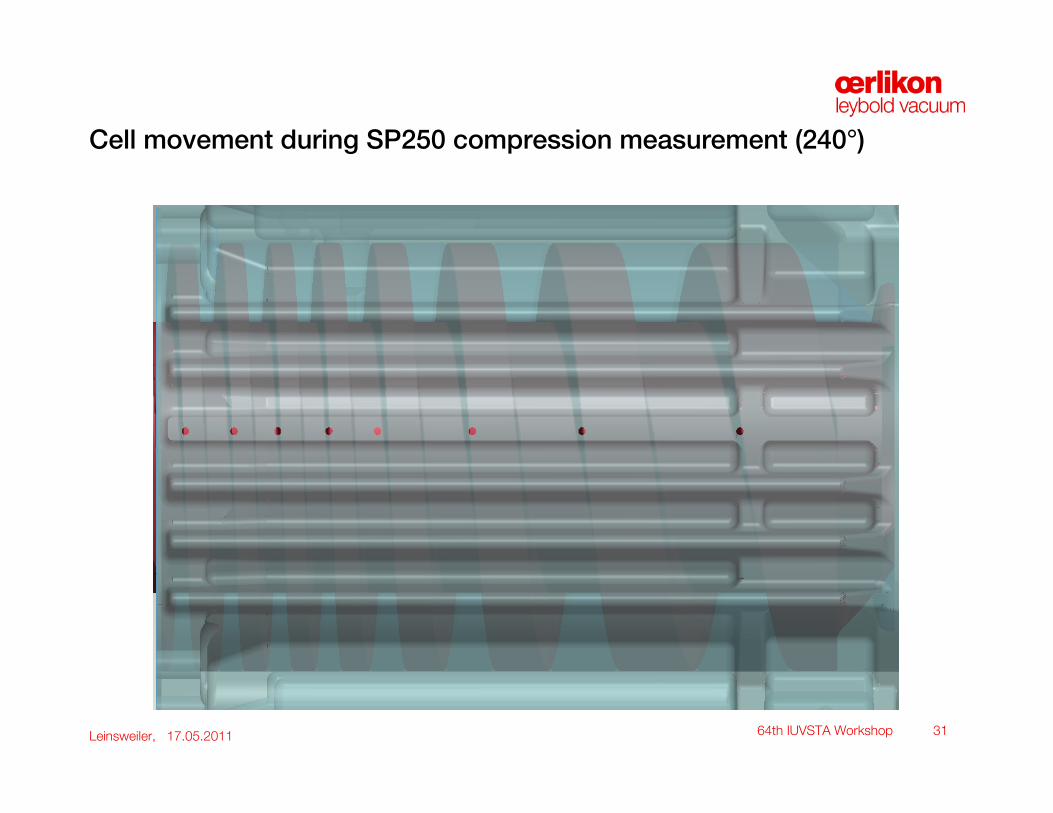
Cell movement during SP250 compression measurement (240°)

64th IUVSTA Workshop 32Leinsweiler, 17.05.2011
Cell movement during SP250 compression measurement (270°)

64th IUVSTA Workshop 33Leinsweiler, 17.05.2011
Cell movement during SP250 compression measurement (300°)

64th IUVSTA Workshop 34Leinsweiler, 17.05.2011
Cell movement during SP250 compression measurement (330°)
64th IUVSTA Workshop 35Leinsweiler, 17.05.2011
Cell movement during SP250 compression measurement (350°)
64th IUVSTA Workshop 36Leinsweiler, 17.05.2011
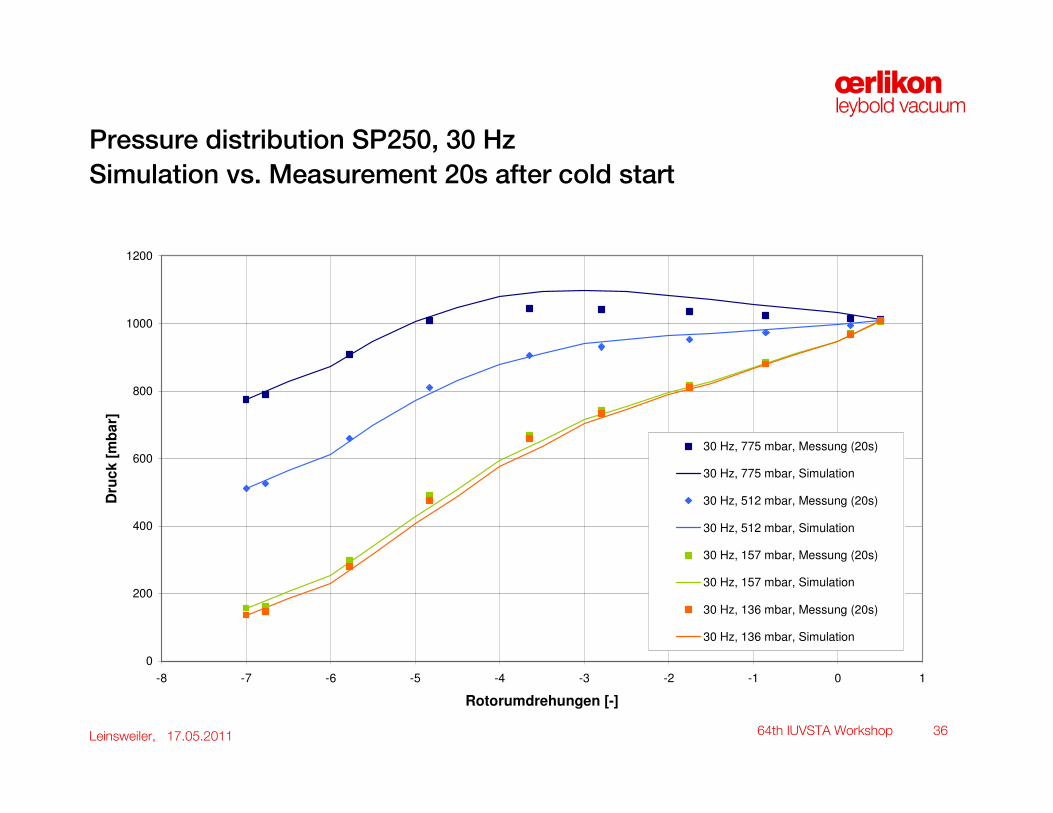
Pressure distribution SP250, 30 Hz
Simulation vs. Measurement 20s after cold start
0
200
400
600
800
1000
1200
-8 -7 -6 -5 -4 -3 -2 -1 0 1
Rotorumdrehungen [-]
Dru
ck [
mb
ar]
30 Hz, 775 mbar, Messung (20s)
30 Hz, 775 mbar, Simulation
30 Hz, 512 mbar, Messung (20s)
30 Hz, 512 mbar, Simulation
30 Hz, 157 mbar, Messung (20s)
30 Hz, 157 mbar, Simulation
30 Hz, 136 mbar, Messung (20s)
30 Hz, 136 mbar, Simulation

64th IUVSTA Workshop 37Leinsweiler, 17.05.2011
Pressure distribution SP250, 40 Hz
Simulation vs. Measurement 20s after cold start
0
200
400
600
800
1000
1200
1400
-8 -7 -6 -5 -4 -3 -2 -1 0 1
Rotorumdrehungen [-]
Dru
ck
[m
ba
r]
40 Hz, 783 mbar, Messung (20s) 40 Hz, 783 mbar, Simulation
40 Hz, 507 mbar, Messung (20s) 40 Hz, 507 mbar, Simulation
40 Hz, 87 mbar, Messung (20s) 40 Hz, 87 mbar, Simulation
40 Hz, 29 mbar, Messung (20s) 40 Hz, 29 mbar, Simulation
40 Hz, 22 mbar, Messung (20s) 40 Hz, 22 mbar, Simulation
40 Hz, 14 mbar, Messung (20s) 40 Hz, 14 mbar, Simulation

64th IUVSTA Workshop 38Leinsweiler, 17.05.2011
Pressure distribution SP250, 50 Hz
Simulation vs. Measurement 20s after cold start
0
1
10
100
1000
10000
-8 -7 -6 -5 -4 -3 -2 -1 0 1
Rotorumdrehungen [-]
Dru
ck
[m
ba
r]
50 Hz, 885 mbar, Messung (20s) 50 Hz, 885 mbar, Simulation
50 Hz, 526 mbar, Messung (20s) 50 Hz, 526 mbar, Simulation
50 Hz, 55 mbar, Messung (20s) 50 Hz, 55 mbar, Simulation
50 Hz, 12 mbar, Messung (20s) 50 Hz, 12 mbar, Simulation
50 Hz, 1,24 mbar, Messung (20s) 50 Hz, 1,24 mbar, Simulation
50 Hz, 0,9 mbar, Messung (20s) 50 Hz, 0,9 mbar, Simulation
50 Hz, 0,61 mbar, Messung (20s) 50 Hz, 0,61 mbar, Simulation

64th IUVSTA Workshop 39Leinsweiler, 17.05.2011
Pressure distribution SP250, 60 Hz
Simulation vs. Measurement 20s after cold start
0,01
0,1
1
10
100
1000
10000
-8 -7 -6 -5 -4 -3 -2 -1 0 1
Rotorumdrehungen [-]
Dru
ck
[m
bar]
60 Hz, 760 mbar, Messung (20s) 60 Hz, 760 mbar, Simulation
60 Hz, 475 mbar, Messung (20s) 60 Hz, 475 mbar, Simulation
60 Hz, 53 mbar, Messung (20s) 60 Hz, 53 mbar, Simulation
60 Hz, 9,8 mbar, Messung (20s) 60 Hz, 9,8 mbar, Simulation
60 Hz, 1,03 mbar, Messung (20s) 60 Hz, 1,03 mbar, Simulation
60 Hz, 0,21 mbar, Messung (20s) 60 Hz, 0,21 mbar, Simulation
60 Hz, 0,10 mbar, Messung (20s) 60 Hz, 0,10 mbar, Simulation
SeffSim / Mess
260 / 221258 / 220
299 / 292
332 / 346
322 / 343
228 / 255
64th IUVSTA Workshop 40Leinsweiler, 17.05.2011
Simulation of screw vacuum pumps with a cell model
The simulation my means of cell model
� allows the calculation of the compression cycle in the pump
� by calculation of leakage through clearances
� and making up the balance between forward transport and backward leakage
� gives a good accuracy regarding
� pumping speed,
� pressure distribution and
� compression power.
� can be used for the variational design of screw pumps

64th IUVSTA Workshop 41Leinsweiler, 17.05.2011
Opportunities in the simulation of screw pumps
The following parts of the simulation can be improved:
� Thermal simulation of the process and the pump parts
� Heat Transfer between the gas and the surrounding surfaces
� Calculation of gas temperature during compression
� FEM simulation for the pump parts
� Recalculation of clearance heights on the basis of simulated pump deformation
� Simulation of mixed gas flows in the clearances
� Empirical flow models limit the simulation capability to certain gases
� Theoratical / physical models would increase simulation capabilities
� Instationary simulation of inlet and exhaust flow
64th IUVSTA Workshop 42Leinsweiler, 17.05.2011
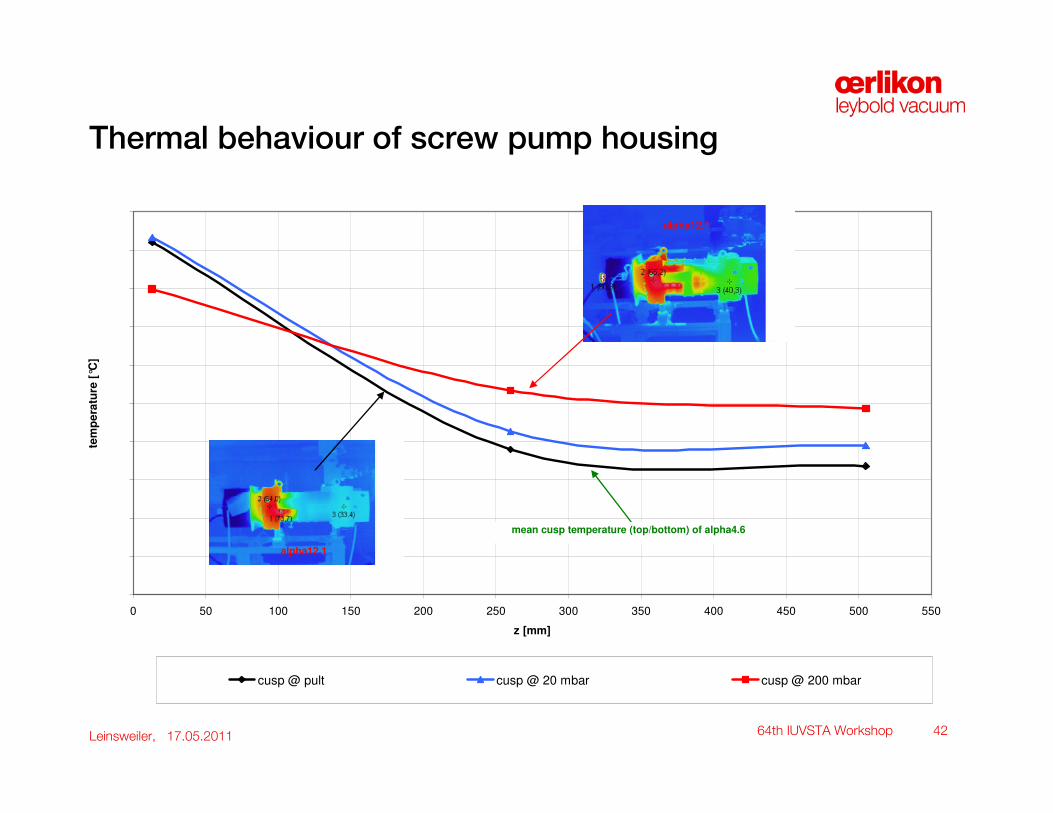
Thermal behaviour of screw pump housing
0
10
20
30
40
50
60
70
80
90
100
0 50 100 150 200 250 300 350 400 450 500 550
z [mm]
tem
pe
ratu
re [
°C]
cusp @ pult cusp @ 20 mbar cusp @ 200 mbar
alpha12.1
alpha12.1
mean cusp temperature (top/bottom) of alpha4.6
64th IUVSTA Workshop 43Leinsweiler, 17.05.2011
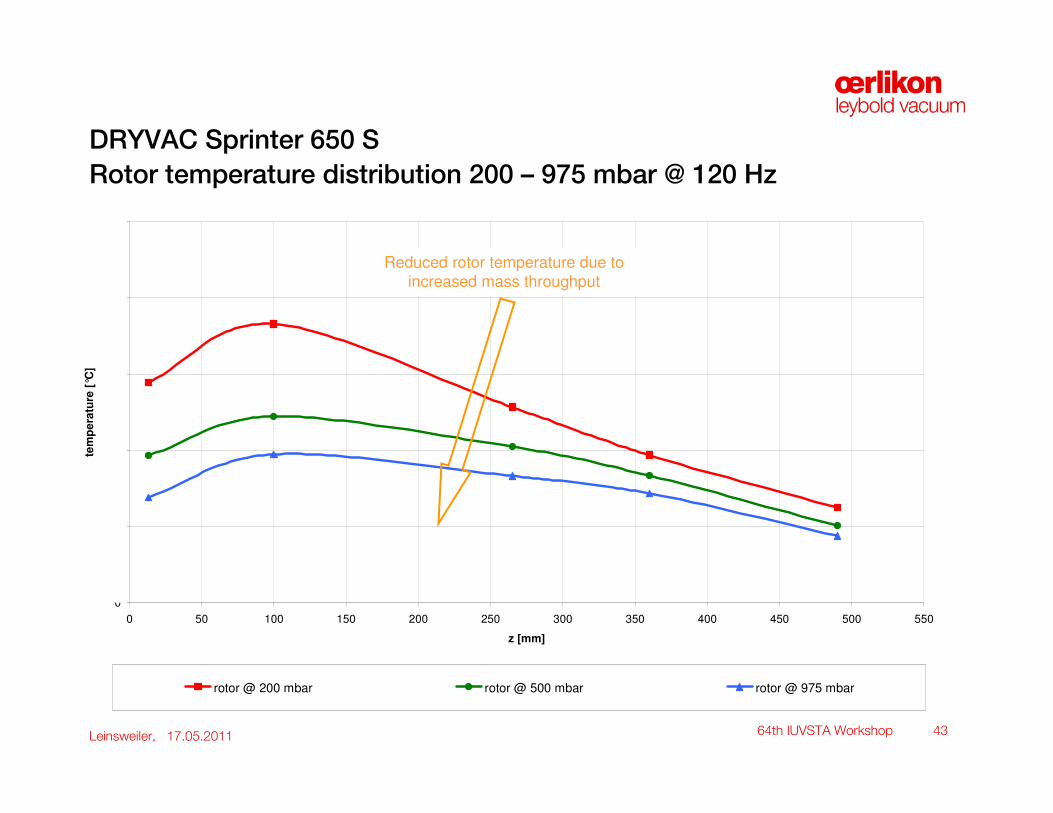
DRYVAC Sprinter 650 S
Rotor temperature distribution 200 – 975 mbar @ 120 Hz
0
50
100
150
200
250
0 50 100 150 200 250 300 350 400 450 500 550
z [mm]
tem
pe
ratu
re [
°C]
rotor @ 200 mbar rotor @ 500 mbar rotor @ 975 mbar
Reduced rotor temperature due to
increased mass throughput
64th IUVSTA Workshop 44Leinsweiler, 17.05.2011
Vacuum Pumps
64th IUVSTA Workshop 45Leinsweiler, 17.05.2011
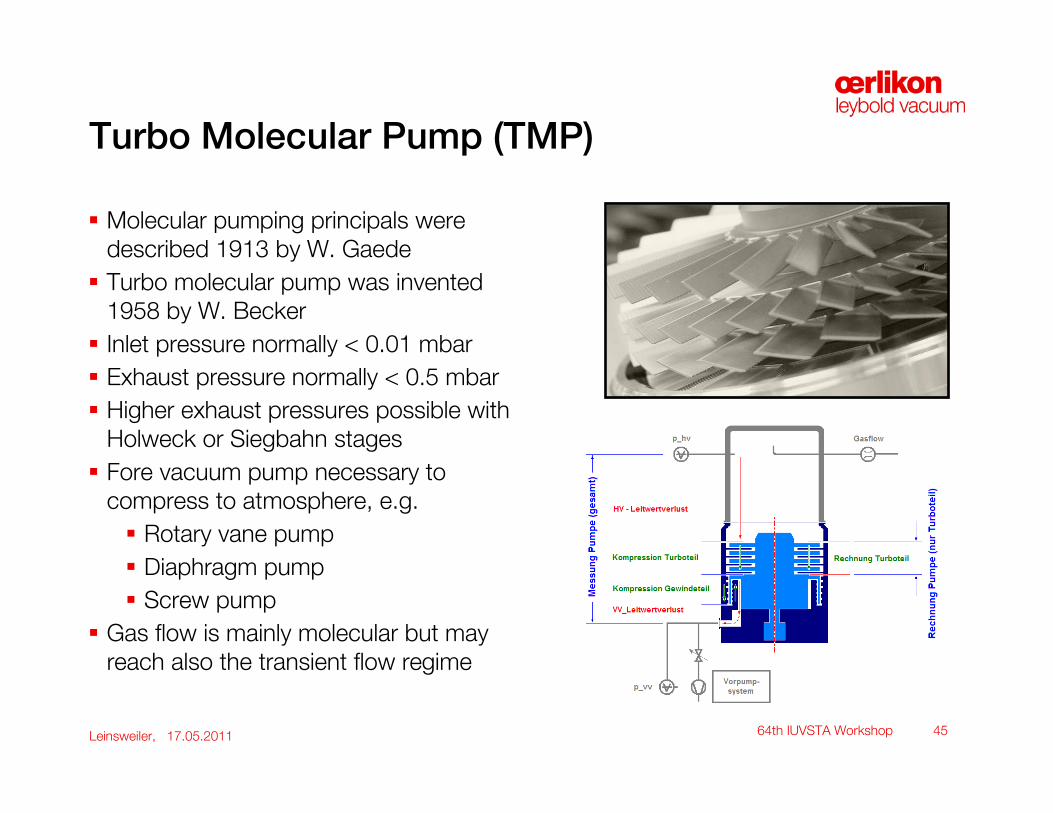
Turbo Molecular Pump (TMP)
� Molecular pumping principals were
described 1913 by W. Gaede
� Turbo molecular pump was invented
1958 by W. Becker
� Inlet pressure normally < 0.01 mbar
� Exhaust pressure normally < 0.5 mbar
� Higher exhaust pressures possible with
Holweck or Siegbahn stages
� Fore vacuum pump necessary to
compress to atmosphere, e.g.
� Rotary vane pump
� Diaphragm pump
� Screw pump
� Gas flow is mainly molecular but may
reach also the transient flow regime

64th IUVSTA Workshop 46Leinsweiler, 17.05.2011
Turbo Molecular Pump – Design Goals
Technical goals in the design of TMP:
� Optimization of Vacuum Performance� Pumping speed� Kompression� For different gases
� High Lifetime� Thermal Household� Mechanical stress
� Flexible solutions for the customer
64th IUVSTA Workshop 47Leinsweiler, 17.05.2011
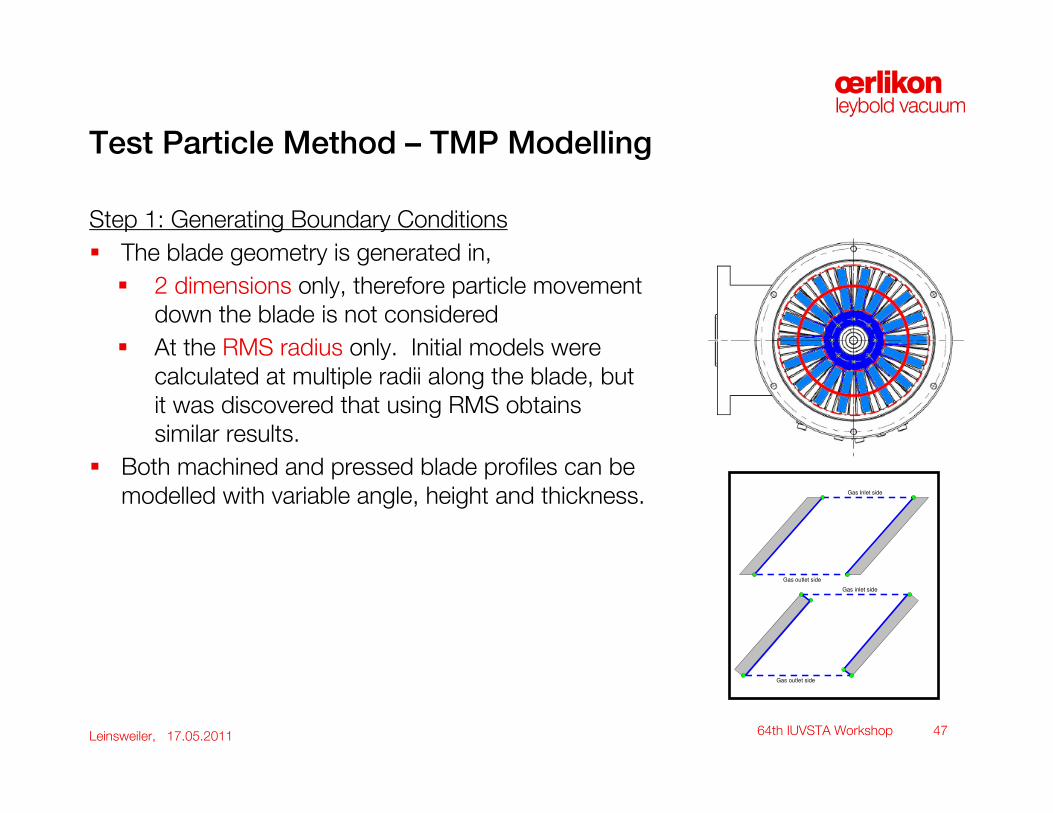
Test Particle Method – TMP Modelling
Step 1: Generating Boundary Conditions
� The blade geometry is generated in,
� 2 dimensions only, therefore particle movement
down the blade is not considered
� At the RMS radius only. Initial models were
calculated at multiple radii along the blade, but
it was discovered that using RMS obtains
similar results.
� Both machined and pressed blade profiles can be
modelled with variable angle, height and thickness.
Gas outlet side
Gas Inlet side
Gas inlet side
Gas outlet side
64th IUVSTA Workshop 48Leinsweiler, 17.05.2011
Test Particle Method – TMP Modelling
Knudsen Cosine Law
0.00%
1.00%
2.00%
3.00%
4.00%
5.00%
6.00%
7.00%
8.00%
9.00%
10.00%
-90 -80 -70 -60 -50 -40 -30 -20 -10 0 10 20 30 40 50 60 70 80 90
Angle (Degrees)
Pro
bab
ilit
y (
%)
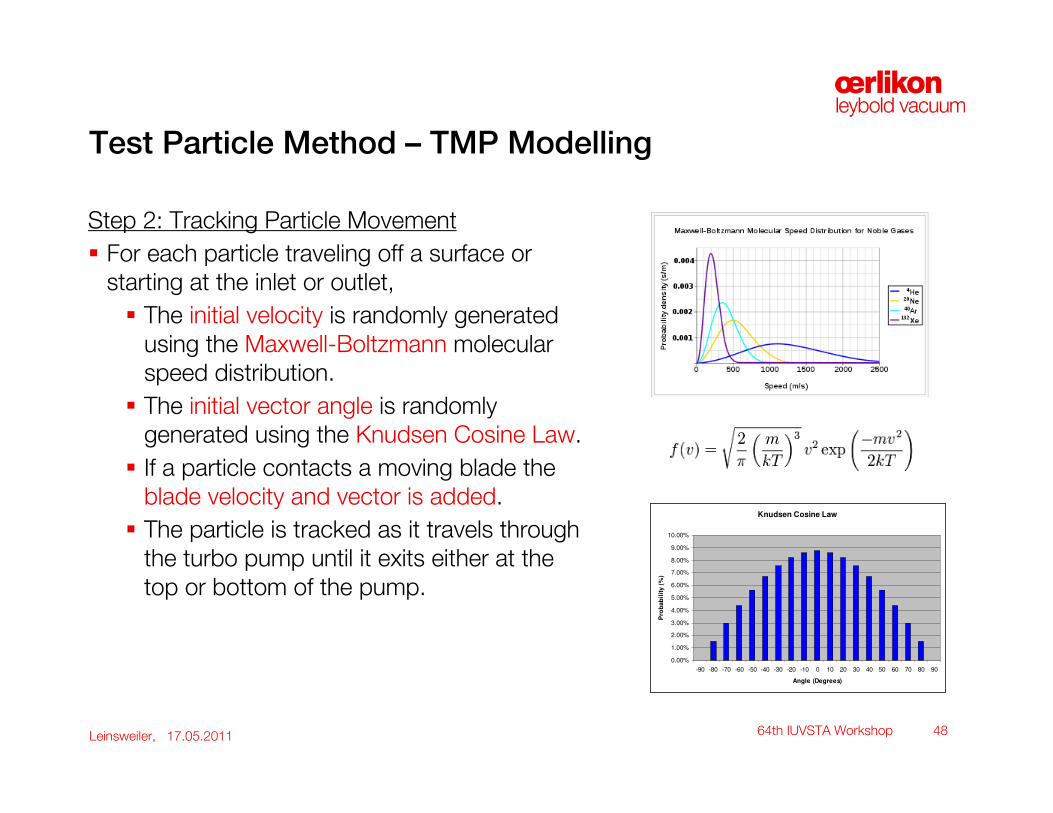
Step 2: Tracking Particle Movement
� For each particle traveling off a surface or
starting at the inlet or outlet,
� The initial velocity is randomly generated
using the Maxwell-Boltzmann molecular
speed distribution.
� The initial vector angle is randomly
generated using the Knudsen Cosine Law.
� If a particle contacts a moving blade the
blade velocity and vector is added.
� The particle is tracked as it travels through
the turbo pump until it exits either at the
top or bottom of the pump.
64th IUVSTA Workshop 49Leinsweiler, 17.05.2011
Test Particle Method – TMP Modelling
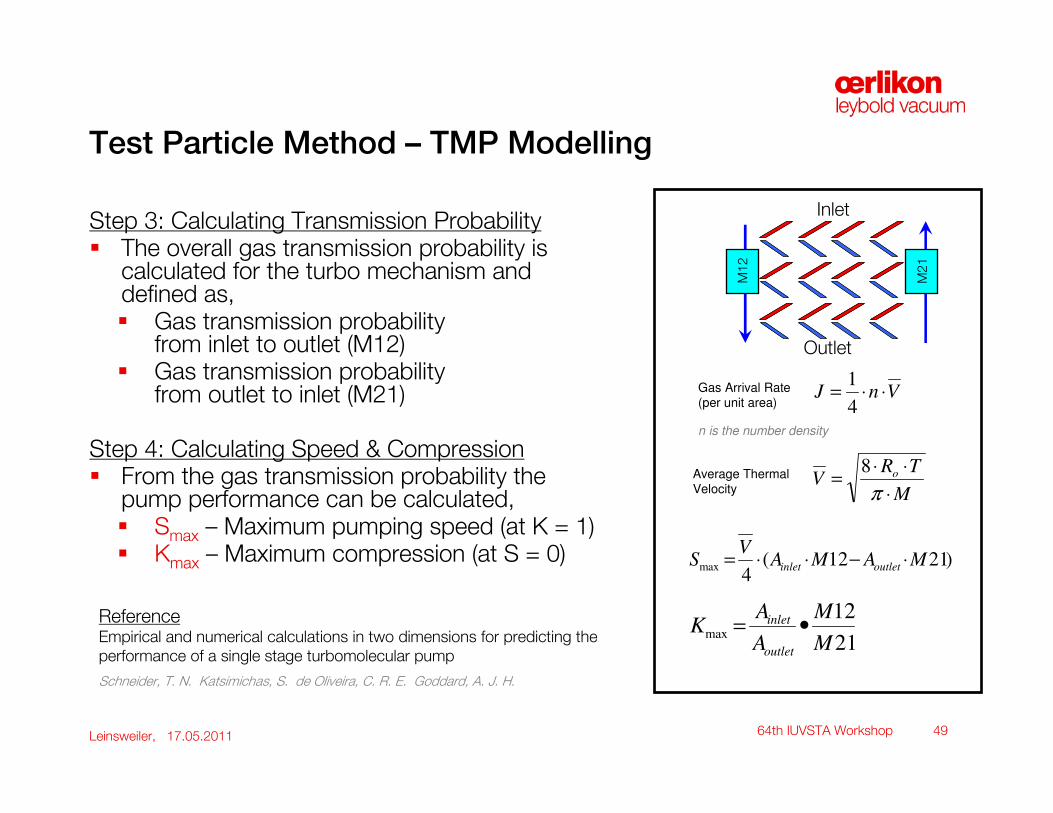
Step 3: Calculating Transmission Probability� The overall gas transmission probability is
calculated for the turbo mechanism and defined as,� Gas transmission probability
from inlet to outlet (M12)� Gas transmission probability
from outlet to inlet (M21)
Step 4: Calculating Speed & Compression� From the gas transmission probability the
pump performance can be calculated,� Smax – Maximum pumping speed (at K = 1)� Kmax – Maximum compression (at S = 0)
M
TRV
VnJ
o
⋅
⋅⋅=
⋅⋅=
π
8
4
1
Average Thermal Velocity
Gas Arrival Rate(per unit area)
n is the number density
21
12max
M
M
A
AK
outlet
inlet •=
)2112(4
max MAMAV
S outletinlet ⋅−⋅⋅=
Inlet
Outlet
M12
M21
ReferenceEmpirical and numerical calculations in two dimensions for predicting the
performance of a single stage turbomolecular pump
Schneider, T. N. Katsimichas, S. de Oliveira, C. R. E. Goddard, A. J. H.
64th IUVSTA Workshop 50Leinsweiler, 17.05.2011
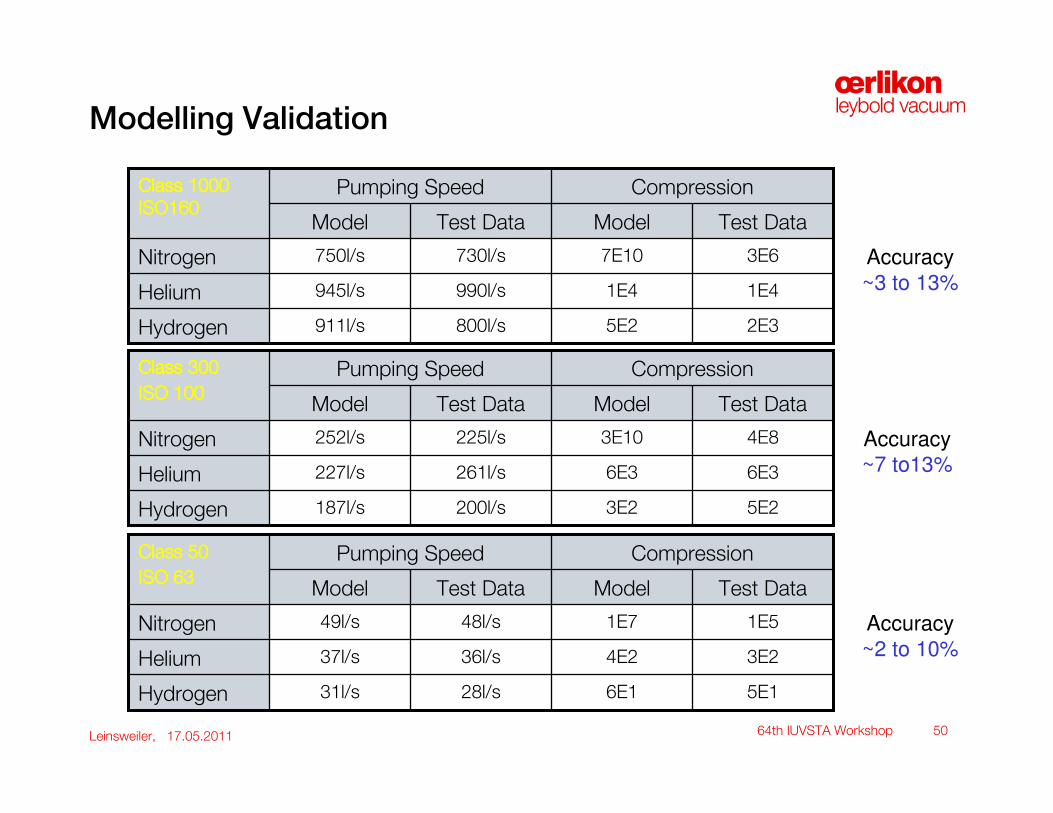
2E35E2800l/s911l/sHydrogen
945l/s
750l/s
Model
Pumping Speed
990l/s
730l/s
Test Data
1E41E4Helium
3E67E10Nitrogen
Test DataModel
CompressionClass 1000 Class 1000 Class 1000 Class 1000
ISO160ISO160ISO160ISO160
Accuracy
~3 to 13%
5E16E128l/s31l/sHydrogen
37l/s
49l/s
Model
Pumping Speed
36l/s
48l/s
Test Data
3E24E2Helium
1E51E7Nitrogen
Test DataModel
CompressionClass 50Class 50Class 50Class 50
ISO 63ISO 63ISO 63ISO 63
Accuracy
~2 to 10%
5E23E2200l/s187l/sHydrogen
227l/s
252l/s
Model
Pumping Speed
261l/s
225l/s
Test Data
6E36E3Helium
4E83E10Nitrogen
Test DataModel
CompressionClass 300Class 300Class 300Class 300
ISO 100ISO 100ISO 100ISO 100
Accuracy
~7 to13%
Modelling Validation
64th IUVSTA Workshop 51Leinsweiler, 17.05.2011
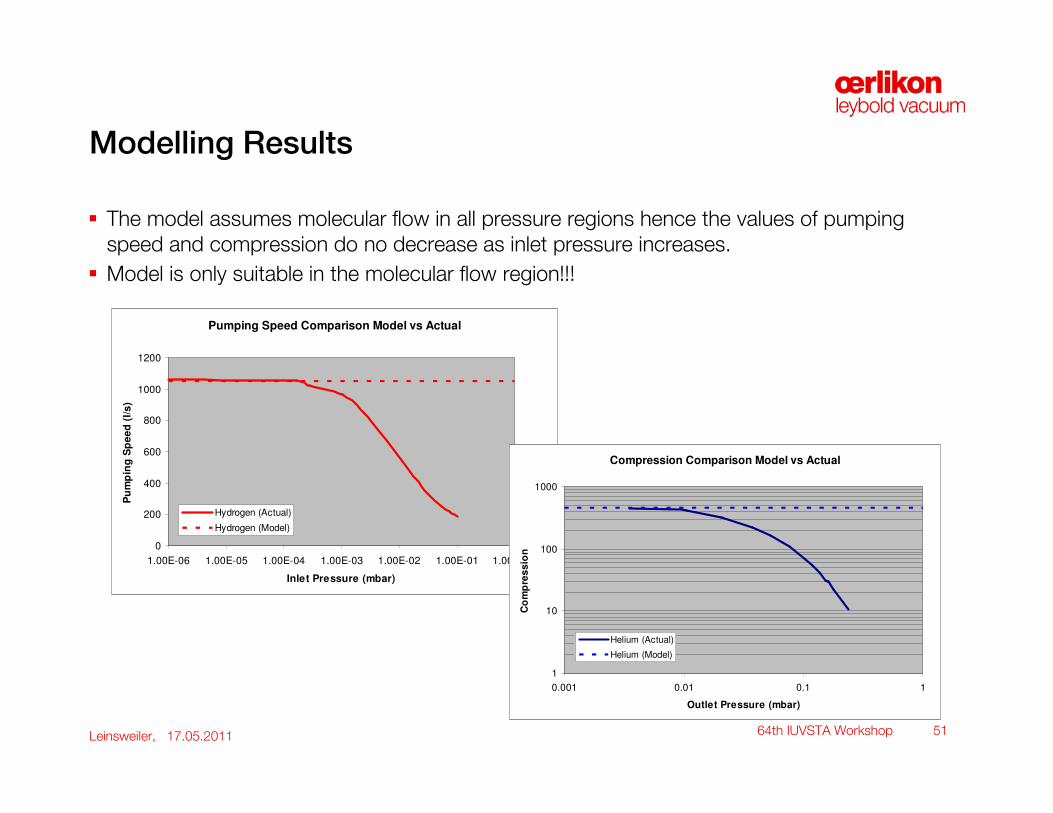
Pumping Speed Comparison Model vs Actual
0
200
400
600
800
1000
1200
1.00E-06 1.00E-05 1.00E-04 1.00E-03 1.00E-02 1.00E-01 1.00E+00
Inlet Pressure (mbar)
Pu
mp
ing
Sp
ee
d (
l/s
)
Hydrogen (Actual)
Hydrogen (Model)
Compression Comparison Model vs Actual
1
10
100
1000
0.001 0.01 0.1 1
Outlet Pressure (mbar)
Co
mp
res
sio
n
Helium (Actual)
Helium (Model)
Modelling Results
� The model assumes molecular flow in all pressure regions hence the values of pumping
speed and compression do no decrease as inlet pressure increases.
� Model is only suitable in the molecular flow region!!!
64th IUVSTA Workshop 52Leinsweiler, 17.05.2011
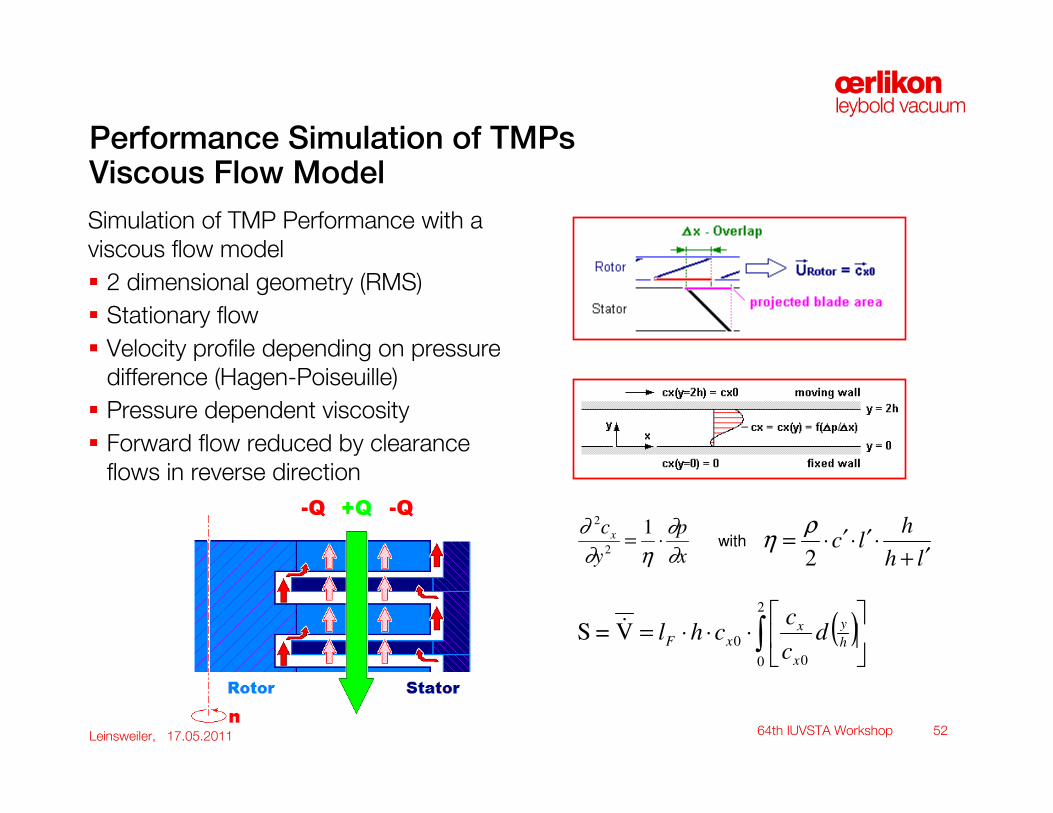
Performance Simulation of TMPsViscous Flow Model
Simulation of TMP Performance with a
viscous flow model
� 2 dimensional geometry (RMS)
� Stationary flow
� Velocity profile depending on pressure
difference (Hagen-Poiseuille)
� Pressure dependent viscosity
� Forward flow reduced by clearance
flows in reverse direction
x
p
y
cx
∂
∂
η∂
∂⋅=
12
2
lh
hlc
′+⋅′⋅′⋅=
2
ρηwith
( )∫
⋅⋅⋅=
2
0 0
0V=Sh
y
x
xxF d
c
cchl&

64th IUVSTA Workshop 53Leinsweiler, 17.05.2011
Performance Simulation with viscous flow model
Simulation of the vacuum performance
� Shows generally good accuracy
� Allows a fast simulation of multiple design
variations
64th IUVSTA Workshop 54Leinsweiler, 17.05.2011
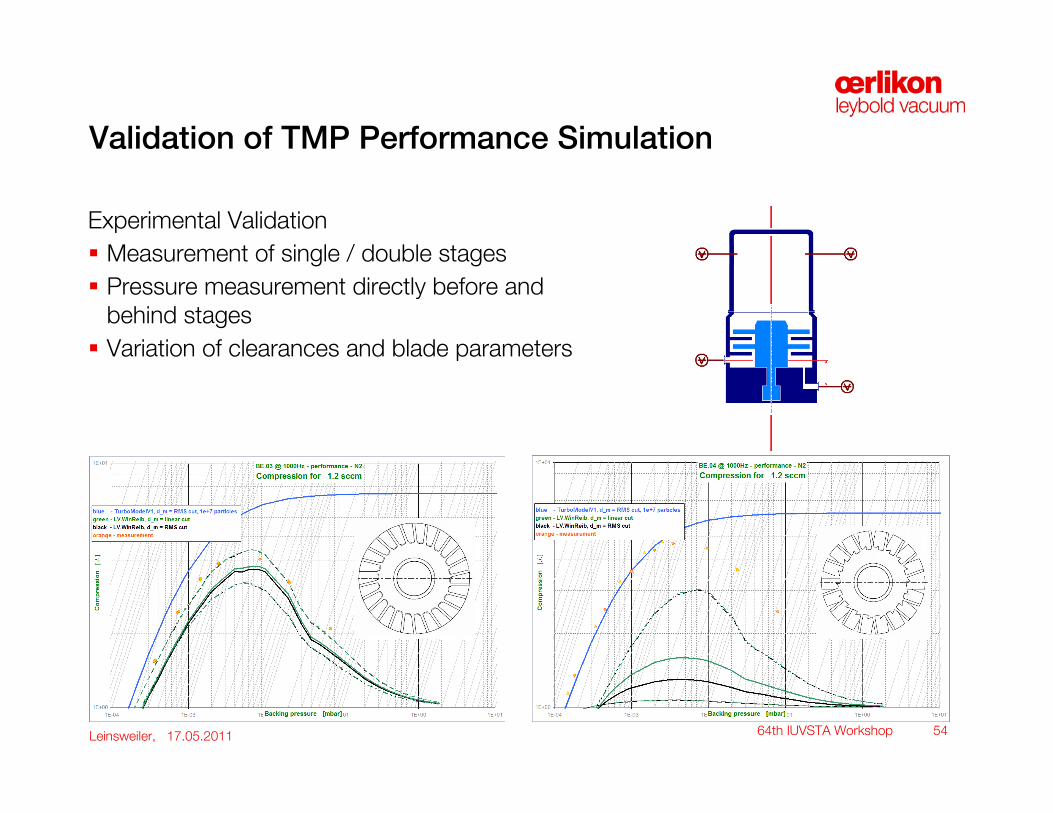
Validation of TMP Performance Simulation
Experimental Validation
� Measurement of single / double stages
� Pressure measurement directly before and
behind stages
� Variation of clearances and blade parameters
64th IUVSTA Workshop 55Leinsweiler, 17.05.2011
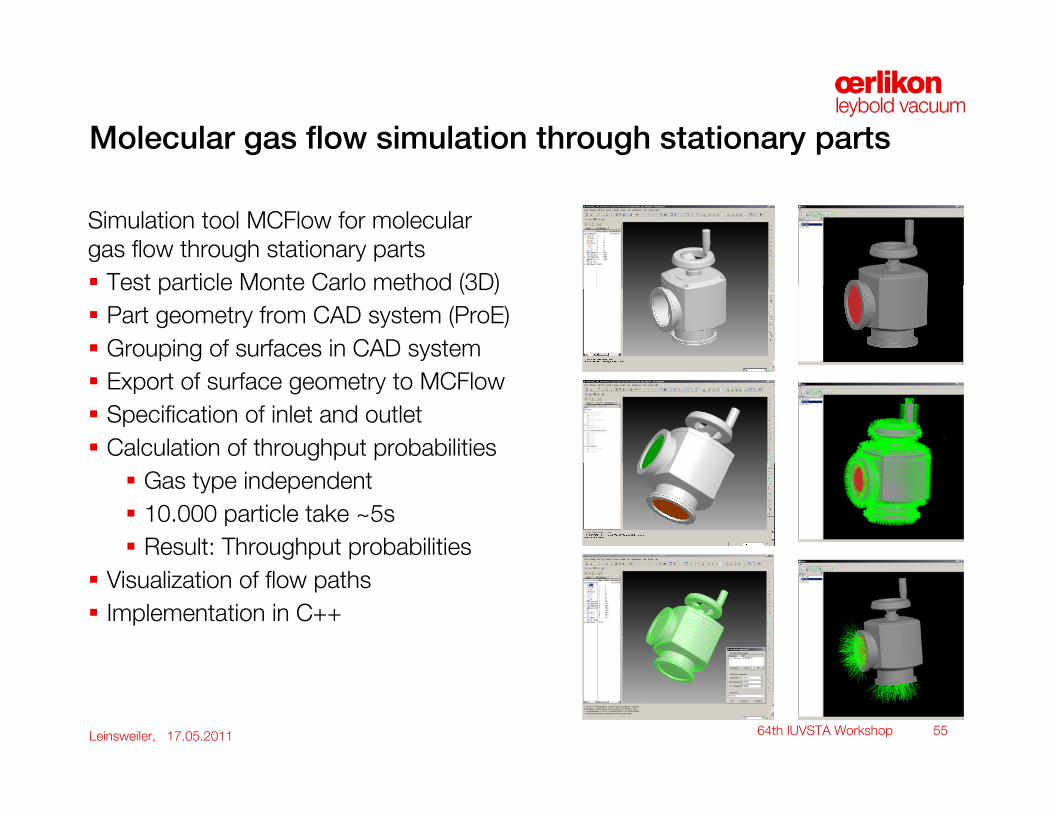
Molecular gas flow simulation through stationary parts
Simulation tool MCFlow for molecular
gas flow through stationary parts
� Test particle Monte Carlo method (3D)
� Part geometry from CAD system (ProE)
� Grouping of surfaces in CAD system
� Export of surface geometry to MCFlow
� Specification of inlet and outlet
� Calculation of throughput probabilities
� Gas type independent
� 10.000 particle take ~5s
� Result: Throughput probabilities
� Visualization of flow paths
� Implementation in C++
64th IUVSTA Workshop 56Leinsweiler, 17.05.2011
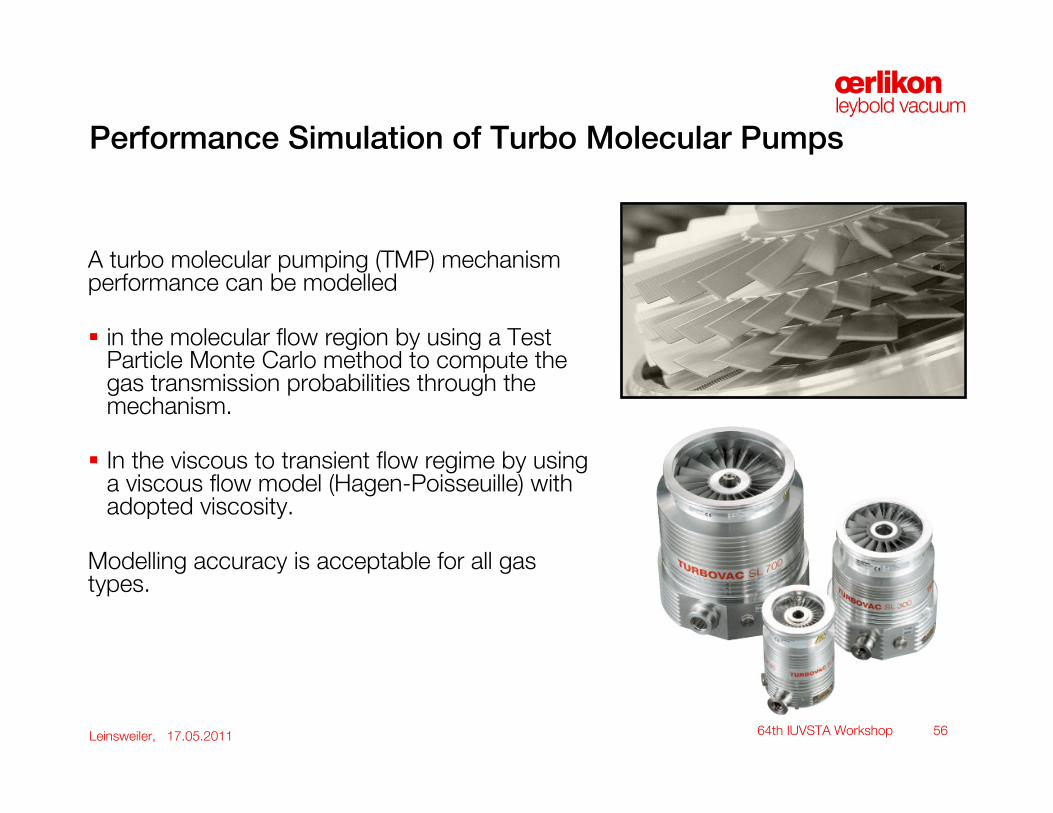
Performance Simulation of Turbo Molecular Pumps
A turbo molecular pumping (TMP) mechanism performance can be modelled
� in the molecular flow region by using a Test Particle Monte Carlo method to compute the gas transmission probabilities through the mechanism.
� In the viscous to transient flow regime by using a viscous flow model (Hagen-Poisseuille) with adopted viscosity.
Modelling accuracy is acceptable for all gas types.
64th IUVSTA Workshop 57Leinsweiler, 17.05.2011
Challenges in the simulation of Turbo Molecular Pumps
The following parts of the simulation can be improved:
� One (combined) flow model to simulate all flow regimesmolecular � transient � viscous
� Thermal simulation of the process and the pump parts
� Heat Transfer between the gas and the surrounding surfaces
- Housing
- Rotor Blades
- Holweck stage
� Calculation of gas temperature during compression
� FEM simulation for the pump parts
� 3D – model including the influences of complex flow channels inside the pump
� Simulation of mixed gas flows