CURRENT STATE AND POTENTIAL FOR INCREASING PLASTICS ...
66
1 CURRENT STATE AND POTENTIAL FOR INCREASING PLASTICS RECYCLING IN THE U.S. Jawad A. Bhatti Advisor: Professor Nickolas J. Themelis, Columbia University Submitted in partial fulfillment of the requirements for the degree of Master of Science in Earth Resources Engineering Department of Earth & Environmental Engineering Fu Foundation School of Engineering & Applied Science Columbia University October 2010 Research sponsored by
Transcript of CURRENT STATE AND POTENTIAL FOR INCREASING PLASTICS ...

1
CURRENT STATE AND POTENTIAL FOR INCREASING PLASTICS RECYCLING IN THE U.S.
Jawad A. Bhatti
Advisor: Professor Nickolas J. Themelis, Columbia University
Submitted in partial fulfillment of the requirements for the degree of Master of Science in Earth Resources Engineering
Department of Earth & Environmental Engineering
Fu Foundation School of Engineering & Applied Science
Columbia University
October 2010
Research sponsored by

2
EXECUTIVE SUMMARY
Plastics are a relatively new man‐made material that provides vast material benefits throughout their useful lifespan. However, their end of life disposal currently leaves much to be desired. The U.S. EPA estimates that 30 million tons (16.8% according to the EPA estimate of MSW and 8% according to the BioCycle/Columbia national survey) of the municipal solid waste (MSW) generated in the US annually is in the form of plastics.1 Of this amount only 7% is recovered for recycling , mostly in the form of polyethylene, and roughly 10% is combusted in waste‐to‐energy (WTE) facilities to generate electricity. The remainder of plastic wastes are landfilled, which is clearly a loss of non‐renewable, fossil‐based resources. Also, plastics litter in some cases poses a threat to human health and also threatens other ecosystems. For example, there is an estimated 100 million tons of plastic litter in the oceans, with millions more tons added each year.
The widely varying compositions and types of plastics, and also their commingling with other materials such as paper and inks, present difficulties in recycling. Therefore, novel beneficial uses of plastic wastes are needed to conserve fossil fuels and also land. Beyond the quantities of waste generated, plastics litter in some cases poses a threat to human health and also threatens other ecosystems. For example, there is an estimated 100 million tons of plastic litter in the oceans, with millions more tons added each yearNonetheless, it is important to recycle plastics for a number of reasons. These include energy savings of up to 40 MJ/kg depending on the polymer, as well as economic benefits, and reducing demand for virgin polymer from non‐renewable resources. Therefore, recycling of plastics is much preferable to landfilling.
The objectives of this thesis were to determine how plastics are currently recycled and identify means for increasing plastics recycling and/or energy recovery from plastics, substantially. The study examined six major thermoplastic resins: Polyethylene terephthalate (PET), high density polyethylene (HDPE), polyvinyl chloride (PVC), low density polyethylene (LDPE), polypropylene (PP), and polystyrene (PS), which comprise the vast majority (80%) of plastics. The study showed the respective volumes of these materials that are recycled or landfilled. The source‐separated plastics, by some U.S. communities were followed by the author, first at the materials recovery facility (MRF), where plastic are separated from other materials, and then at a regional plastics recovery facility (PRF) that receives plastic wastes from many local MRF and produces various types of marketable plastics and a residue amounting to about 30% of the feedstock to the PRF. A waste characterization test performed by the author on this residue showed that it consisted mostly of paper fiber.
Since policy drives volume, an effective way to increase collection rates is through the provision of single or multiple collection of recyclables, separate from the trash to be landfilled or combusted with energy recovery. New York State and New York City provide a good example with multiple laws and initiatives on the books to address plastic wastes, including the NYS Returnable Container Law (1982) and its update, the “Bigger Better Bottle Bill” (2009), the NYS Plastic Bag Reduction, Reuse and Recycling Law (2009), the NYS Electronic Equipment Recycling and Reuse Act (2010) and the NYC Textile Recycling Initiative (Fall 2010). These laws distribute the responsibility of recycling between manufacturers, retailers, and consumers, and have proven effective in increasing recycling rates.
1 EPA, "Municipal Solid Waste Generation, Recycling, and Disposal in the United States" 2008

3
Improvements in separation with advanced electromechanical methods have allowed for faster and more efficient automatic sorting. However, mechanical recycling of plastic wastes to the same form of plastics has its limits. Tertiary thermal recycling of the energy values in plastic wastes provide an alternative and equally sustainable solution. Therefore they should be considered in integrated waste management schemes. The high energy content of plastic wastes makes it a prime candidate for recovery by combustion and also as feedstock for the production of synthetic fuels. Embracing energy‐recycling methods, particularly the expansion of U.S. WTE capacity, is essential to properly manage the burgeoning quantities of plastic wastes generated.

4
TABLE OF CONTENTS
1. Introduction . . . . . . . . . . . 5 1.1 The issue of managing plastic wastes . . . . . . 5 1.2 Objectives . . . . . . . . . . 7 2. Plastics & Society . . . . . . . . . . 9
2.1 The polyolefin family . . . . . . 12 2.1.1 Polyethylene (PE) . . . . . . 12 2.1.2 Polypropylene (PP) . . . . . . 12 2.1.3 Polyvinyl Chloride (PVC) . . . . . 12
2.2 The polyester family . . . . . . . 13 2.2.1 Polyethylene Terephthalate (PET) . . . . 13 2.2.2 Polycarbonate (PC) . . . . . . 14 2.3 Styrenic plastics . . . . . . . 14 2.3.1 Polystyrene (PS) . . . . . . 14 2.3.2 Acrylonitrile Butadiene Styrene (ABS) . . . 15 2.4 Additional elements and compounds in plastic waste . . . 16 2.4.1 Catalyst and process residue . . . . 16 2.4.2 Co‐polymers, elastomers, and plasticizers . . . 16 2.4.3 Halogenated compounds & flame retardants . . . 17 2.4.4 Other elements . . . . . . 17 2.5 Plastics compared to other MSW . . . . . 17 2.6 Properties of plastic materials . . . . . 17 2.7 Energy required to create plastics . . . . . 18 3. Generation, how much is collected to WTE & landfills . . . . . 20 3.1 Production of plastics . . . . . . . . . 20 3.2 Disposal of plastics . . . . . . . . . 20 3.3 Specific streams of plastic wastes . . . . . . . 23 3.3.1 PET bottles & HDPE jugs . . . . . . . 23 3.3.2 Plastic bags & film . . . . . . . . 23 3.3.3 Single‐use food service . . . . . . . 24 3.3.4 Waste Electric & Electronic Equipment (WEEE) . . . 24 3.3.5 Agricultural film . . . . . . . . 25 4. Detailed analysis of fate of plastic wastes collected ‐ NYC Analysis . . . 26 4.1 NYC Preliminary Waste Characterization Study . . . . . 26 4.2 Waste Management – St. Charles, NJ – Materials Recycling Facility (MRF) . 29 4.3 Waste Management – Raleigh Plastics, Raleigh, NC – Plastics Recycling Facility (PRF)29 4.3.1 Feedstocks and products . . . . . . . 29 4.3.2 Residue . . . . . . . . . 31 4.4 Overall residue of NYC curbside recycling of plastics . . . . 32 5. Source reduction of plastics . . . . . . . . . 33 5.1 Potential benefits of source reduction . . . . . . 33 5.2 Legislative attempts . . . . . . . . . 34 5.3 Manufacturer reduction in packaging . . . . . . 35 5.4 Designing for recyclability . . . . . . . . 35 6. Collection & Separation . . . . . . . . . . 36 6.1 Manually sorted collection . . . . . . . . 36 6.1.1 Curbside collection . . . . . . . . 36 6.1.2 Container legislation & bottle deposits . . . . . 37

5
6.1.3 Post‐collection recycling . . . . . . . 38 6.1.4 Manufacturer‐led collection . . . . . . 38 6.1.5 Other schemes . . . . . . . . 38 6.2 Separation . . . . . . . . . . 39 6.2.1 Froth flotation . . . . . . . . 39 6.2.2 Density separation . . . . . . . . 39 6.2.3 Optical sorting methods . . . . . . . 40 6.2.4 Triboelectric separation . . . . . . . 41 6.2.5 Selective dissolution . . . . . . . . 42 7. Potential for increasing plastics materials recycling . . . . . 43 7.1 Difficulties in materials recycling . . . . . . . 43 7.2 Potential energy conservation of materials recycling . . . . 44 7.3 Closed loop recycling . . . . . . . . . 45 7.4 Plastic lumbers & building materials . . . . . . 45 7.4.1 Pure recycled plastic materials . . . . . . 45 7.4.2 Recycled plastics with additional fillers . . . . . 45 7.4.3 Plastics in concrete . . . . . . . . 46 7.5 Other potential end uses of recycled plastics . . . . . 46 8. Potential for using more plastic wastes for gasification and production of fuels . 47 8.1 Pyrolysis . . . . . . . . . . 47 8.1.1 Thermal Pyrolysis . . . . . . . . 48 8.1.2 Catalytic Pyrolysis . . . . . . . . 49 8.1.3 Microwave Pyrolysis . . . . . . . . 49 8.2 Gasification . . . . . . . . . . 49 8.3 Hydrocracking . . . . . . . . . . 50 8.4 Other synthetic fuels . . . . . . . . . 50 8.4.1 In conjunction with diesel fuels . . . . . . 50 8.4.2 Hydrogen production from waste plastics . . . . 50 9. Potential for using more plastic wastes as fuel on power plants, either co‐combusting with MSW in newly designed WTE facilities or in new plastics‐dedicated power plants . . 51 9.1 Plastics heat content . . . . . . . . . 51 9.2 Combustion emissions . . . . . . . . 51 9.3 Methods of combustion with energy recovery . . . . . 53 9.4 Co‐incineration . . . . . . . . . . 53 9.4.1 With MSW . . . . . . . . . 53 9.4.2 With Coal . . . . . . . . . 53 9.5 Dedicated plastics combustion . . . . . . . 54 9.5.1 GR Tech boiler . . . . . . . . 54 9.5.2 Northeastern University's double‐tank waste combuster . . 55 10. Discussion & recommendations . . . . . . . . 56 10.1 General Recommendations . . . . . . . . 56 10.2 Recommendations for particular resins and plastic wastes . . . 58 11 Conclusions . . . . . . . . . . . 59 12 References . . . . . . . . . . . 60

6
1 Introduction 1.1 The issue of managing plastic wastes Plastics constitute a significant and increasing segment of the municipal solid wastes stream (Figure 1.1). The U.S. EPA estimates that 30 million tons (16.8% according to the EPA estimate of MSW and 8% according to the BioCycle/Columbia national survey), of the municipal solid waste (MSW) generated in the US annually is in the form of plastics.2 Of this amount only 7.1% is recovered for recycling, and roughly 10% is combusted in waste‐to‐energy (WTE) facilities to generate electricity. The bulk of plastic wastes are landfilled, which is clearly a loss of non‐renewable, fossil‐based resources. Therefore, novel beneficial uses of plastic wastes are needed to avoid burying a valuable resource and also conserve land. While suitable solutions exist to address other components of the MSW stream, such as metals and paper, the widely varying compositions and types of plastics in use present difficulties in recycling. Available routes for plastic waste management often remain unclear to municipalities, which is the level at which recycling takes place.
Figure 1.1 ‐ Materials discarded in MSW, 20083 The disposition of plastic wastes is a relatively new problem. In 1960, plastics comprised less than 0.5% of municipal solid waste (MSW) in the United States. By 2008, over 30 million tons were discarded into the domestic waste stream. Increases in recovery rate have not matched the growth of generation rate, so that a mere 2.1 million tons (7.1%) were recovered for recycling in 2008 (Figure 1.2). While both paper/cardboard and organic waste contributed more tonnage to MSW, their recovery rates are substantially higher, as illustrated in Figure 1.3.
2 EPA, "Municipal Solid Waste Generation, Recycling, and Disposal in the United States" 2008 3 ibid

7
Figure 1.2 – Plastics generated & recovered in MSW since 19604
Figure 1.3 ‐ Breakdown of Recovery versus Generation in MSW by Category5
A 2007 Harper’s article disparaged plastics for their extreme durability, often exceeding the usable lifespan and overstated the amount of fossil fuels used in the manufacture of plastics6: “Never mind that only 5 percent of plastics actually end up getting recycled. Never mind that the plastics industry stamps those little triangles of chasing arrows into plastics for
4 ibid 5 ibid 6 Hohn, Donovan. “Moby Duck”. Harpers, January 2007. <http://www.harpers.org/archive/2007/01/0081345>

8
which no viable recycling method exists. Never mind that plastics consume about 400 million tons of oil and gas every year and that oil and gas may very well run out in the not too distant future. Never mind that so‐called green plastics made of biochemicals require fossil fuels to produce and release greenhouse gases when they break down.”
Beyond the quantities of waste generated, plastics litter in some cases poses a threat to human health and also threatens other ecosystems. For example, there is an estimated 100 million tons of plastic litter in the oceans, with millions more tons added each year.7 8 The award‐winning documentary “Addicted to Plastics”9 and the “Rise Above Plastics” of the Surfrider Foundation10 are just two of many examples of the general perception that plastics pose more harm than good. However, plastics are an indispensable part of our modern lives, offering a multitude of material benefits. For example, the low‐cost, versatility, and lightweight nature of plastics allows them to be compared favorably versus other sorts of packaging such as paper, glass and aluminum.
The Plastics Institute of America ”Plastic Engineering, Manufacturing and Data Handbook” counters negative perceptions in a section titled “Correcting Misconceptions About Plastics” that firmly defends the plastics industry – “If you examine the ‘facts’ the plastic industry has been and will continue to [be] one of the best materials ever introduced worldwide.”11 The truth lies somewhere in the middle. Plastics are a family of extremely versatile material, and provide unique benefits for the duration of their lifespans. However, at the end of their life, plastic “wastes” need to be disposed properly. Plastics are produced from petroleum sources. It has been estimated that their production consumes 8% of the world’s annual oil production – 4% as feedstock and another 4% in the form of energy used during manufacture.12 Therefore the intrinsic value of waste plastics is evident, whether it is recovered in the form of materials, by recycling, or in the form of energy, by combustion, or as fuels, by gasification. Regrettably, while options for thermochemical recycling processes to recover the embodied energy are being developed and improved, and an estimated 10% of the U.S. plastic wastes are combusted in waste‐to‐energy (WTE) facilities that generate electricity, over 80% are buried in U.S. landfills. 1.2 Objectives of this study The objectives of this thesis were twofold: To determine how plastics are currently recycled and recommend means for increasing plastics recycling and/or energy recovery from plastics, substantially. The principal goals are to identify and evaluate the best existing, or under development, methods for managing plastic wastes by separation at the source, collection, and processing, in the U.S. and globally. In particular, different avenues for recycling were investigated in order to recommend appropriate paths of disposal for individual polymers. Additionally, this study suggested
7 Plastic Debris from River to Sea. Algalita Marine Research Foundation. Web. 30 June 2010. <http://www.algalita.org/pdf/PLASTIC%20DEBRIS%20ENGLISH.pdf> 8 "UNEP :: Regional Seas Programme :: Marine Litter." ‐‐ United Nations Environment Programme (UNEP) ‐ Home Page ‐‐. Web. 30 June 2010. <http://www.unep.org/regionalseas/marinelitter/about/distribution/default.asp>. 9 “Addicted to Plastic." Bullfrog Films: 1‐800‐543‐3764: Environmental DVDs and Educational DVDs. 2009. Web. 30 June 2010. <http://www.bullfrogfilms.com/catalog/atp.html> 10 RISE ABOVE PLASTICS. 2009. Web. 30 June 2010. <http://riseaboveplastics.org/> 11 Plastics Insitute of America: Plastics Engineering Manufacturing and Data Handbook (2001) p63 12 Siddique, Rafat, et al. “Use of recycled plastic in concrete: A review.” Waste Management 28 (2008) 1835‐1852.

9
additional practices and procedures for the recovery of materials and energy form the enormous quantity of plastic wastes generated. Answers were sought to the question: Given the large amount of plastic wastes discarded and their petrochemical value, are there novel ways for recovering this value? Options to explore included material recycling, feedstock recycling to deconstruct the plastics to their original monomers, thermo‐chemical processing, and combustion (waste‐to‐energy) in dedicated power plants. While data collection and analysis in this paper have largely been confined to the United States, the fate of plastic wastes worldwide is not significantly different. The management of plastic wastes is highly complex since waste generation and collection must be performed at the local municipal level while recycling is regional or even international; for example, the US exports much plastic waste to China where it may be either recycled or combusted. Therefore, actual tonnages of plastics recycled are difficult to determine. Much of the research conducted in this work is based on visits of Materials Recycling Facilities (MRF), review of the technical literature, newspaper articles, and industry sources. The work also included the characterization of the residue produced in a large plastics recycling facility in Raleigh, North Carolina.

10
2 Plastics & Society “Plastics” is the generic term for synthetic materials formed by the polymerization of simple monomers. Both the terms “polymer” and “resin” may be used interchangeably for particular plastics. The Society of Plastics Industry defines a plastic material13 as “any one of a large group of materials consisting wholly or partly of combinations of carbon with oxygen, hydrogen, nitrogen and other organic or inorganic elements, which, while solid in the finished state, at some stages in its manufacture is made liquid, and thus capable of being formed into various shapes, most usually through the application, either singly or together, of heat and pressure.” At the broadest of classifications, plastics can be split into thermoplastic (“thermoplasts”) and thermosetting (“thermosets”) materials. The difference between the two is their behavior upon heating ‐‐ thermoplasts can be repeatedly melted and solidified without much change in properties (apart from the effect of contamination), while thermosets can only be set once. This is vital for purposes of recycling, as thermoplasts can be recycled while thermosets cannot. Strictly speaking, only thermoplasts are truly “plastic”. Thermosets represent only 12% of all plastics produced.14 The addition of non‐recyclable fibers such as fiberglass into a thermoplastic material can turn it into a thermoset. This study examined six major thermoplastic resins: Polyethylene terephthalate (PET), high density polyethylene (HDPE), polyvinyl chloride (PVC), low density polyethylene (LDPE), polypropylene (PP), and polystyrene (PS), which comprise the vast majority (80%) of plastics. (Fig 2.1) Additionally, polymers such as acrylonitrile butadiene styrene (ABS) and polycarbonate (PC) were investigated as representative of less prevalent plastics.
Figure 2.1 :Breakdown of Plastic Wastes in MSW by Resin15
13 Buekens, A. “Introduction to Feedstock Recycling of Plastics.” p 4 of “Feedstock Recycling and Pyrolysis of Waste Plastics” edited by John Scheirs & Walter Kaminsky Wiley 2006. 14 High Beam Business Industry Report. “Plastic Materials, Synthetic Resins http://business.highbeam.com/industry‐reports/chemicals/plastics‐materials‐synthetic‐resins‐nonvulcanizable‐elastomers 15 ibid

11
While tens of thousands of different polymers exist, the above polymers represent the vast majority of plastic wastes and can be divided into three families: Polyesters (PET, PC), polyolefins (HDPE, LDPE, PP, PVC), and styrenic plastics (PS, ABS). Plastics may be categorized and classified in several ways, e.g., by individual resin, by chemical makeup, physical characteristics, or lifespan. In 1988, the Society of Plastics Industries (SPI) developed the seven resin identification codes to differentiate the six major resins suitable for recycling as well as a seventh “catch‐all” code (Fig. 2.2). The resins codes are (1) PET, (2) HDPE, (3) PVC, (4) LDPE, (5) PP, (6) PS, and (7) other (O). The “Other” category is not to be confused with non‐recyclable thermosets.
Figure 2.2 – Resin Identification Codes & Symbols
While the SPI codes indicate plastics that are “recyclable”, the reality is that few of these plastics are actually recycled. Consumers assume that anything stamped with a code is not only technically recyclable but local recyclers can manage them. The infrastructure for PS recycling, for example, is sorely lacking. Additionally the SPI codes lumps together plastics that cannot be recycled together – blow‐molded and injection‐molded HDPE for example. These misconceptions lead to unwanted residue. Recycling rates for individual resins vary, although none of them is impressive. PET and HDPE are recycled at the highest rates, 18% and 10% respectively. LDPE reaches a recycling rate of only 5%, and recycling rates of PVC, PP, and PS are negligible (Fig. 2.3)

12
Figure 2.3 : Recycling rates of different resins16
A polymer is transformed into a usable final plastic product by the addition of various chemical compounds, such as colorants, elastomers, plasticizers, flame retardants, and UV stabilizers that impart to the plastic the desired material properties.17 The most commonly used plastics are limited to a handful of resins that differ only slightly in makeup. The monomers used to form plastics are derived from oil and are heavily carbon based (80%), with the balance being mostly hydrogen (~12%). Some additional elements exist. PET is notable for containing a large amount of oxygen while PVC contains a large amount of chlorine and ABS nitrogen.18 Table 2.1. Typical chemical composition of most common plastics
Resin Type Share of MSW
%C %H %O %Cl %N %S
Approximate chemical formula using C6 for all compounds.
PE Polyolefin 40% 85.4 14.4 0.17 0.03 C6H12 PET Polyester 12% 62.5 4.2 33.3 C6H4.8O2.4 PP Polyolefin 15% 85.5 14.4 0.08 C6H12 PS Styrenic 9% 90.2 8.5 1.3 C6H6 PVC Polyolefin 5% C6H6Cl3 In some cases, the chemical composition of various polymers may not show significant differences, e.g. between polystyrene and polypropylene. It is the physical arrangement of the atoms that differentiates polymers, e.g. polystyrene contains the styrene monomer while polypropylene is derived from the simpler propene monomer (Fig. 2.4).
16 ibid 17 Effect of Temperature and Other Factors on Plastics and Elastomers (2nd Edition) 18 Encinar, J.M. and J.F. Gonzalez. “Pyrolysis of synthetic polymers and plastic wastes. Kinetic study” Fuel Processing Technology 89 (2008) 678‐686.

13
Figure 2.4 – Propylene (left) vs Styrene (right)
2.1 The polyolefin family
2.1.1 Polyethylene (PE) Polyethylene (PE) molecules, ‐(‐C2H4‐)n, are derived from the polymerization of the simple ethylene monomer (Figure 2.5) and is the leading plastics family, in terms of total volume sold worldwide. PE is extremely versatile and serves as the basis for many different materials used in packaging. Polyethylene‐based plastics are classified in terms of the length of the monomers chain and its density. PE is used to form a wide variety of materials such as LLDPE (linear low density polyethylene) stretch wrap, LDPE (low density polyethylene) plastic bags, HDPE (high density polyethylene) jugs and UHMWPE (ultra high molecular weight polyethylene) bulletproof vests. Polymer chains, and correspondingly molecular weights, can often be extremely long, tens of thousands LLDPE to millions for UHMWPE. Density is also determined by the amount of branching of the polymer chains, and different densities are appropriate for different applications.19
Figure 2.5 : Ethylene C2H4 monomer, the basis for polyethylene
2.1.2 Polypropylene (PP)
Polypropylene (PP) (‐C3H6‐)(n), is formed by the polymerization of the propylene(C3H6) molecule (Figure 2.6) and is used in a wide assortment of applications. However, PP waste is hard to separate on the basis of physical characteristics, as there exists no large wastestreams such as PET bottles or HDPE jugs. Although PP is widely used for both film and rigid packaging, it is also used in more durable goods such as automotive interiors. 20
Figure 2.6 : Propylene (CH3) monomer
2.1.3 Polyvinyl Chloride (PVC)
PVC (‐C2H2Cl‐)n, is the polymer of the vinyl chloride monomer (Figure 2.7). PVC is most
19 Plastics Institute of America: Plastics Engineering Manufacturing and Data Handbook (2001) p177‐178. 20 ibid

14
notable for its high concentration of chlorine (40‐50%), which has the benefit of reducing the amount of hydrocarbon needed in its production. While PVC is only 5% of MSW waste, it is a contaminant to PET materials recycling, and can pose a threat even at low percentages. Pure PVC suffers from poor resistance to impact, and therefore commercial PVC has many additives, sometimes as much as 50% by weight.21 PVC is sometimes seen in synthetic leathers, for which plasticizers are added. PVC is widely used in water conduits and other construction applications. PVC accounts for 66% of water distribution piping and 75% of sanitary sewer piping22.
Figure 2.7: Vinyl chloride
2.2 The polyester family
2.2.1 PolyEthylene Terephthalate (PET) Polyethylene terephthalate (PET, Figures 2.8 & 2.9) has the molecular formula ‐(C10H8O4)n and is unique among the major polymers for its high oxygen content. The oxygen content makes the plastic impervious to gas diffusion, which is crucial in keeping carbonated soft drinks fresh.23 Also, as a member of the polyester family, PET is used extensively in the formation of synthetic fibers. PET is relatively well recycled, as it represents a very visible waste stream and, also, the bottle industry was pressured to institute a recycling infrastructure in the late 1980s24.
Figure 2.8 Terepthalic acid (left) and ethylene glycol (right)
Figure 2.9 : PET monomer –(‐C10H8O4‐)‐n
21 Recycling of PVC and Mixed Plastic Waste (1996) p8 22 "Pipe." Vinyl in Design. Web. 30 June 2010. <http://www.vinylbydesign.com/site/page.asp?CID=14&DID=15>. 23 Effect of Temperature and Other Factors on Plastics and Elastomers (2nd Edition) 24 “Plastics Industry, Under Pressure, Begins to Invest in Recycling “ <http://www.nytimes.com/1988/08/30/science/plastics‐industry‐under‐pressure‐begins‐to‐invest‐in‐recycling.html>

15
2.2.2 Polycarbonate (PC)
Polycarbonate plastics, C16H14O3 (Figure 2.10) are polyesters known for their excellent mechanical properties. Featuring high‐impact resistance, UV resistance, and flame retardancy as well as excellent electrical resistance, polycarbonates are used in a wide variety of materials. Polycarbonates do not have their own recycling identification code and therefore fall under the #7 “other” classification. Polycarbonates may be made a variety of ways, the most popular of which from Bisphenol‐A (BPA) feedstock.25 BPA use is highly controversial, and the FDA has recently decided to reopen an inquiry on the safety of BPAs. This is following an approval in 2008.26 Nalgene Outdoor Products, the preeminent manufacturer of reusable plastic water bottles, is transitioning from polycarbonate bottles to other plastics as well as metal alternatives in the wave of negative consumer perception of BPA.27
Figure 2.10 : Polycarbonate monomer –(‐C10H8O4‐)‐n
2.3 Styrenic Plastics
2.3.1 Polystyrene (PS) Polystyrene ‐(C6H5CH=CH2)‐(n) is formed by the polymerization of styrene, creating long carbon chains with every other carbon bonded to a phenyl group. As styrene is a low cost feedstock polystyrene is ubiquitous (Figure 2.11).
Figure 2.11: Styrene
The physical characteristics of PS are dependent on the tacticity i.e. internal structure of the end product. Depending on the catalyst, the PS may be "atactic" or "syndiotactic" (Fig 2.12). “Styrofoam” for example is the trademark of the Dow Corporation for their foamed atactic PS. Higher tacticity allows for better rigidity in the form of cheap plastics such as stirring and drinking straws, coffee cups including lids, takeout containers, and other similar
25 Effect of Temperature and Other Factors on Plastics and Elastomers (2nd Edition) 26 Broder, John M. "New E.P.A. Scrutiny Is Set for a Chemical in Plastics." The New York Times. 29 Mar. 2010. Web. 30 June 2010.
<http://www.nytimes.com/2010/03/30/science/earth/30epa.html> 27 "BPA and Nalgene." Welcome to NALGENE Outdoor. Thermo Fisher Scientific Inc, 2008. Web. 30 June 2010.
<http://www.nalgene‐outdoor.com/technical/bpaInfo.html>
16
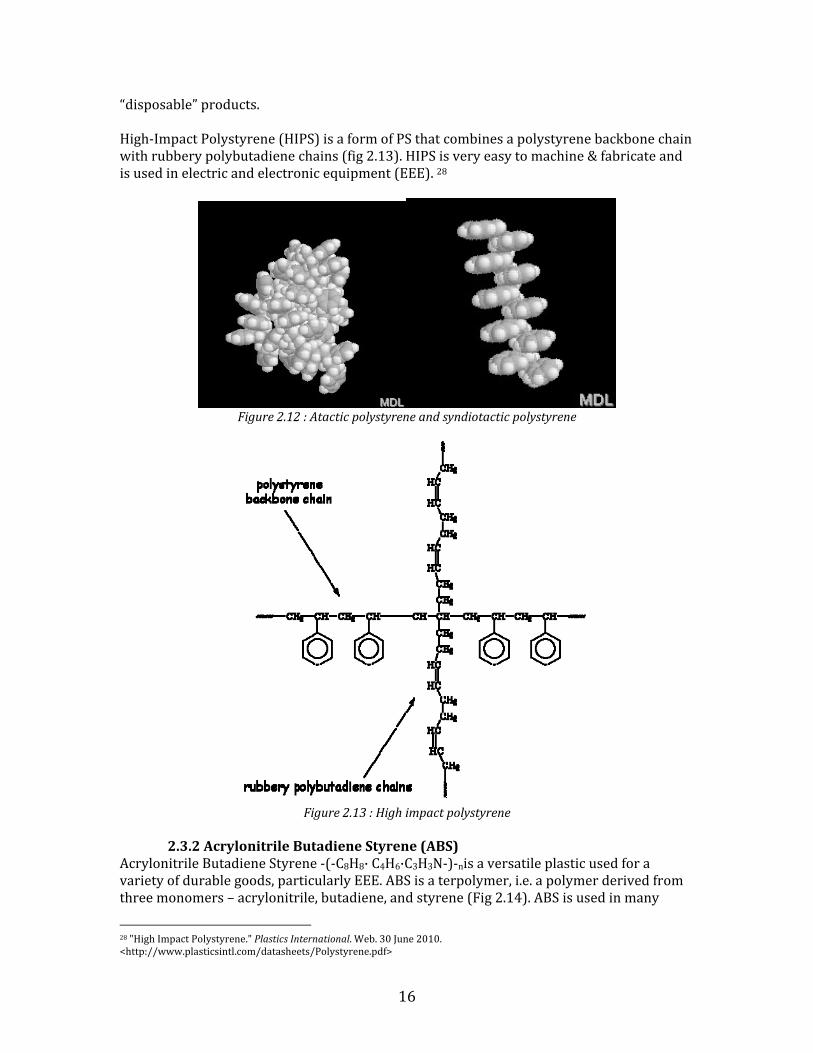
“disposable” products. High‐Impact Polystyrene (HIPS) is a form of PS that combines a polystyrene backbone chain with rubbery polybutadiene chains (fig 2.13). HIPS is very easy to machine & fabricate and is used in electric and electronic equipment (EEE). 28
Figure 2.12 : Atactic polystyrene and syndiotactic polystyrene
Figure 2.13 : High impact polystyrene
2.3.2 Acrylonitrile Butadiene Styrene (ABS)
Acrylonitrile Butadiene Styrene ‐(‐C8H8· C4H6·C3H3N‐)‐nis a versatile plastic used for a variety of durable goods, particularly EEE. ABS is a terpolymer, i.e. a polymer derived from three monomers – acrylonitrile, butadiene, and styrene (Fig 2.14). ABS is used in many
28 "High Impact Polystyrene." Plastics International. Web. 30 June 2010. <http://www.plasticsintl.com/datasheets/Polystyrene.pdf>

17
durable goods due to its superior mechanical properties. Combining adequate chemical, electrical and weathering characteristics, low water absorption, and resistance to hot‐and‐cold water cycles ABS is the primary choice for EEE plastics. Due to the acrylonitrile component, ABS plastics do contain some nitrogen.29
Figure 2.14 : Left to right : Acrylonitrile, Butadiene, and Styrene
2.4 Additional Elements & Compounds in Plastic Waste
2.4.1 Catalyst and Process Residue While the manufacturing of plastics is a catalytic process, the catalyst is generally not recovered due to the difficulties in recoverintg the minute quantities in which it exists. The modern catalysts in plastics production are the so‐called Ziegler/Natta catalysts that are based on titanium and magnesium organometallic compounds. Antimony trioxide is the most used catalyst for PET, due to its “adequate catalytic activity, colour and cost”. 30 Catalysts exist in minute quantities and are nearly non‐detectable in the ultimate analysis of manufactured resins. For example, the antimony concentration of commercially available resins was determined to be between 190 and 300 micrograms per gram. 31 The Almedan Research Center of IBM in Saudi Arabia and Stanford University recently announced a line of organic catalysts that will replace or augment the existing metal oxide/metal hydroxide catalysts for PET by organic N‐heterocyclic carbene (NHC) catalysts. These new catalysts better facilitate the depolymerization of PET for chemical recycling under mild conditions (typically 80oC or lower).32
2.4.2 Co‐Polymers, Elastomers, and Plasticizers While the mechanical properties of pure polymers are not always optimal, the addition of co‐polymers allow plastics manufacturing to reach the optimal combination of various mechanical benefits, including glass temperatures, melting points, impact resistance, plasticity i.e. flexibility, and a wide assortment of others. Additives regularly used in plastics, with maximum amount encountered in weight percent, include plasticizers (40%), fillers (40%), flame‐retardants (15%), impact resistance enhancers (10%), heat & UV stabilizers (5%), pigments, colorants & dyes (5%), foaming agents (2%) and antioxidants (1%). 33
29 Plastics Insitute of America: Plastics Engineering Manufacturing and Data Handbook (2001) p173.
30 Kereszes, Szilvia et al. “Leaching of antimony from polyethylene terephthalate (PET) bottles into mineral water”. Science of the Total Environment 407 (2009) 4731‐4735. 31 Duh B. “Effect of antimony catalyst on solid‐state polycondensation of poly(ethylene terephthalate)”. Polymer 2002;43:3147–54. 32 “Green Chemistry: Non‐metallic catalysts for polymerization and depolymerization” http://www.almaden.ibm.com/st/chemistry/ps/catalysts/Green/ 33 Buekens, A. “Introduction to Feedstock Recycling of Plastics.” p 4 of “Feedstock Recycling and Pyrolysis of Waste Plastics”

18
2.4.3 Halogenated Compounds & Flame Retardants
The addition of flame‐retardants poses a problem in the recycling of plastic wastes, particularly for waste electric and electronic equipment (WEEE). An estimated 11% of plastic materials in WEEE contain flame‐retardants. Brominated Flame Retardants (BFRs) are often used, and are likely to be added to about 10% of styrenic plastics, including HIPS, ABS, polystyrene (PS) and ABS/polycarbonate components. In the case of fire, some BFRs form highly toxic brominated dioxins and furans. Dioxins are also produced during the shredding and granulation of BFR of BFR plastics.34 These concerns have caused the European Union (EU) to limit polybrominated biphenyl (PBB) and polybrominated diphenyl ethers (PBDEs).35 Also, usage of PBDEs has been voluntarily phased out in the US.36 The emergence of halogen‐free substitutes for BFR compounds should eventually reduce the amount of bromine and other halogens in plastic wastes. While they are more expensive than their halogen‐containing counterparts, legislation and directives from both the US EPA and EU will restrict the usage of PBDE and PBBs and encourage their use.
2.4.4 Other Elements The char from the pyrolysis of three samples of WEEE was found to contain various elements including many metals. In one test, cathode ray tubes (CRT), waste refrigerators, and a mixed batch of WEEE were pyrolyzed resulting in char containing magnesium, aluminum, calcium, titanium, nickel, silicon, chlorine, and calcium as well as oxygen and carbon.37 2.5 Plastics Compared to Other MSW components The very high content of carbon and hydrogen and the small amount of oxygen in mixed plastic wastes is in contrast to the average molecular breakdown of MSW (C6H10O4) which contains much higher oxygen and, therefore, has a lower calorific value than plastic wastes. 2.6 Properties of plastic materials Important properties of plastics include their “glass temperature”, i.e. the temperature at which the polymer becomes brittle on cooling and soft on heating; their melting point is the temperature at which the polymer is transformed from a crystalline or semi‐crystalline structure to an amorphous solid. “Tacticity” relates to the crystalline structure, a property that is most important in the case of polystyrene., which is manufactured in various forms , such as atactic, by extrusion, isotactic, andsyndiotatic. Table 2.2 shows some of the characteristics of plastic materials. Table 2.2 – Properties of common thermoplastics38
Resin Structural State
Tensile Strength (MPa)
Flexural Strength (MPa)
Impact Strength (J/m) Density
Tg (DegC)
Tmax* (DegC)
edited by John Scheirs & Walter Kaminsky Wiley 2006. 34 Nnorom, Innocent Chidi and Oladele Osibanjo. “Sound managemenet of bromanted flame retarded (BFR) plastics from electronic wastes: State of the art and options in Nigeria”. Resources, Conservation and Recycling 52 (2008) 1362‐1372. 35 “Recast of the WEEE and RoHS Directives proposed in 2008” http://ec.europa.eu/environment/waste/weee/index_en.htm 36 “Polybrominated diphenylethers (PBDEs)“ http://www.epa.gov/oppt/pbde 37 Hall, William J. “Analysis of products from the pyrolysis of plastics recovered from the commercial scale recycling of waste electrical and electronic equipment.” Journal of Analytical and Applied Pyrolysis 79 (2007) 375‐386. 38 Bartholomew & Farrauto. “Fundamentals of Industrial Catalytic Processes”, p867

19
PET crystalline, stiff, inert
60 (48-72) 80-125 12-35
1.35-1.38 70-80 80-120
HDPE
linear (64-80% crystallinity)
28 (22-31) 7
250-1000
0.94-0.96 -90 120
PVC largely amourphous
46 (41-52) 70-100 20-1000
1.32-1.42 105 65-80
LDPE
branched (42-53% crystallinity) 14 (8-22) -
no break
0.91-0.93 -110 82-100
PP
isotactic (70% crystallinity)
34 (31-41) 40-55 25-100
0.90-0.92 -10 120-160
PS atactic (amorphous)
48 (36-52) 12-20
1.03-1.06 100 104
ABS
glassy copolymer with rubbery domains
38 (28-48) 75-90 200-600 1.03 - 71-93
PC
stiff molecular structure
68 (63-72) 95 650-850 1.2 150 120
Polyester with glass fiber (thermoset)
amorphous, glass-reinforced
110 (48-138) - 400-800 1.7-2.3 - 150-177
* - Tmax = maximum use temperature (no load) 2.7 Energy required to create plastics Franklin Associates performed a cradle‐to‐gate life‐cycle analysis (LCA) of plastic resins from 17 U.S. resin manufacturers to determine the energy requirements resulting from the production of various thermoplastics. 39 While the bulk of the energy embedded was the energy of the material resource, a large portion was dedicated to the process energy in creating the resins. (Table 2.3) Table 2.3 – Energy required to create plastic resins40
Energy of Material Resource (MJ/kg)
Process Energy (MJ/kg)
Transportation Energy (MJ/kg)
Total Energy (MJ/kg)
PET 37.9 29.7 1.54 69.14 HDPE 54.6 13.1 1.26 68.96 PVC 25 26.6 0.78 52.38 LDPE 55.6 17.2 1.28 74.08 PP 54.5 7.63 1.32 63.45 GPPS* 55 27.1 2.52 84.62 HIPS** 55.8 27.1 2.66 85.56 ABS 58.2 32.7 2.41 93.31
39 Franklin Associates. “Cradle‐to‐Gate Life Cycle Inventory of Nine Plastics Resins and Two Polyurethane Precursors.” Report prepared for The Plastics Divison of the American Chemistry Council (2007). 40 ibid
20
* - General Purpose PolyStyrene ** - High Impact PolyStyrene
In the course of creating the final product, additional energy is required. In the case of PET bottles, for example, an additional 20 MJ/kg is required to produce preforms and turn the resin into bottles.41 For polyester fibers, energy consumption can be much greater. For polymerization, spinning, and finishing, the energy required is estimated between 369 and 432 MJ/kg.42 In either case, the polyester retains the embedded material resource energy of roughly 38 MJ/kg, which may be conserved by recycling.
41 Gleick, P. H. and H. S. Cooley. “Energy implications of bottled water.” Environmental Research Letters 4 (2009) 014099. 42 Bartl, et al. “Recycling of Fibre Materials” Process Safety and Environmental Protection, 83 (B4): 351‐358.

21
3 Plastic Wastes 3.1 Productions of plastics The volume of plastics produced globally has increased from about five million tons in the fifties43 to 260 million tons in 2007, before dropping to 245 million tons in 2008 following the recent financial crisis.44 Table 3.1 shows the estimated production of plastics and the generation of plastic wastes in the U.S. Table 3.1 – Plastics produced and disposed annually in US tons per year
U.S. plastics produced annually 41 million tonsPlastics disposed annually in MSW 28 million tonsPlastics recycled annually in MSW 2 million tonsIn‐stock plastics (tons added annually) 20 million tons
2007 estimates of U.S. plastics consumption are roughly 41 million tons. 45 Boston College sociologist Juliet Schor focused on the rising trends in consumption. Between 1998 and 2005 the number of vacuum cleaners imported annually more than doubled. The number of toasters, ovens and coffeemakers tripled. Much of these plastics remain in‐stock, some in storage: despite the increase in home sizes in recent decades, there are now 2.3 billion square feet in self‐storage space. 46 3.2 Disposal of plastics Most plastic wastes (60%) end up in the MSW stream. 22% of plastic wastes originate from industrial wastes, and 3% in the form of waste electric and electronic equipment (WEEE)47 (Fig. 3.1). Numbers for New York City are similar: ‐‐ 57.1% plastic in DSNY waste, 6.8% in DSNY recycling, 31.9% in commercial waste, 4.1% in commercial recycling, 0.2% returned in bottle deposit.48 Also, an estimated 431,000 tons of plastics are disposed in US construction and demolition landfills.49 Other than PVC, all resins are predominantly disposed of in MSW.50 Unknown quantities of WEEE have been exported to the third world; for example 45% of the imports of waste plastic to Nigeria are from the US.51
43 Siddique, Rafat, et al. “Use of recycled plastic in concrete: A review.” Waste Management 28 (2008) 1835‐1852. 44 Johansson, J.E. Plastics – the compelling facts and figures. PlasticsEurope. 45 Kuczenski, B. & R. Geyer. “Materials flow analysis of polyethylene terephthalate in the US, 1996‐2007”. Resources, Conservation and Recycling 54 (2010) 1161‐1169. 46 Mooallem, John. "The Self‐Storage Self." The New York Times. 2 Sept. 2009. Web. 01 June 2010. <http://www.nytimes.com/2009/09/06/magazine/06self‐storage‐t.html> 47 Menad, N. et al. “Combustion of plastics contained in electric and electronic scrap.” Resources, Conservation, and Recycling 24 (1998) 65‐85. 48 2004 RW Beck ‐ Preliminary Waste Characterization Study 49 EPA 2009 – “Opportunities to Reduce Greenhouse Gas Emissions through Materials and Land Management Practices” Table 27. 50 Hegberg, Bruce et al. “Mixed Plastics Recycling Technology” (1992) p15. 51 Nnorom, Innocent Chidi and Oladele Osibanjo. “Sound management of brominated flame retarded (BFR) plastics from electronic wastes: State of the art and options in Nigeria”. Resources, Conservation and Recycling 52 (2008) 1362‐1372.

22
Figure 3.1. Plastic waste by sectors.
Much of the EU is moving away from landfilling plastics, either by recycling or combusting with energy recovery at WTE facilities. The countries most successful at avoiding landfilling wastes do a healthy mix of both. Europe as a whole recycles 21.3% of plastic waste via mechanical and feedstock recycling, and 30% of plastic waste is diverted to WTE facilities.52
Plastics are used in three categories of products, according to their respective lifespans: Containers and packaging, non‐durable goods, and durable goods. Containers and packaging make up the largest share of U.S. MSW, with 43%. Non‐durable goods represent 22% and durable goods represent 35% (Figure 3.2).
Figure 3.2: Plastics categories in MSW, by lifespan
52 Johansson, J.E. “Plastics – the compelling facts and figures.” 2009 PlasticsEurope.

23
There is no clear relationship between quantities of plastics produced and quantities of plastic wastes in the MSW stream, because of the lag between production and disposal that depends on the lifespan of each product. While containers and packaging waste generally have lifespans under a year, durable and non‐durable goods can have lifespans estimated at five years, for transportation applications, 10 years for furniture, housewares, electric and electronic products, and 50 years or more for building and construction materials.53 Therefore, production data for any given year may not be indicative of the quantity or composition of plastics in the waste. Therefore, production numbers should not be used to estimate plastic waste statistics, since many of the plastic products may still be in use. Increasingly, large amounts of plastics are held indefinitely following their useful life but prior to disposal. This can partially be traced to the dichotomy between plastics that are considered as “disposable” versus “valuable”54. This is particularly so for WEEE; over 70% of retired consumer electronic devices (CEDs) are kept in storage, typically for as many as 3‐5 years.55 In a 2009 study by ABI Research, only 5% of respondents were willing to send in their old mobile phones, without any monetary or other incentive, such as cash, store credit, or tax deductions.56 Exact estimates of plastic wastes vary. Results from the BioCycle/Columbia University bi‐annual survey “The State of Garbage in America” surveys each state for landfilling and com bustion data. In 2006, an estimated 266 million tons were landfilled and about 28 million tons, i.e. 10% of the post‐recycling stream were combusted. These numbers are reported with near certainty since both landfills and WTE facilities require permits. Recycling and composting numbers are not as certain but were estimated at a combined 118 million tons, for a total of 413 million tons of MSW generated in 2008.57 Estimates from the EPA for quantities of MSW are significantly lower. The 2007 estimates place the size of the US MSW pie at a total of 254.6 million tons; 170 million of these were landfilled and 84 million tons were recovered in recycling and composting. Quantities of waste combusted in WTE were not estimated.58 The differing figures between the two reports can be traced to different methodologies. The BioCycle/EEC report relied on direct input from each state for accurate numbers, while the EPA report employs a mass balance approach referred to as a “materials flow methodology” in which waste quantities are estimated by industry associations, key businesses, and similar industry sources. Clearly this methodology is lacking as it only accounts for 60% of the MSW. However, EPA data was used for projections on plastics in MSW on the national scale as it estimates percentage breakdown of MSW by materials.59 Resin use varies with the expected lifespan of an item. Durable goods are much more likely to be produced from a resin other than the six major ones. This is due to a few factors,
53 Alter, Henry. “The recovery of plastics from waste with reference to froth flotation.” Resources, Conservation, & Recycling 43 (2005) 119‐132. 54 Alter, Harvey. The Origins of Municipal Solid Waste II. Policy Options for Plastics Waste Management. Waste Management & Research (1993) 11, 319‐332. 55 Kang, Hai‐Yong and Julie M. Shoenung. “Electronic waste recycling: A review of U.S. infrastructure and technology options”. 56 "Green" Handsets." ABI Research ‐ Technology Market Research in Wireless Cellular Automotive RFID Security IP Telephony Semiconductor Energy. 2010. Web. 30 June 2010. <http://www.abiresearch.com/research/1004703> 57 Arsova, Ljupka, Rob van Haaren, et al. “The State of Garbage of America”. BioCycle December 2008, Vol. 49, No. 12, p. 22 58 EPA, "Municipal Solid Waste Generation, Recycling, and Disposal in the United States", 2008 data. 59 EPA “MSW Characterization Methodology”.

24
including less pressure for manufacturers to worry about the end of life of durable goods as well as the tendency to pick a resin with superior engineering properties..
Table 3.2 : U.S. plastic wastes disposed in MSW by resin in 2008 (in thousands of U.S. tons.)
Resin Durable Goods
Non Durable Goods
Containers & Packaging
TOTAL
PET 610 240 2890 3740
HDPE 780 680 3890 5350
PVC 630 660 370 1660
LL/LDPE 910 2130 2840 5880
PP 1400 810 1980 4190
PS 900 1360 360 2620
Other 5290 640 680 6610
10520 6520 13010 30050
3.3 Specific Streams of Plastic Wastes
3.3.1 PET Bottles & HDPE Jugs
PET & HDPE bottles represent the best‐managed classification of plastics wastes. Almost exclusively composed of PET and HDPE, the recycling of bottles and jugs are nearly the only plastics recycling currently performed. Over 96% of the plastic bottles and jugs are made of PET and HDPE – . As the majority of all curbside recycling programs accept PET and HDPE (and often little beyond this), the bulk of plastic recycling is constrained to these two resins. However, there is a wide array of applications for PET and HDPE beyond bottles or jugs. However, many recycling centers and programs do not accept these other forms of PET/HDPE because of sorting problems. The American Chemistry Council (ACC) and the Association of Postconsumer Plastic Recyclers report that recycling of plastic bottles reached a record high 2,410 million pounds (1.2 million U.S. tons) in 2008.60 As compared to EPA estimates of total plastics recycled, PET bottles represent 98.7% of all PET recycled, HDPE bottles 82% of all HDPE recycled, and PP bottles 15% of all PP recycled. (Table 3.3)
Table 3.3 – Bottle recycling as percentage of total resin recycling
Resin Bottles recycled (thousands of tons) [ACC data]
Total recycling of resin (thousands of tons) [EPA Estimates]
Bottle recycling as percentage of total resin recycling
PET 721 730 98.7% HDPE 469 579 82% PP 10.6 70 15%
3.3.2 Plastic bags and film
Film applications are a sink of much plastic that is neither recycled nor used for energy purposes. Plastic film is a category that includes plastic bags, shrink wrap, etc., and is defined as plastics sold in a thickness of 10 mil (0.125 centimeters) or less. Many different
60 United States National Post‐Consumer Plastics Bottle Recycling Report 2008. Web. 30 June 2010 http://www.americanchemistry.com/s_plastics/sec_content.asp?CID=1593&DID=10383

25
resins of plastics are used in film applications due to different properties in gas permeability; for example LDPE film acts as a gas barrier, while PVC film is gas permeable.61 Annually, the numbers for plastic bag consumption are staggering – an estimated 100 billion in the US.62 Global consumption rate of plastic bags is now estimated at 500 billion plastic bags annually. 63 Plastic film is versatile, coming in many more versions than simply single resins. Multi‐resin, multi‐layer packaging is used for plastics such as bubble‐wrap. Many junk‐food wrappers are composed of polypropylene bags coated with micro‐thin deposits of aluminum and are referred to as “metallized” polypropylene. These multi‐layered films are not considered to be recyclable, although advancements in pyrolysis promise the ability to chemically recycle plastics with metal recovery. According to the American Chemistry Council, the estimated recovery of plastic film in 2007 was 415 thousand U.S., largely recovered from commercial sources (64%). Only 3% of this amount was recovered through curbside pickup.64 Table 3.4: Post‐consumer recycled of plastic film in the U.S.(in thousands of U.S. tons)
Year Total
Recovered Total
Exported Recycled in US or Canada
2005 326.2 91.9 234.4
2006 234.4 110.5 295.5
2007 415.1 231.3 183.8
3.3.3 Single‐use food service
Around 70% of the total overall consumer packaging consumption is used for food and beverage packaging.65 The wide use of plastics in single‐use food service, including but not limited to plastic plates and utensils, stirring straws, plastic coffee tops; as well as the usage of plastics in food packaging and transport are largely responsible for the amount of food residue on plastic waste. This is prevalent in tactic polystyrene (e.g. plates & utensils), and PET jugs & bottles. A study by Alter investigated the statistical relationship between the fraction of food residues and packaging residue in MSW. He found the statistical relation is linear with a high statistical significance. This 1990 study found a linear relationship between these two quantities with a “waste reduction coefficient” to be ‐2.2, meaning a unit weight of plastics packaging has a high statistical probability of being associated with 2.2 unit weights of food wastes in the MSW. 66
3.3.4 Waste Electric & Electronic Equipment
61 Understanding Plastic Film : Its Uses, Benefits, and Waste Management Options, American Plastics Council, December 1996. http://www.americanchemistry.com/s_plastics/bin.asp?CID=1211&DID=4603&DOC=FILE.PDF 62 West, Larry. "Reusable Bags ‐ Paper, Plastic, or Something Better?" Environmental Issues ‐ News and Information about the Environment. Web. 30 June 2010. <http://environment.about.com/od/recycling/a/reusablebags.htm 63 "The Numbers …Believe It or Not." Eco‐friendly Reusable Bags, plus Facts & News on Plastic Bag Issue. Web. 30 June 2010.
<http://www.reusablebags.com/facts.php?id=4> 64 2007 National Post‐Consumer Recycled Plastic Bag & Film Report, American Chemistry Council. 65 Muncke, Jane.“Exposure to endocrine disrupting compounds via the food chain: Is packaging a relevant source?” Science of the Total Environment (2009). 66 Alter, Harvey. The Origins of Municipal Solid Waste II. Policy Options for Plastics Waste Management. Waste Management & Research (1993) 11, 319‐332.

26
Electronic waste is presently an obvious environmental problem and the infrastructure to manage it is still not developed. An estimated 11% of plastic materials in WEEE contain flame retardants. The amount of plastics in electronics varies substantially by product and ranges from a few percentage points to more than half the material composition. Electronic toys may contain more than 70% plastic. 67The United Nations estimates that up to 50 million tons of electronic waste are landfilled globally each year.68 There are local efforts to collect electronic waste but the effect is relatively small. For example, the Lower East Side Ecology Center (LESEC) in New York City holds regular e‐waste collection drives in Union Square (NYC). Since 2003, LESEC has collected over 500 tons of WEEE.69
3.3.5 Agricultural Film An estimated 350,000 tons per year of film are used in agricultural applications in the U.S.70 The main challenges for recycling of this material are cleaning to remove soil/small stones/water and efficient transport for re‐using. However, it is possible and one legally‐enforced program in Norway was reported to recycle 8000 U.S. tons.71 In the U.S. , agricultural plastics are rarely disposed correctly. Current disposal methods include dumping at a solid waste transfer station, left in the fields, plowed into the ground, or burned in an open fire which can be a source of dioxin emissions. New York State has created the "Recycling Ag Plastics Project" (RAPP) partnership headquartered at Cornell University.72
67 Nnorom, Innocent Chidi and Oladele Osibanjo. “Sound managemenet of bromanted flame retarded (BFR) plastics from electronic wastes: State of the art and options in Nigeria”. Resources, Conservation and Recycling 52 (2008) 1362‐1372. 68 "How Discarded Computers Are Poisoning Africa's Kids." ABCNews.com ‐ Breaking News, Politics, Online News, World News, Feature Stories, Celebrity Interviews and More ‐ ABC News. 7 Dec. 2009. Web. 01 July 2010. <http://abcnews.go.com/print?id=9266722> 69 Wagner, Tara L. "E‐Waste Recycling Comes to Union Square ‐ NY1." Top Stories ‐ ‐ NY1.com. 4 Jan. 2010. Web. 01 June 2010. <http://www.ny1.com/5‐manhattan‐news‐content/top_stories/111396/e‐waste‐recycling‐comes‐to‐union‐square> 70 "Barrier Films Find Increasing Application in Agriculture." Plastics Product Bags Used Machines Technology Jobs Recycled Polymers, India. 2003. Web. 30 June 2010. <http://www.plastemart.com/upload/Literature/Barrier‐films‐increasing‐application‐in‐agriculture.asp?LiteratureID=1283> 71 Johansson, J.E. Plastics – the compelling facts and figures. PlasticsEurope. 72 RAPP Summary. Life Cycle Stewardship of Agricultural Plastics

27
4 Detailed analysis of fate of plastic wastes collected ‐ NYC Analysis In order to follow the plastics waste stream from curbside to remanufacture, the author analyzed the three steps involved in this process. First, the Department of Sanitation of New York (DSNY) performs curbside collection of recyclables. Next, this single‐stream of recyclables is shipped to a Waste Management‐owned MRF ( St. Charles Street, Newark,, New Jersey) where plastics are separated from other recyclables and shipped in the form of bales to Raleigh Plastics (also owned by Waste Management Inc.) in North Carolina. This Plastics Recycling Facility (PRF) receives mixed plastics from over one hundred MRFs and separates them into plastic flakes of different grades that are sold to re‐manufacturers. The residues are either landfilled or sent to WTE facilities. New York City’s recycling program was started by DSNY in November 1986.73 In July 2002, collection of glass and plastic wastes was discontinued because an estimated 85% of the materials collected were not marketable and ended up in landfills. . Collection of glass and plastics was started again in July 2003 but only plastic bottles and jugs are being collected for recycling. As of January 2009 DSNY and Sims Municipal Recycling of New York launched a 23‐year agreement for the processing of recyclables. 4.1 NYC Preliminary Waste Characterization Study In a 2004 study commissioned by the Department of Sanitation of New York (DSNY), R.W. Beck carried out a Preliminary Waste Characterization Study (PWCS) to obtain a snapshot of the city’s waste streams. Two hundred waste samples were collected from across the city, each weighing about 200‐250 lbs (up to 100 kilograms). Waste was separated into nine material groups, and 87 material categories. Plastics comprised a total of 14.2% of NYC waste, which was less than the national average of 16.1% reported in 2005 by EPA. The PWCS study breaks down plastic wastes into 21 categories, primarily based on physical characteristics.74 (Table 4.1) Each category was denoted with a recycling indicator, “R”, that indicates that the material category is currently recyclable under DSNY’s current curbside recycling plan, “PR” indicates that Beck deemed the plastics “potentially recyclable”, and “NR” indicates not‐recyclable under DSNY’s current curbside recycling. The recyclable category simply includes PET and HDPE jugs and bottles. Any enumerated rigid plastic as well as plastic bags and film were considered potentially recyclable, including PVC. Single‐use food service, single‐use cameras, and non‐classifiable plastics were considered non‐recyclable. These three categories constituted R=1.7%, PR= 10%, and NR =2.5% of the total MSW stream. The Beck survey produced a number of insights. DSNY’s policy to only accept PET and HDPE bottles and jugs for recycling only addresses 16.5% of the plastics in the wastestream. The plastics portion of the mixed metal/glass/plastic (MGP) single stream recycling is highly contaminated, with only 52.6% of the plastics fulfilling the recyclable criteria. This results in nearly half of the plastics collected being landfilled. If NYC were to accept the plastics Beck deemed "potentially recyclable" as well, this would address 82.2% of plastics disposed. Residue would also drop dramatically, as 82.4% of the
73 "DSNY ‐ Public Information ‐ Annual Reports." NYC.gov. 2010. Web. 30 June 2010. <http://www.nyc.gov/html/dsny/html/Pub_Info/annual.shtml> 74 Beck, R. W. . Preliminary Waste Characterization Study. Final Report prepared for the New York City Department of Sanitation, September 2004.

28
plastics currently collected are either “R” or “PR”. Residue would likely decrease further as more potentially recyclable plastics are properly diverted towards the MGP recycling. Containers and packaging comprised the majority of waste, with durable and non‐durable goods presumably being lumped into “other plastics” – 12.3% of the waste stream.
Table 4.1 : Distribution of New York City plastic wastes75
Recycling Indicator
% of Refuse % of PaperRecycling
% in mixed MGP Recycling
Overall %
Recyclable Plastic 10.7 0.1 5.7 16.5
Potentially Recyclable Plastic
61.5 0.9 3.3 65.6
Non‐Recyclable Plastic
15.6 0.2 1.9 17.8
87.9 1.2 10.9 100.0
75 ibid

29
Table 4.2 : Distribution of New York City plastic wastes76
Plastics Category % of Refuse
% of total
% of Paper
Recycling
% of total
% of Mixed
Recycling
% of total
Recycling Indicator
Aggregate Refuse & Recycled
% of total plastic wastes
PET Bottles (Dep)
0.33% 0.27% 0.01% 0.00% 1.21% 0.08%
R 0.36% 2.7%
PET Bottles (Non‐dep)
0.64% 0.53% 0.05% 0.01% 4.73% 0.32%
R 0.86% 6.4%
HDPE Bottles (Natural)
0.31% 0.26% 0.02% 0.00% 2.69% 0.18%
R 0.44% 3.3%
HDPE Bottles (Colored)
0.45% 0.37% 0.03% 0.00% 2.68% 0.18%
R 0.56% 4.2%
PET Tubs/Trays 0.03% 0.02% 0.00% 0.00% 0 0.00% PR 0.02% 0.1% HDPE Tubs/Trays
0.08% 0.07% 0.00% 0.00% 0.11% 0.01%
PR 0.07% 0.5%
PVC Containers 0.01% 0.01% 0.00% 0.00% 0.06% 0.00% PR 0.02% 0.1% LDPE Containers 0.01% 0.01% 0.00% 0.00% 0.01% 0.00% PR 0.01% 0.1% PP Containers 0.22% 0.18% 0.00% 0.00% 0.66% 0.04% PR 0.23% 1.7% Other Recyclable Containers
0.07% 0.06% 0.01% 0.00% 0.17% 0.01%
PR 0.07% 0.5%
PVC (Other) 0.07% 0.06% 0.00% 0.00% 0.08% 0.01% NR 0.06% 0.4% PS (Rigid) 0.16% 0.13% 0.00% 0.00% 0.40% 0.03% PR 0.16% 1.2% PS (Expanded) 0.69% 0.57% 0.05% 0.01% 0.11% 0.01% PR 0.59% 4.4% Other Rigid Packaging
0.61% 0.51% 0.01% 0.00% 1.53% 0.10%
PR 0.61% 4.5%
Plastic Bags 2.79% 2.32% 0.22% 0.02% 0.76% 0.05% PR 2.39% 17.8% Other Film 5.21% 4.33% 0.86% 0.09% 2.46% 0.17% PR 4.58% 34.2% Plastic Crates & Soda Bottle Carriers
0.06%
0.05% 0.00% 0.00% 0.13% 0.01%
PR
0.06% 0.4% Single‐Use Food Svc
0.78% 0.65% 0.01% 0.00% 0.16% 0.01%
NR 0.66% 4.9%
Single Use Cameras
0% 0.00% 0.00% 0.00% 0 0.00%
NR 0% 0.0%
Disposable Razors
0.01% 0.01% 0.00% 0.00% 0.07% 0.00%
NR 0.01% 0.1%
Other Plastics 1.67% 1.39% 0.31% 0.03% 3.49% 0.24% NR 1.65% 12.3% Total Plastics 14.20% 11.79% 1.58% 0.16% 21.51% 1.46% 13.41% 100.0%
76 ibid

30
4.2 Waste Management – St. Charles Materials Recycling Facility Residues It is obvious from previous discussion that not all plastic wastes that are source‐separated by citizens are actually recycled. Statistics provided by WM‐RA for their St. Charles’ Street MRF in Newark, NJ, over a three‐ month period in 2009 indicate that an estimated 10.5% of inbound materials to the MRF is non‐recyclable and is disposed as residue (Table 3). It has been estimated that of the roughly 1300 tons landfilled or sent to WTE facilities each month, rigid plastics comprise 8%, bottle‐grade plastics at 2% and plastic film 3%. 77 Table 4.3. Inbound and outbound statistics for St. Charles MRF, measured in tons. August September October 3 Month total
Inbound 11,920.97 13,381.68 14840.41 40,143.06
Outbound 1‐7 1,740.00 1765.02 1739.93 5,244.95 13.1%
Outbound Other plastic 18.06 18.06 0.0%
Residue Baled 1,192.99 1415.45 1568.87 4,177.31 10.5%
Residue Loose 35.50 16.76 46.77 99.03 0.2%
Total Outbound 11,785.93 13255.66 14887.16 39,928.75
Outbound/Inbound 98.9% 99.1% 100.3% 99.5%
4.3 Analysis of Raleigh Plastics Recycle America is the recycling division of Waste Management, Inc. It owns and operates a plastics recycling plant that receives the plastics stream from several Material Recovery Facilities (MRF), such as the WMI MRF plant in Newark, NJ that was also visited by the author. The Raleigh plant is designed to process post‐consumer plastic containers up to 3 gallons in size. It is located in Raleigh, NC, adjacent to a materials recycling facility (MRF) and an old cardboard container (OCC) recycling plant, also owned by WM‐RA. The 60,000 ft2 facility opened in 2003, has a nominal capacity of 125 tons per day and its capital cost was $6 million. The facility serves as a key step between various material recycling facilities (MRFs) and plastic manufacturers and separates mixed plastic bales into various products that are used as feedstock by plastics manufacturing plants. This facility was visited by the author on June 18, 2009. The visit was arranged between Mr. Richard Abramowitz, Public Affairs Manager of WMI‐RA and Mr. Tim Hunter, Plant Manager of Raleigh Plastics. The visit was hosted by Mr. Hunter and Mr. Tommy Higgins, Operations Supervisor at Raleigh Plastics.
4.3.1 Feedstock and products Raleigh Plastics receives bales of mixed waste plastics from roughly 150 MRFs nationwide, the majority of which are Waste Management owned & operated. Most of these facilities are on the east coast, but plastics are imported from as far away as Bismarck, North Dakota. The end products are sold to a variety of customers, including Coca‐Cola, Nestle, and Pepsi for bottle‐to‐bottle recycling, and to carpet and plastic fiber manufacturers. Roughly 30% of the lower quality material is shipped overseas.
77 Angelini, Enrique. "Plastic Wastes & Residue at St. Charles." Message to the author. 30 Sept. 2009. E‐mail.

31
Figure 4.1. Plastic bales received at plant in 2008 (x‐axis in month of the year)
Bales are purchased from these 150 MRFs at a market rate for the four‐week moving average bale price. Previously, Raleigh plastics used to pay on the basis of product yield but this was too cumbersome a process considering that about 10 million pounds of plastics are debaled each month (Figure 4.1). Nevertheless, they maintain meticulous data on bale composition. For example, the Newark facility, visited by EEC in May 2009, provides a typical bale containing ~68% saleable product to ~32% residue ratio (Figure 4.2). From the data in Figure 3, it is estimated that in 2008 the plant received 59,350 short tons of feed and produced 42,450 short tons of product.
Figure 4.2 – Typical composition of bales received at plant from NJ MRF
While the facility ostensibly accepts all resins 1‐7 for recycling, economics dictate that only resins 1 (PET), 2 (HDPE) and 5 (PP) are recovered for recycling purposes. PET is separated into clear PET, green PET; HDPE is separated into natural HDPE and mixed HDPE. These main plastic products make up 95% of their end product, fine plastic particles (“fines”) and assorted plastics that are swept up off the manufacturing floor (“floor”) are collected and sold on the recycling market. Also, large quantities of aluminum mixed into the plastic bales

32
are recovered and sold – 120,000 to 130,000 lbs per month. Table 4.4 shows the breakdown of products by weight in 2008.
Table 4.4. Breakdown of 2008 saleable products by weight
Material Percentage Thousand tons
PET Clear 42.6% 18.1
PET Green 5.1% 2.2
HDPE‐Natural 21.4% 9.1
HDPE‐Mixed 22.3% 9.5
Aluminum 1.4% 0.6
Polypropylene 4.1% 1.7
Fines 2.5% 1.1
Floor 0.5% 0.2
Total products 100% 42.5
4.3.2 Residue
Waste Management performed an internal characterization of their waste in order to categorize the residue of Raleigh Plastics. This “trash test” indicate that 12.6% of waste of the 595 lb sample was considered “good material” – recyclable plastics that could not be recovered during the sorting operation. About 9.2% of this is PET. Paper constitutes a large portion of the waste, at 37.0%. The remaining 50.4% of the garbage was considered “trash” and was not further analyzed. Table 4.5 shows the results of this test.
Table 4.5. Results of WM residue composition test April 21, 2009
Material Weight (pounds)
Share (%)
Paper 220 37.0%
Trash w/o Paper 300 50.4%
Good Material 75 12.6%
PET 55 9.2%
HDPE 8 1.3%
PP 8 1.3%
Aluminum 4 0.7% Total Weight 595 pounds
In a February 2010 trash test of Raleigh Plastic’s waste stream performed by the author, it was estimated that only 6.5% of the residue was “good material” i.e. PET/HDPE/PP. Overall 22% of the residue was plastic (Table 4.6). The remainder was largely paper fiber (65%), as well as other miscellaneous materials (12%).
Table 4.6 Characterization of Raleigh Plastics residue (February 2010) by the author
Material Subcategory Weight (grams)
Share (%)
Plastic PET bottles 61 2.54
“ HDPE 35 1.46
“ PP (large) 12 0.50
“ PP (small) 18 0.75
“ PS (rigid) 38 1.59
“ PS (foam) 30 1.25

33
“ Other Rigid 173 7.22
“ Bags 35 1.46
“ Film 125 5.21
Plastic Total 527 21.99
Paper Fiber Paper 498 20.78
“ “ Paperboard/OCC 471 19.65
“ “ Milk & Juice Cartons 568 23.70
“ “ Aluminized paper 34 1.42
Wood Wood 133 5.55
Miscellaneous Shredded paper, plastic film, glass 166 6.93
Total Non‐Plastics Total 1870 78.01
Total Residue Total 2397 100%
Figure 4.3. Graphical representation of composition of Raleigh Plastics residue
The final residue of Raleigh Plastics is landfilled at a nearby landfill at a cost of $55 per ton. This works out to be nearly a million dollar a year expense considering 31% residue of the 10 million pounds debaled monthly. 4.4 Overall residue of NYC curbside recycling of plastics Consideration of the relatively low quality of plastic "recyclables" collected by DSNY (52% usable, 48% residue), the residue of the local MRF (90% usable, 10% residue), and the residue from the baled plastics entering the Raleigh plastics recycling plant (67% plastic, 31% residue) indicates that the overall recovery from the plastic wastes collected by DSNY is about 34%. However, this rate of actual recycling is still much better than the actual recovery of 15% from plastics that were collected by the City prior to the interruption of the plastics recycling program.

34
5 Source reduction of plastics In the expanded hierarchy of waste management (Fig 5.1), the most favored solution to address plastic wastes is waste reduction. This can be as simple as smarter packaging that reduces the use of plastics, reduction of particular plastics that may pose health concerns, or the replacement of particular plastics with compostable bio‐plastic alternatives.
Figure 5.1 ‐ Expanded hierarchy of waste management78
However, plastics themselves often are the result of reduction & mitigation of heavier traditional materials. “Generally speaking, when a plastic item is discarded, an item of another and often heavier material is not.” Trends in packaging materials have indicated a rise by wt% in lighter materials including plastic, paper and aluminum and a reduction in heavier materials including glass and steel. 79 5.1 Potential benefits of source reduction A September 2009 study by the EPA investigated the potential for greenhouse gas (GHG) reduction by various materials management practices. The reduction of plastics used for containers and packaging (estimated at 13.8 million tons in 2006) was investigated to determine the amount of GHG reduction. The emissions are estimated – the emission factors of HDPE, LDPE, and PET were averaged for the category. A 50% source reduction would lead to a savings of 14.9 million MTCO2E, while a 25% source reduction would lead to a savings of 7.4 million MTCO2E (Table 5.1). Increasing the recycling rates of plastics in containers and packaging to 50% would lead to an estimated GHG reduction of 11 million MTCO2E.80
78 Kaufman, S.M.and N.J. Themelis, “Using A Direct Method to Characterize and Measure Flows of Municipal Solid Waste in the United States”; J. Air & Waste Management. Assoc. 2009, 59: 1386‐1390. 79 Alter, Harvey. The Origins of Municipal Solid Waste II. Policy Options for Plastics Waste Management. Waste Management & Research (1993) 11, 319‐332. 80 EPA, “Opportunities to Reduce Greenhouse Gas Emissions through Materials and Land Management Practices”. September 2009.

35
Table 5.1 : Estimations of GHG reductions by source reduction of containers & packaging. (in thousand U.S. tons)81
Category Weight
Generated Annually
Theoretical % Source
Reduction
Theoretical Amount Reduced
GHG Reduction Assuming Current Mix of Inputs (GTCO2E),
excluding Forest Sequestration
Plastics Containers & Packaging 14,230 50% 7,115 ‐14,856 Total Containers and Packaging 79,620 50% 39,810 ‐40,821 Plastics Containers & Packaging 14,230 25% 3,558 ‐7,428 Total Containers and Packaging 79,620 25% 19,905 ‐20,411
5.2 Legislative attempts Generally, bans on plastics have solely attempted to address specific types of packaging materials, but not all. Bans do not reduce the volume of the waste stream, but their severity forces industries to adapt. Importantly, ill‐conceived bans that arbitrarily reduce engineering choices of packaging materials may cause more harm than good. 82 Plastic bags in particular are often targeted by legislative attempts to reduce them as they are a visible source of pollution. Legislative attempts have varied – fees in Washington, D.C. and China, voluntary agreements in Australia, prohibition in Zanzibar and San Francisco, etc..83 In 2009 Mexico City outlawed non‐biodegradable bags.84 Hard lobbying by the plastics industry85 including spending $1.4 million86 convinced the citizens of Seattle to reject a proposed a twenty‐cent bag fee.87 Results of such actions can be fruitful in reducing demand. The results of a 5‐cent bag tax in Washington, D.C. encouraged residents to sharply reduce their usage of plastic bags. It was reported that after consuming 22.5 million bags per month in 2009, only 3.3 million bags were used in January 2010 – a reduction of more than 85%.88 Similarly, the first year of plastic bag restrictions in China reduced demand by two thirds and saved an estimated 1.6 million tons of oil.89 Still, regulative focus does not have much of a potential for weight or volume reductions in landfills as plastic bags constitute a small percentage and are malleable and fill voids in landfills. They exist mostly to counter a very visible pollution problem. One Israeli study
81 ibid 82 Alter, Harvey. The Origins of Municipal Solid Waste II. Policy Options for Plastics Waste Management. Waste Management & Research (1993) 11, 319‐332. 83 Ayalon, Ofira, et al. “Reduction of plastic carrier bag use: An analysis of alternatives in Israel.” Waste Management 29 (2009) 2025‐2032. 84 CNN NewsWire. “No more plastic bags for Mexico City.” August 19, 2009. http://cnnwire.blogs.cnn.com/2009/08/19/no‐more‐plastic‐bags‐for‐mexico‐city/ 85"Seattle Mayor's Proposal Counters National Recycling Trend Bag Tax, Product Ban Risk the Environment." AmericanChemistry. 4 Apr. 2008. Web. 30 June 2010. <http://www.americanchemistry.com/s_acc/sec_news_article.asp?CID=206&DID=7208>. 86 Brunner, Jim. "Bag Fee Opponents Report $1.4 Million in Contributions." The Seattle Times. 28 July 2009. Web. 30 June 2010. <http://seattletimes.nwsource.com/html/politicsnorthwest/2009552839_bag_fee_opponents_report_14_mi.html>. 87 “Seattle Rejects Its Plastic Bag Tax” http://www.businessinsider.com/seattle‐rejects‐its‐plastic‐bag‐tax‐2009‐8 88 Craig, Tim. "D.C. Wire ‐ Bag Tax Raises $150,000, but Far Fewer Bags Used." Washington Post. 29 Mar. 2010. Web. 30 June 2010. <http://voices.washingtonpost.com/dc/2010/03/bag_tax_raises_150000_but_far.html> 89 Watts, John. "China Plastic Bag Ban 'has Saved 1.6m Tonnes of Oil' | Environment | Guardian.co.uk." Guardian.co.uk. 22 May 2009. Web. 30 June 2010. <http://www.guardian.co.uk/environment/2009/may/22/china‐plastic‐bags‐ban‐success>

36
noted bags constitute 5‐10% of litter in the city of Haifa and 15‐20% of all accumulated litter at unofficial beaches. The survey showed 25% of bags in Israel were immediately disposed, 52% were used as trash bags, and 23% reused for another purpose.90 5.3 Manufacturer reduction in packaging With short lifespans and high volumes, packaging lends itself to improved solutions. Improvements in manufacturing have led to the ability to use less plastic to package the same materials without compromise. While the total amount of plastic waste has been increasing, the amount of plastic used in many types of packaging has decreased. Over the years, PET soft drink bottles have evolved to use less plastic, and have shed their HDPE plastic base‐cup. Poland Spring PET water bottles proudly proclaim how they contain 33% less plastic than previously to contain the same amount of water91, Sandisk memory card packaging is advertised "now with less plastic", all for the same goal of source reduction of plastics. In 1989, McDonald's addressed their excessive polystyrene packaging for hamburgers and pledged to recycle the estimated 2 tons of PS waste generated by each franchise restaurant annually.92 Just a year later, they found it more amenable to replace the excessive polystyrene packaging by using paper and paperboard. 93 Small percentage reductions by large volume consumers can result in large amounts of plastics being saved. In 2009 Coca‐Cola’s classic contour bottle was reduced in weight in Latin America and Europe by 7.5%, which will save 16,000 metric tons of plastic annually. 94 More creative methods of source reduction have emerged. Recent research by Mazda Motors has found a way to reduce plastic use by up to 30% by the addition of a supercritical gas (nitrogen or carbon dioxide), with associated reduction in vehicle weights.95 5.4 Designing for recyclability The U.K. based Recoup issued a packaging handbook titled “Recyclability by Design”96, that encourages manufacturers of plastics packaging to design with recyclability in mind. For example, the use of unpigmented polymers is recommended in order to not interfere with optical sorting methods. Additives that alter the densities of resins are similarly discouraged. Combining materials that are easily separable is recommended. For example, PP film labels on PET rigid bottles are recommended over paper labels since paper tends to stick to the bottles. Techniques such as these make it easier to identify waste plastics through automated methods.
90 Ayalon, Ofira, et al. “Reduction of plastic carrier bag use: An analysis of alternatives in Israel.” Waste Management 29 (2009) 2025‐2032. 91 "A Better Bottle for You and the Environment." Poland Spring ‐ Water Delivery, Spring Water & Bottled Water Delivery | Nestle©. 2008. Web. 30 June 2010. <http://www.polandspring.com/DoingOurPart/EcoShapeBottle.aspx> 92 Holusha, John. "McDonald's Plastic Recycling Plan ‐ NYTimes.com." The New York Times. 27 Oct. 1989. Web. 30 June 2010. <http://www.nytimes.com/1989/10/27/business/mcdonald‐s‐plastic‐recycling‐plan.html> 93 Holusha, John. "McDonald's Expected to Drop Plastic Burger Box ‐ NYTimes.com." The New York Times. 01 Nov. 1990. Web. 30 June 2010. <http://www.nytimes.com/1990/11/01/business/mcdonald‐s‐expected‐to‐drop‐plastic‐burger‐box.html> 94 2008‐09 Coca‐Cola Sustainability Review 95 Mazda. Mazda Develops Plastic Molding Technology Which Reduces Consumption of Plastic Resins by 30 Percent. Mazda News Releases. 9 Sept. 2008. Web. 02 Sept. 2010. <http://www.mazda.com/publicity/release/2008/200809/080909c.html 96 Recoup “Recyclability by Design” 2009

37
6. Collection & Separation 6.1 Collection
6.1.1 Curbside Collection
Curbside recycling is the easiest and most convenient means for recycling for most of the US population. Starting over 20 years ago, curbside collection is well established and often is mandatory in many jurisdictions.97 In 1989, an estimated 9 million US households had access to curbside recycling, and 20% of them collected some sort of plastic.98 By 2008, curbside recycling had grown to reach 59% of the population overall, and 85% in the Northeast.99 Since recycling is done on the municipal basis, recycling rates differ widely from city to city. For larger municipalities, Waste & Recycling News surveys cities for information regarding their recycling programs. Their 2009 Public Sector Survey indicated that recycling rates ranged from abysmal – 1.27% in Houston – to impressive – 72% in San Francisco. Recycling rates are not necessarily tied to annual operating budgets. San Francisco’s system generated a $25.6M profit on an annual operating budget of $3.6M, while Houston only mustered $1.0M on an annual operating budget of $76.9M.100 Resins accepted for recycling also vary from city to city. Most municipalities, including NYC, only collect PET and HDPE jugs & bottles.101 While this ensures the mechanical purity of plastic recycling, it leaves quite a bit of potentially recyclable plastics out of the loop. Independent entities such as Brooklyn’s Park Slope Food Co‐op strive to correct for the shortcomings of the city by collecting PET, PP, and clear PS, as well as clear plastic film and bubble wrap.102 Recent legislation (January, 2008) by the New York City Council has required large stores & retail chains to accept plastic bags for recycling.103 Results from a UK study show that the inclusion of plastic and cans versus simply paper in curbside recycling schemes improved participation rates as householders seem interested in diverting high volume rigid containers from their waste.104 Research has shown that expanding collection to include any type plastic bottle will result in a 75‐200% weight increase in the amount of plastics collected over collection of just PET and clear HDPE beverage bottles. In the event of confusion, participants are more likely to deposit all plastics into the recycling scheme “just to play it safe.”105 While there have been
97 Kahlenberg, Rebecca. “Curbside Recycling Proves An Easy Way to Go Green”, Washington Post. April 15, 2005. http://www.washingtonpost.com/wp‐dyn/articles/A56135‐2005Apr15.html/?nav=lb 98 Hegberg, Bruce et al. “Mixed Plastics Recycling Technology” (1992) p44. 99 EPA “Municipal Solid Waste in the United States, 2008 Facts & Figures.” United States Environmental Protection Agency (EPA), table 25. 100 Waste & Recycling News. “Municipal Recycling Survey 2009”. Web. 30 June 2010. http://www.wasterecyclingnews.com/rankings/pubsurvey2009.html "Municipal Recycling Survey." Waste & Recycling News | Waste Management/Recycling/Landfill Headlines. 2010. Web. 30 June 2010. <http://www.wasterecyclingnews.com/rankings/mrs2009.html> 101 NYC WasteLe$$. “What and How to Recycle in New York City’ http://www.nyc.gov/html/nycwasteless/html/recycling/recycle_what.shtml#symbol 102 Park Slope Food Co‐op, “Plastics Recycling”. http://foodcoop.com/go.php?id=112 103 Bernard, Ann. “City Council Passes Bill for Recycling of Plastic Bags”. NY Times. January 10, 2008. http://www.nytimes.com/2008/01/10/nyregion/10bags.html 104 Woodard, R. et al. “Participation in curbside recycling schemes and its variation with material types.” Waste Management 26 (2006) 914‐919. 105 Hegberg, Bruce et al. “Mixed Plastics Recycling Technology” (1992) p18‐41

38
some pilot programs that collected film in curbside collection, excessive contamination is likely and makes the sale of the film difficult. Only 3% of plastic film is collected in curbside collection schemes.
6.1.2 Container legislation & bottle deposits The current container deposit laws in place in a handful of states originally started the plastics recycling industry and continues to subsidize its functionality; only Maine, Hawaii, and California have expanded bottle laws to deal with more than simply carbonated soft drinks (Fig. 6.1). New York recently expanded its original 1982 legislation with the 2009 amendment “The ‘Bigger Better Bottle Law’” which now applies the existing five cent deposit to water bottles in addition to soft‐drink & alcohol plastic, glass, and aluminum containers.
Figure 6.1 : States with Bottle Bills (Blue) and States with Current Campaigns (Yellow)106
Chapter 59, Part SS of the Laws of New York, 2009 – the “Bigger Better Bottle Law” strives to correct some of the shortcomings of the original 1982 legislation. While the original language of the law blamed litter on “soft‐drink, beer and ale bottles and cans” the updated legislation points at “beverage containers” as the culprit, and expands the definition of beverage to include all water rather than simply mineral water and soda water. Water is further defined to be “any beverage identified the use of letters, words, or symbols on its product label as a type of water, including any flavored water or nutritionally enhanced water” excepting those with sugar added. While the legislation did not take the opportunity to either increase the deposit from five cents nor to expand the wording to include all beverages including juices & sports drinks, it is an important piece of legislation.107 According to the Preliminary Waste Characterization Study (PWCS) performed by R.W. Beck for the New York City Department of Sanitation, two thirds of the PET bottles in the
106 Container Recycling Instite, Bottle Bill Resource Guide http://www.bottlebill.org/legislation/usa.htm 107 “Bigger Better Bottle Law”, Chapter 59, Part SS of the Laws of New York, 2009

39
curbside waste stream are non‐deposit bottles.108 The Container Recycling Institute reports that of the 3.2 million water bottles sold annually in New York, fewer than 20 percent are actually recycled. Despite its positive intentions, the updated New York bottle bill has met its share of resistance. After numerous delays, it finally ostensibly took effect on October 31st. It is not yet fully operational, as language in the law requires a New York state specific universal product code which has yet to be embraced by water bottle manufacturers. Additionally, many convenience store owners have refused to collect the deposit on bottles as a form of protest. Inevitably, though, the legislation will lead to an uptick in plastic bottle recycling, as much as 30‐40% of an expected increase.109 Bottle deposit laws have proven effective – PET bottles for carbonated beverages are recycled at a 71.2% rate in the 11 bottle deposit states, versus 13.6% for the 39 non‐deposit states.110
6.1.3 Post‐collection recycling The NYC MTA employs post collection recycling in the 468 subway stations in the transit system. This results in a high recycling rate. In 2008, NYC Transit's subway stations yielded 8,444 tons of recyclables, representing approximately 50 percent of all waste collected in the system.111
6.1.4 Manufacturer‐led collection Polystyrene recycling remains financially difficult, primarily due to the low cost of polystyrene. Dart, the world’s largest manufacturer of foam cups and containers, performs materials recycling for its single‐use polystyrene foam cups in its polystyrene foam recycling facility in Mason, MI. Their three‐tiered program works with large operators, small operators, and drop‐off locations open to the general public. Additionally, Dart works with its home state of Michigan to provide drop‐off points for recycling for 30 counties.112 6.1.5 Other collection schemes Various other recycling and collection schemes exist outside these schemes, but none in large quantities. The USPS recently began a program in conjunction with Clover Environmental Solutions to collect and recycle small WEEE called “mail it back with USPS”.113 The pilot program began in 1500 post offices in 10 regions across the country, where customers can get free mail‐back envelopes that are large enough to contain cell phones, PDAs, digital cameras, and other small electronic devices. Postage is paid for by Clover Technologies Group, who won the contract from the USPS, besting 19 other companies.
108 R. W. Beck. Preliminary Waste Characterization Study. Final Report prepared for the New York City Department of Sanitation, September 2004. 109 Jones, Blake. "Sorting out the Bottle Bill." PostStar.com ‐ Glens Falls, Saratoga, Lake George. 23 Nov. 2009. Web. 30 June 2010. <http://www.poststar.com/news/local/article_7bdb1532‐d7e5‐11de‐ad51‐001cc4c03286.html> 110 "CRI ‐ Recycling Rates by Material and Class." Container Recycling Institute. 2006. Web. 30 June 2010. <http://www.container‐org/facts/all/data/recrates‐depnon‐3mats.htm> 111 "New York City Transit and the Environment." Metropolitan Transportation Authority. Web. 301 June 2010. <http://www.mta.info/nyct/facts/ffenvironment.htm#aru> 112 "Dart ‐ Recycle Polystyrene Foam." Dart ‐ Quality Single‐Use Foodservice Packaging Products. 2010. Web. 30 June 2010. <http://www.dartcontainer.com/web/environ.nsf/pages/enrecy.html> 113 Veto, Joanne. "Free Recycling Through the Mail." USPS ‐ The United States Postal Service. 17 Mar. 2008. Web. 30 June 2010. <http://www.usps.com/communications/newsroom/2008/pr08_028.htm>

40
6.2 Separation The success of plastics recycling is contingent on proper separation from non‐plastics and the subsequent separation of individual resin. No simple solution exists for mechanical separation of plastic wastes after disposal, e.g., analogous to the magnetic separation of ferrous metals. While some organizations such as the New York City Metropolitan Transit Authority enjoy a high recycling rate with collection followed by separation, this is highly labor intensive and may not be feasible to replicate in a more profit‐driven operation. Manual sort rates are typically 1200+ bottles per hour, while automatic sort rates can be up to 40,000 bottles per hour.114
6.2.1 Froth flotation Separation of plastics by froth flotation has been researched. There are two primary strategies. Since virgin resins of all major polymers are hydrophobic by nature, selective wetting of the components is the obvious approach and has been applied in most of the published research studies. A secondary more advanced approach, based on the selective hydrophobization of individual components, is perhaps better suited to handle plastic wastes. Most of such processes involve size reduction (wet or dry), and sink‐float separation to collect PE and PP, together with foamed resins in (PUR and expanded PS), in float fraction, and heavier‐than water plastics PS, PVC, PET, in the sink fraction.115 For the former approach, in a 45 ton per hour pilot plant in Washington DC in 1976‐1977, plastic waste was shredded in a hammer mill, the magnetic fraction was removed, and the remainder passed through a zigzag air classifier. The resulting “heavy” fraction was screened and passed through an eddy current separator to recover aluminum. Rigid plastics were then handpicked from this residue. Handpicking was done due to a lack of a suitable mechanical separation technique. After this, the plastics fraction was shredded in a knife shredder and three fractions were returned. The heavy fraction contained PVC and rubber, and was not investigated further. The middling fraction was principally composed of various styrene products while the float fraction consisted of various polyolefins. The project was discontinued primarily due to the lack of mechanical separation of the plastics‐rich residue following eddy current separation. “The overall conclusion is that more research..... is needed if froth flotation is to be a viable separation method for plastic mixtures derived from municipal or industrial waste.”116
6.2.2 Density Separation Density separation is often used to separate plastics, although the limited range in densities of plastics makes this difficult (Table 6.1). While PET and PVC are easily separated from polyolefins, the separation between PET and PVC is difficult, as well as the separation between HDPE, LDPE, and PP.
Table 6.1 Density Range of Key Plastics & Closure Materials.117
Material Density (g/cc)
PP 0.90 ‐ 0.92
LDPE 0.91 ‐ 0.93
114 ibid 115 Fraunholcz, N. “Separation of waste plastics by froth flotation – a review, part I” Minerals Engineering 17 (2004) 261‐268. 116 Alter, Henry. “The recovery of plastics from waste with reference to froth flotation.” Resources, Conservation, & Recycling 43 (2005) 119‐132. 117 "Density Range." The Association of Postconsumer Plastic Recyclers. Web. 30 June 2010. <http://www.plasticsrecycling.org/technical_resources/design_for_recyclability_guidelines/density_range.asp>

41
HDPE 0.94 ‐ 0.96
PET 1.35 ‐ 1.38
PVC 1.32 ‐ 1.42
PS 1.03 ‐ 1.06
Aluminum ~2.10
In the separation of polyolefins (HDPE, LDPE, and PP), the close range of densities is often problematic. Inverse magnetic density separation (IMDS) is a technique that uses magnetic liquids combined with an electromagnetic field to vary the density exponentially.118 The segregation of some plastics from others are critical for their purity. One of the worst contamination effects is PVC on PET. PVC has a detrimental effect on PET, contaminating PET reprocessing and producing a char. Separation is difficult due to similar densities of 1.30 – 1.35 g/cm3 that are inseparable by normal flotation methods. “It was possible to separate PVC from PET through flotation using calcum lignin sulfonate as a surfactant for PET and methyl isobutyl carbinol (MIBC) as a frothing agent. “119
6.2.3 Optical Sorting Methods Near‐Infrared Spectroscopy (NIR) allows for the rapid identification of the polymers of rigid plastic containers by infrared photo detection and often can provide information on additives. The process operates by matching transmission spectrum to fingerprint of known polymers.120 NIR requires a minimum particle size of 20 to 50mm, which precludes the recycling of smaller plastic wastes such as bottle caps.121 Ti‐Tech, the industry leader in NIR autosort sensors, has over 2000 units in operation in 25 countries.122 Waste Management’s Raleigh Plastics has 10 units in operation, at a cost of $250,000 each, that separate plastic wastes into individual resins (Figure 6.2). The use of optical methods of separation reduces the water usage.
118 Bakker, E.J. “Upgrading mixed polyolefin waste with magnetic density separation.” Waste Management 29 (2009) 1712‐1717. 119 Marques, Gisela Ablas et al. “Use of froth flotation to separate PVC/PET mixtures” Waste Management 20 (2000) 265‐269. 120 Eisenreich. Norbert, et al. “Fast Identification of Plastic Materials by Near‐Infrared Spectroscopy” Conversion of Polymer Wastes and Energetics (1994) pp21‐30. 121 Bakker, E.J. “Upgrading mixed polyolefin waste with magnetic density separation.” Waste Management 29 (2009) 1712‐1717. 122 "Company Profile." Titech: Innovations in Global Recycling. 2010. Web. 30 June 2010. <http://www.titech.com/about‐titech/company‐profile>

42
Figure 6.2 : One of ten Ti‐Tech NIR scanners in use at Raleigh Plastics
NIR can also be used for identifying and removing biodegradable polylactic acid (PLA) bottles from PET plastic materials recycling, although a test did not yield optimal results: In a experiment, 512 bottles were classified by a Ti‐Tech NIR device. 361 PLA bottles (70.5%) were correctly rejected, 115 (22.4%) were mis‐categorized as PET green, and 31 bottles (6%) were mis‐categorized as PET clear.123
6.2.4 Triboelectric Separation
Triboelectric separation is a promising emerging method to sort plastics. The separation works on the principle of surface charge transfer phenomenon, where plastics are rubbed together. This may be accomplished multiple ways, such as passing small plastic particles through a cyclone lined with polyethylene124. Then, by passing the charged particles through an electric field between two charged plates, negatively charged particles gravitate towards the positively charged plate and vice versa.
Figure 6.3 : Schematic design for a triboelectric separator
123 NatureWorks LLC. “Using Near‐Infrared Sorting to Recycle PLA Bottles.” 2009 (Whitepaper) 124 Dodbiba, G. “The use of air tabling and triboelectric separation for separating a mixture of three plastics.” Minerals Engineering 18 (2005) 1350‐1360.

43
Since surface charge transfers differently for different polymers a triboelectric series is necessary to rank their charge tendencies. A study by Park et al. established a triboelectric series of (negative)‐PVC‐PP‐LDPE‐HDPE‐PET‐PS‐ABS‐(positive)125. Benefits of triboelectric separation include the ability to handle metals as well as mixed plastics, and being able to simultaneously sort three or more resins at once. However, triboelectric separation requires appropriate size range (approximately 2‐4mm in diameter) particles, and can be susceptible to the humidity in the operational area. 126
6.2.5 Selective dissolution
Selective dissolution involves dissolving resin mixtures in a solvent. Depending on the solvent, this allows recovery of pure polymers with even fillers removed, although it is difficult and costly.127 This purification process has been used to result in higher purity PET polymer after individual polymer separation.128 Creasolv is an emerging proprietary technology in the field of solvent dissolution for BFR compounds used in WEEE. In 2002, the Fraunhofer Institut IVV (Germany) founded CreaCycle GmbH to develop Creasolv. In trial studies by the Waste & Resources Action Programme (WRAP) of U.K., Creasolv proved to be successful at removing BFRs from styrenic WEEE polymers.129
125 Park et al. “Triboelectric series and charging properties of plastics using the designed vertical‐reciprocation charger.” Journal of Electrostatics 66 (2008) 578‐583. 126 Xiao et al. “Electrostatic Separation and Recovery of Mixed Plastics”. americanchemistry.com/s_plastics/doc.asp?CID=1588&DID=6046
127 Bakker, E.J. “Upgrading mixed polyolefin waste with magnetic density separation.” Waste Management 29 (2009) 1712‐1717. 128 Hegberg, Bruce et al. “Mixed Plastics Recycling Technology” (1992) p134‐138. 129 Nnorom, Innocent Chidi and Oladele Osibanjo. “Sound managemenet of bromanted flame retarded (BFR) plastics from electronic wastes: State of the art and options in Nigeria”. Resources, Conservation and Recycling 52 (2008) 1362‐1372.
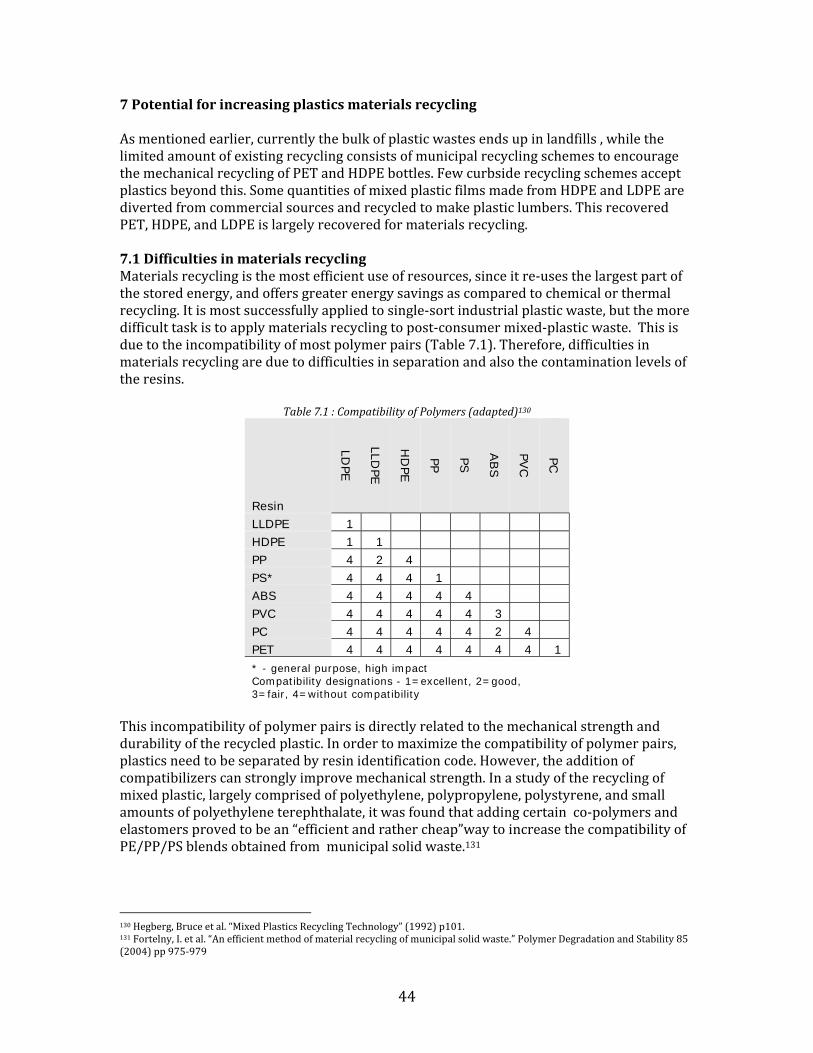
44
7 Potential for increasing plastics materials recycling As mentioned earlier, currently the bulk of plastic wastes ends up in landfills , while the limited amount of existing recycling consists of municipal recycling schemes to encourage the mechanical recycling of PET and HDPE bottles. Few curbside recycling schemes accept plastics beyond this. Some quantities of mixed plastic films made from HDPE and LDPE are diverted from commercial sources and recycled to make plastic lumbers. This recovered PET, HDPE, and LDPE is largely recovered for materials recycling. 7.1 Difficulties in materials recycling Materials recycling is the most efficient use of resources, since it re‐uses the largest part of the stored energy, and offers greater energy savings as compared to chemical or thermal recycling. It is most successfully applied to single‐sort industrial plastic waste, but the more difficult task is to apply materials recycling to post‐consumer mixed‐plastic waste. This is due to the incompatibility of most polymer pairs (Table 7.1). Therefore, difficulties in materials recycling are due to difficulties in separation and also the contamination levels of the resins.
Table 7.1 : Compatibility of Polymers (adapted)130
Resin
LDPE
LLDPE
HD
PE
PP
PS
ABS
PVC
PC
LLDPE 1 HDPE 1 1 PP 4 2 4 PS* 4 4 4 1 ABS 4 4 4 4 4 PVC 4 4 4 4 4 3 PC 4 4 4 4 4 2 4 PET 4 4 4 4 4 4 4 1 * - general purpose, high impact Compatibility designations - 1=excellent, 2=good, 3=fair, 4=without compatibility
This incompatibility of polymer pairs is directly related to the mechanical strength and durability of the recycled plastic. In order to maximize the compatibility of polymer pairs, plastics need to be separated by resin identification code. However, the addition of compatibilizers can strongly improve mechanical strength. In a study of the recycling of mixed plastic, largely comprised of polyethylene, polypropylene, polystyrene, and small amounts of polyethylene terephthalate, it was found that adding certain co‐polymers and elastomers proved to be an “efficient and rather cheap”way to increase the compatibility of PE/PP/PS blends obtained from municipal solid waste.131
130 Hegberg, Bruce et al. “Mixed Plastics Recycling Technology” (1992) p101. 131 Fortelny, I. et al. “An efficient method of material recycling of municipal solid waste.” Polymer Degradation and Stability 85 (2004) pp 975‐979

45
Infinite recycling is technically impossible. Repeated processing forces the degradation of molecules, placing a finite limit on plastics recycling.132 As it is often difficult to separate materials such as mixed plastic film from the perils of cross‐resin contamination, plastics such as film are unlikely to be recycled back into film. However, such materials may be suitable for manufacturing other plastic products such as plastic lumber, or even higher gauge plastic bags/liners. 7.2 Potential energy savings of materials recycling Due to the inefficiencies of combustion, recycling saves more energy. WTE facilities covert to electrical energy only 20‐ 25% of the intrinsic heating value. However, according to the E.U. definition of thermal efficiency, electricity generated in a WTE plant should be multiplied by the factor 2.6, in order to determine the thermal efficiency of the WTE. Therefore, the 20% thermal efficiency translates to 20 x 2.6 = 52% efficiency. Preliminary estimates of energy saved recycling plastics ranges between 42 MJ/kg (LHV for “other rigid”) and 111 MJ/kg (HHV for PET) – the largest savings for any segment of MSW other than aluminum (Table 7.1).133 Table 7.1 : Energy generated by mass burn incineration vs energy conserved by recycling134
Waste Stream Material
Residential waste
composition (%)
Material Heating Value
(MJ/kg)
EFW facility material energy
equivalent to steam-electric
power fuel energy (MJ/kg)
Energy saved when recycled
into same material - Low
est (MJ/kg)
Energy saved when recycled
into same material - High
est (MJ/kg)
PET 0.30% 46.3 21.0 60.8 111.0 HDPE 0.90% 46.3 21.0 66.1 82.6 Other container 0.20% 37.0 16.8 61.6 64.2 Film/packaging 4.30% 32.1 14.6 66.1 84.9 Other rigid 1.80% 37.0 16.8 41.9 95.9 Total Plastics 7.50% 35.7 16.2 60.0 87.9 Total MSW/ Weighted Average 100% 13.5 6.1 20.1 31.3
While energy is saved in using recycled rather than “virgin materials, recycling of plastics requires some consumption of energy. The most general scheme involves the size reduction of waste plastics into a more suitable form. The steps involved in plastics recycling usually include: separate collection and transportation to a MRF; sorting of the plastic stream at the MRF and transportation to the plastics recycling facility; cutting/shredding into smaller pieces, contaminant separation by cyclone, density float separation, milling of separated resins, washing and drying by water or by solvent, agglutination of product, extrusion and pelletization, and “quenching” i.e. water‐cool.135 A 2010 study prepared for the American Chemistry Council attempted to estimate the total
132 Fletcher, B.L. “A model of plastics recycling: does recycling reduce the amount of waste?” Resources, Conservation and Recycling 17 (1996) 141‐151. 133 Morris, Jeffrey. “Recycling versus incineration: an energy conservation analysis”. Journal of Hazardous Materials 47 (1996) 277‐293. 134 ibid 135 Al‐Salem, S.M. et al. “Recycling and recovery routes of plastic solid waste (PSW): A review” Waste Management 29 (2009) 2625‐2643.

46
process and transportation energy required to collect, sort and separate, and reprocess postconsumer plastics.136 The process energy for PET and was estimated as 8.1 MJ/kg and 5.7 MJ/kg. Additionally, both resins required 1.0 MJ/kg in transportation energy. 7.3 Closed‐loop recycling Products and markets for recycled plastics are often not the same as their original sources. Open‐loop recycling dominates for a variety of reasons. Additionally, the ability to close‐loop materials recycle is often dependent on the life cycle of the product. Long lifespans can limit the possibility for closed loop recycling of durable goods.137 FDA regulations on containers & packaging being reused in food‐contact applications has historically limited the amount of plastics being closed‐loop recycled. As most separation and collection of recyclable has focused done with food‐contact plastics, particularly bottles and jugs. In response to improvements in quality and potential contamination levels, the FDA has begun to approve recycling of plastics in food applications for manufacturer’s on a case‐by‐case basis.138 Coca‐Cola recently announced its intentions to recycle and reuse 100% of their waste plastics. In January 2009, in conjunction with PET recycler United Resource Recovery Corporation, (URRC), Coca‐Cola unveiled the world’s largest PET recycling plant in Spartanburg, SC.139 The plant has an operating capacity of 100 million pounds/year (50 thousand tons/year). As an estimated 680 thousand tons were recovered in 2008, this single plant represents a significant increase in capacity.140 7.4 Plastic lumber & and other construction materials
7.4.1 Pure recycled plastic materials Plastic building materials have the promise of high strength, durability, and resistance to rot. Pure plastic building materials can have significant mechanical strength. A recycled thermoplastic HDPE bridge built by Army Corps of Engineers used 42.5 tons of recycled HDPE to support the movement of military equipment. 141 7.4.2 Plastics with added fillers One study by Breslin et al tested the mechanical properties of TRIMAX plastic lumber. 142 Cross‐sections of the profile were taken that indicated internal voids located in the center, which were attributed to presence of moisture in remanufacturing process. Depending on the composition of the lumber, the engineering properties can vary widely. Plastic lumber had 1/10 the stiffness, ½ the strength, twice the weight, and twice the cost of wood lumber. In some cases, the promise of a 50 year or longer lifespan may make plastic competitive
136 Final Report – Life Cycle Inventory of 100% Postconsumer HDPE and PET Recycled Resin from Postconsumer Containers and Packaging (2010) 137 Zia, Khalid Mahmood et al. “Methods for polyurethane and polyurethane composites, recycling and recovery: A review.” Reactive & Functional Polymers 67 (2007) 675‐692. 138 FDA, “Recycled Plastics in Food Packaging” http://www.fda.gov/Food/FoodIngredientsPackaging/FoodContactSubstancesFCS/ucm093435.htm 139 "Bottle‐to‐Bottle Recycling Plant ‐ Press Release ‐ Coca‐Cola." Coca‐Cola: The Coca‐Cola Company. 14 Jan. 2009. Web. 30 June 2010. <http://www.thecoca‐colacompany.com/presscenter/nr_20090114_bottle‐to‐bottle_recycling.html> 140 EPA, "Municipal Solid Waste Generation, Recycling, and Disposal in the United States" 2008 141 “Recycled Plastic Bridge at Fort Bragg Stands up to M‐1 Tank Traffic” http://www.cecer.army.mil/td/tips/docs/LampoBridge.pdf 142 Breslin, Vincent T. et al. “Long‐term engineering properties of recycled plastic lumber used in pier construction.” Resources, Conservation and Recycling 23 (1998) 243‐258.

47
with wood. Engineering properties of plastic lumber from the same manufacturer may vary up to 30%. The study suggested a grading system for differentiating qualities of plastic lumber. U.K.‐based Environmental Recycling Technologies plc (ERT) has developed the eco‐sheet plastic plywood alternative made from 100% recycled PVC‐free mixed plastics. ERT utilizes a proprietary process called powder impression molding (PIM).143 A large potential market for recycled HDPE may be recycled crossties for railroads. Tie‐Tek is a Texas based manufacturer of composite rail ties made from a proprietary formula of 85% recycled materials, including recycled plastic, waste tires, and waste fiberglass, in addition to structural mineral fillers. The company estimate an annual installation of 350,000 ties for 100 miles of rail would yield many environmental benefits, including the recycling of 50 million pounds of HDPE (25 thousand tons) and the estimated reduction of GHG emissions by 40,000 metric tons. As an estimated 15 to 20 million wooden railroad ties are replaced annually, the market is potentially huge. Additionally, 25 thousand tons would represent 4.3% of the 579 thousand tons of HDPE plastics recycled annually.144 7.4.3 Plastics in concrete Adding plastics to asphalt/building materials ‐‐ Adding plastics may increase lifespan of road asphalts, and prevent cracking of concretes but it decreases strength. Such addition can improves the temperature susceptibility of asphalt, i.e., the tendency to become brittle at low and soft at high temperature. Addition of polymers can also enhance various engineering properties, although the literature on this subject is “quite scarce”.145 K. K. Plastics Waste Management, headquartered in Bangalore, India, is currently piloting a program in which plastics are added to bitumen at a rate of 8 tons of plastic to 100 tons of bitumen to build public roads primarily in Bangalore. To date, over 1200 km (745 mi) of road have been built, using 3,500 tons of plastic waste.146 7.5 Other potential end uses of recycled plastics Recycled powder from rigid polyurethane (PU) is an excellent material for absorbing oil spills.147 This may be relevant in the light of the recent BP oil disaster in the Gulf of Mexico. The presence of brominated flame retardants (BFR) in WEEE is not an insurmountable hurdle for recyclability. One study observed that new plastics containing BFRs were successfully recycled up to five times while meeting safety and performance standards. Only 5‐20% of the original bromine contents remained in recovered fractions, resulting in bromine levels of 0.18‐1.39%.148
143 "Ecosheet." Environmental Recycling Technologies Plc. Mar. 2009. Web. 30 June 2010. <http://www.eco‐sheet.com/home> 144 “Conceptual Level Assessment of the Sustainability Attributes of Composite Railroad Ties” Final Report to TieTek, developed by HDR. <http://www.tietek.com/product.php> 145 Al‐Hadidy, A.I. and Tan Yi‐qiu. “Effect of polyethylene on life of flexible pavements”. Construction and Building Materials 23 (2009) 1456‐1464. 146 Khullar, Mridu. "Plastic Roads Offer Greener Way to Travel in India." The New York Times. 13 Nov. 2009. Web. 30 June 2010. <http://www.nytimes.com/2009/11/14/business/global/14plastic.html> 147 Zia, Khalid Mahmood et al. “Methods for polyurethane and polyurethane composites, recycling and recovery: A review.” Reactive & Functional Polymers 67 (2007) 675‐692. 148 Nnorom, Innocent Chidi and Oladele Osibanjo. “Sound managemenet of bromanted flame retarded (BFR) plastics from electronic wastes: State of the art and options in Nigeria”. Resources, Conservation and Recycling 52 (2008) 1362‐1372.

48
8 Potential for using plastic wastes for gasification and production of fuels As plastics are derived from petroleum, much research has been conducted in converting waste plastics into various synthetic fuels by way of chemical recycling. Chemical recycling involves the alteration of the chemical structure. While the application of some of the chemical processes outlined here to plastics is relatively new, the techniques for doing so are well‐established by similar reactions in the petroleum industry and include processes such as pyrolysis, gasification, catalytic hydrotreating, hydrocracking, and hydrogenation.149 The exact numbers for quantities of plastic wastes that undergo chemical recycling are not known , but the number is estimated to be below 1%. The conversion of waste plastics into fuels requires some expenditure of energy and, therefore, the question arises as to what extent chemical recycling is useful.150 As it turns out, the energy consumption of the process is very low. Less than 10% of the energy content of waste plastics is used to convert it to liquid or gaseous fuels.151 For example, the internal energy of PS is estimated at 40 MJ/kg; the heat necessary to pyrolyze the polymer was reported to be only 1.5 MJ/kg, less than 4%.152 The mechanism of thermal degradation of waste plastics is very complex and “includes, among others, the following reactions: chain fission, radical recombination, carbon‐hydrogen bond fission, hydrogen abstraction, mild‐change beta‐scision, radial addition, etc.”153
Table 8.1: Polymer resins and major possible products of thermal decomposition (adapted)154
Resin Mode of thermal decomposition Low-temperature
products High-temperature
products
PE Random chain rupture Waxes, paraffin oils, alpha-olephins Gases & light oils
PP Random chain rupture Vaselines, olefins Gases & light oils
PVC Elimination of HCl from the chain, chain dehydrogenation and cyclization
HCl (<300 degC), benzene
Toluene (>300 degC)
PS Combination of unzipping, and chain rupture, forming oligomers
Styrene and its oligomers
Styrene and its oligomers
PET Beta-Hydrogen transfer, rearrangement and de-carboxylation Benzoic acid and vinyl terephthalate
8.1 Pyrolysis Pyrolysis, i.e. heating in an oxygen‐free environment, decomposes the organic compounds of a material into liquid and gaseous products leaving inorganic ingredients free from being bound to them.155 The pyrolysis of individual resins is well documented. Pyrolysis of the polyolefins PE and PP
149 Al‐Salem, S.M. et al. “Recycling and recovery routes of plastic solid waste (PSW): A review” Waste Management 29 (2009) 2625‐2643. 150 Krause, H.H. and J.M.L. Penninger. “Conversion of Polymer Wastes & Energetics.” 1994. P1‐5 151 Nnorom, Innocent Chidi and Oladele Osibanjo. “Sound managemenet of bromanted flame retarded (BFR) plastics from electronic wastes: State of the art and options in Nigeria”. Resources, Conservation and Recycling 52 (2008) 1362‐1372. 152 Goncalves, Cecilia K. et al. “Emissions from Premixed Combusion of Polystyrene.” Energy & Fuels 22 (2008) pp354‐362. 153 Encinar, J.M. and J.F. Gonzalez. “Pyrolysis of synthetic polymers and plastic wastes. Kinetic study” Fuel Processing Technology 89 (2008) 678‐686. 154 Buekens, A. “Introduction to Feedstock Recycling of Plastics.” p 12 of “Feedstock Recycling and Pyrolysis of Waste Plastics” edited by John Scheirs & Walter Kaminsky Wiley 2006. 155 Lopez, A. et al. “Pyrolysis of municipal plastic wastes: Influence of raw material composition.” Article in press. Waste Management (2010).

49
produced similar results of light volatile hydrocarbons, in the form of gases and light oils which are suitable for the production of gaseous fuel. The styrenics ABS and PS however produce styrene monomers and oligomers, which are more suited to the production of an oil/wax feedstock for the petrochemical industry rather than synthetic fuels.156 PET pyrolysis forms a gas containing mostly carbon dioxide and carbon monoxide, due to its high oxygen content. ABS and PS produce much less gaseous products versus PE, PP, or PET, less than 10% for ABS and less than 5% for PS.157 In the case of WEEE, the halogen component can form extremely toxic polyhalogenated dibenzo dioxins and furans during the pyrolysis itself or during any subsequent combustion of the pyrolysis products.158 The emission of particulate matter from the direct combustion of PS is at least one order of magnitude higher than that from the combustion of PS pyrolysis products. The indirect combustion produces mostly submicron particulates, while the direct combustion produced higher agglomerated chains in addition to the submicron particles.159
8.1.1 Thermal pyrolysis Temperatures above 460 oC are sufficient to produce complete decomposition of plastic wastes in thermal pyrolysis, although this results in oils that are wax‐like and solidify and room temperature.160 PS melts at 237.5 degC, decomposes at 364 degC. Rapid devolatilization of PS increases with temp, approaches 100% as 800 degC reached.161 Higher temperatures yield better results. At around 850 degC, pyrolysis of mixed waste plastics yields almost exclusively aromatics, C2H4 and CH4. To crack PAHs, very high temperatures in excess of 1200 degC and long residence times are required.162 Plas2Fuel, a Longview, Washington based start‐up, Plas2Fuel employs thermal pyrolysis to create a synthetic crude. Plas2Fuel’s batch process to convert plastic wastes to synthetic crude oil. 8 lbs of plastic yields 1 gallon of synthetic crude. Envion, near Washington, DC is pyrolyzing waste plastics using a “far‐infrared ray” technology . Test system was set up at Montgomery County’s (MD) Solid Waste Transfer Station, and was scheduled to end of October 2009.163 The company is envisaging two generators, the smaller with a capacity of 6000 tons/a year, and a flagship 10,000 ton/year version at a cost of $6‐7M. The company estimates that it will cost about $10 to convert plastic wastes into a barrel of a synthetic “light‐brown synthetic oil that can be converted into fuel for a truck or a jet airplane.” using a proprietary non‐catalytic process that hinges
156 Goncalves, Cecilia K. et al. “Emissions from Premixed Combusion of Polystyrene.” Energy & Fuels 22 (2008) pp354‐362. 157 Encinar, J.M. and J.F. Gonzalez. “Pyrolysis of synthetic polymers and plastic wastes. Kinetic study” Fuel Processing Technology 89 (2008) 678‐686. 158 Hall, William J. “Analysis of products from the pyrolysis of plastics recovered from the commercial scale recycling of waste electrical and electronic equipment.” Journal of Analytical and Applied Pyrolysis 79 (2007) 375‐386. 159 Goncalves, Cecilia K. et al. “Emissions from Premixed Combusion of Polystyrene.” Energy & Fuels 22 (2008) pp354‐362. 160 de Marco, I. et al. “Pyrolysis of the rejects of a waste packaging separation and classification plant”. Journal of Analytical and Applied Pyrolysis 85 (2009) 384‐391. 161 Goncalves, Cecilia K. et al. “Emissions from Premixed Combusion of Polystyrene.” Energy & Fuels 22 (2008) pp354‐362. 162 Al‐Salem, S.M. et al. “Recycling and recovery routes of plastic solid waste (PSW): A review” Waste Management 29 (2009) 2625‐2643. 163 Musgrove, Mike. "Turning Trash into Fuel: D.C. Start‐Up Aims to Pitch Oil Made From Plastic Waste." The Washington Post. 16 Sept. 2009. Web. 30 June 2010. <http://www.washingtonpost.com/wp‐dyn/content/article/2009/09/15/AR2009091503264.html>

50
on a reactor that performs a “low temperature thermal cracking in a vacuum” process.164
8.1.2 Catalytic Pyrolysis Catalytic pyrolysis offers the benefits of pyrolysis with the use of a catalyst to lower reaction temperatures, speed cracking reactions, and allow selectivity towards specific products. Significant catalytic degradation of polymers has been detected at temperatures as low as 200 degC, versus the minimum of 400 degC required for thermal degradation. 165 Catalytic recycling has proven to be significantly more efficient than simple thermal degradation, especially for PP. Plastic degradation leads to the formation of gas, liquids, and residue. In the degradation of PS, coke is also formed. By the usage of catalysts that currently are in wide use in the petroleum industry (SA, HNZ, HZSM‐5) the formation of residue was entirely avoided. Additionally, while SA/HNZ formed gaseous to liquid products in 1:3 ratio, HZSM‐5 formed twice as much gas as liquid. This is indicative of the selectivity abilities of catalysts. A published study investigated the conversion of PS (#6) into gasoline range fuels by FCC (fluidized catalytic cracking) by acidic catalysts. However, “very important amounts of coke are formed.”166 Heterogenous catalysts are easier to separate from the reaction medium, but they present difficulties in deactivation as they suffer from coking. Homogenous catalysts are difficult to remove from the final product, and consequently cheap catalysts such as red mud have been examined.167
8.1.3 Microwave Pyrolysis Microwave pyrolysis is a relatively new field. It offers many advantages over conventional heating, including more even distribution of heat and better control over the heating process. In laboratory studies, it has been used successfully to treat aluminum/polymer laminates with 100% recovery of aluminum present.168 Global Climax Energy, a South Carolina‐based company, has proposed a plastics pyrolysis plant for Paterson, NJ to process 20 tons of plastics per day, roughly 1 trailer‐load. The CEO, John C. Griffith, estimates a 10‐15% energy loss to produce 100 bbl/per day.169 8.2 Gasification The gasification of plastics is a combination of partial combustion with pyrolysis and has been widely studied, with techniques similar to that of rubber/coal. Plastic wastes should be gasified at a temperature of at least 500 degC to reach a lower heating value (LHV) of
164 "Envion Technology." Envion | Waste to Resource. 2009. Web. 30 June 2010. <http://envion.com/evp_theenviontechnology.html>. 165 Aguado, Jose and David Serrano. “Feedstock Recycling of Plastic Wastes” Cambridge: Royal Society of Chemistry, 1999. 166 de la Puente, Gabriela. “Recycling polystyrene into fuels by means of FCC: performance of various acidic catalysts.” Applied Catalysis B: Environmental 19 (1998) 305‐311. 167 de Marco, I. et al. “Pyrolysis of the rejects of a waste packaging separation and classification plant”. Journal of Analytical and Applied Pyrolysis 85 (2009) 384‐391. 168 Ludlow‐Palafox, Carlos and Howard A. Chase. “Microwave‐Induced Pyrolysis of Plastic Wastes” Ind. Eng. Chem. Res. 2001, 40, 4749‐4756. 169 April 8, 2010 NewlyGreens Radio Edition, audio podcast interview. http://newlygreens.com/podcasts/john‐griffith‐climax‐global‐energy/

51
10,000 kJ/N.170 Thermoselect Gasification: At the Chiba Recycling Center in Japan, a study was performed of 270,000 tons of plastic waste gasified with MSW between April 2001 and March 2005.171 The addition of packaging waste plastics to the waste stream raised the average lower heating value (LHV) from 8.5 MJ/kg to 13.7 MJ/kg. The resulting syngas (32.4% H2, 43.1% CO and 18.8% CO2) was combusted in a 1.5 MW gas engine generator with control system to adjust air ratio depending on varying heating value of fuel gas. Utilizing thermoselect process lowered the concentrations of dioxins in flue gas. Successful treatment of wastes led to the construction order of 4 Thermoselect process waste treatment facilities to startup 2005 & 2006. 8.3 Hydrocracking In a study by Joo & Guin, mixed plastic feed of HDPE, PP, and PS was pyrolyzed and then upgraded by catalytic hydrotreating, hydrocracking, and distillation.172 A “water‐clear distillate” was formed that is environmentally favorable to traditional gasoline. The researchers noted the hydrocracking step to be critical in the process. With more paraffins (a higher isoparaffin index) than commercial gasoline, less aromatics and olefins, and less nitrogen, with similar RON properties to normal gasoline (89 octane), the capacity of mixed plastics to synthetic petroleum is clear. The yield in these experiments was 46% and 53% in two experiments. 8.4 Other fuels
8.4.1 In conjunction with diesel fuels Dissolving polystyrene packing peanuts into biodiesel can improve combustion properties of the resulting fuel. While combusting polystyrene in diesel engines is not viable in their typical forms, PS dissolves in diesel fuels like “snowflakes in water”. A study by Kuzhiyil et al173 tested PS concentrations of 2, 5, 10, 15, and 20 wt in diesel. A 5% concentration was found to slightly increase engine power, although higher concentrations caused poor fuel flow through the injection system & higher emissions. 8.4.2 Hydrogen production from waste plastics A transition from hydrocarbons to a hydrogen economy would requires a steady source of hydrogen. In the interest of this, a study was performed by Wu and Williams to identify catalysts that lead to high hydrogen yields for use in a two‐stage pyrolysis‐gasification reactor.174 Various nickel based catalysts are being researched to gasify polypropylene to produce H2. Catalytic activity was quite good – for example, a Ni/ZSM‐5 catalyst for example had a 93.7% gas yield%. In the absence of a catalyst they found a yield of just 0.015 grams H2 per gram waste plastics. With the presence of a Ni‐Mg‐Al catalyst, production was improved to 0.258 g H2/g waste plastics.
170 Al‐Salem, S.M. et al. “Recycling and recovery routes of plastic solid waste (PSW): A review” Waste Management 29 (2009) 2625‐2643. 171 Marushima, Hironari et al. “Waste Plastic Treatment by Thermoselect Gasification and Reforming Process” 172 Joo, H.S. and James A. Guin. “Continuous upgrading of a plastics pyrolysis liquid to an environmentally favorable gasoline range product.” Fuel Processing Technology 57 (1998) 25‐40. 173 Kuzhiyil, Najeeb and Song‐Charng Kong. “Energy Recovery from Waste Plastics by Using Blends of Biodiesel and Polystyrene in Diesel Engines”. 174 Wu, Chunfei and Paul T. Williams. “Hydrogen production by steam gasification of polypropylene with various nickel catalysts.” Applied Catalysis B: Environmental 87 (2009) 152‐161.

52
9 Plastics Combustion Combustion combined with energy recovery represents the best solution to deal with many waste plastics and is environmentally preferable to landfilling. In addition to recovering the embedded energy of waste plastics, combustion allows for a high volume reduction – e.g. combustion of polyurethane foam results in a 99% size reduction.175 While materials and feedstock recycling are often preferable for the amount of energy recovered, many plastics are neither mechanically nor economically feasible to recycle, such as plastics in medical waste. Much of Europe is trending towards augmenting a materials recycling approach with controlled combustion of plastics along with other MSW WTE (waste‐to‐energy) with low emissions. However, open‐air combustion presents emissions problems with all plastics, and especially with WEEE. 9.1 Plastics heat content Municipal solid waste contains many different types of materials, some with very high energy value and others not nearly so. Plastics as a family have an exceedingly high heat content, especially in comparison with the remainder of MSW (Figure 9.1). A 2007 study by the EIA categorizing waste by biogenic and non‐biogenic sources analyzed the heat content per unit weight of different wastestreams of MSW. The heat content of plastics and other non‐biogenic sources was far greater than for biogenic waste streams. The increasing rate of diversion of paper and paperboard to recycling combined with increasing amounts of plastics being combusted rather than recycled has resulted in the steady increase of the Btu content per ton of MSW. Plastics & rubber combine to contribute 44% of the heat content.176
Figure 9.1 : Heat content of different plastics found in MSW as compared to Crude Oil177
9.2 Combustion emissions The open‐air combustion of mixed waste plastics produces a variety of emissions. The combustion of PS produces a black smoke, which is a highly agglomerated soot. PE and PP
175 Zia, Khalid Mahmood et al. “Methods for polyurethane and polyurethane composites, recycling and recovery: A review.” Reactive & Functional Polymers 67 (2007) 675‐692. 176 EIA – Methodology for Allocating Municipal Solid Waste to Biogenic and Non‐Biogenic Energy 177 ibid

53
generate soot in the form of fine particles. PVC combustion is difficult and yields small amounts of smoke with appreciable amounts of metals (Pb, Ni, Cr, Al and Cu) and large amounts of charred residue. PET, also difficult to burn, yielded little soot and ash but still measurable amounts, roughly 4‐5%. This indicates the presence of carbon‐ and oxygen‐ centered free radicals, which are dangerous to human health. Open‐burning of plastic generates particulate smoke that contains various organic compounds and polycyclic aromatic hydrocarbons (PAHs).178
Table 9.1: Emissions from controlled combustion of polymeric material at 600‐750179
Resin Production of black smoke?
Difficulty in burning?
Particulate soot emission (%, w/w) (n=3)
Residue solid ash (%, w/w) (n=3)
PE (HDPE) No No 0.10-0.25 0.25-0.33 PE (LDPE) No No 0.10-0.15 0.10-0.2 PP No No 0.2-0.3 0.1-0.1 PS Yes No 0.52-0.65 2.63-2.85 PVC No Yes 0.21-0.33 9.14-9.62 PET No Yes 0.21-0.25 4.75-5.26 The open‐air burning of WEEE, which often contain brominated flame retardants (BFRs), can be more harmful still. An estimated 18 kg of halogenated additives is used for every 100 kg of plastics.180 Consequently, the combustion of WEEE can lead to the formation of toxic brominated by‐products. Unfortunately, in many third world countries including Nigeria, waste plastics from EEE is simply incinerated in the open, potentially subjecting locals to health risks.181 The earliest studies on the emissions of plastics in the waste‐to‐energy combustion of MSW date back to 1993, in which a series of tests were conducted in Wurzburg, Germany. The plastic feed was varied from 8.5% to 27% to determine effects of plastics infeed on emissions. In addition to improved process performance and increased combustion, which are directly related to the improved heat contents of plastics, carbon monoxide emissions were decreased and particulate matter emissions were not affected. While chloride emissions are a concern in the combustion of PVC, this is to be expected due to the high chlorine content and can be offset by the use of efficient lime injection.182 While the Wurzburg tests were inconclusive on the role and extent of dioxin emissions, more recent studies have shown that high combustion temperatures (>900 degC) mitigate the amount of dioxins. Of course, as waste management expert Harvey Alter puts it, “any controversy in the USA over chlorine in wastes, or dioxin or furan emissions, should have been ended with the passage of the Clean Air Act Amendments of 1990, which establish new emission limits for MSW waste‐to‐energy plants.”183 As plastics are hydrocarbons, the complete combustion of plastics yields appreciable
178 Valavanidis, Athanasios et al. “Persistent free radicals, heavy metals and PAHs generated in particulate soot emissions and residue ash from controlled combustion of common types of plastics.” Journal of Hazardous Materials 156 (2008) 277‐284. 179 ibid 180 Menad, N. et al. “Combustion of plastics contained in electric and electronic scrap.” Resources, Conservation, and Recycling 24 (1998) 65‐85. 181 Nnorom, Innocent Chidi and Oladele Osibanjo. “Sound managemenet of bromanted flame retarded (BFR) plastics from electronic wastes: State of the art and options in Nigeria”. Resources, Conservation and Recycling 52 (2008) 1362‐1372. 182 Mirza, Rukhsana. “A review of the role of plastics in energy recovery.” Chemosphere, Vol 38, No. 1 (1999) pp 207‐231 183 Alter, Harvey. The Origins of Municipal Solid Waste II. Policy Options for Plastics Waste Management. Waste Management & Research (1993) 11, 319‐332.

54
amounts of CO2, a known greenhouse gas. 9.3 Methods of combustion with energy recovery For the purpose of energy recovery, plastics may be combusted in a variety of ways. For direct combustion, grate technology i.e. simple co‐incineration by direct one stage combustion of waste is primarily used in most WTE facilities. The presence of plastics in waste is generally accounted for to raise caloric values of MSW.184 Fluidized bed and two stage incineration is a method that has been used to co‐fire waste polyurethane with coal, although some PU may be problematic due to their high glass fiber content. Rotary and cement kiln incineration is an alternative that can deal with a mixture of high‐chlorinated wastes such as PVC and high‐nitrogen wastes such as PU.185 Perfectly efficient combustion would yield 1 kWh of electricity for each 3596 kJ of heating value. Due to inefficiencies in conversion, 10807 kJ is typically required to produce each kWh.186 Had the estimated 28.64 million tons of plastic wastes in 2007 disposed been combusted rather than landfilled, they could have potentially provided 71 TWh of electrical energy.
Table 9.2 : Potential energy potential of waste plastics disposed annually in the US187
Resin Mbtu/Ton Millions of
Tons Landfilled
Potential trillions of Btu
landfilled
Potential TWh
Potential GW of plastics landfilled
per year
PET 20.5 3.08 63.1 5.54 0.63 HDPE 38 5.08 193.0 16.93 1.93 PVC 16.5 1.66 27.4 2.40 0.27 LDPE 24.1 6.09 146.8 12.87 1.47 PP 38 4.56 173.3 15.20 1.73 PS 35.6 2.6 92.6 8.12 0.93 O 20.5 5.57 114.2 10.01 1.14 Total 810.4 71.07 8.11
9.4 Co‐incineration 9.4.1 With MSW Combusting plastics with MSW in WTE facilities produces benefits. Most MSW incinerators are built to deal with waste with a calorific value of 9‐13 MJ/kg.188 Therefore the inclusion of plastic wastes increases the overall calorific value. 9.4.2 With Coal The co‐combustion of plastics with coal allows to capitalize upon the concept of economies of scale. A study by Zhou noted polyolefins PE and PP have been noted to have synergistic
184 Al‐Salem, S.M. et al. “Recycling and recovery routes of plastic solid waste (PSW): A review” Waste Management 29 (2009) 2625‐2643. 185 Zia, Khalid Mahmood et al. “Methods for polyurethane and polyurethane composites, recycling and recovery: A review.” Reactive & Functional Polymers 67 (2007) 675‐692. 186 Morris, Jeffrey. “Recycling versus incineration: an energy conservation analysis”. Journal of Hazardous Materials 47 (1996) 277‐293. 187 ibid 188 Al‐Salem et al. "The valorization of plastic solid waste (PSW) by primary to quaternary routes: From re‐use to energy and chemicals." Progress in Energy and Combustion Science 36 (2010) 103‐129.

55
effects on coal, playing the role of hydrogen donor solvent and improving the heating value of bituminous coals and lignites. 189 9.5 Dedicated waste plastics combustion
9.5.1 GR‐Tech Boiler and Atlas Certified Fuels A South Korean startup named GR Technologies invented a novel plastic‐fueled burner in 1999 (Fig. 9.2). After conducting emissions testing between 2005‐2007 in conjunction with Penn State University, a subsidiary of GR Technologies, Eco‐Clean Burners LLC was formed in Spring 2008 in the Pittsburgh area.190 The company has secured $1M in stimulus funds as well as $2.5M in venture capital to develop its GR‐Tech Boilers.191 These boilers are designed to be start up on diesel or kerosene fuel and then run indefinitely on PE or PP pellets.
Figure 9.2 : Eco‐Clean Burners LLC’s GR‐Tech Boiler
The units are rated to produce 100,000 kcal/hr (418.4 MJ/hr) on 9 kg/hr.(19.8 lb/hr.) of feed with 11,500 kcal/kg (48.1 MJ/kg) plastic fuel pellets. The projected cost of the boiler is $17,000, although Eco‐Clean Burners is currently only leasing their combustion systems.192
189 Zhou, Limin et al. “Co‐pyrolysis characteristics and kinetics of coal and plastic blends.” Energy Conversion and Management 50 (2009) 705‐710. 190 "Take Plastic Full Circle." American Society for Plasticulture. 23 Apr. 2010. Web. 30 May 2010. <http://plasticulture.cas.psu.edu/gr.html> 191 Smit, Debra D. "EcoClean Burners on Target for $1M for Plastic to Energy Tech, Hiring 54." PopCity, 23 Sept. 2009. Web. 30 June 2010. <http://www.popcitymedia.com/innovationnews/ecoclean0923.aspx>. 192 Tuss, Robert. "GR‐TECH Boiler Statistics 1." Web log post. WASTE PLASTIC TECHNOLOGY. 3 Dec. 2009. Web. 30 June 2010. <http://wasteplastictechnology.blogspot.com/2006/12/gr‐tech‐boiler‐statistics‐1.html>

56
Figure 6.3.3 – Examples of Penn State’s “PlastoFuel”193
A sister company named Atlas Certified Fuels, L3C has emerged to provide plastic fuel to customers of Eco‐Clean Burners. Using a process developed at Penn State called “PlastoFuel”, the process is designed to convert agricultural film waste to a fuel. Using a heated die, waste plastic film is forced through and thin jacket is melted around the plastic.194 This forms a dense fuel nugget. Costs of pellets are projected to be $160‐$220/ton to produce, and a market value of $280‐320/ton.
9.5.2 Northeastern University's double‐tank waste combuster At the MIT Energy Conference 2010, students from Northeastern University recently unveiled a prototype double‐tank waste graduated combuster for dedicated plastics combustion.195 The system utilized an upper tank for the pyrolysis of plastics, and a lower tank to combust and generate heat and steam.
193 "Take Plastic Full Circle." American Society for Plasticulture. 23 Apr. 2010. Web. 30 May 2010. <http://plasticulture.cas.psu.edu/gr.html> 194 "Waste Plastics as Fuel." Penn State: College of Agricultural Sciences, 2008. Web. 30 June 2010. <http://downloads.cas.psu.edu/RenewableEnergy/Plastofuels08.pdf>. 195 Cheong, Teresa. "Transforming Waste Plastic into an Alternative Fuel | Northeastern University News." Northeastern University: a Leader in Global Experiential Learning in Boston, MA. 10 May 2010. Web. 30 June 2010. <http://www.northeastern.edu/news/stories/2010/05/LevendisPowerCombuster.html>.

57
10 Discussion and Recommendations The potential to recoup the high embedded energy value of plastic wastes make it worthwhile to divert them from other wastes. Landfilling plastics is akin to landfilling crude oil or a similar high‐energy fuel. Improving plastics recycling rates requires improvements in production and disposal of plastics. Also the optimal method of recycling should be properly defined for each plastic waste stream. 10.1 General recommendations Increasing the recycling rate of plastic wastes requires the cooperation of all parties involved – manufacturers of plastic resins and plastic products, consumers, and most importantly waste managers and recyclers. Additionally recycling rates may be influenced legislatively. Following are recommendations for each participant of plastics manufacture and disposal. Recommendations for manufacturers Manufacturing of plastic products occurs at two levels – the manufacture of plastic resins from petroleum feedstocks, and the manufacture of plastic products from plastic resins. The existence of the SPI codes has encouraged manufacturers to select the primary recyclable thermoplastic resins and provide consumers with a recognizable symbol of recyclability. The use of these recyclable plastics is recommended whenever possible in manufacturer – for example, fully recyclable self‐reinforced PET would be preferable over unrecyclable fiberglass thermosets. In the manufacture of plastic resins, safer catalysts should be used, and additives known or suspected to be hazardous to human health should be avoided. Health concerns of food‐contact plastics should be addressed by using safer catalysts in the production of resins and eliminating the addition of harmful additives such as BPAs and PCBs which can be replaced by safer biodegradable alternatives. Additionally, for these food‐contact plastics applications, manufacturers may consider the use of biodegradable alternatives. This of course requires the caveat of diverting this waste towards composting, as biodegradable plastics are unlikely to degrade in landfill conditions. Considering the high correlation of organic residue with plastic wastes, this may divert larger amounts of organics towards composting than expected. (See Appendix B) Manufacturers of plastic products should reduce creation of superfluous plastics. Plastics should be designed with recyclability in mind, whether containers and packaging, non‐durable goods, or non‐durable goods. Additionally include post‐consumer recycled content to the extent that the mechanical properties of the recycled material aren’t compromised.
Recommendations for consumers Consumers need to be cognizant of their plastics consumption; while recycling will conserve the energy embedded in the plastic resins, much of the energy expended in manufacture is unrecoverable. Therefore, consumers should reduce their intake, and dispose of waste plastics properly at the end of their life cycle. As there is no easy way to mechanically separate plastics from other waste, the onus is on consumers to manually diverted plastic wastes for recycling at disposal to the proper channels.

58
Recommendations for waste managers The interface between consumers and waste managers has typically been the limiting factor preventing high recovery rates of waste plastics. The inability of waste managers to collect marketable plastic wastes has led to most municipalities to restrict their plastic collection to simply plastic jugs and bottles, ignoring the large quantities of other waste plastics. Even then, the recovery rates of plastic jugs and bottles remains low. As mechanical recycling has dominated, traditionally the biggest barrier preventing the existence of recyclers is ensuring a steady input of relatively clean recyclable waste plastics. Chemical recycling offers a method to address other plastic wastes not traditionally thought recyclable. MSW collectors and recyclers should try to collect the maximum amount of plastics possible, and market plastics that are not considered traditionally recyclable for the purpose of energy recovery. This requires waste collectors to be flexible in their ability to accept plastic wastes, maximizing the collection of marked‐as‐recyclable rigid plastic containers. Rather than being highly restrictive, waste managers should adapt. Plastic waste collection should be simplified – for example, all SPI identified rigid plastics may be collected together with glass and metal waste streams. Curbside pickup should be expanded, particularly in the south United States. Major portions of plastic waste should be well‐diverted entirely from MSW – for example the PVC piping in construction & demolition (C&D) waste, as well as the styrenic plastics in WEEE. While it is simple to suggest that they should “just collect more” this would would require a large investment in infrastructure to handle the increased influx, but the prospects of the high volume of energy recovery would make it worthwhile.
Recommendations for recyclers Without recyclers, diverting plastics for recycling is just delaying their inevitable landfilling. Traditionally “recycling” has simply referred to materials recycling, which better conserves the embedded energy of plastics than either chemical recycling or combustion. To increase plastics recycling rates, all methods of recycling must be considered. Chemical recycling allows for the creation of gasoline‐equivalent fuels. Combustion with energy recovery allows for the reclamation of the high energy content embedded in plastic wastes. Materials recycling rates should be maximized to reclaim the largest portion of energy in plastics for reuse. However, materials recycling of plastics to another recyclable polymer often requires a purity of feedstock that is not always feasible. Additionally it can prove costly considering the extra steps involved including cleaning, shredding, and granulating waste plastics. Either direct combustion with energy recovery or recycling plastics into synthetic fuels for later combustion represents a better option than simply landfilling plastic wastes. The embedded energy of plastics make landfilling plastic wastes the equivalent of landfilling crude oil or coal. For specific plastic wastes, refer to the recommendations for particular resins and plastic wastes.

59
Recommendations for legislators Various legislative tactics can be used to increase recycling rates. The enforcement of curbside recycling, banning of plastics such as polyethylene bags, container deposit laws, or demanding the use of recycled content in the manufacture of plastic materials are just some. Legislative pressure has proven effective in reducing plastic wastes. As most plastic waste collection is handled by municipal governments, the recommendations for waste managers is particular relevance to legislators. 10.2 Specific recommendations for particular resins and plastic wastes Polyesters Whenever possible, PET should be materials recycled. This is for a number of reasons, as clear PET has the highest economic value of any plastic, PET bottles & jugs have a well established infrastructure, and the high oxygen content of PET makes it a poor feedstock for a synthetic fuel. The closed‐loop recycling of PET bottles should be increased, although PET bottles may also be recycled into polyester fibers. Polyester fibers often found in clothing and upholstery are difficult to materials recycle, but their high energy value makes them a good candidate for combustion with energy recovery. Polyolefins High quality polyolefin wastes have many potential material recycling prospects. Rigid HDPE, LDPE, and PP should be materials recycled as their market exists, but depending on the purity of wastestream, chemical recycling may be preferable. Mechanical properties are easily affected by cross contamination of resins. While these plastics may be combined with other materials such as asphalt, concrete, or wood, the next generation product would be unrecyclable. Plastic films are a good candidate as a source as a a fuel feedstock via pyrolysis. The dominance of polyolefins in this category will lead to the formation of high quality gases & light oils. Pyrolysis is also highly tolerant of the presence of other plastic resins and even organic matter, which would make it a good option for the residues generated in plastics recycling. The existence of PVC should be minimized in MSW by eliminating PVC leatherette in the interests of health. PVC piping, particularly chlorinated‐PVC should be diverted to construction & demolition waste. Due to the likelihood of HCl being created in the combustion of PVC, combustion should be avoided in the absence of pollution control systems. Styrenics The cost of styrene is typically so low there is little demand for materials recycling. PS and may be chemically recycled if there is a demand for styrenics – for example, to be added to diesel fuels. The high energy content of PS and ABS makes them an ideal candidate for combustion with energy recovery. This requires the combustion temperatures to be above 900degC to completely eliminate dioxins. Combustion temperatures lower than that, for example in an open fire pit, may create health risks.

60
11 Conclusions Plastics are a very important man‐made material that provides vast material benefits throughout their useful lifespan. However, their end of life disposal currently leaves much to be desired. Although recycling in the U.S. has exceeded 2 million tons of plastics recovered per year, this pales in comparison to the 30 million tons of plastics disposed annually. Most current attempts at plastics recovery focus on materials recycling of rigid containers, which can present multiple complications. It is hard to easily separate plastics from non‐plastics. The differing composition of plastic resins means they are largely incompatible. Contamination and polymer lengths degradation, leaving recycled polymer of lower quality than virgin quality. Nonetheless, it is important to recycle plastics for a number of reasons. These include energy savings of up to 40 MJ/kg depending on the polymer, as well as economic benefits, and reducing demand for virgin polymer from non‐renewable resources. Therefore, recycling is preferable to landfilling, and is more sustainable. The process of materials recycling produces large quantities of residues. Waste composition tests performed by the author do not indicate that the residues of the Raleigh Plastics PRF are high in plastics content. While there are certainly many waste streams with high plastic content, this did not seem to be one of them. Since policy drives volume, the most effective way to increase collection rates is through legislative means. New York State and New York City provide a good example with multiple laws and initiatives on the books to address plastic wastes, including the NYS Returnable Container Law (1982) and its update, the “Bigger Better Bottle Bill” (2009), the NYS Plastic Bag Reduction, Reuse and Recycling Law (2009), the NYS Electronic Equipment Recycling and Reuse Act (2010) and the NYC Textile Recycling Initiative (Fall 2010). These laws distribute the responsibility of recycling between manufacturers, retailers, and consumers, and have proven effective in increasing recycling rates. Improvements in separation with advanced methods such as NIR and triboelectric separation have allowed for faster and more efficient automatic sorting. However these efforts have largely been used solely for mechanical recycling. Mechanical recycling can be used for selected plastic wastes, such as liquid containers, but chemical and thermal recycling of plastic wastes are applicable to nearly all plastics and therefore can complement material recycling. Therefore they should be considered in integrated waste management schemes. The high energy content of plastic wastes makes it a prime candidate for recovery and use as a synthetic fuel. Embracing tertiary recycling methods, particularly by means of waste‐to‐energy that already converts 10% of ths U.S. plastic wastes to electricity, is essential to properly manage these burgeoning quantities of plastic wastes.

61
12 References “Addicted to Plastic." Bullfrog Films: 1‐800‐543‐3764: Environmental DVDs and Educational DVDs. 2009. Web. 30 June 2010.
<http://www.bullfrogfilms.com/catalog/atp.html>. Aguado, Jose and David Serrano. “Feedstock Recycling of Plastic Wastes” Cambridge: Royal Society of Chemistry, 1999. Al‐Hadidy, A.I. and Tan Yi‐qiu. “Effect of polyethylene on life of flexible pavements”. Construction and Building Materials 23
(2009) 1456‐1464. Al‐Salem, S.M. et al. “Recycling and recovery routes of plastic solid waste (PSW): A review” Waste Management 29 (2009)
2625‐2643. Al‐Salem et al. "The valorization of plastic solid waste (PSW) by primary to quaternary routes: From re‐use to energy and
chemicals." Progress in Energy and Combustion Science 36 (2010) 103‐129. Alter, Harvey. The Origins of Municipal Solid Waste II. Policy Options for Plastics Waste Management. Waste Management &
Research (1993) 11, 319‐332. Alter, Henry. “The recovery of plastics from waste with reference to froth flotation.” Resources, Conservation, & Recycling 43
(2005) 119‐132. Angelini, Enrique. "Plastic Wastes & Residue at St. Charles." Message to the author. 30 Sept. 2009. E‐mail. Arsova, Ljupka, Rob van Haaren, et al. “The State of Garbage of America”. BioCycle December 2008, Vol. 49, No. 12, p. 22 Ayalon, Ofira, et al. “Reduction of plastic carrier bag use: An analysis of alternatives in Israel.” Waste Management 29 (2009)
2025‐2032. Bakker, E.J. “Upgrading mixed polyolefin waste with magnetic density separation.” Waste Management 29 (2009) 1712‐1717. "Barrier Films Find Increasing Application in Agriculture." Plastics Product Bags Used Machines Technology Jobs Recycled
Polymers, India. 2003. Web. 30 June 2010. <http://www.plastemart.com/upload/Literature/Barrier‐films‐increasing‐application‐in‐agriculture.asp?LiteratureID=1283>.
Bartholomew & Farrauto. “Fundamentals of Industrial Catalytic Processes”, p867 Bartl, et al. “Recycling of Fibre Materials” Process Safety and Environmental Protection, 83 (B4): 351‐358. Beck, R. W. . Preliminary Waste Characterization Study. Final Report prepared for the New York City Department of Sanitation,
September 2004. Bernard, Ann. “City Council Passes Bill for Recycling of Plastic Bags”. NY Times. January 10, 2008. Web. 30 June 1010.
http://www.nytimes.com/2008/01/10/nyregion/10bags.html "A Better Bottle for You and the Environment." Poland Spring ‐ Water Delivery, Spring Water & Bottled Water Delivery |
Nestlé. 2008. Web. 30 June 2010. <http://www.polandspring.com/DoingOurPart/EcoShapeBottle.aspx>. Buekens, A. “Introduction to Feedstock Recycling of Plastics.” p 12 of “Feedstock Recycling and Pyrolysis of Waste Plastics”
edited by John Scheirs & Walter Kaminsky Wiley 2006. “Bigger Better Bottle Law”, Chapter 59, Part SS of the Laws of New York, 2009 "Bottle Bills in the USA." Bottle Bill Resource Guide. Web. 30 June 2010. <http://www.bottlebill.org/legislation/usa.htm> "Bottle‐to‐Bottle Recycling Plant ‐ Press Release ‐ Coca‐Cola." Coca‐Cola: The Coca‐Cola Company. 14 Jan. 2009. Web. 30 June
2010. <http://www.thecoca‐colacompany.com/presscenter/nr_20090114_bottle‐to‐bottle_recycling.html> "BPA and Nalgene." Welcome to NALGENE Outdoor. Thermo Fisher Scientific Inc, 2008. Web. 30 June 2010.
<http://www.nalgene‐outdoor.com/technical/bpaInfo.html>. Broder, John M. "New E.P.A. Scrutiny Is Set for a Chemical in Plastics." The New York Times. 29 Mar. 2010. Web. 30 June 2010.
<http://www.nytimes.com/2010/03/30/science/earth/30epa.html>. Breslin, Vincent T. et al. “Long‐term engineering properties of recycled plastic lumber used in pier construction.” Resources,
Conservation and Recycling 23 (1998) 243‐258. Brunner, Jim. "Bag Fee Opponents Report $1.4 Million in Contributions." The Seattle Times. 28 July 2009. Web. 30 June 2010.

62
<http://seattletimes.nwsource.com/html/politicsnorthwest/2009552839_bag_fee_opponents_report_14_mi.html>. Buekens, A. “Introduction to Feedstock Recycling of Plastics.” p 4 of “Feedstock Recycling and Pyrolysis of Waste Plastics”
edited by John Scheirs & Walter Kaminsky Wiley 2006. Cheong, Teresa. "Transforming Waste Plastic into an Alternative Fuel | Northeastern University News." Northeastern University: a Leader in Global Experiential Learning in Boston, MA. 10 May 2010. Web. 30 June 2010. <http://www.northeastern.edu/news/stories/2010/05/LevendisPowerCombuster.html>. CNN NewsWire. “No more plastic bags for Mexico City.” August 19, 2009. Web. 30 June 2010. http://cnnwire.blogs.cnn.com/2009/08/19/no‐more‐plastic‐bags‐for‐mexico‐city/ Coca‐Cola Sustainability Review. 2008‐09 "Company Profile." Titech: Innovations in Global Recycling. 2010. Web. 30 June 2010. <http://www.titech.com/about‐
titech/company‐profile> “Conceptual Level Assessment of the Sustainability Attributes of Composite Railroad Ties” Final Report to TieTek, developed
by HDR. Web. 30 June 1010 http://www.tietek.com/product.php Craig, Tim. "D.C. Wire ‐ Bag Tax Raises $150,000, but Far Fewer Bags Used." Washington Post. 29 Mar. 2010. Web. 30 June
2010. <http://voices.washingtonpost.com/dc/2010/03/bag_tax_raises_150000_but_far.html>. "CRI ‐ Recycling Rates by Material and Class." Container Recycling Institute. 2006. Web. 30 June 2010. <http://www.container‐org/facts/all/data/recrates‐depnon‐3mats.htm> "Dart ‐ Recycle Polystyrene Foam." Dart ‐ Quality Single‐Use Foodservice Packaging Products. 2010. Web. 30 June 2010. <http://www.dartcontainer.com/web/environ.nsf/pages/enrecy.html> De la Puente, Gabriela. “Recycling polystyrene into fuels by means of FCC: performance of various acidic catalysts.” Applied Catalysis B: Environmental 19 (1998) 305‐311. De Marco, I. et al. “Pyrolysis of the rejects of a waste packaging separation and classification plant”. Journal of Analytical and Applied Pyrolysis 85 (2009) 384‐391. "Density Range." The Association of Postconsumer Plastic Recyclers. Web. 30 June 2010. <http://www.plasticsrecycling.org/technical_resources/design_for_recyclability_guidelines/density_range.asp> "DSNY ‐ Public Information ‐ Annual Reports." NYC.gov. 2010. Web. 30 June 2010. <http://www.nyc.gov/html/dsny/html/Pub_Info/annual.shtml> Dodbiba, G. “The use of air tabling and triboelectric separation for separating a mixture of three plastics.” Minerals Engineering
18 (2005) 1350‐1360. Duh B. “Effect of antimony catalyst on solid‐state polycondensation of poly(ethyleneterephthalate)”. Polymer 2002;43:3147– 54. "Ecosheet." Environmental Recycling Technologies Plc. Mar. 2009. Web. 30 June 2010. <http://www.eco‐sheet.com/home> Effect of Temperature and Other Factors on Plastics and Elastomers (2nd Edition) EIA – Methodology for Allocating Municipal Solid Waste to Biogenic and Non‐Biogenic Energy Eisenreich. Norbert, et al. “Fast Identification of Plastic Materials by Near‐Infrared Spectroscopy” Conversion of Polymer Wastes
and Energetics (1994) pp21‐30. Encinar, J.M. and J.F. Gonzalez. “Pyrolysis of synthetic polymers and plastic wastes. Kinetic study” Fuel
Processing Technology 89 (2008) 678‐686. "Envion Technology." Envion | Waste to Resource. 2009. Web. 30 June 2010.
<http://envion.com/evp_theenviontechnology.html>. EPA “MSW Characterization Methodology”. EPA, "Municipal Solid Waste Generation, Recycling, and Disposal in the United States" 2008 EPA “Municipal Solid Waste in the United States, 2008 Facts & Figures.” United States Environmental Protection Agency (EPA),
table 25.

63
EPA, “Opportunities to Reduce Greenhouse Gas Emissions through Materials and Land Management Practices”. September 2009.
Envion | Waste to Resource. 2009. Web. 30 June 2010. <http://envion.com/>. FDA, “Recycled Plastics in Food Packaging” Web. 30 June 2010
http://www.fda.gov/Food/FoodIngredientsPackaging/FoodContactSubstancesFCS/ucm093435.htm Final Report – Life Cycle Inventory of 100% Postconsumer HDPE and PET Recycled Resin from Postconsumer Containers and
Packaging (2010) Finny, Dana. "Recycled Plastic Bridge at Fort Bragg Stands up to M‐1 Tank Traffic." Web. 30 June 2010. Fletcher, B.L. “A model of plastics recycling: does recycling reduce the amount of waste?” Resources, Conservation and
Recycling 17 (1996) 141‐151. Franklin Associates. “Cradle‐to‐Gate Life Cycle Inventory of Nine Plastics Resins and Two Polyurethane Precursors.” Report
prepared for The Plastics Divison of the American Chemistry Council (2007). Fraunholcz, N. “Separation of waste plastics by froth flotation – a review, part I” Minerals Engineering 17 (2004) 261‐268. Fortelny, I. et al. “An efficient method of material recycling of municipal solid waste.” Polymer Degradation and Stability 85
(2004) pp 975‐979 Gleick, P. H. and H. S. Cooley. “Energy implications of bottled water.” Environmental Research Letters 4 (2009) 014099. Goncalves, Cecilia K. et al. “Emissions from Premixed Combusion of Polystyrene.” Energy & Fuels 22 (2008) pp354‐362. " Green Chemistry: Non‐metallic Catalysts for Polymerization and Depolymerization." IBM Research. Web. 30 June 2010.
<http://www.almaden.ibm.com/st/chemistry/ps/catalysts/Green/> "Green" Handsets." ABI Research ‐ Technology Market Research in Wireless Cellular Automotive RFID Security IP Telephony
Semiconductor Energy. 2010. Web. 30 June 2010. <http://www.abiresearch.com/research/1004703>. Green, Irene. "Cities Joining the Curbside Composting Bandwagon." The Green Home Makeover. 27 Apr. 2009. Web. 30 June
2010. <http://yourgreenfriend.com/cities‐joining‐the‐curbside‐composting‐bandwagon/>. Hall, William J. “Analysis of products from the pyrolysis of plastics recovered from the commercial scale recycling of waste
electrical and electronic equipment.” Journal of Analytical and Applied Pyrolysis 79 (2007) 375‐386. Hegberg, Bruce et al. “Mixed Plastics Recycling Technology” (1992) p15, p18‐41 p44, p101, p134‐138. High Beam Business Industry Report. “Plastic Materials, Synthetic Resin.” Web. 30 June 2010
http://business.highbeam.com/industry‐reports/chemicals/plastics‐materials‐synthetic‐resins‐nonvulcanizable‐ elastomers
"High Impact Polystyrene." Plastics International. Web. 30 June 2010.
<http://www.plasticsintl.com/datasheets/Polystyrene.pdf>. Hohn, Donovan. “Moby Duck”. Harpers, January 2007. Web. 30 June 2010
http://www.harpers.org/archive/2007/01/0081345 Holusha, John. "McDonald's Expected to Drop Plastic Burger Box ‐ NYTimes.com." The New York Times. 01 Nov. 1990. Web. 30
June 2010. <http://www.nytimes.com/1990/11/01/business/mcdonald‐s‐expected‐to‐drop‐plastic‐burger‐ box.html>.
Holusha, John. "McDonald's Plastic Recycling Plan ‐ NYTimes.com." The New York Times. 27 Oct. 1989. Web. 30 June 2010.
<http://www.nytimes.com/1989/10/27/business/mcdonald‐s‐plastic‐recycling‐plan.html>. "How Discarded Computers Are Poisoning Africa's Kids." ABCNews.com ‐ Breaking News, Politics, Online News, World News,
Feature Stories, Celebrity Interviews and More ‐ ABC News. 7 Dec. 2009. Web. 01 July 2010. <http://abcnews.go.com/print?id=9266722>.
Johansson, J.E. Plastics – the compelling facts and figures. PlasticsEurope. Jones, Blake. "Sorting out the Bottle Bill." PostStar.com ‐ Glens Falls, Saratoga, Lake George. 23 Nov. 2009. Web. 30 June 2010.
<http://www.poststar.com/news/local/article_7bdb1532‐d7e5‐11de‐ad51‐001cc4c03286.html>.

64
Joo, H.S. and James A. Guin. “Continuous upgrading of a plastics pyrolysis liquid to an environmentally favorable gasoline range product.” Fuel Processing Technology 57 (1998) 25‐40.
Kahlenberg, Rebecca. “Curbside Recycling Proves An Easy Way to Go Green”, Washington Post. April 15, 2005. Web. 30 June
2010 http://www.washingtonpost.com/wp‐dyn/articles/A56135‐2005Apr15.html/?nav=lb Kang, Hai‐Yong and Julie M. Shoenung. “Electronic waste recycling: A review of U.S. infrastructure and technology options”. Kaufman, S.M.and N.J. Themelis, “Using A Direct Method to Characterize and Measure Flows of Municipal Solid Waste in the
United States”; J. Air & Waste Management. Assoc. 2009, 59: 1386‐1390. Kereszes, Szilvia et al. “Leaching of antimony from polyethylene terephthalate (PET) bottles into mineral water”. Science of
the Total Environment 407 (2009) 4731‐4735. Khullar, Mridu. "Plastic Roads Offer Greener Way to Travel in India." The New York Times. 13 Nov. 2009. Web. 30 June 2010.
<http://www.nytimes.com/2009/11/14/business/global/14plastic.html Klockenbrink, Myra. "Plastics Industry, Under Pressure, Begins to Invest in Recycling." The New York Times. 30 Aug. 1988.
Web. 30 June 2010. <http://www.nyc.gov/html/nycwasteless/html/recycling/recycle_what.shtml#symbol> Krause, H.H. and J.M.L. Penninger. “Conversion of Polymer Wastes & Energetics.” 1994. P1‐5 Kuczenski, B. & R. Geyer. “Materials flow analysis of polyethylene terephthalate in the US, 1996‐2007”. Resources,
Conservation and Recycling 54 (2010) 1161‐1169. Kuzhiyil, Najeeb and Song‐Charng Kong. “Energy Recovery from Waste Plastics by Using Blends of Biodiesel and Polystyrene in
Diesel Engines”. Lopez, A. et al. “Pyrolysis of municipal plastic wastes: Influence of raw material composition.” Article in press. Waste
Management (2010). Ludlow‐Palafox, Carlos and Howard A. Chase. “Microwave‐Induced Pyrolysis of Plastic Wastes” Ind. Eng. Chem. Res. 2001, 40,
4749‐4756. Marques, Gisela Ablas et al. “Use of froth flotation to separate PVC/PET mixtures” Waste Management 20 (2000) 265‐269. Mazda. Mazda Develops Plastic Molding Technology Which Reduces Consumption of Plastic Resins by 30 Percent. Mazda News Releases. 9 Sept. 2008. Web. 02 Sept. 2010. <http://www.mazda.com/publicity/release/2008/200809/080909c.html Marushima, Hironari et al. “Waste Plastic Treatment by Thermoselect Gasification and Reforming Process” Menad, N. et al. “Combustion of plastics contained in electric and electronic scrap.” Resources, Conservation, and Recycling 24
(1998) 65‐85. Mirza, Rukhsana. “A review of the role of plastics in energy recovery.” Chemosphere, Vol 38, No. 1 (1999) pp 207‐231 Mooallem, John. "The Self‐Storage Self." The New York Times. 2 Sept. 2009. Web. 01 June 2010.
<http://www.nytimes.com/2009/09/06/magazine/06self‐storage‐t.html>. Morris, Jeffrey. “Recycling versus incineration: an energy conservation analysis”. Journal of Hazardous Materials 47 (1996)
277‐293. Muncke, Jane.“Exposure to endocrine disrupting compounds via the food chain: Is packaging a relevant source?” Science of the
Total Environment (2009). "Municipal Recycling Survey." Waste & Recycling News | Waste Management/Recycling/Landfill Headlines. 2010. Web. 30 June
2010. <http://www.wasterecyclingnews.com/rankings/mrs2009.html>. Musgrove, Mike. "Turning Trash into Fuel: D.C. Start‐Up Aims to Pitch Oil Made From Plastic Waste." The Washington Post. 16
Sept. 2009. Web. 30 June 2010. <http://www.washingtonpost.com/wp‐dyn/content/article/2009/09/15/AR2009091503264.html>
National Post‐Consumer Recycled Plastic Bag & Film Report, American Chemistry Council. 2007. NatureWorks LLC. “Using Near‐Infrared Sorting to Recycle PLA Bottles.” 2009 (Whitepaper) NewlyGreens Radio Edition, audio podcast interview. 8 April 2010. Web. 30 June 2010
http://newlygreens.com/podcasts/john‐griffith‐climax‐global‐energy/

65
"New York City Transit and the Environment." Metropolitan Transportation Authority. Web. 301 June 2010. <http://www.mta.info/nyct/facts/ffenvironment.htm#aru>
Nnorom, Innocent Chidi and Oladele Osibanjo. “Sound managemenet of bromanted flame retarded (BFR) plastics from
electronic wastes: State of the art and options in Nigeria”. Resources, Conservation and Recycling 52 (2008) 1362‐1372.
"The Numbers …Believe It or Not." Eco‐friendly Reusable Bags, plus Facts & News on Plastic Bag Issue. Web. 30 June 2010.
<http://www.reusablebags.com/facts.php?id=4>. NYC WasteLess. “What and How to Recycle in New York City.” Web. 30 June 2010
http://www.nyc.gov/html/nycwasteless/html/recycling/recycle_what.shtml#symbol Park et al. “Triboelectric series and charging properties of plastics using the designed vertical‐reciprocation charger.” Journal
of Electrostatics 66 (2008) 578‐583. Park Slope Food Co‐op, “Plastics Recycling”. Web. 30 June 2010 http://foodcoop.com/go.php?id=112 "Pipe." Vinyl in Design. Web. 30 June 2010. <http://www.vinylbydesign.com/site/page.asp?CID=14&DID=15>. Plastics Insitute of America: Plastics Engineering Manufacturing and Data Handbook (2001) p63,
p173, p177‐178. Plastic Debris from River to Sea. Algalita Marine Research Foundation. Web. 30 June 2010.
<http://www.algalita.org/pdf/PLASTIC%20DEBRIS%20ENGLISH.pdf>. “Polybrominated diphenylethers (PBDEs).” Web. 30 June 2010 http://www.epa.gov/oppt/pbde “Recast of the WEEE and RoHS Directives proposed in 2008.” 6 March 2010. Web. 30 June 2010
http://ec.europa.eu/environment/waste/weee/index_en.htm Recyclability by Design Recycling of PVC and Mixed Plastic Waste (1996) p8 RISE ABOVE PLASTICS. 2009. Web. 30 June 2010. <http://riseaboveplastics.org/>. "Seattle Mayor's Proposal Counters National Recycling Trend Bag Tax, Product Ban Risk the Environment." Americanchemistry.
4 Apr. 2008. Web. 30 June 2010. <http://www.americanchemistry.com/s_acc/sec_news_article.asp?CID=206&DID=7208>.
Siddique, Rafat, et al. “Use of recycled plastic in concrete: A review.” Waste Management 28 (2008)
1835‐1852. Smit, Debra D. "EcoClean Burners on Target for $1M for Plastic to Energy Tech, Hiring 54." PopCity, 23 Sept. 2009. Web. 30
June 2010. <http://www.popcitymedia.com/innovationnews/ecoclean0923.aspx>.
"Take Plastic Full Circle." American Society for Plasticulture. 23 Apr. 2010. Web. 30 May 2010. <http://plasticulture.cas.psu.edu/gr.html>
Tuss, Robert. "GR‐TECH Boiler Statistics 1." Web log post. WASTE PLASTIC TECHNOLOGY. 3 Dec. 2009. Web. 30 June 2010.
<http://wasteplastictechnology.blogspot.com/2006/12/gr‐tech‐boiler‐statistics‐1.html>. "UNEP :: Regional Seas Programme :: Marine Litter." ‐‐ United Nations Environment Programme (UNEP) ‐ Home Page ‐‐. Web. 30
June 2010. <http://www.unep.org/regionalseas/marinelitter/about/distribution/default.asp>. “Understanding Plastic Film : Its Uses, Benefits, and Waste Management Options, American Plastics Council” December 1996.
Web. 30 June 2010 http://www.americanchemistry.com/s_plastics/bin.asp?CID=1211&DID=4603&DOC=FILE.PDF UNITED STATES NATIONAL POST‐ CONSUMER PLASTICS BOTTLE RECYCLING REPORT. 2008. Web. 30 June 2010 http://www.americanchemistry.com/s_plastics/sec_content.asp?CID=1593&DID=10383 Veto, Joanne. "Free Recycling Through the Mail." USPS ‐ The United States Postal Service. 17 Mar. 2008. Web. 30 June 2010. <http://www.usps.com/communications/newsroom/2008/pr08_028.htm> Valavanidis, Athanasios et al. “Persistent free radicals, heavy metals and PAHs generated in particulate soot emissions and

66
residue ash from controlled combustion of common types of plastics.” Journal of Hazardous Materials 156 (2008) 277‐ 284. Wagner, Tara L. "E‐Waste Recycling Comes to Union Square ‐ NY1." Top Stories ‐ ‐ NY1.com. 4 Jan. 2010. Web. 01 June 2010.
<http://www.ny1.com/5‐manhattan‐news‐content/top_stories/111396/e‐waste‐recycling‐comes‐to‐union‐ square>.
Watts, John. "China Plastic Bag Ban 'has Saved 1.6m Tonnes of Oil' | Environment | Guardian.co.uk." Guardian.co.uk. 22 May
2009. Web. 30 June 2010. <http://www.guardian.co.uk/environment/2009/may/22/china‐plastic‐bags‐ban‐ success>
"Waste Plastics as Fuel." Penn State: College of Agricultural Sciences, 2008. Web. 30 June 2010.
<http://downloads.cas.psu.edu/RenewableEnergy/Plastofuels08.pdf>. Waste & Recycling News. “Municipal Recycling Survey 2009”. Web. 30 June 2010. http://www.wasterecyclingnews.com/rankings/pubsurvey2009.html West, Larry. "Reusable Bags ‐ Paper, Plastic, or Something Better?" Environmental Issues ‐ News and Information about the
Environment. Web. 30 June 2010. <http://environment.about.com/od/recycling/a/reusablebags.htm> Woodard, R. et al. “Participation in curbside recycling schemes and its variation with material types.” Waste Management 26
(2006) 914‐919. Wu, Chunfei and Paul T. Williams. “Hydrogen production by steam gasification of polypropylene with various nickel catalysts.”
Applied Catalysis B: Environmental 87 (2009) 152‐161. Xiao et al. “Electrostatic Separation and Recovery of Mixed Plastics”.
<http://americanchemistry.com/s_plastics/doc.asp?CID=1588&DID=6046> Yarow, Jay. "Seattle Rejects Its Plastic Bag Tax." Business Insider. 19 Aug. 2009. Web. 30 June 2010.
<http://www.businessinsider.com/seattle‐rejects‐its‐plastic‐bag‐tax‐2009‐8> Zhou, Limin et al. “Co‐pyrolysis characteristics and kinetics of coal and plastic blends.” Energy Conversion and Management 50
(2009) 705‐710. Zia, Khalid Mahmood et al. “Methods for polyurethane and polyurethane composites, recycling and recovery: A review.”
Reactive & Functional Polymers 67 (2007) 675‐692.