
Current Assessment Practices 2008-09.pdf
26
Measuring Outcomes & Documenting Impact 2/20/2015 EVALUATION AT THE TECH MUSEUM OF INNOVATION Assessment Brief: Informal Science Education (ISE) During the 2008-09 academic year, the Education Dept. began field testing a series of evaluation instruments to gauge some of the STEM-related, short-term outcomes and attitudinal markers of both K- 12 students and their teachers and among afterschool student groups and their activity leaders. Without supplemental funding, the Education team piloted and validated a series of paper-based surveys to measure 1) satisfaction with & appropriateness of the educational intervention among teachers, 2) student engagement in hands-on science workshops, 3) task completion & comprehension, and 4) attitudes towards science & STEM subjects. Summer 2008: Establishing a research base A review of the literature on outcome-based program planning and impact measurement was conducted by the Education and Development teams. The key finding of this review of best-practices and state-of- knowledge in the field is that while there is intense interest in the subject of evaluating informal science learning and instruction, few industry-wide instruments exist or are agreed upon by the museum field. With respect to informal learning environment, in fact, there is disagreement as to whether or not more traditional, academic measures of domain knowledge are even appropriate measures of impact, given the short-term nature of experiences arising from fieldtrips, labs or workshops. While everyone agrees that informal science instruction should be articulated and aligned to state science-content standards and national process standards, few agree as to how best to implement such an assessment regime. Additionally, the large “treatment population” for museums and science centers makes the logistics of surveying and analysis non-trivial and labor-intensive, even when online toolsets like SurveyMonkey.com are employed. Major studies conducted over the past several years on the issues of evaluation and assessment in informal learning environments has been conducted by NSF, CAISE and the Noyce Foundation. The key findings of these studies have informed the evaluation philosophy the Tech Museum’s Education Dept. has decided upon implementing across all the Museum’s educational platforms from labs and galleries to films and the annual Tech Challenge. The object of analysis is not so much STEM content, per se, but on attitudes towards science, process skills learned and behavioral markers, such as information-seeking behavior, career-path interest, and identity/interest development. These conceptual strands align with the recently published evaluative outcomes recommended by the National Research Council and NSF on Learning Science in Informal Environments (LSIE-ES-2). Learners in informal environments: Strand 1: Experience excitement, interest, and motivation to learn about phenomena in the natural and physical world. Strand 2: Come to generate, understand, remember, and use concepts, explanations, arguments, models and facts related to science. Strand 3: Manipulate, test, explore, predict, question, observe, and make sense of the natural and physical world. Strand 4: Reflect on science as a way of knowing; on processes, concepts, and institutions of science; and on their own process of learning about phenomena. Strand 5: Participate in scientific activities and learning practices with others, using scientific language and tools. Strand 6: Think about themselves as science learners and develop an identity as someone who knows about, uses, and sometimes contributes to science. The Tech Museum of Innovation Alysa Caryl & Carlos F. Camargo Page 1
-
Upload
arete-management-consulting -
Category
Documents
-
view
84 -
download
1
Transcript of Current Assessment Practices 2008-09.pdf

Measuring Outcomes & Documenting Impact 2/20/2015
EVALUATION AT THE TECH MUSEUM OF INNOVATION
Assessment Brief: Informal Science Education (ISE)
During the 2008-09 academic year, the Education Dept. began field testing a series of evaluation instruments to gauge some of the STEM-related, short-term outcomes and attitudinal markers of both K-12 students and their teachers and among afterschool student groups and their activity leaders.
Without supplemental funding, the Education team piloted and validated a series of paper-based surveys to measure 1) satisfaction with & appropriateness of the educational intervention among teachers, 2) student engagement in hands-on science workshops, 3) task completion & comprehension, and 4) attitudes towards science & STEM subjects.
Summer 2008: Establishing a research base
A review of the literature on outcome-based program planning and impact measurement was conducted by the Education and Development teams. The key finding of this review of best-practices and state-of-knowledge in the field is that while there is intense interest in the subject of evaluating informal science learning and instruction, few industry-wide instruments exist or are agreed upon by the museum field. With respect to informal learning environment, in fact, there is disagreement as to whether or not more traditional, academic measures of domain knowledge are even appropriate measures of impact, given the short-term nature of experiences arising from fieldtrips, labs or workshops. While everyone agrees that informal science instruction should be articulated and aligned to state science-content standards and national process standards, few agree as to how best to implement such an assessment regime. Additionally, the large “treatment population” for museums and science centers makes the logistics of surveying and analysis non-trivial and labor-intensive, even when online toolsets like SurveyMonkey.com are employed.
Major studies conducted over the past several years on the issues of evaluation and assessment in informal learning environments has been conducted by NSF, CAISE and the Noyce Foundation. The key findings of these studies have informed the evaluation philosophy the Tech Museum’s Education Dept. has decided upon implementing across all the Museum’s educational platforms from labs and galleries to films and the annual Tech Challenge. The object of analysis is not so much STEM content, per se, but on attitudes towards science, process skills learned and behavioral markers, such as information-seeking behavior, career-path interest, and identity/interest development. These conceptual strands align with the recently published evaluative outcomes recommended by the National Research Council and NSF on Learning Science in Informal Environments (LSIE-ES-2).
Learners in informal environments:
Strand 1: Experience excitement, interest, and motivation to learn about phenomena in the natural and physical world.
Strand 2: Come to generate, understand, remember, and use concepts, explanations, arguments, models and facts related to science.
Strand 3: Manipulate, test, explore, predict, question, observe, and make sense of the natural and physical world.
Strand 4: Reflect on science as a way of knowing; on processes, concepts, and institutions of science; and on their own process of learning about phenomena.
Strand 5: Participate in scientific activities and learning practices with others, using scientific language and tools.
Strand 6: Think about themselves as science learners and develop an identity as someone who knows about, uses, and sometimes contributes to science.
The Tech Museum of Innovation Alysa Caryl & Carlos F. Camargo Page 1

Measuring Outcomes & Documenting Impact 2/20/2015
The six interrelated aspects of science learning covered by the strands reflect the field’s commitment to participation—in fact, they describe what participants do cognitively, socially, developmentally, and emotionally in these settings. The strands are distinct from, but overlap with, the science-specific knowledge, skills, attitudes, and dispositions that are ideally developed in schools.
Given that the LSIE strands of science learning provide The Tech a solid research base from which to build upon as it moves to develop a comprehensive evaluation plan institution wide, the Education Dept. decided to pilot several evaluation tools and qualitative research instruments in the fall of 2008.
Fall 2008: Piloting Survey Instruments for Leonardo
During the fall 2008, the Museum hosted a blockbuster exhibition on “Leonardo: 500 Years into the Future,” from late September to late January 2009. During the exhibition, all educational platforms carried content related to the Leonardo and Renaissance science themes. In particular, a hands-on lab series named “Leonardo’s Inventors Workshop,” during the academic semester was conducted and used as the test-bed for several survey instruments. Leo Lab Evaluation tools were created 1) to measure a baseline “science attitude inventory” among 600 G3-8 students, and 2) to measure task completion related to design and construction of mechanical sculptures or automata during over 100 lab sessions. Additionally, print-based and online surveys were administered to 200 G3-8 teachers to measure satisfaction, comprehension and standards appropriateness of lab materials and instruction. Appendix E has details on the results of the Leo Labs assessment.
From these evaluations we learned that while interest and engagement in hands-on science was high among elementary and middle schools students taking the Leo Labs (90% reported that science was fun and enjoyable) that did not translate, in the near-term, into increased interest in STEM career interest or STEM identity orientations (over 90% reported they did not want to be a scientist when they grew up). However, both the teachers and the students reported wanting to repeat their hands-on learning experiences and in continuing to explore design challenge learning. Over 85% of teachers ands students reported that they would recommend the DCL workshops to peers, and that they would return to the museum for similar learning opportunities throughout the academic year. The results of this evaluation research were reported out to the Bechtel Foundation as part of the final grant report for the “Mechanical Cabaret” award in December 2008.
To date, teacher surveys have focused on capturing data relevant to Strands 3, 4 & 5, while student surveys have emphasized capturing data relevant to Strands 1, 2 & 6. Moreover, the student assessment tool comprised a short 5-10 question science attitude inventory employing a 5 point Likert scale. The student questionnaire was modeled on Science Attitude Inventory II developed by Moore & Foy (SAI 1997) and modified by the Education Dept. for use in DCL labs. The teacher assessment tool comprised a 20-25 Likert-scaled questionnaire with four open-ended queries touching upon reflective practice, standards appropriateness and satisfaction with course outputs. Both surveys were administered in print, but results transferred online for analysis in SurveyMonkey. The 200 teacher surveys took 2 volunteers 20-manhours each to enter data online, while the 600 student surveys took two volunteers 40-manhours to code, count and analyze using Excel spreadsheets. All surveys were administered post-intervention, on-site at the Museum. Other modalities of administration and completion will be explored using online tools.
Data from the student and teacher surveys provided the first quantifiable validation of the Year-round 2nd Classroom (YR2C) operational philosophy, where K-12 school sites use The Tech as an “outsourced science learning center,” given the lack of tools, trained staff and time devoted to science instruction in the shadow of high-stakes testing NCLB mandates statewide.
Using modified and improved evaluation instruments that removed ambiguity and strove for brevity, the Education team developed more generalizable evaluation instruments for use in all in-school-time (IST) hands-on science workshops and DCL programs for out-of-school time (OST). The new instruments are both paper-based and will require data-entry into online systems for analysis and reporting. However, with these general lab surveys in hand, the Education Dept. now has a tool set to help measure the efficacy of instruction, learner satisfaction and learner engagement moving forward. At this point in time,
The Tech Museum of Innovation Alysa Caryl & Carlos F. Camargo Page 2
Measuring Outcomes & Documenting Impact 2/20/2015
the Education Dept. has chosen to administer the survey to teachers and students based on a systemically-random sampling methodology—i.e. labs on certain days of the week or certain times of the day. While it would be impossible and impractical to survey all 175,000 student gallery visitors or the 30,000 lab participants or 4,200 teacher members, it is feasible to sample a random subset of all these populations using a systemic random technique. Each such sub-sample will comprise 500 students and 100 teachers, to provide margins of error of ± 5% and ± 10%, respectively for each treatment group surveyed.
During the course of the fall semester, two new employees were added to the Education Dept.: a senior lab coordinator, Julie Smith, and a curriculum/evaluation specialist, Mandy Baughman. With the addition of this staff to assist Education Director Alysia Caryl manages YR2C programs, the evaluation and assessment capacity of the department increased markedly and became a focal point of attention and activity for the development of best practices and practical evaluation tools. While the curriculum specialist is primarily attached to creation of educational content to accompany the Tech Awards Gallery due to open in summer 2009, her charter has encompassed design, development and administration of evaluation instruments to randomly selected treatment groups. In conjunction with the part-time educational staff, the evaluation specialist and Education Director have been able to work with the senior lab coordinator to ensure that survey administration, collection and analysis become standard operating procedures in all IST labs and OST workshops.
Chicago OST Conference: The ECC Trilogy for Student Success
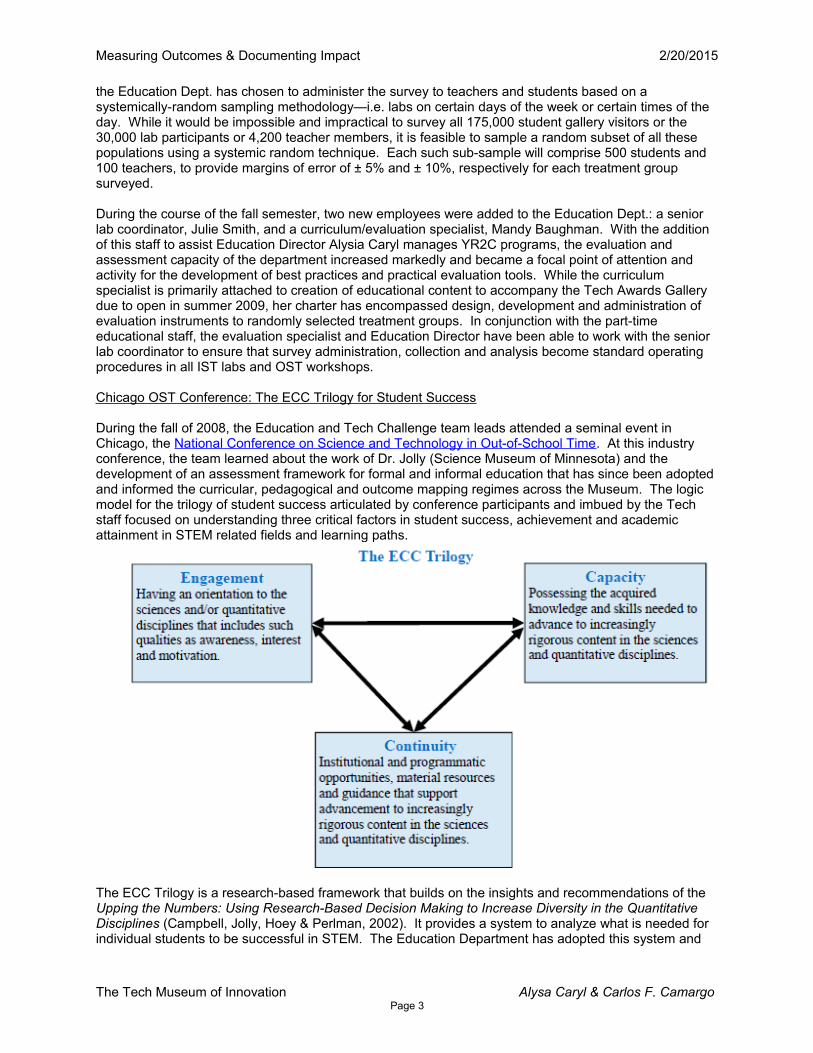
During the fall of 2008, the Education and Tech Challenge team leads attended a seminal event in Chicago, the National Conference on Science and Technology in Out-of-School Time. At this industry conference, the team learned about the work of Dr. Jolly (Science Museum of Minnesota) and the development of an assessment framework for formal and informal education that has since been adopted and informed the curricular, pedagogical and outcome mapping regimes across the Museum. The logic model for the trilogy of student success articulated by conference participants and imbued by the Tech staff focused on understanding three critical factors in student success, achievement and academic attainment in STEM related fields and learning paths.
The ECC Trilogy is a research-based framework that builds on the insights and recommendations of the Upping the Numbers: Using Research-Based Decision Making to Increase Diversity in the Quantitative Disciplines (Campbell, Jolly, Hoey & Perlman, 2002). It provides a system to analyze what is needed for individual students to be successful in STEM. The Education Department has adopted this system and
The Tech Museum of Innovation Alysa Caryl & Carlos F. Camargo Page 3

Measuring Outcomes & Documenting Impact 2/20/2015
framework in its formulation, design and implementation of education programs using the DCL methodology, in the belief that:
“The underlying assumption of the Engagement, Capacity and Continuity Trilogy (ECC Trilogy) is that these three factors must be present for student success. Each of these factors is necessary but individually is not sufficient to ensure student continuation in the sciences and quantitative disciplines. The factors are interdependent. The absence of one can have an impact on the degree to which the others are present. For example, without knowledge and skills (Capacity) many individuals will not be able to take advantage of available opportunities and resources (Continuity). However, Capacity is based at least in part on earlier Continuity.” (Jolly, 3-4)
The model provides a rubric for outcome mapping and measurement that aligns with The Tech’s Theory of Change by offering a common vocabulary, frame and toolkit to measure the impact of our informal educational interventions from the gallery floors to the behind-the-scenes, hands-on science labs. Outlined below is a schema of how each factor in the model is implemented and assessed by the emerging evaluation regime.
Measuring Success: Engagement, Capacity & Continuity
1) Engagement includes awareness, interest and motivation. Researchers have identified, and Tech staff will be utilizing a wide assortment of engagement indicators, including:
Classroom behaviors such as task completion, attendance, following classroom rules, time on task, effort, asking questions to get information and persistence in subjects in the sciences and/or quantitative disciplines;
Student factors such as ability to perceive oneself as a mathematician or scientist, seeing the utility of the sciences and/or quantitative disciplines, voluntary participation in both in- and out-of-school activities in the sciences and quantitative disciplines;
Positive attitudes toward subjects in the sciences and quantitative disciplines and toward careers in these areas
2) Capacity includes student knowledge and skills. Capacity may be registered and measured across the multiple intelligences, postulated by Howard Gardner, that student may demonstrate in different areas such as:
Logical-mathematical: number, categorization, relations Spatial: accurate mental visualization, mental transformation of images Naturalistic: recognition and classification of objects in the environment Linguistic: syntax, phonology, semantics, pragmatics.
It also may be measured at multiple levels, including hierarchical levels such as those found in Bloom’s Taxonomy:
Knowledge of terminology: specific facts, ways and means of dealing with specifics, defined here as the remembering of appropriate, previously learned information.
Comprehension: Grasping (understanding) the meaning of informational materials. Application: Using previously learned information in new and concrete situations to
solve problems that have single or best answers. Analysis: Deconstructing information into its component parts, examining and trying to
understand the organizational structure of information to develop divergent possible conclusions by identifying motives or causes, making inferences and/or finding evidence to support generalizations.
Synthesis: Creatively or divergently applying prior knowledge and skills to produce new or original whole.
Evaluative: Judging the value of material based on personal values/opinions, resulting in an end product, with a given purpose and without real right or wrong answers.
The Tech Museum of Innovation Alysa Caryl & Carlos F. Camargo Page 4
Measuring Outcomes & Documenting Impact 2/20/2015
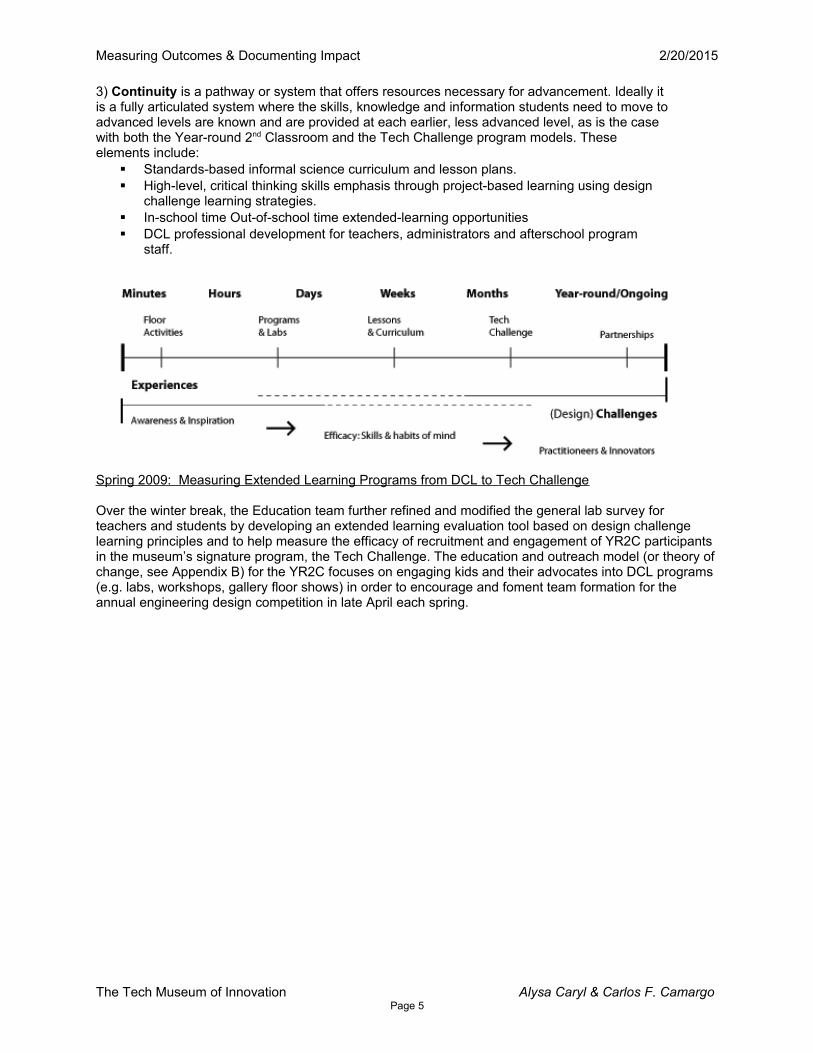
3) Continuity is a pathway or system that offers resources necessary for advancement. Ideally it is a fully articulated system where the skills, knowledge and information students need to move to advanced levels are known and are provided at each earlier, less advanced level, as is the case with both the Year-round 2nd Classroom and the Tech Challenge program models. These elements include:
Standards-based informal science curriculum and lesson plans. High-level, critical thinking skills emphasis through project-based learning using design
challenge learning strategies. In-school time Out-of-school time extended-learning opportunities DCL professional development for teachers, administrators and afterschool program
staff.
Spring 2009: Measuring Extended Learning Programs from DCL to Tech Challenge
Over the winter break, the Education team further refined and modified the general lab survey for teachers and students by developing an extended learning evaluation tool based on design challenge learning principles and to help measure the efficacy of recruitment and engagement of YR2C participants in the museum’s signature program, the Tech Challenge. The education and outreach model (or theory of change, see Appendix B) for the YR2C focuses on engaging kids and their advocates into DCL programs (e.g. labs, workshops, gallery floor shows) in order to encourage and foment team formation for the annual engineering design competition in late April each spring.
The Tech Museum of Innovation Alysa Caryl & Carlos F. Camargo Page 5

Measuring Outcomes & Documenting Impact 2/20/2015
The evaluation regime implemented for the “Tech Challenge 2009: Explore the Volcano” (TC09) encompasses three surveys based on the CARS model administered 1 week after the November Information Clinic and thereafter until the day of the event, as a pre-event assessment completed by 185 G-12 TC09 registrants, followed by a day-of-event 1-page, written “content reflection” piece completed by 400 G5-12 students, and a post-event online instrument to measure short-term outcomes like attitude and motivation, and a 4th online instrument administered in late June and early July to capture more longer term outcomes, such as career path interest, return-visit behavior and process skills learning. TC09 attracted over 1,000 students and survey links will be emailed to all participants and their advisors during phase B and C. The TC09 evaluation instrument is based on the “Changing Attitudes related to Science” (CARS) developed at UC Berkeley and piloted at the Lawrence Hall of Science in 2003.
Evaluation Phase
InstrumentsDate
AdministeredTreatment Groups
A
Pre-event Team Workshop Survey
Online Survey-A (SurveyMonkey)
Nov08-Mar09
March 2009
Workshop Participants
TC09 Registrants
B
Day-of-Event Content & Process Reflection
Online Survey-B (SurveyMonkey)
April 2009
May 2009
TC09 Registrants
TC09 Registrants
C Online Survey-C (SurveyMonkey) July 2009 TC09 Registrants
To date, Phase A has garnered 158 responses, Phase B resulted in 400 completed reflection narratives, and during Phase C 1,034 survey links were sent on 1 May 2009 to all TC09 participants and another set of 1,034 will be emailed in July 2009 to students and coaches to complete the TC09 evaluation cycle.
Summer 2009: Tech Awards Gallery Educational Program & Assessment
The Tech Museum of Innovation Alysa Caryl & Carlos F. Camargo Page 6

Measuring Outcomes & Documenting Impact 2/20/2015
Starting in spring 2008, the Tech Awards Gallery (TAG) curator Tina Blaine and the curriculum specialist have worked out a series of front-end evaluations to help inform the types of exhibit interactive that would make up the final gallery to open in mid-June 2009. The new gallery will feature the projects and work of eleven Tech Award Laureates featuring how technology can benefit humanity.
The educational programming that complements the TAG will be developed and field-tested between January and June 2009. Floor programming will feature docent-led tours and exhibit interpreters. Pre-visit curriculum guides and post-visit classroom materials will be developed after all eleven exhibits are in place and feedback sessions have been conducted with teachers and students by way of front-end evaluation for appropriateness of interactives. In the interim, curricular materials will be field tested with select elementary, middle and high schools during by the Education Dept. Those evaluations will consist of focus groups, group interview and 1:1 interviews with teachers and students participating in the YR2C program, like the Franklin-McKinley school district. Formative and summative evaluations will be conducted internally by the Education Dept. and will be reported out in fall 2009. Additionally, remediation evaluations may be conducted once the exhibit goes live in late June and all program components are deployed across the galleries and labs. Additional details on the educational plan for the new gallery are outlined in Appendix D below. Assessment is planned according to the table below:
The Tech Museum of Innovation Alysa Caryl & Carlos F. Camargo Page 7
TAG Evaluation
Evaluate curriculum and student impact during development
Evaluate impact on student learning after widely implemented
In-gallery field tests
Teacher surveys
5/09
3/10

Measuring Outcomes & Documenting Impact 2/20/2015
Appendix A: Criteria for Determining Sample Size for Survey Participants
In order to have confidence that our survey results are representative, it is critically important that we have a large number of randomly-selected participants in each group we survey. So what exactly is "a large number?" For a 95% confidence level (which means that there is only a 5% chance of our sample results differing from the true population average), a good estimate of the margin of error (or confidence interval) is given by 1/√N, where N is the number of participants or sample size (Niles, 2006).
The table below shows this estimate of the margin of error for sample sizes ranging from 10 to 10,000.
sample size(N)
margin of error(fraction)
margin of error(percentage)
10 0.316 31.6
20 0.224 22.4
50 0.141 14.1
1000.100 10.0
200 0.071 7.1
500 0.045 4.5
1000 0.032 3.2
2000 0.022 2.2
5000 0.014 1.4
10000 0.010 1.0
We can quickly see from the table that results from a survey with only 10 random participants are not reliable. The margin of error in this case is roughly 32%. This means that if we found, for example, that 6 out of our 10 participants (60%) were satisfied with the workshop or learned X in the lab, then the actual proportion of the population that was satisfied with the workshop or learned X in the labe could vary by ±32%. In other words, the actual proportion could be as low as 28% (60 − 32) and as high as 92% (60 + 32). With a range that large, our small survey isn't saying much—i.e. a waste of time.
If we increase the sample size to 100 people, our margin of error falls to 10%. Now if 60% of the participants reported learning X, there would be a 95% probability that between 50 to 70% of the total population have learned X. Now we're getting somewhere. If we want to narrow the margin of error to ±5%, we have to survey 500 randomly-selected participants. The bottom line is, we need to survey a lot of people before we can start having any confidence in our results.
• This webpage calculates the sample size required for a desired confidence interval, or the confidence interval for a given sample size: Creative Research Systems."Sample Size Calculator," http://www.surveysystem.com/sscalc.htm.
The Tech Museum of Innovation Alysa Caryl & Carlos F. Camargo Page 8

Measuring Outcomes & Documenting Impact 2/20/2015
• This website has information on statistics and statistical tests, written for the non-mathematician: Niles, Robert, 2006. "Robert Niles' Journalism Help: Statistics Every Writer Should Know," RobertNiles.com http://www.robertniles.com/stats/.
The Tech Museum of Innovation Alysa Caryl & Carlos F. Camargo Page 9

Measuring Outcomes & Documenting Impact 2/20/2015
Appendix B: YR2C Theory of Change and Action
Our primary institutional objective is to become a single-source “Year Round 2nd Classroom” (YR2C) for teachers, students, and people of all ages who need a world-class science facility and well-constructed educational programs to improve their STEM (e.g., science, technology, engineering and math) proficiency. The overall long-term goal throughout the Museum's K-12 programs is to increase student achievement in Science, Technology, Engineering, and Mathematics (STEM).
Our theory of change is premised on research that stresses the importance of the quality of teaching and student learning, and more specifically teacher classroom practice and student engagement strategies centered on hands-on, collaborative inquiry—an approach that research supports is critical to increasing student achievement using inquiry-based best practices. Improving teacher practice and student achievement involves deepening their knowledge of science and scientific habits of mind, increasing their capacity in instructional decision-making, and increasing their use of exemplary curricular resources based on our signature Design-in-Mind® pedagogy.
The basis of The Tech’s learning pedagogy is Design Challenge Learning, which contends that knowledge is not just acquired, but rather is applied by participating or “doing” in the process of design . Derived from a learning theory that asserts that people learn best when placed in the active role of a designer or builder, design learning offers participants ways to explore and apply existing knowledge, while also acquiring new knowledge. (Design and inquiry are the two fundamental approaches for teaching and learning science as prescribed by the American Association for the Advancement of Science and the National Research Council in their National Science Standards documents.) Under this approach, students are encouraged to investigate inquiry-based topics, think creatively, try and make mistakes, and apply personal experiences and talents to find innovative, original solutions and learn to view themselves as scientists and problem solvers. Studies have shown that design-based learning
The Tech Museum of Innovation Alysa Caryl & Carlos F. Camargo Page 10

Measuring Outcomes & Documenting Impact 2/20/2015
engages youth who are not normally interested in science or math, and do not respond well to traditional teaching techniques1. This style of teaching addresses the key learning barriers among traditionally disenfranchised learners and provides them with a clear path toward becoming competent problem solvers, thus increasing their chances of pursuing coursework and careers in science, technology and engineering.2
Year-round 2nd Classroom: Design Challenge Learning Continuum
Design Challenge Curriculum: Design Challenge Learning represents an essential aspect of The Tech's Design in Mind Learning pedagogy where students engage in the design process to solve a relevant, authentic, real-world problem. Student teams apply and reinforce their Science as well as
Mathematics, Social Studies and Language Arts content knowledge, through an open-ended design process that results in an original solution. Students take responsibility for assessing their own progress
and incorporate peer feedback as they conceptualize and redesign their projects.
The Design Challenge Learning (DCL) curriculum serves as a leading edge in addressing intermediary goals toward these ends:
1) By promoting both age-appropriate, standards-based science content knowledge, and
2) By rehearsing process knowledge of the scientific method necessary for students to participate successfully in the annual Tech Challenge competition.
In offering a home-away-from home for K-12 teachers and their students through the Year-round 2nd Classroom, this effort maintains a Silicon Valley anchor, while encompassing a regional footprint through partner sites, establishing a state asset, and creating a national model to be shared with other science & technology centers, K-12 educators and informal science educators nationally through an online partnership with the Science Buddies Foundation.
The Year-round 2nd Classroom has four critical functions, which are tied to STEM best practices in teacher professional development and in hands-on, project-based science inquiry for K-12 students:
1. Give teachers and out-of-school time (OST) program providers a home and a place to create and sustain a community of learning, using both a web and brick-n-mortar footprint.
2. Provide our expertise and resources to teachers, OST providers and family who visit the museum or come for planned activities like guided fieldtrips or hands-on labs.
1 Design-Based Science and Student Learning Study, College of Education, Michigan State University, 2001and Design Challenge Institute Evaluation Summary, Inverness Research Associates, 2003
2 Inverness Research Associates project findings 2002
The Tech Museum of Innovation Alysa Caryl & Carlos F. Camargo Page 11

Measuring Outcomes & Documenting Impact 2/20/2015
3. Help teachers and OST practitioners bring their standards-based curricula alive with ideas that match the content with student inquiry and exemplary teaching practices infused with design challenge learning.
4. Provide teachers, parents and youth advocates with state-of-the art science laboratories and multimedia classrooms for the use of their students, and also let them bring home to their classrooms, after-school programs and homes extraordinary hands-on learning STEM materials that few schools or districts can afford, let alone low socio-economic status (SES) families.
1) Importance of the Tech’s DCL Theories and Strategies
All of the Tech Museum’s educational and gallery programs strive to enrich STEM learning by integrating disciplines, providing authentic and relevant experiences, and incorporating effective research-based theories and methods. Tech Museum personnel focus on:a) Creating authentic experiences that engage the learner in the habits of mind that are essential to
scientists, engineers, mathematicians, and technologists such as inquiry, logic, abstraction, pattern-making, teamwork and problem-solving.
b) Using relevant experiences that create connections between conceptual learning and its application in everyday living and the professional work environment.
c) Incorporating effective research-based theories and methods that include understanding of learners, content, instruction, assessment, and materials.
2) Increase Accessibility to STEM
All Museum programming is premised on a life-long learning model for the whole family that seeks to:
a) Involve and connect all learners to STEM by providing a welcoming and responsive, interactive environment.
b) Respect the fact that learners exist as both individuals and as members of communities that operate in a broader systems context.
c) Engage innovators of all ages by providing access to STEM programs that engages learners in a responsive, nurturing, relevant environment.
d) Elevate the relevance of STEM in people's lives by engaging learners in the hands-on exploration of the natural world and the nature of science.
3) Increase STEM Literacy among K-12 Students and their Families
Because we believe in the collaborative and social nature of all learning, Museum members and visitors are offered an array of entry points to the veritable marvels of science and the seeming miracles of emerging technologies in our belief that:
a) STEM literacy is essential for civic and economic participation, informed decision-making on personal and professional levels, and for confident community participation.
b) Understanding of the natural world provides critical knowledge about issues that impact our lives, communities, and world.
c) Science is a human endeavor that involves asking questions, conducting investigations, using evidence and logic, being skeptical and creative and communicating results.
d) Science is a social endeavor that is influenced by culture, values, and ethics.
Alignment around a Clear, Focused, and Demanding Set of DCL Standards
The Tech’s theory of change for DCL stipulates that when instructional methods and materials, assessments, data systems, and professional development are designed to work in concert with, and in support of, a set of well-defined DCL content standards, the instructional process in schools and OST
The Tech Museum of Innovation Alysa Caryl & Carlos F. Camargo Page 12

Measuring Outcomes & Documenting Impact 2/20/2015
programs will be more effective and student achievement will increase. In the ideal case, these elements interact in a relatively straightforward way:
The YR2C content standards contain a comprehensive description of what students should know and be able to do, for every grade and subject. These should be clear, focused, and reflect high expectations for student achievement.
The actual YR2C instruction that occurs in the labs and workshops, and at partner sites, uses methods designed to enable students to master the standards, based on research-based hands-on, inquiry-based methods, wherever possible.
YR2C instructional programs and materials explicitly reference the K-12 content standards, and are designed to promote mastery of them using team-based exploration and investigation strategies.
YR2C Assessments are constructed such that they diagnose students have engaged with and mastered the content and what areas they have not, and are the primary source of data
YR2C Data systems are built to track performance, motivation, engagement and changes in behavior, and are used by Museum educators, classroom teachers and OST practitioners to fine-tune their instructional approach, down to the individual student level.
DCL Professional development for teachers and OST practitioners is used to familiarize them with the standards themselves, as well as to build their capacity to effectively use informal science education tools and materials in support of YR2C instruction at the museum, at the home school and other partner venues.
By aligning these elements, we simultaneously create a unified YR2C instructional philosophy based in research, and increase our ability to support the work of instructional staff through focusing our centralized resources on promoting hands-on, inquiry-based approaches to STEM subjects.
The Tech Museum of Innovation Alysa Caryl & Carlos F. Camargo Page 13

Measuring Outcomes & Documenting Impact 2/20/2015
Year-round 2 nd Classroom (YR2C): Theory of Change Model
The Tech’s YR2C educational programs are based on the utilization of a well developed Theory of Change model. This model allows all partners to provide insight as to the current state of challenges facing our regional STEM alliance and YR2C partner eco-system, to collaborate in managing the change process, and assess the effects of the STEM-related work.
Beneficiary 1: SF Bay Area K-12 School Students ENGAGEMENT—Mobilization Phase
Current State:• Low percent of low-SES students entering and graduating from post-secondary institutions.• Low percent of students passing the math CST at the college ready standard.• Low percent of students passing the Exit science CST.
As demonstrated in the regional, state and national need for STEM, there has been a constant trend emphasizing the need to inspire, educate, engage and provide employability skills for elementary and secondary students in STEM areas. Within the area served by The Tech, students have demonstrated lack of success within special population groups and as a whole in mathematics and science on state and national standardized tests. In addition, students who are classified as low- socioeconomic and those who are Limited English Proficient, show a greater need for intervention in these areas for initial and continued success on math and science exams. Some of the attributes contributing to the lack of success of these students include minimal engagement in STEM activities, lack of opportunities for students to produce products in the areas of STEM, and the low enrollment and graduation rates of students in the STEM areas for post-secondary institutions.
Theory of Change:In response to the current situation, The Tech proposes to meet the needs of the demonstrated challenges by serving students through interventions that will transform existing practices in traditional elementary and secondary schools into effective hands-on, inquiry-infused instruction. The transformation of K-12 math and science courses will be by non-conventional means that allow students to produce high quality products that are a result of a curriculum that expands student knowledge and exposure to STEM areas in daily lessons employing design challenge learning. In addition to curriculum-based transformations, the intention of the Year-round 2nd Classroom is to provide students with ample opportunities to explore and participate in STEM activities to engage and inspire students to pursue STEM learning paths in their studies and careers.
The Tech Museum of Innovation Alysa Caryl & Carlos F. Camargo Page 14
Theory of ChangeEngage teachers & OST
providers in professional development that
is
focused on hands-on, DCL STEM.
Provide school leaders with knowledge about the STEM skills their students should focus on.
Develop and implement informal science education DCL curriculum that expands student knowledge and exposure to STEM through project-based learning.
Develop and implement a science curriculum that expands student knowledge and exposure to STEM through project-based learning for classroom use.
Intended ImpactsAll instructional
staff, teachers and students in DCL labs
and workshops will be engaged in real
world activities to prepare them for
STEM higher education paths of studies
or careers.
All students enrolled in STEM-based science classes will be engaged in real world activities to prepare them for STEM higher education paths of studies or careers .
All students enrolled in DCL workshops or labs will be encouraged and prepared to participate in the Tech Challenge.

Theory of ChangeEngage teachers and
OST providers in professional development
that is focused on DCL.
Provide educational leaders with knowledge about the skills that their students have to focus on.
Develop, modify and implement a DCL curriculum that incorporates project-based learning, expands student knowledge, and exposure to STEM.
Develop and implement a science curriculum that incorporates project-based learning, expands student knowledge, and exposure to DCL.
Intended ImpactsAll teachers and OST
providers participating in YR2C
professional development will deliver
effective DCL-based instruction.
All teachers & OST providers participating in YR2C professional development will engage students in solving real world DCL problems.
All activity leaders participating in YR2C professional development will support instructional staff in the delivery of effective DCL-based instruction and foster Tech Challenge team formation.
Measuring Outcomes & Documenting Impact 2/20/2015
Beneficiary 2: Educators/Instructional Leaders/OST PractitionersCAPACITY—Implementation Phase
Current State:
• Low percent of highly qualified math and science teachers.• Low percent of low-SES students entering and graduating from post-secondary institutes.• Low percent of students passing the math CST or STAR at the college ready standard.• Low percent of students passing the Exit CAHSEE science CST or STAR.
As the current state of education shifts into a rigorous standards-based system, which requires teachers to be accountable for student achievement and educational leaders to be accountable for classroom instruction, the STEM community is faced with the challenge of providing students within special populations the opportunities and resources required to reach college-readiness achievement standards in mathematics and science. In addition, school districts are being faced with a shortage of highly-qualified teachers in critical areas such as mathematics and science. Furthermore, there is a lack of knowledge and resources in the area of integrating hands-on and project-based elements into math and science courses that align to state and national standards.
Theory of Change:In an endeavor to transform classroom and OST practices, teachers and OST providers will be given the opportunity to engage in relevant meaningful professional development opportunities that are rooted in research and focused on student performance, utilizing the same DCL methodology geared towards fostering facilitation and coaching skills. In addition, district/school/OST leaders will be given tools to expand their knowledge and skills to support teachers with information and resources for success in STEM activities. Through the development and implementation of DCL curriculum, teachers and school leaders will be better prepared to expand student knowledge, increase exposure levels to STEM education and careers, and incorporate project-based learning to increase student success in STEM fields.
The Tech Museum of Innovation Alysa Caryl & Carlos F. Camargo Page 15

Measuring Outcomes & Documenting Impact 2/20/2015
Beneficiary 3: Community/Partner Eco-systemCONTINUITY—Institutionalization Phase
Current State:• Low percent of highly qualified after-school instructors or OST professionals with STEM
knowledge or skill sets.• Low percent of students enrolled in Level 3: Academic Enrichment OST programs• High percent of young, inexperienced and trained OST professional with high turnover rates• High percent of low-SES students entering Level 1 & 2 OST, with no academic components
Within the region, state, and nation there exists an underdeveloped central repository capable of identifying and exemplifying STEM best practices and then disseminating such information in an efficient meaningful capacity. This prevents schools and industry from making well informed decisions regarding student institutes and teacher professional development. Another result of the underdeveloped network is the lack of resources around aligned curriculum and project-based learning.
Theory of Change:Through the establishment of a well-developed DCL partner eco-system using the Science Buddies Foundation online platform, The Tech will provide information and support to all beneficiaries to ensure success in STEM education and careers, stay abreast of current issues in STEM to promote practices worthy of attention, and disseminate STEM information to all beneficiaries in a format that is aligned, appropriate, accessible and useful. The Tech, in partnership with Science Buddies Foundation, will serve as a platform and a catalyst to weave together promising practices, research-based curriculum, technology integration and leverage the combined achievements into new knowledge in STEM education and careers. The results will inform and guide educators formally and informally in planning, implementing and evaluating enriched STEM initiatives implementing design challenge learning methodologies.
The Tech Museum of Innovation Alysa Caryl & Carlos F. Camargo Page 16
Theory of ChangeProvide online and
web-based information and support to
all beneficiaries to ensure STEM
success.
Stay abreast of current issues in STEM to promote practices worthy of attention.
Disseminate STEM information to all beneficiaries in a DCL format that is aligned, appropriate, accessible and useful.
Educate parents about the significance of STEM education and career choices
Intended ImpactsIncrease the STEM
body of knowledge with an emphasis on
Title 1 populations by sharing and
disseminating DCL best-practices,
research, project-based lesson plans, and
assessment tools to school districts, youth
development programs, OST providers
and partners.
Partner School districts, OST partners, and other Science & Technology Centers will implement STEM curriculum-based projects leading to Tech Challenge team formation
Parents and partners will demonstrate increased awareness and knowledge about STEM education and careers
Additional community and industry partners will be engaged with The Tech in planning, aligning, and implementing of DCL curriculum and resources for YR2C & Tech Challenge

Measuring Outcomes & Documenting Impact 2/20/2015
Appendix C: Research on Learning in Informal Science Environments
Relevant Studies in ISE:
Bell, P. et. al. (March 2009) Learning Science in Informal Environments: People, Places, and Pursuits [On-line]. (Available at: http://www.nap.edu/catalog.php?record_id=12190 and Executive Summaryhttp://www.nap.edu/catalog/12190.html)
Friedman, A. (Ed.). (March 12, 2008). Framework for Evaluating Impacts of Informal Science Education Projects [On-line]. (Available at: http://insci.org/resources/Eval_Framework.pdf)
Hussar, K. et. al. (August 2008). Toward a Systematic Evidence Base for Science in Out-of-School Time: The Role of Assessment. [On-line]. (Available at http://www.pearweb.org/pdfs/Noyce-Foundation-Report-ATIS.pdf )
R.A. Duschl, H.A. Schweingruber, and A.W. Shouse (Eds.). (2007). Taking science to school: Learning and teaching science in grades K-8. Committee on Science Learning, Kindergarten through Eighth Grade. Washington, DC: The National Academies Press.
Jolly, E.J. et.al. (September 2004). Engagement, Capacity and Continuity: A Trilogy for Student Success. [On-line]. (Available at http://www.campbell-kibler.com/trilogy.pdf)
Siegel, M.and M. Ranney. (November 2002). Developing the Changes in Attitude about the Relevance of Science (CARS) Questionnaire and Assessing Two High School Science Classes. Online at: http://www.soe.berkeley.edu/~schank/convinceme/papers/SiegelRanneyJRSTReprint.pdf)
Campbell, Patricia B., Jolly, Eric, Hoey, Lesli & Perlman, Lesley. (2002). Upping the Numbers: Using Research-Based Decision Making to Increase Diversity in the Quantitative Sciences. Newton, MA: Education Development Center.
The Tech Museum of Innovation Alysa Caryl & Carlos F. Camargo Page 17

Measuring Outcomes & Documenting Impact 2/20/2015
Appendix D: Tech Awards Education Program
Target Audiences for Educational Programs:• Kids: K-12 students (gallery exhibits, bookmarks & STEM-TA activities)• Teachers: K-12 educators (pre-visit teacher’s guide, professional development, lesson plans)• Parents (pre- and post-visit guide; STEM activity sheets)• Adults: the general public in Bay Area to International Tourists (Info-Box interactives)• Supporters (Donors, Volunteers, etc.) (gallery signage and collateral)
Unifying Themes:• Technology Benefiting Humanity (main theme)• One person CAN make a difference• Think Globally, Act Locally (“glocality”)• Technology helping real people help themselves• You Can TOO! (take away theme)
Educational Goals:• Create linkages between science, art, culture and innovation• Enable visitors to engage in process experimentation• Better understanding of “cultural geography” and the limited resources of our planet• Address the need for sustainable practices and innovations• Universal desire to improve the human condition• Tie-in to other exhibits and projects at the Tech (i.e. Tech Challenge, Choices/Energy, Genetics
Wet Lab, LifeTech, etc.)• Provide information in support of the U.N. Millennium Goals• Meet California State Curriculum guidelines
Major Educational Messages for Curriculum Development:• Population growth is threatening the availability of fresh water in many regions of the world. With
agriculture accounting for approximately 70% of all water used, the water crisis is closely linked to food production and economic development.
• Agriculture and health are related in many ways. Malnutrition, often caused by the lack of micronutrients such as vitamins, zinc, and iron, affects vulnerable groups such as women and children.
• Promotion of human rights and equality for women, immigrants, children, etc. Activism is vital tool to advance the rights of all people by challenging inequality and repression.
• Microfinance is one of the most effective and flexible strategies in the fight against global poverty.• There are many low-cost, sustainable solutions to the energy needs of marginalized communities
through the construction, installation, and maintenance of hybrid wind and solar electric systems.• According to WHO, more than one billion people lack access to clean drinking water which leads
to the death of 2.2 million children.• Using indigenous, sustainable materials helps protect the environment, provides new economic
opportunities and better living conditions.• Renewable energy and solid-state lighting technologies bring affordable, safe, healthy, efficient,
and environmentally responsible illumination to people who do not have access to power for adequate lighting.
• Improve the environment by promoting waste recycling activities.• The best means to reduce pollution, reduce greenhouse gas emissions, and reduce energy
consumption is to reduce electric and thermal demand.• More than two billion people live without electricity; more than four billion rarely make a phone
call. Three billion people have never seen a doctor; more than a billion adults cannot read or write at all.
The Tech Museum of Innovation Alysa Caryl & Carlos F. Camargo Page 18

Measuring Outcomes & Documenting Impact 2/20/2015
Call-to-Action Tree in Tech Awards Gallery
Rallying Point:
The Tech Awards Gallery will be theatrically-staged with a physical focal point -- the Call-to-Action Tree -- that will solicit, encourage and facilitate visitor feedback related to issues that are implicit in each of the 10 displays. The gallery will be anchored by a central gathering place adorned with computer kiosks where visitors can learn more about relevant subject matter and access the Internet for online resources related to the exhibit, as well as community resources that allow visitors to “think globally” but “act locally.” At these kiosks, visitors will be able to take a quiz, provide feedback on the exhibit, nominate individuals or organizations for next Tech Awards competition, and even project their hopes for the future onto the tree.
Kiosks at the Call-to-Action Tree will:• Invite guests to email a postcard
about the exhibit to a friend,• Provide feedback via surveys,• Project their hopes for the future,• Inform guests about “things you
can do to make a difference”, • Tie in with the United Nations
Millennium Development goals,• Encourage a Call to Action
response using the Web to send info to friends, elected officials, etc.,
• Provide links to organizations that are seeking volunteers or resources,
• Offer quizzes to test visitors’ knowledge and survey opinions on issues raised by the exhibits
• Communicate ways that visitors can participate in “Multiply Yourself by a Million” challenges.
The Tech Museum of Innovation Alysa Caryl & Carlos F. Camargo Page 19

Measuring Outcomes & Documenting Impact 2/20/2015
Appendix E: Leo Labs Evaluation Fall 2008
Brief Summary of Project Plan and Goals (inclusive of Assessment & Analysis):
Funding by the Bechtel Foundation, this program grant enabled the development and evaluation of Leonardo’s Inventors Workshop during fall 2008.
Project Results: All grant goals & productivity objectives proposed in reformulated implementation plan from October 2008 were met or exceeded. See chart below for summary of pilot goals, project performance and attainment metrics.
PROPOSED ACTIVITIES PRODUCTIVITY OBJECTIVESActual
Attainment1. Forge partnerships & dialogue with school districts, teachers & families and STEM partners
2. Recruit, enroll and retain Lead Teachers.
3. Curriculum Developmenta) ED-Plan 1-hour workshop & 1-hour lab structures & contentsb) Floor Programs: What Would Leonardo Do?
4. Conduct school-year workshops over 8 weeks (10/13-12/12/08 for proof-of-concept)
5. Conduct Prof Dev workshops
6. Provide Family weekend workshops
7. Provide website resources that teachers use.
8. Lead teachers provide school-site level evangelization of programs.
a) 12 SCCOE districtsb) 2000+ students attend labsc) 40 families engagedd) 120 teachers engaged
e) Partnership w/ MESA & SJSU
a) 120 teachers over 3 months to attend Prof Dev workshopsb) 2,000 students are enrolled in labs
a) Complete inventory of agendas, lesson plans, handouts, etc.
b) Leonardo linkage & docent training
a) 100 labs for students during Fall; b) 85% student satisfaction with workshops;
a) three 90-minute workshops for teachers b) 85% teacher satisfaction with labs
a) six weekend labs for families & kidsb) 85% attendee satisfaction w/ labs
a) 90% of attendees report accessing the TECH website at least once per month; b) 85% teacher satisfaction with the website.
a) Evidence of increasing school-site level evangelization on the part of lead teachers via new bookings for labs
a) 44 School districtsb) 3,111 students attend labsc) 80 families engagedd) 120 teachers engaged
e) Both targeted partners secured; additional partnerships formed w/ Eastside YMCA, 3rd Street Community Center & San Jose Rec. Dept.
a) 120 teachers completed PD workshopsb) 3,111 students are enrolled in labs
a) Completed 90-min K-12 workshop; 90-minute PD session; 1 Teacher’s Guide; 45-min afterschool workshopb) 3 Floor experiences developed; 16 docents trained
a) 117 lab/workshops conducted over 120 days, instead of 100b) 90% satisfaction rating attained from G3-8 students
a) six 90-min PD workshops designed & conducted b) 100% teacher satisfaction
a) 12 weekend labs for families & kidsb) 100% attendee satisfaction w/ labs
a) 50% of attendees report accessing the TECH website at least once per month; b) 90% teacher satisfaction with the website.
a) Each of 44 school district evangelists spread word to 2.6 other colleagues at different sites
The Tech Museum of Innovation Alysa Caryl & Carlos F. Camargo Page 20

Measuring Outcomes & Documenting Impact 2/20/2015
PROPOSED ACTIVITIES PRODUCTIVITY OBJECTIVESActual
Attainment
9. Teacher report on incorporation on concepts/skills use based on training
10. Lead teachers mentor/share STEM resources w/ colleague teachers.
11. Conduct project evaluation; interpret and apply findings.
12. Assess project effectiveness and generalizability for exhibition.
a) Evidence of standards articulation into class curriculum & use of concepts/skills used during term based on training
a) Each Lead Teacher evangelizes to 2 other colleagues who book other labs at Tech
a) Evaluation design; b) Satisfactory timeliness, accuracy and utility of data collection, analyses, reporting, interpretation & application.
a) Final report to Bechtel; b) Produce TECH newsletter article.
a) 50% of teachers report allowing additional class time after visit to allow continued work on Automata projects
a) Each lead evangelizes to 2.6 colleagues w/in LEA
a) 2 evaluation instruments developed and administered online & in printb) 77 of 117 teachers (66%) completed online SurveyMonkey instrument and 600 of 3,111 G3-8 students (20%) completed Science Attitude Inventory
a) Final Report submitted to Bechtel; b) Tech Connect article written by Alysia Caryl updating membership on success of 2nd Classroom Initiative, and success of Leo activities
Lessons Learned• The Mechanical Cabaret Workshop Series for 3rd-12th grade students was a tremendous success. We
learned that the development and instruction of these gallery floorshows, hands-on experiences, labs and workshops were more time intensive than predicted, but also more rewarding.
• We also learned that the students responded to clear and defined expectations set at the beginning of the learning session, followed by strict adherence to and re-enforcement of those guidelines. With clear expectations in place, the learning sessions ran more smoothly and students gained more from the experience.
• We learned that our expectations for the amount of content material that could be covered during the normal course of business in the museum floor, in the labs and during workshops were too high; we made mid-project course adjustments to reflect the learning pace of our students.
• We also learned that the support of the parents-volunteers and teacher-chaperones was invaluable to the success of the series.
• A sense of accomplishment was achieved at the end of each learning session, when students shared their completed projects during the lab. And, again when back in the classrooms, the students showed off their hard work to peers, parents, teachers and administrators.
• We learned that the 90-minute time slot was too short for a deep dive into the engineering process. After classroom set up and clean up time, the students were left with inadequate time for the investigation and solidification of ideas. In response to this, in many instances, over 50%, the school teachers decided to allow students additional time in-class to complete their automata or floor projects during school time after a visit to the museum.
The Tech Museum of Innovation Alysa Caryl & Carlos F. Camargo Page 21

Measuring Outcomes & Documenting Impact 2/20/2015
Leo Labs Pilot Outcomes
All five proposed educational program components of the pilot were completed and implemented successfully over the four-month long trial:
1. Three gallery floorshows & design challenge learning experiences took place during the 120 day trial, resulting in…a) Leonardo’s Parachute: 3,600 Catapults being built during hands-on sessions by visitors to
piloted galleryb) What Would Leonardo Do?: 7,600 Parachutes being built during hands-on sessions by
visitors to piloted galleryc) Leonardo’s White Water Adventure: 3,600 Flotation devices being built during hands-on
sessions by visitors to piloted gallery2. Twelve weeks of week-day K-12 “Leonardo Learning Labs” conducted 3. Twelve weekend family workshops serving 80 families conducted4. Twelve 90-minute teacher professional development workshops & learning labs completed by
120 teachers5. Research dissemination accomplished by both newsletter article for Spring 2009 Tech
CONNECT member newsletter and white paper being prepared for publication in trade publication
Additionally, gallery floor programs in the lower level of the museum in Idea House linked and incorporated design-challenge activities and automata/kinetic sculpture linkages through hands-on learning experiences offered at various times of the day throughout the 4 months of pilot. These activities attracted over 141,675 lower gallery attendees (60% children and about 40% adults), many of whom took time to participate in hands-on activities: 94,450 guests or two-thirds of lower gallery visitors.
Attendance & Participation Metrics:
Leonardo’s Inventors Workshop was designed as a series of labs & floors displays for kids featuring how-to and do-it-yourself projects that can be completed in short sequences on the floor, offering K-8 students engaging, free-choice learning encounters.
The Tech Museum of Innovation Alysa Caryl & Carlos F. Camargo Page 22
Activities Type of
Participant Projected Number
Actual Number Variance
Completing Leo's Learning Workshop Pilot School Districts 12 44 267%
Completing Leo's Learning Workshop Pilot Teachers 120 120 0%
Completing Leo's Learning Workshop Pilot G3-8 Classes 100 117 17%
Completing Leo's Learning Workshop Pilot G3-8 Students 2,000 3,111 56%
Completing Leo's Learning Workshop PilotG3-8 Students
Title 1 600 1,556 159%
Completing Leo's Learning Workshop PilotG3-8 Classes
Title 1 30 59 95%
Attending The Tech for Leonardo Exhibition K-12 Schools 500 707 41%
Attending The Tech for Leonardo Exhibition K-12 Students 17,000 25,044 47%
Attending The Tech for Leonardo ExhibitionK-12 Schools
Title 1 100 215 115%
Attending The Tech for Leonardo ExhibitionK-12 Students
Title 1 12,940 18,548 43%

Measuring Outcomes & Documenting Impact 2/20/2015
Activities Type of Participant
Projected Number
Actual Number Variance
Completing Piloted Gallery Floor Programs General Population
80,000 94,450
18%Completing Piloted Gallery Floor Programs K-12 Students 50,000 56,670 13%Completing Piloted Gallery Floor Programs Adults 30,000 37,780 26%
Attending Leonardo Exhibition In Parkside General Population
150,000 170,000
13%Attending Downstairs Workshop & Gallery from General Attendance not LEO
General Population
60,000 66,125
10%Attending Downstairs Workshop & Gallery from General
Attendance not LEOK-12 Students 126,000 141,675
12%Attending Downstairs Workshop & Gallery from General
Attendance not LEOAdults 84,000 94,450
12%Total General Museum Attendance All 210,000 236,125 12%
Conclusion
Creating a partnership between school sites, faculty and students, and parents made a big difference in the engagement and enjoyment levels of middle and high school students participating in the program. This trial shows that the urban museum setting is an ideal venue for engaging students — especially those with backgrounds typically underrepresented in engineering — in the creative aspects and methodology of design challenge learning. This workshop model was received by teachers, students and parents as and effective and practical approach to help students gain experience in teamwork, communication, project management and technical skills that will help them in their post school career paths.
As demonstrated in this Mechanical Cabaret Workshop Pilot Series, the hands-on building aspect of a design/build, kinetic-sculpture project motivates students effectively. By learning the fundamentals of the engineering design process, museum visitors became aware of a broader range of career options,
including the in-demand fields of engineering and technology. Thus positively helping to impact recent trends, especially those noted in the 2003 TIMSS datai documenting a widening achievement gap in math and science between students in the U.S. and other developed countries. Opening the doors early to alternate educational avenues for school students is essential to improve the general technological literacy of our graduates, and widen their understanding and appreciation for potential career options — all of which advances the technological progress and economic competitiveness of our nation. The Mechanical Cabaret Workshop methodology shows strong evidence to being one means of accomplishing these goals.
However, given the lack of strong, science-content standards articulation across K-12 for CA standards, The Tech’s Education Department has opted not to further develop this content strand for inclusion in its repertoire of STEM, hands-on workshops or for possible use as a model for a gallery exhibit at this time. Additionally, given the museum’s new direction toward complete renovations for all six permanent galleries
The Tech Museum of Innovation Alysa Caryl & Carlos F. Camargo Page 23
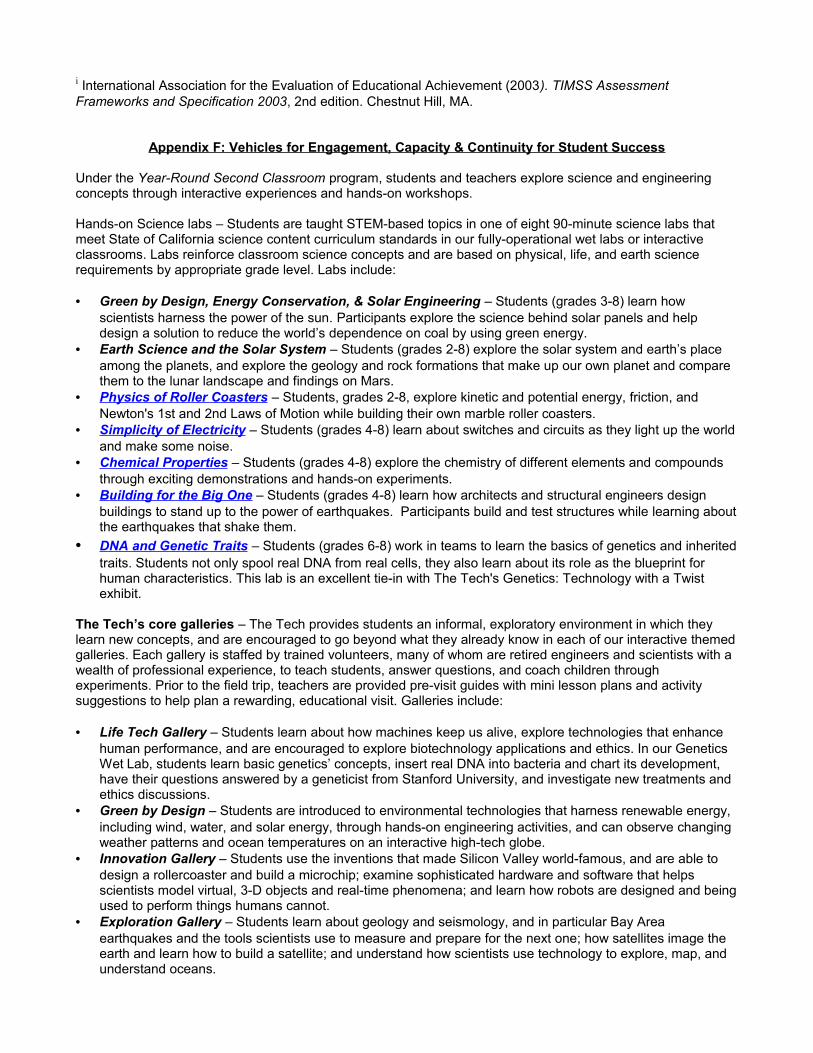
Figure 2: Wooden Automata
Figure 1: Leo's Inventor Workshop @ The Tech in Idea House Gallery
Measuring Outcomes & Documenting Impact 2/20/2015
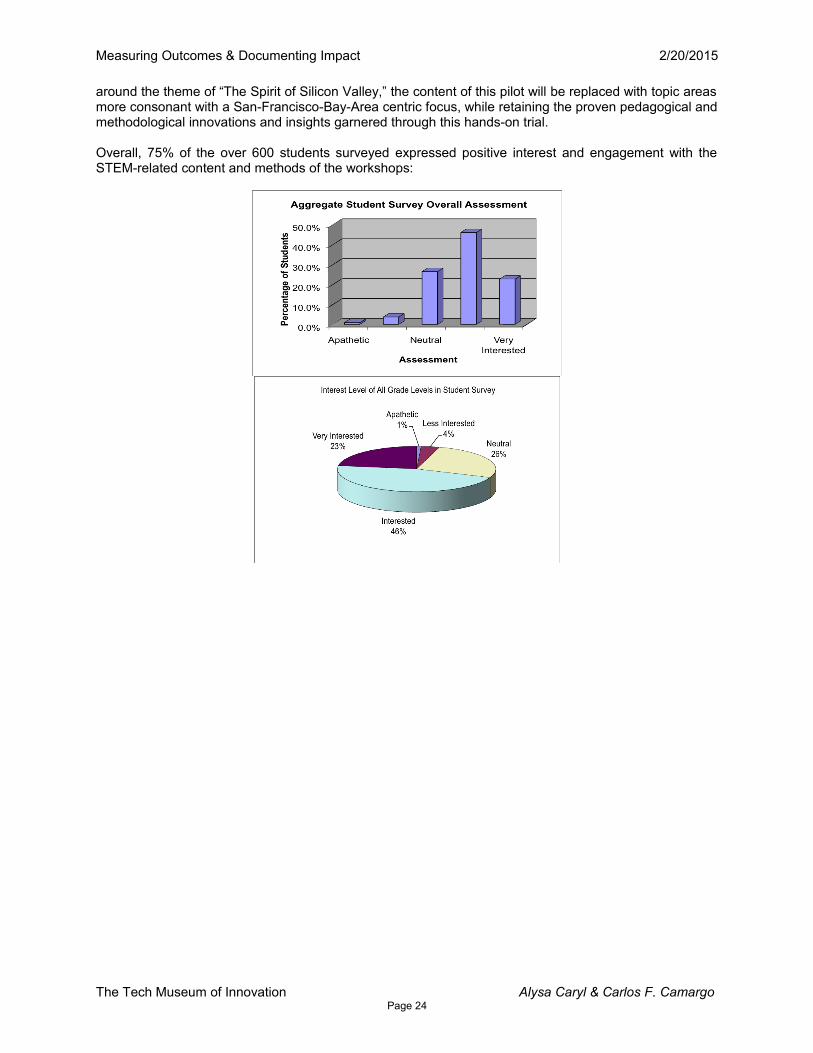
around the theme of “The Spirit of Silicon Valley,” the content of this pilot will be replaced with topic areas more consonant with a San-Francisco-Bay-Area centric focus, while retaining the proven pedagogical and methodological innovations and insights garnered through this hands-on trial.
Overall, 75% of the over 600 students surveyed expressed positive interest and engagement with the STEM-related content and methods of the workshops:
The Tech Museum of Innovation Alysa Caryl & Carlos F. Camargo Page 24
i International Association for the Evaluation of Educational Achievement (2003). TIMSS Assessment Frameworks and Specification 2003, 2nd edition. Chestnut Hill, MA.
Appendix F: Vehicles for Engagement, Capacity & Continuity for Student Success
Under the Year-Round Second Classroom program, students and teachers explore science and engineering concepts through interactive experiences and hands-on workshops.
Hands-on Science labs – Students are taught STEM-based topics in one of eight 90-minute science labs that meet State of California science content curriculum standards in our fully-operational wet labs or interactive classrooms. Labs reinforce classroom science concepts and are based on physical, life, and earth science requirements by appropriate grade level. Labs include:
• Green by Design, Energy Conservation, & Solar Engineering – Students (grades 3-8) learn how scientists harness the power of the sun. Participants explore the science behind solar panels and help design a solution to reduce the world’s dependence on coal by using green energy.
• Earth Science and the Solar System – Students (grades 2-8) explore the solar system and earth’s place among the planets, and explore the geology and rock formations that make up our own planet and compare them to the lunar landscape and findings on Mars.
• Physics of Roller Coasters – Students, grades 2-8, explore kinetic and potential energy, friction, and Newton's 1st and 2nd Laws of Motion while building their own marble roller coasters.
• Simplicity of Electricity – Students (grades 4-8) learn about switches and circuits as they light up the world and make some noise.
• Chemical Properties – Students (grades 4-8) explore the chemistry of different elements and compounds through exciting demonstrations and hands-on experiments.
• Building for the Big One – Students (grades 4-8) learn how architects and structural engineers design buildings to stand up to the power of earthquakes. Participants build and test structures while learning about the earthquakes that shake them.
• DNA and Genetic Traits – Students (grades 6-8) work in teams to learn the basics of genetics and inherited traits. Students not only spool real DNA from real cells, they also learn about its role as the blueprint for human characteristics. This lab is an excellent tie-in with The Tech's Genetics: Technology with a Twist exhibit.
The Tech’s core galleries – The Tech provides students an informal, exploratory environment in which they learn new concepts, and are encouraged to go beyond what they already know in each of our interactive themed galleries. Each gallery is staffed by trained volunteers, many of whom are retired engineers and scientists with a wealth of professional experience, to teach students, answer questions, and coach children through experiments. Prior to the field trip, teachers are provided pre-visit guides with mini lesson plans and activity suggestions to help plan a rewarding, educational visit. Galleries include: • Life Tech Gallery – Students learn about how machines keep us alive, explore technologies that enhance
human performance, and are encouraged to explore biotechnology applications and ethics. In our Genetics Wet Lab, students learn basic genetics’ concepts, insert real DNA into bacteria and chart its development, have their questions answered by a geneticist from Stanford University, and investigate new treatments and ethics discussions.
• Green by Design – Students are introduced to environmental technologies that harness renewable energy, including wind, water, and solar energy, through hands-on engineering activities, and can observe changing weather patterns and ocean temperatures on an interactive high-tech globe.
• Innovation Gallery – Students use the inventions that made Silicon Valley world-famous, and are able to design a rollercoaster and build a microchip; examine sophisticated hardware and software that helps scientists model virtual, 3-D objects and real-time phenomena; and learn how robots are designed and being used to perform things humans cannot.
• Exploration Gallery – Students learn about geology and seismology, and in particular Bay Area earthquakes and the tools scientists use to measure and prepare for the next one; how satellites image the earth and learn how to build a satellite; and understand how scientists use technology to explore, map, and understand oceans.

• Idea House – Students learn how commonly used or household items can be transformed into new ideas and innovations through interactive demonstrations.
• Net Planet – Students learn about the fundamental technologies that allowed the internet revolution to occur. Participants are able to join a virtual world, learn about how the internet works, and how new trends on the net develop.
The Tech’s other interactive experiences include floor programs and demonstrations that change on a regular basis and are tied into the themes of the core galleries, and staged shows which are live theatre presentations that are themed to align with current exhibits or IMAX films. Visitors may also use their Tech Tags—the Museum’s admission ticket—at scanners throughout the Museum’s many exhibits to document their activities during their visit, including taking photos at various exhibits and checking the progress of their DNA/bacteria experiment in the genetics lab, then visit an individualized webpage after their visit.
IMAX films – Played in The Tech’s Hackworth IMAX Dome Theater, these fun, educational films also meet California science content standards and examine topical science-related issues.


