Current Approaches to the Development of Airport Retail: A ...
45
Current Approaches to the Development of Airport Retail: A Sales Performance Analysis and Case Study by Ahron B. Herring M.B.A., Massachusetts Institute of Technology, 2002 B.A., Mathematics, Physics, and Computer Science Yeshiva University, 1995 Submitted to the Department of Urban Studies and Planning in Partial Fulfillment of the Requirements for the Degree of Master of Science in Real Estate Development at the Massachusetts Institute of Technology September 2002 © Copyright 2002 Ahron B. Herring. All rights reserved. The author hereby grants to MIT permission to reproduce and to distribute publicly paper and electronic copies of this thesis document in whole or in part. Signature of Author ................................................................................................................ Department of Urban Studies and Planning August 2, 2002 Certified by ............................................................................................................................ John T. Riordan Thomas G. Eastman Chairman Thesis Supervisor Accepted by ............................................................................................................................ William C. Wheaton Chairman, Interdepartmental Degree Program in Real Estate Development
Transcript of Current Approaches to the Development of Airport Retail: A ...
Current Approaches to the Development of Airport Retail:
A Sales Performance Analysis and Case Study
by
Ahron B. Herring
M.B.A.,
Massachusetts Institute of Technology, 2002
B.A., Mathematics, Physics, and Computer Science
Yeshiva University, 1995
Submitted to the Department of Urban Studies and Planning in Partial Fulfillment of the Requirements for the Degree of
Master of Science in Real Estate Development
at the
Massachusetts Institute of Technology
September 2002
© Copyright 2002 Ahron B. Herring.
All rights reserved.
The author hereby grants to MIT permission to reproduce and to distribute publicly paper and electronic copies of this thesis document in whole or in part.
Signature of Author................................................................................................................
Title Page Department of Urban Studies and Planning August 2, 2002
Certified by ............................................................................................................................
John T. Riordan Thomas G. Eastman Chairman
Thesis Supervisor Accepted by............................................................................................................................
William C. Wheaton Chairman, Interdepartmental Degree Program in Real Estate Development

CURRENT APPROACHES TO THE DEVELOPMENT OF AIRPORT RETAIL:
A SALES PERFORMANCE ANALYSIS AND CASE STUDY
BY
AHRON B. HERRING
Submitted to the Department of Urban Studies and Planning on August 2, 2002 in partial fulfillment of the requirements
for the Degree of Master of Science in Real Estate Development
ABSTRACT During the 1990s, a number of airports around the United States radically changed the way they managed the retail space in their terminals. Departing from the traditional master concessionaire/operator model, airports began experimenting with branded direct leasing programs and outsourcing to third party developers. Serving over 700 million domestic airline passengers annually, and until recently overlooked by the retail development community at large, the airport network presents a significant market for retail development. We review the issues surrounding airport retail management, the genesis of the branded, mall-style and developer-run programs, and evaluate the relative performance of different management models both quantitatively and qualitatively, based on recent sales data and case studies of a number of airports. Data for this report was collected June/July 2002 in the form of publicly available data from industry trade groups and journals, interviews with members of airport business offices, developers active in airport retail, and firms providing concessionaire service to airports. Thesis Supervisor: John Riordan Title: Thomas G. Eastman Chairman
- 3 -
Table of Contents Title Page ............................................................................................................................ 1 ABSTRACT........................................................................................................................ 2 Table of Contents................................................................................................................ 3 Acknowledgements ............................................................................................................. 4 Introduction......................................................................................................................... 5
The evolution of airport retailing .................................................................................... 5 The airport network and organization............................................................................. 7 History of retail management in airports ........................................................................ 9 Early successes.............................................................................................................. 10 Entry of third party developers ..................................................................................... 12 Competitive response .................................................................................................... 13 Impact of 9/11 ............................................................................................................... 14
Strategic Issues.................................................................................................................. 17 Choice of management structure vs. format of retail environment .............................. 17 Three categories of management structure ................................................................... 17 Political considerations ................................................................................................. 20 Organizational models .................................................................................................. 20
Analysis of Sales Performance Data ................................................................................. 22 Data Sources ................................................................................................................. 22 Metrics .......................................................................................................................... 24 Analysis......................................................................................................................... 24
Case Studies ...................................................................................................................... 28 Chicago Midway Airport (MDW) ................................................................................ 28 Ronald Reagan Washington National Airport (DCA) .................................................. 30
Conclusions and Recommendations for Further Research............................................... 32 Tables and Figures ............................................................................................................ 34 Bibliography and Sources ................................................................................................. 42

- 4 -
Acknowledgements
I would like to acknowledge my appreciation of the many people who expressed willingness to share of their time and experience as I delved into the world of airport retailing. I would like to offer particular thanks to Cheryl Nashir, now of Orlando International Airport, for unstinting generosity with her rolodex. To all I offer my sincerest thanks. To my teachers throughout the years, I have been touched by you all, and am better for the experience. To my parents, no words can fully express my love and gratitude; you have bequeathed to me a rich, honorable and fulfilling perspective on life that I will carry with me always. In alphabetical order: Sal Amico Concessions Manager, MassPort-Logan Dick Dickson President, Parodies Terry Dorrington Business Manager, Metro Washington Airport Authority Charles “Chili” Ewing Aviation Property Specialist, Hartsfield Atlanta International
Airport Ann Freedman Newark Retail and Concessions Manager, Port Authority of
New York/New Jersey Steve Johnson Vice President of Business Development, HMSHost Jack Lee Director of Business, Broward County Aviation Department Tim Lowe VP Airport Business Development, Westfield Development Bryan Malinowski Airport Properties Manager (Airlines/Concession), Broward
County Aviation Department Robert McFayden Head of Retail, Sydney Airport Cheryl Nashir (formerly) Terminal Concessions and Services, Metro
Washington Airport Authority Bob Weinberg Chairman, Marketplace Development
Dedicated to those who lost their lives on September 11, 2001, and to all people who give of themselves for the sake of others:
in peacetime and in war, as civilians and as soldiers, and
as teachers and as friends.

- 5 -
Introduction
The evolution of airport retailing
In the late 1980s, when you stood in line at the airport check- in counter, your
thoughts might have wandered a bit – commenting to yourself on the how poorly the
building was showing it s age, hoping the airplane was in better shape, and whether you’d
have time to sit at the gate and enjoy the view of the planes taking off. Taking a sip from
that awful cup of caffeine- laced coffee, you might have found solace in the fact that at
least the airline industry had some competition these days, but how could those
stewardesses be so friendly this early in the morning.
Ten years later, the well- lit, vaulted ceilings in the new terminal makes for a more
pleasant airport experience, but the booking agents seem so much more harried, and
you’ve been in line for almost 45 minutes. At least the java is decent, and you’ll have
another hour to shop for that gift you’ve been meaning to get for your spouse, just before
you sprint to your gate…to find out your plane has been delayed in Chicago. You might
as well check your email at the bank of kiosks while you wait…such is life on the road!
In the wake of September 11th, safety when traveling may be once again central in
our minds in a way we thought gone forever, but the experience of traveling through an
airport will never be the way it once was. Since 1990, domestic air travel in the US has
grown from 424 million passengers a year to over 708 million in 2000, and when you
consider that for every one of those people arriving at the airport, you have someone
getting off that plane, all told airports in the United States serve over a billion people a
year. Meanwhile, airport facilities have been renovated, but the inability of the aviation

- 6 -
network to keep up with that demand has meant an increase in delays, multiple
connections and longer dwell times in the airport.
If the previous decade had been spent adapting the business of aviation to the new
world of deregulation, the last ten years has seen a revolution in the airport as a
commercial venue in it’s own right, with name brand retail stores, business productivity
centers, even minute spas, become more and more commonplace. This has been driven
in part by changes in our culture, as we spend more time traveling greater distances in the
course of our professional lives, but it is also due to a change in our expectations of a
retail and shopping experience. With Starbucks at every corner, a J Crew or The Limited
not far away, and 24-hour pharmacies, our expectation for convenient, familiar
conveniences no longer ends just because we’ll be traveling halfway across the country.
With limited government funding and increasingly squeezed operating budgets, airports
are run ‘like a business’, and if we’re spending the time and have money in our pockets,
someone, somehow will be there to take it from us.
But behind the scenes, in the airport’s business office, someone has to make that
miracle of modern capitalism possible. Should the airport take on the job, tight staffed as
it is? Perhaps the concessionaire, who generally has great familiarity with and a long-
term commitment to operating in the airport environment, could run the operation. Or
perhaps they should outsource to a completely new breed of operator from outside the
traditional boundary of the industry – the third-party manager-financier-developer – who
has the contacts and resources to bring in and manage a program offering a broad variety
of name brand products in a high service environment.

- 7 -
All these variations have been tried over the course of the past ten years, and the
grand experiment is not yet over. The question we hope to begin to address here is how
we have gotten from there to here, if there are indications that there are aspects of these
various business models work better than others, and where the industry might be
evolving.
The airport network and organization
The Federal Aviation Administration oversees the 3,304 commercial and general
aviation airports that make up the national airport transportation system. The top 419 are
categorized as primary hub airports, which in 2000 carried over 708 million passengers,
the great majority traveling through the 31 large hub (494 million, or 70%) and 35
medium hub (135 million, 19%) airports1,2 (see Table 1.) This ranking is based on the
FAA’s measurement of an airport’s annual enplanements, which are defined as the
number of passengers boarding a flight, including origination, stopovers and connections.
While the total passenger volume at an airport is double that (as we pointed out, few
people actually live in an airport, so in the aggregate there are roughly just as many
people leaving the airport system as there are enplaning), the number of enplanements is
considered the principal measure of passenger volume in an airport and, more
importantly for our purposes, represents those passengers spend ing their time – and
money – in the airport terminal while waiting for their flight.
Most airports in the United States are public entities – either directly owned by
the city, or incorporated, but serving the public trust. To meet their operating and capital
1 ATA Airline Handbook 2 FAA 2000 Primary Airport Enplanements Activity Summary

- 8 -
investment needs, airports rely on a broad range of funding sources: municipal airport
bonds, federal and state grants and airport-generated income, which includes landing
fees, passenger facility charges, fees paid by rental car companies, parking fees, facility
rent and retail concessions. In some airports these non-airplane related fees, concessions
and rents contribute almost a third of the airport’s income. Concession fees themselves
may be only a few percent of a large airport’s operating budget, but they and the rents
that those concessions generate are an essential part of the fiscal balancing act.
The retail environment in airports is driven by unique geographic constraints.
The major distinction in the airport environment is between “ground-side” and “air-side”,
a distinction that has been made much clearer to the traveling public and the airport
retailer since 9/11. Ground-side, “before” security, with ticketing and baggage handling,
has traditionally been the place for an airport’s large open spaces. There are many airport
layouts, but generally there is a central terminal with connections to ground-side
transportation (car or light rail), separated from the air-side concourses and boarding
gates by a bank of security. Once on the air-side, there is wide variation in the layout and
capacity for retail. Some concourses are short walks from the terminal, with the all gates
visible before going through security. Others are completely separate sections to the
airport, with shops and restaurants peppered all along their length. Typically however,
the design of airports had been focused on getting people from the entrance, through
security and to their gate as quickly as possible; what they might be do once they were
there was often an afterthought. In the world of commuter shuttles and walk-on booking
that was a reasonable and effective design. That design presents challenges in today’s
much more time- intensive travel experience.
- 9 -
History of retail management in airports
In the past, the great majority of airports either managed operations in house, with
a dedicated staff, or contracted for various services through a RFQ/RFP process, and
retail concessions were no exception. The choice to outsource could cover the entire
range of retail operations, or for a specific product segment. The market segmentation in
airports has five principal product categories – food and beverage, specialty retailing,
news and gifts, duty free and general services – with different firms specializing in some
products and not others, and a few that can service the entire market. Major master
concessionaires include HMSHost, formerly Host Marriott Services (news, gift and
specialty retail, as well as food and beverage), Parodies Shops (specialty retail), CA One
Services (both retail and food/beverage) and DFS Group (duty free).
Generally the contracts ranged from 15 to 25 years with a single, integrated
“master (or prime) concessionaire” entity providing the operating staff and management
for the retail locations. The advantage of this approach was a simplified interaction with
the retail operation, which was considered outside the scope of an airport’s primary
function. Rather than having a staff to manage the dozens of retailers and operators, a
single firm could provide one point of contact. The airport received income from rent on
the leased space and a concession fee from the master concessionaire, which was
compensation for the effective monopoly the airport had granted.
The concessionaires earned an operating profit, hiring their own staff to manage
and operate those stores. With airport employees starting to arrive at 4am, these
concessionaires face high labor costs (as they were required to remain open for as many
as 14 or more hours a day), as well as a high cost of inventory (airport retail locations are

- 10 -
significantly smaller than a similar space outside the airport, and limit the space available
for preparation and inventory). As a consequence much of these higher costs were
captured in higher prices charged to the public, who had few other options.
The first signs of change came with the introduction of two new concepts:
branded stores and street pricing. Part of the former joys of airport shopping was paying
two or three times for the generic version of whatever it was you were buying. As a
customer your options were limited. That had to change with the introduction of branded
concepts. Once the brand – that is to say, the reputation – of the outside company is at
stake, they have an incentive to keep their customers happy with reasonable prices, even
if they never pass through that airport or frequent that store again. Brand signals the
quality of the product you’re buying, and McDonald’s will not do a very good business if
they ask you to pay twice as much for the comparable burger and fries as you would five
minutes away from the airport. This upset to the comfortable business environment
stemmed from two experiments at opposite ends of the country.
Early successes
In 1988, Portland International Airport became the first airport in the country to
experiment with the themed development of retail. Dubbed “Oregon Market”, this
central shopping and dining area was an attempt to market the unique culture and
experience of the Pacific Northwest, with shops and restaurants that captured the local
and regional flavor. It initially opened with six specialty retail shops, oriented around a
“main street” theme complete with clock tower to complete the street-like pedestrian
experience. The program was a success, and in 1994 expanded to include three

- 11 -
additional retail shops and nine food outlets. Then in 1999, the model was extended with
the creation of a concessions court Concourse C, which was recently expanded in 2001.
All told, the retail program will encompass 110,000 square feet of retail. Portland has
also been the recipient of a number of awards, both locally and nationally. In 2000, the
program earned a Governor’s Livability Award from Livable Oregon for its success in
reflecting the feeling of livability and values of the state. In 2001, Portland distinguished
itself among a peer group of medium sized hubs by placing first in three of the five
categories in Airport Retail News’ annual Best Airport Concessions Poll. In 2002, that
impressive performance was surpassed when Portland took top honors in four of five
categories. Over time, Portland’s model has proven itself
by continuing to strive for unique and interesting
concepts that capture local flavor and that offer
professional design and function. Notably, one of the
2002 judges made specific comment of Portland’s fair
rent approach to its tenants, which reflects the airport’s macroscopic appreciation what it
takes to make such a concept work.
In 1992, another experiment was started at Pittsburg International Airport that
took this concept to another level. The airport brought in an affiliate of the United
Kingdom’s BAA plc to replicate their successful redevelopment of the British Airways
terminal at London’s Heathrow Airport. BAA designed AIRMALL as a stylish
shopping-mall- in-the-airport, on a scale much beyond anything that had been created
before. Enforcing the same “street pricing” as at Portland, the AIRMALL is centrally
located at the nexus of all four of Pittsburgh’s concourses. Once you pass through

- 12 -
security, you connect into the central core of AIRMALL, which you walk through to
reach your specific concourse. With almost all of the airport’s passenger traffic passing
by the 100,000 square feet of retailing and 110 stores, some of them sole local outlets for
national chains, the AIRMALL generates sales of $9.02 per enplaned passenger, much
improved from the dismal $2.40 prior to the opening in 1992, and consistently ranking it
at the top of its peers.
AIRMALL position behind security has challenged it post-9/11, as non-ticketed
customers can no longer enter the mall, but a sign of faith in the concept’s strength is the
announcement in May 2002 of the opening of additional retailers, including Swarovski
Crystal, Polished manicures and makeovers and Perfumania and the extensive renovation.
Entry of third party developers
With the entry of BAA at Pittsburg in 1992, the airport world awoke to the
potential for retailing as a profit center. And with the profit opportunity have come the
developers. From the world of traditional retailing, developers with the relationships to
bring in brand named eateries and stores, the management skills to orchestrate the
leasing, build-out and tenant relations, as well as the financial acumen and incentives to
make the model work tried their hand. There are anecdotes of developers sitting in
Oregon Market over lunch, observing the bustling environment and going off to explore a
similar opportunity for themselves. A number of new firms entered, most with some
prior connection to and experience with the airport environment, which would assist them
in navigating the political landscape. Building on their success at Pittsburgh, BAA
continued to expand, and was joined by MarketPlace Development (a joint venture of a

- 13 -
major New England mall developer and a prior chairman of MassPort, which operates
Logan Airport), LCOR (the US affiliate of the firm that developed Amsterdam’s
Schiphol Airport), as well as international retailing behemoth Westfield Corporation.
The financial structure of the development model is radically different from the
concession model. In most cases, the developer is bring a source of financing (which
may be in concert with the airport’s providing low-cost municipal debt) as well as
expertise in the role of general manager, and in exchange for developing and executing
the leasing and tenant management function, it receives a partnership interest, generally
20-25%. As compared to the pure mall development model, airports are both smaller in
square footage (at most 100,000 square feet versus a mall of 600-700,000 square feet),
but their attraction is in the long term stability of the contract.
Competitive response
Since most concessionaires have long-term contracts with “their” airports, these
development firms have faced a partially closed market as they have introduced their new
brand of retail management. Some airports have successfully brought in a developer
when overhauling or expanding their facilities (such as Washington National, see case
study later), or in a more limited fashion for selected portions of the airport. For example
Boston’s Logan Airport introduced Boston Landing, a smaller scale AIRMALL with 35
specialty retail shops in its Terminal C, with the help of Westfield ; then, shortly before
the prior contract for South Terminal was due to expire, MassPort appointed BAA as
developer for Terminals B, D and E. To date over a dozen airports have adopted the

- 14 -
developer model in whole or in part, but unsurprisingly the incumbent concessionaries
have mounted a competitive response.
Faced with the introduction of an invigorating array of specialty retailers and
branded food and beverage providers, master concessionaires adopted a similar product
offering as did developers, while remaining true to their operating model. Still hiring and
operating stores themselves, concessionaires began developing a franchise business and
bring in such stores as PGA Tour golf shops, Brooks Brothers (both airport exclusives for
Parodies Shops), Starbucks, Burger King and Chilis. What is important to mention is that
although the stores themselves offer branded products, from the airports perspective the
financial relationship has not changed – they still receive rent and a concession fee rather
than a share in operating profits. So despite the evolution in the customer experience,
this underlying issue remains one of the strategic differences between the two models,
and impacts the strategic relationship with the airport.
Impact of 9/11
The landscape of the country has changed since 9/11, and in no place more so
than the aviation industry. Security concerns have become paramount, to the point where
Los Angeles has announced a multi-billion dollar off-site check- in system, in addition to
the disruption that new security procedures and equipment already brings.
After 9/11, airports saw passenger traffic fall 20 to 30 percent, although over time
ridership is improving. Industry insiders project that it will take the better part of next
year to work out the most pressing issues. And with the fall-off in passenger volume, so
has revenue from retail concessions, rental car, parking revenues and landing fees. But

- 15 -
despite this grim situation, many airports have found their retail sales have not fallen as
much as could be expected. A large contributing factor in this is likely the longer dwell
times travelers are experiencing. With earlier check- ins, passengers have more time to
spend, and they’ll spend it the restaurants and shops in the airport. But all retail is not
equal. While in the past passengers felt comfortable spending the ir time in the central
terminal, confident they could move through security quickly, most passengers today
expect long lines at the security checkpoints, and generally go through to the concourses
as soon as possible and spend their time there. This has decimated the sales of ground-
side stores, with few exceptions. At National Airport in Washington, DC, airport
managers point to the design of the facility as encouraging people to stay in the central
terminal. With short concourses, travelers can see their gate from the central terminal
and this, managers believe, gives passengers the comfort level they need to stay in the
more relaxing environment of the central terminal.
Space is another constraint that redesigned security considerations are imposing
on airport retail. The new scanning machines mandated into every US airport are
massive pieces of equipment. Faced with little alternative, South Florida’s Ft.
Lauderdale-Hollywood International has reduced the square footage available to the retail
locations adjacent to security, and in some cases has decided they must give up those
sites entirely. The operation of stores has changed – steak is tough product to sell
without steak knives – and shipments of the most basic staples, food and paper goods,
must now be delivered in secured trucks and coordinated more closely with airport
security. With flexibility and coordination at a premium, the post-9/11 world will help

- 16 -
clarify the strategic differences between the different retail management models. In the
next section we look at those strategic consequences, both as related to 9/11 and beyond.
- 17 -
Strategic Issues
Choice of management structure vs. format of retail environment
An important distinction needs to be made when between the function that
management plays, and the form and design of the retail areas in the airport. A consumer
may not even be aware that there is one concession manager in the airport, and that the
employees of the bookstores, restaurants and specialty retail stores all work for the same
company. In the past, that may have been indicated by the generic branding of the stores,
but today’s concessionaires have made extensive use of franchising to bring branded
retail to the airports in which they operate. In addition, while an airport’s priority is not
to create the most effective mall at the expense of passenger convenience and safety, an
airport’s management can still outsource to a 3rd party or private developer to leverage
the skills that they bring to the table.
Three categories of management structure
For purposes of comparison, we can describe three general categories of
management structure; in reality, each airport may structure the relationship differently,
and in many cases a hybrid exists among different product types or between different
locations in the airport. Firstly, the airport can manage tenants directly (“direct airport”
model.) In the pure form of this model, the airport has the staff with appropriate
expertise to set the overall agenda of the retail program, recruit quality tenants and serve
their needs on a ongoing basis; in some circumstances, the airport might outsource a part
of that function to a 3rd party manager. This provides the airport with greatest degree of
- 18 -
oversight and the potential to capture all the surplus profit, but it comes with some
downsides. Firstly, the airport has to be either so large as to support a full time staff, with
commensurate expertise, or so small as to fit those responsibilities within a larger job
description.
More importantly, that oversight can become a liability. Airports are often the
local municipality’s largest asset, and are often beholden to the pressure of local
politicians. There have been recent allegations that a former Mayor of Atlanta influenced
the selection of concession operators at Hartsfield Atlanta, circumventing the bidding of
two concession contracts generating $20 million a year in revenue, among almost two
dozen other contracts.
The second major form is the modern adaptation of the traditional prime/master
concessionaire. Now offering branded retail at street prices, these concessionaires still
make their money from operating profit, leasing the space from the airport on relatively
long term leases, plus paying a concession fee to the airport. There has been a growing
trend towards the segmentation of RFQ/RFPs, which works well with this model. For
example, a firm might bid on the provision of themed restaurants throughout an airport,
and a concessionaire with expertise in creating those types of eating environments could
pick up two, three or more differently branded locations under one contract, without
having pick up the bar contract, for example, as well. This further segmenting of the
contracts alleviates another downside of this model, that of the double optimization of
profit that occurs when subletting. If a concessionaire does not have the requisite
expertise, the concessionaire sublets the space, adding their own profit margin (a rational
choice on their part) in addition to the profit margin offered to the airport. The net effect
- 19 -
is a higher rent to the tenant, forcing higher prices and thus sub-optimal performance for
the airport. This points to a more subtle issue – concessionaires are rewarded by
maximizing operating profit, which is not the same goal as the airport’s after the long
term contact has been signed. The next model attempts to align those interests more
closely.
Under the third party or privately owned developer model, the airport partners
with a development organization that takes responsibility for all aspects of the retail
environment and fully shares the risks with the airport. For example, neither the airport
nor LCOR Schiphol, which runs JFK’s Terminal 4 program, has drawn a profit since
9/11, but LCOR is choosing to weather the storm because of JFK’s long, successful track
record. They had made an initial investment which committed them to the project over
the long term. The downside to this alignment of interests is that the risks that the airport
is now sharing may bring down the private sector partner. Under the concessionaire
model, the manager passes on rental income; here the manager may make the decision to
renege on their contract with the airport in the face of a long period of no or minimal
profit. Similarly, when times are not good, there is less profit to go around, and the
airport may wish to renege and renegotiate with the manager. As a partner, rather than a
tenant or vendor, both sides of the relationship are exposed to the risks of the other trying
to change the relationship midstream. On the other hand, this model is well suited to an
uncertain environment if both parties understand the risks they are taking on, and are
compensated fairly for them.

- 20 -
Political considerations
Since airports are often a division of their local municipality, that separation from
control of tenant selection under the developer model is no mean feat. Otherwise subject
to local politics, the airport can claim to have washed its hands of the tenant selection
process; of course, how uninvolved depends on the particular circumstances in the airport
and the terms of the contract with the developer. An airport that has historically been
involved in every aspect of tenant selection might find it difficult to give up control of the
tenants, or as indicated above, may consider that to be the least attractive part of their job
and happily hand it off to the outside developer. But perhaps even more contentious is
the profit sharing relationship. The transparency of airport operations to the political
process makes profit sharing a frequent hot topic. In the positive growth years of the
1990s, with everyone making money, that has been manageable, but with the future more
uncertain, that issue may rise to the fore. On the other hand, the developer model gives
as good as it gets – in the months since 9/11, many developers have made no money on
their projects, but stay involved for the long haul in the conviction that the airline market
is sound. The financial benefits of the developer model will be explored more fully in the
later section on Data Analysis.
Organizational models
The issues discussed above can be encapsulated in the classic tradeoff between
control and incentive in and between organizations. On one extreme, with the direct
model you can have absolute control over the process with absolute clarity as to direction
and alignment of purpose. But the sacrifice is in incentive and motivation – no

- 21 -
bureaucracy, even a benevolent one, can hope to attract as broad a range of skills and as
full a commitment to the cause as an independent , profit-seeking entity. But a separate
organization is rightly looking out for its own best interests first – and if the long term
profits and cost of a damaged reputation didn’t justify the continued investment, then that
separate organization can and should exit the market. Post-9/11 these considerations may
seem less abstract and an awareness of the theoretical possibilities can shed some insight
on the subject.

- 22 -
Analysis of Sales Performance Data
Data Sources
To ascertain whether there is a quantifiable difference in sales performance
between these various models, we made use of two primary sources of numerical data.
The first, published in the Airport Retail News (ARN) Factbook, is the product of an
annual survey of airports that started in 1997. In 2000, the last year for which data was
available, the Factbook included 70 domestic airports, including all the large hubs, 22 of
the 35 medium hubs, and four Canadian airports. ARN has collected data on passenger
traffic, gross sales, gross sales per enplaned passenger and airport revenue broken down
by product (food & beverage, specialty retail, news & gifts, duty free and general
services); in addition, for each airport they list square footage by product and tenant, as
well as lease maturities. Where provided by the airport, these figures are further broken
down by concourse and terminal.
The second data set was provided courtesy of the Metro Washington Airport
Authority. For 2000 and 2001, the majority of large and medium airports participated in
an email survey, and reported sales broken down into food & beverage and retail, airside
and groundside, and for each product type the concession management model used by the
airport. As small number of large and medium hub airports are missing from this data
set, ARN data was used to supplement them. The separation of airside versus groundside
sales is not available across all airports, and has been ignored for the purposes of a
comparative analysis, although it is clear that a forecasting model would rely heavily on
that subset of the data.
- 23 -
The challenge with making use of both these data sources is the short history –
four years in the first case and two in the second. Ideally, we would like to see data that
spans over an airport’s introduction of a new retailing model. A number of airports made
that transition just before the start of the earlier data set; others are currently undergoing
construction with completion dates over the next one to two years. Another is resolving
the discrepancies between data sets regarding enplanements; ARN data is published
before the final figures are calculated by the Federal Aviation Administration, and the
MWAA survey has self-reported data. For the most part the differences are minor, but in
a few cases there may be timing issues (fiscal versus calendar year, for example.) This is
directly relevant, as a key measure of performance is sales per enplanement, and different
enplanement figures will give different values for this metric, even with agreement on the
sales level. The net effect is to reduce the accuracy of the data to +/- $0.15. A more
fundamental issue is the predictive power of aggregate data at the airport level. More
specific conclusions could be drawn from the volume of sales (rather than dollar volume)
of comparable items, such as pulp paperback or cheeseburgers, across many airports and
time periods.
Despite all these shortcomings, the data provides clear direction as the relative
performance of developer vs. concessionaire vs. directly run programs, both in the 2000
base year, and over time. While a longer or more detailed data set might prove to reduce
the uncertainty as to the magnitude of difference in performance between groups – and
might increase or decrease it -- the differences between the models is clear, as will be
demonstrated in the following sections.

- 24 -
Metrics
From the perspective of the traditional retailer, gross sales per square foot is a
principal measure of performance. In the typical urban or suburban environment, each
retail center competes with the others within the MSA (metropolitan statistical area) for
the disposable income of various population segments. Retail sales in an airport are
driven by very different factors. Firstly, there is a captive audience. Not many people go
to the airport to shop; most travelers are trying to fill their time as productively as they
can. Secondly, the great majority of airplane passengers are traveling for business or on
vacation, and in either case their ‘willingness to pay’, a measure of the profit available for
capture when transacting with them, is higher than under other, more banal,
circumstances. Lastly, airport retail is an exceedingly local business. In the language of
real estate economics, the commuting cost between airports is infinite – you don’t travel
from one airport to another to purchase an item – and thus the productivity of a retail
store is driven not by its size and turnover, but by the people close enough to pass by the
front door – in other words exposed passenger traffic. More specifically, exposed
enplanements, as debarking passengers rarely spend more time in the airport than they
have to. (A passenger on a stop-over or waiting for a connecting flight counts as a
separate enplanement.)
Analysis
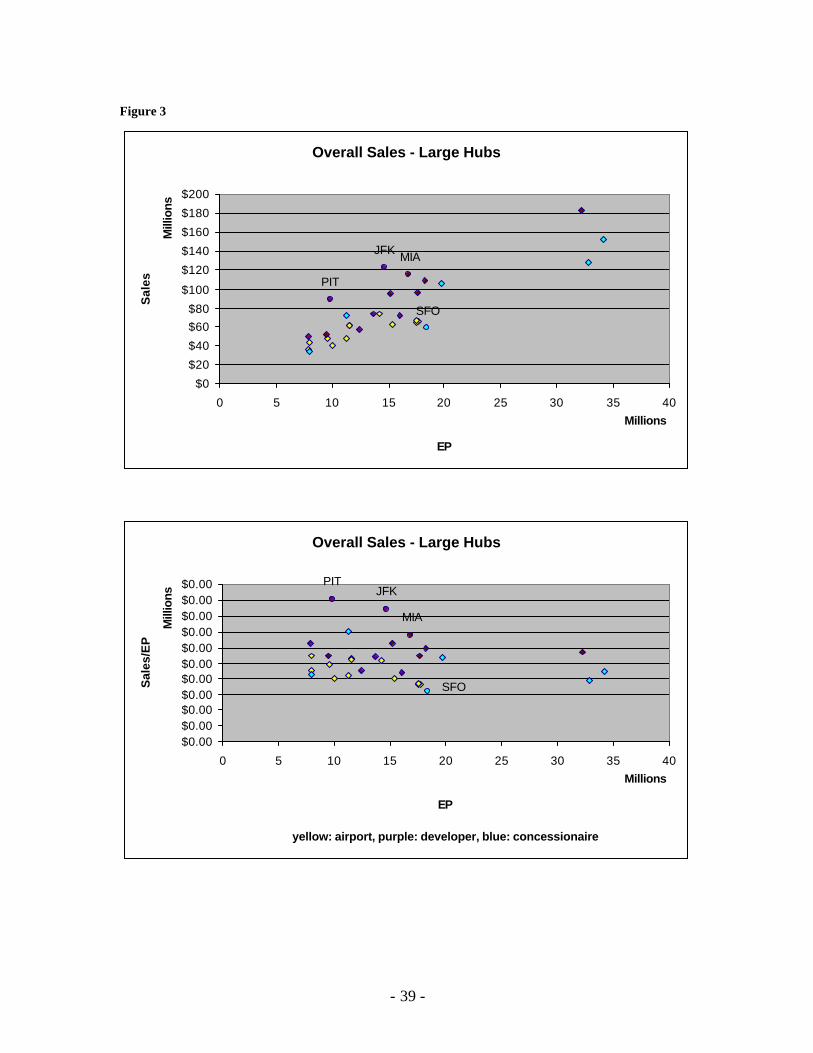
In the Tables and Figures section below, Figure 1 (Food & Beverage), Figure 2
(Retail) and Figure 3 (Total Sales) show that the distribution of sales per enplaned
passengers across all the airports in the MWAA data set (which includes the large hub

- 25 -
airports and 10 medium hubs) falls in a broad band between $2.50 and $3.50 per EP for
food & beverage, $1.00 and $3.50 for retail. At this level of analysis, when grouping the
airports by management structure, the variation among food & beverages does not
distinguish one model over the other, but in retail, the developer group seems to have a
better track record than either master operator or direct airport management.
To refine our observations, we looked more closely at the ARN data, and selected
a subset at the subset for which we have sales performance data throughout the 1997 to
2000 period. This dropped 13 airports from our data set of 55. Focusing on retail
performance (comprised of specialty retail and news/books, as this data was often
reported together from some airports and separately from others), we grouped them into
five categories: the three straight-forward models discussed above, and two hybrids,
airport direct / master concessionaire and “other” which included a partially developer
run airport.
The principal observation with the specialty retail product type is that sales per
enplaned passenger are far and away higher with airports that are managed by developers,
but more significantly, over the 1997-2000 time-period the group of developers increased
that lead enormously. (See Table 2 in Tables and Figures section.) In 2000, the average
developer-managed airport brought in $3.23 in retail per EP, while the average prime
contractor managed airport brought in $1.67, a significant differential, but all the more
impressive considering that the average developer-managed airport in 1997 brought in
$0.99 per EP, and the average prime concessionaire managed airport $1.35 ($2.24
improvement versus $0.32). Of course, averages can be deceiving, but when we looked
at the changes at individual airports, we found that fully 75% of the developer-managed
- 26 -
airports increased by at least $1.40, while the 75th percentile for increases at prime-
concessionaire managed airports was only $0.09 per enplaned passenger.
On the other hand, the distribution of outcomes was much broader at developer-
managed airports – there were some significant outlying data points to the upside. In
2000, the spread between the top and bottom quartile of prime-concessionaire managed
airports was $0.54, while $1.79 among those managed by developers. Since even the
best performing concession-run airports did not increase significantly (top quartile shifted
from $1.86 from $1.82), this is almost entirely due to an increase in the bottom
performers. A possible explanation for this behavior is as a competitive “tightening of
the pack”, as less well performing concession-managed airports increased their focus on
performing more in line with their peers, considering the attention that the presence of
developers had brought to specialty retail.
As a comparison, airports that ran their specialty retail franchises directly had a
similar performance profile to concession-run airports – the spread between top and
bottom quartiles tightened from $1.28 to $1.07, while the average shifted upwards by
$0.52 to $1.88, with the increase at the median airport of $0.07 even lower than at
concession-run airports (where it was a slight increase of $0.23). Compare this to
developer-run airports where the median airport improved by $1.48!
Interestingly, those firms that combined direct management by the airport with
master-concessionaire programs did better than either alone. Those airports already
started out ahead of direct- and concessionaire-managed airports (for the most part – their
sales were closely distributed around $1.72 in 1997); by 2000 they had maintained that
tight distribution while increasing average sales per enplaned passenger ($2.28 vs. $1.88
- 27 -
and 1.67), but were still not within striking distance of the developer-managed group (top
quartile of hybrid-managed airports were above $2.50, but bottom quartile of developer-
managed airports was $2.68).
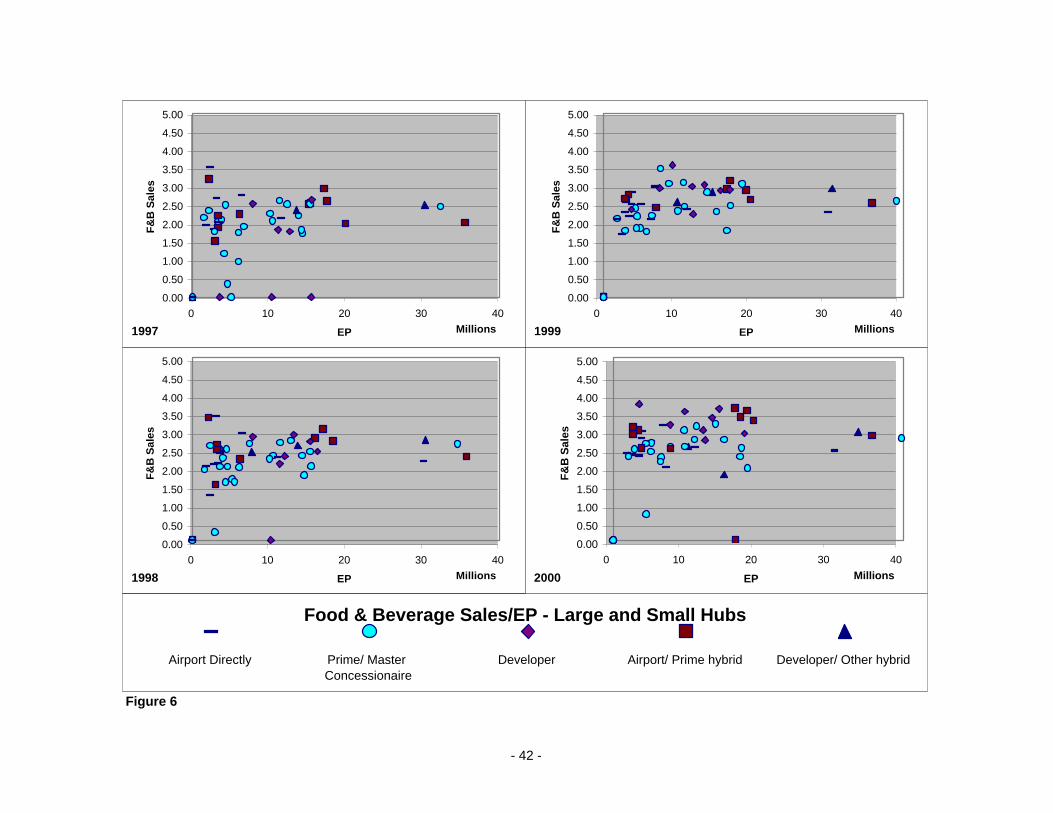
Similar observations can be made with regard to food & beverage sales. The
average developer-managed airports improved $1.51 over the time period, compared to
$0.54 (airport direct) and $0.48 (concessionaire). In 2000, all three groups had similar
tight ranges around that mean (top 25% to bottom 25% ranged from $0.46 to $0.37, not
significantly different given our data.) However, this was an improvement for developer
airports, which started out 1997 with a range of $0.76 versus $0.50 (concessionaire) and
$0.39 (airport direct). Given the same logic as above, it’s possible that developers had a
learning curve to climb with regard to food & beverage. Again, direct airport-prime
concessionaire hybrids did better than either alone, but not quite as well on average as the
group of developer airports.
On the whole, though, this is a minor point in the context of the larger
observation: by 2000 developer airports as a whole did better than their peers, even
though some concession-run programs (especially the joint direct airport-concessionaire
hybrids) might have outperformed a number of developer-run programs. This can be
observed visually in Figures 4, 5 and 6 (see Chart and Figures section below.)
- 28 -
Case Studies
In this section, we look at two airports – one deve loper run in part, the other
operated directly by the airport – to explore some of the issues raised in the previous
sections.
Chicago Midway Airport (MDW)
Midway Airport (2000 FAA ranking #32), sister airport to the #2 ranked Chicago-
O’Hare International, exemplifies the redesign of an airport terminal with attention to the
creation of a retailing atmosphere. In 1997, the City of Chicago began an ambitious $761
million revitalization of Midway Airport, the 7-year Terminal Development Program. As
part of the program, Midway has built an integrated municipal subway stop, a new
parking garage, and an impressive pedestrian bridge to a renovated terminal with 41 new
gates.
The investment in new infrastructure was well overdue. Sales per enplaned
passenger totaled $3 in both 1999 and 2000 (around $2 per EP for food & beverage and
$1 in specialty retail and news & gifts), giving Midway the unenviable distinction of the
second lowest sales performance per EP, both among its peer group of medium hubs
(which averaged $4.40), as well as the overall airport network (which averaged $5.16 per
EP in 2000.) As with other successful concession programs, such as Portland’s
OregonMarket and Pittsburgh’s AIRMALL, “Midway Boulevard” includes a mix of 23
national specialty stores as well as local Chicago favorites, with a notably high proportion
of food and beverage concessions. Like Portland, the Airport Authority has made the

- 29 -
commitment to developing this concept internally, and has worked closely with potential
tenants and the public to see it off successfully.
The ribbon cutting ceremony for the 23,000 square feet of new concessions was
on August 28, 2001 (see images at the end of this section). Another 24,000 square feet of
food & beverage and retail space is scheduled to open in the adjacent concourses at the
completion of the development program in 2004. The development plan for the full
program called for the concessionaires’ contribution of $12.8 million toward tenant
improvements, with gross sales projected at $39 million annually, and a 13% concession
fee to the airport – on the high end for medium sized airports, but 9/11 has certainly
changed the equation here, as elsewhere. Working in Midway’s favor is the placement of
the concessions triangle on the airside, after security, with clear vantage points to three
terminals, and a preponderance of food & beverage, which from anecdotal evidence
seems to come back at airports around the country more strongly than retail.
Unfortunately, sales data for 2001 was not available at the time this report was
printed, but Midway is a good test case for the retail concept. Quantifying the effects of
9/11 will be difficult, as the gross sales/EP metric may very well have to be adjusted; a
closer look at the difference in product categories (food & beverage versus specialty
retail and news & gifts) is warranted. In addition, Chicago has made a significant
commitment in time and money to the revitalization of Midway; not every airport or
municipal authority has the luxury of starting from the ground up.
- 30 -
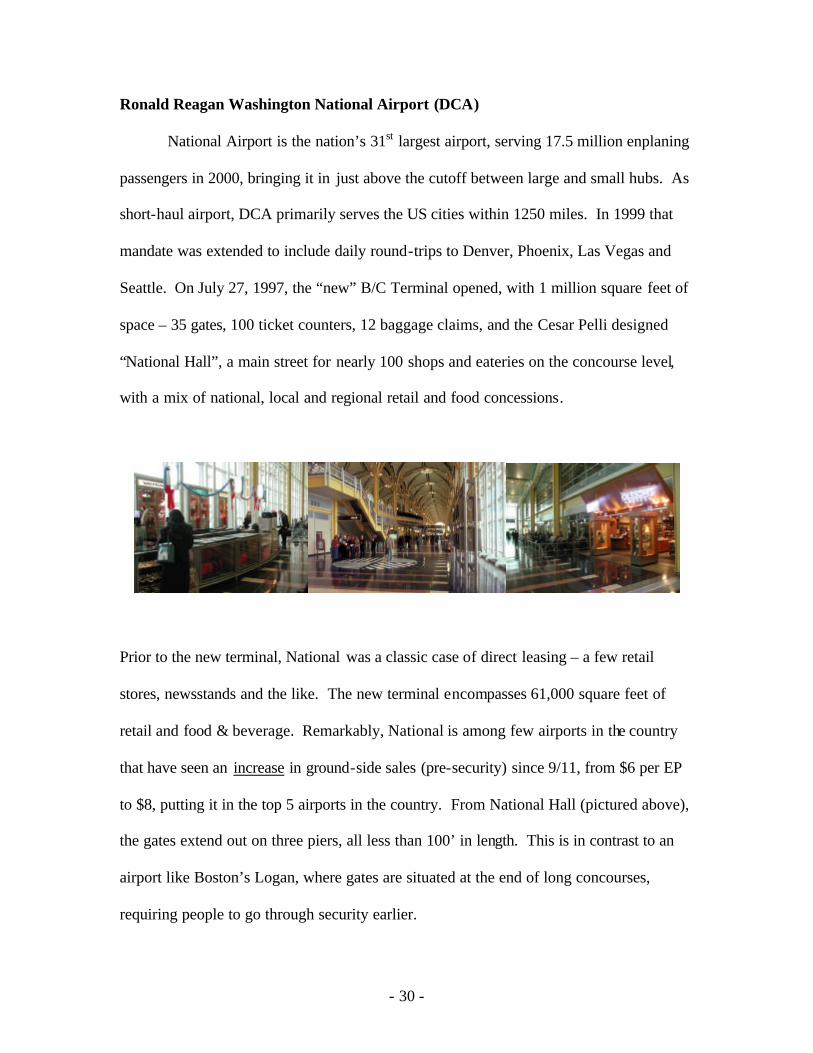
Ronald Reagan Washington National Airport (DCA)
National Airport is the nation’s 31st largest airport, serving 17.5 million enplaning
passengers in 2000, bringing it in just above the cutoff between large and small hubs. As
short-haul airport, DCA primarily serves the US cities within 1250 miles. In 1999 that
mandate was extended to include daily round-trips to Denver, Phoenix, Las Vegas and
Seattle. On July 27, 1997, the “new” B/C Terminal opened, with 1 million square feet of
space – 35 gates, 100 ticket counters, 12 baggage claims, and the Cesar Pelli designed
“National Hall”, a main street for nearly 100 shops and eateries on the concourse level,
with a mix of national, local and regional retail and food concessions.
Prior to the new terminal, National was a classic case of direct leasing – a few retail
stores, newsstands and the like. The new terminal encompasses 61,000 square feet of
retail and food & beverage. Remarkably, National is among few airports in the country
that have seen an increase in ground-side sales (pre-security) since 9/11, from $6 per EP
to $8, putting it in the top 5 airports in the country. From National Hall (pictured above),
the gates extend out on three piers, all less than 100’ in length. This is in contrast to an
airport like Boston’s Logan, where gates are situated at the end of long concourses,
requiring people to go through security earlier.

- 31 -
Initially, the program at National ran into challenges. Managers there point
toward too many nationally branded stores; since then they’ve introduced a mix of local
and regional names as well as national. Having Westfield as the outside developer
helped pull the program together, from bringing in franchisees such as McDonald’s to
running the competitive bid without entanglements into DC politics, adapting quickly to
the early changes, as well as the ones since 9/11. The relationship with Westfield has
worked well, with a roughly 25%-75% partnership split (25% to Westfield, 75% to the
airport); HMSHost ran the food & beverage program on a 50%-50% basis (this was their
first foray into the developer model), but has found that they are more comfortable
leveraging their traditional operational expertise as vendors.
Since the opening of the new terminal, sales per enplanement have risen from
around $4.50 to over $6.25 – and then to $8 after 9/11, bringing in over $6 million in
revenue (on $50 million in sales) to the airport in 2000. This represents a doubling of
income to the airport as compared to prior to the construction of the new terminal. Much
of that is due to the sales volume that came from the added retail space, but it does
demonstrate that there is revenue to capture. On the other hand, this was an expensive
renovation, and you could not justify such an elaborate terminal on the basis of improved
performance of retail and food concessions! What it does demonstrate is that thoughtful
integration of revenue capture when redesigning a terminal can improve an airport’s
balance sheet significantly. In 2000, National’s revenue was $130 million overall, $60
million of which from non-airline sources (parking, concessions, advertising). In other
words, 10% of the non-airline revenue – or 4.6% of the airports total revenue – was
derived from retailing.

- 32 -
Conclusions and Recommendations for Further Research A little more than ten years after the first shot was fired in the revolution of
airport retailing, the landscape has changed forever. From a sales volume perspective,
the developer model seems to have an advantage, although the best of the concessionaire
and directly run programs often perform superbly. Over the short term, airports around
the country will be facing difficult times, but with projections of continued growth, and
increased delays, it will only become more important for airports to capitalize on the
profit center represented by retailing. There are a number of considerations that industry
participants must address.
Firstly, although this evolution is a slow process, given the entrenched interests
and long contract times, this is a trend that is now reaching an inflection point that
foretells more rapid change. The pace of change – whether it be to a totally developer
run programs like Pittsburgh or a hybrid of airport/concessionaire/developer food court (a
la Boston Landing) – will only accelerate as contracts are renewed on a 5 year versus a
15 year cycle. Secondly, airports and developers must appreciate the differences and
challenges of dealing with a public-private partnership rather than a purely financial
vendor relationship. Investing in airport-based projects is generally a stable investment,
but there are political and organizational hurdles to be overcome. The concessionaire
model had adapted to this politicized environment, and the changes that have already
occurred reflect those organizations to change with the times. However, it is not clear,
and the data does not support the argument, that the deep knowledge of the airport
industry will enable them to compete head to head with a developer program. The

- 33 -
structural difference created by profit sharing, as compared to fixed rental payments,
seems to support the classic argument of coordination versus incentive to produce.
With the fragmentation of RFQs and RFPs to smaller and smaller projects, the
concessionaries will find themselves competing on the basis of more narrowly defined
expertise for less extensive projects. Whether the current field of development firms can
afford to all remain in the industry under these conditions is highly doubtful. There are
only a handful of airports that offer the choice projects that meet the investment criteria
of the largest development firms, and once those are redeveloped, there may be
significant firm exits from the industry. For those that do win projects, there will be a
steadily growing income stream directly tied into two key drivers of the US economy –
consumer spending and travel.
The directions for additional research are clear: as time passes the historical data
set that is easily available is growing and additional data going back to the early 1990s is
available through the Freedom of Information Act. As the conversions at developer-run
airports are completed during the 2002 to 2004 time-frame, a broader set of comparative
data will become available. In addition, with the expected growth of hybrid awards
within a particular airport, further analysis and disaggregating of the components of the
“hybrid” model should provide much fruitful labor.

- 34 -
Tables and Figures
Table 1: FAA Large and Medium Hub Airports
PRIMARY AIRPORT ENPLANEMENT ACTIVITY SUMMARY FOR CY2000 10/19/2001
Rank LOCID Airport Name Associated City ST Enplanements Hub
1 ATL THE WILLIAM B HARTSFIELD AT ATLANTA GA 39,277,901 Large
2 ORD CHICAGO O'HARE INTL CHICAGO IL 33,845,895 Large
3 LAX LOS ANGELES INTL LOS ANGELES CA 32,167,896 Large
4 DFW DALLAS/FORT WORTH INTERNATI DALLAS-FORT WORTH TX 28,274,512 Large
5 SFO SAN FRANCISCO INTERNATIONAL SAN FRANCISCO CA 19,556,795 Large
6 DEN DENVER INTL DENVER CO 18,382,940 Large
7 PHX PHOENIX SKY HARBOR INTL PHOENIX AZ 18,094,251 Large
8 LAS MC CARRAN INTL LAS VEGAS NV 17,425,214 Large
9 DTW DETROIT METROPOLITAN WAYNE DETROIT MI 17,326,775 Large
10 EWR NEWARK INTL NEWARK NJ 17,212,226 Large
11 MSP MINNEAPOLIS-ST PAUL INTL/WO MINNEAPOLIS MN 16,959,014 Large
12 MIA MIAMI INTL MIAMI FL 16,489,341 Large
13 IAH GEORGE BUSH INTERCONTINENTA HOUSTON TX 16,358,035 Large
14 JFK JOHN F KENNEDY INTL NEW YORK NY 16,155,437 Large
15 STL LAMBERT-ST LOUIS INTL ST LOUIS MO 15,288,493 Large
16 MCO ORLANDO INTL ORLANDO FL 14,831,648 Large
17 SEA SEATTLE-TACOMA INTL SEATTLE WA 13,875,942 Large
18 BOS GENERAL EDWARD LAWRENCE LOG
BOSTON MA 13,613,507 Large
19 LGA LA GUARDIA NEW YORK NY 12,697,208 Large
20 PHL PHILADELPHIA INTL PHILADELPHIA PA 12,294,051 Large
21 CLT CHARLOTTE/DOUGLAS INTL CHARLOTTE NC 11,469,282 Large
22 CVG CINCINNATI/NORTHERN KENTUCK COVINGTON/CINCINNATI KY 11,223,966 Large
23 HNL HONOLULU INTL HONOLULU HI 11,174,701 Large
24 PIT PITTSBURGH INTERNATIONAL PITTSBURGH PA 9,871,995 Large
25 BWI BALTIMORE-WASHINGTON INTL BALTIMORE MD 9,675,681 Large
26 IAD WASHINGTON DULLES INTERNATI CHANTILLY VA 9,643,275 Large
27 SLC SALT LAKE CITY INTL SALT LAKE CITY UT 9,522,344 Large
28 TPA TAMPA INTL TAMPA FL 7,969,797 Large
29 SAN SAN DIEGO INTL-LINDBERGH FL SAN DIEGO CA 7,898,360 Large
30 FLL FORT LAUDERDALE/HOLLYWOOD I FORT LAUDERDALE FL 7,817,173 Large
31 DCA RONALD REAGAN WASHINGTON NA
ARLINGTON VA 7,517,811 Large
32 MDW CHICAGO MIDWAY CHICAGO IL 7,059,520 Medium
33 PDX PORTLAND INTL PORTLAND OR 6,754,514 Medium
34 CLE CLEVELAND-HOPKINS INTL CLEVELAND OH 6,269,516 Medium
35 SJC SAN JOSE INTERNATIONAL SAN JOSE CA 6,170,384 Medium
36 MCI KANSAS CITY INTL KANSAS CITY MO 5,903,296 Medium
37 MEM MEMPHIS INTL MEMPHIS TN 5,684,619 Medium
38 OAK METROPOLITAN OAKLAND INTL OAKLAND CA 5,196,451 Medium
39 RDU RALEIGH-DURHAM INTL RALEIGH/DURHAM NC 5,191,077 Medium
40 SJU LUIS MUNOZ MARIN INTL SAN JUAN PR 5,135,591 Medium
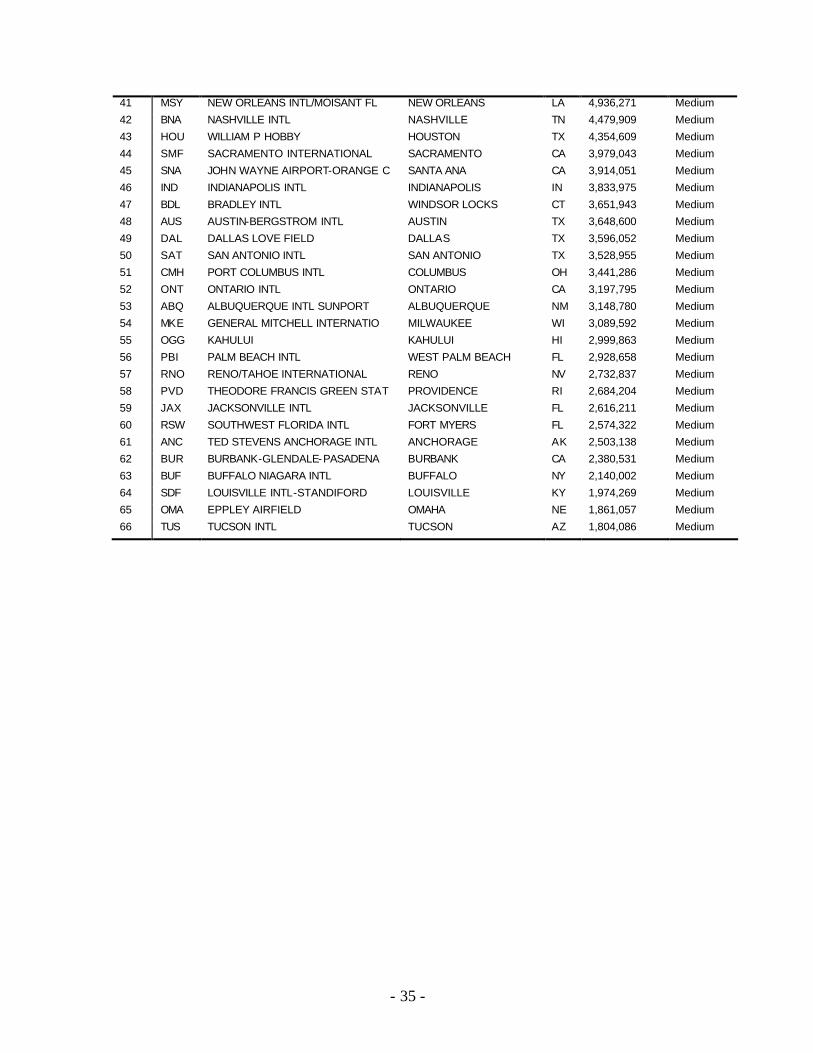
- 35 -
41 MSY NEW ORLEANS INTL/MOISANT FL NEW ORLEANS LA 4,936,271 Medium
42 BNA NASHVILLE INTL NASHVILLE TN 4,479,909 Medium
43 HOU WILLIAM P HOBBY HOUSTON TX 4,354,609 Medium
44 SMF SACRAMENTO INTERNATIONAL SACRAMENTO CA 3,979,043 Medium
45 SNA JOHN WAYNE AIRPORT-ORANGE C SANTA ANA CA 3,914,051 Medium
46 IND INDIANAPOLIS INTL INDIANAPOLIS IN 3,833,975 Medium
47 BDL BRADLEY INTL WINDSOR LOCKS CT 3,651,943 Medium
48 AUS AUSTIN-BERGSTROM INTL AUSTIN TX 3,648,600 Medium
49 DAL DALLAS LOVE FIELD DALLAS TX 3,596,052 Medium
50 SAT SAN ANTONIO INTL SAN ANTONIO TX 3,528,955 Medium
51 CMH PORT COLUMBUS INTL COLUMBUS OH 3,441,286 Medium
52 ONT ONTARIO INTL ONTARIO CA 3,197,795 Medium
53 ABQ ALBUQUERQUE INTL SUNPORT ALBUQUERQUE NM 3,148,780 Medium
54 MKE GENERAL MITCHELL INTERNATIO MILWAUKEE WI 3,089,592 Medium
55 OGG KAHULUI KAHULUI HI 2,999,863 Medium
56 PBI PALM BEACH INTL WEST PALM BEACH FL 2,928,658 Medium
57 RNO RENO/TAHOE INTERNATIONAL RENO NV 2,732,837 Medium
58 PVD THEODORE FRANCIS GREEN STAT PROVIDENCE RI 2,684,204 Medium
59 JAX JACKSONVILLE INTL JACKSONVILLE FL 2,616,211 Medium
60 RSW SOUTHWEST FLORIDA INTL FORT MYERS FL 2,574,322 Medium
61 ANC TED STEVENS ANCHORAGE INTL ANCHORAGE AK 2,503,138 Medium
62 BUR BURBANK-GLENDALE-PASADENA BURBANK CA 2,380,531 Medium
63 BUF BUFFALO NIAGARA INTL BUFFALO NY 2,140,002 Medium
64 SDF LOUISVILLE INTL-STANDIFORD LOUISVILLE KY 1,974,269 Medium
65 OMA EPPLEY AIRFIELD OMAHA NE 1,861,057 Medium
66 TUS TUCSON INTL TUCSON AZ 1,804,086 Medium

- 36 -
Table 2: Analysis of ARN data 1997-2000
1997 2000 Change at each airport
1997-2000 min 0.00 0.00 0.00 3.72 2.31 1.41 -1.15 -1.22 -0.08 25% 3.06 1.93 1.08 4.23 2.42 1.49 0.37 0.35 -0.01 average 3.27 2.01 1.36 4.58 2.55 1.88 0.55 0.39 0.07 75% 5.71 2.32 2.36 5.31 2.85 2.56 1.17 0.80 0.52 max 6.62 3.55 4.46 7.04 3.15 4.49 4.59 2.71 1.88 skew -0.42 -0.87 0.96 1.13 0.65 1.62 1.44 0.52 1.84 kurtosis 0.10 2.81 0.93 0.39 -0.94 2.51 3.04 2.59 3.09 A
irpor
t Dire
ctly
count 8.00 min 1.34 0.36 0.64 1.15 0.70 0.44 0.09 -0.02 -0.29 25% 3.20 1.79 1.02 3.78 2.29 1.36 0.59 0.35 0.09 average 3.54 2.08 1.35 4.05 2.56 1.67 0.76 0.48 0.23 75% 3.97 2.29 1.82 4.76 2.75 1.86 0.88 0.56 0.39 max 4.46 2.64 2.08 5.31 3.17 2.69 2.50 2.29 0.78 skew -1.25 -1.66 0.10 -1.82 -2.08 0.18 1.85 2.61 0.08 kurtosis 1.48 3.81 -1.05 5.60 6.38 1.24 5.16 8.44 0.66 P
rime
Ope
rato
r
count 17.00 min 2.78 0.00 0.00 5.68 3.00 2.39 -0.90 0.61 1.33 25% 2.79 1.79 0.95 5.73 3.15 2.68 1.94 0.93 1.40 average 4.45 1.84 0.99 6.38 3.35 3.23 2.42 1.16 1.48 75% 5.98 2.55 1.90 7.99 3.52 4.47 2.89 1.56 1.73 max 8.89 2.65 3.33 8.40 3.59 4.81 2.95 3.52 4.47 skew 0.99 -1.50 0.79 0.47 -0.30 0.33 -1.89 1.75 2.17 kurtosis 0.20 2.49 0.72 -2.83 -1.85 -2.66 3.68 3.29 4.74
Dev
elop
er
count 5.00 min 2.59 1.53 1.06 4.26 2.50 1.67 0.27 -0.12 -0.39 25% 3.41 2.02 1.31 4.90 2.87 1.91 0.94 0.65 0.21 average 4.10 2.25 1.72 5.35 3.05 2.28 1.27 0.73 0.47 75% 4.78 2.61 2.02 5.85 3.34 2.50 1.65 0.95 0.64 max 5.96 3.22 3.00 7.37 3.61 4.27 2.45 1.52 2.25 skew 0.16 0.31 0.75 0.83 -0.13 1.62 0.32 -0.26 1.27 kurtosis -0.49 -0.37 -0.25 0.08 -0.98 2.82 0.05 0.87 1.88
Airp
ort/O
pera
tor
hybr
id
count 10.00 min 4.90 2.38 2.39 2.65 1.79 0.87 -2.68 -0.59 -2.09 25% 5.01 2.41 2.53 3.18 2.08 1.10 -2.05 -0.33 -1.72 average 5.12 2.44 2.67 3.71 2.37 1.33 -1.41 -0.07 -1.34 75% 5.23 2.48 2.82 4.23 2.67 1.57 -0.78 0.19 -0.97 max 5.34 2.51 2.96 4.76 2.96 1.80 -0.14 0.45 -0.59 skew n/a n/a n/a n/a n/a n/a n/a n/a n/a kurtosis n/a n/a n/a n/a n/a n/a n/a n/a n/a
Oth
er/d
evel
oper
hyb
rid
count 2.00

- 37 -
Figure 1
Food & Beverage - Large Hubs
SFOMSP
MIAJFK
PIT
$0
$20
$40
$60
$80
$100
$120
0 5 10 15 20 25 30 35 40
Mill
ions
Millions
EP
Sal
es
Food & Beverage - Large Hubs
SFOMSP
MIAJFKPIT
$0.00$0.50$1.00$1.50$2.00$2.50$3.00$3.50$4.00$4.50$5.00
0 5 10 15 20 25 30 35 40Millions
EP
yellow: airport, purple: developer, blue: concessionaire
Sal
es/E
P

- 38 -
Figure 2
Retail - Large Hubs
DTWEWR
MIA
JFK
STL
MCOHNL
PIT
DCA
$0
$20
$40
$60
$80
$100
$120
0 5 10 15 20 25 30 35 40
Mill
ions
Millions
EP
Sal
es
Retail - Large Hubs
DTWEWR
MIA
JFK
STL
MCO
HNL
DCA
$0.00$0.50$1.00$1.50$2.00$2.50$3.00$3.50$4.00$4.50$5.00
0 5 10 15 20 25 30 35 40Millions
EP
yellow: airport, purple: developer, blue: concessionaire
Sal
es/E
P
- 39 -
Figure 3
Overall Sales - Large Hubs
SFO
MIAJFK
PIT
$0
$20
$40
$60$80
$100
$120
$140
$160
$180
$200
0 5 10 15 20 25 30 35 40
Mill
ions
Millions
EP
Sal
es
Overall Sales - Large Hubs
SFO
MIA
JFKPIT
$0.00$0.00$0.00$0.00$0.00$0.00$0.00$0.00$0.00$0.00$0.00
0 5 10 15 20 25 30 35 40
Mill
ions
Millions
EP
yellow: airport, purple: developer, blue: concessionaire
Sal
es/E
P
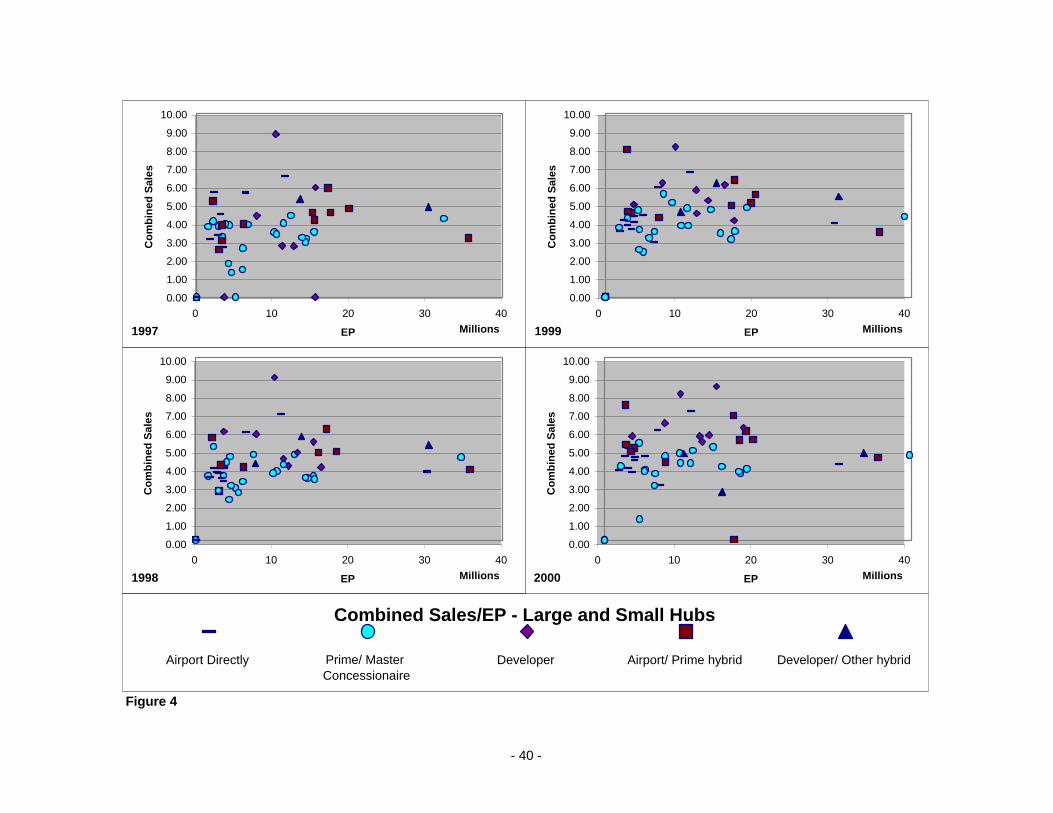
Figure 4
1998
0.00
1.00
2.00
3.00
4.00
5.00
6.00
7.00
8.00
9.00
10.00
0 10 20 30 40MillionsEP
Co
mb
ined
Sal
es
1999
0.00
1.00
2.00
3.00
4.00
5.00
6.00
7.00
8.00
9.00
10.00
0 10 20 30 40MillionsEP
Co
mb
ined
Sal
es
1997
0.00
1.00
2.00
3.00
4.00
5.00
6.00
7.00
8.00
9.00
10.00
0 10 20 30 40MillionsEP
Co
mb
ined
Sal
es
Combined Sales/EP - Large and Small Hubs
Airport Directly Developer Airport/ Prime hybrid Developer/ Other hybridPrime/ Master Concessionaire
2000
0.00
1.00
2.00
3.00
4.00
5.00
6.00
7.00
8.00
9.00
10.00
0 10 20 30 40MillionsEP
Co
mb
ined
Sal
es
- 40 -

Figure 5
1998
0.00
0.50
1.00
1.50
2.00
2.50
3.00
3.50
4.00
4.50
5.00
0 10 20 30 40MillionsEP
Ret
ail S
ales
1999
0.00
0.50
1.00
1.50
2.00
2.50
3.00
3.50
4.00
4.50
5.00
0 10 20 30 40MillionsEP
Ret
ail S
ales
1997
0.00
0.50
1.00
1.50
2.00
2.50
3.00
3.50
4.00
4.50
5.00
0 10 20 30 40MillionsEP
Ret
ail S
ales
Retail Sales/EP - Large and Small Hubs
Airport Directly Developer Airport/ Prime hybrid Developer/ Other hybridPrime/ Master Concessionaire
2000
0.00
0.50
1.00
1.50
2.00
2.50
3.00
3.50
4.00
4.50
5.00
0 10 20 30 40MillionsEP
Ret
ail S
ales
- 41 -
a
Figure 6
1997
0.00
0.50
1.00
1.50
2.00
2.50
3.00
3.50
4.00
4.50
5.00
0 10 20 30 40MillionsEP
F&
B S
ales
1998
0.00
0.50
1.00
1.50
2.00
2.50
3.00
3.50
4.00
4.50
5.00
0 10 20 30 40MillionsEP
F&
B S
ales
1999
0.00
0.50
1.00
1.50
2.00
2.50
3.00
3.50
4.00
4.50
5.00
0 10 20 30 40MillionsEP
F&
B S
ales
Food & Beverage Sales/EP - Large and Small Hubs
Airport Directly Developer Airport/ Prime hybrid Developer/ Other hybridPrime/ Master Concessionaire
2000
0.00
0.50
1.00
1.50
2.00
2.50
3.00
3.50
4.00
4.50
5.00
0 10 20 30 40MillionsEP
F&
B S
ales
- 42 -

- 43 -
Bibliography and Sources
1. Data sources
a. Airport Retail News Factbook 1998-2001 b. Metro Washington Airport Authority email survey
2. Print Articles
a. ICSC Research Quarterly
i. v 6 no 3, Fall 1999, p 18-23, “Airport Retailing” ii. v 8 no 3, Fall 2001, p 9-16, “Recent Trends in Airport Retailing”
b. Washington Post i. “THE SKY'S THE LIMIT; The Region's Airports Are Teeming
Business Centers Whose Profits Are Taking Off, Too”, May 18, 1995, pg F12, by Frank Swoboda, final edition
c. Airport Retail News i. “Developer Benefits Conspicuous in Complex New Environment”,
by Pauline Armbrust, March 2002, p12-18
3. Web Articles a. Metro Washington Airport Authority 2001 Comprehensive Annual
Financial Report (CAFR) http://www.mwaa.com/financial/Final-2001CAFR-July101.pdf
b. “Local Businesses Selected for First Phase of New Midway Airport Concessions Program”, June 5, 2000, http://www.chicagoairports.com/doa/avi_news/doa_avi_news_pr_6.shtm
c. “Daley Opens Chicago-Oriented Concessions Triangle At Midway”, Press release, August 28, 2001, http://www.ohare.com/doa/avi_news/doa_avi_news_pr_60.shtm
d. 2000 Annual Report, Chicago Department of Aviation, http://www.ohare.com/doa/avi_news/2000annual.pdf
e. Air Transport Association, Airline Handbook, Chapter 7: Airports http://www.airlines.org/public/publications/display1.asp?nid=967
f. FAA Primary Airport Enplanements Activity Summary (CY 2000) http://www.faa.gov/arp/planning/VPhubs.htm
g. PDX CONCESSIONS NAMED ‘BEST’ FOR 2001, PDX News release, March 7, 2001, http://www.portlandairportpdx.com/htmlpop/a%5F200138154534nr%2D01%2D010.htm
h. PDX OPENS REMODELED CONCOURSE C, PDX news release, August 13, 2001, http://www.portofportland.com/A_200181314163NR-01-060.htm
i. PDX CONCESSIONS NAMED ‘BEST’ FOR 2001, PDX news release, March 7, 2001,

- 44 -
http://www.portlandairportpdx.com/htmlpop/a%5F200138154534nr%2D01%2D010.htm
j. ARN's Best Concessions 2002, http://www.airportretailnews.com/ARN_FEB_winners.pdf
k. “BAA Announces `Spring Arrivals' at the AIRMALL®”, BAA Pittsburgh press release, May 13, 2002, http://biz.yahoo.com/prnews/020513/phm017_2.html
l. “Massport to Upgrade Customer Conveniences at Logan; BAA To Bring World-Class Restaurants and Shops to Terminals”, Logan press release, July 5th, 2000, http://www.massport.com/about/press00/press_news_baa.html
m. “New bidding poses ethical challenge for mayor”, The Atlanta Journal-Constitution, April 3, 2002, http://www.accessatlanta.com/ajc/metro/airport/0403airport.html
4. Websites
a. Atlanta Hartsfield (http://www.atlanta-airport.com/) b. Boston Logan (http://www.massport.com/logan/ ) c. Chicago Midway (http://www.ohare.com/midway/home.asp) d. Pittsburgh (http://www.pitairport.com/) e. Portland (http://www.portlandairportpdx.com/) f. Washington Dulles/National (http://www.mwaa.com/)
5. Phone Interviews
a. Airports
i. Ronald Reagan Washington National and Washington Dulles International (Metro Washington Airport Authority)
1. Terry Dorrington, Business Manager 2. Cheryl Nashir, Terminal Concessions and Services
ii. Hartsfield Atlanta International Airport 1. Charles “Chili” Ewing, Aviation Property Specialist
iii. Fort Lauderdale-Hollywood International (Broward County Aviation Department)
1. Jack Lee, Director of Business 2. Bryan Malinowski, Airport Properties Manager
(Airlines/Concession) b. Developers
i. Marketplace Development 1. Bob Weinberg, Chairman
ii. Westfield 1. Tim Lowe, VP Airport Business Development
c. Concessionaires i. HMSHost
1. Steve Johnson, Vice President of Business Development

- 45 -
d. Other contacts i. Port Authority of New York/New Jersey,
1. Ann Freedman, Newark Retail and Concessions Manager ii. MassPort-Logan,
1. Sal Amico, Concessions Manager iii. Parodies,
1. Dick Dickson, President iv. Sydney Airport,
1. Robert McFayden, Head of Retail