
curis.ku.dk · Rapport / Fødevareøkonomisk Institut, No. 170 Download ... Stage of the food ......
63
university of copenhagen Københavns Universitet The branding behaviour of Danish food industry firms Baltzer, Kenneth Thomas; Baker, Alister Derek; Møller, A. S. Publication date: 2004 Document Version Early version, also known as pre-print Citation for published version (APA): Baltzer, K., Baker, D., & Møller, A. S. (2004). The branding behaviour of Danish food industry firms. Copenhagen: Fødevareøkonomisk Institut. Rapport / Fødevareøkonomisk Institut, No. 170 Download date: 13. Sep. 2018
Transcript of curis.ku.dk · Rapport / Fødevareøkonomisk Institut, No. 170 Download ... Stage of the food ......
u n i ve r s i t y o f co pe n h ag e n
Københavns Universitet
The branding behaviour of Danish food industry firms
Baltzer, Kenneth Thomas; Baker, Alister Derek; Møller, A. S.
Publication date:2004
Document VersionEarly version, also known as pre-print
Citation for published version (APA):Baltzer, K., Baker, D., & Møller, A. S. (2004). The branding behaviour of Danish food industry firms.Copenhagen: Fødevareøkonomisk Institut. Rapport / Fødevareøkonomisk Institut, No. 170
Download date: 13. Sep. 2018

Fødevareøkonomisk Institut Report 170
The branding behaviour of Danish food industry firms Kenneth Baltzer, Derek Baker and Anja Skadkær Møller
Copenhagen 2004

2 The branding behaviour of Danish food industry firms, FØI
The branding behaviour of Danish food industry firms, FØI 3
Contents:
Preface .......................................................................................................................... 5
1. Introduction............................................................................................................ 7 1.1. Background................................................................................................... 7
Brands ......................................................................................................... 7 Branding behaviour and the food industry ................................................... 7 Brands and public policy ............................................................................ 11
1.2. The study .................................................................................................... 12 Aims of the study........................................................................................ 12 Structure of the report................................................................................. 12
1.3. Explanations of firms’ branding behaviour ................................................ 12
2. Model and data..................................................................................................... 17 2.1. Measurement issues.................................................................................... 17
Measurement of branding behaviour .......................................................... 17 Measurement of firms’ characteristics........................................................ 17
2.2. Data ....................................................................................................... 18 Survey ....................................................................................................... 18
2.3. Hypotheses concerning explanatory variables............................................ 22 Interactions between branding behaviour variables.................................... 22 Firm size and features of ownership........................................................... 22 Value added................................................................................................ 23 Trade orientation ........................................................................................ 24 Commodity sector ...................................................................................... 24 Stage of the food marketing chain.............................................................. 25 Firms’ views on food chain organisation and competitiveness .................. 25
3. Empirical model ................................................................................................... 27 3.1. Model approach .......................................................................................... 27 3.2. Specification ............................................................................................... 27
Data ....................................................................................................... 27 Models of current branding behaviour ....................................................... 27 Change in branding behaviour.................................................................... 28
3.3. Measure of goodness of fit ......................................................................... 29
4. Results.................................................................................................................. 31 4.1. Estimates of model parameters................................................................... 31 4.2. Model performance .................................................................................... 31 4.3. Interactions amongst branding behaviour variables ................................... 33
4 The branding behaviour of Danish food industry firms, FØI
4.4. Firm size and features of ownership........................................................... 34 4.5. Value added ................................................................................................ 35 4.6. Trade orientation ........................................................................................ 36 4.7. Commodity sector ...................................................................................... 36 4.8. Stage of the food marketing chain.............................................................. 37 4.9. Firms' views on food chain organisation and competitiveness................... 38
5. Discussion and conclusions.................................................................................. 39 5.1. Overview .................................................................................................... 39 5.2. Key results .................................................................................................. 40
Brand ownership......................................................................................... 40 Number of brands introduced ..................................................................... 40 Share of sales as retailers’ own-label brands.............................................. 41
5.3. Implications for the Danish food industry .................................................. 42 Sources of new brands................................................................................ 42 The role of retail firms................................................................................ 43 Retailers’ own-label brands ........................................................................ 43
5.4. Policy implications ..................................................................................... 44 Branding behaviour as a cause and an outcome ......................................... 44 Government role in branding...................................................................... 44 Firm size and industry concentration.......................................................... 45 Export promotion........................................................................................ 45 Firms’ conduct............................................................................................ 45
5.5. Limitations of the research ......................................................................... 46 5.6. Extensions of the research .......................................................................... 47
References .................................................................................................................. 49
I. Annex 1: Technical discussion of model specification issues.............................. 53 I.1. A general model ......................................................................................... 53 I.2. Functional form .......................................................................................... 53 I.3. Missing values ............................................................................................ 53 I.4. Bounded values of dependent variables ..................................................... 54
Count data models ...................................................................................... 55 Fractional data model ................................................................................. 56
1.5. Observations on changes in dependent variables ....................................... 57
II. Annex 2: Raw results of parameter estimates ...................................................... 59 II.1. Raw parameter estimates ............................................................................ 59 II.2. Parameter transformation and interpretation ................................................ 61
Current Branding behaviour ....................................................................... 61 Change in branding behaviour.................................................................... 62
The branding behaviour of Danish food industry firms, FØI 5
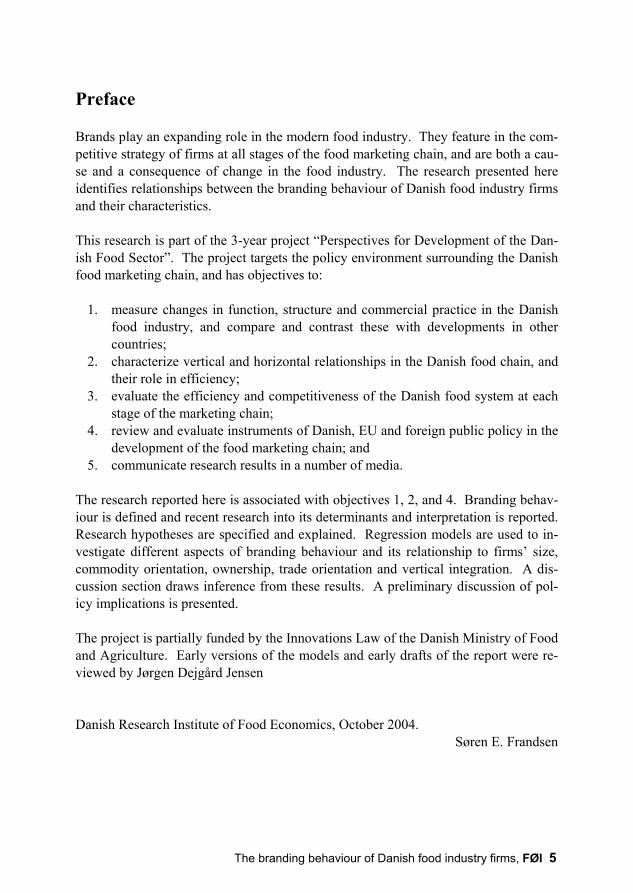
Preface
Brands play an expanding role in the modern food industry. They feature in the com-petitive strategy of firms at all stages of the food marketing chain, and are both a cau-se and a consequence of change in the food industry. The research presented here identifies relationships between the branding behaviour of Danish food industry firms and their characteristics. This research is part of the 3-year project “Perspectives for Development of the Dan-ish Food Sector”. The project targets the policy environment surrounding the Danish food marketing chain, and has objectives to:
1. measure changes in function, structure and commercial practice in the Danish food industry, and compare and contrast these with developments in other countries;
2. characterize vertical and horizontal relationships in the Danish food chain, and their role in efficiency;
3. evaluate the efficiency and competitiveness of the Danish food system at each stage of the marketing chain;
4. review and evaluate instruments of Danish, EU and foreign public policy in the development of the food marketing chain; and
5. communicate research results in a number of media. The research reported here is associated with objectives 1, 2, and 4. Branding behav-iour is defined and recent research into its determinants and interpretation is reported. Research hypotheses are specified and explained. Regression models are used to in-vestigate different aspects of branding behaviour and its relationship to firms’ size, commodity orientation, ownership, trade orientation and vertical integration. A dis-cussion section draws inference from these results. A preliminary discussion of pol-icy implications is presented. The project is partially funded by the Innovations Law of the Danish Ministry of Food and Agriculture. Early versions of the models and early drafts of the report were re-viewed by Jørgen Dejgård Jensen Danish Research Institute of Food Economics, October 2004.
Søren E. Frandsen

6 The branding behaviour of Danish food industry firms, FØI
The branding behaviour of Danish food industry firms, FØI 7
1. Introduction
1.1. Background
Brands
Brands are a symbolic construct, typically including name, logo and some sort of vis-ual image or symbol. In general, they are created to represent a collection of informa-tion about a product, group of products,1 or a firm2 that distinguishes it from others. Use of a brand provides a seller with a means of quality-certifying a product, transfer-ring the firm’s goodwill to the product, and otherwise differentiating it from those of competitors (Kohls and Uhl, 1990). Beierlein and Woolverton (1991) identify the benefits of branding as:
− improved market segmentation; − increased consumer loyalty; − increased repeat business; − ease of new product introduction; and − improved corporate image.
Kaufman et al. (2000) found that on the U.S. market the share of branded sales in all food product sales increased from 7% to 19% in the period 1987-1997. For fresh-cut and packaged salad items the increase was from 1% to 15% in the same period. Cas-ual observation suggests that food products are becoming more intensively branded. Such trends are likely to be occurring in Denmark, although they have not been measured empirically.
Branding behaviour and the food industry
Management in the food industry is increasingly characterised by “brand manage-ment”, as numerous food brands have entered the list of the 100 most valuable brands (Businessweek, 2004), although methods for brand valuation vary substantially
1 So-called “multiproduct brands” 2 So-called “corporate brands”
8 The branding behaviour of Danish food industry firms, FØI
(Davis and Spicer, 2004). Brands are frequently bought and sold for large sums. In just one example, Swissinfo (2003) reports that Novartis sold the “Ovaltine” brand to Associated British Foods for 2 billion DKK34 in 2003. Merger and acquisition in the food industry increasingly focuses on firms’ acquisition of brands, and this has been recognised in European legal scrutiny of market power in the industry. An example is the requirement that Unilever divest itself of a large number of food product brands as a condition for approval of its acquisition of Bestfoods (EU Commission, 2000). Issues of the use of brands in vertical competition (between stages of the food market-ing chain) have become more topical with the increasing use of retailers’ own-label brands. Borghesani et al. (1999) has suggested that they replace processors’ brands, while Mills (1999) proposes that for processors, contract production of own-label brands is a means of utilizing spare capacity, and may well fit into a processors’ mar-keting strategy. These relationships have rarely been empirically examined. In terms of horizontal competition, modern food retailing increasingly offers custom-ers a composite shopping experience that emphasises convenience. It seeks to foster and maintain repeat customers, recognising that it is cheaper to retain customers than to attract new ones (De Kimpe et al., 1997). Food and Drink (2003) estimated that United Biscuits would spend 37.9 million DKK5 in promoting one of its biscuit brands, and that this would add some 75.9 million DKK6 to the value of that brand, in addition to whatever increase in sales was achieved. This level of return encourages promotion of corporate brands in order to maximise shareholder value. In retailing, this has led industry observers to suggest that “the firm has become the brand” (Sparks, 1997), and the idea that “store loyalty replaces brand loyalty” as shoppers prefer to shop at one, familiar, location (Gruen et al., 2002). Sparks (1997) and Collins (2001) have described the importance of retailers’ own-label brands in firms’ strategies to establish store loyalty. Hughes (2000) describes continual narrowing of food industry channels associated with consolidation at processing, distribution and retail stages of the food chain. Con-nor (2000) describes this as “food convergence”, and notes two forms it may take. In the first (the “US model”), food manufacturers exercise market power with globally well-known brands. Their economies of scale in processing and promotion com-
3 400 million Swiss Francs 4 1 billion = 1 x 10⁹ 5 5.1 million Euros 6 10.2 million Euros
The branding behaviour of Danish food industry firms, FØI 9
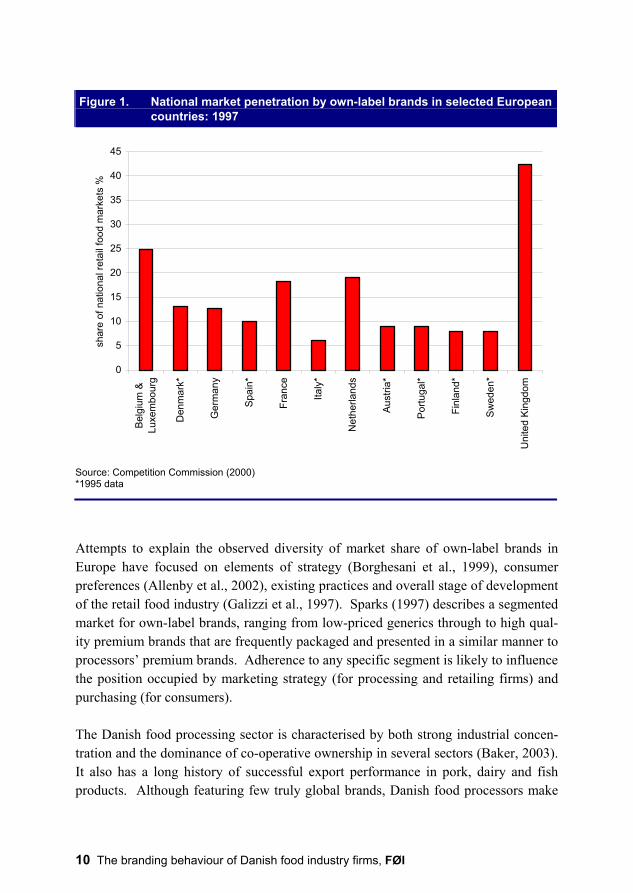
plement large market shares. In the second form (the “UK model”), retailers exercise market power based on buying power and economies of scope, complemented by the use of retailers’ own-label brands. In both forms, Conner identifies “brand monop-oly” (concentration of brands, or a few firms owning the majority of brands) as both a mechanism and an outcome of food convergence. Ward et al. (2002) examined the response of food processors to growth in retailers’ own-label brands. They find declining market share for processors’ brands in some product categories, but the impacts are different across commodity sectors. Most sig-nificantly, Ward et al. find that food manufacturers have responded to retailers’ own-label brands by increasing prices on their brands. Borghesani et al. (1999) propose that second- and third-tier brands are being displaced by own-label on food stores’ shelves, while leading or global brands are maintaining their market share. To the au-thors’ knowledge, this proposition has not been empirically tested. Measurement of the market share occupied by retailers’ own brands has received sur-prisingly little attention from researchers. The UK Competition Commission’s esti-mates that about 13% of Danish retail food sales were of retailers’ own-label brands in 1995 (figure 1), and that this lags behind the UK, where some authors estimate own-labels to have a market share of over 50% (e.g. Brouwer and Bijman, 2001). France, the Netherlands and Belgium have own-label market shares between 15 and 25%. Ward et al.’s (2002) estimate7 for the United States is 15% by value and 19% by volume. Moreover, they found that in 40% of all food categories, there had been a statistically significant increase in own-labels’ market share in the previous 3 years, and that 25% of categories showed an increase of over 10%. Share of the aggregate market is, however, not the whole story as there are substantial differences amongst retail firms in the shares of products, product groups, and sales that are own-label (Dobson, 1999; Ward et al., 2002). Ward et al. found that some categories of own-label (shortening and oil, pickles and relish) had almost zero mar-ket share in the US, while frozen poultry had the highest (66%).
7 This estimate includes so-called generic brands.
10 The branding behaviour of Danish food industry firms, FØI
Figure 1. National market penetration by own-label brands in selected European countries: 1997
0
5
10
15
20
25
30
35
40
45Be
lgiu
m &
Luxe
mbo
urg
Den
mar
k*
Ger
man
y
Spai
n*
Fran
ce
Italy
*
Net
herla
nds
Aust
ria*
Portu
gal*
Finl
and*
Swed
en*
Uni
ted
King
dom
shar
e of
nat
iona
l ret
ail f
ood
mar
kets
%
Source: Competition Commission (2000) *1995 data Attempts to explain the observed diversity of market share of own-label brands in Europe have focused on elements of strategy (Borghesani et al., 1999), consumer preferences (Allenby et al., 2002), existing practices and overall stage of development of the retail food industry (Galizzi et al., 1997). Sparks (1997) describes a segmented market for own-label brands, ranging from low-priced generics through to high qual-ity premium brands that are frequently packaged and presented in a similar manner to processors’ premium brands. Adherence to any specific segment is likely to influence the position occupied by marketing strategy (for processing and retailing firms) and purchasing (for consumers). The Danish food processing sector is characterised by both strong industrial concen-tration and the dominance of co-operative ownership in several sectors (Baker, 2003). It also has a long history of successful export performance in pork, dairy and fish products. Although featuring few truly global brands, Danish food processors make
The branding behaviour of Danish food industry firms, FØI 11
widespread use of brands in both domestic and export markets (Madsen, 1996; Traill and Meulenberg, 2001). However, little is known about the incidence of various forms of branding behaviour, or association between the behaviour and the form and structure of Danish food industry firms.
Brands and public policy
The public interest interacts with firms’ branding behaviour in two general ways. First, the number and type of food product brands observed in a market may be the outcome of various trends in the food chain that are considered socially undesirable. Second, brands may be interpreted as instruments of market power, bringing about socially undesirable change of other forms. Identification of brand-related problems is a challenge to policymaking institutions more familiar with issues of farm income and consumer protection, than with food in-dustry dynamics and competition. Public sentiment can further complicate the defini-tion of policy problems. One example is the perception that the variety of food avail-able to the Danish consumer is declining over time (addressed by Teknologirådet, 2004), although no empirical studies have been made of trends in numbers of Danish products nor brands on sale. A further challenge is the formulation and implementation of policy to address food industry conduct. Cotterill (1999) reports that U.S. antitrust policy has been brought to bear on the impact of anti-competitive behaviour on consumers, but in general has interpreted brand proliferation as competitive behaviour. Cotterill also proposes that retailers’ own-label brands (which tend to be lower-priced than processors’ brands) offer relief to consumers, although no policy toward own-label brands is recom-mended. Schmalensee (2001) proposes that although retailers’ own-label brands that are essentially copies of processors’ brands may erode prices, they would also reduce incentives for brand introduction. Notably, discussion of these impacts is oriented toward consumers, rather than toward firms in the food marketing chain which can also be affected by retailers’ market power. EU merger and acquisition policy has occasionally required divestiture of brands (see also Schmalensee (2001) on U.S. markets), and EU competition policy has addressed processors’ exclusive purchasing or distribution practices (see Baker, 2003).
12 The branding behaviour of Danish food industry firms, FØI
In summary, there are few established empirical linkages between firms’ conduct, their branding behaviour, and the welfare of other firms in the Danish food industry. This study is an initial attempt to identify those linkages.
1.2. The study
Aims of the study
In what follows, we define branding behaviour as the choices made by firms as to the number of brands to own, the number to introduce in a given period, and the decisions associated with manufacturing retailers’ own-label brands. We use a survey of Dan-ish food industry firms to explain observed differences in branding behaviour in 2002, and changes in that behaviour during a 5-year period 1997-2002. We interpret our re-sults in terms of possible future development paths for the Danish food industry, and food industry policy.
Structure of the report
In the next section we provide an overview of past studies of branding behaviour, and report the results obtained. In section 2 we present our data, and in section 3 our modelling methodology and econometric approach. Section 4 presents results, and section 5 is a discussion of the results in the context of the Danish food industry and public policy, the limitations of the study, and future research into this topic. Annex 1 provides details of the econometric specifications used, and Annex 2 presents details of preliminary steps in the econometric estimation.
1.3. Explanations of firms’ branding behaviour
Schmalensee (2001) proposed a spatial market model in which products occupy fixed “locations”. In this theoretical model, profitability arises from location near to de-mand (population) centers. New products must then seek profitable location niches, given the locations of existing (already located) brands. In his model, firms prefer competing by market segmentation (locating near to their own existing brands) to lo-cating in unprofitable spaces (in amongst other firms’ brands). A segmented market results, restricting entry in the cases of highly concentrated food industries.

The branding behaviour of Danish food industry firms, FØI 13
There is some empirical evidence for a relationship between over-supply of breakfast cereal brands and imperfect competition. Gejdensen and Schumer’s (1995) statement to the U.S. house of representatives states that ready-to-eat breakfast cereals have the highest price-cost margins of any product in the U.S. food industry, and the fourth highest of any U.S. product. Schmalensee (2001) notes that none of the ready-to-eat cereal brands introduced between 1950 and 1972 attained market shares above 3%. Connor (1999) estimates that more than 100 new brands appeared in the period 1989-1998, almost none of which ever showed a profit, and almost all of which were with-drawn from the market within five years or less. He notes that between 6 and 13 firms supplied a total of 1000 ready-to-eat breakfast cereal brands on the U.S. market, making it the 5th most concentrated industrial sector (including all industries) in the U.S. Cotterill (1999) used a spatial market-type model to describe the U.S. market for ready-to-eat breakfast cereal (the product most studied with regard to food industry branding behaviour). He proposes that firms over-supply brands so as to crowd out the product space and minimize the number of profitable locations available to other firms. It is likely that firms with one or more existing brand positions are better placed to over-supply brands: (i) economies of scale are likely to apply to subsequent brand introductions and (ii) profitability of existing brands is raised, even by loss-making brands. Putsis (1997) used scanner data to examine brand proliferation in 135 food products in 1991 and 1992. Using two linear regression models, he found that the number of new brands is positively related to the prices of both national8 processors’ brands and retailers’ own-label brands. Conversely, he found that concentration of brands (meaning a few firms own the majority of brands) leads to lower costs of introduction and, accordingly, lower prices. Ward et al. (2002) found that expansion of retailers’ own-label brands was positively associated with increased prices for processors’ brands, as processors adopted non-price competitive tools (e.g. advertising and pro-motions) and focused on maintaining quality differentials. Ward et al. (2002, in U.S. markets) and Dobson (1999, in several European markets) found that the share of re-tailers’ own-label brands varied significantly amongst commodity groups, and that their shares of the markets exhibited different growth rates.
8 A “national brand” is a brand that dominates or “leads” a national market. Other classifications
might include “global” brands and “local” brands.

14 The branding behaviour of Danish food industry firms, FØI
Connor (1981) examined the connection between product introductions and market structure. He looked at 419 new product introductions during 1977-78 in 102 US food product classes. He explained that product proliferation “fills up adjacent prod-uct space”, as a defensive strategy to maintain market share and to establish a “full line of products”. Using a simple regression model, Connor found that the number of new brands is positively related to industry concentration, and that product prolifera-tion tends to occur in oligopolistic industry sectors featuring differentiated products. He found that firms’ new brand introductions are positively associated with spending on advertising and promotion. Notably, he found that firms’ new brand introductions in a given product group are slightly negatively correlated with firms’ share of retail-ers’ own-label brands in sales for that product group. Zellner (1989) extended Connor’s regression model of new product introduction, us-ing simultaneous equations systems. Zellner also found that the number of brands is positively related to industry concentration. Although he found no influence of firm size on new product introductions, he did find that new product introductions were as-sociated with sales growth. Unlike Connor, Zellner found a negative relationship be-tween product introductions and advertising (a measure of non-price competition). Similar to Putsis, he found a negative relationship between new product introductions and price-cost margins. Zellner found that firms’ number of new brands is positively correlated with their number of existing brands. Retailers’ own-label brand share of sales has a negative (although insignificant at 10% level of test) effect on introduction, which is inversely related to the degree of standardization (by regulation). Zellner concluded that firms treat introduction of new brands as a substitute for intense advertising, and that al-though they are costly to launch, new brands are more profitable than intense adver-tising of existing ones. “Portfolio” strategies involving frequency of introduction, relationships between brands and advertising and promotion have been described for the ready-to-eat break-fast cereals market by Gejdenson and Schumer (1999) and Cotterill (1999). Zellner (1989) interpreted new product introduction as a quasi-permanent entry barrier, with long-run cost advantages over advertising and other competitive tools. Mills (1999) explains processors’ portfolio mix of their brands and retailers’ own-label brands as a counter-strategy against retailers. He suggests that their intention is to divert dis-placement by retailers’ brands to other processors’ brands (the “fighting brands” the-ory). Mills’ analytic framework includes 2 firms in a vertical relationship: one proc-
The branding behaviour of Danish food industry firms, FØI 15
essor selling a high quality (perhaps “national”, after Putsis) brand and one retailer producing own-label brands. Traill and Meulenberg (2002) also bring together portfolio ideas and overall firm strategy. Building on a survey of European firms (Traill, 2000), and case studies of 12 firms, their central argument is that firms behave differently based on their “domi-nant orientation”: toward one of “product”, “process” and “market”. Traill’s survey data recorded characteristics of firms, including their size, branding behaviour (par-ticularly choices between processors’ or retailers’ own-label products), ownership type (public, private, co-operative), as well as the size and nature of the market served. Traill and Meulenberg (2002) found that processing firms with a high reliance (>50%) on retailers’ own-label brands emphasise both new product development and process innovation. They found that co-operative-owned firms have fewer new prod-uct introductions than firms with other forms of ownership, but are perhaps more pro-cess innovative than other firms. They found some support for the argument that private companies are more product-oriented than public companies. Interestingly, they found no relationship between firms’ sizes and their form and extent of innova-tion. However, the larger and more heterogeneous is the market served, the more in-novative (in product and process) is the firm. In the absence of other data, these au-thors used export intensity (>50% being defined as “high”) as a measure of market size and heterogeneity. Authors have been able to explain several measures of firms’ branding behaviour with variables describing the structure and conduct of those firms. They have also consis-tently identified relationships amongst variables describing branding behaviour. In the next section we use these results to develop hypotheses, and apply them to our data.

16 The branding behaviour of Danish food industry firms, FØI
The branding behaviour of Danish food industry firms, FØI 17
2. Model and data
2.1. Measurement issues
Measurement of branding behaviour
Ideal measures of firms’ branding behaviour would include strategic and management information regarding the positioning, grouping, sales, purchase and valuation of brands. Brand-related data (e.g. advertising and promotion) are also desirable, and have been used in several of the studies described above. Standardisation of such in-formation across a sample of firms places one constraint on its inclusion in this study, but in any case its collection is precluded by confidentiality. Detailed firm-level data (e.g. management effort, advertising, research and development) is unlikely to be col-lected in a mail survey. We compromise between ideal measures and those that are both meaningful, and likely to be willingly provided by firms. We measure individual firms’ branding be-haviour by numbers of brands owned (a stock variable), numbers of new brands in-troduced annually (a flow variable) and the % of sales occupied by retailers’ own-label brands (a stock variable). We also measure changes in the values taken by these variables, generating more flow variables.
Measurement of firms’ characteristics
From the available literature we note the recurrence of several variables thought to be influential in explaining a firm’s branding behaviour. These include the firm’s size, and commodity sector specialisation, and the degree of competitiveness of industry segments or markets served. We measure and apply each of these variables for each firm, as well as firms’ degree of vertical integration, orientation and performance in international trade, stage of the marketing chain, and others. Several previous studies have used firm-level data on price-cost margins and profitability. As noted above, such variables are subject to measurement and collection difficulties. Although our focus is on firms’ characteristics, rather than performance, we use a derived measure of value-added.
18 The branding behaviour of Danish food industry firms, FØI
We also propose that firms’ branding behaviour is associated with their attitudes to the food industry’s commercial and policy environment. Firms’ definition of specific aspects of the food marketing chain as problems is likely to be associated with par-ticular aspects of their branding behaviour. These include firms’ views on the market share held by retailers’ own-label brands, the extent of market power at processing and retail stages of the food marketing chain, and the proposition that the Danish food marketing chain “produces too few new products”.
2.2. Data
Survey
A survey of Danish food industry firms was conducted between November 2003 and February 2004.9 A sample of 940 Danish food processing and distribution firms was assembled, which after rejections for duplication, industry exit and merger yielded 700 firms. These were all contacted by telephone and invited to participate in the survey. A second telephone call was used to remind participating firms, and eventu-ally 109 completed questionnaires were received (a 16% response rate). Of the re-spondents, 69 were food processors, 29 were food distributors, 9 were input suppliers and 4 were other actors in the food marketing chain. The relevant Danish populations are believed to be about 350 food processors,10 and about 600 food distributors and input suppliers (Baker, 2003). The survey questionnaire featured questions on basic information on firms’ size, structure and functions, sought firms’ views on food industry problems and opportunities, and their estimates of the form of financial impacts of food-related policies in 30 specified regulatory areas.11 The current study utilises the descriptive data from the first part of the questionnaire (see figure 2), and isolated questions from the policy-related sections of the questionnaire.12
9 A full description of the survey and listing of its raw results are available in Baker et al. (2004). 10 Excluding a large number of small bakeries and patisseries. 11 The list of regulatory areas was compiled from a review of the legal basis of Danish food industry
policy by Hamann and Baker (2004). 12 A copy of the questionnaire and associated publications are available at www.dfk.foi.dk and from
the authors.

The branding behaviour of Danish food industry firms, FØI 19
Figure 2. Survey questionnaire: background information on the firm Konservesfabrikken Peach A/S (example) Ferskenstræde 10 (example) 9999 Bogenstrup (example) Att. Direktør Jens Jensen (example)
1 Position held by person filling out the questionnaire 2 Firm’s commodity specialisation 2002 ...... 3 1997 (i.e. 5 years ago) ..... 4 Firm’s main activity 2002 ...... 5 1997 (i.e. 5 years ago) ..... Main products and services (ranked by value of sales in 2002 6 Name of product or service highest sales (by value) 7 Name of product or service with 2nd highest sales (by value) 8 Name of product or service with 3rd highest sales (by value) Size of the firm (2002) 9 No. of employees (full time equivalent) 10 Annual sales (DKK) of which 11 food products (%) 12 food industry services (%) 13 other (%) Vertical integration (2002) 14 % ownership of firm by food processing firms 15 % ownership of firm by food retailing firms 16 % ownership of firm by farmers or farm co-operatives 17 % ownership of firm by firms outside the food industry Foreign operations (2002) 18 What % of value of purchases of agricultural raw materials are imported? 19 What % of value of sales are exported Number of business units OWNED BY the firm (2002) 20 number of units owned, that supply agricultural inputs and raw materials 21 number of units owned, that process or manufacture food products 22 number of warehouses, storage, wholesale and distribution units owned 23 number of retail shops owned 24 number of restaurants owned 25 number of other units owned (specify...) 26 number of other units owned (specify ...) Branded food products 26E Number of food product brands owned by the firm 2002 ..... 27 1997 (i.e. 5 years ago) ..... 28 Number of new branded food products introduced in one year 2002 ..... 29 1997 (i.e. 5 years ago) ..... 30 What % of value of sales are retailers’ own-brands? 2002 ..... 31 1997 (i.e. 5 years ago) .....
The six questions directed at branding behaviour are those from 26E13 to 31. Firms were asked to report the number of brands they own (in 2002 and in 1997), the num-ber of new branded food products introduced (in 2002 and in 1997) and the share of sales value occupied by retailers’ own-label brands (in 2002 and in 1997). Other sur-
13 The question adopts the name ”26E” as, due to the addition of another question, question number
26 appeared twice.
20 The branding behaviour of Danish food industry firms, FØI
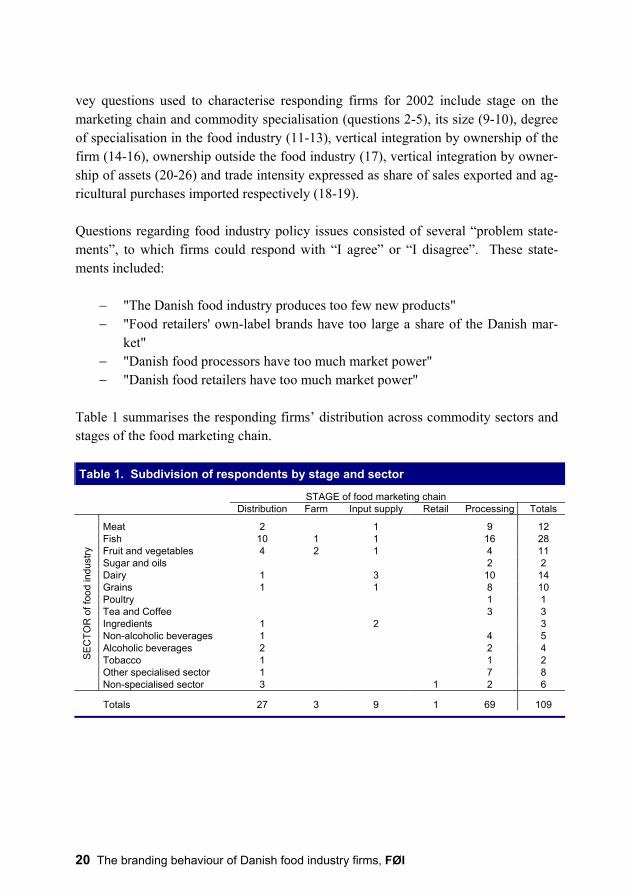
vey questions used to characterise responding firms for 2002 include stage on the marketing chain and commodity specialisation (questions 2-5), its size (9-10), degree of specialisation in the food industry (11-13), vertical integration by ownership of the firm (14-16), ownership outside the food industry (17), vertical integration by owner-ship of assets (20-26) and trade intensity expressed as share of sales exported and ag-ricultural purchases imported respectively (18-19). Questions regarding food industry policy issues consisted of several “problem state-ments”, to which firms could respond with “I agree” or “I disagree”. These state-ments included:
− "The Danish food industry produces too few new products" − "Food retailers' own-label brands have too large a share of the Danish mar-
ket" − "Danish food processors have too much market power" − "Danish food retailers have too much market power"
Table 1 summarises the responding firms’ distribution across commodity sectors and stages of the food marketing chain. Table 1. Subdivision of respondents by stage and sector
STAGE of food marketing chain Distribution Farm Input supply Retail Processing Totals
Meat 2 1 9 12 Fish 10 1 1 16 28 Fruit and vegetables 4 2 1 4 11 Sugar and oils 2 2 Dairy 1 3 10 14 Grains 1 1 8 10 Poultry 1 1 Tea and Coffee 3 3 Ingredients 1 2 3 Non-alcoholic beverages 1 4 5 Alcoholic beverages 2 2 4 Tobacco 1 1 2 Other specialised sector 1 7 8
SEC
TOR
of f
ood
indu
stry
Non-specialised sector 3 1 2 6 Totals 27 3 9 1 69 109

The branding behaviour of Danish food industry firms, FØI 21
Table 2 presents summaries of the values for firms’ characteristics, e.g. firms’ size (question 9 and 10), ownership and vertical integration (14-17 and 20-26), product and trade orientation (11-13 and 18-19), and branding behaviour (26E-31). Table 2. Basic information about responding firms
No. Topic Min. Max. Average Non-
response 9 No. of employees (full time equivalent) 1 2,900 146 0 10 Annual sales (million DKK) 7. 0 4,300.0 342.8 10 11 of which: food products (%) 0% 100% 92% 5 12 food industry services (%) 0% 100% 4% 25 13 other (%) 0% 100% 5% 30 14 % ownership of firm by food processing firms 0% 100% 49% 15 15 % ownership of firm by food retailing firms 0% 100% 2% 25 16 % ownership of firm by farmers or farm co-operatives 0% 100% 11% 23 17 % ownership of firm by firms outside the food industry 0% 100% 37% 20 18 % of value of purchases of agricultural raw materials
that are imported 0% 100% 26% 16
19 % of value of sales that are exported 0% 100% 41% 8
20 number of units owned, that supply agricultural inputs and raw materials 0 13 23
21 number of units owned, that process or manufacture food products 0 6 21
22 number of warehouses, storage, wholesale and distri-bution units owned 0 6 24
23 number of retail shops owned 0 1 27 24 number of restaurants owned 0 0 27 25 number of other establishments owned (specify…) 0 1 31 26 number of other establishments owned (specify…) 0 0 31 26E Number of food product brands owned by the firm 2002 0 200 7 18 27 Number of food product brands owned by the firm 1997 0 150 5 25
28 Number of new branded food products introduced in one year 2002 0 10 0.63 20
29 Number of new branded food products introduced in one. Year 1997 0 25 0.69 32
30 What % of value of sales are retailers' own-brands?
2002 0% 100% 21% 23
31 What % of value of sales are retailers' own-brands? 1997 0% 100% 15% 35
Several variables have been constructed from these responses for the purposes of this analysis. We employ, as a measure of firm size, the number of employees. A proxy measure of value-added is calculated as annual revenue/number of employees. Sev-eral derived measures of vertical integration are used: % ownership by firms from other stages of the food chain is used to measure ownership by retailers, by farmers or farm co-operatives and by food processing firms; a second set of vertical integration measures use the survey responses on asset ownership (questions 20-26), to construct
22 The branding behaviour of Danish food industry firms, FØI
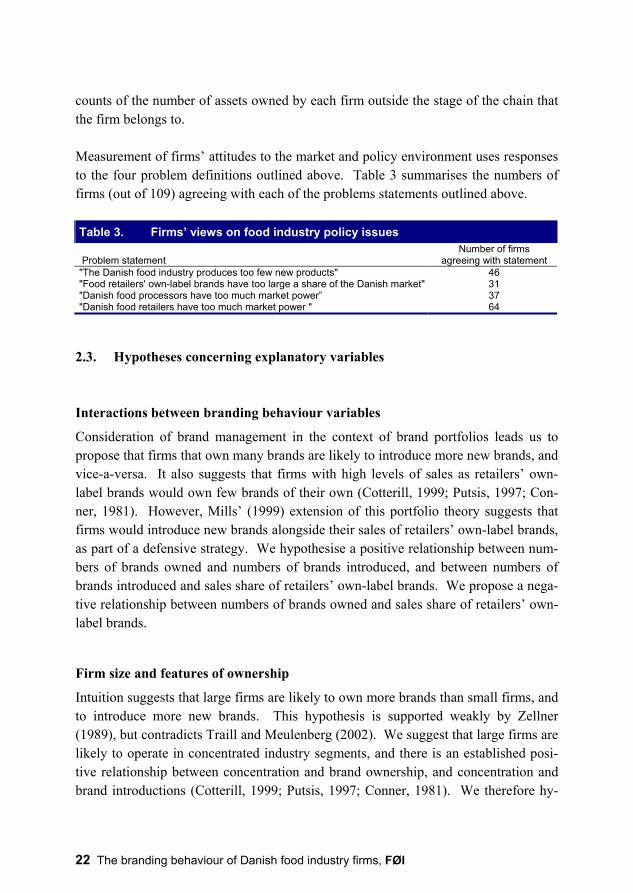
counts of the number of assets owned by each firm outside the stage of the chain that the firm belongs to. Measurement of firms’ attitudes to the market and policy environment uses responses to the four problem definitions outlined above. Table 3 summarises the numbers of firms (out of 109) agreeing with each of the problems statements outlined above. Table 3. Firms’ views on food industry policy issues
Problem statement Number of firms
agreeing with statement "The Danish food industry produces too few new products" 46 "Food retailers' own-label brands have too large a share of the Danish market" 31 "Danish food processors have too much market power” 37 "Danish food retailers have too much market power " 64
2.3. Hypotheses concerning explanatory variables
Interactions between branding behaviour variables
Consideration of brand management in the context of brand portfolios leads us to propose that firms that own many brands are likely to introduce more new brands, and vice-a-versa. It also suggests that firms with high levels of sales as retailers’ own-label brands would own few brands of their own (Cotterill, 1999; Putsis, 1997; Con-ner, 1981). However, Mills’ (1999) extension of this portfolio theory suggests that firms would introduce new brands alongside their sales of retailers’ own-label brands, as part of a defensive strategy. We hypothesise a positive relationship between num-bers of brands owned and numbers of brands introduced, and between numbers of brands introduced and sales share of retailers’ own-label brands. We propose a nega-tive relationship between numbers of brands owned and sales share of retailers’ own-label brands.
Firm size and features of ownership
Intuition suggests that large firms are likely to own more brands than small firms, and to introduce more new brands. This hypothesis is supported weakly by Zellner (1989), but contradicts Traill and Meulenberg (2002). We suggest that large firms are likely to operate in concentrated industry segments, and there is an established posi-tive relationship between concentration and brand ownership, and concentration and brand introductions (Cotterill, 1999; Putsis, 1997; Conner, 1981). We therefore hy-

The branding behaviour of Danish food industry firms, FØI 23
pothesise a (indirect) positive relationship between a firm’s size and the numbers of brands it owns, as well as between the firm’s size and the numbers of new brands that it introduces. No specific relationship is proposed between a firm’s size and the share of its sales that are retailers’ own-label brands. Traill and Meulenberg (2002) suggest that cooperatively-owned firms are oriented toward innovation in “process”, rather than “product”. We interpret this to mean that co-operative ownership bears a negative relationship to numbers of brands owned, and to numbers of new brands introduced. Co-operatives’ farmer-orientation suggests a negative relationship with the share of sales as retailers’ own-label brands. We propose that firms’ ownership from outside the food industry is positively associ-ated with numbers of brands owned, as we expect that investment from outside the food industry would target well-established brands. However, we propose the oppo-site effect on new brand introductions, as non-food firms would generally lack exper-tise in food brand development. We propose a negative relationship between non-food industry ownership of firms and the share of sales as retailers’ own-label brands, because that would be inconsistent with a brand-oriented investment strategy. The connection between vertical integration and branding behaviour has not been ad-dressed in the literature we have reviewed. Two intuitively-appealing hypotheses arise. In one, firms vertically integrate in order to better control quality and informa-tion flows as described by Hennessy (1999). Both quality control and information flows are associated with brand ownership and management. In the second hypothe-sis, vertical integration is an alternative strategy to branding, adopted where brand management has proven difficult due to transactions and other costs (Frank and Hen-derson, 1992). We propose that both positive and negative relationships might exist amongst our sample of firms, as it is drawn from a variety of commodity sectors, so that an estimate’s sign remains indeterminate a priori. We do propose, however, that vertical integration is negatively related to sales share of retailers’ own-label brands. Furthermore, we propose that ownership by a retailer is a special case of vertical inte-gration, and is likely to be positively associated with use of retailers’ own-label brands, but negatively related to brand introduction and brand ownership.
Value added
Intuition suggests that firms with popular brands will be firms that exhibit high value-added, and that retailers’ own-label brands appropriate value-added to the retailer and
24 The branding behaviour of Danish food industry firms, FØI
away from other stages of the food marketing chain. However, if a small proportion of brands are profitable (Cotterill, 1999), then a firms’ value-added may be unrelated to its branding behaviour. We propose that share of sales as retailers’ own-label brands are negatively associated with value-added, but offer no hypothesis about brand ownership and brand introductions.
Trade orientation
The available literature offers little insight into relationships between firms’ interna-tional trade orientation and branding behaviour. Intuitively, importing firms might be viewed as traders, and be expected to own and introduce few brands. However, spe-cialist processors may rely on specific imported raw materials (e.g. durum wheat, to-bacco) for their branded products. We offer no hypotheses a priori about the rela-tionship between firms’ imported shares of raw material purchases and brand intro-ductions, but we propose that import-oriented firms would own few brands (a nega-tive relationship). No hypotheses are offered regarding relationships between trade orientation and use of retailers’ own-label brands. Exporting firms might be expected to introduce few new brands, as they serve spe-cific foreign markets that are likely to be demanding of consistent supply and quality, rather than product innovation and brand proliferation. Because export sales might normally be associated with low levels of market power (at least on the foreign mar-kets served), the results of Conner (1981), Cotterill (1999), Putsis (1997) and Zellner (1989) would suggest a negative relationship between the share of sales as exports and both brand ownership and brand introduction. Traill and Meulenberg (2001) con-clude the opposite: that firms serving diverse markets (they use export intensity as a proxy measure) tend to produce many new brands.
Commodity sector
We propose that firms in different commodity sectors will exhibit different branding behaviour. Casual observation of retail fresh fish, meat and vegetables sales in Den-mark suggests that these products are usually sold unbranded. However, the opposite statement applies to dairy. Accordingly, we propose a negative relationship between firms’ brand ownership and membership of fish, meat and fruits and vegetables’ sec-tors, and a positive relationship for dairy. We recognise potentially-conflicting hy-potheses due to interactions with a number of other variables (e.g. vertical integration, use of retailers’ own-label brands, and co-operative ownership), and so maintain these
The branding behaviour of Danish food industry firms, FØI 25
variables in the regressions described below. Sectors with low brand ownership (we propose meat, for example) would also be expected to feature low levels of brand in-troduction. Our hypothesis is that one or more commodity sectors will show a sig-nificant association with share of sales as retailers’ own-label brand.
Stage of the food marketing chain
No publicly-available research has examined the distribution of brand ownership and introduction within the food marketing chain, beyond cataloguing rises in prevalence of retailers’ own-label brands. Intuitively, we expect a positive relationship between numbers of brands owned and membership of the processing stage. Casual observa-tion suggests that large and diversified food distributors also own large numbers of brands, so we offer these two hypotheses. We also expect food processors, as op-posed to firms from other stages, to exhibit high levels of sales as retailers’ own-label brands. We propose that food distributors would be by-passed by retailers in securing supplies of own-label brands, so yielding a negative relationship.
Firms’ views on food chain organisation and competitiveness
We recognise that relationships between firms’ branding behaviour and their views on issues of food industry policy are likely to be complex. Two conflicting hypotheses are apparent: first, that a firm’s expression of a particular view is associated with that firm’s failure to overcome a particular problem; and second, that the view is ex-pressed despite success in overcoming it, possibly at a disappointing level of profit-ability that is associated with a specific branding strategy. As an example, firms with the view that retailers’ own-label brands’ market share is “too large” may either have failed to introduce or sustain their competing brands, or alternatively may have seen their brands maintained but at a lower level of profitability. Similar examples might be constructed for firms’ statements about market power by processors and retailers, and about the overall number of new food products being introduced to the Danish market. Despite the lack of clear hypotheses with regard to firms’ definitions of food industry problems, we maintain these variables in the analysis to provide insight into the definition of such problems. Its association with specific aspects of branding be-haviour has important policy implications.

26 The branding behaviour of Danish food industry firms, FØI
The branding behaviour of Danish food industry firms, FØI 27
3. Empirical model
3.1. Model approach
We propose six models of branding behaviour: one for each of six defined measures of branding behaviour that constitute the models’ dependent variables (questions 26E-31 in the questionnaire). We employ a variety of estimation approaches that reflect data considerations, specifically the form and distribution of dependent variables. We draw inference from model parameter estimates, and also from observed consistency and contradiction between models.
3.2. Specification
Annex 1 provides a technical discussion of steps taken in model specification.
Data
Owing to the large number of missing values in the data set, we adopt Griliches’ (1986) procedure to compensate by generating artificial data points based on individ-ual firms’ distributions of explanatory variables. Missing values in the dependent variables are maintained. The various dependent variables (representing branding behaviour) used in the study all feature bounded distributions. The number of brands owned by a firm and the number of brands introduced by the firm in the previous years cannot take negative values (they are so-called count data), and the share of firm revenue sold as retailers' own-label brands can only take values between 0 and 1 (0-100%, so-called fractional data). This introduces difficulties for specification of models relating branding behaviour to firms’ characteristics, because parameters estimated by Ordinary Least Squares (OLS) may imply predicted values that lie outside feasible limits for branding behaviour (e.g. negative numbers of brands owned or retailers’ own-label brands making up >100% of sales. Alternative model specifications are therefore explored.
Models of current branding behaviour
We may ensure non-negativity of predictions of number of brands owned and the number of new brands introduced in a number of ways. One solution is to run a sim-

28 The branding behaviour of Danish food industry firms, FØI
ple OLS regression on a logarithmic transformation of the dependent variable. How-ever, this approach is not viable because a non-trivial fraction of the observations are zeroes. Instead, a non-linear specification, the Poisson model, is chosen. The Poisson specification is well suited for count data models, and it has some desirable proper-ties, including consistency and ease of implementation. With respect to the share of retailers' own brands in sales, a specific logarithmic trans-formation of the dependent variable (the so-called log-odds ratio – see Papke and Wooldridge, 1996) may lend itself to linear OLS regression. However, as before, this would preclude a significant number of observations lying on the boundaries (i.e. tak-ing values of 0 or 1). Another non-linear specification, the logistic model, is em-ployed instead. It is generally preferred to alternative functional forms defined over the [0;1] interval because it is relatively easy to implement. The two specifications are described in more detail in Annex 1.
Change in branding behaviour
The models explaining the change in branding behaviour also feature bounded de-pendent variables. However, the bounds are more complex and different specifica-tions are needed. The change in the number of brands owned and the change in the number of new brands introduced may take both negative and positive values. While the variables are unbounded from above, there is a lower bound defined as the nega-tive of the 1997-values. For instance, a firm may reduce the number of brands owned, but not by more than the number of brands in stock in 1997. The lower bound on the dependent variables is in itself a variable and no simple specification can accommo-date this. We therefore use a simple linear OLS regression, recognising that parameter estimates will be constant and predictions may fall outside the permitted range. The change in retail brands' share in sales is similar to fractional data as it is bounded both from above and from below. However, the bounds are different. The maximum possible changes in the retail brands share of sales is from 0 to 1 (0% - 100%) or from 1 to 0 (100% - 0%), yielding a permitted range of [-1;1]. To accommodate this inter-val, we simply scale the dependent variable by adding 1 and dividing by 2. This gives the dependent variable the [0;1] interval of a standard fractional variable, and we can

The branding behaviour of Danish food industry firms, FØI 29
use a logistic specification to derive estimates. For interpretation we rescale the pa-rameter by multiplying by 2.14
3.3. Measure of goodness of fit
The non-linear specifications are estimated using Maximum Likelihood. This method yields more precise estimates than alternative non-linear techniques (such as Non-linear Least Squares – see Annex 1 for a short discussion). However, unlike Least Squares methods, Maximum Likelihood does not produce any measure of the good-ness of fit usable for model comparison. A variety of statistics has been constructed in the literature to provide a usable measure (see e.g. Maddala, 1983). We adopt the very simple pseudo-R2 suggested by MacFadden (1974 - cited in Wooldridge, 2002) given as
2 model
intercept
Pseudo R 1= − where model is the logarithm of the likelihood value of a specification including all explanatory variables and intercept is the logarithm of the likelihood value of the specification including only the intercept.15 The pseudo-R2 takes a value between 0 and 1 and measures the degree, to which the fit of the model is improved by including explanatory variables. However, the measure does not have the exact same interpre-tation as the traditional R2, and conclusions based on these statistics should be drawn with care.
14 We do not subtract the 1. As the parameter estimates are essentially derivatives, any added scaling constant disappears. 15 As the logarithm of likelihood values are always negative, intercept > model , and their ratio is
always between 0 and 1.

30 The branding behaviour of Danish food industry firms, FØI

The branding behaviour of Danish food industry firms, FØI 31
4. Results
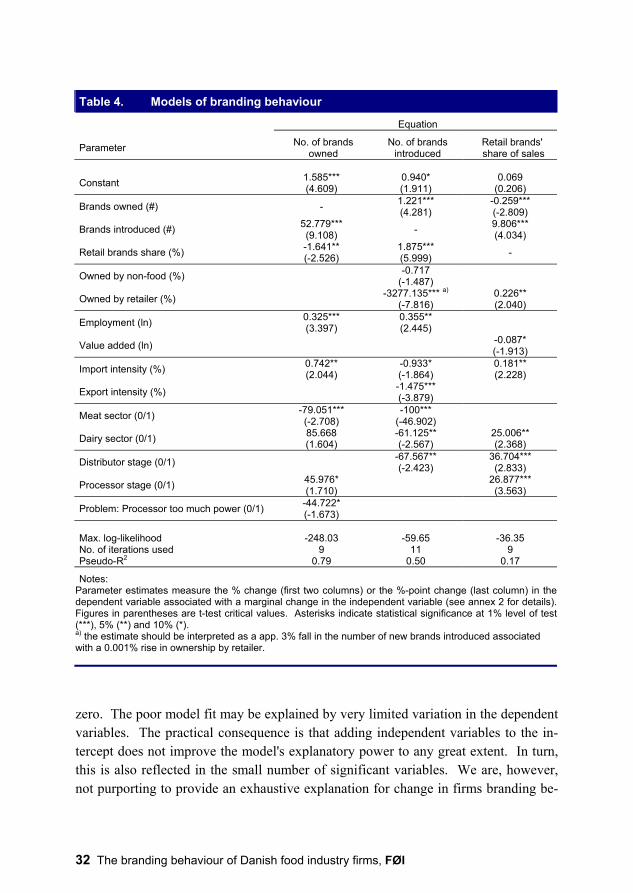
4.1. Estimates of model parameters Estimation of the six models produced a large number of parameter estimates. The raw results are presented in annex 2 (tables A1 on current branding behaviour and A2 on change in branding behaviour). Relatively few of the variables in the models are significant, even at a 10% level of test. One reason for this is the statistical uncer-tainty associated with the large number of variables included in the models. To ob-tain more efficient estimates, a second set of models has been specified, from which insignificant variables have been excluded. Starting from the raw results, this entails a multiple-step procedure (excluding one variable at a time, starting with the most in-significant ones). At each step a hypothesis is tested of joint insignificance of all ex-cluded variables. This proceeds until all insignificant variables are excluded, or the joint-insignificance hypothesis is rejected. The remaining variables are retained in the models, and the resulting parameter estimates are reported in tables 4 and 5. Parameter estimates in tables 4 and 5 have been transformed for ease of interpretation. Interpretation of their signs is, as usual, of positive or negative correlation between the dependent and independent variables. However, interpretations of their magni-tudes require consideration of the nature of each of the dependent and independent variables. The transformations employed, and the interpretation of the parameters, are discussed in Annex 2.
4.2. Model performance
The models explaining current branding behaviour, particularly with respect to the number of brands owned seem to fit the data well.16 We find a reasonable number of significant variables (some of them highly significant) and the estimates generally conform to our hypotheses presented in section 2.3 (discussed in more detail below). The models of the change in branding behaviour are less impressive in terms of good-ness-of-fit. The R2 measures on the two OLS regressions (change in the number brands owned and change in the number of new brands introduced) are low and the pseudo-R2 measure in the model of change in sales share of retail brands is practically
16 Connor (1981) achieves, in a similar regression analysis, R2 = 0.46.
32 The branding behaviour of Danish food industry firms, FØI
Table 4. Models of branding behaviour
Equation Parameter No. of brands
owned No. of brands
introduced Retail brands' share of sales
Constant 1.585*** (4.609)
0.940* (1.911)
0.069 (0.206)
Brands owned (#) - 1.221*** (4.281)
-0.259*** (-2.809)
Brands introduced (#) 52.779*** (9.108) - 9.806***
(4.034)
Retail brands share (%) -1.641** (-2.526)
1.875*** (5.999) -
Owned by non-food (%) -0.717 (-1.487)
Owned by retailer (%) -3277.135*** a)
(-7.816) 0.226** (2.040)
Employment (ln) 0.325*** (3.397)
0.355** (2.445)
Value added (ln) -0.087* (-1.913)
Import intensity (%) 0.742** (2.044)
-0.933* (-1.864)
0.181** (2.228)
Export intensity (%) -1.475*** (-3.879)
Meat sector (0/1) -79.051*** (-2.708)
-100*** (-46.902)
Dairy sector (0/1) 85.668 (1.604)
-61.125** (-2.567)
25.006** (2.368)
Distributor stage (0/1) -67.567** (-2.423)
36.704*** (2.833)
Processor stage (0/1) 45.976* (1.710) 26.877***
(3.563)
Problem: Processor too much power (0/1) -44.722* (-1.673)
Max. log-likelihood -248.03 -59.65 -36.35 No. of iterations used 9 11 9 Pseudo-R2 0.79 0.50 0.17
Notes:
Parameter estimates measure the % change (first two columns) or the %-point change (last column) in the dependent variable associated with a marginal change in the independent variable (see annex 2 for details). Figures in parentheses are t-test critical values. Asterisks indicate statistical significance at 1% level of test (***), 5% (**) and 10% (*). a) the estimate should be interpreted as a app. 3% fall in the number of new brands introduced associated with a 0.001% rise in ownership by retailer.
zero. The poor model fit may be explained by very limited variation in the dependent variables. The practical consequence is that adding independent variables to the in-tercept does not improve the model's explanatory power to any great extent. In turn, this is also reflected in the small number of significant variables. We are, however, not purporting to provide an exhaustive explanation for change in firms branding be-
The branding behaviour of Danish food industry firms, FØI 33
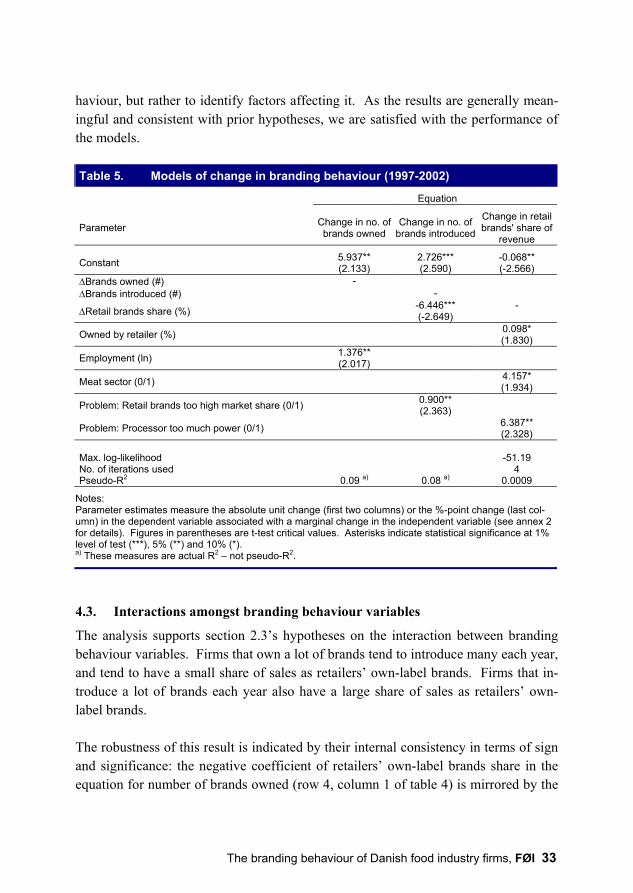
haviour, but rather to identify factors affecting it. As the results are generally mean-ingful and consistent with prior hypotheses, we are satisfied with the performance of the models. Table 5. Models of change in branding behaviour (1997-2002) Equation
Parameter Change in no. of brands owned
Change in no. of brands introduced
Change in retail brands' share of
revenue Constant 5.937**
(2.133) 2.726*** (2.590)
-0.068** (-2.566)
∆Brands owned (#) - ∆Brands introduced (#) -
∆Retail brands share (%) -6.446*** (-2.649)
-
Owned by retailer (%) 0.098* (1.830)
Employment (ln) 1.376** (2.017)
Meat sector (0/1) 4.157* (1.934)
Problem: Retail brands too high market share (0/1) 0.900** (2.363)
Problem: Processor too much power (0/1) 6.387** (2.328)
Max. log-likelihood -51.19 No. of iterations used 4 Pseudo-R2 0.09 a) 0.08 a) 0.0009
Notes: Parameter estimates measure the absolute unit change (first two columns) or the %-point change (last col-umn) in the dependent variable associated with a marginal change in the independent variable (see annex 2 for details). Figures in parentheses are t-test critical values. Asterisks indicate statistical significance at 1% level of test (***), 5% (**) and 10% (*). a) These measures are actual R2 – not pseudo-R2.
4.3. Interactions amongst branding behaviour variables
The analysis supports section 2.3’s hypotheses on the interaction between branding behaviour variables. Firms that own a lot of brands tend to introduce many each year, and tend to have a small share of sales as retailers’ own-label brands. Firms that in-troduce a lot of brands each year also have a large share of sales as retailers’ own-label brands. The robustness of this result is indicated by their internal consistency in terms of sign and significance: the negative coefficient of retailers’ own-label brands share in the equation for number of brands owned (row 4, column 1 of table 4) is mirrored by the
34 The branding behaviour of Danish food industry firms, FØI
negative coefficient for the number of brands owned in the equation for retailers’ own-label brands’ share (row 2, column 3); and the positive coefficient for the num-ber of brands owned in the equation for number of brands introduced is mirrored by the positive coefficient for the number of brands introduced in the equation for the number of brands owned. The magnitudes of the correlations require further comment. Results indicate, for ex-ample, that firms for which retailer's own-label brands account for 1% more of sales than the sample average tend to have 1.64% fewer processors’ brands (row 4, column 1 of table 4) than the average firm in the sample. Those firms have also introduced 1.87% more new brands than the average firm in the survey (row 4, column 2). The interaction between the variables measuring changes in firms’ branding behav-iour is less pronounced (see table 5). The only significant coefficient is a negative correlation between the change in the number of brands introduced and the change in the sales share of retail brands (row 4, column 2). This suggests that firms that have increased their involvement with retailers’ own-label brands tend to reduce their rate of brand introductions over time. In combination with table 4’s result (that firms that introduce a lot of new brands also tend to have a high proportion of sales as retailers‘ own-label brands), this result strongly supports the conjecture by Mills (1998) that the defensive portfolio strategy is not viable in the long run. In particular, the relation-ship between longer-run changes in the two variables will be negatively correlated.
4.4. Firm size and features of ownership
Positive correlations are established between the size of the firm (measured by the number of employees) and the number of brands owned, and the number of new brands introduced. Results indicate that firms with 1% more employees than average own 0.33% more brands (row 7, column 1 of table 4) and introduce 0.35% more new brands (row, column 2). This supports our earlier hypothesis, based on other authors’ previous research findings that numbers of brands owned, and numbers of new brands introduced, are positively correlated with firm size. Because larger Danish firms tend to operate in more concentrated industries, the re-sult also supports our hypothesis that branding is more frequent in such industries. Our results indicate that larger firms are expanding their stock of brands over time faster than the industry average (row 6 of table 5), perhaps reflecting the increasing concentration in the Danish food industry.

The branding behaviour of Danish food industry firms, FØI 35
We identify no significant relationship between firms’ size and their use of retailers’ own-label brands, also supporting our earlier hypothesis. This suggests that both small and large Danish firms are involved with production of retailers’ own-label brands. Contrary to our prior hypotheses, we find that few measures of firm ownership and vertical integration are significant in explaining branding behaviour. We find no in-dication that cooperative ownership, nor ownership by firms outside the food sector, nor measures of upstream and downstream vertical integration have any influence on branding behaviour. The one exception is that a firm’s level of ownership by a retailer is positively corre-lated with sales share of retailers’ own-label brands (row 6, column 3 of table 4) as well as the change in the retailers’ own-label brands’ share (row 5,column 3 of table 5). We find no relationship between retail ownership and number of brands owned by a firm, but our results strongly indicate that firms with a high % ownership by retail-ers are disinclined to introduce new brands (row 6, column 2 of table 4). Examination of the data reveals that all the firms in the survey that are, to any extent, owned by re-tailers did not introduce a single new processors’ brand in 2002. Drawing on our rea-soning developed in section 2.3, this suggests that retailers invest in the food industry to boost production of retailers’ own-label brands, and/or to limit the introduction of (competing) processors’ brands. It would appear that considerations of quality con-trol and information exchange for processors’ brands do not motivate Danish retail-ers’ investments in food processors and distributors.
4.5. Value added
The analyses offer relatively weak evidence to support our hypotheses on the relation-ships between firms’ branding behaviour and their value added. There is no signifi-cant correlation between firms’ number of brands owned and their value added, im-plying that a large brand portfolio may include both successful and unsuccessful brands. Similar arguments can be presented with respect to the number of new brands introduced. We also identify a (albeit barely-significant) negative relationship between value added and the sales share of retailers’ own-label brands. This may indicate that value added by retailers’ own-label brands (as opposed to other forms of brands) may be be-ing transferred along the food marketing chain, and away from the firms that produce
36 The branding behaviour of Danish food industry firms, FØI
the brands. This has important implications in explanations of retailers’ strategies within the Danish food industry, and these are discussed further below.
4.6. Trade orientation
We find that import intensity is a significant variable in all three models of branding behaviour. Compared to the Danish food industry average, we find that firms with a higher than average share of imports in their purchased agricultural raw materials own more brands, introduce fewer new brands, and have a higher share of sales as retail-ers’ own-label brands. This contradicts our earlier hypothesis (that of a negative rela-tionship between import intensity and number of brands owned), and we can offer no robust explanation. This issue is returned to below. Firms’ export intensity (like import intensity) is negatively associated with new brand introductions, and is highly significant. This result supports our hypothesis, as we expected exporting firms to emphasize consistency for existing brands, rather than brand proliferation. However, our results contradict Traill and Meulenberg’s (2001) finding that export-oriented firms serve diverse markets and so proliferate their brands. No relationship is identified between export intensity and sales of retailers’ own-label brands. Despite the substantial share of exports in many Danish firms’ sales, it would appear that foreign retailers are not sourcing own-label brands from Danish firms to any greater extent than do Danish retailers. The positive relationship between firms’ import intensity and sales share of retailers’ own-label brands may indicate that im-porting firms are basing their production of retailers’ own-label brands on imported raw materials.
4.7. Commodity sector
Our results indicate that branding behaviour of food industry firms varies across commodity sectors, as hypothesized in section 2.3. Two sectors (meat and dairy) are found to diverge significantly from the industry average. Firms in the meat sector tend to own very few brands (almost 80% fewer brands than the sample average) and they have introduced even fewer. In fact, no meat sector firm included in the survey introduced any new brands in 2002. Meat sector firms are not significantly more, nor less, inclined to produce retailers’ own-label brands, but from table 5 there is weak
The branding behaviour of Danish food industry firms, FØI 37
evidence to suggest that, over time, meat sector firms are increasing their production of retailers’ own-label brands faster than are firms in other sectors. In contrast, and again in support of our hypotheses, the average number of brands owned by firms in the dairy sector is more than 85% higher than the food sector aver-age (although the t-test value for this parameter is very slightly below the critical level). However, dairy sector firms introduce fewer brands than the industry average, which is contrary to our hypothesis, and also contradicts the general observation that more concentrated industries tend to employ a more aggressive branding strategy. One explanation may be that other variables included in the models (e.g. firm size) better capture the influence of industry concentration: we discuss this further below. We also find that firms in the dairy sector tend to be more heavily engaged in produc-tion of retailers’ own-label brands than is the food industry average. Another expla-nation is that while previous research addressed oligopoly in the food marketing chain, the Danish dairy sector approaches pure monopoly. A monopoly may, in fact, be under no competitive pressure to produce new brands.17 Our hypothesis was that use of retailers’ own-label brands varied across sectors, but we had no a priori conjec-tures as to how specific sectors would behave in this regard. The analysis does not reveal any specific branding behaviour for firms from the fish, and the fruits and vegetables, sectors. Our hypotheses were that these sectors would behave in a somewhat similar way to meat sector firms, based on casual observation of fresh produce on sale. The meat sector’s trade orientation is different to that of fruits and vegetables, and its industrial concentration and the size of its firms are dif-ferent to that of (being far larger than) both sectors. This offers some evidence that the effects of sector specialization on branding behaviour are dominated by other variables.
4.8. Stage of the food marketing chain
Our hypothesis that firms in the processing sector own more brands than other firms in the food industry is supported by the analysis, albeit only at the 10% significance level (row 14, column 1 of table 4). One possible explanation of the weak signifi-cance of this parameter estimate is that distributors also own a large number of brands, and that this raises the average size of brand portfolio for the food industry as
17 This insight provided by Jørgen Dejgård Jensen.
38 The branding behaviour of Danish food industry firms, FØI
a whole.18 However, we also find that firms from the distributor stage have intro-duced significantly fewer more new brands than have firms from the rest of the food industry. Finally, we find that both the distributor and processor stages are producing and/or selling retailers’ own-label brands more intensively than are other stages. This con-tradicts our prior expectation: we hypothesized a negative coefficient for the distribu-tor stage, as retailers could be expected to by-pass distributors and go directly to processors for production of retailers’ own-label brands.
4.9. Firms' views on food chain organisation and competitiveness
Of the four food policy issues deemed relevant, our results indicate that only two are associated with firms' branding behaviour: the issues represented by the statements "Food retailers' own-label brands have too large a share of the Danish market" and "Danish food processors have too much market power". Firms stating that processors have too much market power own fewer brands than the industry average (row 15, column 1 of table 4). The sentiments expressed by those firms could be taken as a measure of frustration over the failure to compete with large processors. Those firms are not currently producing significantly more or less retail-ers’ own-label brands than is the average firm in the sample, but over a five year pe-riod they are increasing their share of retailers’ own-label brands (table 5, row 9, col-umn 3). The analysis does not associate any specific current branding behaviour with firms stating that retailers’ own-label brands have too large a share of the Danish market. However, those firms have increased their numbers of new brand introductions over the last 5 years (see table 5). This branding behaviour could be interpreted as a strat-egy to counter increasing competition from retailers’ own-label brands, as the firms that are proliferating brands are also increasing their sales share of retailers’ own-label brands (see section 4.2 above).
18 The argument is supported by the table A1 in Annex 2 showing parameter estimates of the full
model. The number of brands owned is positively and significantly related to both the processing and distributing stage. However, in the process of eliminating insignificant variables the distribu-tor stage became insignificant and the processor stage less significant.
The branding behaviour of Danish food industry firms, FØI 39
5. Discussion and conclusions
5.1. Overview
In this paper we attempt to explain the branding behaviour of Danish food industry firms by the characteristics of those firms and their views on issues of food industry organisation. We employ survey data from a sample of 109 Danish food industry firms drawn from a variety of commodity sectors and stages of the food marketing chain, and spanning a range of other variables, including brand ownership. We re-view relevant empirical work and relevant characteristics of the Danish food industry to develop hypotheses, which we then test by econometric analysis. We present six models of branding behaviour: the first three to the numbers of brands owned, numbers of new brands introduced and the share of sales that are retailers’ own-label brands in 2002; the second three models examine changes in these three variables between 1997 and 2002 (an arbitrarily-chosen 5-year period). As explana-tory variables, we use firms’ survey responses, or measures derived directly from them. Our model specifications take account of missing values and the characteristics of the dependent variables used. Our estimation procedures employ methods for eliminating insignificant explanatory variables, and we present a set of parameter estimates that are transformed to enhance inference. In general, the models perform well in explaining branding behaviour for Danish food industry firms in 2002. The results generally conform to hypotheses that we devel-oped a priori, based on existing literature and on our understanding of the Danish food industry. The models explaining change in branding behaviour over a 5-year time period perform less well. One explanation is that for those models, the variation in the dependent variables is comparatively low, and this is reflected in measures of overall model fit (R2 and pseudo-R2). The results show strong internal consistency, both within models and between mod-els. Notwithstanding the above comments on the performance of the long term mod-els, their results are consistent with those of the short term models. Taken together, the models enable a clear interpretation with few anomalies.
40 The branding behaviour of Danish food industry firms, FØI
5.2. Key results
Brand ownership
We find that Danish food industry firms that owned a large number of brands in 2002 tend to be large (as measured by numbers of employees), and to be food processors. The firms owning the largest number of brands are associated with the dairy sector, but specifically not with the meat sector. While these results conform to our expecta-tions, we are surprised to find that the firms owning the largest number of brands also tend to import a large share of their agricultural raw materials. This result, for exam-ple, does not apply to the Danish dairy sector. An interesting result is that although the firms owning the most brands tend to be food processors, they also tend to subscribe to the view that “Danish food processors have too much market power”. Change in brand ownership over a 5-year period was more difficult to model and the regression results are rather weaker. However, we do find that larger firms are increasing the number of brands owned faster than are smaller firms. The prominence of firm size in our explanation of branding behaviour supports existing research findings, and in the Danish context is likely to be related to indus-trial concentration. However, the Danish meat sector is highly concentrated but we find that meat sector firms own fewer brands than the industry average introduced few new brands, and are increasing their intensity of use of retailers’ own-label brands.
Number of brands introduced
Firms that introduce a large number of new brands annually also tend to own large numbers of brands. Interestingly, a large proportion of their sales is made up of re-tailers’ own-label brands. Previous research has suggested that food industry firms might react to increasing prominence of retailers’ own-label brands by proliferating their own brands, at least in the short term. However, several researchers agree that this is unlikely to be successful in the long term. Our results support both hypotheses, as our model of 5-year change shows that the firms with the fastest growth rate in brand introductions have either reduced their sales’ share of retailers’ own-label brands or increased them by less than have other firms. If such a “fighting brands” strategy is pursued by firms in Denmark, it appears that they abandon it again within 5 years.
The branding behaviour of Danish food industry firms, FØI 41
Firms that introduce a large number of new brands feature low % ownership by either retailers or firms from outside the food industry, and they tend to be large firms. This was one of the few results in our analysis associating vertical integration with brand-ing behaviour. As in the case of the number of brands owned, we expect that industry concentration would also be a significant factor influencing brand introductions, and we identify this indirectly with the firm size variable. Certainly, the effect is not cap-tured by firms’ sector orientation: only the meat and dairy sectors show significant re-lationships with new brand introductions, and these are both negative. Neither is it captured by stage of the food marketing chain, as distribution is the only stage that demonstrates reduced new brand introductions despite being highly concentrated. We identify a negative relationship between trade intensity (both import- and export-oriented) and brand introductions. This may indicate that firms that are more focused on the Danish market, and that have stronger links to suppliers of Danish raw materi-als, are more aggressive in brand introductions. We find that firms that express the view that retailers’ own-label brands have “too high” a share of the Danish market have accelerated their brand introductions over a 5-year period. Notwithstanding earlier comments on the ambiguity of the motivation of firms for making this statement, we infer that brand introductions and increasing market share of retailers’ own-label are a site of conflict in the Danish food industry.
Share of sales as retailers’ own-label brands
Firms that feature retailers’ own-label brands as a large share of sales tend to also in-troduce many new brands in the short term, but (as discussed above) reduce brand in-troductions in the long term. Use of retailers’ own-label brands is positively corre-lated with ownership by retail firms, which indicates that Danish retailers’ investment in firms at other stages of the food chain involves generating own-label brands from those firms. Moreover, the longer term model indicates that firms with high levels of ownership by retailers are increasing their sales’ shares of retailers’ own-label brands more quickly that the industry as a whole. These results argue against a possible al-ternative strategy: that retailers’ investments at other stages of the food chain are an alternative to use of own-label branding, possibly associated with control of quality and enhanced information exchange. We find that firms with high sales’ share of retailers’ own-label brands tend to have low value added. This suggests that the value added generated by retailers’ own-label
42 The branding behaviour of Danish food industry firms, FØI
brands may be shifted “along” the food marketing chain, away from the firms that produce them. Retailers may capture this value added, at the expense of other firms in the food marketing chain. The dairy sector is the only sector that is statistically associated with high levels of sales’ share of retailers’ own-label brands. The model of longer term adjustment re-veals that the meat sector is increasing its sales’ share of retailers’ own-label brands faster than is the food industry as a whole. We also note that both distributors and processors feature higher levels of use of retailers’ own-label brands than does the in-dustry average. However, we identify no relationship between firms’ sizes and their use of own-label: Danish small firms appear not to be affected any more than are Danish large firms. Import intensity is positively associated with use of retailers’ own-label brands. It is possible that Danish firms are importing the raw materials to produce own-label brands, but little evidence exists to support such a proposition. Another explanation is that firms that are based on (perhaps historically) importing and reselling products have used retailers’ own-label brands as a means of entering the food processing in-dustry as part of a diversification strategy. Some indirect evidence for this explana-tion is that firms that are increasing the intensity of their use of retailers’ own-label brands tend to hold the view that “Danish food processors have too much market power”. Such a view might be typical of new entrants, particularly those restricted to a low value added end of the market (such as retailers’ own-label brands).
5.3. Implications for the Danish food industry
Sources of new brands
Our results indicate that sustained new brand introduction is likely to emerge from parts of the Danish food industry featuring large firms operating in concentrated in-dustry sectors, and from firms that already own large numbers of brands. However, we cannot associate this behaviour with individual sectors: the two most concentrated sectors, featuring the largest firms, (meat and dairy) are not currently active in intro-ducing new brands despite (in the case of dairy) currently owning the most brands. The fish, and fruit and vegetable, sectors are not heavily branded and appear to not be changing that behaviour in any consistent way.
The branding behaviour of Danish food industry firms, FØI 43
The firms that are highly trade-oriented (toward export and/or import) introduce few new brands, leading us to the conclusion that new Danish brands may be targeted at the domestic market in the future, and so may feature elements of service and local custom. Notably, retailers are best-placed to deliver such brands as they focus on convenience and the retention of repeat customers. The firms likely to generate new brands are not, however, owned by food retailers, nor by firms outside the food industry. Our analysis was not able to identify any posi-tive or negative role for the vertical integration and/or co-operative ownership that is so widespread in the Danish food industry. Whatever the impacts of those features may be, they appear not to be associated with branding behaviour.
The role of retail firms
Aspects of the role of retail firms in the Danish food industry are evidenced through changes in food industry branding behaviour. Retail ownership of food industry firms (expressed as % ownership) is associated with their reduced new brand introductions and an increase in their share of sales occupied by retailers’ own-label brands. There is also evidence that retailers may be able to extract value added from their own-label brands at the expense of the rest of the food chain. Taken together, this indicates that retailers’ investment strategy in the Danish food industry focuses on own-label brands and is not associated with generation of new processor brands. Indeed, those firms that are most active in introducing new processor brands are the ones that believe that retailers’ own-label brands “have too high a share of the Danish retail food market”.
Retailers’ own-label brands
Future increases in firms’ sales’ share of retailers’ own-label brands are likely to be associated with reductions in the numbers of brands owned by those firms. This dis-placement is probably a long term process, affecting firms’ short term new brand in-troductions in ways that are difficult to predict, but eventually reducing them. Retailers’ own-label brands may well be a means for retailers to extract value added from the food marketing chain, at the same time as they may provide a means for new entrants to become established in food processing in Denmark. If these two forces are working together, then the traditional Danish food industry firms will be squeezed be-tween losses of market share for their brands and reduced opportunities for production of retailers’ own-label brands. As a logical extension of these arguments, local or
44 The branding behaviour of Danish food industry firms, FØI
low-volume brands, that offer few economies of scale in processing, are likely to be abandoned by the rapidly-consolidating food processing firms in Denmark and those from abroad. This development has been widely anticipated by researchers in many countries, but our findings may be the first empirical evidence of such a trend. The traditional strengths of Danish food processing firms (export orientation, vertical integration, industry concentration) are not necessarily a strong basis for continued success in a brand-dominated food industry. Rather, it appears to be retail firms that are best-placed for the future, and their gains may well be at the expense of firms at other stages of the food marketing chain in Denmark.
5.4. Policy implications
Branding behaviour as a cause and an outcome
We have identified linkages between food industry structure and conduct, and firms’ observed branding behaviour. However, we have not identified strong associations between firms’ views on the competitiveness and organisation of the Danish food marketing chain and branding behaviour. This may be because of ambiguity in our survey questions on those topics, or because of difficulties in interpreting firms’ re-sponses. Our sample of firms is also dominated by food processors, a bias that per-haps overrides firms’ characteristics such as size, sector or ownership form. We identify several interesting aspects of firms’ use (and increasing use) of retailers’ own-label brands. We have been able to identify linkages between that branding be-haviour and retailers’ increasing market power on the Danish market and investment strategy within it. Policy toward firms at the retail stage of the food marketing chain may influence investment and conduct in a variety of ways that will influence brand-ing. First, limits on shop size, location and opening hours are likely to reinforce exist-ing patterns of ownership and location, and deter entry by foreign retailers. Second, these same policies may encourage retail strategies to extract value added from other parts of the food marketing chain.
Government role in branding
Government provision of product or firm certification (e.g. Ø-marque and food safety “smileys”) offers one product differentiation option to firms, but they are designed to
The branding behaviour of Danish food industry firms, FØI 45
accompany and reinforce brand development, rather than encourage it directly. Gov-ernment has few opportunities to intervene in, and encourage, brand ownership or proliferation by food industry firms. If retailers’ own-label brands pose a threat to longevity and development of Danish food processors’ brands, one possible policy response is to apply copyright to branded products. This would target, in particular, retail brands that are very similar in ap-pearance to well-known processors’ brands. However, such a policy would be diffi-cult to design and implement and would reduce price competition.
Firm size and industry concentration
Although firm size and industry concentration are associated with brand ownership and proliferation, these attributes of Danish food industry firms have occurred de-spite, rather than because of, interventions by policy makers. Merger and antitrust law, restrictions on shop sizes and opening hours, and aspects of policies on agricul-tural and rural land use all provide barriers to consolidation. Some Danish food in-dustry policies (food safety, environmental law and labour regulations) are likely to influence firm size and industry concentration by asymmetric imposition of costs, but these effects are indirect and probably small. We have not identified connections be-tween the impact of these policies and branding.
Export promotion
Our identified negative relationship between brand introduction and export intensity has implications for policies promoting exports. In particular, exporting firms may , through less intense branding behaviour, be steadily driven out of their domestic mar-kets. To that extent that their place is taken by firms selling retailers’ own-label brands, then trade promotion may have the perverse effect of helping to extract value added from export-oriented firms and transferring it to retail firms.
Firms’ conduct
If Danish firms’ observed branding behaviour is a consequence of (rather than a cause of) imperfect competition, then policy makers need to target that conduct. This would begin by identifying it and proceed by designing policies to modify it. This research has identified the relationship between retailers’ own-label brands and processors’ brands as a logical starting point. However, we have not identified the mechanisms
46 The branding behaviour of Danish food industry firms, FØI
by which, for example, retail firms might penalise processors’ brands through shelf space allocation, supply chain costs and promotional requirements. While food proc-essors might be expected to lobby policymakers for action in such areas, retail firms can be expected to claim such actions represent cost savings that are passed on to the Danish consumer. It is notable that, in this study, few linkages were identified be-tween firms’ branding behaviour and their views on industry problems.
5.5. Limitations of the research
The research suffers from three survey-related weaknesses. The first is the small sample and the second is the unknown degree to which the sample truly represents the conduct and sentiment of the Danish food industry and the characteristics of the firms within it. The third is firms’ responses are subject to the respondent’s understanding of the question and motivation towards answering it. We have dealt with “no response” answers (in the case of independent variables) by generating synthetic responses based on firms’ other responses. Clearly our conclu-sions could be more strongly stated if more firms had responded to all questions. In addition, several of our explanatory variables (vertical integration, trade intensity and value added) are imperfect measures of the concepts under study. However, our re-sponse rate was achieved in the absence of obtrusive questions that firms might object to answering on grounds of confidentiality. While the analysis would have benefited from more financial data on responding firms, it is likely that this would have exacer-bated the problem of missing values. Collection of financial data would require an al-ternative survey method (either face-to-face interview or access to annual reports), which introduce new problems and research costs. Our econometric models may be criticised due to the indeterminate causality of the relationships we study. In particular, this would refer to the incorporation of firms’ views on policy and industry problems into a study of branding behaviour. Our goal in the analysis is to identify associations between characteristics of the firms and their branding behaviour, and we stop short of proclaiming the direction of causality. While the goodness-of-fit of our models of change in branding behaviour is poor or very poor, we defend their inclusion and presentation. First, the results obtained are consistent with the better-performing models on branding behaviour. Second, the (differenced) data’s patterns of variation are likely to deliver an under-estimate of model performance.
The branding behaviour of Danish food industry firms, FØI 47
5.6. Extensions of the research
The research is suitable for duplication in countries other than Denmark. Much could be gained from identification of food industry firms’ differences and similarities in branding behaviour within and beyond the European Union. Inclusion of performance data on brands (e.g. brand longevity) and firms (e.g. profit-ability, money spent on brand promotion) would enhance the analysis. As discussed above, this would require a new survey methodology. As part of a more intrusive en-quiry, greater understanding would also be gained of the nature of Danish brands. In particular, this would examine the extent to which brands are of a corporate (firm-based), collective (applied to a range of products) or single product type. This would be of particular interest in international comparisons. On-going analysis of the survey data is addressing the problem of indeterminate cau-sality referred to above. In a reverse-causality approach, we seek to explain firms’ stated policy preferences and problem definitions using a range of variables, including branding behaviour. Further details are available from the authors. The mechanisms of interaction between processors’ brands and retailers’ own-label brands deserve more research. The pattern and nature of replacement of one by the other are obviously complex, and likely to vary across many measures of firm type. More particularly, understanding of the commercial and combatative actions of firms within the food marketing chain is likely to add substantially to the understanding gained here.

48 The branding behaviour of Danish food industry firms, FØI

The branding behaviour of Danish food industry firms, FØI 49
References
Allenby, G.M., G. Fennell and S. Yang (2002) “Modeling variation in brand prefer-ence: The roles of objective environment and motivating conditions” Marketing Science 21(1): 14-31
Baker, D., T.V. Jensen, D. Das and T. Dalgaard (2004) “Survey of Danish food indus-try firms’ views on policies that impact the food industry” Danish Institute of Food Economics. Working paper no. 06/2004.
Baker, D. (2003) “The Danish food marketing chain: developments and policy choices” Danish Research Institute of Food Economics. Research report no. 154.
Beierlein, J.G. and M.W Woolverton (1991) Agribusiness Marketing: the manage-ment perspective Prentice-Hall. New Jersey
Borghesani, W., P. de la Cruz and D. Berry (1997) ”The Emergence of power buyer and its challenge to competition analysis” Food for thought US Antitrust Bu-reau.
Brouwer, F. and J. Bijman (2001) Dynamics in crop protection, agriculture and the food chain in Europe Agricultural Economics Research Institute, the Hague, the Netherlands.
Businessweek (2004) “The top 100 brands” 2nd August 2004. Collins, A. (2001) “An investigation into retailers’ margin-related bargaining power”
Department of Food Business and Development, National University of Ireland, Cork. Discussion paper No. 34.
Connor, J.M. (1999) “ Breakfast cereal: The extreme food industry” Agribusiness 15(2): 247-260
Connor, J.M. (1981) “Food product proliferation: a market structure analysis” Ameri-can Journal of Agricultural Economics 63(4): 607-617
Cotterill, R.W. (1999) “High cereal prices and the prospects for relief by expansion of private labels and antitrust enforcement” Agribusiness 15(2): 229-245
Davis, A. and L. Spicer (2004) “An international perspective on brand valuation and management”. Price Waterhouse Coopers.
De Kimpe, M., J. Steenkamp, M. Mellens and P. Van Den Abeele (1997) “Decline and variability in brand loyalty” International Journal of Research in Market-ing, 14(5): 405-420.
Dobson, P. (1999) “Buyer power and its impact on competition in the food retail dis-tribution sector of the European Union” study for the EU-DGIV. no. IV/98/ETD/078.
European Commission (2000) “Commission clears acquisition of Bestfoods by Unilever subject to significant package of divestments” IP/00/1076.
50 The branding behaviour of Danish food industry firms, FØI
Food and Drink (2003) “McVities to Go Ahead! with low-fat relaunch” 3rd September 2003.
Frank, S. and D. Henderson (1992) “Transactions costs and determinants of vertical co-ordination in the U.S: food industries” American Journal of Agricultural Economics 74(4): 941-950.
Galizzi, G., L. Venturini and S. Boccalitti (1997) “Vertical relationships and dual branding strategies in the Italian food Industries” Agribusiness 13(2):185-195.
Gejdenson, S. and C. Schumer (1999) “Consumers in a box: A consumer report on cereal” Agribusiness 15(2): 207-218
Gejdenson, S. and C. Schumer (1995) “Consumers in a box” House of Representa-tives, Washington D.C. 7 March 1995.
Greene, W. H. (1993), Econometric analysis, 3rd ed., Prentiss-Hall.. Griliches, Z. (1986) Economic data issues, in Griliches, Z. and Intriligator, M., eds.,
Handbook of Econometrics, vol. 3, Amsterdam: North Holland Gruen, T., D. Corsten and S. Bharadwaj (2002) “Retail out-of-stocks: A worldwide
examination of extent, causes, and consumer responses” Emory University re-search paper (Draft Version).
Hamann, K. and D. Baker (2004) “Review of policies impacting the Danish food mar-keting chain” Danish Institute of Food Economics, Working Paper no. 07/2004.
Hennessy, D. (1999) “Information asymmetry as a reason for food industry vertical integration” American Journal of Agricultural Economics 78(5):1034-1043.
Hughes, D. (2002) “Grocery retailing in Europe and emerging routes to the con-sumer” Eurochoices 1(3): 12-17.
Kohls, R. and J. Uhl (1990) “Marketing of agricultural products” 7th ed. Macmillan Publishing Company. New York.
McFadden, D.L. (1974) “Conditional Logit Analysis of Qualitative Choice Analysis” in Frontiers of Econometrics (Karlqvist, ed.) New York. Academic Press: 105-142.
Maddala, G.S. (1983) “Limited-dependent and qualitative variables in econometrics” Econometric Society Monographs NO. 3. Cambridge University Press.
Madsen, T.K. The structure and behaviour of some Danish food companies MAPP working paper no. 36 March 1996, project no. 13 .
Meulenberg, M.T.G. and W. B. Traill (2002) “Innovations in the food industry” Agri-business 18(1): 1-22
Mills, D.E. (1999) “Private labels and manufacturer counterstrategies” European Re-view of Agricultural Economics 26(2): 125-145

The branding behaviour of Danish food industry firms, FØI 51
Papke, L. E. and J. M. Wooldridge (1996) “Econometric methods for fractional re-sponse variables with an application to 401 (k) plan participation rates” Journal of Applied Econometrics 11(6): 619-632
Putsis, W.P. (1997) “An empirical study of the effects of brand proliferation on pri-vate labels” Review of Industrial Organization 12: 355-371
Schmalensee, R. (2001) “Entry deterrence in the ready-to-eat breakfast industry” Bell Journal of Economic 9: 305-327.
Sparks, L. (1997) “From Cocoa-Colonization to Copy-Cotting: The Cott Corporation and retailer brand soft drinks in the UK and the US” Agribusiness 13(2):153-168.
Swissinfo (2002) “Swiss icon lands in British hands” 8 October 2002. Teknologirådet (2004) “Fødevareudbuddet I Danmark – myter og facts” BioForum-
konference. 2 June 2004. Traill, W.B. (2000) “Strategic groups of EU food manufactures” Journal of Agricul-
tural Economics 15(1): 45-60 U.K. Competition Commission (2000) “Supermarkets: A report on the supply of gro-
ceries from multiple stores in the United Kingdom” (Report to the Secretary of State for Trade and Industry).
Ward, M.B., J. B. Shimshack, J. M. Perloff, and M. J. Harris (2002) “Effects of the private-label invasion in food industries” American Journal of Agricultural Economics 84(4): 961-973
Wooldridge, J. M. (2002) Econometric Analysis of Cross Section and Panel Data, MIT Press
Zellner, J.A. (1989) “Food industry conduct” American Journal of Agricultural Eco-nomics 71(1): 105-115

52 The branding behaviour of Danish food industry firms, FØI
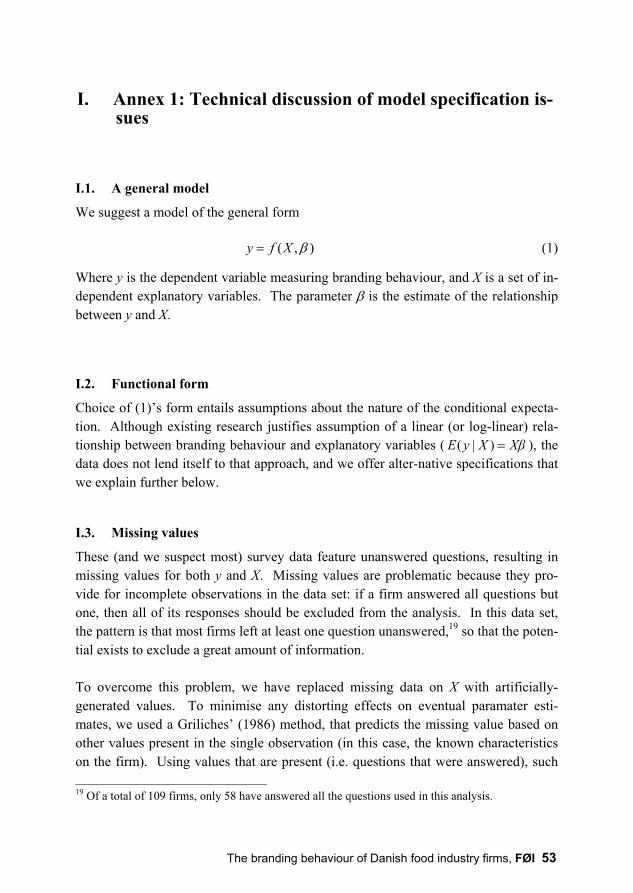
The branding behaviour of Danish food industry firms, FØI 53
I. Annex 1: Technical discussion of model specification is-sues
I.1. A general model
We suggest a model of the general form
( , )β=y f X (1)
Where y is the dependent variable measuring branding behaviour, and X is a set of in-dependent explanatory variables. The parameter β is the estimate of the relationship between y and X.
I.2. Functional form
Choice of (1)’s form entails assumptions about the nature of the conditional expecta-tion. Although existing research justifies assumption of a linear (or log-linear) rela-tionship between branding behaviour and explanatory variables ( ( | ) =E y X Xβ ), the data does not lend itself to that approach, and we offer alter-native specifications that we explain further below.
I.3. Missing values
These (and we suspect most) survey data feature unanswered questions, resulting in missing values for both y and X. Missing values are problematic because they pro-vide for incomplete observations in the data set: if a firm answered all questions but one, then all of its responses should be excluded from the analysis. In this data set, the pattern is that most firms left at least one question unanswered,19 so that the poten-tial exists to exclude a great amount of information. To overcome this problem, we have replaced missing data on X with artificially-generated values. To minimise any distorting effects on eventual paramater esti-mates, we used a Griliches’ (1986) method, that predicts the missing value based on other values present in the single observation (in this case, the known characteristics on the firm). Using values that are present (i.e. questions that were answered), such 19 Of a total of 109 firms, only 58 have answered all the questions used in this analysis.

54 The branding behaviour of Danish food industry firms, FØI
as the number of employees and sectoral characteristics, an auxiliary regression is carried out to determine the correlation between the existing variables and one par-ticular variable containing missing values (e.g. total annual revenue).20 The auxiliary regression is based only on firms that have answered the question on annual revenue, and is used to predict the total annual revenue of firms that did not answer the ques-tion. This procedure is carried out for each of the incomplete variables in turn, start-ing with the ones containing fewest missing values and eventually using the artifi-cially generated values. Only data on explanatory variables X are augmented in this way, and dependent variables’ y data remain depleted by missing values.21
I.4. Bounded values of dependent variables
In the data, variables representing branding behaviour are limited in the values they may take: the number of brands owned by a firm and the number of brands introduced by the firm in the previous year are both bounded from below by zero, i.e. y ∈ [0, ∞], while the share of firm revenue sold as retailers' own-label brands is measured as a percentage, i.e. y ∈ [0, 1]. Estimation with a linear model delivers constant coeffi-cients, which implies that predicted values for branding behaviour could lie outside y’s permitted range: negative numbers of brands introduced and sales shares of retail-ers’ own-brands >100%. One way to impose y ∈ [0, ∞] and/or y ∈ [0, 1] on regression models is to use loga-rithmic forms of y. Unfortunately, this method also precludes y = 0, which applies to a significant number of firms in the data (firms that own no brands and/or have not in-troduced any brands in the previous year), which would be eliminated from a loga-rithmic specification. For this reason we use non-linear modeling techniques, of which two specifications are adopted: the “count data model” for models for which observations on the dependent variable are y ≥ 0, and the “fractional data model” for which 0 ≤ y ≤ 1 (Papke and Wooldridge, 1996; Wooldridge, 2002).
20 The type of regression depends on the nature of the variable to be completed. For instance, for
fractional variables (e.g. the export intensity of the firm), missing values are predicted based on a non-linear fractional data regression as defined above.
21 Little is known about the effects of generating artificial values for dependent variables, but Greene (1993) reports an overall consensus against it.
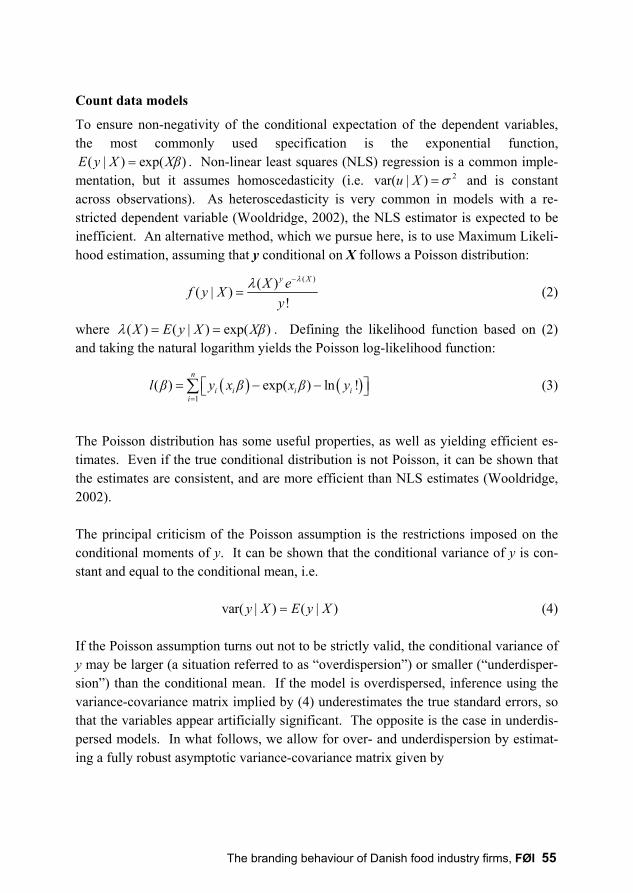
The branding behaviour of Danish food industry firms, FØI 55
Count data models
To ensure non-negativity of the conditional expectation of the dependent variables, the most commonly used specification is the exponential function,
( | ) exp( )=E y X Xβ . Non-linear least squares (NLS) regression is a common imple-mentation, but it assumes homoscedasticity (i.e. 2var( | ) σ=u X and is constant across observations). As heteroscedasticity is very common in models with a re-stricted dependent variable (Wooldridge, 2002), the NLS estimator is expected to be inefficient. An alternative method, which we pursue here, is to use Maximum Likeli-hood estimation, assuming that y conditional on X follows a Poisson distribution: ( )( )( | )
!
λλ −
=y XX ef y Xy
(2) where ( ) ( | ) exp( )λ = =X E y X Xβ . Defining the likelihood function based on (2) and taking the natural logarithm yields the Poisson log-likelihood function:
( ) ( )1
( ) exp( ) ln != = − − ∑
n
i i i ii
l β y x β x β y (3) The Poisson distribution has some useful properties, as well as yielding efficient es-timates. Even if the true conditional distribution is not Poisson, it can be shown that the estimates are consistent, and are more efficient than NLS estimates (Wooldridge, 2002). The principal criticism of the Poisson assumption is the restrictions imposed on the conditional moments of y. It can be shown that the conditional variance of y is con-stant and equal to the conditional mean, i.e.
var( | ) ( | )=y X E y X (4) If the Poisson assumption turns out not to be strictly valid, the conditional variance of y may be larger (a situation referred to as “overdispersion”) or smaller (“underdisper-sion”) than the conditional mean. If the model is overdispersed, inference using the variance-covariance matrix implied by (4) underestimates the true standard errors, so that the variables appear artificially significant. The opposite is the case in underdis-persed models. In what follows, we allow for over- and underdispersion by estimat-ing a fully robust asymptotic variance-covariance matrix given by
56 The branding behaviour of Danish food industry firms, FØI
1 1
1 1 1
ˆ ˆ ˆˆ ˆ ˆvar( )− −
= = =
′= − − ∑ ∑ ∑
n n n
i i i ii i i
β H s s H (5) where ˆ− iH is the negative estimated Hessian22 matrix at observation point i, and is is the estimated score23 vector (gradient) at point i. The square root of the diagonal ele-ments of the covariance matrix (5) constitutes the fully robust standard errors, which can be used to conduct inference using standard t-tests.24
Fractional data model
Fractional variables are bounded both below (by zero) and above (by one), which makes the functional form of ( | )E y X more complex than is the case in count data models. A variety of possible functional forms exist: any cumulative distribution function (cdf) might be used, as they are by definition limited to values on the interval [0,1]. A popular choice, which we pursue here, is the logistic function
exp( )( | )1 exp( )
=+
XβE y XXβ
(6) One of the major advantages of the logistic function is its straightforward derivatives, for ease of interpretation of parameter estimates. While estimation of (6) by NLS is possible, it encounters the same problems as in the count data models. With bounds on the dependent variable the model tends to be heteroscedastic and the estimates are relatively inefficient. In this case, Papke and Wooldridge (1996) recommend Maxi-mum Likelihood estimation using the Bernoulli (or binary) log-likelihood function
( ) ( )1
( ) ln ( | ) (1 ) ln 1 ( | )= = + − − ∑
n
i i i i i ii
l β y E y x y E y x (7)
22 The Hessian is a symmetric k×k matrix (where k is the number of parameters) of second order de-
rivatives of the log-likelihood function with respect to the parameters. 23 The score is the k×1 vector of first order derivatives of the log-likelihood function with respect to
the parameters. See e.g. Wooldridge (2002) for a thorough exposition on Maximum Likelihood theory.
24 Given a number of regularity assumptions (e.g. that ˆ− iH is positive definite) it can be shown that the parameter estimates are asymptotically normal distributed (see e.g. Wooldridge (2002)), and that t-tests are therefore asymptotically valid.

The branding behaviour of Danish food industry firms, FØI 57
The Maximum Likelihood specification in (6) and (7) is easy to estimate, and the pa-rameter estimates have some desirable properties: in addition to being more efficient than the NLS estimates, they are consistent and asymptotically normally distributed even if y conditional on X is not actually Bernoulli-distributed. As in the count data models, the Bernoulli assumption imposes restrictions on the variance-covariance ma-trix that are not necessarily met as the fractional data model is implemented. There-fore, as before, inference will be conducted using the fully robust asymptotic covari-ance matrix in (5).
1.5. Observations on changes in dependent variables
To gain further insight into the relationship ( , )β=y f X , changes in the values of brand-related variables have been used as dependent variables, ∆y = yt – yt-1, where t and t-1 are adjacent time periods. Survey data on all brand-related variables features observations for 2002 (the latest available year) and 1997 (to create a 5-year time dif-ferential. The ∆y variables can adopt negative and zero values, so are unsuited to logarithmic transformations as used above.

58 The branding behaviour of Danish food industry firms, FØI

The branding behaviour of Danish food industry firms, FØI 59
II. Annex 2: Raw results of parameter estimates II.1. Raw parameter estimates
Table A.1. Results of estimating branding behaviour Equation
Parameter No. of brands owned
No. of brands in-troduced
Retail brands' share of revenue
Constant 2.945 (1.188)
5.039 (1.616)
0.652 (0.201)
Brands owned (#) - 0.009*** (3.413)
-0.023*** (-2.928)
Brands introduced (#) 0.508*** (6.256)
- 0.721*** (2.688)
Retail brands share (%) -1.478** (-2.162)
1.660*** (4.625)
-
Owned by coop (%) 0.911** (2.110)
0.645 (0.964)
-1.201 (-1.303)
Owned by non-food (%) 0.233 (0.570)
-0.577 (-1.464)
-0.600 (-1.091)
Owned by retailer (%) -0.173 (-0.282)
-3581.331*** (-8.175)
1.329 (1.209)
Employment (ln) 0.244 (1.554)
0.236* (1.746)
0.140 (0.652)
Value added (ln) -0.301 (-0.967)
-0.549 (-1.415)
-0.594 (-1.585)
Downstream VI (#) 0.051 (0.383)
-0.084 (-0.629)
0.208 (0.791)
Upstream VI (#) -0.086 (-0.574)
-0.103 (-0.586)
-0.098 (-0.493)
Import intensity (%) 1.042*** (2.835)
-0.605 (-1.063)
0.729 (0.901)
Export intensity (%) -0.692 (-1.466)
-0.940** (-2.163)
0.428 (0.489)
Meat sector (0/1) -1.497*** (-2.720)
-20.918*** (-39.914)
-0.460 (-0.407)
Fish sector (0/1) 0.136 (0.304)
-0.889 (-1.569)
-0.181 (-0.194)
Fruit & veg. sector (0/1) -0.496 (-1.049)
-0.946 (-1.412)
-0.125 (-0.152)
Dairy sector (0/1) 0.432 (0.902)
-1.237*** (-2.996)
1.576* (1.923)
Processing stage (0/1) 1.103** (2.108)
0.029 (0.065)
2.752** (2.270)
Distributor stage (0/1) 1.114* (1.822)
-0.740 (-1.152)
3.148** (2.111)
Problem: Retail brands too high market share (0/1) 0.352 (0.896)
0.070 (0.169)
-0.164 (-0.318)
Problem: Too few new products introduced (0/1) 0.213 (0.767)
-0.350 (-1.049)
-0.262 (-0.538)
Problem: Processor too much power (0/1) -0.432 (-1.120)
-0.439 (-1.026)
-0.717 (-1.220)
Problem: Retailers too much power (0/1) -0.333 (-0.844)
0.128 (0.354)
0.074 (0.170)
Max. log-likelihood -226.88 -57.41 -34.93 No. of iterations used 11 29 8 Pseudo-R2 0.81 0.52 0.21
Note: Values in parentheses are t-values for the parameter estimates. The number of aster-isks denote the level of significance: * = 10%; ** = 5%; *** = 1%.
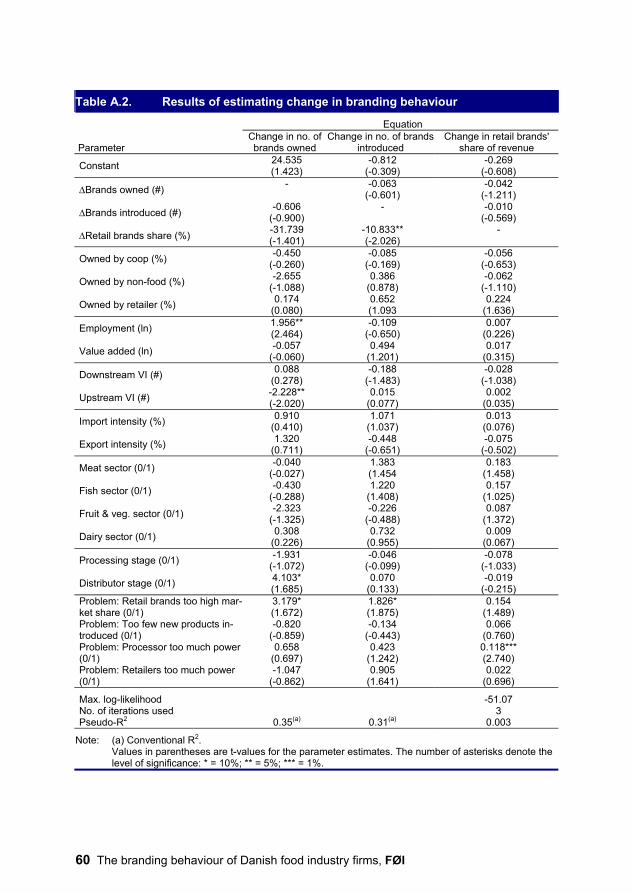
60 The branding behaviour of Danish food industry firms, FØI
Table A.2. Results of estimating change in branding behaviour Equation
Parameter
Change in no. of brands owned
Change in no. of brands introduced
Change in retail brands' share of revenue
Constant 24.535 (1.423)
-0.812 (-0.309)
-0.269 (-0.608)
∆Brands owned (#) - -0.063 (-0.601)
-0.042 (-1.211)
∆Brands introduced (#) -0.606 (-0.900)
- -0.010 (-0.569)
∆Retail brands share (%) -31.739 (-1.401)
-10.833** (-2.026)
-
Owned by coop (%) -0.450 (-0.260)
-0.085 (-0.169)
-0.056 (-0.653)
Owned by non-food (%) -2.655 (-1.088)
0.386 (0.878)
-0.062 (-1.110)
Owned by retailer (%) 0.174 (0.080)
0.652 (1.093
0.224 (1.636)
Employment (ln) 1.956** (2.464)
-0.109 (-0.650)
0.007 (0.226)
Value added (ln) -0.057 (-0.060)
0.494 (1.201)
0.017 (0.315)
Downstream VI (#) 0.088 (0.278)
-0.188 (-1.483)
-0.028 (-1.038)
Upstream VI (#) -2.228** (-2.020)
0.015 (0.077)
0.002 (0.035)
Import intensity (%) 0.910 (0.410)
1.071 (1.037)
0.013 (0.076)
Export intensity (%) 1.320 (0.711)
-0.448 (-0.651)
-0.075 (-0.502)
Meat sector (0/1) -0.040 (-0.027)
1.383 (1.454
0.183 (1.458)
Fish sector (0/1) -0.430 (-0.288)
1.220 (1.408)
0.157 (1.025)
Fruit & veg. sector (0/1) -2.323 (-1.325)
-0.226 (-0.488)
0.087 (1.372)
Dairy sector (0/1) 0.308 (0.226)
0.732 (0.955)
0.009 (0.067)
Processing stage (0/1) -1.931 (-1.072)
-0.046 (-0.099)
-0.078 (-1.033)
Distributor stage (0/1) 4.103* (1.685)
0.070 (0.133)
-0.019 (-0.215)
Problem: Retail brands too high mar-ket share (0/1)
3.179* (1.672)
1.826* (1.875)
0.154 (1.489)
Problem: Too few new products in-troduced (0/1)
-0.820 (-0.859)
-0.134 (-0.443)
0.066 (0.760)
Problem: Processor too much power (0/1)
0.658 (0.697)
0.423 (1.242)
0.118*** (2.740)
Problem: Retailers too much power (0/1)
-1.047 (-0.862)
0.905 (1.641)
0.022 (0.696)
Max. log-likelihood -51.07 No. of iterations used 3 Pseudo-R2 0.35(a) 0.31(a) 0.003
Note: (a) Conventional R2. Values in parentheses are t-values for the parameter estimates. The number of asterisks denote the
level of significance: * = 10%; ** = 5%; *** = 1%.

The branding behaviour of Danish food industry firms, FØI 61
II.2. Parameter transformation and interpretation
Current Branding behaviour
The parameter estimates presented in table 4 have been transformed for ease of inter-pretation. The interpretations are as follows. The models in the first two columns are count data models (as described in annex 1) and the estimated relationship is given by
ˆ( | ) exp( )=E y x xβ . Taking the natural logarithm and differentiating with respect to an explanatory variable, xj, we get:
ln ( | ) β∂=
∂ jj
E y xx
(8) Thus for variables expressed in numbers (#) or fractions (%), the parameter estimate is interpreted as the percentage change in the number of brands as the independent variable increases by one unit or one percentage point respectively. For the variables expressed in logarithms (such as employment or value added), the estimates have the same interpretation as elasticities (% change in the dependent variable in response to 1% change in the independent variable). The parameters for sector and stage in the food chain are calculated differently, as these variables enter the models as dummy variables (taking the value zero or 1). The interpretation is the expected additional number of brands (measured in %) owned by a firm in a particular sector (or stage) compared to the average of firms in other sec-tors (or stages). It is expressed as
( | ; 1) ( | ; 0)( | ; 0)
≠ ≠
≠
= − ==
i d d i d d
i d d
E y x x E y x xE y x x
(9) where xd is the dummy variable in question and xi≠d is every other variable. The last column in table 4 reports the parameter estimates from a fractional data model, given by ˆexp( )( | ) ˆ1 exp( )
=+
xβE y xxβ
(10)
62 The branding behaviour of Danish food industry firms, FØI
Taking the derivative with respect to a variable xj yields
( )2
ˆ( | ) exp( )ˆˆ1 exp( )
β∂=
∂ +j
j
E y x xβx xβ
(11) The parameters are interpreted as the absolute increase in the share of sales of retail-ers' brands (measured in percentage points) as firms have a one unit (or percentage point, or percent depending on the variable) higher value of a particular variable. Again, the sector and stage variables are measured a bit differently, as
( | ; 1) ( | ; 0)≠ ≠= − =i d d i d dE y x x E y x x (12)
The dummy-parameters are interpreted as the greater retail brand intensity (measured in percentage points) in a particular sector (or stage) compared to the average of other sectors (or stages). In general, the difference between the parameters in the first columns and the last two columns of table 4 respectively, is that the count model parameters measure relative changes, while the fractional model parameters are expressed in percentage points.
Change in branding behaviour
The first two columns in table 5 (change in the number of brands owned and change in the number of new brands introduced) contain parameters estimated by simple lin-ear OLS. They have not been transformed, and they should be interpreted as tradi-tional derivatives: the absolute change in the dependent variable in response to change in the independent variable. The last column of table 5 reports parameters estimated by a fractional model. They are transformed in the same way as the estimates in the last column of table 4, and should be interpreted accordingly.