Cumulative Review and 2012 Annual Report of the Administrator Cumulative Review and 2012 Annual...
21
Cumulative Review and 2012 Annual Report of the Administrator Executive Board Informal Discussion Judith Karl – Executive Office / Operations Support Group
-
Upload
hillary-neal -
Category
Documents
-
view
216 -
download
1
Transcript of Cumulative Review and 2012 Annual Report of the Administrator Cumulative Review and 2012 Annual...

Cumulative Review and 2012 Annual Report of the AdministratorExecutive Board Informal Discussion
Judith Karl – Executive Office / Operations Support Group
2009 2010 2011 20122008 2013
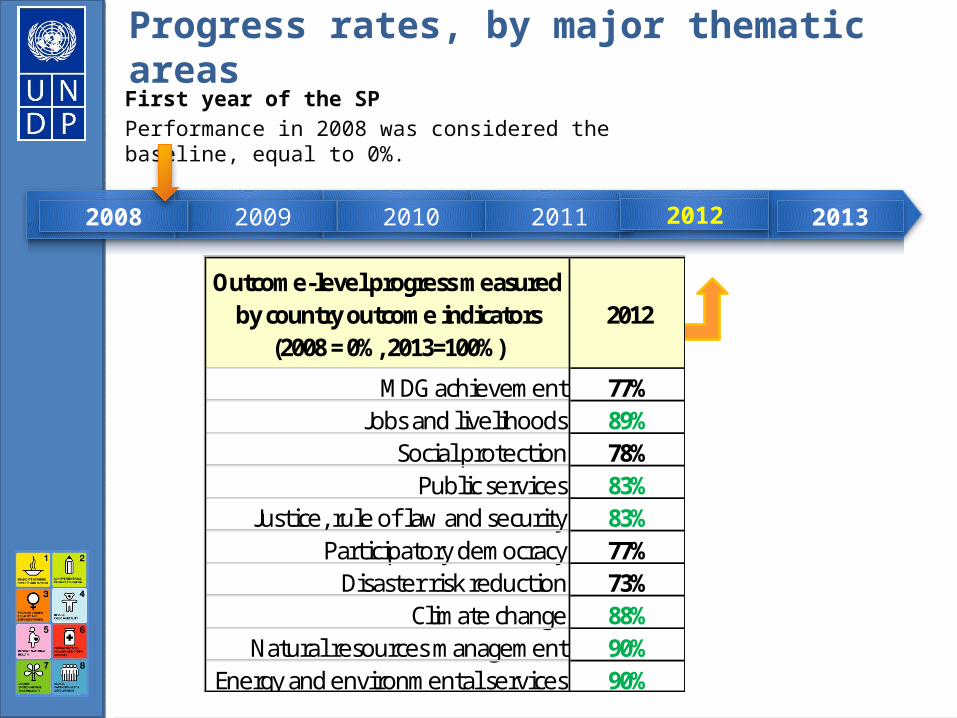
First year of the SPPerformance in 2008 was considered the baseline, equal to 0%.
Progress rates, by major thematic areas
Outcome-level progress measured by country outcome indicators
(2008 = 0%, 2013=100%)2012
MDG achievement 77%Jobs and livelihoods 89%
Social protection 78%Public services 83%
Justice, rule of law and security 83%Participatory democracy 77%
Disaster risk reduction 73%Climate change 88%
Natural resources management 90%Energy and environmental services 90%

Poverty & MDG cumulative results$ = USD 5.89 billion in 146 countries (49 LDC)
Transformational contributions: • Worldwide integration of the MDGs into national
policies, plans, budgets and local initiatives;• Enabling policy environment for livelihoods and
social protection of groups suffering discrimination, exclusion and marginalization; and
• HIV responses integrated across sectors• 15.3 million people:
higher food security• 420,000 hectares of land
recovered for farming• 4.7 million people: jobs
and livelihoods improvements
• 1 million people: anti-retroviral treatment
• 12 million people: HIV counseling and testing
• 250,000 mothers: services to prevent mother-child transmission
• 40 million people: malaria treatments
Diagnostics Plans Budgets Policies Strategies
LIC 63 410 702 142 117 194MIC 59 229 222 88 167 194NCC 14 87 18 1 30 26LDC 44 230 514 100 71 156Africa 45 309 357 127 74 135Asia-Pacific 24 141 438 62 80 75Arab States 18 74 26 1 34 76ECIS 24 93 56 17 72 67LAC 25 109 65 24 54 61
Note: 2011-2012 country outcomes in which UNDP contributed primarily through the "Policy" output dimension.
# countries supported
Total number (2011-2012)
Typology
Region
Poverty and MDGs

MDG Acceleration Frameworks (MAF)
19 African countries

Output indicator 4: "Durability of results" output dimension - Significant measures to develop capacities for institutional arrangements, knowledge
management, leadership and accountability in the poverty & MDGs focus area
Achieved or
positive change
Performance differential
included 150 47% 76%not 172 53% 67%
included 131 41% 79%not 191 59% 65%
included 59 18% 76%not 263 82% 70%
included 21 7% 86%not 301 93% 70%
included 79 25% 82%not 243 75% 67%
included 89 28% 76%not 233 72% 69%
included 62 19% 77%not 260 81% 70%
included 46 14% 87%not 276 86% 68%
included 129 40% 79%not 193 60% 66%
Number of country outcomes in the poverty and MDGs focus area: 322
Civil society has organized to monitor commitments under the issue 7%
A process to foster future leaders on this topic is in place 19%
There is improved access and participation in dialogue and decision-making 13%
Civil servants’ performance appraisal processes include the topic 16%
Resources for the issue are allocated cyclically 15%
Oversight bodies have a mandate to regularly monitor / report on the issue 7%
Government-offered civil service training periodically includes the topic 6%
No. and % of outcomes including / not including
this measure
Specific statistics and/or indicators being collected in national systems 9%
Counterpart-managed knowledge platforms on the topic are strengthened 14%
Ensuring durability of results• Focus on regularly collect[ing] relevant [MDGs, poverty, HIV] statistics, promoting
knowledge management through Communities of Practice and South-South Cooperation, and increase[ing] participation [of excluded groups] in decision processes.
• More to be done to foster future leaders on Poverty & MDGs topics.

• Better evidence base for policymaking: stronger national statistical systems in 41 countries;• 109 HDR, 147 MDG Progress and hundreds of other analytical reports;• MDG awareness campaigns in 164 countries;• MAF in 44 countries (19 in Africa);• Stronger legal and administrative frameworks and policies for employment in 48 countries;• Higher social floors and priority given to excluded, discriminated and marginalized groups in
social protection / social safety schemes in 30 countries;• Stronger planning and financing of multi-sector HIV strategies in 49 countries;• Role as Global Fund Principal Recipient turned over in 14 out of 41 countries;• Improved capacity of national institutions to deliver essential health services in 37 countries;• Scaling up / replication of successful interventions in 80 countries
More inclusive societies
Women YouthEconomically
disadvantaged groups
HIV-affected, persons with
disabilities, other health groups
43 32 25 20Success rate 72% 53% 42% 33%Note: not all groups were targeted in each of the country outcomes
In 2012, out of 60 poverty & MDGs country outcomes in which UNDP aimed to expand the access of specific groups to political process and decision-making…
…of which this group was successfully
included in [number of] outcomes

Democratic Governance cumulative results$ = USD 6.3 billion in 149 countries
Transformational contributions: Increased access to public services by
excluded, discriminated and marginalized groups;
Higher access to justice, particularly for women; and
Increased social participation and representation of women and youth
• 17.3 million additional people participating in elections;• 10,250 institutions strengthened.
Diagnostics Plans Budgets Policies Strategies
LIC 61 362 861 239 314 470MIC 56 549 678 356 274 235NCC 12 45 33 6 40 11LDC 43 165 712 461 140 253Africa 44 209 627 260 116 274Asia-Pacific 21 130 360 266 85 69Arab States 18 133 125 35 76 91ECIS 21 229 221 19 181 251LAC 25 255 239 21 170 31
Note: 2011-2012 country outcomes in which UNDP contributed primarily through the "Policy" output dimension.
# countries supported
Total number (2011-2012)
Typology
Region
Democratic governance

Output indicator 4: "Durability of results" output dimension - Significant measures to develop capacities for institutional arrangements, knowledge management, leadership and accountability in the democratic governance
focus area
Achieved or
positive change
Performance differential
included 112 38% 77%not 182 62% 67%
included 151 51% 80%not 143 49% 61%
included 81 28% 83%not 213 72% 66%
included 159 54% 75%not 135 46% 66%
included 37 13% 84%not 257 87% 69%
included 84 29% 79%not 210 71% 68%
included 93 32% 79%not 201 68% 67%
included 62 21% 77%not 232 79% 69%
included 143 49% 76%not 151 51% 66%
Number of country outcomes in the democratic governance focus area: 294
Civil society has organized to monitor commitments under the issue 12%
A process to foster future leaders on this topic is in place 8%
There is improved access and participation in dialogue and decision-making 10%
There is a government institution with a mandate to address the issue 9%
Civil servants’ performance appraisal processes include the topic 15%
Oversight bodies have a mandate to regularly monitor / report on the issue 11%
Government-offered civil service training periodically includes the topic 17%
No. and % of outcomes including / not including
this measure
Specific statistics and/or indicators being collected in national systems 10%
Counterpart-managed knowledge platforms on the topic are strengthened 19%
Ensuring durability of results• Focus on civil servants’ training and strengthening knowledge platforms [on public
services]; and on foster[ing] future leaders and the capacity of civil society to monitor commitments on elections, parliaments and anti-corruption.
• More to be done on improving civil servants’ appraisal processes.

More participatory and just societies
• Anti-corruption campaigns reaching 375 million people;• 50 referenda and elections, 85% deemed fair and credible;• Stronger budgets for public service delivery in 21 African countries;• HIV-related law reform in 20 countries;• Stronger parliaments in 60 countries;• Stronger national human rights institutions in 70 countries;• Better citizen participation in administrative, policymaking, urban planning and public
service delivery processes in 53 countries;• e-portals and e-services expanded in over 40 countries;• Legal inclusion mechanisms strengthened in 51 countries;• Higher access to justice for women in 14 African countries.
Women YouthEthnic
minorities
Economically disadvantaged
groups
Indigenous peoples
79 60 29 28 19Success rate 69% 52% 25% 24% 17%Note: not all groups were targeted in each of the country outcomes
In 2012, out of 115 democratic governance country outcomes in which UNDP aimed to expand the access of specific groups to political process and decision-making…
…of which this group was successfully
included in [number of] outcomes

Crisis Prevention & Recovery cumulative results$ = USD 4.2 billion in 106 countriesTransformational contributions: • DRR mainstreamed worldwide into national
development policies;• Increased preparedness of vulnerable
communities;• Early recovery fostered by jobs, livelihoods and
infrastructure being available in conflict-affected settings.
• 2 million emergency jobs and livelihoods generated;
• 7.1 million people: benefitting from rehabilitated public infrastructure;
• 87,000 ex-combatants reintegrated;
• Indian Ocean tsunami warning system.
Diagnostics Plans Budgets Policies Strategies
LIC 48 134 317 215 94 61MIC 34 274 299 171 45 6NCC 7 8 27 3 52 0LDC 32 58 79 13 38 22Africa 30 51 246 188 35 24Asia-Pacific 19 51 55 19 51 5Arab States 9 19 9 0 56 19ECIS 12 41 54 11 27 19LAC 19 254 279 171 22 0
Note: 2011-2012 country outcomes in which UNDP contributed primarily through the "Policy" output dimension.
# countries supported
Total number (2011-2012)
Typology
Region
Crisis prevention & recovery

Output indicator 4: "Durability of results" output dimension - Significant measures to develop capacities for institutional arrangements, knowledge
management, leadership and accountability in the crisis prevention and recovery focus area
Achieved or
positive change
Performance differential
included 33 31% 88%not 74 69% 72%
included 56 52% 84%not 51 48% 69%
included 34 32% 85%not 73 68% 73%
included 70 65% 81%not 37 35% 68%
included 6 6% 83%not 101 94% 76%
included 24 22% 88%not 83 78% 74%
included 29 27% 86%not 78 73% 73%
included 23 21% 87%not 84 79% 74%
included 55 51% 82%not 52 49% 71%
Number of country outcomes in the crisis prevention and recovery focus area: 107
Civil society has organized to monitor commitments under the issue 13%
A process to foster future leaders on this topic is in place 13%
There is improved access and participation in dialogue and decision-making 11%
There is a government institution with a mandate to address the issue 13%
Civil servants’ performance appraisal processes include the topic 7%
Oversight bodies have a mandate to regularly monitor / report on the issue 14%
Government-offered civil service training periodically includes the topic 12%
No. and % of outcomes including / not including
this measure
Specific statistics and/or indicators being collected in national systems 16%
Counterpart-managed knowledge platforms on the topic are strengthened 15%
Ensuring durability of results• Focus on ensuring existence of government institution with a mandate to address
relevant issues in justice and security, elections, human rights, and DRM.• More to be done on collect[ing] statistics and strengthening knowledge platforms [to
improve decisions in information-poor environments].

More resilient and peaceful societies
• Disaster risk management policies and planning including measures to reduce future risk in 70 countries;
• Stronger diagnostic capacities to detect disaster hazards and vulnerabilities in 42 countries;
• Peace dialogues carried out in 15 conflict-affected countries;• National SALW policies and control frameworks in 20 countries;• Community security and crisis preparedness assessments in 29 countries;• Stronger and more coherent structures for early recovery response.
Women YouthEconomically
disadvantaged groups
Ethnic minorities
Indigenous peoples
Displaced persons / refugees
27 20 15 12 10 7Success rate 87% 65% 48% 39% 32% 23%Note: not all groups were targeted in each of the country outcomes
In 2012, out of 31 crisis prevention & recovery outcomes in which UNDP aimed to expand the access of specific groups to political process and decision-making…
…of which this group was successfully
included in [number of] outcomes

Environment & Energy cumulative results$ = USD 2.1 billion in 153 countries• 252 million hectares of protected areas better
managed;• 170 million tons of carbon dioxide-equivalent
emissions eliminated;• 335,000 land users adopted sustainable land
management practices;• 3.5 million people: access to energy;• 600,000 people: access to water and sanitation;• 4,962 metric tons of persistent organic
pollutants disposed of or safeguarded;• 195,000 people trained in managing POPs.
Transformational contributions: • Integration of environmental
considerations into national development policies worldwide;
• Increased access to water and energy for poor communities; and
• Improved local-level climate change adaptation.
Diagnostics Plans Budgets Policies Strategies
LIC 53 264 413 19 118 124MIC 59 332 166 44 184 115NCC 14 39 7 0 29 0LDC 36 188 310 13 59 100Africa 40 204 372 11 70 82Asia-Pacific 22 131 70 35 63 115Arab States 15 7 13 0 16 8ECIS 24 206 69 13 114 13LAC 25 87 62 4 68 21
Note: 2011-2012 country outcomes in which UNDP contributed primarily through the "Policy" output dimension.
Environment and energy
# countries supported
Total number (2011-2012)
Typology
Region

Output indicator 4: "Durability of results" output dimension - Significant measures to develop capacities for institutional arrangements, knowledge
management, leadership and accountability in the environment and energy focus area
Achieved or
positive change
Performance differential
included 75 43% 83%not 99 57% 71%
included 103 59% 81%not 71 41% 69%
included 30 17% 80%not 144 83% 75%
included 105 60% 80%not 69 40% 70%
included 12 7% 83%not 162 93% 75%
included 52 30% 83%not 122 70% 73%
included 42 24% 83%not 132 76% 74%
included 31 18% 87%not 143 82% 73%
Oversight bodies have a mandate to regularly monitor / report on the issue 10%
A process to foster future leaders on this topic is in place 14%
Number of country outcomes in the evironment and energy focus area: 174
There is a government institution with a mandate to address the issue 10%
Civil servants’ performance appraisal processes include the topic 8%
Resources for the issue are allocated cyclically 10%
Government-offered civil service training periodically includes the topic 5%
No. and % of outcomes including / not
including this measure
Specific statistics and/or indicators being collected in national systems 12%
Counterpart-managed knowledge platforms on the topic are strengthened 12%
Ensuring durability of results• Focus on ensuring existence of government institution with a mandate to address
relevant issues; and on collect[ing] statistics to allow monitoring of access to water and to energy.
• More to be done on foster[ing] future leaders.
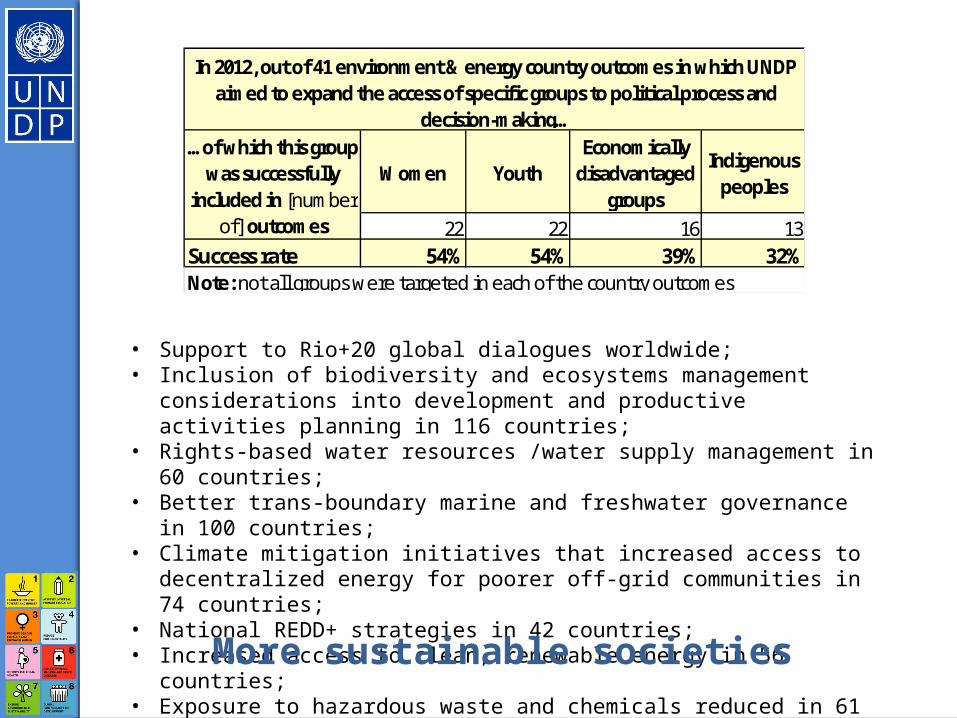
• Support to Rio+20 global dialogues worldwide;• Inclusion of biodiversity and ecosystems management considerations into
development and productive activities planning in 116 countries;• Rights-based water resources /water supply management in 60 countries;• Better trans-boundary marine and freshwater governance in 100 countries;• Climate mitigation initiatives that increased access to decentralized energy for
poorer off-grid communities in 74 countries;• National REDD+ strategies in 42 countries;• Increased access to clean, renewable energy in 56 countries;• Exposure to hazardous waste and chemicals reduced in 61 countries
More sustainable societies
Women YouthEconomically
disadvantaged groups
Indigenous peoples
22 22 16 13Success rate 54% 54% 39% 32%Note: not all groups were targeted in each of the country outcomes
In 2012, out of 41 environment & energy country outcomes in which UNDP aimed to expand the access of specific groups to political process and
decision-making……of which this group
was successfully included in [number
of] outcomes

Development Effectiveness
More focused programmes
Less fragmented interventions

Strides in Gender Mainstreaming

Promoting South-South Cooperation(% country outcomes supported under each category)
Note: based on a random sample of 200 country outcomes that indicated “yes,” South-South Cooperation exchanges had been supported within that outcome.

Promoting South-South Cooperation(% country outcomes supported under each thematic area)
Note: based on a random sample of 200 country outcomes that indicated “yes,” South-South Cooperation exchanges had been supported within that outcome.
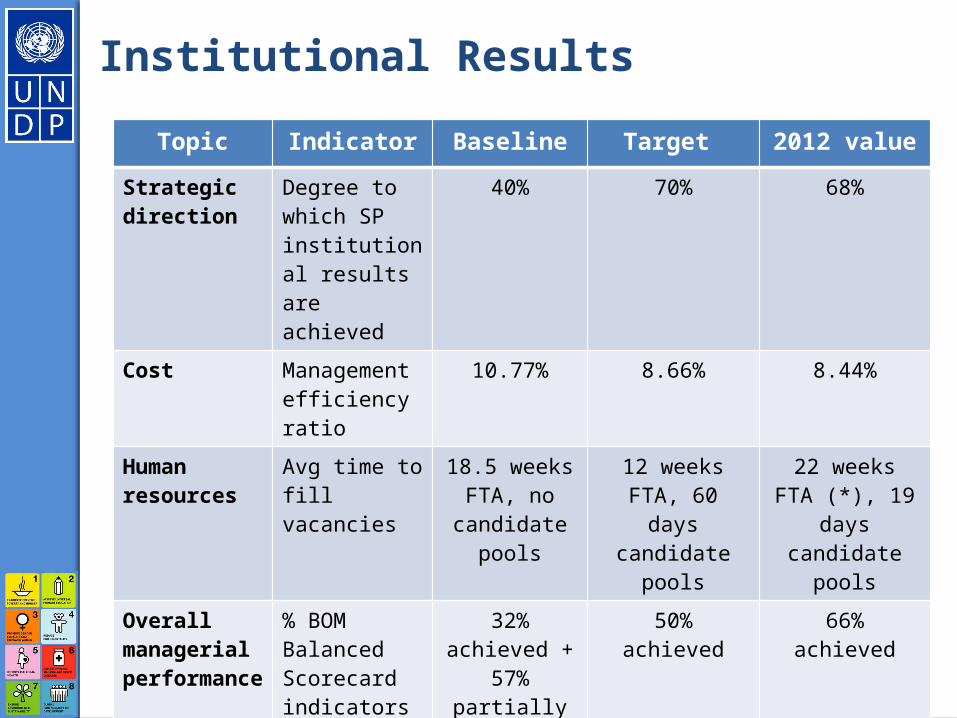
Institutional Results
Topic Indicator Baseline Target 2012 value
Strategic direction
Degree to which SP institutional results are achieved
40% 70% 68%
Cost Management efficiency ratio
10.77% 8.66% 8.44%
Human resources
Avg time to fill vacancies
18.5 weeks FTA, no
candidate pools
12 weeks FTA, 60 days candidate
pools
22 weeks FTA (*), 19 days
candidate pools
Overall managerial performance
% BOM Balanced Scorecard indicators with satisfactory rating
32% achieved + 57% partially
achieved
50% achieved 66% achieved

Fragmented interventions are the least likely to influence outcome level change.
Innovations on the ground that benefit the poor and excluded, feed back into policies and provide the basis for scaling-up.
Achieving development results was most successful when there was a strong evidence base to inform policy and programme responses and track impact.
Forward-looking analysis, advocacy and advice on Sustainable Human Development.
Need for UNDP to take cross-practice approaches. Shift from a practice-based architecture to more flexible multi-disciplinary issues-based development solutions teams.
Engaging women early and throughout development processes improves outcomes not only for women, but for all beneficiaries.
Emphasis on interventions benefitting women.
Weak human, financial, and infrastructure capacities coupled with divergent or uncoordinated donor interests often lead to piecemeal capacity development efforts and weaker results.
UNDP’s help in developing policies, leadership skills, partnering abilities and institutional capacities that can sustain results over time.
Greatest UN impact when common action is structured around the achievement of substantive results rather than process coordination.
Focus coordination more around delivery and getting development results and less on internal management or process issues.
Need for a more integrated, strategic approach to embedding knowledge management into organizational performance and learning.
Greater organisational openness, agility and adaptability to harness knowledge, solutions and expertise.
UNDP is in a unique position within the UN System to foster SSC, and could do more with a clearer organisational strategy.
Increasingly facilitate SSC to respond to country demand for relevant, tested, and cost-effective interventions.
Challenges and Lessons for the 2014-2017 SP