CUMI Annual Report_web.cdr
98
Transcript of CUMI Annual Report_web.cdr
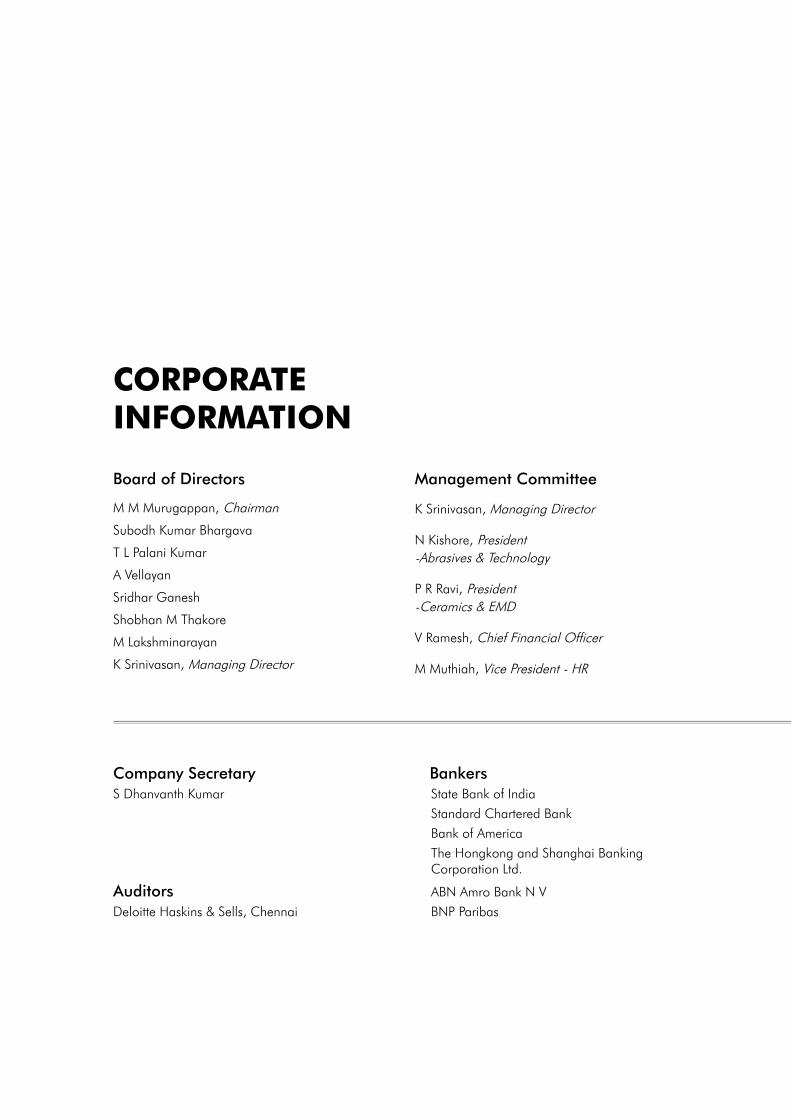
Management Committee
K Srinivasan, Managing Director
N Kishore, President -Abrasives & Technology
P R Ravi, President -Ceramics & EMD
V Ramesh, Chief Financial Officer
M Muthiah, Vice President - HR
Company Secretary Bankers S Dhanvanth Kumar State Bank of India Standard Chartered Bank Bank of America The Hongkong and Shanghai Banking Corporation Ltd.
Auditors ABN Amro Bank N VDeloitte Haskins & Sells, Chennai BNP Paribas
Board of Directors
M M Murugappan, Chairman
Subodh Kumar Bhargava
T L Palani Kumar
A Vellayan
Sridhar Ganesh
Shobhan M Thakore
M Lakshminarayan
K Srinivasan, Managing Director
CORPORATEINFORMATION
2
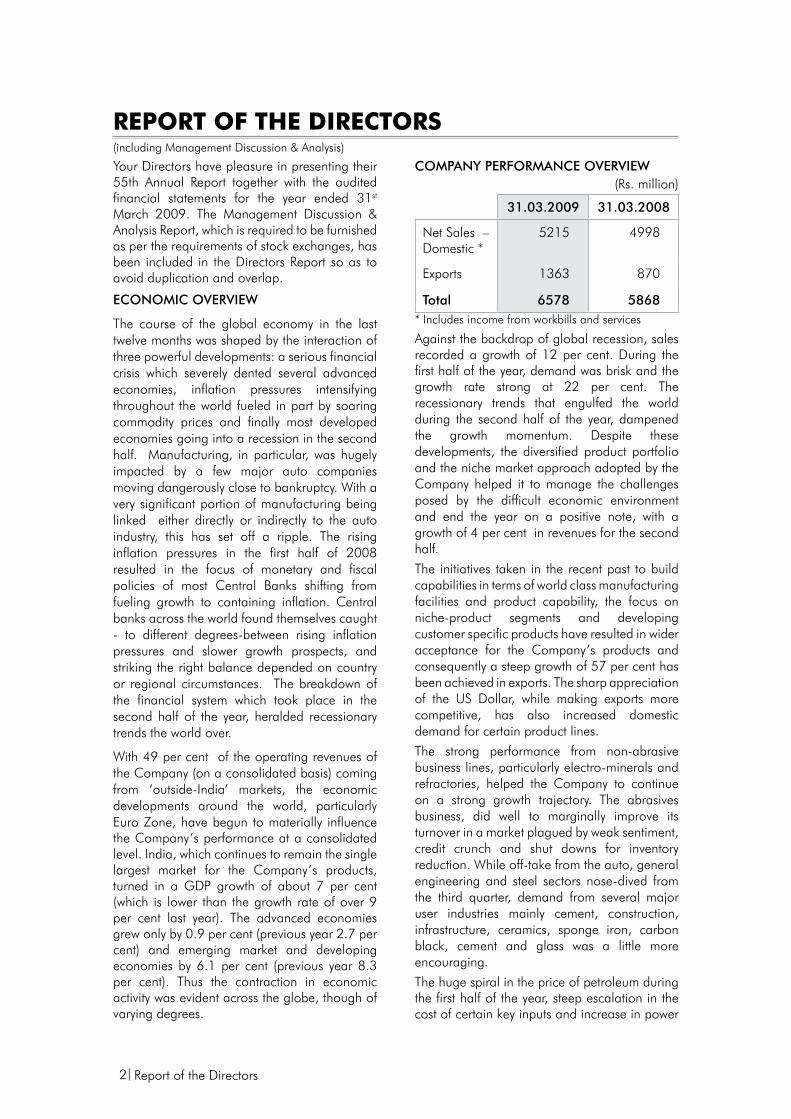
Your Directors have pleasure in presenting their 55th Annual Report together with the audited financial statements for the year ended 31st March 2009. The Management Discussion & Analysis Report, which is required to be furnished as per the requirements of stock exchanges, has been included in the Directors Report so as to avoid duplication and overlap.
ECONOMIC OVERVIEW
The course of the global economy in the last twelve months was shaped by the interaction of three powerful developments: a serious financial crisis which severely dented several advanced economies, inflation pressures intensifying throughout the world fueled in part by soaring commodity prices and finally most developed economies going into a recession in the second half. Manufacturing, in particular, was hugely impacted by a few major auto companies moving dangerously close to bankruptcy. With a very significant portion of manufacturing being linked either directly or indirectly to the auto industry, this has set off a ripple. The rising inflation pressures in the first half of 2008 resulted in the focus of monetary and fiscal policies of most Central Banks shifting from fueling growth to containing inflation. Central banks across the world found themselves caught - to different degrees-between rising inflation pressures and slower growth prospects, and striking the right balance depended on country or regional circumstances. The breakdown of the financial system which took place in the second half of the year, heralded recessionary trends the world over.
With 49 per cent of the operating revenues of the Company (on a consolidated basis) coming from ‘outside-India’ markets, the economic developments around the world, particularly Euro Zone, have begun to materially influence the Company’s performance at a consolidated level. India, which continues to remain the single largest market for the Company’s products, turned in a GDP growth of about 7 per cent (which is lower than the growth rate of over 9 per cent last year). The advanced economies grew only by 0.9 per cent (previous year 2.7 per cent) and emerging market and developing economies by 6.1 per cent (previous year 8.3 per cent). Thus the contraction in economic activity was evident across the globe, though of varying degrees.
COMPANY PERFORMANCE OVERVIEW(Rs. million)
31.03.2009 31.03.2008
Net Sales – Domestic *
5215 4998
Exports 1363 870
Total 6578 5868* Includes income from workbills and services
Against the backdrop of global recession, sales recorded a growth of 12 per cent. During the first half of the year, demand was brisk and the growth rate strong at 22 per cent. The recessionary trends that engulfed the world during the second half of the year, dampened the growth momentum. Despite these developments, the diversified product portfolio and the niche market approach adopted by the Company helped it to manage the challenges posed by the difficult economic environment and end the year on a positive note, with a growth of 4 per cent in revenues for the second half.
The initiatives taken in the recent past to build capabilities in terms of world class manufacturing facilities and product capability, the focus on niche-product segments and developing customer specific products have resulted in wider acceptance for the Company’s products and consequently a steep growth of 57 per cent has been achieved in exports. The sharp appreciation of the US Dollar, while making exports more competitive, has also increased domestic demand for certain product lines.
The strong performance from non-abrasive business lines, particularly electro-minerals and refractories, helped the Company to continue on a strong growth trajectory. The abrasives business, did well to marginally improve its turnover in a market plagued by weak sentiment, credit crunch and shut downs for inventory reduction. While off-take from the auto, general engineering and steel sectors nose-dived from the third quarter, demand from several major user industries mainly cement, construction, infrastructure, ceramics, sponge iron, carbon black, cement and glass was a little more encouraging.
The huge spiral in the price of petroleum during the first half of the year, steep escalation in the cost of certain key inputs and increase in power
Report of the Directors
REPORT OF ThE DIRECTORs(including Management Discussion & Analysis)
Annual Report 2009 3
cost due to supply constraints, additional levies and lower captive power generation, accentuated costs. The Company initiated a slew of cost reduction programmes to mitigate the adverse impact of the cost increases.
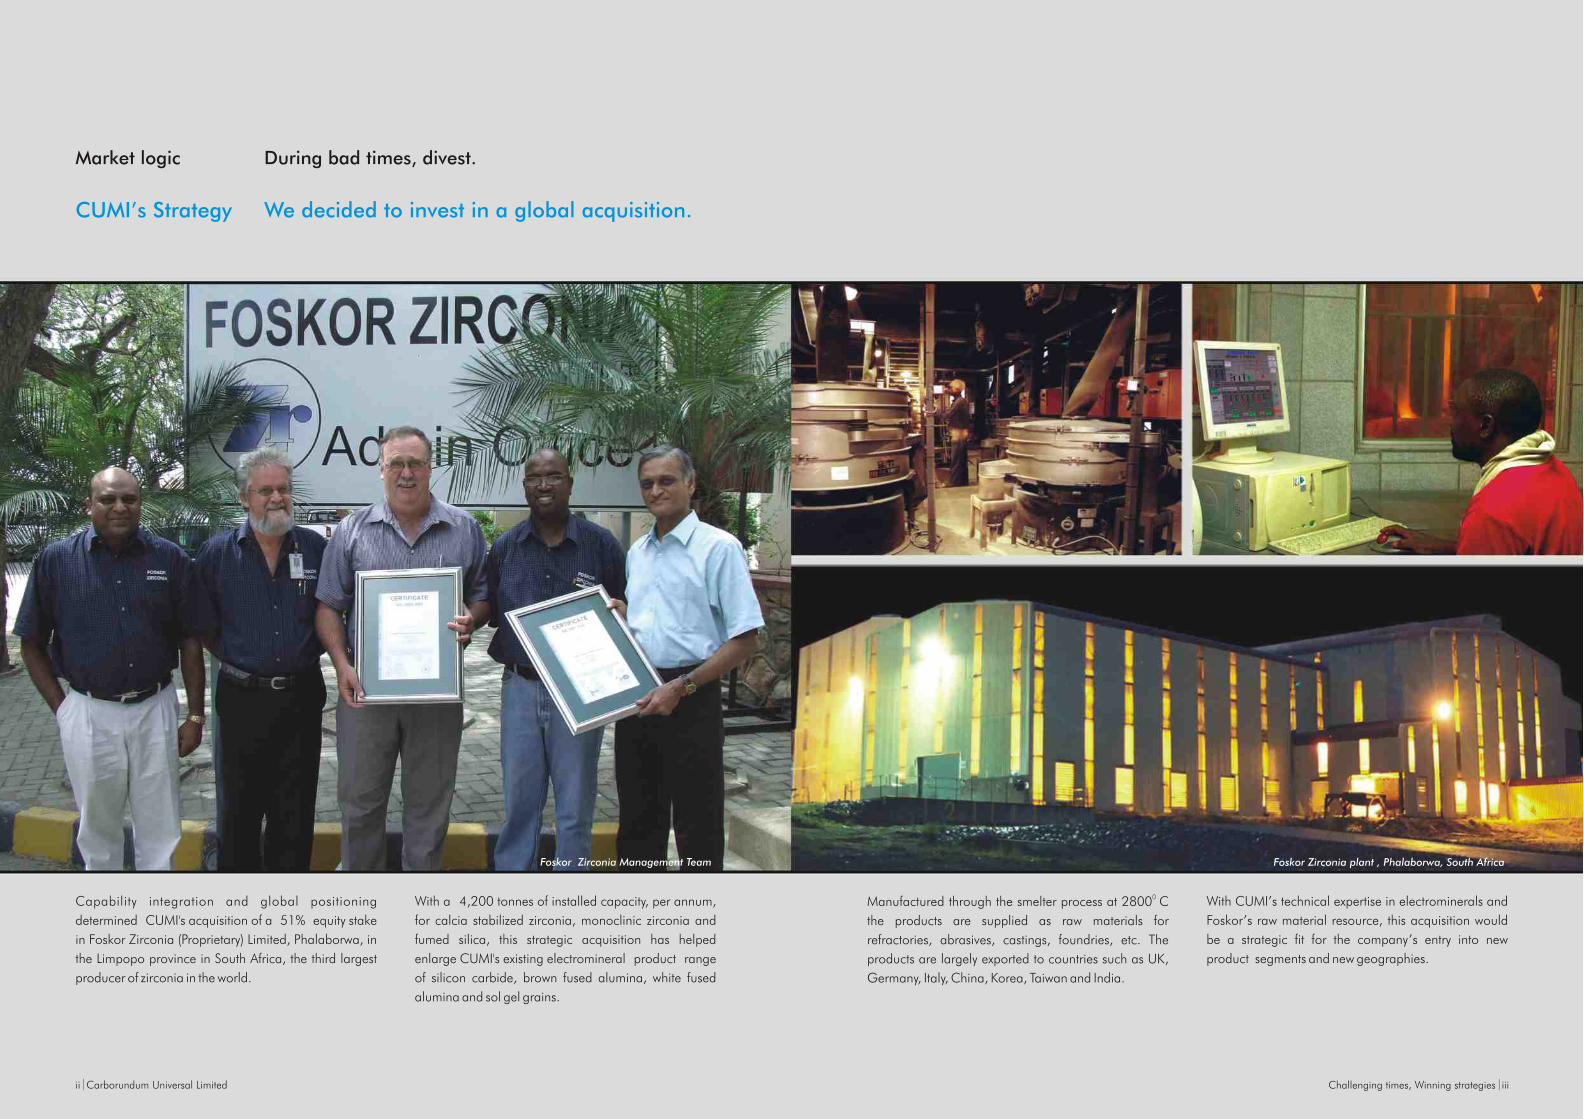
One of the key developments of the year was the acquisition by CUMI International Limited (the Company’s wholly owned subsidiary) of a 51 per cent equity stake in Foskor Zirconia (Proprietary) Limited (‘FZL’), South Africa. Foskor (Proprietary) Limited, South Africa, who are one of the world’s largest producers of phosphate and phosphoric acid, hold the remaining 49 per cent. FZL, with a turnover of about USD 13 million, is today the 3rd largest producer of Zirconia in the world. With a 4200 tons per annum installed capacity for calcia stabilized zirconia and other products like monoclinic zirconia and fumed silica, this acquisition has helped to widen CUMI’s product offering in electro-minerals which now comprises of silicon carbide, fused alumina and zirconia.
Capital expenditure during the year was Rs. 774 million, with investments being made primarily for continuing the effort to build a world-class back end in technical ceramics, super refractories and electrominerals. With the threat of a global recession looming large, it was decided to restrict spending to projects of strategic significance. Consequently total capex spending was kept below originally planned levels. Apart from the new investments, the Company made considerable progress in getting the desired benefits from the various capital expenditure projects commissioned in the past few years.
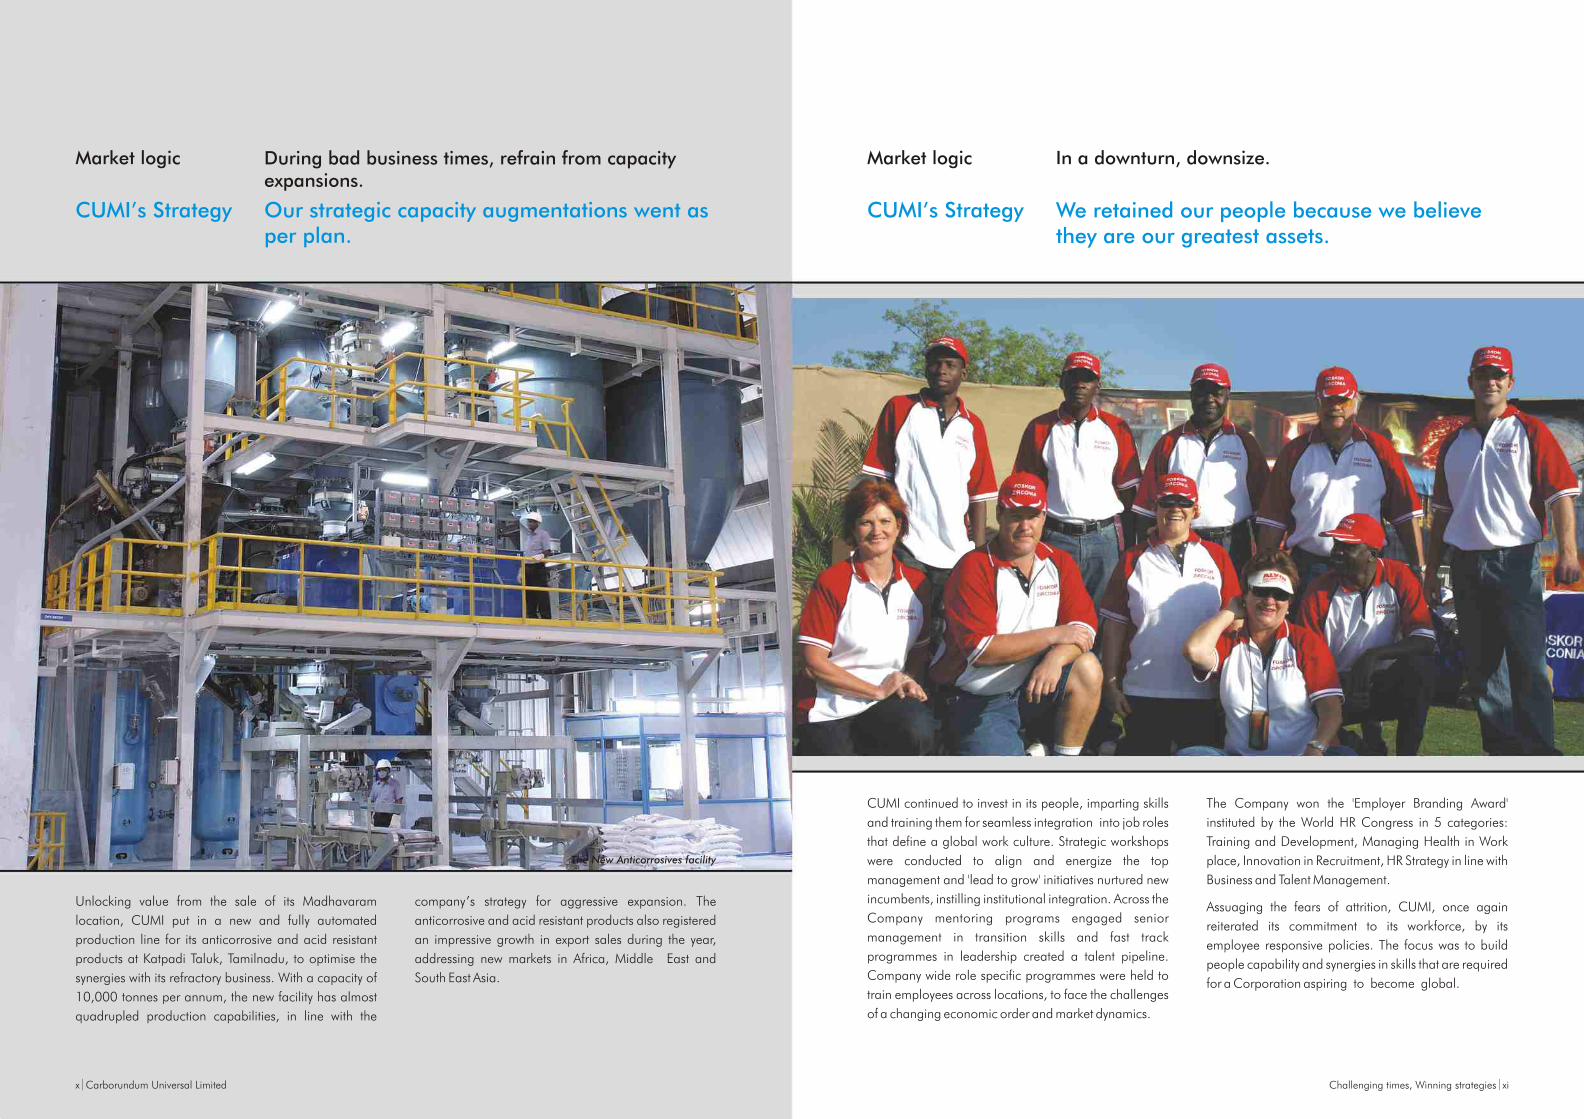
The Company continued its exercise of divesting non-strategic assets to fund construction of strategic assets. During the year, the Madhavaram property which housed the anti-corrosives operations was sold yielding a profit of Rs 288 million.
Earnings before interest, depreciation and tax (EBITDA) margins did not reach targeted levels as a result of a combination of factors – disproportionate increase in raw material cost, higher fixed costs resulting from capacity creation across businesses in anticipation of growth and unexpected movements in the foreign currency rates. Depreciation and interest costs were higher consequent to the large capital expenditure that is being undertaken in the last few years. The developments in the global
financial sector accentuated the hike in interest costs.
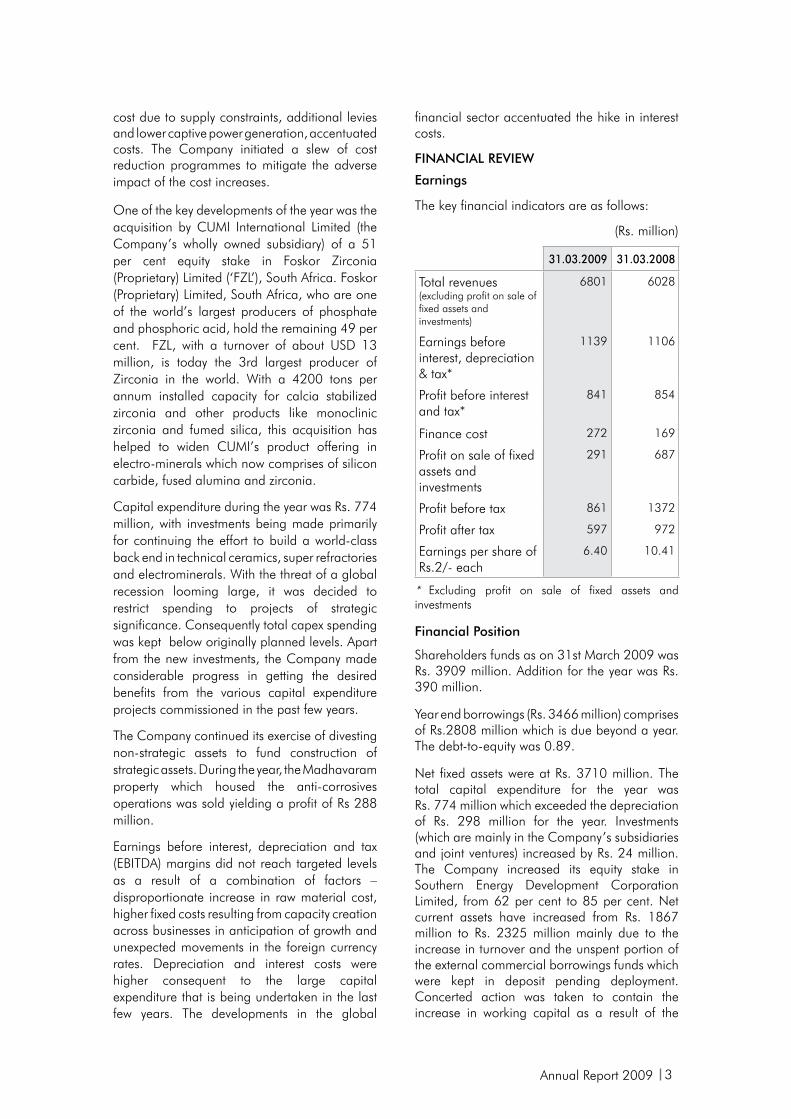
FINANCIAL REVIEW
Earnings
The key financial indicators are as follows:
(Rs. million)
31.03.2009 31.03.2008
Total revenues(excluding profit on sale of fixed assets and investments)
6801 6028
Earnings before interest, depreciation & tax*
1139 1106
Profit before interest and tax*
841 854
Finance cost 272 169
Profit on sale of fixed assets and investments
291 687
Profit before tax 861 1372
Profit after tax 597 972
Earnings per share of Rs.2/- each
6.40 10.41
* Excluding profit on sale of fixed assets and investments
Financial Position
Shareholders funds as on 31st March 2009 was Rs. 3909 million. Addition for the year was Rs. 390 million.
Year end borrowings (Rs. 3466 million) comprises of Rs.2808 million which is due beyond a year. The debt-to-equity was 0.89.
Net fixed assets were at Rs. 3710 million. The total capital expenditure for the year was Rs. 774 million which exceeded the depreciation of Rs. 298 million for the year. Investments (which are mainly in the Company’s subsidiaries and joint ventures) increased by Rs. 24 million. The Company increased its equity stake in Southern Energy Development Corporation Limited, from 62 per cent to 85 per cent. Net current assets have increased from Rs. 1867 million to Rs. 2325 million mainly due to the increase in turnover and the unspent portion of the external commercial borrowings funds which were kept in deposit pending deployment. Concerted action was taken to contain the increase in working capital as a result of the
4
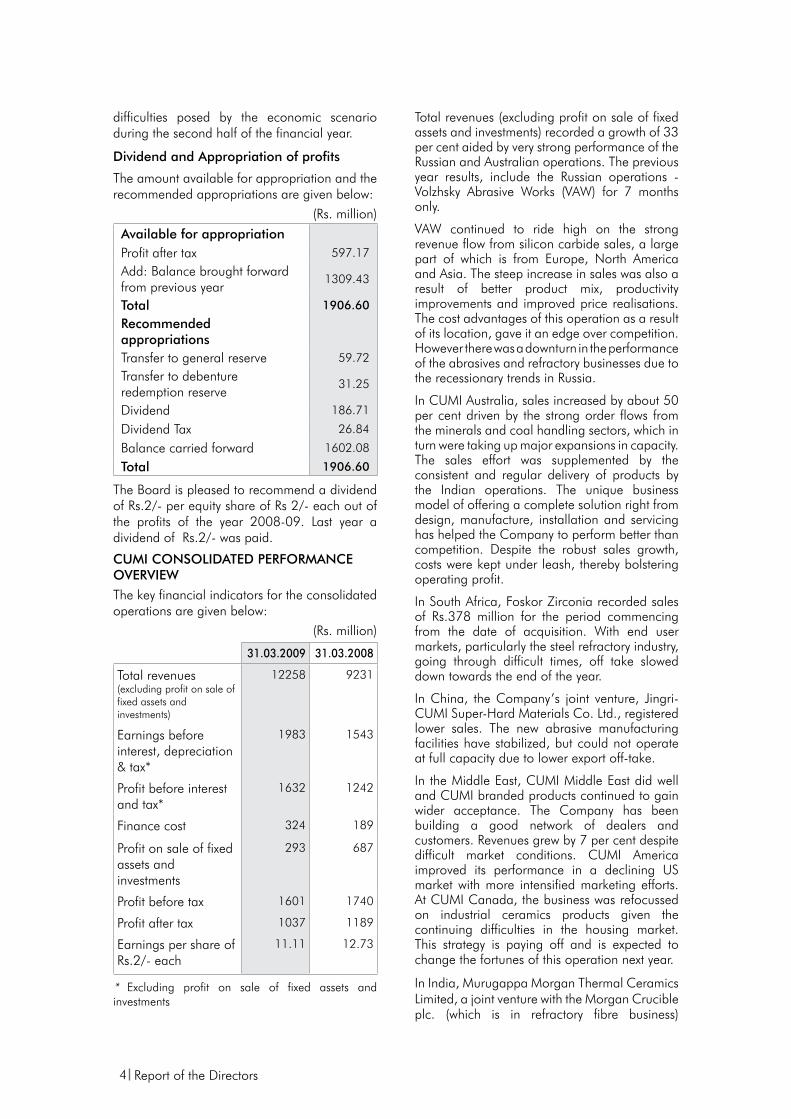
difficulties posed by the economic scenario during the second half of the financial year.
Dividend and Appropriation of profits
The amount available for appropriation and the recommended appropriations are given below:
(Rs. million)
Available for appropriationProfit after tax 597.17
Add: Balance brought forward from previous year
1309.43
Total 1906.60
Recommended appropriationsTransfer to general reserve 59.72
Transfer to debenture redemption reserve
31.25
Dividend 186.71
Dividend Tax 26.84
Balance carried forward 1602.08
Total 1906.60
The Board is pleased to recommend a dividend of Rs.2/- per equity share of Rs 2/- each out of the profits of the year 2008-09. Last year a dividend of Rs.2/- was paid.
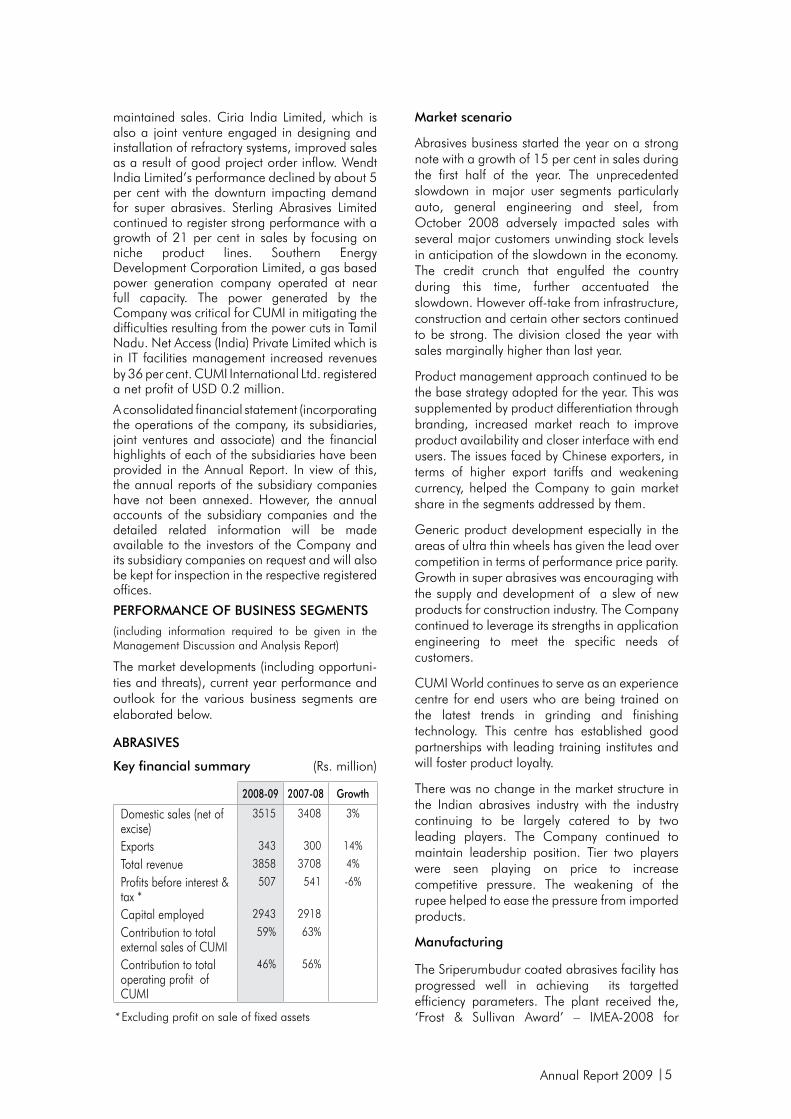
CUMI CONSOLIDATED PERFORMANCE OVERVIEWThe key financial indicators for the consolidated operations are given below:
(Rs. million)
31.03.2009 31.03.2008
Total revenues(excluding profit on sale of fixed assets and investments)
12258 9231
Earnings before interest, depreciation & tax*
1983 1543
Profit before interest and tax*
1632 1242
Finance cost 324 189
Profit on sale of fixed assets and investments
293 687
Profit before tax 1601 1740
Profit after tax 1037 1189
Earnings per share of Rs.2/- each
11.11 12.73
* Excluding profit on sale of fixed assets and investments
Total revenues (excluding profit on sale of fixed assets and investments) recorded a growth of 33 per cent aided by very strong performance of the Russian and Australian operations. The previous year results, include the Russian operations - Volzhsky Abrasive Works (VAW) for 7 months only.
VAW continued to ride high on the strong revenue flow from silicon carbide sales, a large part of which is from Europe, North America and Asia. The steep increase in sales was also a result of better product mix, productivity improvements and improved price realisations. The cost advantages of this operation as a result of its location, gave it an edge over competition. However there was a downturn in the performance of the abrasives and refractory businesses due to the recessionary trends in Russia.
In CUMI Australia, sales increased by about 50 per cent driven by the strong order flows from the minerals and coal handling sectors, which in turn were taking up major expansions in capacity. The sales effort was supplemented by the consistent and regular delivery of products by the Indian operations. The unique business model of offering a complete solution right from design, manufacture, installation and servicing has helped the Company to perform better than competition. Despite the robust sales growth, costs were kept under leash, thereby bolstering operating profit.
In South Africa, Foskor Zirconia recorded sales of Rs.378 million for the period commencing from the date of acquisition. With end user markets, particularly the steel refractory industry, going through difficult times, off take slowed down towards the end of the year.
In China, the Company’s joint venture, Jingri-CUMI Super-Hard Materials Co. Ltd., registered lower sales. The new abrasive manufacturing facilities have stabilized, but could not operate at full capacity due to lower export off-take.
In the Middle East, CUMI Middle East did well and CUMI branded products continued to gain wider acceptance. The Company has been building a good network of dealers and customers. Revenues grew by 7 per cent despite difficult market conditions. CUMI America improved its performance in a declining US market with more intensified marketing efforts. At CUMI Canada, the business was refocussed on industrial ceramics products given the continuing difficulties in the housing market. This strategy is paying off and is expected to change the fortunes of this operation next year.
In India, Murugappa Morgan Thermal Ceramics Limited, a joint venture with the Morgan Crucible plc. (which is in refractory fibre business)
Report of the Directors
Annual Report 2009 5
maintained sales. Ciria India Limited, which is also a joint venture engaged in designing and installation of refractory systems, improved sales as a result of good project order inflow. Wendt India Limited’s performance declined by about 5 per cent with the downturn impacting demand for super abrasives. Sterling Abrasives Limited continued to register strong performance with a growth of 21 per cent in sales by focusing on niche product lines. Southern Energy Development Corporation Limited, a gas based power generation company operated at near full capacity. The power generated by the Company was critical for CUMI in mitigating the difficulties resulting from the power cuts in Tamil Nadu. Net Access (India) Private Limited which is in IT facilities management increased revenues by 36 per cent. CUMI International Ltd. registered a net profit of USD 0.2 million.
A consolidated financial statement (incorporating the operations of the company, its subsidiaries, joint ventures and associate) and the financial highlights of each of the subsidiaries have been provided in the Annual Report. In view of this, the annual reports of the subsidiary companies have not been annexed. However, the annual accounts of the subsidiary companies and the detailed related information will be made available to the investors of the Company and its subsidiary companies on request and will also be kept for inspection in the respective registered offices.
PERFORMANCE OF BUSINESS SEGMENTS
(including information required to be given in the Management Discussion and Analysis Report)
The market developments (including opportuni-ties and threats), current year performance and outlook for the various business segments are elaborated below.
ABRASIVES
Key financial summary (Rs. million)
2008-09 2007-08 Growth
Domestic sales (net of excise)
3515 3408 3%
Exports 343 300 14%
Total revenue 3858 3708 4%
Profits before interest & tax *
507 541 -6%
Capital employed 2943 2918
Contribution to total external sales of CUMI
59% 63%
Contribution to total operating profit of CUMI
46% 56%
* Excluding profit on sale of fixed assets
Market scenario
Abrasives business started the year on a strong note with a growth of 15 per cent in sales during the first half of the year. The unprecedented slowdown in major user segments particularly auto, general engineering and steel, from October 2008 adversely impacted sales with several major customers unwinding stock levels in anticipation of the slowdown in the economy. The credit crunch that engulfed the country during this time, further accentuated the slowdown. However off-take from infrastructure, construction and certain other sectors continued to be strong. The division closed the year with sales marginally higher than last year.
Product management approach continued to be the base strategy adopted for the year. This was supplemented by product differentiation through branding, increased market reach to improve product availability and closer interface with end users. The issues faced by Chinese exporters, in terms of higher export tariffs and weakening currency, helped the Company to gain market share in the segments addressed by them.
Generic product development especially in the areas of ultra thin wheels has given the lead over competition in terms of performance price parity. Growth in super abrasives was encouraging with the supply and development of a slew of new products for construction industry. The Company continued to leverage its strengths in application engineering to meet the specific needs of customers.
CUMI World continues to serve as an experience centre for end users who are being trained on the latest trends in grinding and finishing technology. This centre has established good partnerships with leading training institutes and will foster product loyalty.
There was no change in the market structure in the Indian abrasives industry with the industry continuing to be largely catered to by two leading players. The Company continued to maintain leadership position. Tier two players were seen playing on price to increase competitive pressure. The weakening of the rupee helped to ease the pressure from imported products.
Manufacturing
The Sriperumbudur coated abrasives facility has progressed well in achieving its targetted efficiency parameters. The plant received the, ‘Frost & Sullivan Award’ – IMEA-2008 for
6
Manufacturing Excellence – Silver Certificate of Merit. With Sriperumbudur plant settling down, the coated abrasives facility at Thiruvottiyur has been converted into a back-up facility to be used in times of demand surges and to mitigate the risks of dependency on a single location. The abrasives facility at Uttarkhand has fully stabilized and has established its capability to operate at peak levels.
The operating margins showed a decline, since the selling prices could not be adjusted to fully recover the cost increases. Further a product mix shift to lower margin ‘eco’ products also impacted margins.
Input cost increase impacted margins during the year. The production restrictions imposed on Chinese manufacturers by local government coupled with adverse currency movements and higher export tariffs resulted in steep increase in grain prices. To counter the cost push on grains, cost reduction initiatives in the form of value engineering, use of alternative materials, development of new supply sources and power and fuel cost reduction were undertaken.
Power cost was higher due to the supply constraints imposed in Tamil Nadu. The adverse impact was minimized to some extent, using the captive power procured from the power plant operated by the Company’s subsidiary. The restrictions imposed for a few months, resulted in the division having to resort to higher cost alternatives.
Faced with stiff challenges in the market place and escalation in manufacturing costs, the division strived to protect operating profits by tighter working capital management apart from cost reduction measures.
The power tools business recorded sales of over Rs.62 million during the first full year of operations. Competition was intense, with stiff product line up and price competition from power tool majors, which was further exacerbated during the second half by the sluggish market conditions. While several products which were launched in the first phase have gained good acceptance, the next phase of enlarging the product offering was taken up. Marketing & service network was expanded to several territories in India. The division received ISO accreditation for “Design, manufacture, marketing & servicing”.
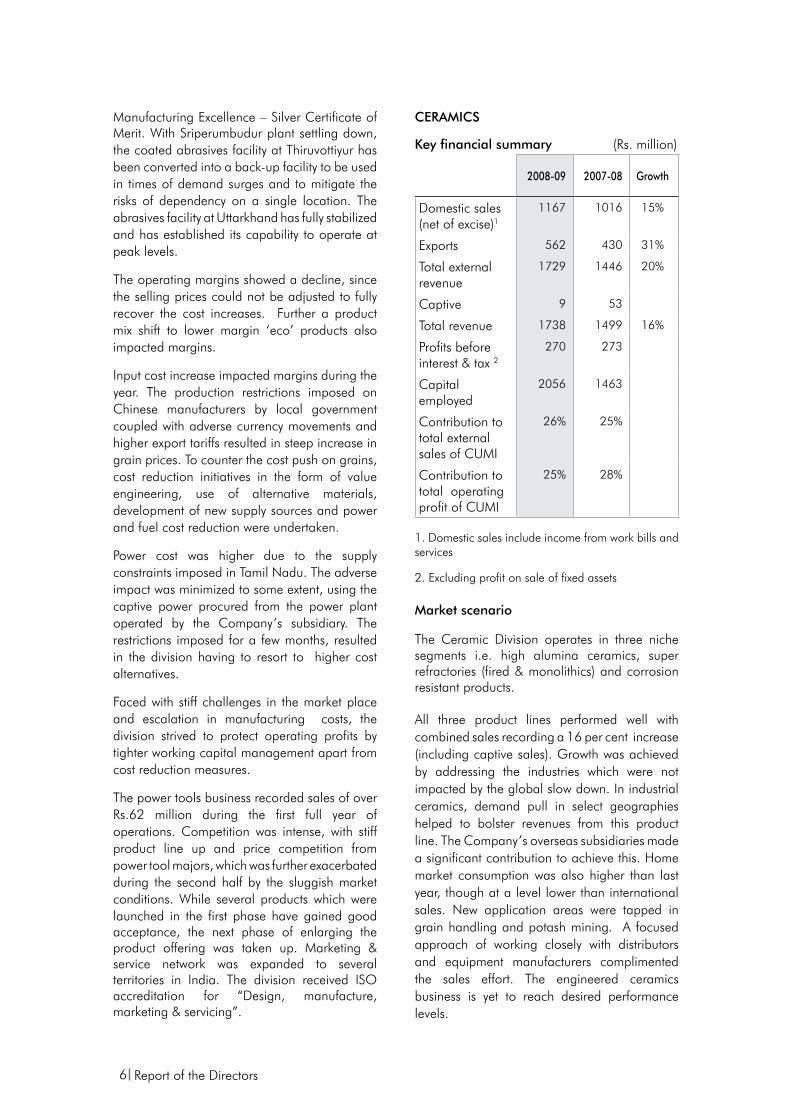
CERAMICS
Key financial summary (Rs. million)
2008-09 2007-08 Growth
Domestic sales (net of excise)1
1167 1016 15%
Exports 562 430 31%
Total external revenue
1729 1446 20%
Captive 9 53
Total revenue 1738 1499 16%
Profits before interest & tax 2
270 273
Capital employed
2056 1463
Contribution to total external sales of CUMI
26% 25%
Contribution to total operating profit of CUMI
25% 28%
1. Domestic sales include income from work bills and services
2. Excluding profit on sale of fixed assets
Market scenario
The Ceramic Division operates in three niche segments i.e. high alumina ceramics, super refractories (fired & monolithics) and corrosion resistant products.
All three product lines performed well with combined sales recording a 16 per cent increase (including captive sales). Growth was achieved by addressing the industries which were not impacted by the global slow down. In industrial ceramics, demand pull in select geographies helped to bolster revenues from this product line. The Company’s overseas subsidiaries made a significant contribution to achieve this. Home market consumption was also higher than last year, though at a level lower than international sales. New application areas were tapped in grain handling and potash mining. A focused approach of working closely with distributors and equipment manufacturers complimented the sales effort. The engineered ceramics business is yet to reach desired performance levels.
Report of the Directors
Annual Report 2009 7
In super refractories growth was driven by good order inflow from Ceramics, Sponge Iron, Carbon black, Cement and Glass industries. Monolithic refractories, particularly performed well, by addressing new customers / segments and by offering customized and cost-effective products. The fired segment also registered double digit growth. Project orders from various user industries was strong, especially glass. These orders were won against strong competition from overseas competitors.
Anti corrosives business also did well achieving double digit growth rates, both in the home and international markets. Growth was achieved by addressing mineral processing industries in domestic and export markets.
There has been no material change in the industry structure in India which is catered to by 4-5 major players in each product line. CUMI is the market leader in certain market segments.
Manufacturing
The new automated plant in Hosur (near Bangalore), for wear resistance liner tiles, the final phase of which was completed last year, has been leveraged to service the demand for industrial ceramics products, in both domestic and overseas markets. New products in terms of geometry and scale (imperial scale for North American markets and metric scales for the rest of the world) were manufactured to meet customers’ requirements. In order to improve product consistency, productivity and achieve dimensional stability, several improvements were done in the manufacturing process. Quality initiatives (6 sigma) were introduced for tile production in order to achieve defect free dimensionally consistent products.
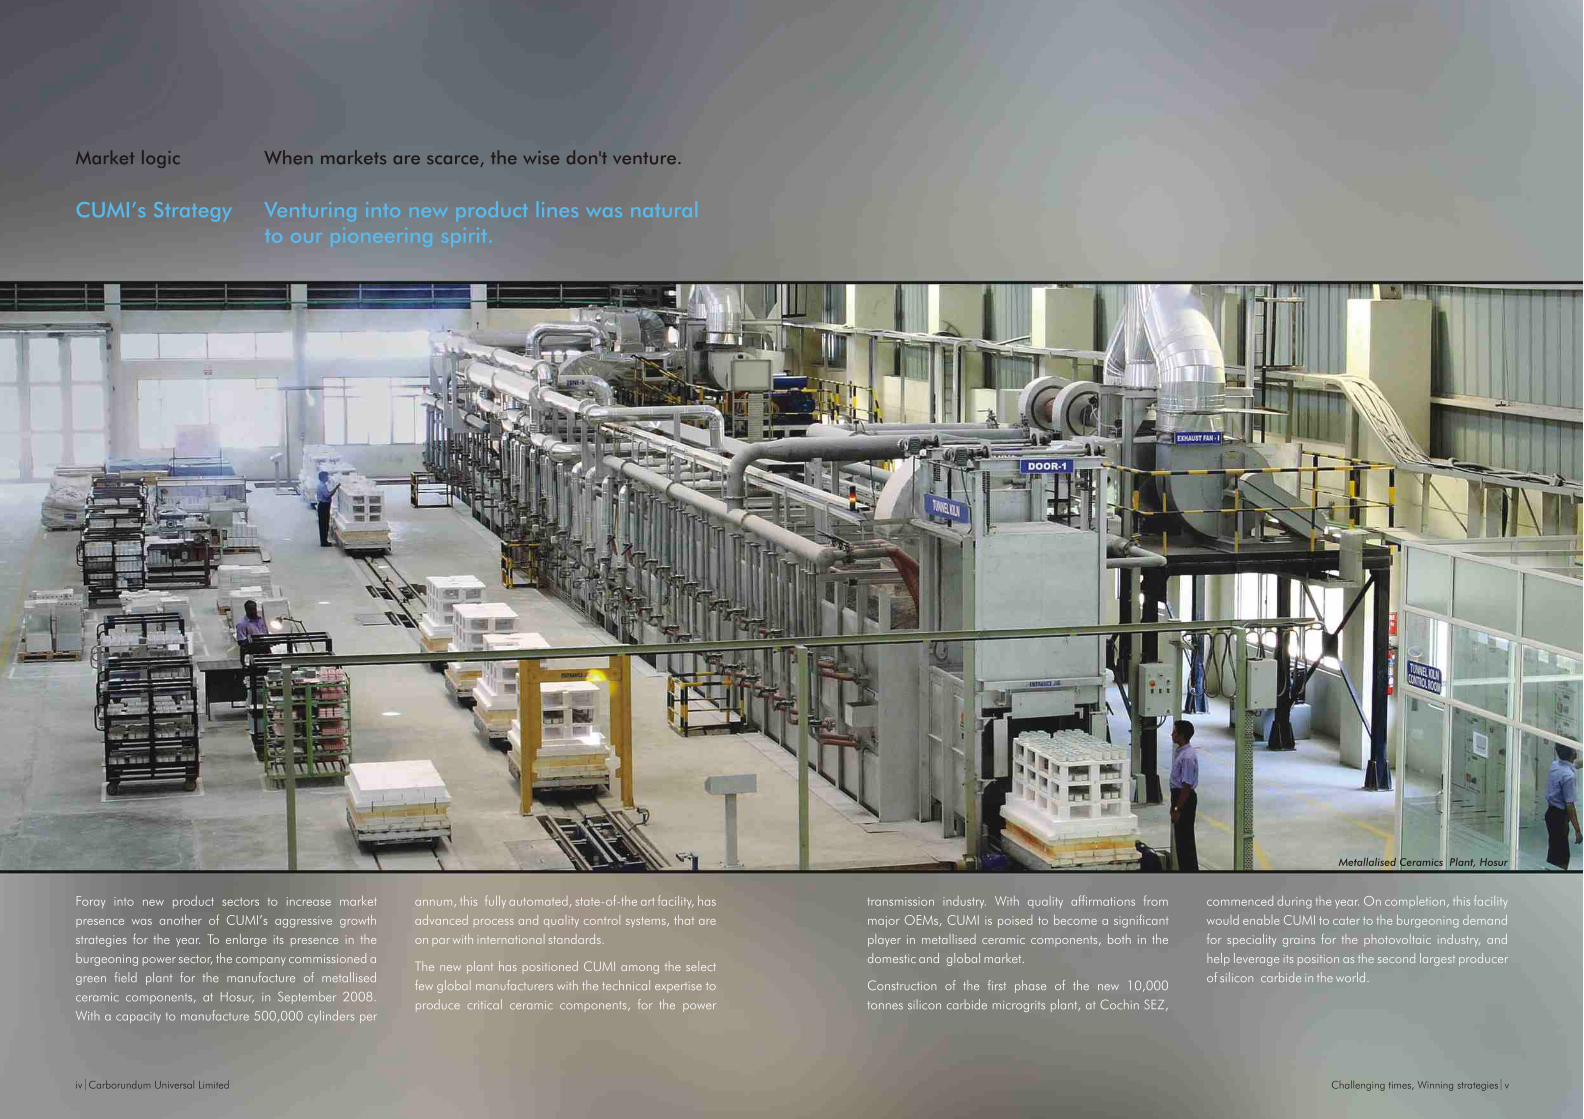
A state-of-the-art metallised ceramics plant has been commissioned in September 2008 which will primarily address the requirements of the power transmission industry. The plant has stabilized operations. The process of getting approvals from major customers is progressing well.
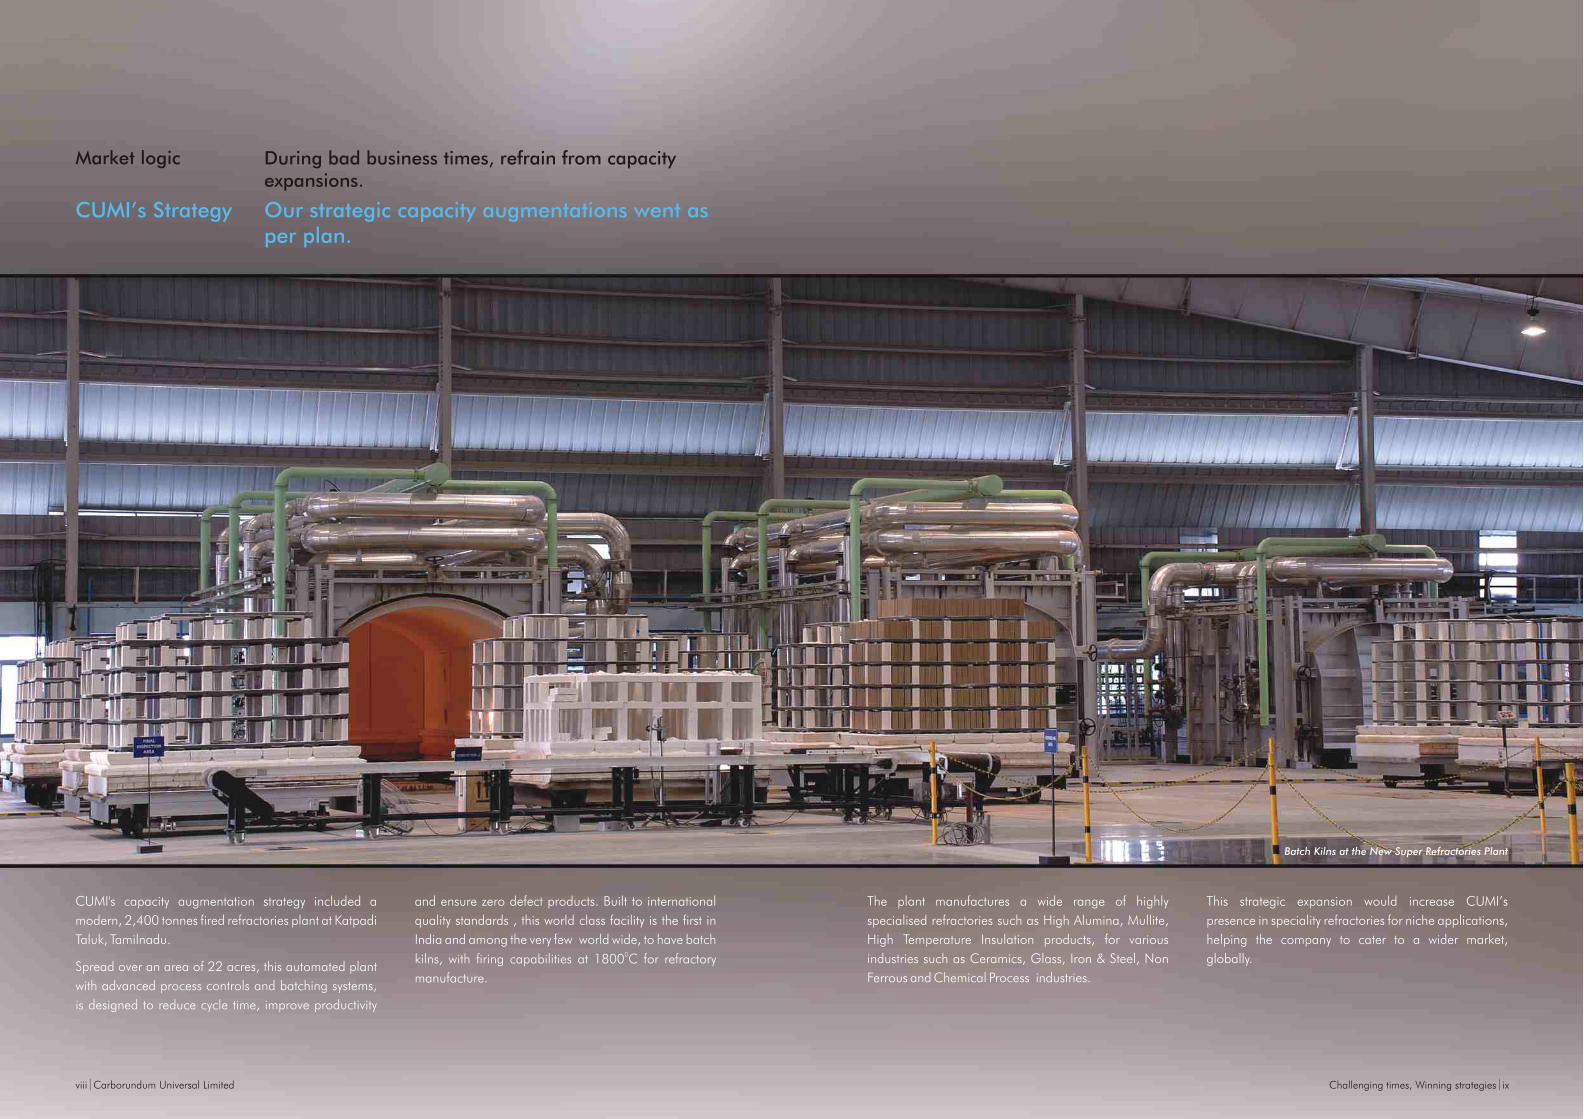
Given the strong order flow for fired refractories during the last few years, a modern plant (with a 2400 tonnes per annum capacity) has been commissioned in Katpadi Taluk, Tamil Nadu. The plant incorporates advanced production processes and equipments which are designed to deliver cost advantage and high quality products. This plant has the capability to fire products at 18000 C. It would supplement the operations of the existing fired refractories plant in Ranipet. This plant will also house the anti-
corrosives operations which have been shifted from Madhavaram. The facility with an annual capacity of 10000 metric tonnes for producing anti corrosive products is being commissioned in a phased manner. TPM activities were initiated in both the first and the second refractory plants.
The monolithics operations which has now been consolidated into the Jabalpur unit has crossed 10000 metric tonne production for the year. The plant obtained its ISO 9001 approval during the year and played a pivotal role in bolstering the revenues of the business.
Cost pressures resulted from increase in power and fuel cost and escalation in cost of imported raw materials. The power cuts imposed in Tamil Nadu necessitated incurring additional fuel cost for operating generators. The depreciation in the Indian rupee led to escalation in cost of certain imported raw materials. In order to combat the effects of slow down and cost increases, with its resultant impact on operating profits, the Company worked on reducing costs by rationalizing manufacturing processes and improving internal efficiencies. Additional sources were developed for key raw materials in super refractories to improve cost position.
Operating profits were flat despite the increase in turnover, because of the delay in revenue flow from the new metallised cylinders facility and lower sales from the engineered ceramics segment.
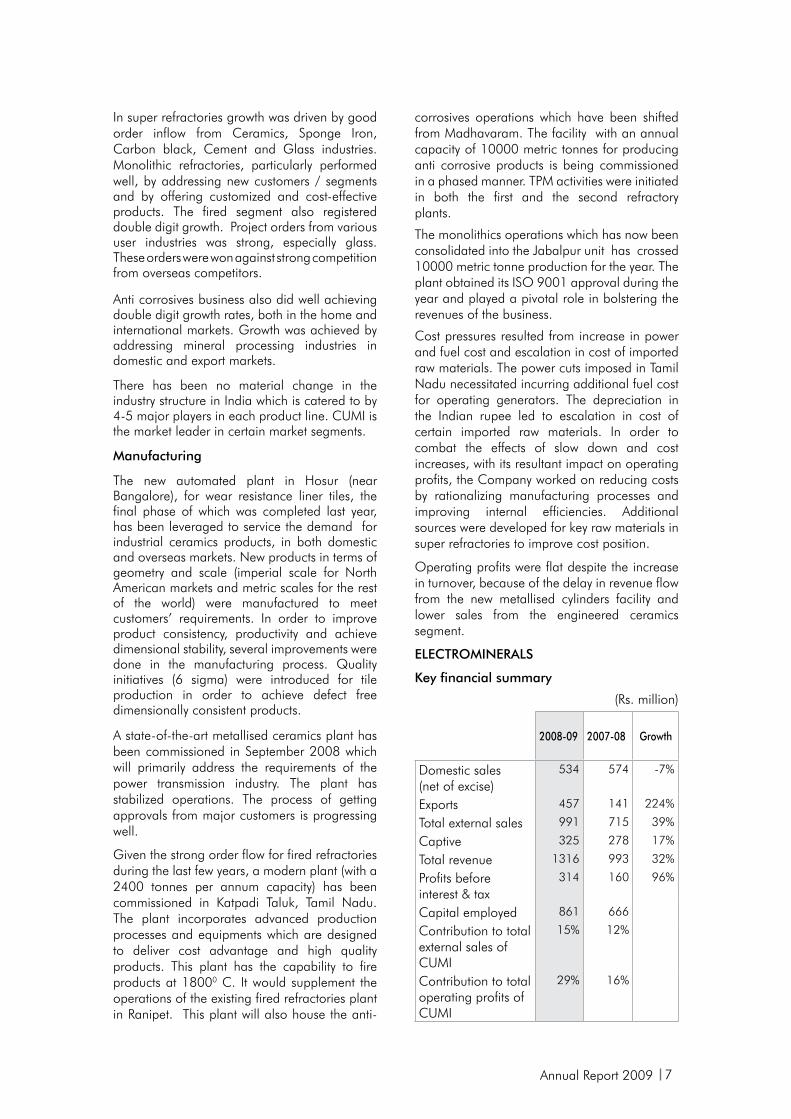
ELECTROMINERALS
Key financial summary
(Rs. million)
2008-09 2007-08 Growth
Domestic sales (net of excise)
534 574 -7%
Exports 457 141 224%
Total external sales 991 715 39%
Captive 325 278 17%
Total revenue 1316 993 32%
Profits before interest & tax
314 160 96%
Capital employed 861 666
Contribution to total external sales of CUMI
15% 12%
Contribution to total operating profits of CUMI
29% 16%
8
Market scenario
It has been a watershed year for the electro-minerals business with revenues recording a 32 per cent growth (including captive supplies to the abrasives business). The division established itself in the international markets as a reliable supplier of high quality, high performing products for niche applications. The strategy of shifting product focus from commodities to specials has started paying rich dividends. Sales to overseas markets tripled in comparison to the previous year aided by favorable conditions in user industry segments and wider acceptance of the division’s supply capabilities. The efforts taken to stock products in key markets helped the division to address the micro market segments with good price realisations.
Sales to home markets which started on a strong note in the first half lost momentum during the second half due to the downturn in the economy, difficulties in credit availability and inventory downsizing by customers. Consumption across product groups reduced drastically and this reflected in lower sales of commodities during the second half. Consequently the division had to scale down production in certain product lines which were affected by the drop in demand. However emerging market still showed signs of growth and compensated for loss of sale from others. Competition from imports, mainly from China, was less intense due to a host of factors. The Olympic games in China and the resultant restrictions imposed on mineral manufacturing impacted the availability and pricing of mineral products out of China. Further increase in export taxes on brown fused alumina made imports from China more expensive. This coupled with appreciation in the Chinese currency, gave an opportunity to the division to make in-roads into these market segments.
The market structure remained largely unchanged in India with the market continuing to be catered to by three players (including CUMI). Apart from the domestic players, imported products also catered to the domestic market.
Manufacturing
The first half of the year, saw a huge increase in raw material costs mainly– raw and calcined bauxite and raw petroleum coke, driven by large exports of raw bauxite and spiraling crude oil prices. Prices of brown fused alumina and silicon carbide were increased to pass on some of the cost push to the customers.
Doubling of silicon carbide microgrits capacity was completed in Koratty, four months ahead of the targeted deadline. A green field project is being established in Kochi, Kerala. The first phase of this expansion is expected to come on stream by October 2009.
Autonomous working groups were set up in the heat treatment plant resulting in a flexible work culture. Yield improvements in silicon carbide microgrits, brown fused alumina and ceramic grains have been achieved.
Generation at the Maniyar hydro power station was significantly lower thereby increasing power cost for the business. Lower than average rainfall as well as the damage to the generators at an upstream substation of the electricity board reduced inflows to Maniyar, affecting generation.
FINANCE AND HUMAN RESOURCES
Finance
The crisis in the global financial sector which surfaced in the later part of 2007-08, snowballed during 2008-09 into a disaster of even greater magnitude than when it initially started. The fallout of this crisis was widespread and impacted not only the countries where the crisis originated but the rest of the world (including India). The pessimism and distrust amongst the banking community, particularly in the international arena, made availability of foreign currency loans, particularly long term, quite scarce. With the crisis reaching its peak, sometime in September 2008, the money markets was in shambles starting from then till about the end of January 2009. During this period interest rates skyrocketed and credit flows became thin.
Reserve Bank of India’s bold and phased monetary initiatives taken during the third quarter, helped to cool the markets starting from February 2009. While short term money has become cheaper, long term interest rates continue to hover at double digit levels.
The Company raised external commercial borrowings of USD 12 million to finance capital expenditure, just before the financial crisis erupted. A sum of Rs.500 million was also raised from the domestic financial sector to augment long term resources. Working capital requirements were financed primarily out of foreign currency short term loans in the form of buyer’s credit and export packing credit.
Report of the Directors
Annual Report 2009 9
All foreign currency borrowings, except an amount of about USD 5 million, have been fully hedged against exchange fluctuation and interest rate risks.
There was a steep increase in finance costs, primarily on account of the steady increase in debt levels during the last two years. Debt levels increased because of the aggressive investment programme being undertaken by the Company. The mayhem in the money market, in the latter part of the year, resulted in lending rates becoming pricey thereby adding to the interest burden.
Given the tight credit situation during the second half of the year, the Company put in place rigorous systems for cash conservation. Due to significant unexpected movements in the currencies and market volatility, exchange fluctuation losses amounting to Rs.161 million were incurred on trade flows and open loan exposures.
The Company continued to retain strong credit ratings viz. ‘P1+’ for short term borrowings and ‘AA+ Stable’ for long term borrowings, both from CRISIL. All debt obligations were serviced on time.
Human Resources
An Annual Strategy workshop - “Shaping CUMI’s Destiny” was conducted for energizing and aligning the top management team to the Company’s long term vision and to reinforce simultaneous pursuit of ambition, advantage and opportunity.
The innovation journey has been progressing quite well with the ‘Future Forward Team’ delivering significant breakthroughs in the process of creating new avenues/businesses. It is expected that these initiatives would generate promising business opportunities for the Company.
‘CUMI Leadership Program’ has achieved its first mile stone in the process of creating a leadership pipeline of fast track managers. To take the leadership mission forward, the second batch of CUMI Leadership Program has been launched. The Company also took several steps to diversify its work force in terms of geographical domicile and gender composition to reinforce itself as an ‘Equal Opportunity Employer’. Considering its increasing international presence the Company has initiated the process of building a workforce with global aspirations and competitiveness with
a heterogeneous mix of cultures working in synergy.
The total employee involvement initiatives through small group activities, cross function teams, Kaizen, 5S and suggestion schemes continued with regular reviews. Six sigma initiatives were given a special thrust to deliver superior product quality and consistency.
CUMI continued to focus on Safety, Health and Environment (SHE) and the initiative in these areas have yielded satisfactory results across all the plants. CUMI would continue to work on Zero Accidents, Zero Discharge and in maintaining the noise/dust levels well within statutory requirements.
CUMI won the employer branding awards conducted by World HRD Congress in association with Employer Branding Institute in Five Different categories. The categories are Talent Management, Best HR Strategy in Line with Business, Managing Health at Workplace, Innovation in Recruitment, Excellence in Training at the regional level and at National Level it bagged the first place in the category of Managing Health at Workplace.
Relationship with shop floor employees was generally healthy and conducive. Long term settlements were concluded in certain plants, on expiry of the earlier arrangements.
The total number of permanent employees at the end of the year was 1788 (1707 last year).
RISKS AND CONCERNS
The decline in the economy activity across the world would pose a challenge in getting the targeted returns from the investments made recently. The Company would mitigate this risk by customized product development, product innovation and also by targeting niche, high growth and nascent product markets. Cost reduction, process efficiency improvements and working capital reduction would be implemented across locations to protect profitability. Cash management would be given higher priority to address against liquidity concerns .
The Company follows a policy of multi-sourcing for raw materials. In case of calcined alumina, however a single source is being adopted for product consistency. Though this may throw up a possibility of price escalation, the Company has, through pro-active initiatives developed and strengthened this relationship and has been able to get special terms of supply based on volume commitments and annual contracts.

10
With power and fuel cost constituting a key cost component, violent fluctuations in prices would affect profitability. The Company continuously works on initiatives to reduce power and fuel consumption. Further when new equipments are purchased, power and fuel efficiency are key parameters that would influence the choice of the equipment.
The increased global exposure (in terms of overseas investments, higher overseas revenues and larger values of import of raw materials / capital goods) has enhanced the foreign currency exposure risk. The Company has tightened its forex policy based on the experience acquired in recent years to limit the adverse impact of violent currency movements.
INTERNAL CONTROL
CUMI has put in place extensive internal controls to mitigate operational risks. The internal audit team periodically evaluates the adequacy and effectiveness of these internal controls, recommends improvements and also reviews adherence to policies and corrective action taken to address any gaps.
Capital and revenue expenditure are monitored and controlled with reference to approved budgets. Investment decisions are subject to formal detailed evaluation and approval according to schedule of authority in place in the Company. Review of capital expenditure undertaken with reference to benefits forecasted is done. Physical verification of assets is periodically undertaken.
The Audit Committee reviews the significant internal audit observations and overall functioning of the internal audit on a periodical basis.
BUSINESS OUTLOOK
According to IMF’s World Economic Outlook for 2009, the global economy is being currently battered by competing crosscurrents - with the collapse in confidence and demand continuing to pull the economy down and government stimulus measures and natural stabilization mechanisms pulling the economy up. While the first current strongly dominates the second at present, the balance could shift towards the end of the year progressively if sustained policy response is provided to tackle financial sector and support demand. Growth could reemerge in 2010, but would be sluggish relative to past recoveries.
Given the above, the Company would approach 2009-10 with cautious optimism. While demand would contract for certain product lines as general activity in target markets has slowed, certain niche market segments provide opportunities for growth. The Company would continue to focus on building long term relationships with key customers by leveraging the investments in product capability that have been made across the organization. Conservation of cash would be accorded priority and consequently capital expenditure would be restricted to growth businesses and essentials. The downturn would be used to get efficiencies up and drive down costs. With these efforts, the Company is confident of continuing to ride the growth trajectory, though at a slower pace.
GOVERNANCE
Board of Directors
Mr M M Murugappan and Mr Sridhar Ganesh retire by rotation at the forthcoming Annual General Meeting and are eligible for reappointment.
Mr. Shobhan M Thakore (61 years) was inducted as an Additional Director with effect from 25th July 2008. Mr.Thakore is a lawyer with over 35 years of experience. He practices as a Solicitor in the High Court of Mumbai and the Supreme Court of England and Wales and is an advisor to several leading Indian Companies on corporate law matters and securities related legislations.
Mr. M Lakshminarayan (62 years) was co-opted as an Additional Director on 20th January 2009. He was formerly the Joint Managing Director of Bosch Limited, India. He has several decades of experience in world class machine building and tooling industry.
Both Mr. Shobhan M Thakore and Mr. M. Lakshminarayan will vacate office as additional directors at the forthcoming annual general meeting and their appointment by shareholders will be taken up at that meeting.
Mr. Suresh N Talwar and Mr. T M M Nambiar retired at the last Annual General Meeting.
Auditors
M/s Deloitte, Haskins & Sells, Chartered Accountants, Chennai retire as Auditors at the forthcoming Annual General Meeting and being eligible have expressed their willingness to be reappointed.
Report of the Directors
Annual Report 2009 11
Corporate Governance
The report on corporate governance along with a certificate from the Auditors is annexed as required by the listing agreement with stock exchanges. The Managing Director and the Chief Financial Officer have submitted a certificate to the Board regarding the financial statements and other matters as required under clause 49 V of the listing agreement.
Corporate Social Responsibility
The Company contributed a sum of Rs 45 million for various philanthropic purposes in the field of education and health-care and also for scientific research.
As part of its commitment to society, the Company has been extending support for improving health and hygiene of the people living in and around some of the company’s plant locations, by conducting free medical and health awareness camps and distributing medicines.
ANNExURES
The directors’ responsibility statement under Section 217(2AA), the particulars relating to energy conservation, technology, research and development and exports as required under Section 217(1)(e), the particulars of employees’ remuneration as required under Section 217(2A) of the Companies Act, 1956 and the information relating to employee stock options to be provided as per the applicable SEBI regulations are annexed to and forms part of this report.
ACKNOWLEDGEMENT
The Board places on record, its appreciation for the cooperation and support received from shareholders, customers, dealers, suppliers, employees, government authorities, banks and joint venture partners.
On behalf of the Board
Chennai M M MURUGAPPAN29th April 2009 Chairman
ANNExURE TO THE REPORT OF THE DIRECTORSGiven as required under the Companies (Disclosure of Particulars in the Report of Board of Directors) Rules, 1988, Companies (Particulars of Employees Rules), 1975 and the Securities and Exchange Board of India (Employees Stock Option and Employees Stock Purchase Scheme) Guidelines 1999
ENERGY CONSERVATION & TECHNOLOGY
Energy Conservation
A sum of Rs.6 million was spent on energy conservation initiatives last year. Apart from several minor initiatives across locations, the major contributors were the efforts to reduce specific energy in manufacture of electro-minerals, installation of energy efficient kiln for grain treatment, burner improvement in kilns, introduction of recuperators and TPM initiatives. The estimated savings from these investments is Rs.12 million per annum.
Measures planned for 2009-10 include heat recovery from kilns, modifications to compressed air systems and lighting systems, burner improvement in boilers and kilns and specific energy reduction in alumina and silicon carbide production. A total investment of Rs. 17 million is planned which is estimated to yield savings of Rs.14 million annually.
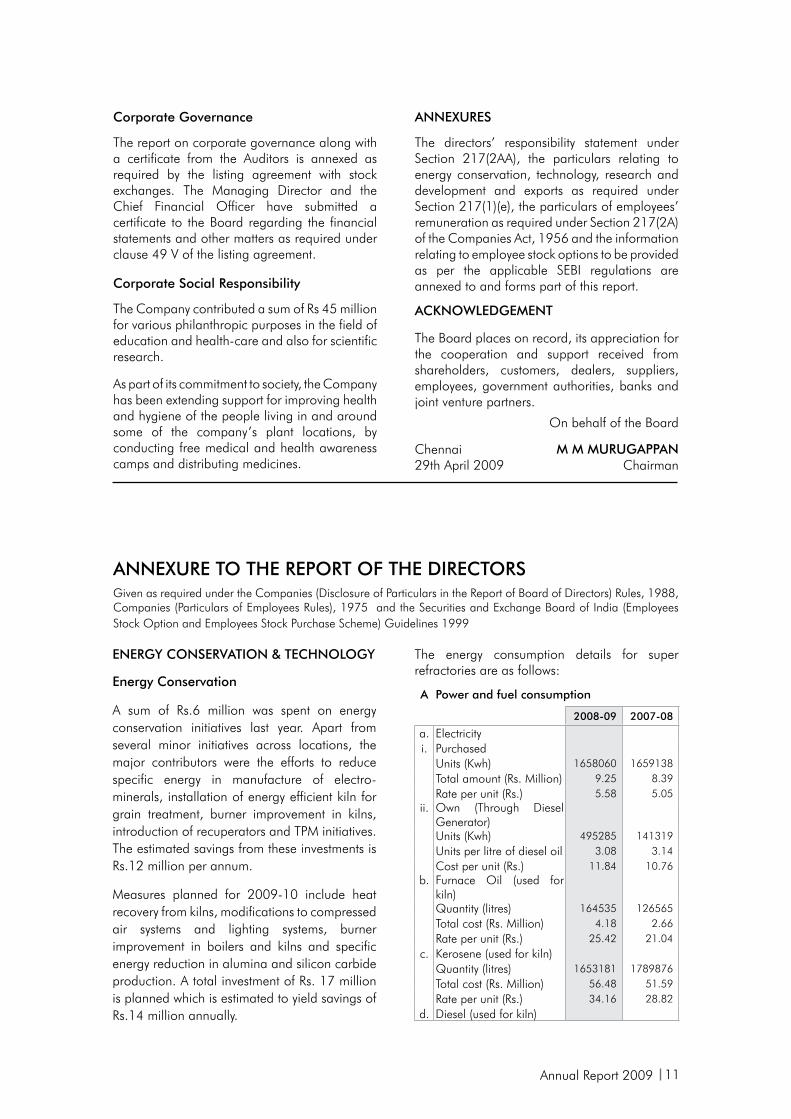
The energy consumption details for super refractories are as follows:
A Power and fuel consumption
2008-09 2007-08
a. Electricity i. Purchased Units (Kwh) 1658060 1659138 Total amount (Rs. Million) 9.25 8.39 Rate per unit (Rs.) 5.58 5.05ii. Own (Through Diesel
Generator)
Units (Kwh) 495285 141319 Units per litre of diesel oil 3.08 3.14 Cost per unit (Rs.) 11.84 10.76b. Furnace Oil (used for
kiln)
Quantity (litres) 164535 126565 Total cost (Rs. Million) 4.18 2.66 Rate per unit (Rs.) 25.42 21.04c. Kerosene (used for kiln) Quantity (litres) 1653181 1789876 Total cost (Rs. Million) 56.48 51.59 Rate per unit (Rs.) 34.16 28.82d. Diesel (used for kiln)
12
applications and wear and corrosion protection in chemically aggressive mining applications.
• Oxidationand thermal shock resistant kilnfurniture system.
• Insulationbrickstoaddressspecialsegmentsfor kiln lining.
Future Plans
Developing new nano-based grinding wheel / coated products, grinding technology for composite materials, establishment of fast firing processes and new binders for grinding wheels will be some of the projects that will be handled by the abrasives business for 2009-10. The electro-minerals business will continue to work on developing shape specific products and high purity powders for niche market segments; the ceramics business will work on ultra fine powders for engineered ceramics and filtration products and also special products for certain niche market segments
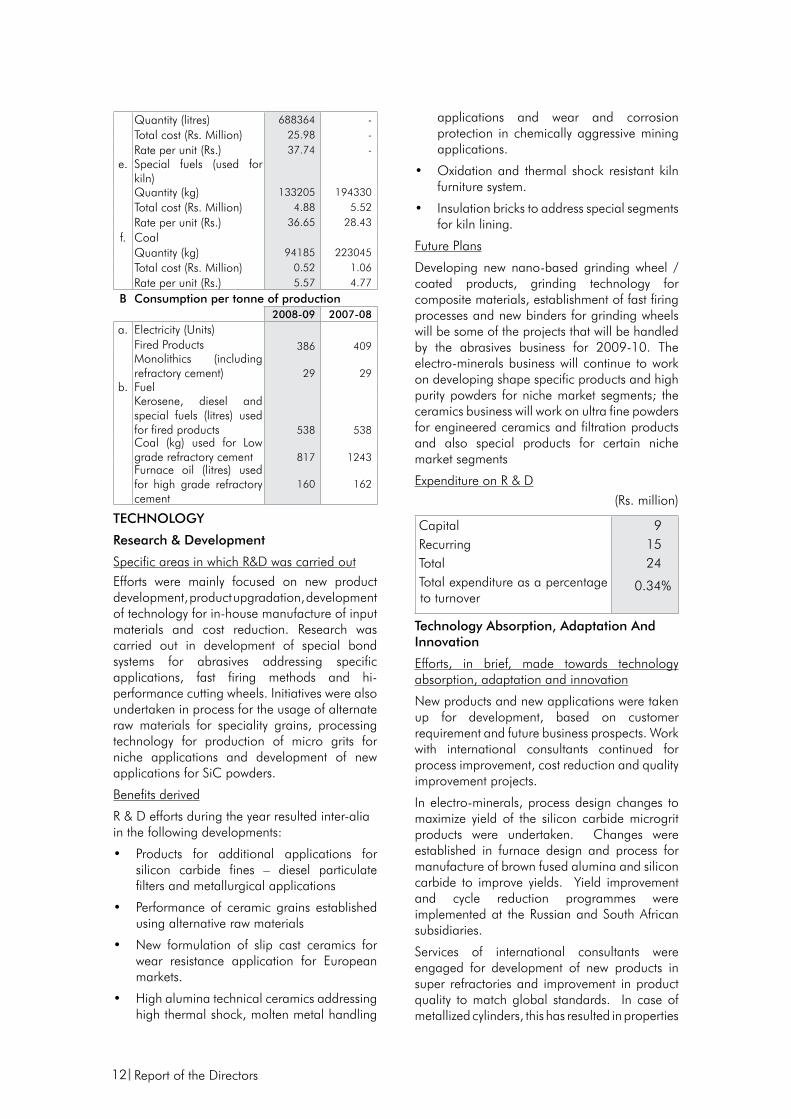
Expenditure on R & D (Rs. million)
Capital 9Recurring 15Total 24Total expenditure as a percentage to turnover
0.34%
Technology Absorption, Adaptation And Innovation
Efforts, in brief, made towards technology absorption, adaptation and innovation
New products and new applications were taken up for development, based on customer requirement and future business prospects. Work with international consultants continued for process improvement, cost reduction and quality improvement projects.
In electro-minerals, process design changes to maximize yield of the silicon carbide microgrit products were undertaken. Changes were established in furnace design and process for manufacture of brown fused alumina and silicon carbide to improve yields. Yield improvement and cycle reduction programmes were implemented at the Russian and South African subsidiaries.
Services of international consultants were engaged for development of new products in super refractories and improvement in product quality to match global standards. In case of metallized cylinders, this has resulted in properties
Quantity (litres) 688364 -Total cost (Rs. Million) 25.98 -Rate per unit (Rs.) 37.74 -
e. Special fuels (used for kiln)
Quantity (kg) 133205 194330 Total cost (Rs. Million) 4.88 5.52 Rate per unit (Rs.) 36.65 28.43f. Coal Quantity (kg) 94185 223045 Total cost (Rs. Million) 0.52 1.06 Rate per unit (Rs.) 5.57 4.77
B Consumption per tonne of production 2008-09 2007-08a. Electricity (Units)
Fired Products 386 409
Monolithics (including refractory cement) 29 29
b. FuelKerosene, diesel and special fuels (litres) used for fired products 538 538Coal (kg) used for Low grade refractory cement 817 1243Furnace oil (litres) used for high grade refractory cement
160 162
TECHNOLOGY
Research & Development
Specific areas in which R&D was carried outEfforts were mainly focused on new product development, product upgradation, development of technology for in-house manufacture of input materials and cost reduction. Research was carried out in development of special bond systems for abrasives addressing specific applications, fast firing methods and hi-performance cutting wheels. Initiatives were also undertaken in process for the usage of alternate raw materials for speciality grains, processing technology for production of micro grits for niche applications and development of new applications for SiC powders.
Benefits derived
R & D efforts during the year resulted inter-alia in the following developments:
• Products for additional applications forsilicon carbide fines – diesel particulate filters and metallurgical applications
• Performanceof ceramic grains establishedusing alternative raw materials
• New formulation of slip cast ceramics forwear resistance application for European markets.
• Highaluminatechnicalceramicsaddressinghigh thermal shock, molten metal handling
Report of the Directors
Annual Report 2009 13
on par/better than global competition. Six sigma projects were initiated at industrial ceramics and stabilized for tile production in order to achieve dimensionally consistent products. Process automation was done in the wear resistant tile plant. The Jabalpur refractories unit offered tailor made customized monolithic products.
Benefits derived as a result of the above efforts, e.g. product / process improvements, cost reduction, product development, import substitution, etc.
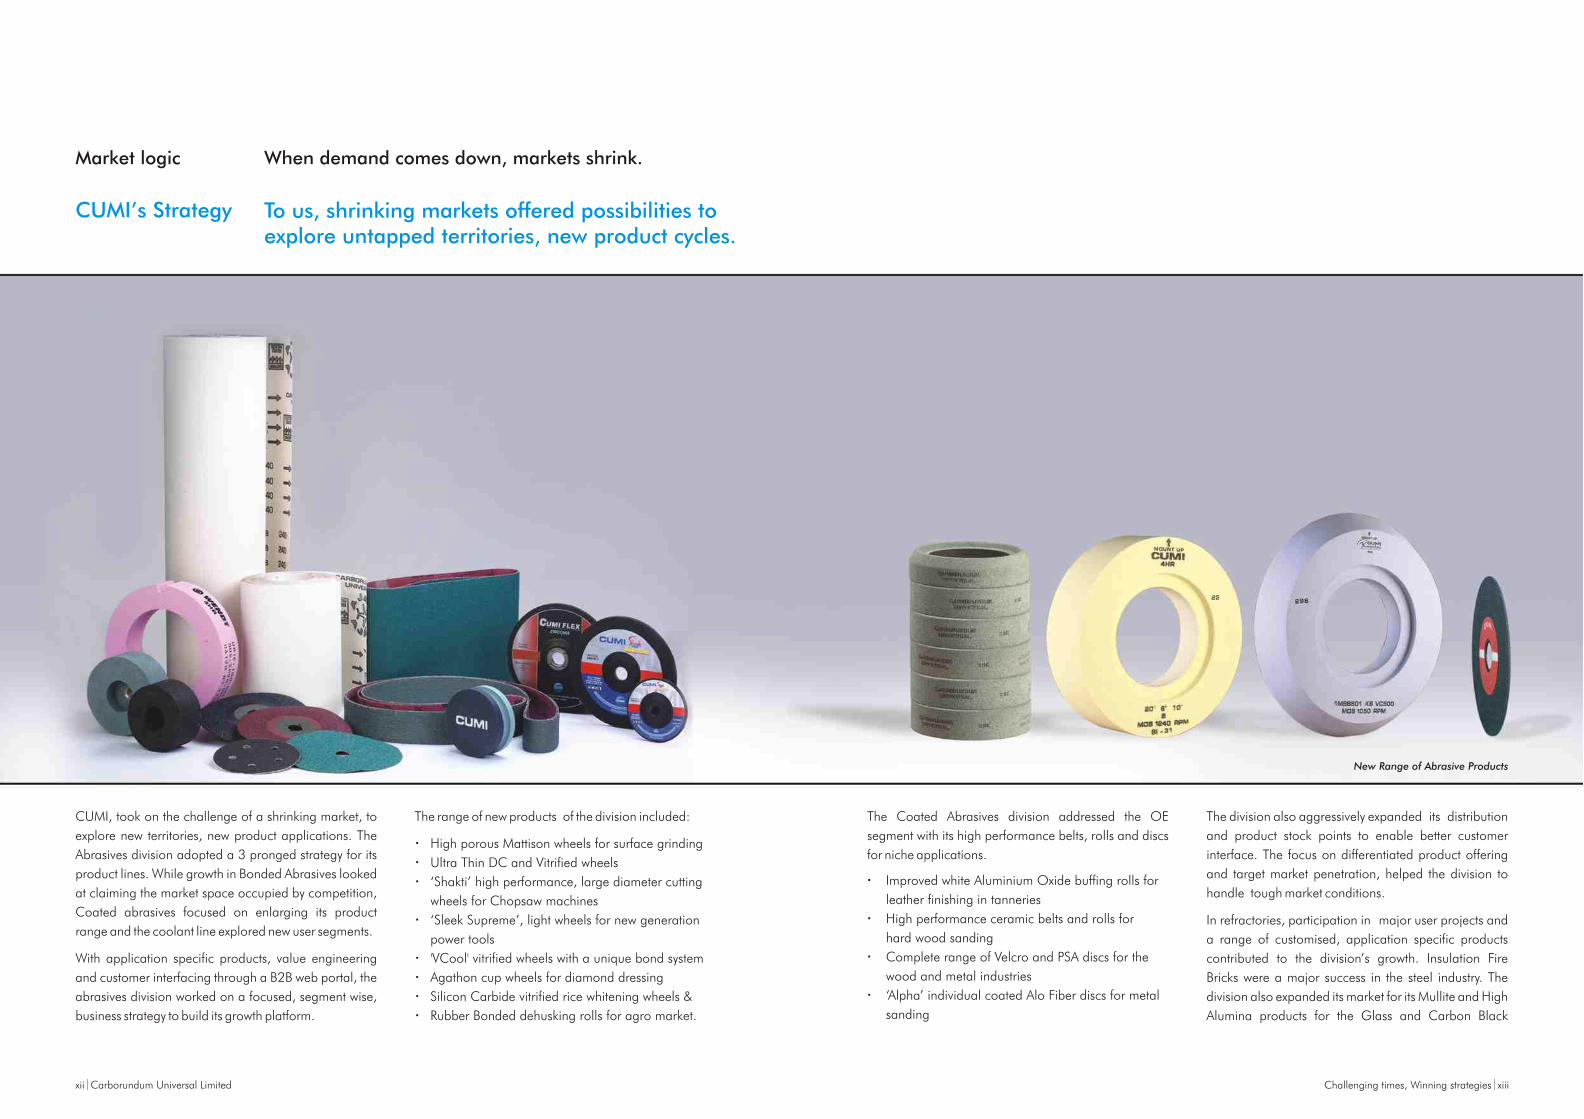
The new product development efforts focused on developing products for customer segment and for the mass market segment. New varieties of rice polishing wheels, high performance cut off wheels, CUMISOL, C cool, Agni range of vitrified products and B99 resin bonds were launched as upgrades. In coated abrasives CUMIZON gold, alpha fibre discs, high performance Zircon sanding discs, Antistatic paper and Velcro discs were launched.
In electrominerals, the division migrated seamlessly to produce new grade of silicon carbide powders for niche industry segments Yield improvements was achieved in brown fused alumina and silicon carbide furnacing processes. The modifications to furnaces in silicon carbide operations yielded cost savings. Yield of crystalline silicon carbide increased by 15 per cent in Volzhsky Abrasive Works, Russia and the cycle time reduced at Foskor Zirconia, South Africa which resulted in good productivity improvement.
In ceramics, six sigma projects and automation has helped to achieve cost reduction and higher sales of wear resistance liner tiles in both domestic and exports market. New products in terms of geometry and scale (imperial scale for North American markets and metric scales for the rest of the world) were manufactured to meet customer requirements. This helped to increase exports sales.
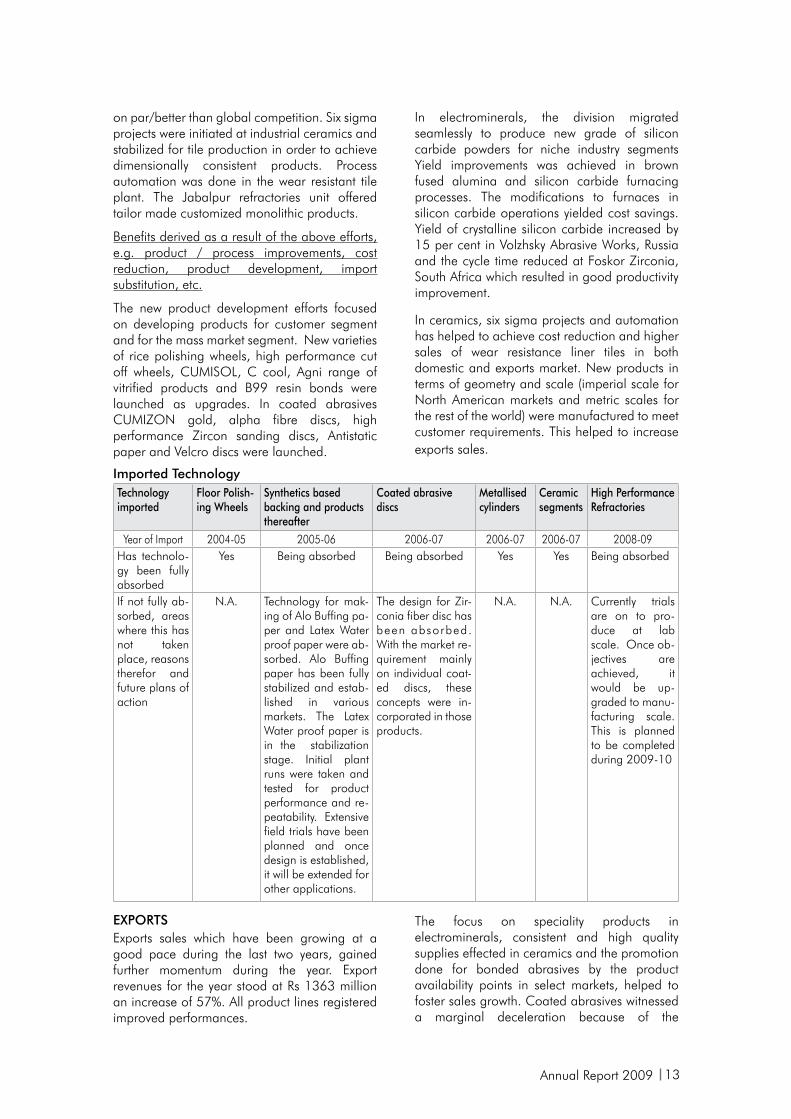
Imported TechnologyTechnology imported
Floor Polish-ing Wheels
Synthetics based backing and products thereafter
Coated abrasive discs
Metallised cylinders
Ceramic segments
High Performance Refractories
Year of Import 2004-05 2005-06 2006-07 2006-07 2006-07 2008-09Has technolo-gy been fully absorbed
Yes Being absorbed Being absorbed Yes Yes Being absorbed
If not fully ab-sorbed, areas where this has not taken place, reasons therefor and future plans of action
N.A. Technology for mak-ing of Alo Buffing pa-per and Latex Water proof paper were ab-sorbed. Alo Buffing paper has been fully stabilized and estab-lished in various markets. The Latex Water proof paper is in the stabilization stage. Initial plant runs were taken and tested for product performance and re-peatability. Extensive field trials have been planned and once design is established, it will be extended for other applications.
The design for Zir-conia fiber disc has been absorbed. With the market re-quirement mainly on individual coat-ed discs, these concepts were in-corporated in those products.
N.A. N.A. Currently trials are on to pro-duce at lab scale. Once ob-jectives are achieved, it would be up-graded to manu-facturing scale. This is planned to be completed during 2009-10
ExPORTSExports sales which have been growing at a good pace during the last two years, gained further momentum during the year. Export revenues for the year stood at Rs 1363 million an increase of 57%. All product lines registered improved performances.
The focus on speciality products in electrominerals, consistent and high quality supplies effected in ceramics and the promotion done for bonded abrasives by the product availability points in select markets, helped to foster sales growth. Coated abrasives witnessed a marginal deceleration because of the
14
continuing lull in the housing market in North America. The Company has been able to capitalize on the growth potential for certain niche market products by timely entry into these product lines. The decision to stock products closer to the customers has been paying good dividends.Construction of world class production facilities for various product lines have helped the Company to gain a reputation as a dependable supplier of quality products. Product and process approvals for ceramics and silicon carbide were received from several new customers. Several relationships were forged and existing relationships strengthened by developing products specific to customer needs. Brand promotion was undertaken by means of
participation in industry specific exhibitions and advertisements in trade journals.
The Company would continue to pursue its goal of becoming an international player of repute. Efforts would be taken to showcase the Company’s capabilities through sales promotion initiatives and referrals. The network of subsidiaries and joint ventures abroad would be leveraged to increase market penetration, reduce delivery lead time and improve customer service.
Rs. millionForeign Exchange Earnings 1402Foreign Exchange Outgo- Raw materials and other payments- Capital Equipment
1375153
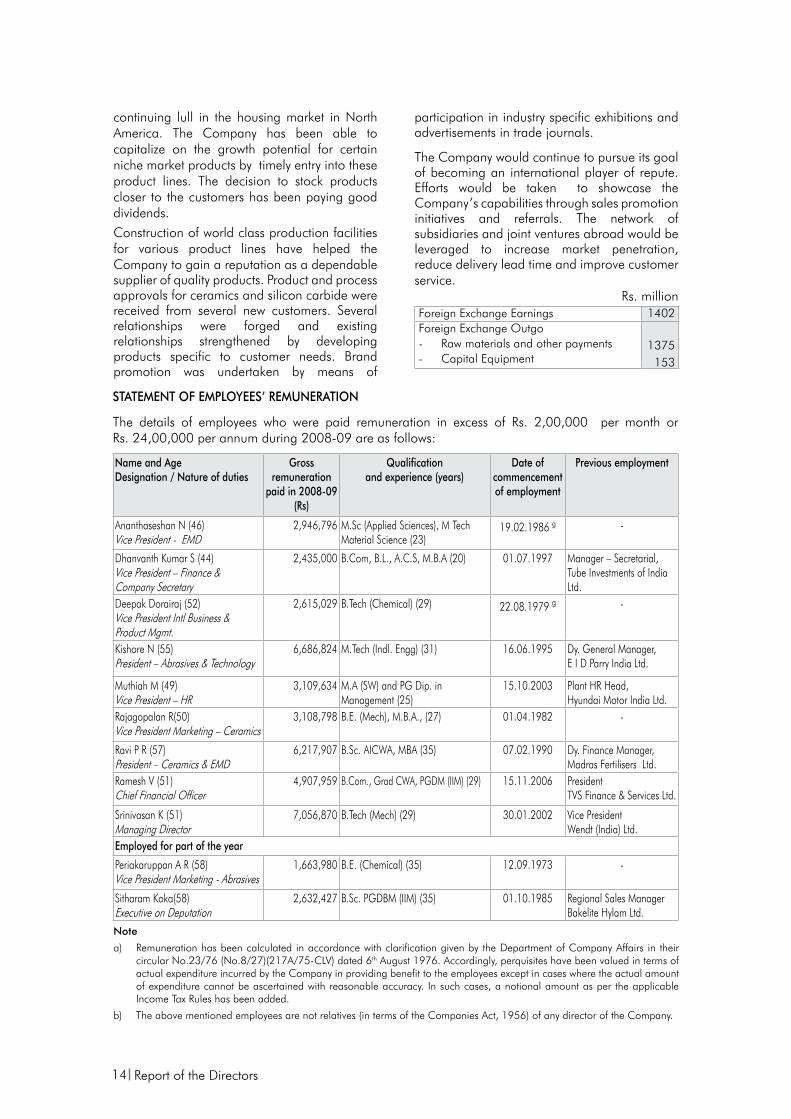
STATEMENT OF EMPLOYEES’ REMUNERATION
The details of employees who were paid remuneration in excess of Rs. 2,00,000 per month or Rs. 24,00,000 per annum during 2008-09 are as follows:
Name and AgeDesignation / Nature of duties
Gross remuneration
paid in 2008-09 (Rs)
Qualificationand experience (years)
Date of commencement of employment
Previous employment
Ananthaseshan N (46)Vice President - EMD
2,946,796 M.Sc (Applied Sciences), M Tech Material Science (23)
19.02.1986 g -
Dhanvanth Kumar S (44)Vice President – Finance &Company Secretary
2,435,000 B.Com, B.L., A.C.S, M.B.A (20) 01.07.1997 Manager – Secretarial, Tube Investments of India Ltd.
Deepak Dorairaj (52)Vice President Intl Business & Product Mgmt.
2,615,029 B.Tech (Chemical) (29) 22.08.1979 g -
Kishore N (55)President – Abrasives & Technology
6,686,824 M.Tech (Indl. Engg) (31) 16.06.1995 Dy. General Manager, E I D Parry India Ltd.
Muthiah M (49) Vice President – HR
3,109,634 M.A (SW) and PG Dip. in Management (25)
15.10.2003 Plant HR Head,Hyundai Motor India Ltd.
Rajagopalan R(50)Vice President Marketing – Ceramics
3,108,798 B.E. (Mech), M.B.A., (27) 01.04.1982 -
Ravi P R (57)President – Ceramics & EMD
6,217,907 B.Sc. AICWA, MBA (35) 07.02.1990 Dy. Finance Manager, Madras Fertilisers Ltd.
Ramesh V (51)Chief Financial Officer
4,907,959 B.Com., Grad CWA, PGDM (IIM) (29) 15.11.2006 PresidentTVS Finance & Services Ltd.
Srinivasan K (51)Managing Director
7,056,870 B.Tech (Mech) (29) 30.01.2002 Vice President Wendt (India) Ltd.
Employed for part of the year
Periakaruppan A R (58)Vice President Marketing - Abrasives
1,663,980 B.E. (Chemical) (35) 12.09.1973 -
Sitharam Koka(58)Executive on Deputation
2,632,427 B.Sc. PGDBM (IIM) (35) 01.10.1985 Regional Sales Manager Bakelite Hylam Ltd.
Note
a) Remuneration has been calculated in accordance with clarification given by the Department of Company Affairs in their circular No.23/76 (No.8/27)(217A/75-CLV) dated 6th August 1976. Accordingly, perquisites have been valued in terms of actual expenditure incurred by the Company in providing benefit to the employees except in cases where the actual amount of expenditure cannot be ascertained with reasonable accuracy. In such cases, a notional amount as per the applicable Income Tax Rules has been added.
b) The above mentioned employees are not relatives (in terms of the Companies Act, 1956) of any director of the Company.
Report of the Directors
Annual Report 2009 15
c) (i) The persons mentioned above are wholetime employees of the company.
(ii) Mr. K Srinivasan, who is also a wholetime employee, was appointed as Managing Director by the shareholders from 1.2.2006 till 31.1.2010. He is subject to all service conditions as applicable to any other employee of the Company.
(iii) The nature of employment of all employees is contractual and terminable with 3 months notice.
d) No employee of the Company is covered by the provisions of Sec.217(2A)(a)(iii) of the Companies Act, 1956
e) The remuneration details are for the year 2008-09 and all other particulars are as on 31.3.2009.
f) Actuarial valuation for gratuity liability and compensated absences is done for the Company as a whole. Therefore the amount attributable to compensated absences is not included in the above. In case of contribution for gratuity liability, a notional sum has been reckoned.
g) Date of joining as gradutate engineer trainee.
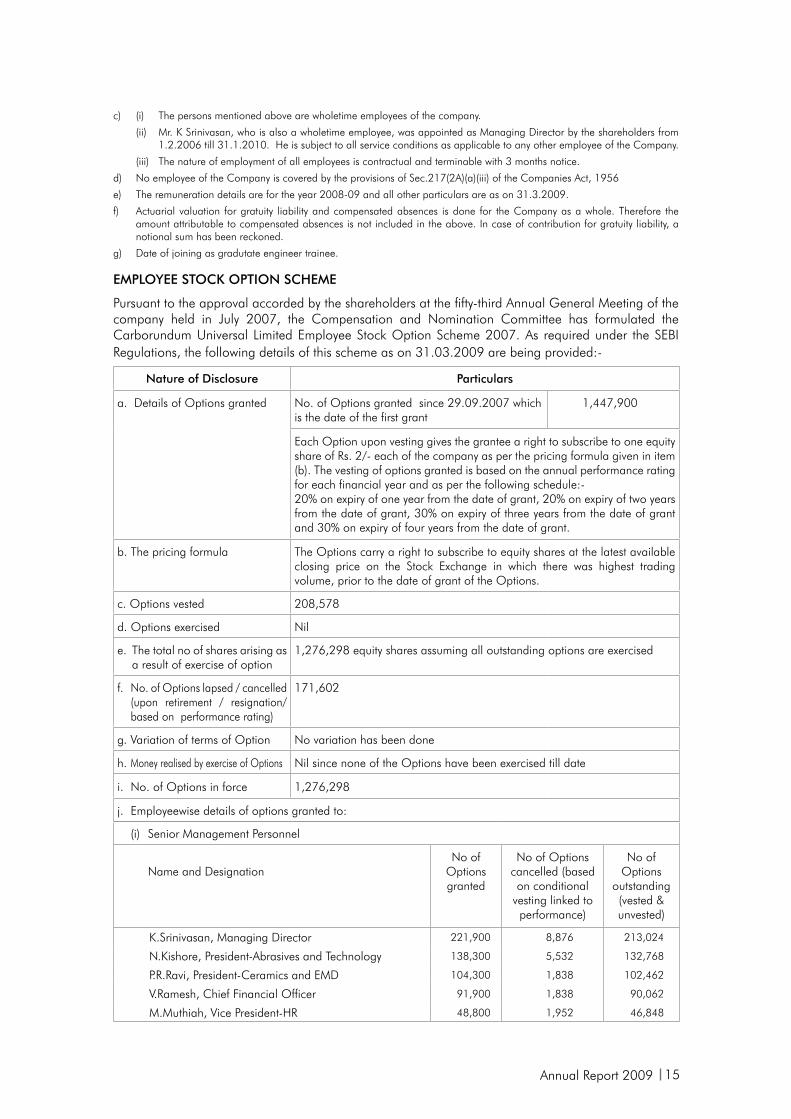
EMPLOYEE STOCK OPTION SCHEME
Pursuant to the approval accorded by the shareholders at the fifty-third Annual General Meeting of the company held in July 2007, the Compensation and Nomination Committee has formulated the Carborundum Universal Limited Employee Stock Option Scheme 2007. As required under the SEBI Regulations, the following details of this scheme as on 31.03.2009 are being provided:-
Nature of Disclosure Particulars
a. Details of Options granted No. of Options granted since 29.09.2007 which is the date of the first grant
1,447,900
Each Option upon vesting gives the grantee a right to subscribe to one equity share of Rs. 2/- each of the company as per the pricing formula given in item (b). The vesting of options granted is based on the annual performance rating for each financial year and as per the following schedule:- 20% on expiry of one year from the date of grant, 20% on expiry of two years from the date of grant, 30% on expiry of three years from the date of grant and 30% on expiry of four years from the date of grant.
b. The pricing formula The Options carry a right to subscribe to equity shares at the latest available closing price on the Stock Exchange in which there was highest trading volume, prior to the date of grant of the Options.
c. Options vested 208,578
d. Options exercised Nil
e. The total no of shares arising as a result of exercise of option
1,276,298 equity shares assuming all outstanding options are exercised
f. No. of Options lapsed / cancelled (upon retirement / resignation/based on performance rating)
171,602
g. Variation of terms of Option No variation has been done
h. Money realised by exercise of Options Nil since none of the Options have been exercised till date
i. No. of Options in force 1,276,298
j. Employeewise details of options granted to:
(i) Senior Management Personnel
Name and DesignationNo of
Options granted
No of Options cancelled (based on conditional
vesting linked to performance)
No of Options
outstanding (vested & unvested)
K.Srinivasan, Managing Director 221,900 8,876 213,024
N.Kishore, President-Abrasives and Technology 138,300 5,532 132,768
P.R.Ravi, President-Ceramics and EMD 104,300 1,838 102,462
V.Ramesh, Chief Financial Officer 91,900 1,838 90,062
M.Muthiah, Vice President-HR 48,800 1,952 46,848
16
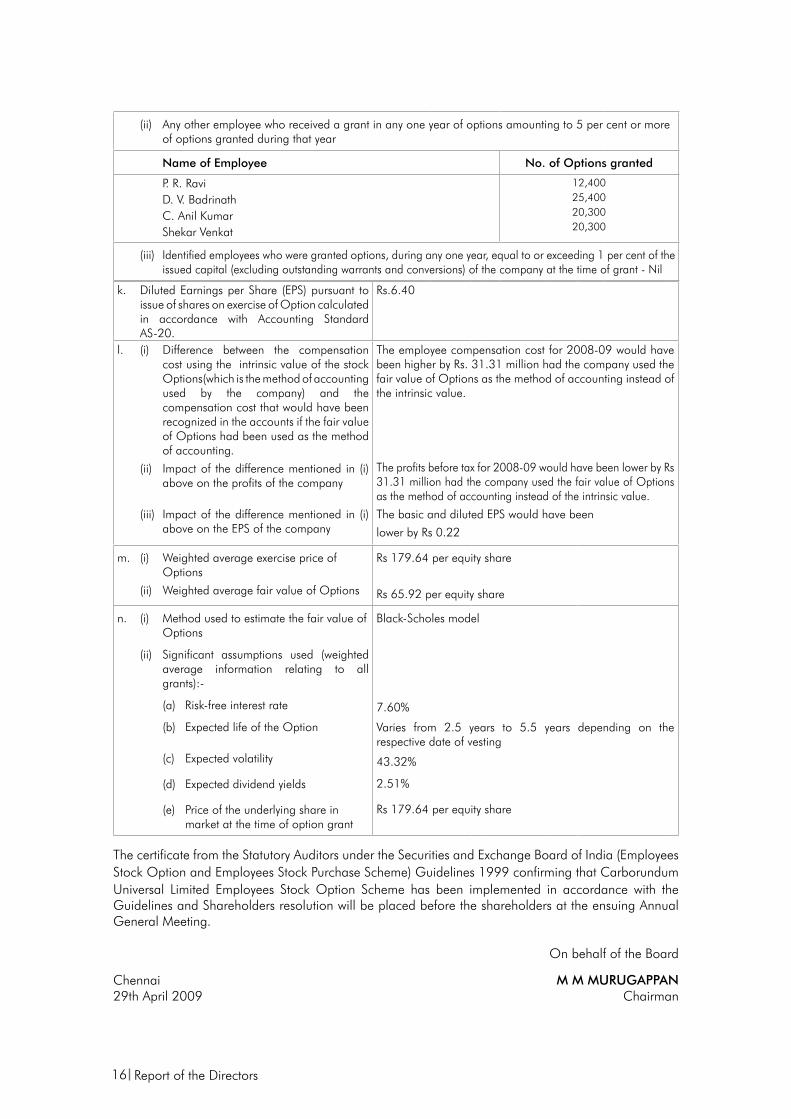
k. Diluted Earnings per Share (EPS) pursuant to issue of shares on exercise of Option calculated in accordance with Accounting Standard AS-20.
Rs.6.40
l. (i) Difference between the compensation cost using the intrinsic value of the stock Options(which is the method of accounting used by the company) and the compensation cost that would have been recognized in the accounts if the fair value of Options had been used as the method of accounting.
(ii) Impact of the difference mentioned in (i) above on the profits of the company
(iii) Impact of the difference mentioned in (i) above on the EPS of the company
The employee compensation cost for 2008-09 would have been higher by Rs. 31.31 million had the company used the fair value of Options as the method of accounting instead of the intrinsic value.
The profits before tax for 2008-09 would have been lower by Rs 31.31 million had the company used the fair value of Options as the method of accounting instead of the intrinsic value.
The basic and diluted EPS would have been
lower by Rs 0.22
m. (i) Weighted average exercise price of Options
(ii) Weighted average fair value of Options
Rs 179.64 per equity share
Rs 65.92 per equity share
n. (i) Method used to estimate the fair value of Options
(ii) Significant assumptions used (weighted average information relating to all grants):-
(a) Risk-free interest rate
(b) Expected life of the Option
(c) Expected volatility
(d) Expected dividend yields
(e) Price of the underlying share in market at the time of option grant
Black-Scholes model
7.60%
Varies from 2.5 years to 5.5 years depending on the respective date of vesting
43.32%
2.51%
Rs 179.64 per equity share
The certificate from the Statutory Auditors under the Securities and Exchange Board of India (Employees Stock Option and Employees Stock Purchase Scheme) Guidelines 1999 confirming that Carborundum Universal Limited Employees Stock Option Scheme has been implemented in accordance with the Guidelines and Shareholders resolution will be placed before the shareholders at the ensuing Annual General Meeting.
On behalf of the Board
Chennai M M MURUGAPPAN29th April 2009 Chairman
Report of the Directors
(ii) Any other employee who received a grant in any one year of options amounting to 5 per cent or more of options granted during that year
Name of Employee No. of Options granted
P. R. RaviD. V. Badrinath C. Anil KumarShekar Venkat
12,40025,40020,30020,300
(iii) Identified employees who were granted options, during any one year, equal to or exceeding 1 per cent of the issued capital (excluding outstanding warrants and conversions) of the company at the time of grant - Nil
Annual Report 2009 17
The Directors have pleasure in presenting the Corporate Governance Report for the year ended 31st March 2009.
1. The Company’s Corporate Governance Philosophy
Carborundum Universal Limited (“CUMI”), as a constituent of the Murugappa Group, is committed to high standards of corporate governance in all its activities and processes. CUMI looks at corporate governance as the cornerstone for sustained superior financial performance and for serving all its stakeholders. Apart from drawing from the various legal provisions, the group practices are continuously benchmarked with industry practices. The entire process begins with the functioning of the Board of Directors, with leading professionals and experts serving as independent directors and represented in various Board Committees. Systematic attempt is made to ensure symmetry of information.
Key elements in corporate governance are transparency, internal controls, risk man-agement, internal/external communications and good standards of safety and health. The Board has empowered responsible per-sons to its broad policies and guidelines and has set up adequate review processes.
2. Board of Directors
a) Composition
The Board comprised of 8 members as on 31st March 2009. The Board has been constituted in a manner, which will result in an appropriate mix of executive and independent directors. This has been done to preserve the independence of the Board
and to separate the Board functions of governance and management.
b) Board Meetings
The Board has a formal schedule of matters reserved for its consideration and decision. These include setting performance targets, reviewing performance, approving investments, ensuring adequate availability of financial resources overseeing risk management and reporting to the shareholders.
The board periodically reviews the compliance of all applicable laws and gives appropriate directions wherever necessary.
The board has laid-down a “Code of Conduct” for all the board members and the senior management of the company. Annual declaration is obtained from every person covered by the Code of Conduct. A declaration to this effect signed by the Managing Director is attached to this report.
The Company has laid down procedures to inform Board members about the risk assessment and minimisation procedures. The Board reviews the significant business risks identified by the management and the mitigation process being taken up.
The Board also reviews the board meeting minutes and financial statements of subsidiary companies, and also their significant transactions.
Five Board Meetings were held during the year on 30th April 2008, 24th July 2008, 24th October 2008, 27th January 2009 and 23rd March 2009.
REPORT ON CORPORATE GOVERNANCE
(Pursuant to clause 49 of the Listing Agreement)
18
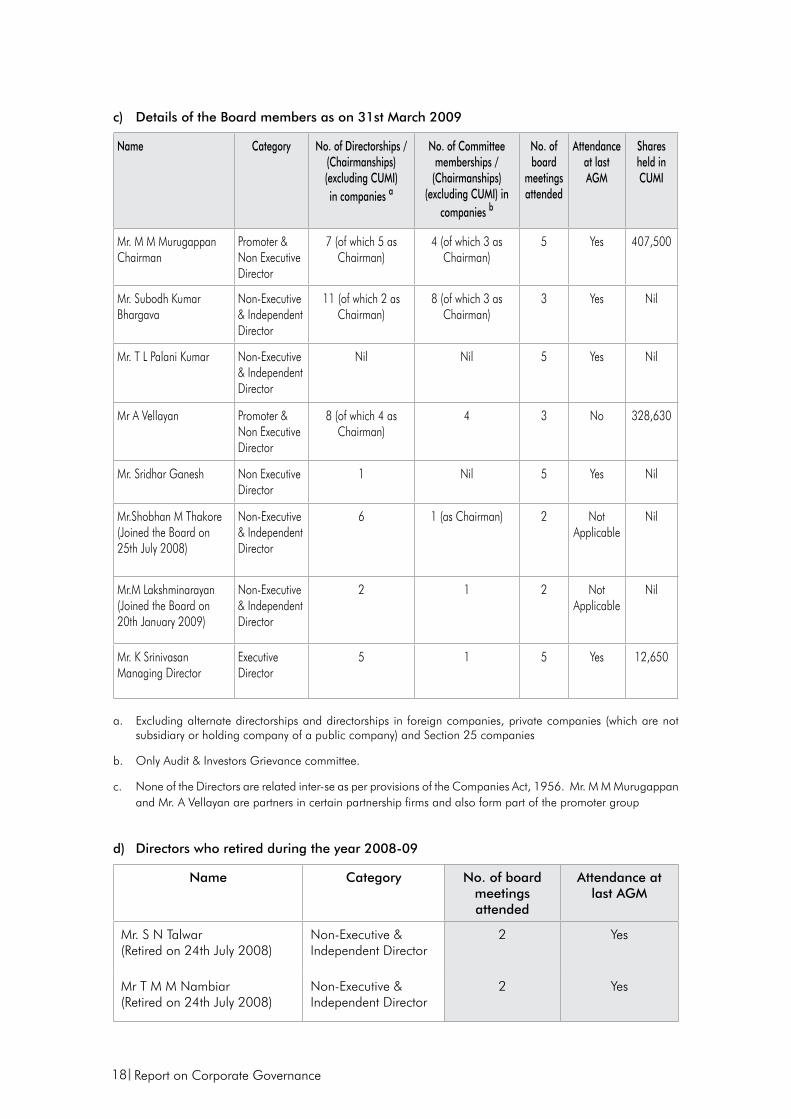
c) Details of the Board members as on 31st March 2009
Name Category No. of Directorships / (Chairmanships)(excluding CUMI) in companies a
No. of Committee memberships /
(Chairmanships) (excluding CUMI) in
companies b
No. of board
meetings attended
Attendance at last AGM
Shares held in CUMI
Mr. M M Murugappan Chairman
Promoter & Non Executive Director
7 (of which 5 as Chairman)
4 (of which 3 as Chairman)
5 Yes 407,500
Mr. Subodh Kumar Bhargava
Non-Executive & Independent Director
11 (of which 2 as Chairman)
8 (of which 3 as Chairman)
3 Yes Nil
Mr. T L Palani Kumar Non-Executive & Independent Director
Nil Nil 5 Yes Nil
Mr A Vellayan Promoter & Non Executive Director
8 (of which 4 as Chairman)
4 3 No 328,630
Mr. Sridhar Ganesh Non Executive Director
1 Nil 5 Yes Nil
Mr.Shobhan M Thakore(Joined the Board on 25th July 2008)
Non-Executive & Independent Director
6 1 (as Chairman) 2 Not Applicable
Nil
Mr.M Lakshminarayan(Joined the Board on 20th January 2009)
Non-Executive & Independent Director
2 1 2 Not Applicable
Nil
Mr. K Srinivasan Managing Director
Executive Director
5 1 5 Yes 12,650
a. Excluding alternate directorships and directorships in foreign companies, private companies (which are not subsidiary or holding company of a public company) and Section 25 companies
b. Only Audit & Investors Grievance committee.
c. None of the Directors are related inter-se as per provisions of the Companies Act, 1956. Mr. M M Murugappan and Mr. A Vellayan are partners in certain partnership firms and also form part of the promoter group
d) Directors who retired during the year 2008-09
Name Category No. of board meetings attended
Attendance at last AGM
Mr. S N Talwar(Retired on 24th July 2008)
Non-Executive & Independent Director
2 Yes
Mr T M M Nambiar (Retired on 24th July 2008)
Non-Executive & Independent Director
2 Yes
Report on Corporate Governance
Annual Report 2009 19
The resume, nature of expertise and directorships and committee memberships of the directors proposed for appointment/reappointment at the forthcoming Annual General Meeting are given in the Notice of the meeting.
3. Board Committees
The Board has set up the following Committees as per the requirements of the stock exchanges:
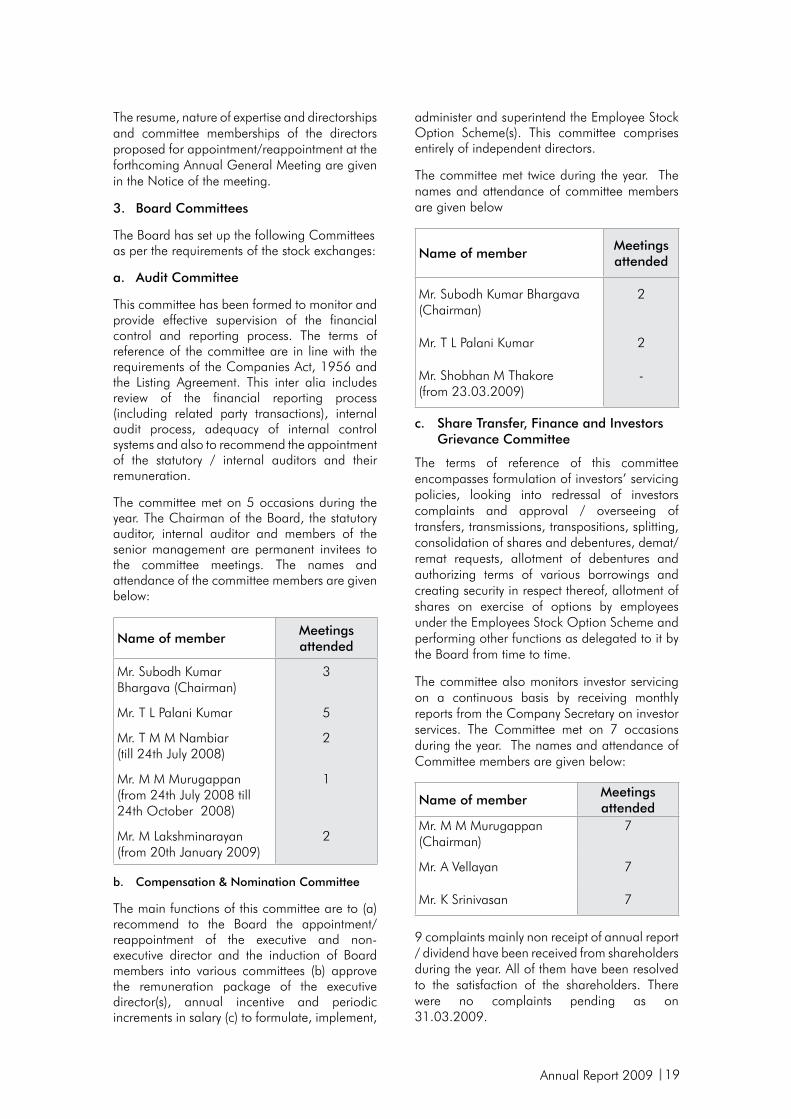
a. Audit Committee
This committee has been formed to monitor and provide effective supervision of the financial control and reporting process. The terms of reference of the committee are in line with the requirements of the Companies Act, 1956 and the Listing Agreement. This inter alia includes review of the financial reporting process (including related party transactions), internal audit process, adequacy of internal control systems and also to recommend the appointment of the statutory / internal auditors and their remuneration.
The committee met on 5 occasions during the year. The Chairman of the Board, the statutory auditor, internal auditor and members of the senior management are permanent invitees to the committee meetings. The names and attendance of the committee members are given below:
Name of memberMeetings attended
Mr. Subodh Kumar Bhargava (Chairman)
3
Mr. T L Palani Kumar 5
Mr. T M M Nambiar (till 24th July 2008)
2
Mr. M M Murugappan (from 24th July 2008 till 24th October 2008)
1
Mr. M Lakshminarayan (from 20th January 2009)
2
b. Compensation & Nomination Committee
The main functions of this committee are to (a) recommend to the Board the appointment/reappointment of the executive and non-executive director and the induction of Board members into various committees (b) approve the remuneration package of the executive director(s), annual incentive and periodic increments in salary (c) to formulate, implement,
administer and superintend the Employee Stock Option Scheme(s). This committee comprises entirely of independent directors.
The committee met twice during the year. The names and attendance of committee members are given below
Name of member Meetings attended
Mr. Subodh Kumar Bhargava (Chairman)
2
Mr. T L Palani Kumar 2
Mr. Shobhan M Thakore (from 23.03.2009)
-
c. Share Transfer, Finance and Investors Grievance Committee
The terms of reference of this committee encompasses formulation of investors’ servicing policies, looking into redressal of investors complaints and approval / overseeing of transfers, transmissions, transpositions, splitting, consolidation of shares and debentures, demat/remat requests, allotment of debentures and authorizing terms of various borrowings and creating security in respect thereof, allotment of shares on exercise of options by employees under the Employees Stock Option Scheme and performing other functions as delegated to it by the Board from time to time.
The committee also monitors investor servicing on a continuous basis by receiving monthly reports from the Company Secretary on investor services. The Committee met on 7 occasions during the year. The names and attendance of Committee members are given below:
Name of member Meetings attended
Mr. M M Murugappan (Chairman)
7
Mr. A Vellayan 7
Mr. K Srinivasan 7
9 complaints mainly non receipt of annual report / dividend have been received from shareholders during the year. All of them have been resolved to the satisfaction of the shareholders. There were no complaints pending as on 31.03.2009.
20
The Board has appointed Mr. S Dhanvanth Kumar, Company Secretary as the Compliance Officer for the purpose of compliance with the requirements of the Listing Agreement.4. Directors’ Remuneration a. PolicyThe compensation of the managing director comprises of a fixed component and a performance incentive based on certain pre-agreed parameters. The compensation is determined based on level of responsibility and scales prevailing in the industry. The managing director is not paid sitting fees for any Board / Committee meetings attended by him.
The compensation of the non-executive directors takes the form of commission on profits. Though the shareholders have approved payment of
commission upto 1% of net profits of the Company for each year calculated as per the provisions of the Companies Act, 1956, the actual commission paid to the directors is restricted to a fixed sum. This sum is reviewed periodically taking into consideration various factors such as performance of the Company, time spent by the directors for attending to the affairs and business of the company and extent of responsibilities cast on directors under general law and other relevant factors. Further the aggregate commission paid to all non-executive directors is within the limit of 1% of the net profits as approved by the shareholders. The non-executive directors are also paid sitting fees within the limits set by government regulations for every Board / Committee meeting attended by them.
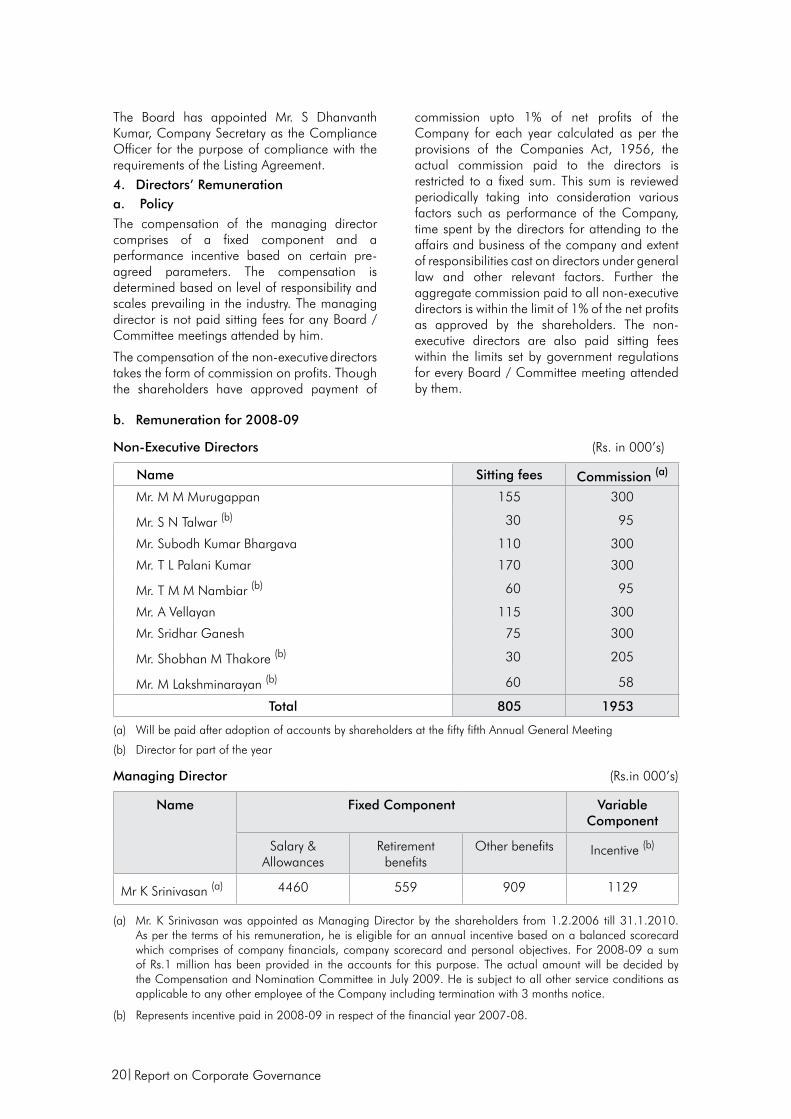
b. Remuneration for 2008-09
Non-Executive Directors (Rs. in 000’s)
Name Sitting fees Commission (a)
Mr. M M Murugappan 155 300
Mr. S N Talwar (b) 30 95
Mr. Subodh Kumar Bhargava 110 300
Mr. T L Palani Kumar 170 300
Mr. T M M Nambiar (b) 60 95
Mr. A Vellayan 115 300
Mr. Sridhar Ganesh 75 300
Mr. Shobhan M Thakore (b) 30 205
Mr. M Lakshminarayan (b) 60 58
Total 805 1953
(a) Will be paid after adoption of accounts by shareholders at the fifty fifth Annual General Meeting
(b) Director for part of the year
Managing Director (Rs.in 000’s)
Name Fixed Component Variable Component
Salary & Allowances
Retirement benefits
Other benefits Incentive (b)
Mr K Srinivasan (a) 4460 559 909 1129
(a) Mr. K Srinivasan was appointed as Managing Director by the shareholders from 1.2.2006 till 31.1.2010. As per the terms of his remuneration, he is eligible for an annual incentive based on a balanced scorecard which comprises of company financials, company scorecard and personal objectives. For 2008-09 a sum of Rs.1 million has been provided in the accounts for this purpose. The actual amount will be decided by the Compensation and Nomination Committee in July 2009. He is subject to all other service conditions as applicable to any other employee of the Company including termination with 3 months notice.
(b) Represents incentive paid in 2008-09 in respect of the financial year 2007-08.
Report on Corporate Governance
Annual Report 2009 21
No. of options granted
2,21,900 options (each option being exercisable into one equity share of Rs. 2/- each) were granted on 29th September 2007
Exercise Price Rs. 183.60 being the market price
Vesting Schedule The number of options that would vest is based on the annual performance rating for each financial year and as per the following schedule:-
% of the total number of options
Date of vesting
20% One year from the date of grant
20% Two years from the date of grant
30% Three years from the date of grant
30% Four years from the date of grant
Exercise period Within 3 years from the date of vesting of the respective option, in one or more instalments
5. General Body Meetingsa. Last 3 Annual General Meetings
Year Date Time Venue
2005-2006 24.07.2006 3.30 PM T T K Auditorium, The Music Academy, 168 (Old No.306) T T K Road, Royapettah, Chennai 600 014
2006-2007 27.07.2007 3.30 PM - do -
2007-2008 24.07.2008 3.00 PM Tamil Isai Sangham,Rajah Annamalai Mandram5 Esplanade Road, Chennai 600 108
b. Special Resolutions passed during the last three Annual General Meetings
Sl.No. Item of business Passed on
1 Issue of Employee Stock Options 27.07.2007
2 Payment of commission to Non-Wholetime Directors 24.07.2008
The details of options granted to Mr. K Srinivasan under the “Carborundum Universal Limited Employees Stock Option Scheme 2007” are as follows:
c. Special Resolution passed by Postal Ballot since 1st April 2008
No special resolutions were passed by postal ballot since 1st April 2008.
6. Disclosures
a. There were no materially significant related party transactions during the year having conflict with the interests of the Company.
b. There have been no non-compliance by the Company or penalty or stricture imposed on the Company by the Stock Exchange or SEBI or any statutory authority, on any matter related to capital markets, during the last 3 years.
c. The Company has established a whistle blower mechanism to provide an avenue to raise concerns, in line with the Company commitment to the highest possible standards of ethical, moral and
22
legal business conduct. The mechanism also provides for adequate safeguards against victimization of employees who avail of the mechanism and also for appointment of an Ombudsperson who will deal with the complaints received. The policy also lays down the process to be followed for dealing with complaints and in exceptional cases, also provides for direct appeal to the Chairperson of the Audit Committee. We further affirm that during the year, no employee has been denied access to the audit committee.
7. Means of Communication
The quarterly unaudited financial results and the annual audited financial results are normally published in Business Standard and Makkal Kural. Press releases are given to all important dailies. The financial results, press releases and presentations made to institutional investors / analysts are posted on the Company’s website i.e. www.cumi.murugappa.com The financial results are posted on SEBI’s website i.e.www.sebiedifar.nic.in.
8. Management’s Discussion & Analysis Report
In order to avoid duplication and overlap between the Directors Report and a separate Management Discussion & Analysis Report, the information required to be provided has
been given in the Directors Report itself as permitted by the listing agreement.
9. Non Mandatory Requirements
(i) The Board has constituted a Compensation and Nomination Committee. The terms of reference of this Committee is given in para 3 (b) above.
(ii) Half yearly financial results were sent to individual household of shareholders for the six months ended 30th September 2008.
(iii) The Company has put in place a Whistle Blower mechanism.
(iv) The Company’s financial statements do not carry any qualifications by Auditors.
(v) The expenses incurred by the Chairman in performance of his duties are reimbursed.
Other non-mandatory requirements have not been adopted at present.
10. General Shareholder Information
This is annexed.
On behalf of the Board
Chennai M M MURUGAPPAN29th April 2009 Chairman
Declaration on Code of Conduct
To
The Members of Carborundum Universal Limited
This is to confirm that the Board has laid down a code of conduct for all Board members and senior management of the company. It is further confirmed that all directors and senior management personnel of the company have affirmed compliance with the Code of Conduct of the company as at 31st March 2009, as envisaged in clause 49 of the Listing Agreement with stock exchanges.
Chennai K Srinivasan29th April 2009 Managing Director
Report on Corporate Governance
Annual Report 2009 23
General Shareholder Information1. Registered Office of the Company
“Parry House”, 43 Moore Street, Chennai 600 001
2. Forthcoming Annual General Meeting
Friday, the 31st July 2009 at 3.00 p.m. at T T K Auditorium, The Music Academy, 168 (Old No.306), T T K Road, Royapettah, Chennai 600 014. Last date for receipt of proxy forms: 29th July 2009.
3. Financial Year
1st April to 31st March
4. Book Closure Dates
Friday, the 17th July 2009 to Friday, the 31st July 2009 (both days inclusive).
5. Share Capital
The paid up capital of the Company was Rs. 186,708,000 comprising 93,354,000 equity shares of Rs.2/- each.
6. Dividend
The Board of Directors have recommended a dividend of Rs.2/- per equity share of Rs.2/- each and the same will be paid after approval at the Annual General Meeting. The warrants will be posted by 7th August 2009. In case of shareholders opting for ECS, the dividend would in the normal course be credited to their accounts by 7th August 2009.
Instructions to shareholders
a) Shareholders holding shares in physical form
Requests for change of address must be sent to the Company’s registrar, M/s Karvy Computershare Private Limited, not later than 17th July 2009 to enable them to forward the dividend warrants to the latest address. Members are also advised to intimate M/s Karvy Computershare Private Limited the details of their bank account to enable the same to be incorporated in the dividend warrants. This would help to prevent any fraudulent encashment of the dividend warrants.
b) Shareholders holding shares in demat form
In respect of shareholders who have provided relevant bank account details to their DPs and who reside in Ahmedabad, Bangalore, Bhubaneswar, Chandigarh, Chennai, Hyderabad, Jaipur, Kanpur, Kolkata, Mumbai, Nagpur, New Delhi, Guwahati, Patna and Trivandrum and any other centres as decided in consultation with the bankers, the dividend would be remitted by ECS to their bank account. The Company would send a remittance advice after payment of dividend by ECS.
In respect of shareholders residing in other centres, the bank account details furnished by their Depository Participants (DPs) would be incorporated in the dividend warrants and these would be mailed to their residence. If there is any change in bank account details or the address particulars, shareholders are requested to advice their DPs immediately about the change.
7. Listing on stock exchanges and stock code
Stock Exchange Stock Code
National Stock Exchange of India Ltd. Exchange Plaza, Bandra-Kurla Complex Bandra (E) Mumbai 400 051 CARBORUNIV
Bombay Stock Exchange Ltd. Phiroze Jeejeebhoy Towers, Dalal Street, Mumbai 400 001 513375
Madras Stock Exchange Ltd. Exchange Building, Post Box No. 183, 11 Second Line Beach, Chennai 600 001 CRB
Annual listing fees has been paid to the above stock exchanges.
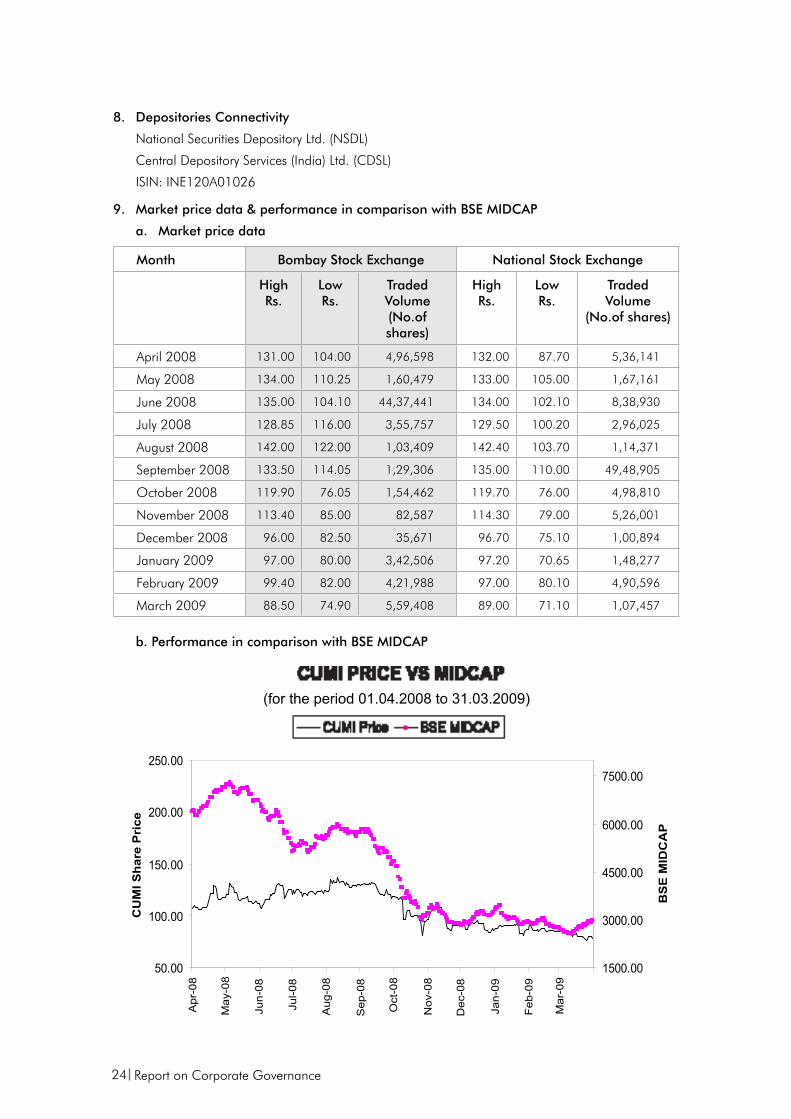
24
8. Depositories Connectivity
National Securities Depository Ltd. (NSDL)
Central Depository Services (India) Ltd. (CDSL)
ISIN: INE120A01026
9. Market price data & performance in comparison with BSE MIDCAP
a. Market price data
Month Bombay Stock Exchange National Stock Exchange
HighRs.
LowRs.
Traded Volume (No.of shares)
HighRs.
LowRs.
Traded Volume
(No.of shares)
April 2008 131.00 104.00 4,96,598 132.00 87.70 5,36,141
May 2008 134.00 110.25 1,60,479 133.00 105.00 1,67,161
June 2008 135.00 104.10 44,37,441 134.00 102.10 8,38,930
July 2008 128.85 116.00 3,55,757 129.50 100.20 2,96,025
August 2008 142.00 122.00 1,03,409 142.40 103.70 1,14,371
September 2008 133.50 114.05 1,29,306 135.00 110.00 49,48,905
October 2008 119.90 76.05 1,54,462 119.70 76.00 4,98,810
November 2008 113.40 85.00 82,587 114.30 79.00 5,26,001
December 2008 96.00 82.50 35,671 96.70 75.10 1,00,894
January 2009 97.00 80.00 3,42,506 97.20 70.65 1,48,277
February 2009 99.40 82.00 4,21,988 97.00 80.10 4,90,596
March 2009 88.50 74.90 5,59,408 89.00 71.10 1,07,457
b. Performance in comparison with BSE MIDCAP
Report on Corporate Governance
50.00
100.00
150.00
200.00
250.00
Apr
-08
May
-08
Jun-
08
Jul-0
8
Aug
-08
Sep
-08
Oct
-08
Nov
-08
Dec
-08
Jan-
09
Feb
-09
Mar
-09
CU
MI S
hare
Pri
ce
1500.00
3000.00
4500.00
6000.00
7500.00
BS
E M
IDC
AP
CUMI Price BSE MIDCAP
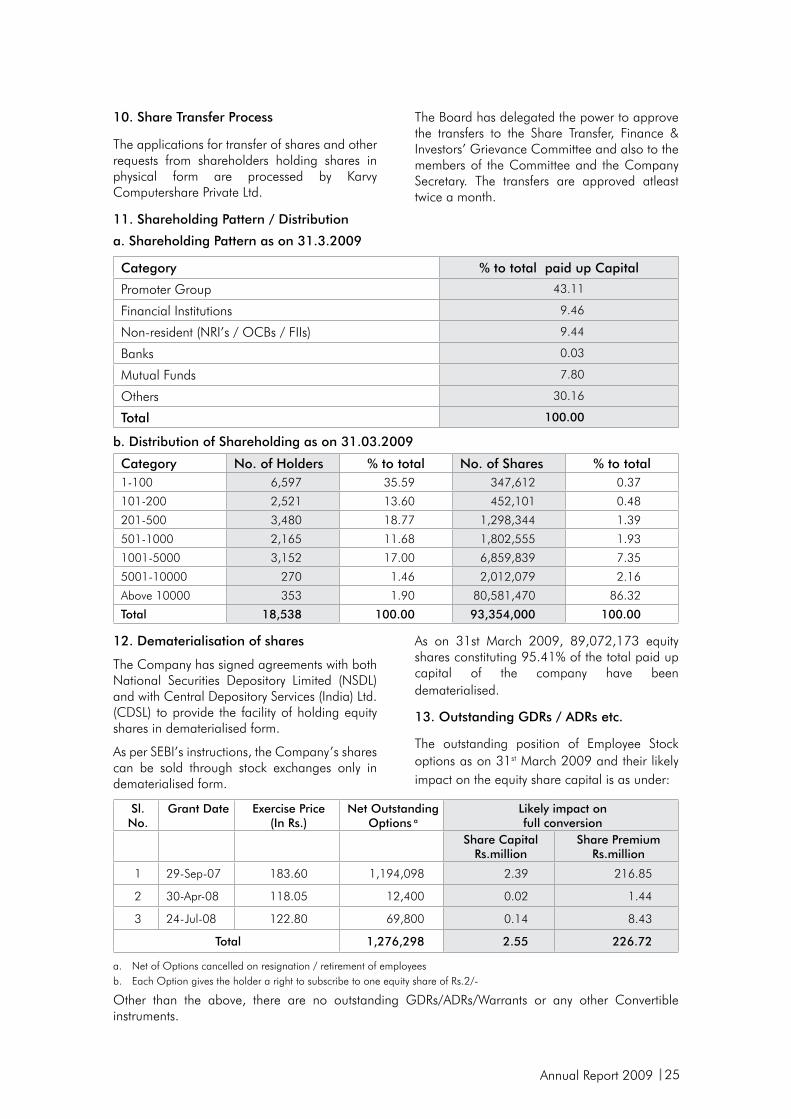
Annual Report 2009 25
10. Share Transfer Process
The applications for transfer of shares and other requests from shareholders holding shares in physical form are processed by Karvy Computershare Private Ltd.
The Board has delegated the power to approve the transfers to the Share Transfer, Finance & Investors’ Grievance Committee and also to the members of the Committee and the Company Secretary. The transfers are approved atleast twice a month.
11. Shareholding Pattern / Distribution
a. Shareholding Pattern as on 31.3.2009
Category % to total paid up Capital
Promoter Group 43.11
Financial Institutions 9.46
Non-resident (NRI’s / OCBs / FIIs) 9.44
Banks 0.03
Mutual Funds 7.80
Others 30.16
Total 100.00
b. Distribution of Shareholding as on 31.03.2009
Category No. of Holders % to total No. of Shares % to total1-100 6,597 35.59 347,612 0.37
101-200 2,521 13.60 452,101 0.48
201-500 3,480 18.77 1,298,344 1.39
501-1000 2,165 11.68 1,802,555 1.93
1001-5000 3,152 17.00 6,859,839 7.35
5001-10000 270 1.46 2,012,079 2.16
Above 10000 353 1.90 80,581,470 86.32
Total 18,538 100.00 93,354,000 100.00
Sl. No.
Grant Date Exercise Price(In Rs.)
Net Outstanding Options a
Likely impact onfull conversion
Share Capital Rs.million
Share Premium Rs.million
1 29-Sep-07 183.60 1,194,098 2.39 216.85
2 30-Apr-08 118.05 12,400 0.02 1.44
3 24-Jul-08 122.80 69,800 0.14 8.43
Total 1,276,298 2.55 226.72
a. Net of Options cancelled on resignation / retirement of employeesb. Each Option gives the holder a right to subscribe to one equity share of Rs.2/-
Other than the above, there are no outstanding GDRs/ADRs/Warrants or any other Convertible instruments.
12. Dematerialisation of shares
The Company has signed agreements with both National Securities Depository Limited (NSDL) and with Central Depository Services (India) Ltd. (CDSL) to provide the facility of holding equity shares in dematerialised form.
As per SEBI’s instructions, the Company’s shares can be sold through stock exchanges only in dematerialised form.
As on 31st March 2009, 89,072,173 equity shares constituting 95.41% of the total paid up capital of the company have been dematerialised.
13. Outstanding GDRs / ADRs etc.
The outstanding position of Employee Stock options as on 31st March 2009 and their likely impact on the equity share capital is as under:
26
14. Address for correspondencea. Registrars and Share Transfer Agents Karvy Computershare Private Limited Plot Nos. 17-24, Vithal Rao Nagar, Madhapur, Hyderabad - 500 081. Tel: +91-40-23420815 to 23420824 Toll Free No. 1-800-3454001 Fax: +91-40-23420814 email: [email protected] website: www.karvy.com
15. Plant Locations
Abrasives
a. 655, Thiruvottiyur High Road, P B No.2272, Thiruvottiyur, Chennai 600 019, Tamil Nadu
Tel : +91-44-25733322 / 42211000 Fax : +91-44-25733499 / 25733280 / 25731027b. Plot No.48, SIPCOT Industrial Complex, Hosur 635 126, Dharmapuri District, Tamil Nadu Tel: +91-4344-276864 / 277059 / 276630 / 279855 / 279844 Fax: +91-4344-277060c. Gopalpur Chandigarh, P.O. Ganga Nagar, Kolkata 700 132, West Bengal Tel : +91-33-25384418 Fax : +91-33-25386331d. C-4 & C-5, Kamarajar Salai, MMDA Industrial Complex, Maraimalai Nagar 603 209, Kanchipuram
District, Tamil Nadu Tel : +91-4114-253093 / 253195 Fax : +91-4114-253097e. F-1/2, F2 - F5, SIPCOT Industrial Park,Pondur “A” Village, Sriperumbudur - 602 105, Kanchipuram
District, Tamil Nadu. Tel: +91-44-37100204 Fax : +91-4114-253097f. K3, ASAHI Industrial Estate, Latherdeva Hoon, Mangalore Jhabrera Road, PO Jhabrera,
Tehsil Roorkee, Hardwar District, Uttranchal – 247667 Tel: +91-01332, 275846 / 224064 Fax : +91-01332 224062
g. Power Tools Division, Plot No.77, Bommasandra, Jigani Link Road, Jigani Industrial Area, Jigani, Bangalore 526 106, Karnataka. Tel: +91 080 27839041/42/43/44 Fax : +91-080 27839040
Ceramics
a. Plot No.47, SIPCOT Industrial Complex, Hosur 635 126, Dharmapuri District, Tamil Nadu Tel : +91-4344-276027 / 276418 Fax : +91-4344-276028b. Plot No A-7/2 MIDC Area, Chikalthana, Aurangabad – 431210, Maharashtra. Tel : +91-0240-2482568 Fax : +91-0240 2482003c. Super Refractories Division, Plot No.102 & 103, SIPCOT Industrial Complex (Phase II),
Ranipet 632 403, Tamil Nadu. Tel : +91-4172-244582 / 244197 Fax : +91-4172-244982d. Super Refractories Division – Plant 2, Vinnampalli Post, Katpadi Taluk, Vellore District – 632 516.
Tamil Nadu. Tel : +91- 04172 – 255397/ 646030 Fax :+91- 04172 – 255395e. Plot Nos. 35,37, 48-51, Adhartal Industrial Estate,Jabalpur - 482 004, Madhya Pradesh, Tel : +91-0761-2680398 / 6539996 Fax: +91-0761-2680678
Electrominerals a. PB No.1 Kalamassery,Development Plot P.O, Kalamassery 683 109, Ernakulam District, Kerala.
Tel : +91-484-2541058/ 2540309/2540525 Fax : +91-484-2532019b. PB No. 3 Nalukettu, Koratty 680 308, Trichur District, Kerala. Tel : +91-480-2732313 /2732061 Fax : +91-480-2732821c. Maniyar Hydroelectric Works, Maniyar P.O., Vadasserikara, Pathanamthitta District,
Kerala 689 662. Tel : +91-4735-274223 Fax : +91-4735-274223d. Bhatia Mines, Bhatia Western Railway, Jamnagar District, Gujarat 361 315 Tel : +91-2891-233464e. P.B No.2 Okha Port P.O., Jamnagar District, Gujarat 361 350 Tel : +91-2892-262063 / 262065 Fax : +91-2892-262061 On behalf of the Board
Chennai M M Murugappan
29th April 2009 Chairman
b. Investor Services Desk
Carborundum Universal Limited Parry House, 6th Floor, 43 Moore Street, Chennai 600 001. Tel: +91-44-42216141 Fax: +91-44-42216149 Email: [email protected]
Report on Corporate Governance
Annual Report 2009 27
List of promoters of Carborundum Universal Limited belonging to the Murugappa Group pursuant to regulation 3(e)(i) of SEBI (Substantial Acquisition of Shares & Takeovers) Regulations, 1997
Chennai For Carborundum Universal Limited29th April 2009 S Dhanvanth Kumar
Company Secretary
Auditors’ Certificate on Corporate GovernanceTo
The members of Carborundum Universal Limited
We have examined the compliance of conditions of Corporate Governance by CARBORUNDUM UNIVERSAL LIMITED, for the year ended 31st March 2009, as stipulated in clause 49 of the Listing Agreement of the said Company with stock exchanges.
The Compliance of conditions of Corporate Governance is the responsibility of the Management. Our examination was limited to procedures and implementation thereof, adopted by the Company for ensuring the compliance of the conditions of Corporate Governance. It is neither an audit nor an expression of opinion on the financial statements of the Company.
In our opinion and to the best of our information and according to the explanation given to us, we certify that the Company has complied with the conditions of Corporate Governance as stipulated in the above mentioned Listing Agreement.
We further state that such compliance is neither an assurance as to the future viability of the Company nor the efficiency or effectiveness with which management has conducted the affairs of the Company.
For DELOITTE HASKINS & SELLSPlace: Chennai Chartered AccountantsDate: 29th April 2009 M.K.Ananthanarayanan Partner
Membership No.19521
1. EID Parry (India) Ltd. & its subsidiaries2. Silkroad Sugar Private Ltd3. New Ambadi Estates Pvt. Ltd. & its
subsidiaries4. Ambadi Enterprises Ltd.& its subsidiaries5. Tube Investments of India Ltd. & its
subsidiaries6. TII Shareholding Trust7. Presmet Private Limited 8. Laserwords Private Limited & subsidiaries9. Cholamandalam DBS Finance Ltd. & its
subsidiaries10. The Coromandel Engineering Company
Limited 11. Murugappa Educational & Medical
Foundation12. AMM Arunachalam & Sons P Ltd.13. AMM Vellayan Sons P Ltd.14. MM Muthiah Sons P Ltd.
15. Kadamane Estates Company16. Yelnoorkhan Group Estates 17. Murugappa & Sons18. MM Muthiah Research Foundation19. A R Lakshmi Achi Trust20. AMM Foundation21. AMM Medical Foundation22. M V Murugappan & family23. M V Subbiah & family24. S Vellayan & family25. A Vellayan & family26. A Venkatachalam & family27. M M Murugappan & family28. M M Venkatachalam & family29. M A Alagappan & family30. Arun Alagappan & family31. M A M Arunachalam & family32. Any other company, firm or trust
promoted or controlled by the above
‘Family’ for the above purpose includes the spouse, unmarried children and parents
28
INDEPENDENT FINANCIAL sTATEMENTs 2008-09
1. We have audited the attached Balance Sheet of CARBORUNDUM UNIVERSAL LIMITED (the Company) as at 31st March 2009, the Profit and Loss Account and also the Cash Flow Statement for the year ended on that date annexed thereto. These financial statements are the responsibility of the Company’s management. Our responsibility is to express an opinion on these financial statements based on our audit.
2. We conducted our audit in accordance with the auditing standards generally accepted in India. Those Standards require that we plan and perform the audit to obtain reasonable assurance about whether the financial statements are free of material misstatements. An audit includes examining, on a test basis, evidence supporting the amounts and disclosures in the financial statements. An audit also includes assessing the accounting principles used and significant estimates made by management, as well as evaluating the overall financial statement presentation. We believe that our audit provides a reasonable basis for our opinion.
3. As required by the Companies (Auditor’s Report) Order, 2003 issued by the Central Government of India in terms of sub section (4A) of Section 227 of the Companies Act, 1956, we enclose in the Annexure a statement on the matters specified in paragraphs 4 and 5 of the said Order.
4. Further to our comments in the Annexure referred to above, we report that:
(i) We have obtained all the information and explanations, which to the best of our knowledge and belief were necessary for the purposes of our audit;
(ii) In our opinion, proper books of account as required by law have been kept by the Company so far as appears from our examination of those books;
(iii) The Balance Sheet, Profit and Loss Account and Cash Flow Statement dealt with by this report are in agreement with the books of accounts;
(iv) In our opinion, the Balance Sheet, Profit and Loss Account and the Cash Flow Statement dealt with by this report comply with the accounting standards referred to in sub-section (3C) of Section 211 of the Companies Act, 1956;
(v) On the basis of written representations received from the directors and taken on record by the Board of Directors, we report that none of the directors is disqualified as on 31st March 2009, from being appointed as a director in terms of clause (g) of sub-section (1) of section 274 of the Companies Act, 1956 on the said date;
AUDITOR’S REPORT TO THE MEMBERS OF CARBORUNDUM UNIVERSAL LIMITED
Pursuant to Section 217(2AA) of the Companies Act, 1956, the Directors to the best of their knowledge and belief confirm that :• in the preparation of the Profit & Loss
Account for the financial year ended 31st March 2009 and the Balance Sheet as at that date (“financial statements”) applicable accounting standards have been followed;
• appropriate accounting policies have been selected and applied consistently and such judgments and estimates that are reasonable and prudent have been made so as to give a true and fair view of the state of affairs of the company as at the end of the financial
DIRECTORS’ RESPONSIBILITY STATEMENTAnnexure to the Directors’ Report
year and of the profit of the company for that period;
• proper and sufficient care has been taken for the maintenance of adequate accounting records in accordance with the provisions of the Companies Act, 1956 for safeguarding the assets of the company and for preventing and detecting fraud and other irregularities;
• the financial statements have been prepared on a going concern basis.
On behalf of the Board
Chennai M M MURUGAPPAN29th April 2009 Chairman
Independent Financial Statements
Annual Report 2009 29
1. In respect of fixed assets:
a) The Company has maintained proper records showing full particulars, including quantitative details and situation of fixed assets.
b) The fixed assets were physically verified in a phased manner by the management in accordance with a programme of verification which, in our opinion, is reasonable having regard to the size of the Company and the nature of its assets. According to the information and explanations given to us, no material discrepancies were noticed on such verification.
c) The fixed assets disposed off during the year, in our opinion do not constitute a substantial part of the fixed assets of the Company and such disposals has, in our opinion not affected the going concern status of the Company.
2. In respect of its inventories:
a) As explained to us, inventories were physically verified by the management at reasonable intervals.
b) In our opinion and according to the information and explanations given to us, the procedures of physical verification of inventories followed by the management were reasonable and adequate in relation to the size of the Company and the nature of its business.
c) In our opinion and according to the information and explanations given to us, the Company has maintained proper record of its inventory. The discrepancies noticed on physical verification between
ANNExURE REFERRED TO IN PARAGRAPH 3 OF OUR REPORT OF EVEN DATE
physical stock and book records were not material.
3. (a) According to the information and explanations given to us, the Company has not granted any loans, secured or unsecured to companies, firms or other parties covered in the register maintained under Section 301 of the Companies Act, 1956. In respect of a loan granted in earlier years to a subsidiary company, the receipt of principal amounts and interest during the year have been regular/as per stipulations. The rate of interest and other terms and conditions of the aforesaid loan, are, in our opinion, prima facie not prejudicial to the interest of the Company. In respect of the above loan, the maximum amount involved during the year was Rs.3.20 million and the year end balance was NIL.
(b) According to the information and explanations given to us, the Company has not taken any loans, secured or unsecured from companies, firms or other parties covered in the register maintained under Section 301 of the Companies Act, 1956.
4. In our opinion and according to the information and explanations given to us, there is adequate internal control system commensurate with the size of the Company and nature of its business with regard to the purchase of inventory and fixed assets and with regard to the sale of goods and services. During the course of our audit, we have not observed any continuing failure to correct major weaknesses in such internal controls.
5. In respect of the contracts or arrangements referred to in Section 301 of the Companies Act, 1956,
(vi) In our opinion and to the best of our information and according to the expla-nations given to us, the said accounts together with schedules and notes there-on, give the information required by the Companies Act, 1956 in the manner so required and give a true and fair view in conformity with the accounting prin-ciples generally accepted in India:
(a) in the case of the Balance Sheet, of the state of affairs of the Company as at 31st March 2009;
(b) in the case of the Profit and Loss Account, of the profit for the year ended on that date; and
(c) in the case of the Cash Flow Statement, of the cash flows for the year ended on that date.
For Deloitte Haskins & Sells Chartered Accountants
M.K.AnanthanarayananPlace: Chennai PartnerDate: 29th April 2009 Membership No.19521
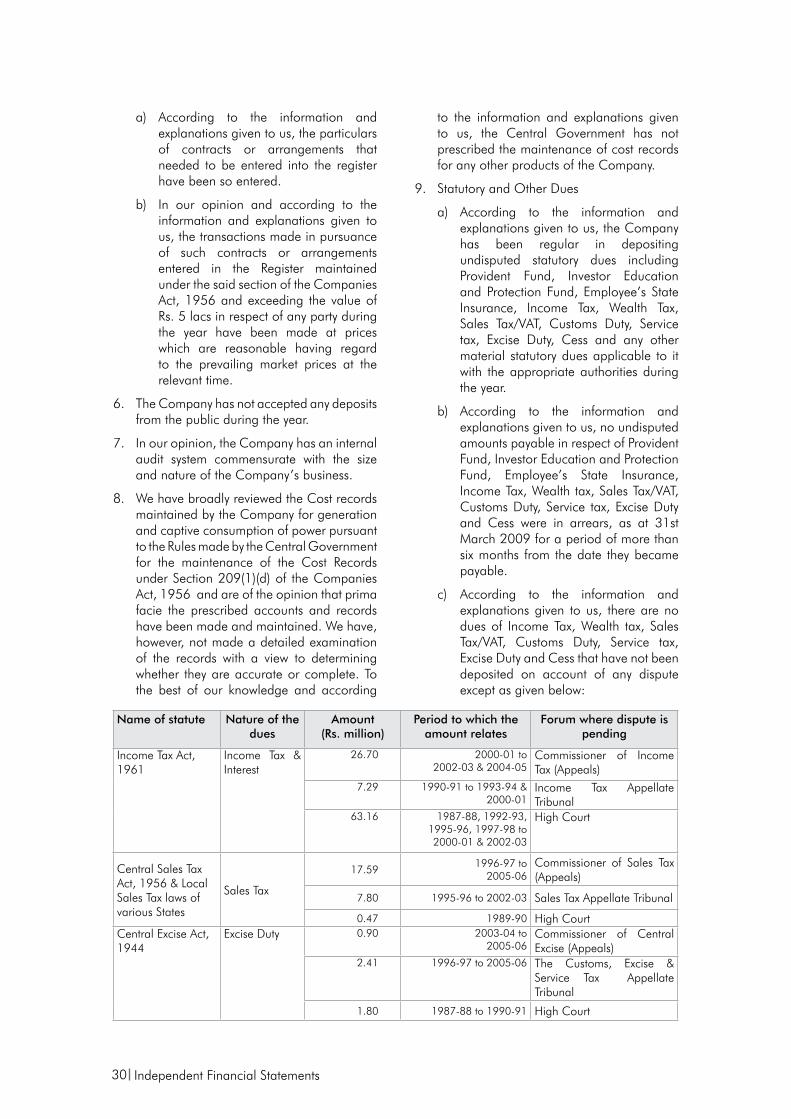
30
a) According to the information and explanations given to us, the particulars of contracts or arrangements that needed to be entered into the register have been so entered.
b) In our opinion and according to the information and explanations given to us, the transactions made in pursuance of such contracts or arrangements entered in the Register maintained under the said section of the Companies Act, 1956 and exceeding the value of Rs. 5 lacs in respect of any party during the year have been made at prices which are reasonable having regard to the prevailing market prices at the relevant time.
6. The Company has not accepted any deposits from the public during the year.
7. In our opinion, the Company has an internal audit system commensurate with the size and nature of the Company’s business.
8. We have broadly reviewed the Cost records maintained by the Company for generation and captive consumption of power pursuant to the Rules made by the Central Government for the maintenance of the Cost Records under Section 209(1)(d) of the Companies Act, 1956 and are of the opinion that prima facie the prescribed accounts and records have been made and maintained. We have, however, not made a detailed examination of the records with a view to determining whether they are accurate or complete. To the best of our knowledge and according
to the information and explanations given to us, the Central Government has not prescribed the maintenance of cost records for any other products of the Company.
9. Statutory and Other Dues
a) According to the information and explanations given to us, the Company has been regular in depositing undisputed statutory dues including Provident Fund, Investor Education and Protection Fund, Employee’s State Insurance, Income Tax, Wealth Tax, Sales Tax/VAT, Customs Duty, Service tax, Excise Duty, Cess and any other material statutory dues applicable to it with the appropriate authorities during the year.
b) According to the information and explanations given to us, no undisputed amounts payable in respect of Provident Fund, Investor Education and Protection Fund, Employee’s State Insurance, Income Tax, Wealth tax, Sales Tax/VAT, Customs Duty, Service tax, Excise Duty and Cess were in arrears, as at 31st March 2009 for a period of more than six months from the date they became payable.
c) According to the information and explanations given to us, there are no dues of Income Tax, Wealth tax, Sales Tax/VAT, Customs Duty, Service tax, Excise Duty and Cess that have not been deposited on account of any dispute except as given below:
Name of statute Nature of the dues
Amount(Rs. million)
Period to which the amount relates
Forum where dispute is pending
Income Tax Act, 1961
Income Tax & Interest
26.70 2000-01 to2002-03 & 2004-05
Commissioner of Income Tax (Appeals)
7.29 1990-91 to 1993-94 & 2000-01
Income Tax Appellate Tribunal
63.16 1987-88, 1992-93,1995-96, 1997-98 to 2000-01 & 2002-03
High Court
Central Sales Tax Act, 1956 & Local Sales Tax laws of various States
Sales Tax
17.591996-97 to
2005-06Commissioner of Sales Tax (Appeals)
7.80 1995-96 to 2002-03 Sales Tax Appellate Tribunal
0.47 1989-90 High CourtCentral Excise Act, 1944
Excise Duty 0.90 2003-04 to 2005-06
Commissioner of Central Excise (Appeals)
2.41 1996-97 to 2005-06 The Customs, Excise & Service Tax Appellate Tribunal
1.80 1987-88 to 1990-91 High Court
Independent Financial Statements
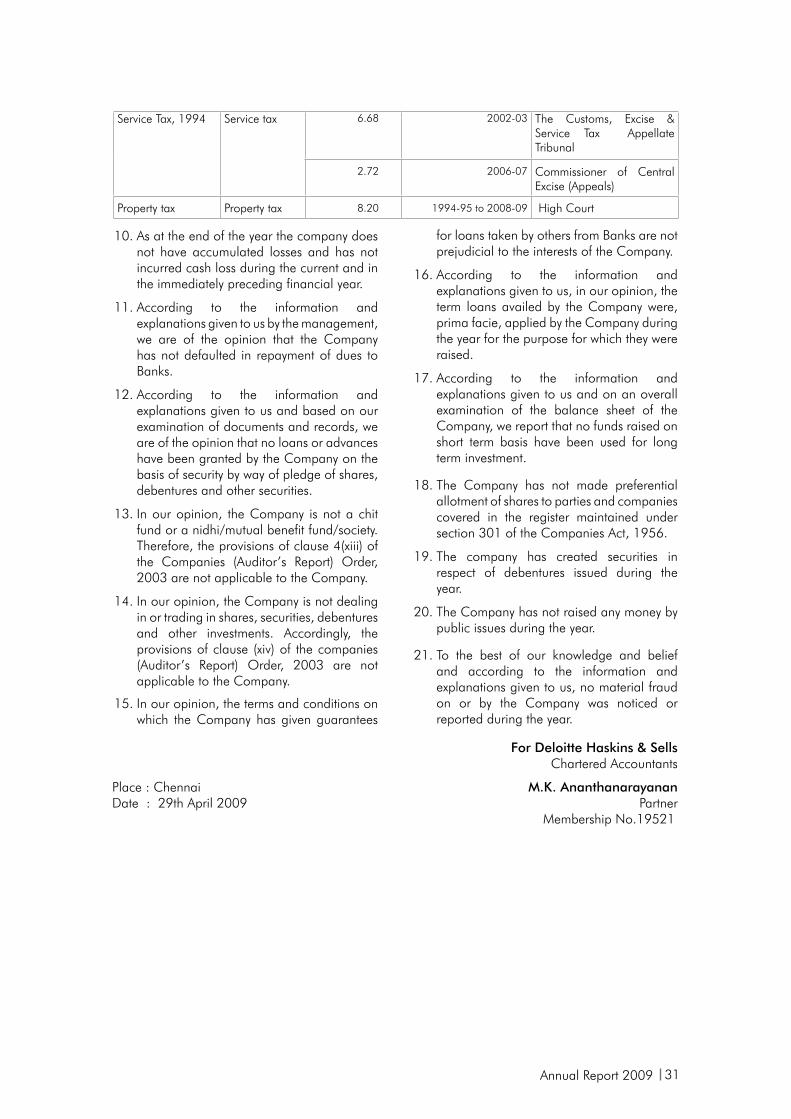
Annual Report 2009 31
for loans taken by others from Banks are not prejudicial to the interests of the Company.
16. According to the information and explanations given to us, in our opinion, the term loans availed by the Company were, prima facie, applied by the Company during the year for the purpose for which they were raised.
17. According to the information and explanations given to us and on an overall examination of the balance sheet of the Company, we report that no funds raised on short term basis have been used for long term investment.
18. The Company has not made preferential allotment of shares to parties and companies covered in the register maintained under section 301 of the Companies Act, 1956.
19. The company has created securities in respect of debentures issued during the year.
20. The Company has not raised any money by public issues during the year.
21. To the best of our knowledge and belief and according to the information and explanations given to us, no material fraud on or by the Company was noticed or reported during the year.
10. As at the end of the year the company does not have accumulated losses and has not incurred cash loss during the current and in the immediately preceding financial year.
11. According to the information and explanations given to us by the management, we are of the opinion that the Company has not defaulted in repayment of dues to Banks.
12. According to the information and explanations given to us and based on our examination of documents and records, we are of the opinion that no loans or advances have been granted by the Company on the basis of security by way of pledge of shares, debentures and other securities.
13. In our opinion, the Company is not a chit fund or a nidhi/mutual benefit fund/society. Therefore, the provisions of clause 4(xiii) of the Companies (Auditor’s Report) Order, 2003 are not applicable to the Company.
14. In our opinion, the Company is not dealing in or trading in shares, securities, debentures and other investments. Accordingly, the provisions of clause (xiv) of the companies (Auditor’s Report) Order, 2003 are not applicable to the Company.
15. In our opinion, the terms and conditions on which the Company has given guarantees
Service Tax, 1994 Service tax 6.68 2002-03 The Customs, Excise & Service Tax Appellate Tribunal
2.72 2006-07 Commissioner of Central Excise (Appeals)
Property tax Property tax 8.20 1994-95 to 2008-09 High Court
For Deloitte Haskins & Sells Chartered Accountants
Place : Chennai M.K. AnanthanarayananDate : 29th April 2009 Partner Membership No.19521
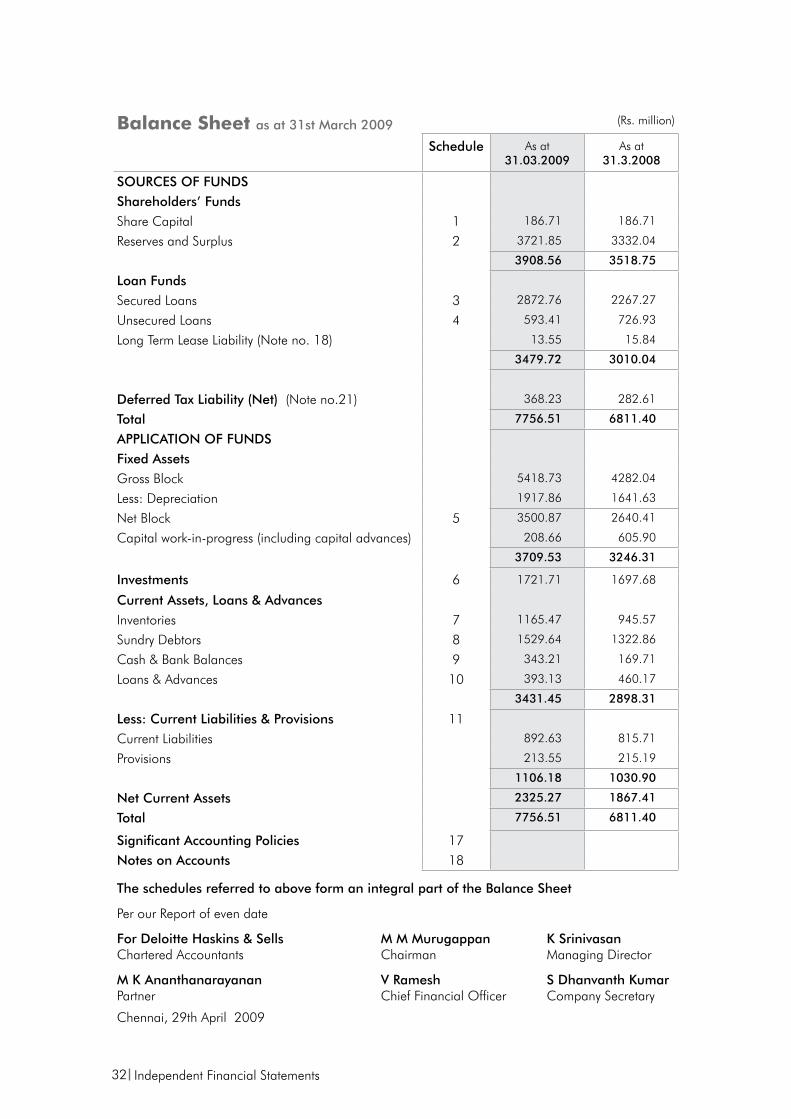
32
Balance sheet as at 31st March 2009 (Rs. million)
Schedule As at31.03.2009
As at31.3.2008
SOURCES OF FUNDSShareholders’ Funds Share Capital 1 186.71 186.71
Reserves and Surplus 2 3721.85 3332.04
3908.56 3518.75
Loan FundsSecured Loans 3 2872.76 2267.27
Unsecured Loans 4 593.41 726.93
Long Term Lease Liability (Note no. 18) 13.55 15.84
3479.72 3010.04
Deferred Tax Liability (Net) (Note no.21) 368.23 282.61
Total 7756.51 6811.40
APPLICATION OF FUNDSFixed AssetsGross Block 5418.73 4282.04
Less: Depreciation 1917.86 1641.63
Net Block 5 3500.87 2640.41
Capital work-in-progress (including capital advances) 208.66 605.90
3709.53 3246.31
Investments 6 1721.71 1697.68
Current Assets, Loans & AdvancesInventories 7 1165.47 945.57
Sundry Debtors 8 1529.64 1322.86
Cash & Bank Balances 9 343.21 169.71
Loans & Advances 10 393.13 460.17
3431.45 2898.31
Less: Current Liabilities & Provisions 11Current Liabilities 892.63 815.71
Provisions 213.55 215.19
1106.18 1030.90
Net Current Assets 2325.27 1867.41
Total 7756.51 6811.40
Significant Accounting Policies 17Notes on Accounts 18
The schedules referred to above form an integral part of the Balance Sheet
Per our Report of even date
For Deloitte Haskins & SellsChartered Accountants
M M MurugappanChairman
K SrinivasanManaging Director
M K AnanthanarayananPartner
Chennai, 29th April 2009
V RameshChief Financial Officer
S Dhanvanth KumarCompany Secretary
Independent Financial Statements
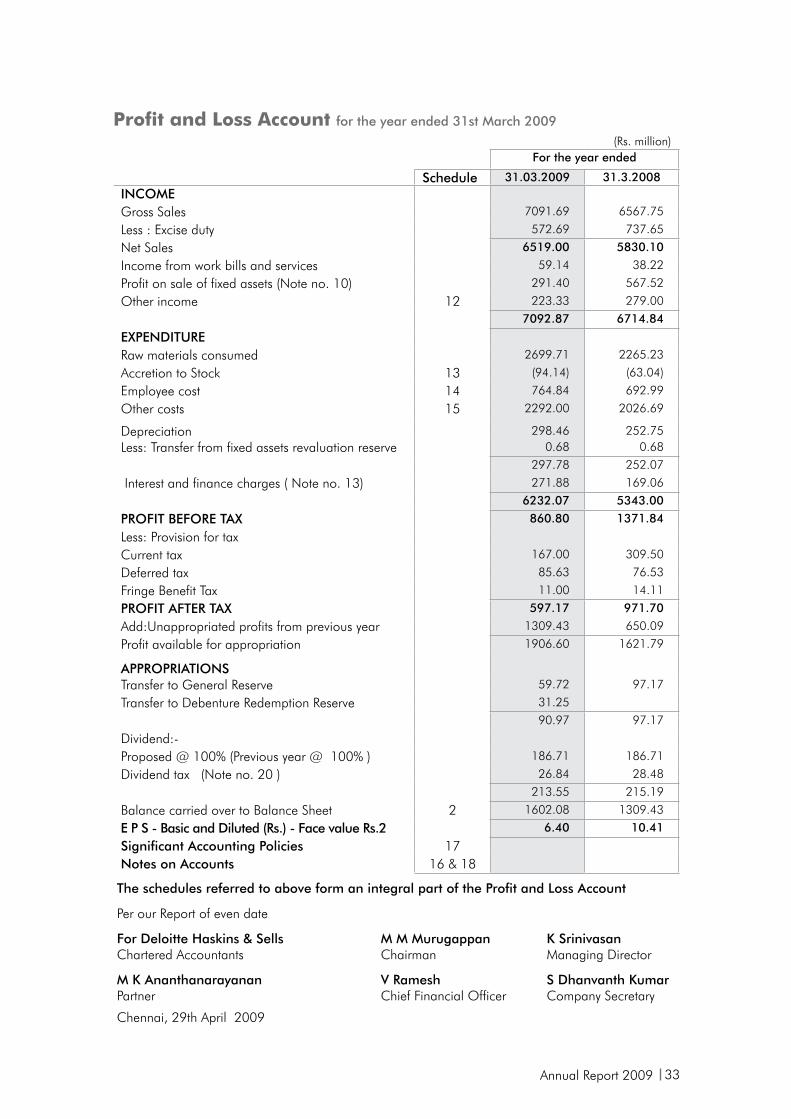
Annual Report 2009 33
Profit and Loss Account for the year ended 31st March 2009(Rs. million)
For the year ended
Schedule 31.03.2009 31.3.2008INCOMEGross Sales 7091.69 6567.75
Less : Excise duty 572.69 737.65
Net Sales 6519.00 5830.10
Income from work bills and services 59.14 38.22
Profit on sale of fixed assets (Note no. 10) 291.40 567.52
Other income 12 223.33 279.007092.87 6714.84
ExPENDITURERaw materials consumed 2699.71 2265.23
Accretion to Stock 13 (94.14) (63.04)
Employee cost 14 764.84 692.99
Other costs 15 2292.00 2026.69
Depreciation 298.46 252.75Less: Transfer from fixed assets revaluation reserve 0.68 0.68
297.78 252.07
Interest and finance charges ( Note no. 13) 271.88 169.066232.07 5343.00
PROFIT BEFORE TAx 860.80 1371.84
Less: Provision for taxCurrent tax 167.00 309.50
Deferred tax 85.63 76.53
Fringe Benefit Tax 11.00 14.11
PROFIT AFTER TAx 597.17 971.70
Add:Unappropriated profits from previous year 1309.43 650.09
Profit available for appropriation 1906.60 1621.79
APPROPRIATIONSTransfer to General Reserve 59.72 97.17
Transfer to Debenture Redemption Reserve 31.25 90.97 97.17
Dividend:- Proposed @ 100% (Previous year @ 100% ) 186.71 186.71
Dividend tax (Note no. 20 ) 26.84 28.48 213.55 215.19
Balance carried over to Balance Sheet 2 1602.08 1309.43
E P S - Basic and Diluted (Rs.) - Face value Rs.2 6.40 10.41
Significant Accounting Policies 17Notes on Accounts 16 & 18
The schedules referred to above form an integral part of the Profit and Loss Account
Per our Report of even date
For Deloitte Haskins & SellsChartered Accountants
M M MurugappanChairman
K SrinivasanManaging Director
M K AnanthanarayananPartner
Chennai, 29th April 2009
V RameshChief Financial Officer
S Dhanvanth KumarCompany Secretary
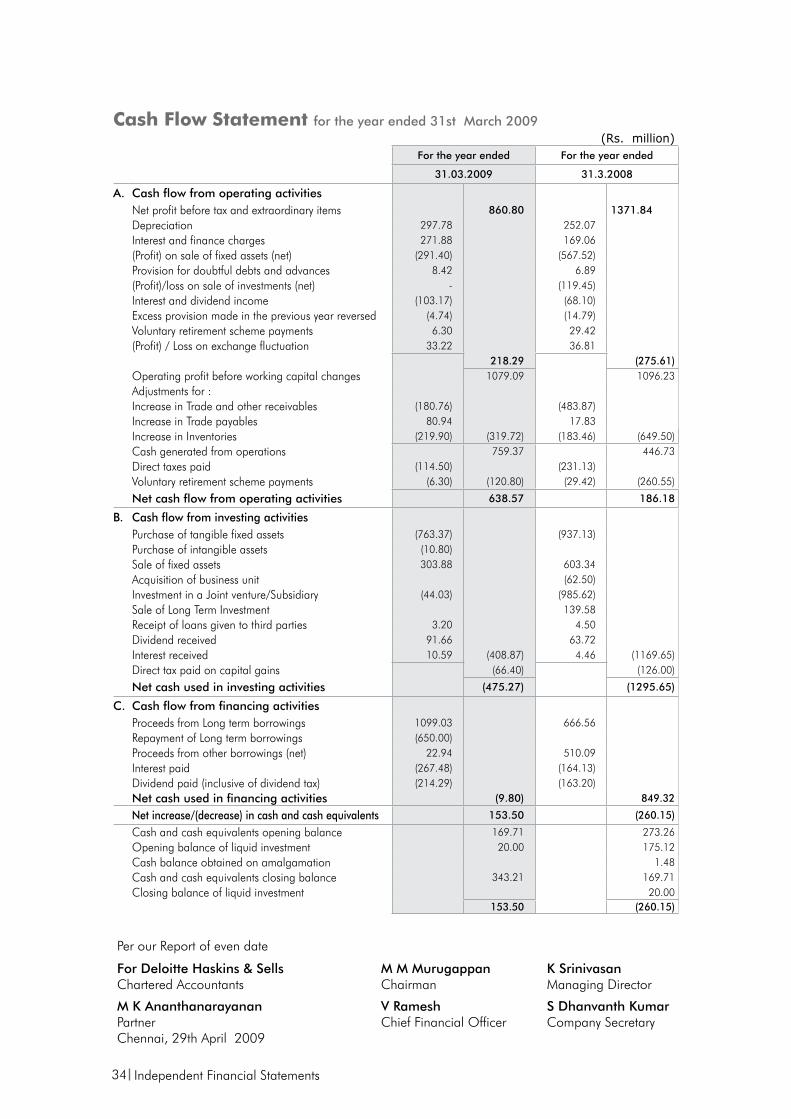
34
Cash Flow statement for the year ended 31st March 2009(Rs. million)
For the year ended For the year ended
31.03.2009 31.3.2008
A. Cash flow from operating activitiesNet profit before tax and extraordinary items 860.80 1371.84Depreciation 297.78 252.07Interest and finance charges 271.88 169.06(Profit) on sale of fixed assets (net) (291.40) (567.52)Provision for doubtful debts and advances 8.42 6.89(Profit)/loss on sale of investments (net) - (119.45)Interest and dividend income (103.17) (68.10)Excess provision made in the previous year reversed (4.74) (14.79)Voluntary retirement scheme payments 6.30 29.42(Profit) / Loss on exchange fluctuation 33.22 36.81
218.29 (275.61)Operating profit before working capital changes 1079.09 1096.23 Adjustments for :Increase in Trade and other receivables (180.76) (483.87)Increase in Trade payables 80.94 17.83Increase in Inventories (219.90) (319.72) (183.46) (649.50)Cash generated from operations 759.37 446.73 Direct taxes paid (114.50) (231.13)Voluntary retirement scheme payments (6.30) (120.80) (29.42) (260.55)
Net cash flow from operating activities 638.57 186.18
B. Cash flow from investing activitiesPurchase of tangible fixed assets (763.37) (937.13)Purchase of intangible assets (10.80)Sale of fixed assets 303.88 603.34Acquisition of business unit (62.50)Investment in a Joint venture/Subsidiary (44.03) (985.62)Sale of Long Term Investment 139.58 Receipt of loans given to third parties 3.20 4.50Dividend received 91.66 63.72Interest received 10.59 (408.87) 4.46 (1169.65)Direct tax paid on capital gains (66.40) (126.00)
Net cash used in investing activities (475.27) (1295.65)
C. Cash flow from financing activitiesProceeds from Long term borrowings 1099.03 666.56Repayment of Long term borrowings (650.00)Proceeds from other borrowings (net) 22.94 510.09 Interest paid (267.48) (164.13)Dividend paid (inclusive of dividend tax) (214.29) (163.20)Net cash used in financing activities (9.80) 849.32
Net increase/(decrease) in cash and cash equivalents 153.50 (260.15)
Cash and cash equivalents opening balance 169.71 273.26Opening balance of liquid investment 20.00 175.12Cash balance obtained on amalgamation 1.48Cash and cash equivalents closing balance 343.21 169.71Closing balance of liquid investment 20.00
153.50 (260.15)
Per our Report of even date
For Deloitte Haskins & SellsChartered Accountants
M M MurugappanChairman
K SrinivasanManaging Director
M K AnanthanarayananPartnerChennai, 29th April 2009
V RameshChief Financial Officer
S Dhanvanth KumarCompany Secretary
Independent Financial Statements
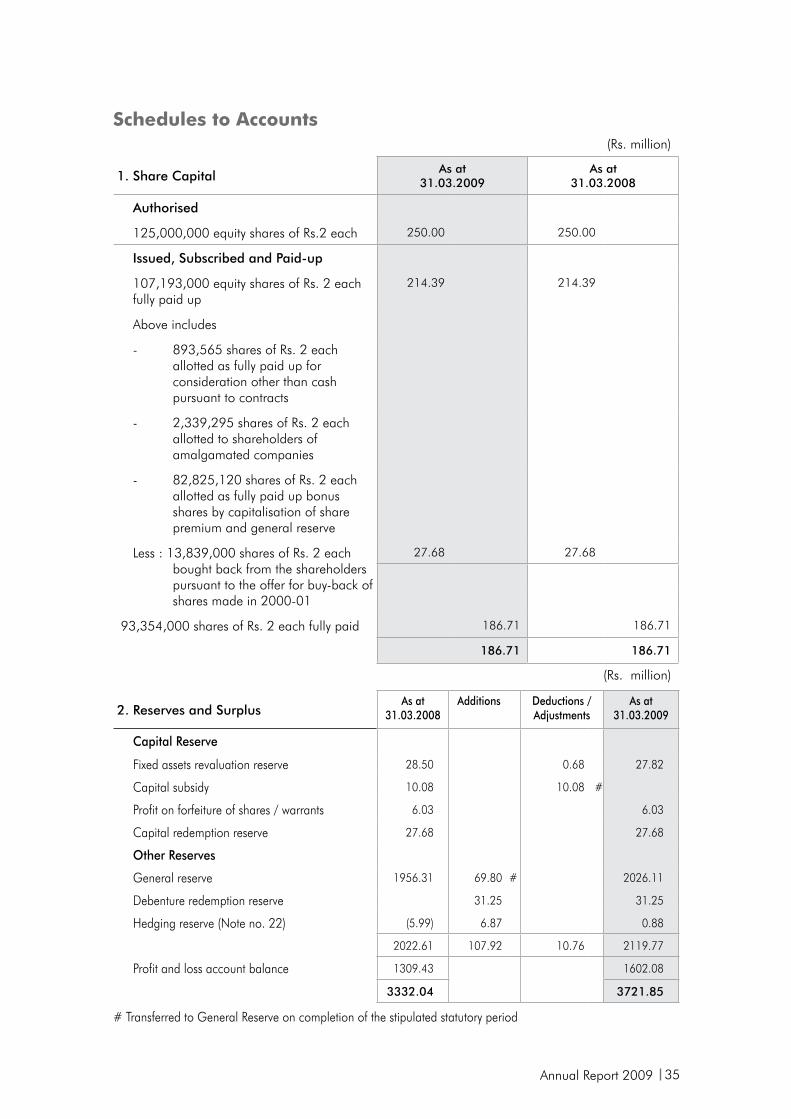
Annual Report 2009 35
schedules to Accounts(Rs. million)
1. Share Capital As at31.03.2009
As at31.03.2008
Authorised
125,000,000 equity shares of Rs.2 each 250.00 250.00
Issued, Subscribed and Paid-up
107,193,000 equity shares of Rs. 2 each fully paid up
214.39 214.39
Above includes
- 893,565 shares of Rs. 2 each allotted as fully paid up for consideration other than cash pursuant to contracts
- 2,339,295 shares of Rs. 2 each allotted to shareholders of amalgamated companies
- 82,825,120 shares of Rs. 2 each allotted as fully paid up bonus shares by capitalisation of share premium and general reserve
Less : 13,839,000 shares of Rs. 2 each bought back from the shareholders pursuant to the offer for buy-back of shares made in 2000-01
27.68 27.68
93,354,000 shares of Rs. 2 each fully paid 186.71 186.71
186.71 186.71
(Rs. million)
2. Reserves and SurplusAs at
31.03.2008Additions Deductions /
AdjustmentsAs at
31.03.2009
Capital Reserve
Fixed assets revaluation reserve 28.50 0.68 27.82
Capital subsidy 10.08 10.08 #
Profit on forfeiture of shares / warrants 6.03 6.03
Capital redemption reserve 27.68 27.68
Other Reserves
General reserve 1956.31 69.80 # 2026.11
Debenture redemption reserve 31.25 31.25
Hedging reserve (Note no. 22) (5.99) 6.87 0.88
2022.61 107.92 10.76 2119.77
Profit and loss account balance 1309.43 1602.08
3332.04 3721.85
# Transferred to General Reserve on completion of the stipulated statutory period
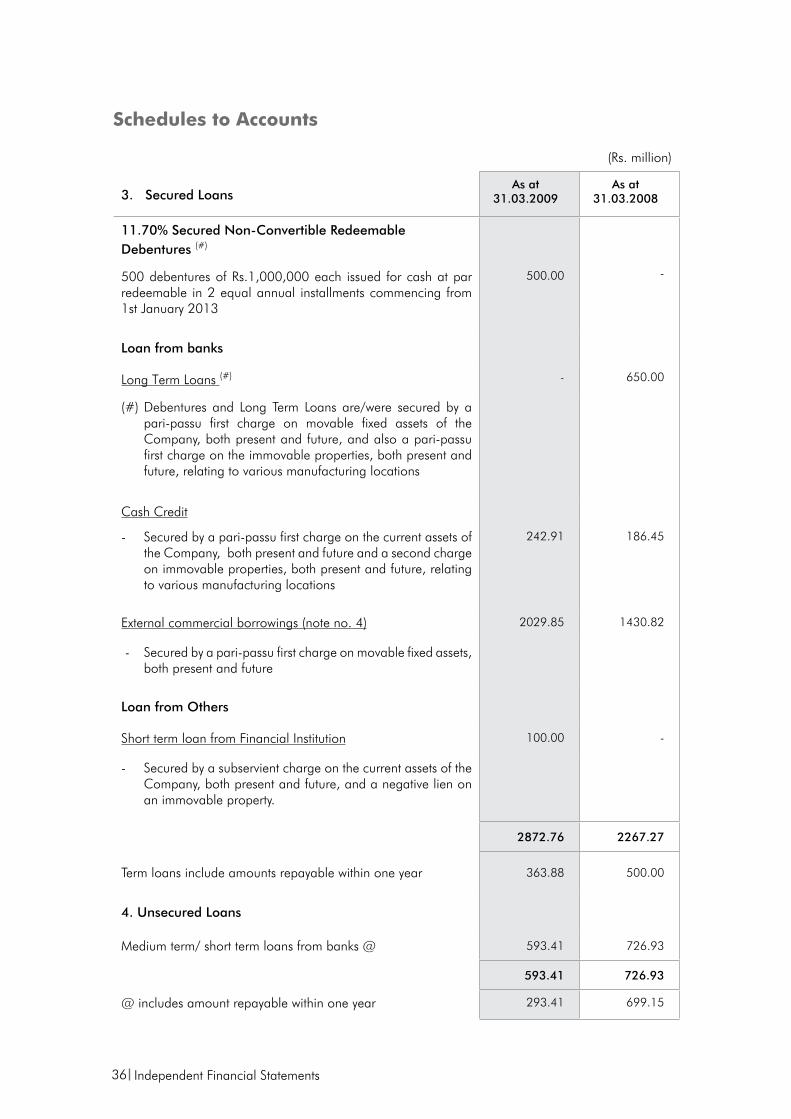
36
(Rs. million)
3. Secured LoansAs at
31.03.2009As at
31.03.2008
11.70% Secured Non-Convertible Redeemable Debentures (#)
500 debentures of Rs.1,000,000 each issued for cash at par redeemable in 2 equal annual installments commencing from 1st January 2013
500.00 -
Loan from banks
Long Term Loans (#) - 650.00
(#) Debentures and Long Term Loans are/were secured by a pari-passu first charge on movable fixed assets of the Company, both present and future, and also a pari-passu first charge on the immovable properties, both present and future, relating to various manufacturing locations
Cash Credit
- Secured by a pari-passu first charge on the current assets of the Company, both present and future and a second charge on immovable properties, both present and future, relating to various manufacturing locations
242.91 186.45
External commercial borrowings (note no. 4) 2029.85 1430.82
- Secured by a pari-passu first charge on movable fixed assets, both present and future
Loan from Others
Short term loan from Financial Institution 100.00 -
- Secured by a subservient charge on the current assets of the Company, both present and future, and a negative lien on an immovable property.
2872.76 2267.27
Term loans include amounts repayable within one year 363.88 500.00
4. Unsecured Loans
Medium term/ short term loans from banks @ 593.41 726.93
593.41 726.93
@ includes amount repayable within one year 293.41 699.15
schedules to Accounts
Independent Financial Statements
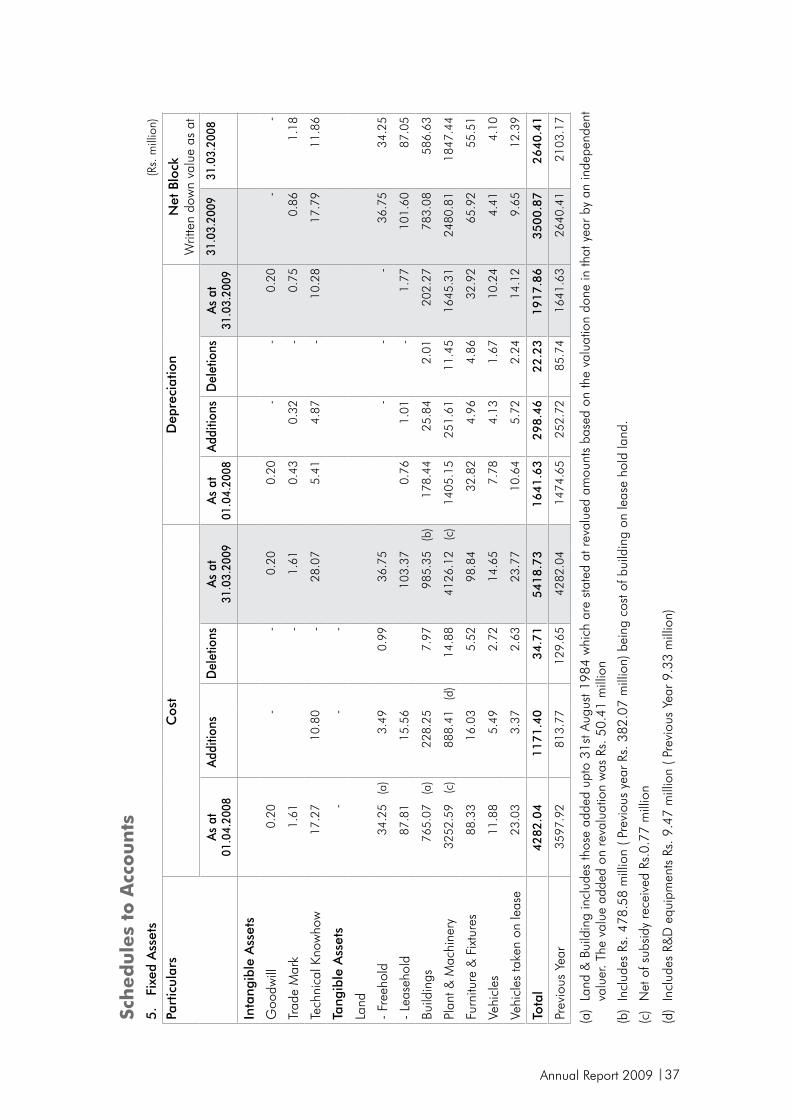
Annual Report 2009 37
sch
ed
ule
s to
Acc
ou
nts
5. Fi
xed
Ass
ets
(Rs.
mill
ion)
Part
icul
ars
Cos
tD
epre
ciat
ion
Net
Blo
ck W
ritte
n do
wn
valu
e as
at
As a
t01
.04.
2008
Addi
tions
Del
etio
nsAs
at
31.0
3.20
09As
at
01.0
4.20
08Ad
ditio
nsD
elet
ions
As a
t31
.03.
2009
31.0
3.20
0931
.03.
2008
Inta
ngib
le A
sset
s
Goo
dwill
0.20
-
-
0.20
0.20
-
-
0.20
--
Trad
e M
ark
1.61
-
1.61
0.43
0.32
-
0.75
0.86
1.18
Tech
nica
l Kno
who
w17
.27
10.8
0 -
28
.07
5.41
4.87
-
10.2
817
.79
11.8
6
Tang
ible
Ass
ets
-
-
-
Land
- Fr
eeho
ld34
.25
(a)
3.49
0.99
36.7
5 -
-
-
36
.75
34.2
5
- Le
aseh
old
87.8
115
.56
103.
370.
761.
01 -
1.
7710
1.60
87.0
5
Build
ings
765.
07(a
)22
8.25
7.97
985.
35(b
)17
8.44
25.8
42.
0120
2.27
783.
0858
6.63
Plan
t & M
achi
nery
3252
.59
(c)
888.
41(d
)14
.88
4126
.12
(c)
1405
.15
251.
6111
.45
1645
.31
2480
.81
1847
.44
Furn
iture
& F
ixtu
res
88.3
316
.03
5.52
98.8
432
.82
4.96
4.86
32.9
265
.92
55.5
1
Vehi
cles
11.8
85.
492.
7214
.65
7.78
4.13
1.67
10.2
44.
414.
10
Vehi
cles
take
n on
leas
e23
.03
3.37
2.63
23.7
710
.64
5.72
2.24
14.1
29.
6512
.39
Tota
l4
28
2.0
41
17
1.4
03
4.7
15
41
8.7
31
64
1.6
3298.4
622.2
31917.8
63500.8
72640.4
1
Prev
ious
Yea
r35
97.9
281
3.77
129.
6542
82.0
414
74.6
525
2.72
85.7
416
41.6
3 26
40.4
121
03.1
7
(a)
Land
& B
uild
ing
incl
udes
thos
e ad
ded
upto
31s
t Aug
ust 1
984
whi
ch a
re s
tate
d at
rev
alue
d am
ount
s ba
sed
on th
e va
luat
ion
done
in th
at y
ear
by a
n in
depe
nden
t va
luer
. The
val
ue a
dded
on
reva
luat
ion
was
Rs.
50.
41 m
illio
n
(b)
Incl
udes
Rs.
478
.58
mill
ion
( Pre
viou
s ye
ar R
s. 3
82.0
7 m
illio
n) b
eing
cos
t of b
uild
ing
on le
ase
hold
land
.
(c)
Net
of s
ubsi
dy r
ecei
ved
Rs.0
.77
mill
ion
(d)
Incl
udes
R&
D e
quip
men
ts R
s. 9
.47
mill
ion
( Pre
viou
s Ye
ar 9
.33
mill
ion)
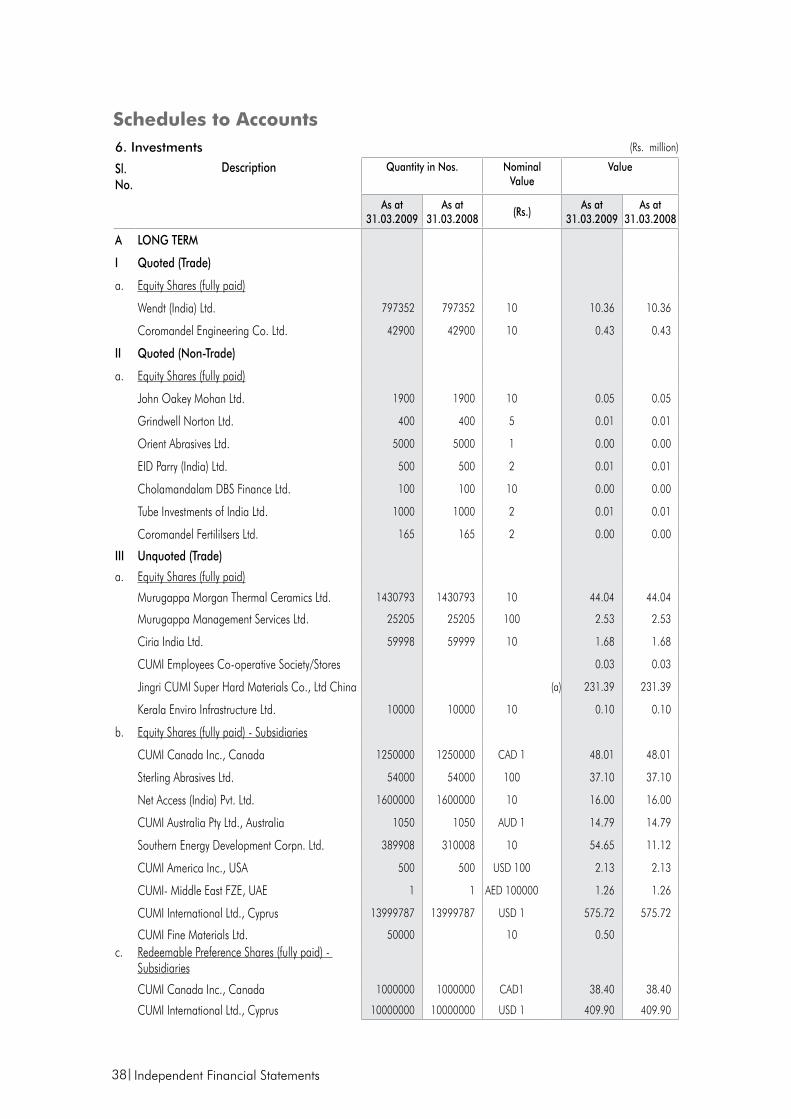
38
6. Investments (Rs. million)
Sl.No.
Description Quantity in Nos. NominalValue
Value
As at31.03.2009
As at31.03.2008
(Rs.)As at
31.03.2009As at
31.03.2008
A LONG TERM
I Quoted (Trade)
a. Equity Shares (fully paid)
Wendt (India) Ltd. 797352 797352 10 10.36 10.36
Coromandel Engineering Co. Ltd. 42900 42900 10 0.43 0.43
II Quoted (Non-Trade)
a. Equity Shares (fully paid)
John Oakey Mohan Ltd. 1900 1900 10 0.05 0.05
Grindwell Norton Ltd. 400 400 5 0.01 0.01
Orient Abrasives Ltd. 5000 5000 1 0.00 0.00
EID Parry (India) Ltd. 500 500 2 0.01 0.01
Cholamandalam DBS Finance Ltd. 100 100 10 0.00 0.00
Tube Investments of India Ltd. 1000 1000 2 0.01 0.01
Coromandel Fertililsers Ltd. 165 165 2 0.00 0.00
III Unquoted (Trade)
a. Equity Shares (fully paid)
Murugappa Morgan Thermal Ceramics Ltd. 1430793 1430793 10 44.04 44.04
Murugappa Management Services Ltd. 25205 25205 100 2.53 2.53
Ciria India Ltd. 59998 59999 10 1.68 1.68
CUMI Employees Co-operative Society/Stores 0.03 0.03
Jingri CUMI Super Hard Materials Co., Ltd China (a) 231.39 231.39
Kerala Enviro Infrastructure Ltd. 10000 10000 10 0.10 0.10
b. Equity Shares (fully paid) - Subsidiaries
CUMI Canada Inc., Canada 1250000 1250000 CAD 1 48.01 48.01
Sterling Abrasives Ltd. 54000 54000 100 37.10 37.10
Net Access (India) Pvt. Ltd. 1600000 1600000 10 16.00 16.00
CUMI Australia Pty Ltd., Australia 1050 1050 AUD 1 14.79 14.79
Southern Energy Development Corpn. Ltd. 389908 310008 10 54.65 11.12
CUMI America Inc., USA 500 500 USD 100 2.13 2.13
CUMI- Middle East FZE, UAE 1 1 AED 100000 1.26 1.26
CUMI International Ltd., Cyprus 13999787 13999787 USD 1 575.72 575.72
CUMI Fine Materials Ltd. 50000 10 0.50 c. Redeemable Preference Shares (fully paid) -
Subsidiaries
CUMI Canada Inc., Canada 1000000 1000000 CAD1 38.40 38.40
CUMI International Ltd., Cyprus 10000000 10000000 USD 1 409.90 409.90
schedules to Accounts
Independent Financial Statements
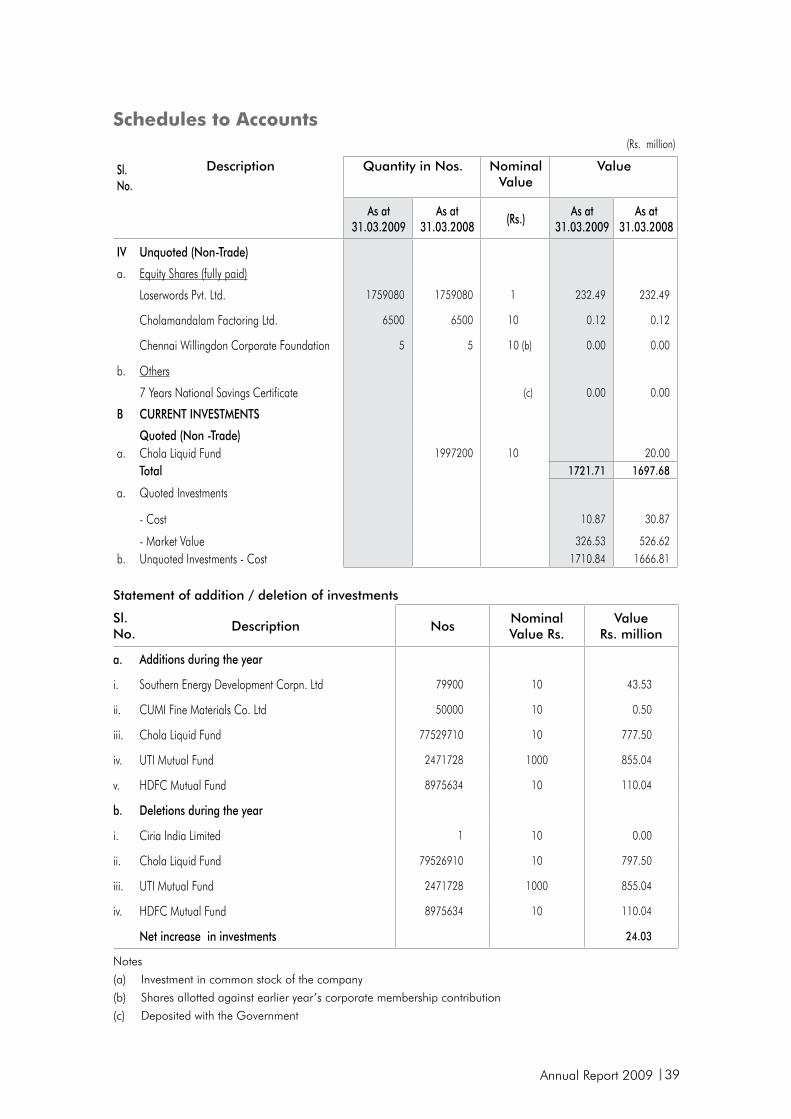
Annual Report 2009 39
(Rs. million)
Sl.No.
Description Quantity in Nos. NominalValue
Value
As at31.03.2009
As at31.03.2008
(Rs.)As at
31.03.2009As at
31.03.2008
IV Unquoted (Non-Trade)
a. Equity Shares (fully paid)
Laserwords Pvt. Ltd. 1759080 1759080 1 232.49 232.49
Cholamandalam Factoring Ltd. 6500 6500 10 0.12 0.12
Chennai Willingdon Corporate Foundation 5 5 10 (b) 0.00 0.00
b. Others
7 Years National Savings Certificate (c) 0.00 0.00
B CURRENT INVESTMENTS
Quoted (Non -Trade)a. Chola Liquid Fund 1997200 10 20.00
Total 1721.71 1697.68
a. Quoted Investments
- Cost 10.87 30.87
- Market Value 326.53 526.62
b. Unquoted Investments - Cost 1710.84 1666.81
Statement of addition / deletion of investments
Sl.No. Description Nos
Nominal Value Rs.
ValueRs. million
a. Additions during the year
i. Southern Energy Development Corpn. Ltd 79900 10 43.53
ii. CUMI Fine Materials Co. Ltd 50000 10 0.50
iii. Chola Liquid Fund 77529710 10 777.50
iv. UTI Mutual Fund 2471728 1000 855.04
v. HDFC Mutual Fund 8975634 10 110.04
b. Deletions during the year
i. Ciria India Limited 1 10 0.00
ii. Chola Liquid Fund 79526910 10 797.50
iii. UTI Mutual Fund 2471728 1000 855.04
iv. HDFC Mutual Fund 8975634 10 110.04
Net increase in investments 24.03
Notes
(a) Investment in common stock of the company
(b) Shares allotted against earlier year’s corporate membership contribution
(c) Deposited with the Government
schedules to Accounts
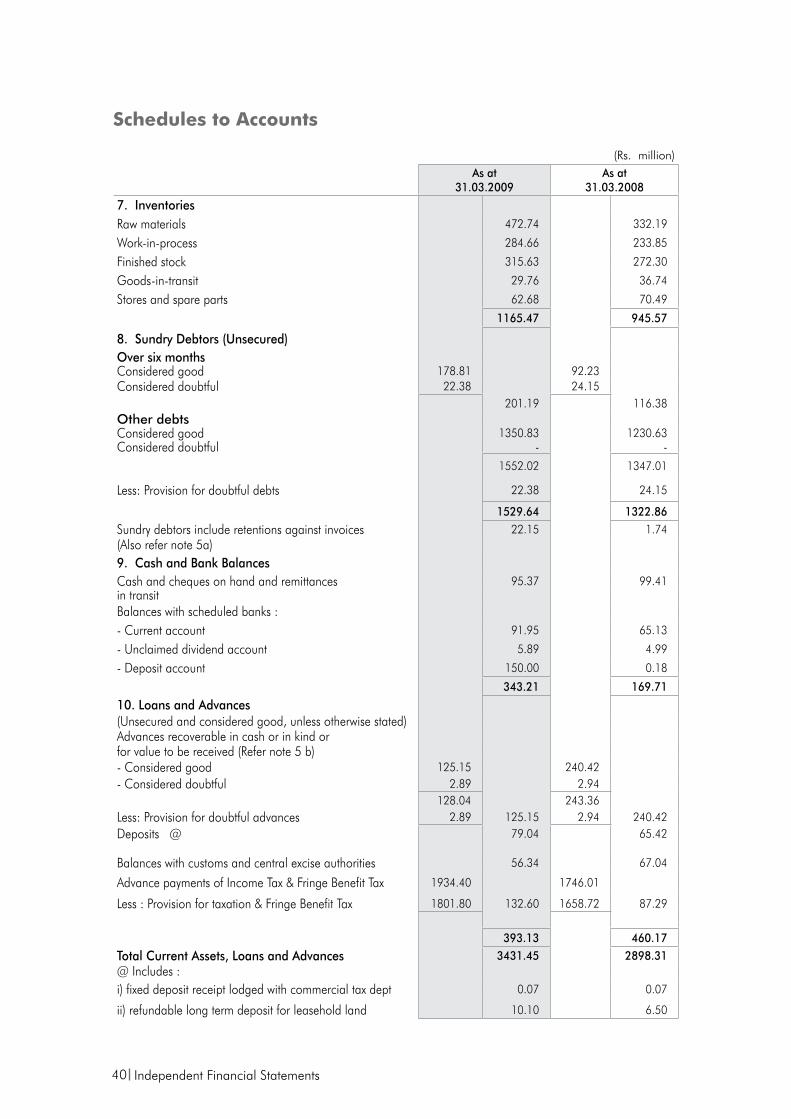
40
(Rs. million)As at
31.03.2009As at
31.03.2008
7. InventoriesRaw materials 472.74 332.19
Work-in-process 284.66 233.85
Finished stock 315.63 272.30
Goods-in-transit 29.76 36.74
Stores and spare parts 62.68 70.49
1165.47 945.57
8. Sundry Debtors (Unsecured)Over six monthsConsidered good 178.81 92.23Considered doubtful 22.38 24.15
201.19 116.38 Other debtsConsidered good 1350.83 1230.63Considered doubtful - -
1552.02 1347.01
Less: Provision for doubtful debts 22.38 24.15
1529.64 1322.86
Sundry debtors include retentions against invoices 22.15 1.74(Also refer note 5a)9. Cash and Bank BalancesCash and cheques on hand and remittances 95.37 99.41in transitBalances with scheduled banks :- Current account 91.95 65.13
- Unclaimed dividend account 5.89 4.99
- Deposit account 150.00 0.18
343.21 169.71
10. Loans and Advances (Unsecured and considered good, unless otherwise stated)Advances recoverable in cash or in kind orfor value to be received (Refer note 5 b)- Considered good 125.15 240.42 - Considered doubtful 2.89 2.94
128.04 243.36 Less: Provision for doubtful advances 2.89 125.15 2.94 240.42 Deposits @ 79.04 65.42
Balances with customs and central excise authorities 56.34 67.04
Advance payments of Income Tax & Fringe Benefit Tax 1934.40 1746.01
Less : Provision for taxation & Fringe Benefit Tax 1801.80 132.60 1658.72 87.29
393.13 460.17
Total Current Assets, Loans and Advances 3431.45 2898.31 @ Includes :i) fixed deposit receipt lodged with commercial tax dept 0.07 0.07
ii) refundable long term deposit for leasehold land 10.10 6.50
schedules to Accounts
Independent Financial Statements
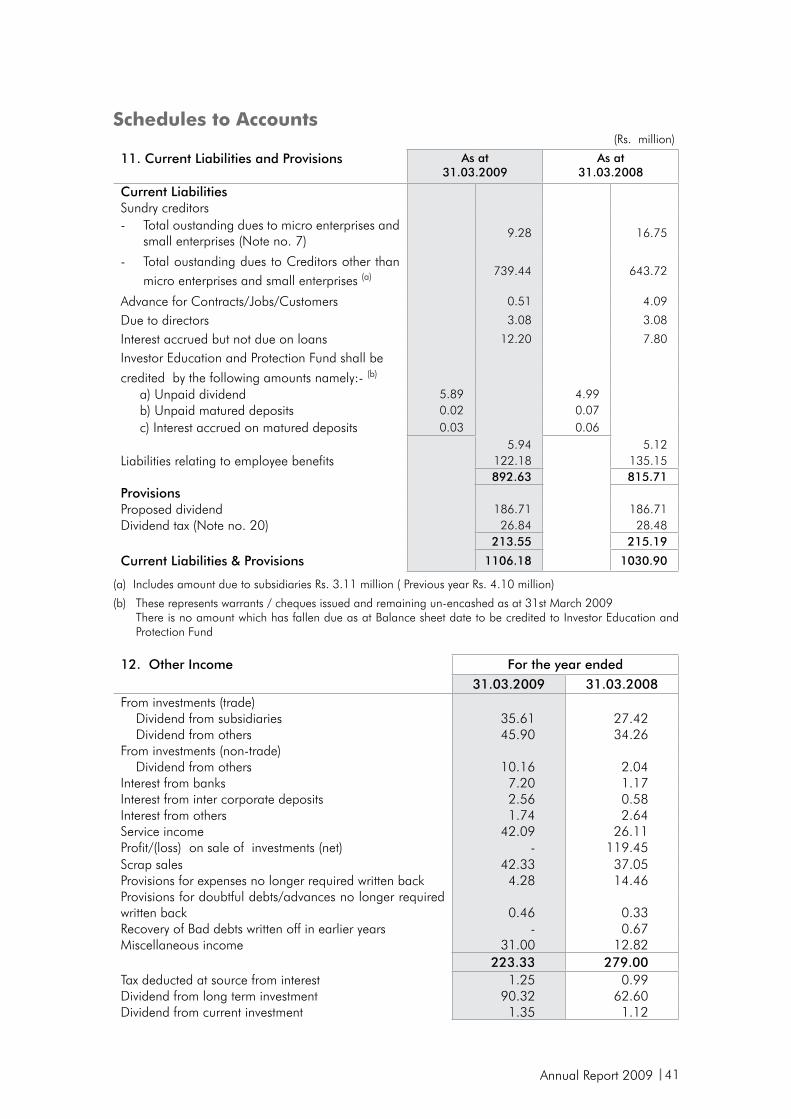
Annual Report 2009 41
(Rs. million)
11. Current Liabilities and Provisions As at31.03.2009
As at31.03.2008
Current Liabilities Sundry creditors - Total oustanding dues to micro enterprises and
small enterprises (Note no. 7)9.28 16.75
- Total oustanding dues to Creditors other than micro enterprises and small enterprises (a) 739.44 643.72
Advance for Contracts/Jobs/Customers 0.51 4.09
Due to directors 3.08 3.08
Interest accrued but not due on loans 12.20 7.80
Investor Education and Protection Fund shall be credited by the following amounts namely:- (b)
a) Unpaid dividend 5.89 4.99 b) Unpaid matured deposits 0.02 0.07 c) Interest accrued on matured deposits 0.03 0.06
5.94 5.12Liabilities relating to employee benefits 122.18 135.15
892.63 815.71 ProvisionsProposed dividend 186.71 186.71Dividend tax (Note no. 20) 26.84 28.48
213.55 215.19
Current Liabilities & Provisions 1106.18 1030.90
(a) Includes amount due to subsidiaries Rs. 3.11 million ( Previous year Rs. 4.10 million)
(b) These represents warrants / cheques issued and remaining un-encashed as at 31st March 2009 There is no amount which has fallen due as at Balance sheet date to be credited to Investor Education and
Protection Fund
12. Other Income For the year ended31.03.2009 31.03.2008
From investments (trade) Dividend from subsidiaries 35.61 27.42 Dividend from others 45.90 34.26From investments (non-trade) Dividend from others 10.16 2.04Interest from banks 7.20 1.17Interest from inter corporate deposits 2.56 0.58Interest from others 1.74 2.64Service income 42.09 26.11Profit/(loss) on sale of investments (net) - 119.45 Scrap sales 42.33 37.05Provisions for expenses no longer required written back 4.28 14.46Provisions for doubtful debts/advances no longer required written back 0.46 0.33Recovery of Bad debts written off in earlier years - 0.67Miscellaneous income 31.00 12.82
223.33 279.00Tax deducted at source from interest 1.25 0.99Dividend from long term investment 90.32 62.60Dividend from current investment 1.35 1.12
schedules to Accounts
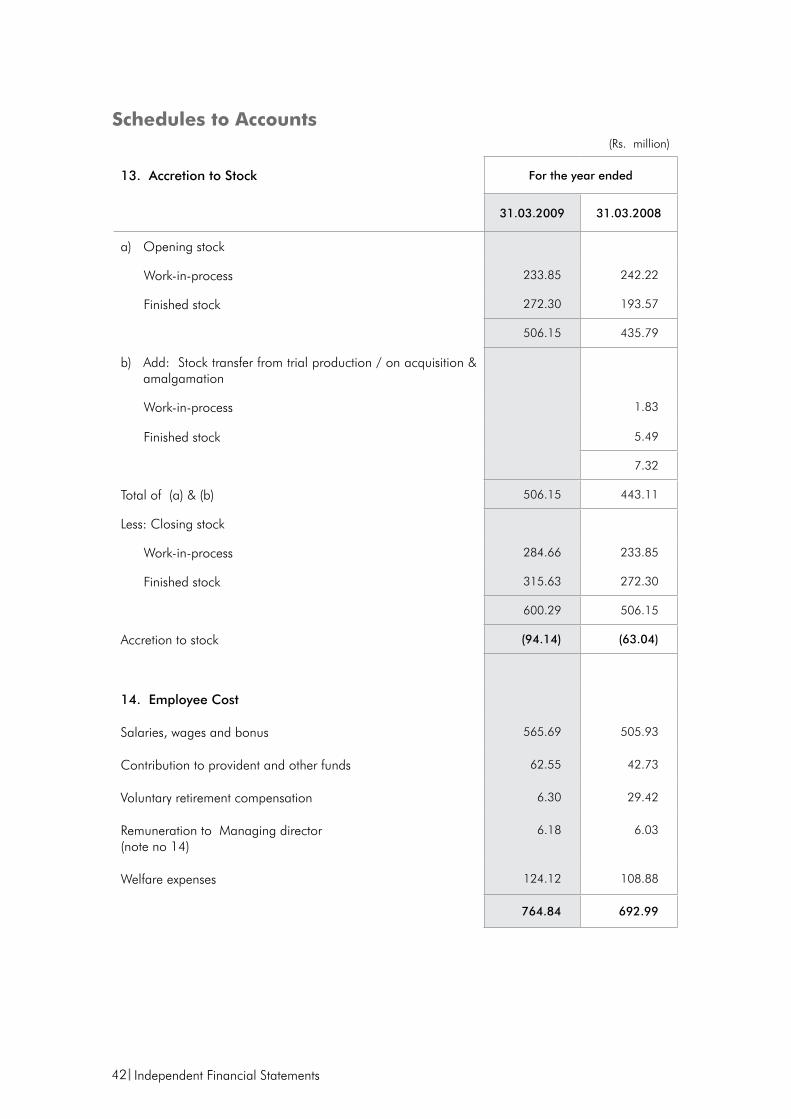
42
(Rs. million)
13. Accretion to Stock For the year ended
31.03.2009 31.03.2008
a) Opening stock
Work-in-process 233.85 242.22
Finished stock 272.30 193.57
506.15 435.79
b) Add: Stock transfer from trial production / on acquisition & amalgamation
Work-in-process 1.83
Finished stock 5.49
7.32
Total of (a) & (b) 506.15 443.11
Less: Closing stock
Work-in-process 284.66 233.85
Finished stock 315.63 272.30
600.29 506.15
Accretion to stock (94.14) (63.04)
14. Employee Cost
Salaries, wages and bonus 565.69 505.93
Contribution to provident and other funds 62.55 42.73
Voluntary retirement compensation 6.30 29.42
Remuneration to Managing director (note no 14)
6.18 6.03
Welfare expenses 124.12 108.88
764.84 692.99
schedules to Accounts
Independent Financial Statements
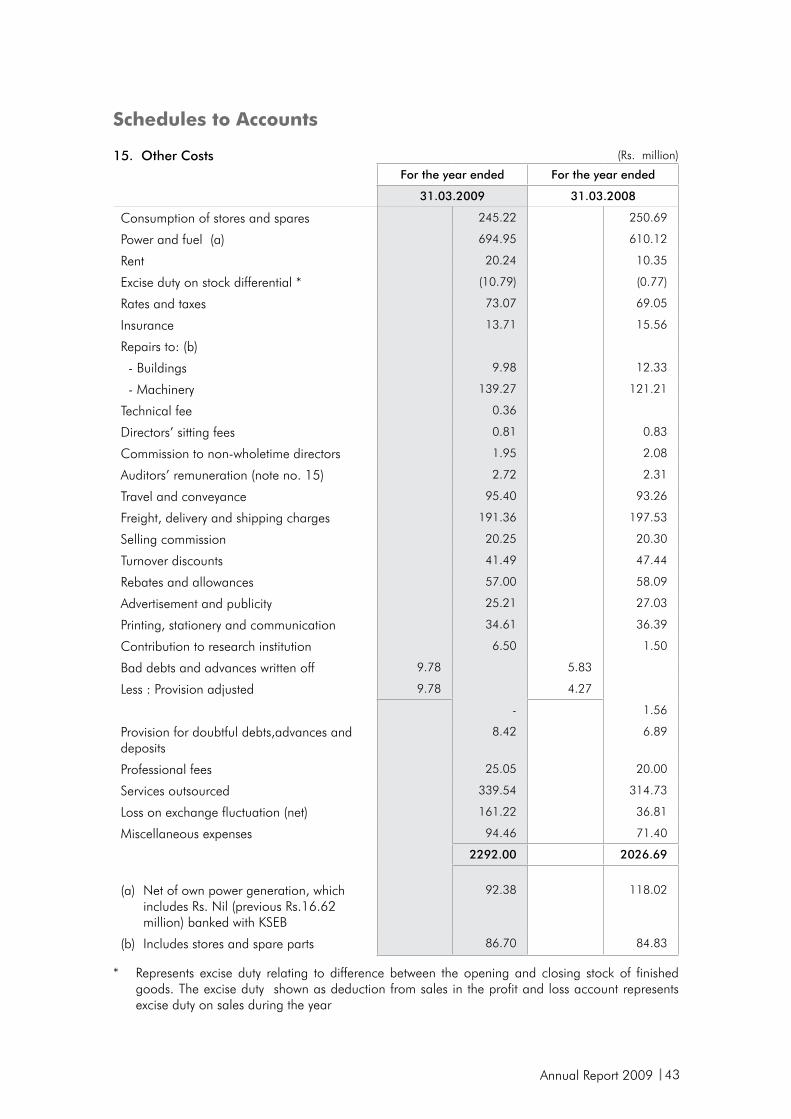
Annual Report 2009 43
15. Other Costs (Rs. million)
For the year ended For the year ended
31.03.2009 31.03.2008
Consumption of stores and spares 245.22 250.69
Power and fuel (a) 694.95 610.12
Rent 20.24 10.35
Excise duty on stock differential * (10.79) (0.77)
Rates and taxes 73.07 69.05
Insurance 13.71 15.56
Repairs to: (b)
- Buildings 9.98 12.33
- Machinery 139.27 121.21
Technical fee 0.36
Directors’ sitting fees 0.81 0.83
Commission to non-wholetime directors 1.95 2.08
Auditors’ remuneration (note no. 15) 2.72 2.31
Travel and conveyance 95.40 93.26
Freight, delivery and shipping charges 191.36 197.53
Selling commission 20.25 20.30
Turnover discounts 41.49 47.44
Rebates and allowances 57.00 58.09
Advertisement and publicity 25.21 27.03
Printing, stationery and communication 34.61 36.39
Contribution to research institution 6.50 1.50
Bad debts and advances written off 9.78 5.83
Less : Provision adjusted 9.78 4.27
- 1.56
Provision for doubtful debts,advances and deposits
8.42 6.89
Professional fees 25.05 20.00
Services outsourced 339.54 314.73
Loss on exchange fluctuation (net) 161.22 36.81
Miscellaneous expenses 94.46 71.40
2292.00 2026.69
(a) Net of own power generation, which includes Rs. Nil (previous Rs.16.62 million) banked with KSEB
92.38 118.02
(b) Includes stores and spare parts 86.70 84.83
* Represents excise duty relating to difference between the opening and closing stock of finished goods. The excise duty shown as deduction from sales in the profit and loss account represents excise duty on sales during the year
schedules to Accounts
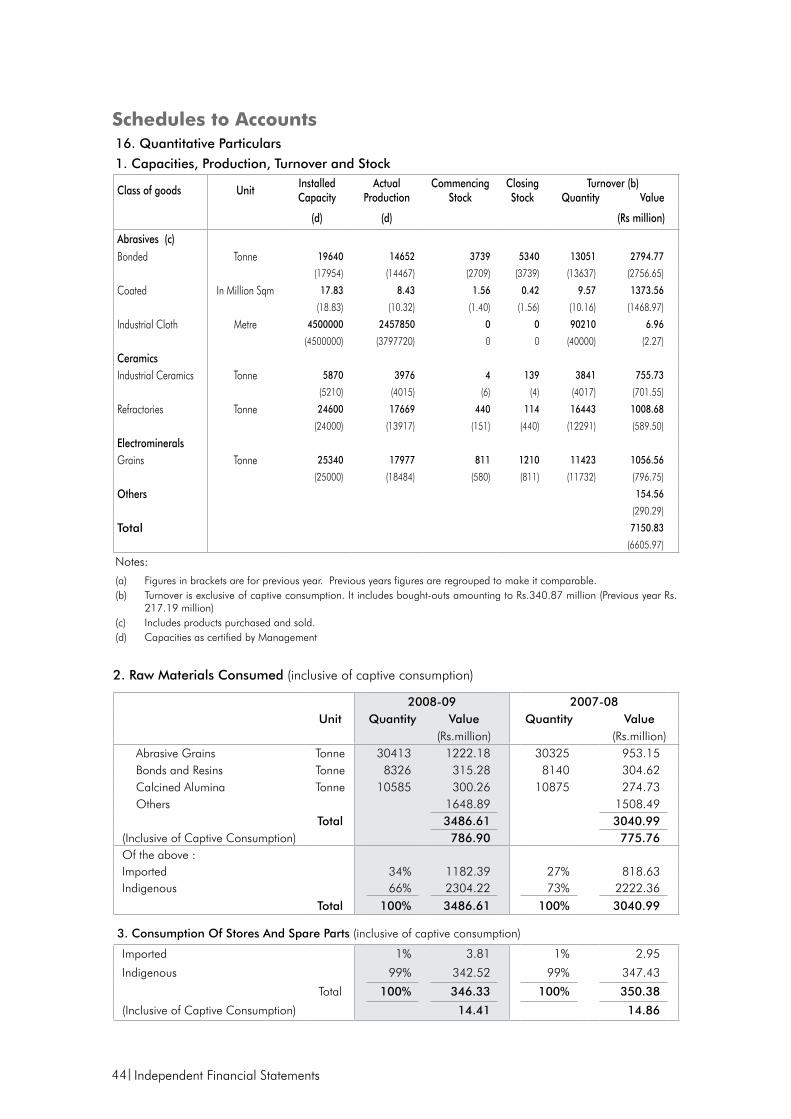
44
16. Quantitative Particulars
1. Capacities, Production, Turnover and Stock
Class of goods UnitInstalled Capacity
Actual Production
Commencing Stock
Closing Stock
Turnover (b) Quantity Value
(d) (d) (Rs million)
Abrasives (c)Bonded Tonne 19640 14652 3739 5340 13051 2794.77
(17954) (14467) (2709) (3739) (13637) (2756.65)
Coated In Million Sqm 17.83 8.43 1.56 0.42 9.57 1373.56
(18.83) (10.32) (1.40) (1.56) (10.16) (1468.97)
Industrial Cloth Metre 4500000 2457850 0 0 90210 6.96
(4500000) (3797720) 0 0 (40000) (2.27)
CeramicsIndustrial Ceramics Tonne 5870 3976 4 139 3841 755.73
(5210) (4015) (6) (4) (4017) (701.55)
Refractories Tonne 24600 17669 440 114 16443 1008.68
(24000) (13917) (151) (440) (12291) (589.50)
ElectromineralsGrains Tonne 25340 17977 811 1210 11423 1056.56
(25000) (18484) (580) (811) (11732) (796.75)
Others 154.56
(290.29)
Total 7150.83
(6605.97)
Notes:
(a) Figures in brackets are for previous year. Previous years figures are regrouped to make it comparable.(b) Turnover is exclusive of captive consumption. It includes bought-outs amounting to Rs.340.87 million (Previous year Rs.
217.19 million)(c) Includes products purchased and sold.(d) Capacities as certified by Management
2. Raw Materials Consumed (inclusive of captive consumption)
2008-09 2007-08 Unit Quantity Value Quantity Value
(Rs.million) (Rs.million) Abrasive Grains Tonne 30413 1222.18 30325 953.15 Bonds and Resins Tonne 8326 315.28 8140 304.62 Calcined Alumina Tonne 10585 300.26 10875 274.73 Others 1648.89 1508.49
Total 3486.61 3040.99 (Inclusive of Captive Consumption) 786.90 775.76 Of the above : Imported 34% 1182.39 27% 818.63 Indigenous 66% 2304.22 73% 2222.36
Total 100% 3486.61 100% 3040.99
3. Consumption Of Stores And Spare Parts (inclusive of captive consumption)
Imported 1% 3.81 1% 2.95
Indigenous 99% 342.52 99% 347.43
Total 100% 346.33 100% 350.38
(Inclusive of Captive Consumption) 14.41 14.86
schedules to Accounts
Independent Financial Statements
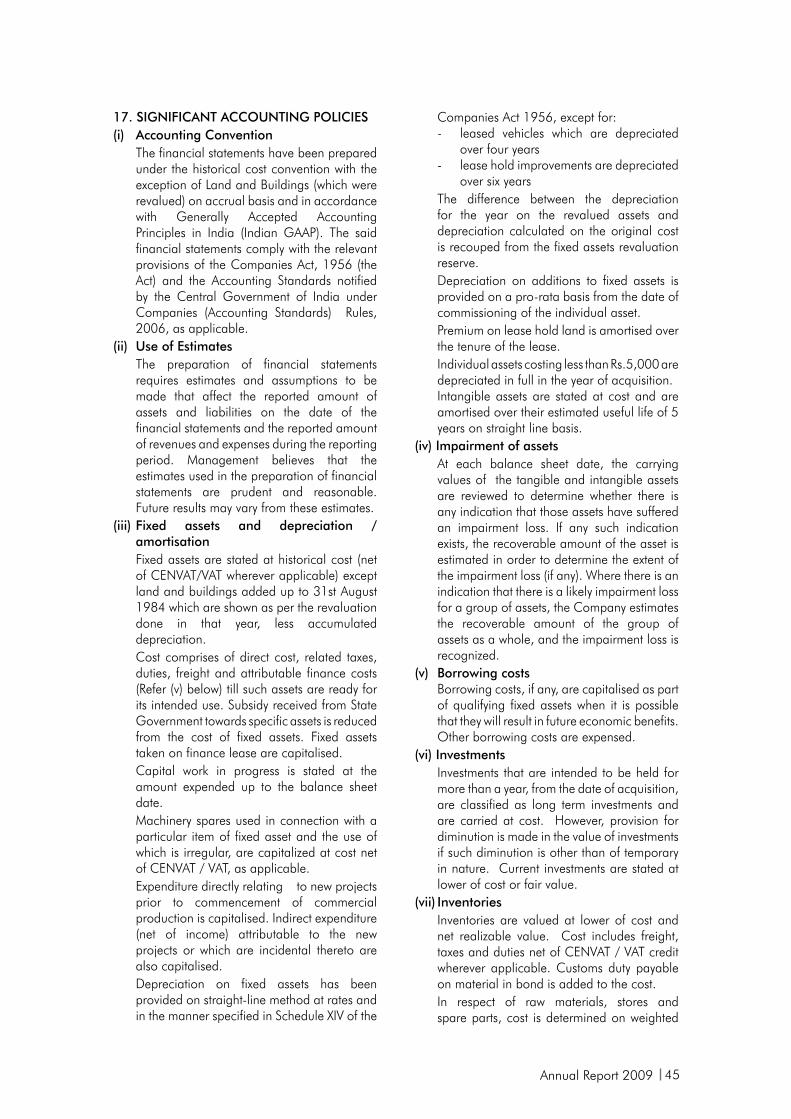
Annual Report 2009 45
17. SIGNIFICANT ACCOUNTING POLICIES(i) Accounting Convention The financial statements have been prepared
under the historical cost convention with the exception of Land and Buildings (which were revalued) on accrual basis and in accordance with Generally Accepted Accounting Principles in India (Indian GAAP). The said financial statements comply with the relevant provisions of the Companies Act, 1956 (the Act) and the Accounting Standards notified by the Central Government of India under Companies (Accounting Standards) Rules, 2006, as applicable.
(ii) Use of Estimates The preparation of financial statements
requires estimates and assumptions to be made that affect the reported amount of assets and liabilities on the date of the financial statements and the reported amount of revenues and expenses during the reporting period. Management believes that the estimates used in the preparation of financial statements are prudent and reasonable. Future results may vary from these estimates.
(iii) Fixed assets and depreciation / amortisation
Fixed assets are stated at historical cost (net of CENVAT/VAT wherever applicable) except land and buildings added up to 31st August 1984 which are shown as per the revaluation done in that year, less accumulated depreciation.
Cost comprises of direct cost, related taxes, duties, freight and attributable finance costs (Refer (v) below) till such assets are ready for its intended use. Subsidy received from State Government towards specific assets is reduced from the cost of fixed assets. Fixed assets taken on finance lease are capitalised.
Capital work in progress is stated at the amount expended up to the balance sheet date.
Machinery spares used in connection with a particular item of fixed asset and the use of which is irregular, are capitalized at cost net of CENVAT / VAT, as applicable.
Expenditure directly relating to new projects prior to commencement of commercial production is capitalised. Indirect expenditure (net of income) attributable to the new projects or which are incidental thereto are also capitalised.
Depreciation on fixed assets has been provided on straight-line method at rates and in the manner specified in Schedule XIV of the
Companies Act 1956, except for: - leased vehicles which are depreciated
over four years - lease hold improvements are depreciated
over six years The difference between the depreciation
for the year on the revalued assets and depreciation calculated on the original cost is recouped from the fixed assets revaluation reserve.
Depreciation on additions to fixed assets is provided on a pro-rata basis from the date of commissioning of the individual asset.
Premium on lease hold land is amortised over the tenure of the lease.
Individual assets costing less than Rs.5,000 are depreciated in full in the year of acquisition.
Intangible assets are stated at cost and are amortised over their estimated useful life of 5 years on straight line basis.
(iv) Impairment of assets At each balance sheet date, the carrying
values of the tangible and intangible assets are reviewed to determine whether there is any indication that those assets have suffered an impairment loss. If any such indication exists, the recoverable amount of the asset is estimated in order to determine the extent of the impairment loss (if any). Where there is an indication that there is a likely impairment loss for a group of assets, the Company estimates the recoverable amount of the group of assets as a whole, and the impairment loss is recognized.
(v) Borrowing costs Borrowing costs, if any, are capitalised as part
of qualifying fixed assets when it is possible that they will result in future economic benefits. Other borrowing costs are expensed.
(vi) Investments Investments that are intended to be held for
more than a year, from the date of acquisition, are classified as long term investments and are carried at cost. However, provision for diminution is made in the value of investments if such diminution is other than of temporary in nature. Current investments are stated at lower of cost or fair value.
(vii) Inventories Inventories are valued at lower of cost and
net realizable value. Cost includes freight, taxes and duties net of CENVAT / VAT credit wherever applicable. Customs duty payable on material in bond is added to the cost.
In respect of raw materials, stores and spare parts, cost is determined on weighted
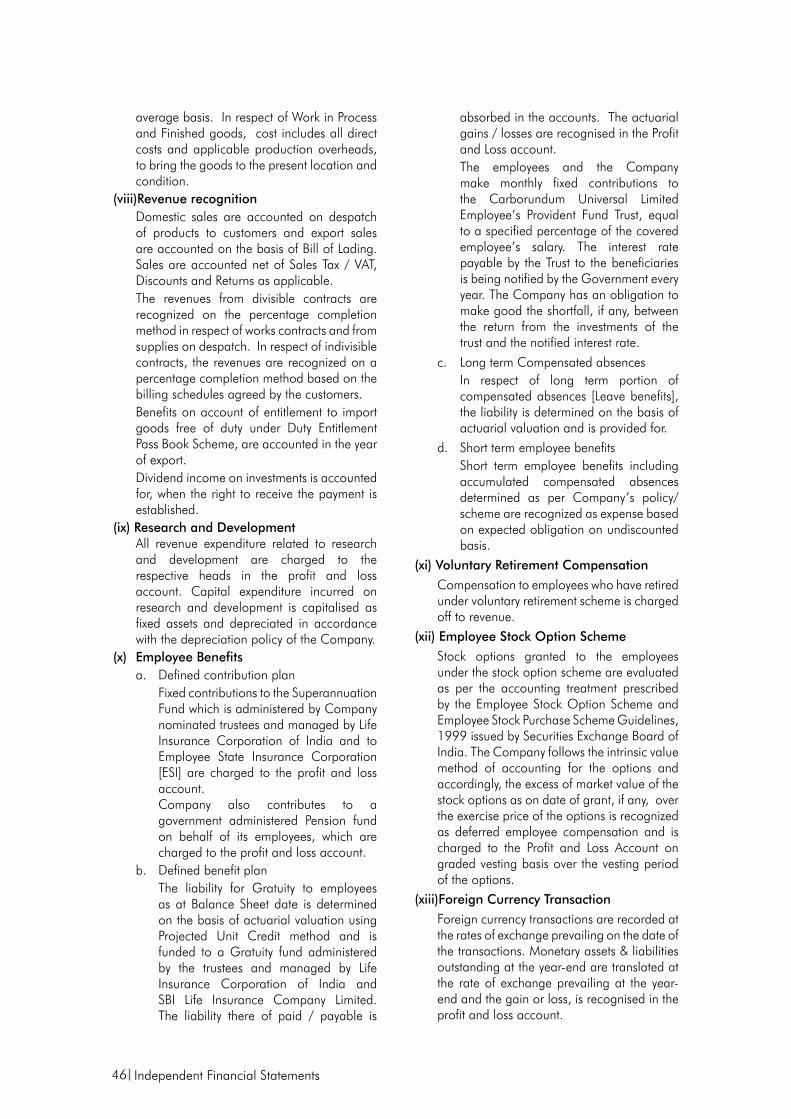
46
average basis. In respect of Work in Process and Finished goods, cost includes all direct costs and applicable production overheads, to bring the goods to the present location and condition.
(viii)Revenue recognition Domestic sales are accounted on despatch
of products to customers and export sales are accounted on the basis of Bill of Lading. Sales are accounted net of Sales Tax / VAT, Discounts and Returns as applicable.
The revenues from divisible contracts are recognized on the percentage completion method in respect of works contracts and from supplies on despatch. In respect of indivisible contracts, the revenues are recognized on a percentage completion method based on the billing schedules agreed by the customers.
Benefits on account of entitlement to import goods free of duty under Duty Entitlement Pass Book Scheme, are accounted in the year of export.
Dividend income on investments is accounted for, when the right to receive the payment is established.
(ix) Research and Development All revenue expenditure related to research
and development are charged to the respective heads in the profit and loss account. Capital expenditure incurred on research and development is capitalised as fixed assets and depreciated in accordance with the depreciation policy of the Company.
(x) Employee Benefits a. Defined contribution plan Fixed contributions to the Superannuation
Fund which is administered by Company nominated trustees and managed by Life Insurance Corporation of India and to Employee State Insurance Corporation [ESI] are charged to the profit and loss account.
Company also contributes to a government administered Pension fund on behalf of its employees, which are charged to the profit and loss account.
b. Defined benefit plan The liability for Gratuity to employees
as at Balance Sheet date is determined on the basis of actuarial valuation using Projected Unit Credit method and is funded to a Gratuity fund administered by the trustees and managed by Life Insurance Corporation of India and SBI Life Insurance Company Limited. The liability there of paid / payable is
absorbed in the accounts. The actuarial gains / losses are recognised in the Profit and Loss account.
The employees and the Company make monthly fixed contributions to the Carborundum Universal Limited Employee’s Provident Fund Trust, equal to a specified percentage of the covered employee’s salary. The interest rate payable by the Trust to the beneficiaries is being notified by the Government every year. The Company has an obligation to make good the shortfall, if any, between the return from the investments of the trust and the notified interest rate.
c. Long term Compensated absences In respect of long term portion of
compensated absences [Leave benefits], the liability is determined on the basis of actuarial valuation and is provided for.
d. Short term employee benefits Short term employee benefits including
accumulated compensated absences determined as per Company’s policy/scheme are recognized as expense based on expected obligation on undiscounted basis.
(xi) Voluntary Retirement Compensation Compensation to employees who have retired
under voluntary retirement scheme is charged off to revenue.
(xii) Employee Stock Option Scheme Stock options granted to the employees
under the stock option scheme are evaluated as per the accounting treatment prescribed by the Employee Stock Option Scheme and Employee Stock Purchase Scheme Guidelines, 1999 issued by Securities Exchange Board of India. The Company follows the intrinsic value method of accounting for the options and accordingly, the excess of market value of the stock options as on date of grant, if any, over the exercise price of the options is recognized as deferred employee compensation and is charged to the Profit and Loss Account on graded vesting basis over the vesting period of the options.
(xiii)Foreign Currency Transaction Foreign currency transactions are recorded at
the rates of exchange prevailing on the date of the transactions. Monetary assets & liabilities outstanding at the year-end are translated at the rate of exchange prevailing at the year-end and the gain or loss, is recognised in the profit and loss account.
Independent Financial Statements
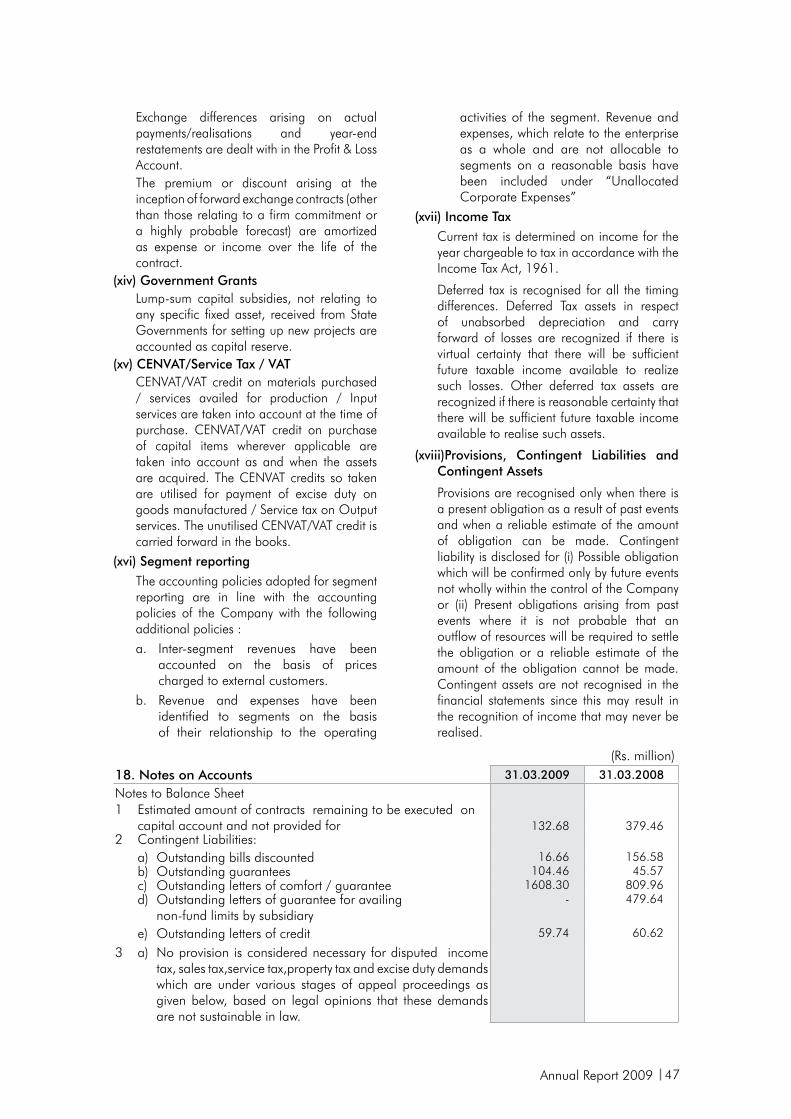
Annual Report 2009 47
Exchange differences arising on actual payments/realisations and year-end restatements are dealt with in the Profit & Loss Account.
The premium or discount arising at the inception of forward exchange contracts (other than those relating to a firm commitment or a highly probable forecast) are amortized as expense or income over the life of the contract.
(xiv) Government Grants Lump-sum capital subsidies, not relating to
any specific fixed asset, received from State Governments for setting up new projects are accounted as capital reserve.
(xv) CENVAT/Service Tax / VAT CENVAT/VAT credit on materials purchased
/ services availed for production / Input services are taken into account at the time of purchase. CENVAT/VAT credit on purchase of capital items wherever applicable are taken into account as and when the assets are acquired. The CENVAT credits so taken are utilised for payment of excise duty on goods manufactured / Service tax on Output services. The unutilised CENVAT/VAT credit is carried forward in the books.
(xvi) Segment reporting The accounting policies adopted for segment
reporting are in line with the accounting policies of the Company with the following additional policies :
a. Inter-segment revenues have been accounted on the basis of prices charged to external customers.
b. Revenue and expenses have been identified to segments on the basis of their relationship to the operating
activities of the segment. Revenue and expenses, which relate to the enterprise as a whole and are not allocable to segments on a reasonable basis have been included under “Unallocated Corporate Expenses”
(xvii) Income Tax Current tax is determined on income for the
year chargeable to tax in accordance with the Income Tax Act, 1961.
Deferred tax is recognised for all the timing differences. Deferred Tax assets in respect of unabsorbed depreciation and carry forward of losses are recognized if there is virtual certainty that there will be sufficient future taxable income available to realize such losses. Other deferred tax assets are recognized if there is reasonable certainty that there will be sufficient future taxable income available to realise such assets.
(xviii)Provisions, Contingent Liabilities and Contingent Assets
Provisions are recognised only when there is a present obligation as a result of past events and when a reliable estimate of the amount of obligation can be made. Contingent liability is disclosed for (i) Possible obligation which will be confirmed only by future events not wholly within the control of the Company or (ii) Present obligations arising from past events where it is not probable that an outflow of resources will be required to settle the obligation or a reliable estimate of the amount of the obligation cannot be made. Contingent assets are not recognised in the financial statements since this may result in the recognition of income that may never be realised.
(Rs. million)18. Notes on Accounts 31.03.2009 31.03.2008
Notes to Balance Sheet1 Estimated amount of contracts remaining to be executed on
capital account and not provided for 132.68 379.462 Contingent Liabilities:
a) Outstanding bills discounted 16.66 156.58b) Outstanding guarantees 104.46 45.57c) Outstanding letters of comfort / guarantee 1608.30 809.96d) Outstanding letters of guarantee for availing
non-fund limits by subsidiary- 479.64
e) Outstanding letters of credit 59.74 60.62
3 a) No provision is considered necessary for disputed income tax, sales tax,service tax,property tax and excise duty demands which are under various stages of appeal proceedings as given below, based on legal opinions that these demands are not sustainable in law.
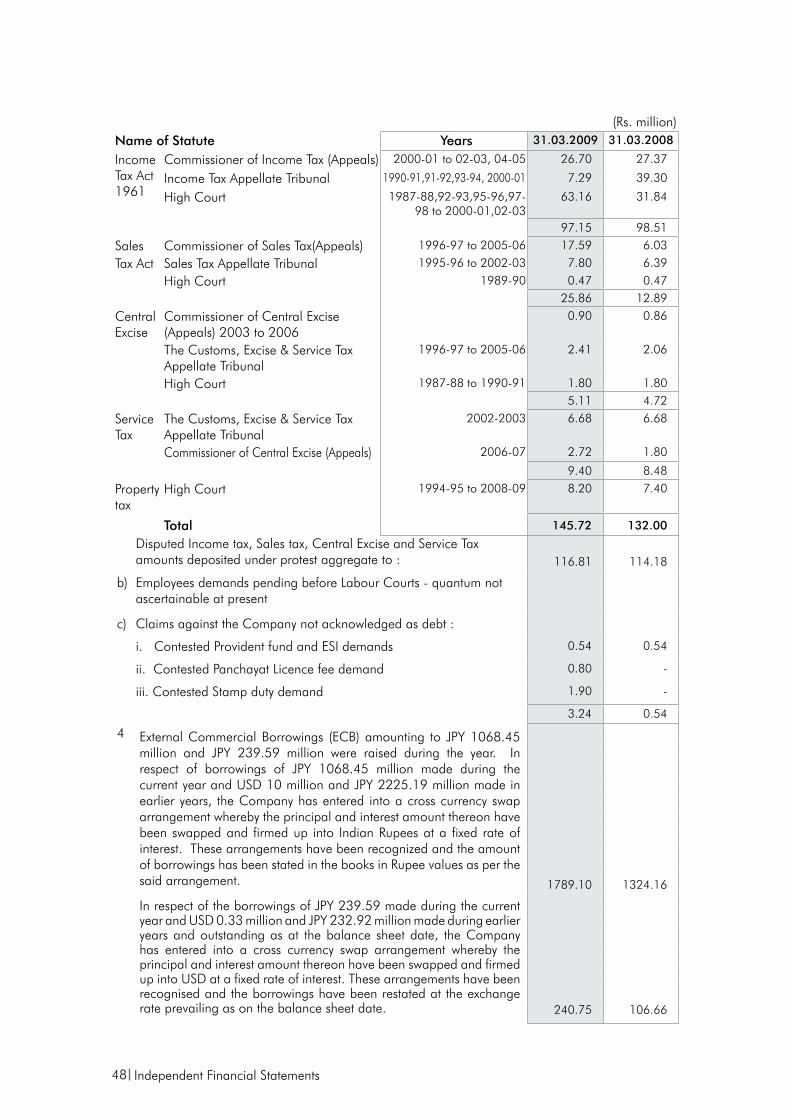
48
Disputed Income tax, Sales tax, Central Excise and Service Tax amounts deposited under protest aggregate to : 116.81 114.18
b) Employees demands pending before Labour Courts - quantum not ascertainable at present
c) Claims against the Company not acknowledged as debt :
i. Contested Provident fund and ESI demands 0.54 0.54
ii. Contested Panchayat Licence fee demand 0.80 -
iii. Contested Stamp duty demand 1.90 -
3.24 0.54
4 External Commercial Borrowings (ECB) amounting to JPY 1068.45 million and JPY 239.59 million were raised during the year. In respect of borrowings of JPY 1068.45 million made during the current year and USD 10 million and JPY 2225.19 million made in earlier years, the Company has entered into a cross currency swap arrangement whereby the principal and interest amount thereon have been swapped and firmed up into Indian Rupees at a fixed rate of interest. These arrangements have been recognized and the amount of borrowings has been stated in the books in Rupee values as per the said arrangement. 1789.10 1324.16
In respect of the borrowings of JPY 239.59 made during the current year and USD 0.33 million and JPY 232.92 million made during earlier years and outstanding as at the balance sheet date, the Company has entered into a cross currency swap arrangement whereby the principal and interest amount thereon have been swapped and firmed up into USD at a fixed rate of interest. These arrangements have been recognised and the borrowings have been restated at the exchange rate prevailing as on the balance sheet date. 240.75 106.66
(Rs. million)Name of Statute Years 31.03.2009 31.03.2008
Income Tax Act 1961
Commissioner of Income Tax (Appeals) 2000-01 to 02-03, 04-05 26.70 27.37
Income Tax Appellate Tribunal 1990-91,91-92,93-94, 2000-01 7.29 39.30
High Court 1987-88,92-93,95-96,97-98 to 2000-01,02-03
63.16 31.84
97.15 98.51
Sales Commissioner of Sales Tax(Appeals) 1996-97 to 2005-06 17.59 6.03
Tax Act Sales Tax Appellate Tribunal 1995-96 to 2002-03 7.80 6.39
High Court 1989-90 0.47 0.4725.86 12.89
Central Excise
Commissioner of Central Excise (Appeals) 2003 to 2006
0.90 0.86
The Customs, Excise & Service Tax Appellate Tribunal
1996-97 to 2005-06 2.41 2.06
High Court 1987-88 to 1990-91 1.80 1.805.11 4.72
Service Tax
The Customs, Excise & Service Tax Appellate Tribunal
2002-2003 6.68 6.68
Commissioner of Central Excise (Appeals) 2006-07 2.72 1.80
9.40 8.48
Property tax
High Court 1994-95 to 2008-09 8.20 7.40
Total 145.72 132.00
Independent Financial Statements
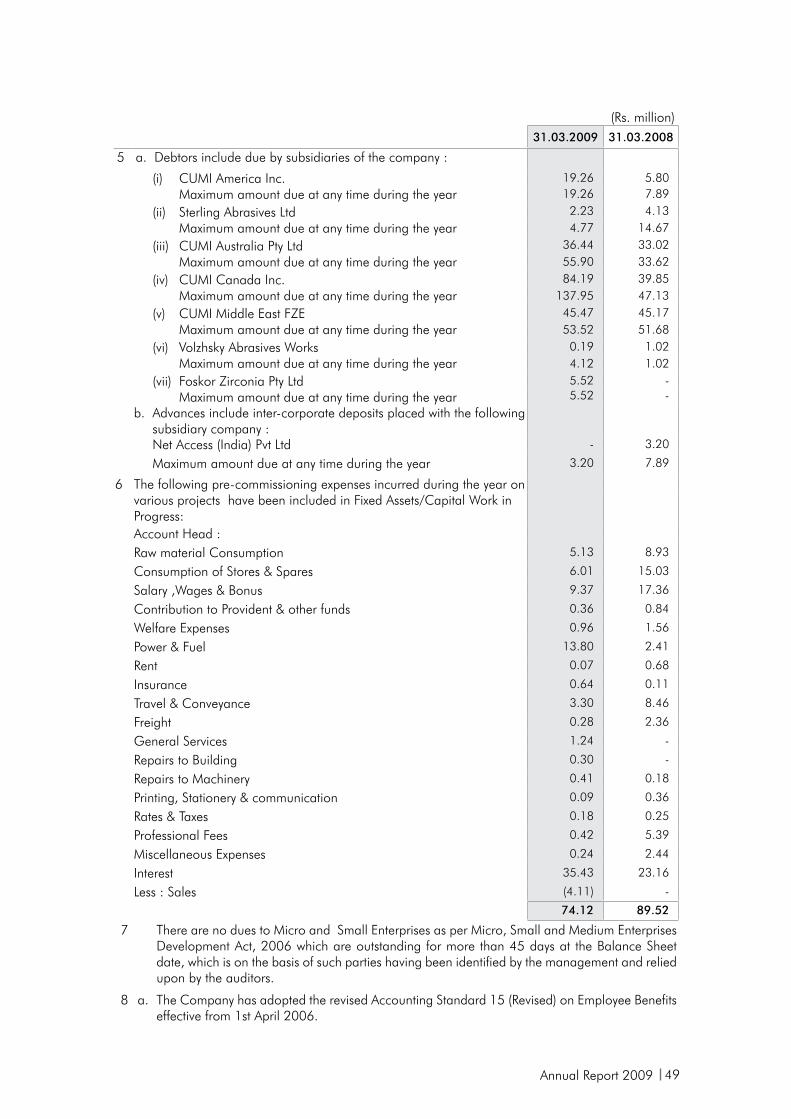
Annual Report 2009 49
(Rs. million)31.03.2009 31.03.2008
5 a. Debtors include due by subsidiaries of the company :
(i) CUMI America Inc. Maximum amount due at any time during the year (ii) Sterling Abrasives Ltd Maximum amount due at any time during the year (iii) CUMI Australia Pty Ltd Maximum amount due at any time during the year (iv) CUMI Canada Inc. Maximum amount due at any time during the year (v) CUMI Middle East FZE Maximum amount due at any time during the year (vi) Volzhsky Abrasives Works Maximum amount due at any time during the year (vii) Foskor Zirconia Pty Ltd Maximum amount due at any time during the year
19.26 5.8019.26 7.892.23 4.134.77 14.67
36.44 33.0255.90 33.6284.19 39.85
137.95 47.1345.47 45.1753.52 51.68
0.19 1.024.12 1.025.52 -5.52 -
b. Advances include inter-corporate deposits placed with the following subsidiary company :
Net Access (India) Pvt Ltd - 3.20
Maximum amount due at any time during the year 3.20 7.89
6 The following pre-commissioning expenses incurred during the year on various projects have been included in Fixed Assets/Capital Work in Progress:Account Head :Raw material Consumption 5.13 8.93
Consumption of Stores & Spares 6.01 15.03
Salary ,Wages & Bonus 9.37 17.36
Contribution to Provident & other funds 0.36 0.84
Welfare Expenses 0.96 1.56
Power & Fuel 13.80 2.41
Rent 0.07 0.68
Insurance 0.64 0.11
Travel & Conveyance 3.30 8.46
Freight 0.28 2.36
General Services 1.24 -
Repairs to Building 0.30 -
Repairs to Machinery 0.41 0.18
Printing, Stationery & communication 0.09 0.36
Rates & Taxes 0.18 0.25
Professional Fees 0.42 5.39
Miscellaneous Expenses 0.24 2.44
Interest 35.43 23.16
Less : Sales (4.11) -
74.12 89.52
7 There are no dues to Micro and Small Enterprises as per Micro, Small and Medium Enterprises Development Act, 2006 which are outstanding for more than 45 days at the Balance Sheet date, which is on the basis of such parties having been identified by the management and relied upon by the auditors.
8 a. The Company has adopted the revised Accounting Standard 15 (Revised) on Employee Benefits effective from 1st April 2006.
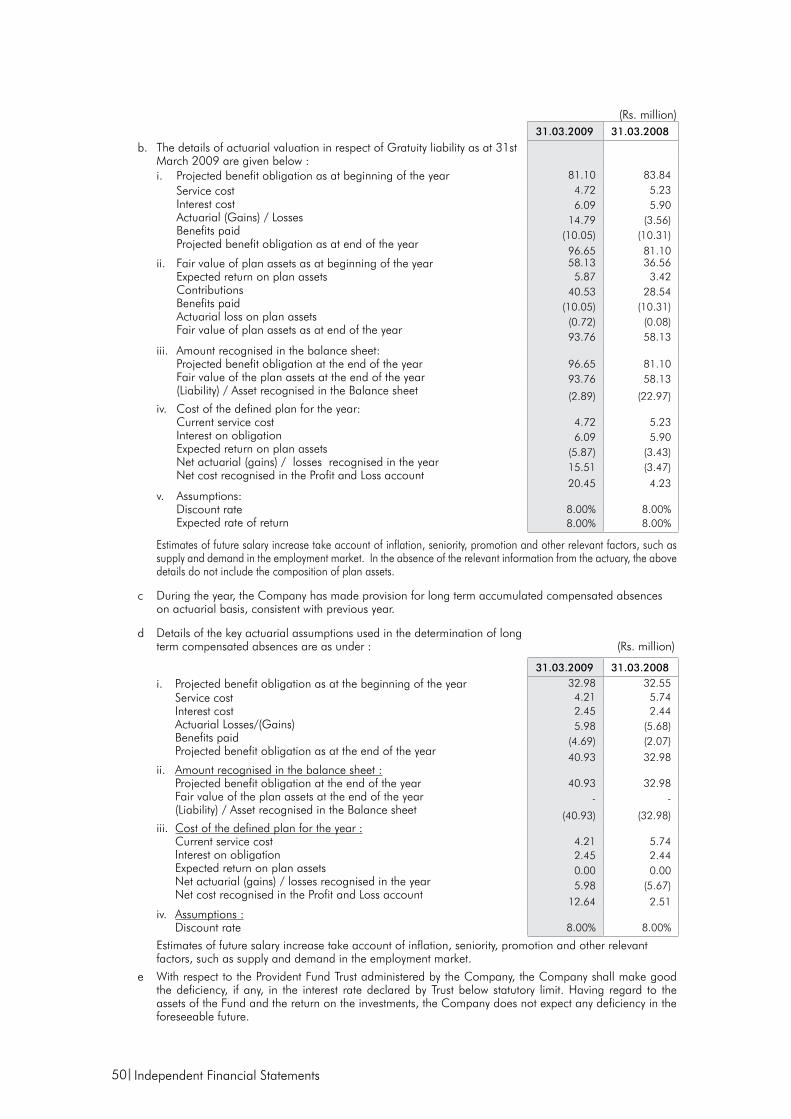
50
(Rs. million)31.03.2009 31.03.2008
b. The details of actuarial valuation in respect of Gratuity liability as at 31st March 2009 are given below :i. Projected benefit obligation as at beginning of the year 81.10 83.84
Service cost Interest cost Actuarial (Gains) / Losses Benefits paid Projected benefit obligation as at end of the year
4.72 5.23 6.09 5.90
14.79 (3.56)(10.05) (10.31)96.65 81.10
ii. Fair value of plan assets as at beginning of the year Expected return on plan assets Contributions Benefits paid Actuarial loss on plan assets Fair value of plan assets as at end of the year
58.13 36.56 5.87 3.42
40.53 28.54 (10.05) (10.31)
(0.72) (0.08)93.76 58.13
iii. Amount recognised in the balance sheet: Projected benefit obligation at the end of the year Fair value of the plan assets at the end of the year (Liability) / Asset recognised in the Balance sheet
96.65 81.10 93.76 58.13
(2.89) (22.97)iv. Cost of the defined plan for the year: Current service cost Interest on obligation Expected return on plan assets Net actuarial (gains) / losses recognised in the year Net cost recognised in the Profit and Loss account
4.72 5.23 6.09 5.90
(5.87) (3.43)15.51 (3.47)
20.45 4.23 v. Assumptions: Discount rate Expected rate of return
8.00% 8.00%8.00% 8.00%
Estimates of future salary increase take account of inflation, seniority, promotion and other relevant factors, such as supply and demand in the employment market. In the absence of the relevant information from the actuary, the above details do not include the composition of plan assets.
c During the year, the Company has made provision for long term accumulated compensated absences on actuarial basis, consistent with previous year.
d Details of the key actuarial assumptions used in the determination of long term compensated absences are as under : (Rs. million)
31.03.2009 31.03.2008
i. Projected benefit obligation as at the beginning of the year 32.98 32.55 Service cost Interest cost Actuarial Losses/(Gains) Benefits paid Projected benefit obligation as at the end of the year
4.21 5.74 2.45 2.44 5.98 (5.68)
(4.69) (2.07)
40.93 32.98 ii. Amount recognised in the balance sheet : Projected benefit obligation at the end of the year Fair value of the plan assets at the end of the year (Liability) / Asset recognised in the Balance sheet
40.93 32.98 - -
(40.93) (32.98)iii. Cost of the defined plan for the year : Current service cost Interest on obligation Expected return on plan assets Net actuarial (gains) / losses recognised in the year Net cost recognised in the Profit and Loss account
4.21 5.74 2.45 2.44 0.00 0.00 5.98 (5.67)
12.64 2.51 iv. Assumptions : Discount rate 8.00% 8.00%
Estimates of future salary increase take account of inflation, seniority, promotion and other relevant factors, such as supply and demand in the employment market.
e With respect to the Provident Fund Trust administered by the Company, the Company shall make good the deficiency, if any, in the interest rate declared by Trust below statutory limit. Having regard to the assets of the Fund and the return on the investments, the Company does not expect any deficiency in the foreseeable future.
Independent Financial Statements
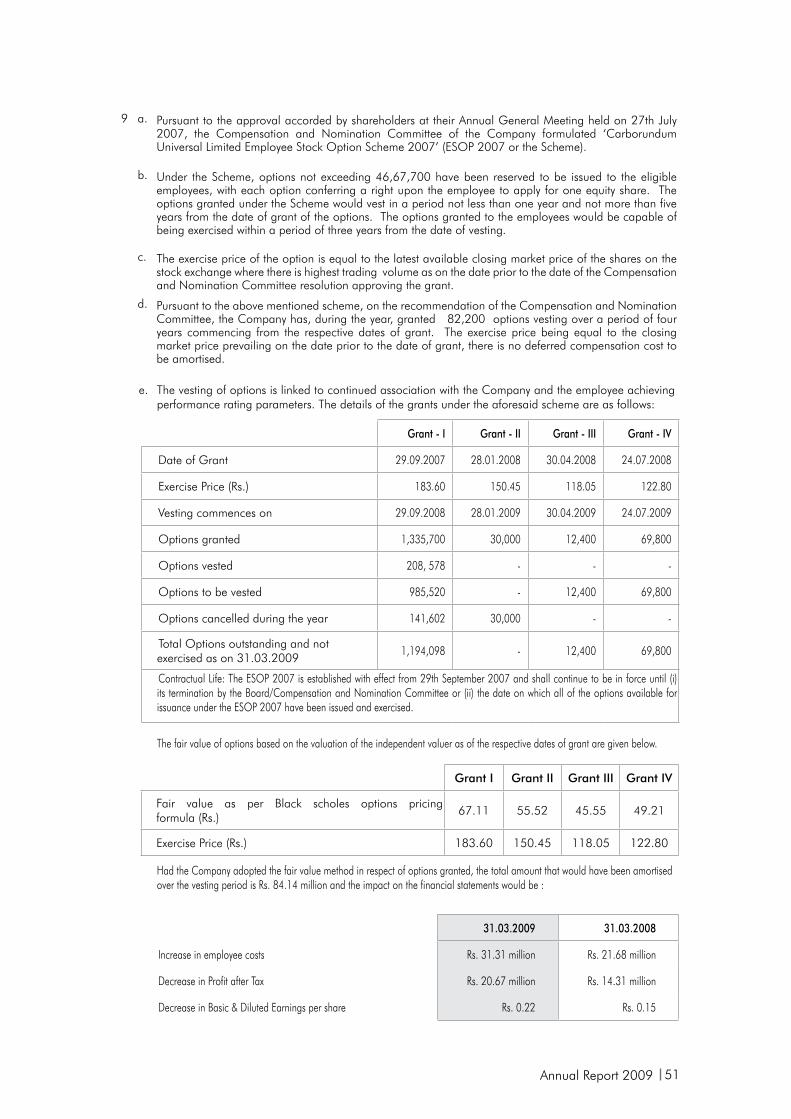
Annual Report 2009 51
9 a. Pursuant to the approval accorded by shareholders at their Annual General Meeting held on 27th July 2007, the Compensation and Nomination Committee of the Company formulated ‘Carborundum Universal Limited Employee Stock Option Scheme 2007’ (ESOP 2007 or the Scheme).
b. Under the Scheme, options not exceeding 46,67,700 have been reserved to be issued to the eligible employees, with each option conferring a right upon the employee to apply for one equity share. The options granted under the Scheme would vest in a period not less than one year and not more than five years from the date of grant of the options. The options granted to the employees would be capable of being exercised within a period of three years from the date of vesting.
c. The exercise price of the option is equal to the latest available closing market price of the shares on the stock exchange where there is highest trading volume as on the date prior to the date of the Compensation and Nomination Committee resolution approving the grant.
d. Pursuant to the above mentioned scheme, on the recommendation of the Compensation and Nomination Committee, the Company has, during the year, granted 82,200 options vesting over a period of four years commencing from the respective dates of grant. The exercise price being equal to the closing market price prevailing on the date prior to the date of grant, there is no deferred compensation cost to be amortised.
e. The vesting of options is linked to continued association with the Company and the employee achieving performance rating parameters. The details of the grants under the aforesaid scheme are as follows:
Grant - I Grant - II Grant - III Grant - IV
Date of Grant 29.09.2007 28.01.2008 30.04.2008 24.07.2008
Exercise Price (Rs.) 183.60 150.45 118.05 122.80
Vesting commences on 29.09.2008 28.01.2009 30.04.2009 24.07.2009
Options granted 1,335,700 30,000 12,400 69,800
Options vested 208, 578 - - -
Options to be vested 985,520 - 12,400 69,800
Options cancelled during the year 141,602 30,000 - -
Total Options outstanding and not exercised as on 31.03.2009
1,194,098 - 12,400 69,800
Contractual Life: The ESOP 2007 is established with effect from 29th September 2007 and shall continue to be in force until (i) its termination by the Board/Compensation and Nomination Committee or (ii) the date on which all of the options available for issuance under the ESOP 2007 have been issued and exercised.
The fair value of options based on the valuation of the independent valuer as of the respective dates of grant are given below.
Grant I Grant II Grant III Grant IV
Fair value as per Black scholes options pricing formula (Rs.)
67.11 55.52 45.55 49.21
Exercise Price (Rs.) 183.60 150.45 118.05 122.80
Had the Company adopted the fair value method in respect of options granted, the total amount that would have been amortised over the vesting period is Rs. 84.14 million and the impact on the financial statements would be :
31.03.2009 31.03.2008
Increase in employee costs Rs. 31.31 million Rs. 21.68 million
Decrease in Profit after Tax Rs. 20.67 million Rs. 14.31 million
Decrease in Basic & Diluted Earnings per share Rs. 0.22 Rs. 0.15
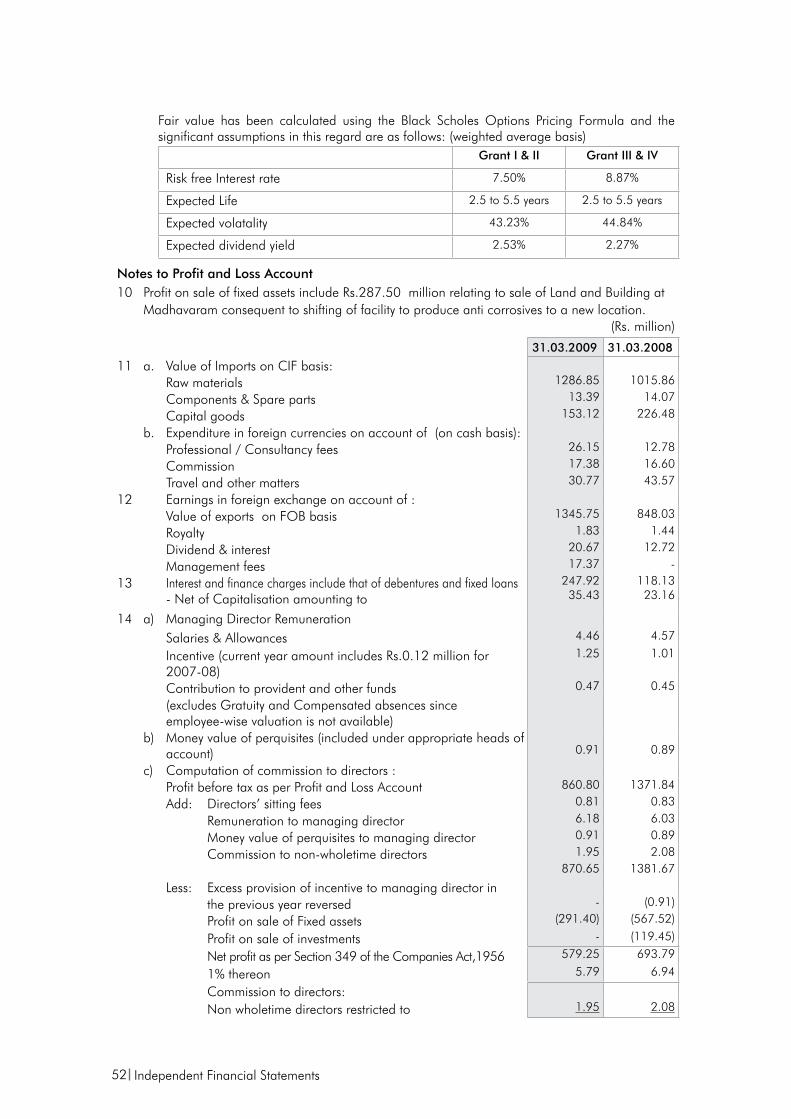
52
Notes to Profit and Loss Account10 Profit on sale of fixed assets include Rs.287.50 million relating to sale of Land and Building at
Madhavaram consequent to shifting of facility to produce anti corrosives to a new location.(Rs. million)
31.03.2009 31.03.2008
11 a. Value of Imports on CIF basis: Raw materials 1286.85 1015.86
Components & Spare parts 13.39 14.07
Capital goods 153.12 226.48
b. Expenditure in foreign currencies on account of (on cash basis): Professional / Consultancy fees 26.15 12.78
Commission 17.38 16.60
Travel and other matters 30.77 43.57
12 Earnings in foreign exchange on account of : Value of exports on FOB basis 1345.75 848.03
Royalty 1.83 1.44
Dividend & interest 20.67 12.72
Management fees 17.37 -
13 Interest and finance charges include that of debentures and fixed loans - Net of Capitalisation amounting to
247.9235.43
118.1323.16
14 a) Managing Director Remuneration Salaries & Allowances 4.46 4.57
Incentive (current year amount includes Rs.0.12 million for 2007-08)
1.25 1.01
Contribution to provident and other funds 0.47 0.45
(excludes Gratuity and Compensated absences since employee-wise valuation is not available)
b) Money value of perquisites (included under appropriate heads of account) 0.91 0.89
c) Computation of commission to directors : Profit before tax as per Profit and Loss Account 860.80 1371.84
Add: Directors’ sitting fees 0.81 0.83
Remuneration to managing director 6.18 6.03
Money value of perquisites to managing director 0.91 0.89
Commission to non-wholetime directors 1.95 2.08870.65 1381.67
Less: Excess provision of incentive to managing director in the previous year reversed - (0.91)
Profit on sale of Fixed assets (291.40) (567.52)
Profit on sale of investments - (119.45)
Net profit as per Section 349 of the Companies Act,1956 579.25 693.79
1% thereon 5.79 6.94
Commission to directors: Non wholetime directors restricted to 1.95 2.08
Fair value has been calculated using the Black Scholes Options Pricing Formula and the significant assumptions in this regard are as follows: (weighted average basis)
Grant I & II Grant III & IV
Risk free Interest rate 7.50% 8.87%
Expected Life 2.5 to 5.5 years 2.5 to 5.5 years
Expected volatality 43.23% 44.84%
Expected dividend yield 2.53% 2.27%
Independent Financial Statements
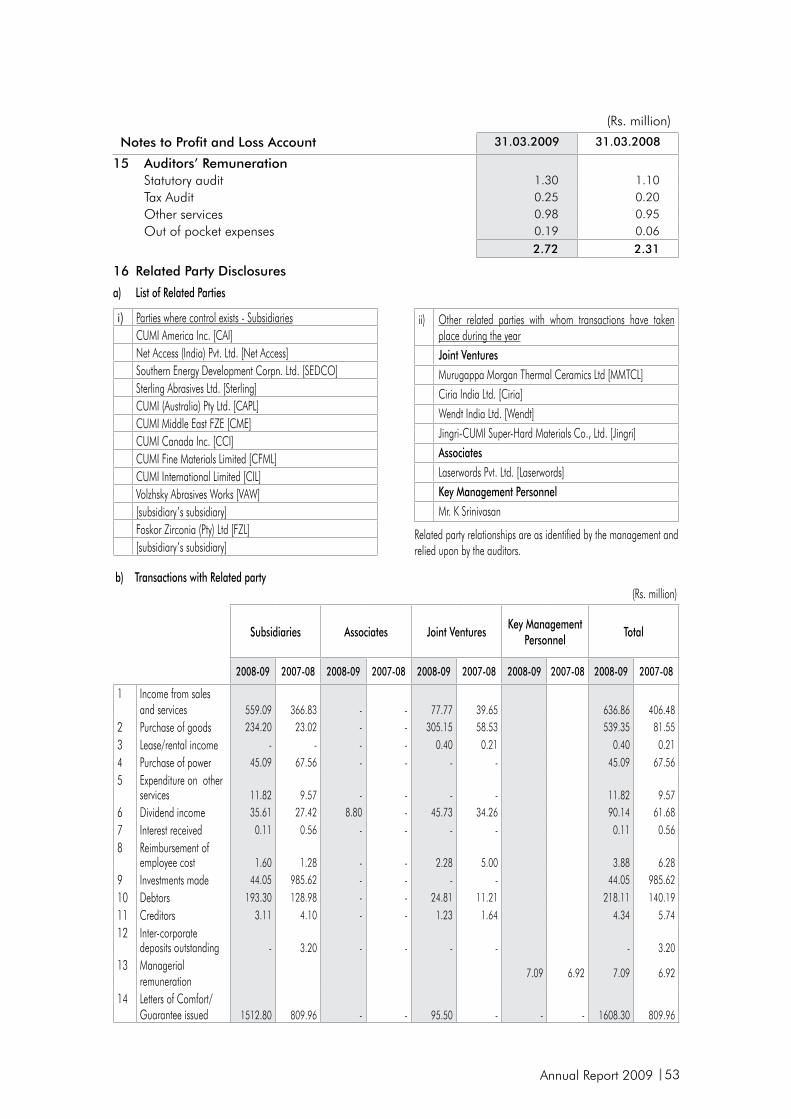
Annual Report 2009 53
(Rs. million)
Notes to Profit and Loss Account 31.03.2009 31.03.2008
15 Auditors’ Remuneration Statutory audit 1.30 1.10Tax Audit 0.25 0.20Other services 0.98 0.95Out of pocket expenses 0.19 0.06
2.72 2.31
b) Transactions with Related party(Rs. million)
Subsidiaries Associates Joint VenturesKey Management
PersonnelTotal
2008-09 2007-08 2008-09 2007-08 2008-09 2007-08 2008-09 2007-08 2008-09 2007-08
1 Income from sales and services 559.09 366.83 - - 77.77 39.65 636.86 406.48
2 Purchase of goods 234.20 23.02 - - 305.15 58.53 539.35 81.55
3 Lease/rental income - - - - 0.40 0.21 0.40 0.21
4 Purchase of power 45.09 67.56 - - - - 45.09 67.56
5 Expenditure on other services 11.82 9.57 - - - - 11.82 9.57
6 Dividend income 35.61 27.42 8.80 - 45.73 34.26 90.14 61.68
7 Interest received 0.11 0.56 - - - - 0.11 0.56
8 Reimbursement of employee cost 1.60 1.28 - - 2.28 5.00 3.88 6.28
9 Investments made 44.05 985.62 - - - - 44.05 985.62
10 Debtors 193.30 128.98 - - 24.81 11.21 218.11 140.19
11 Creditors 3.11 4.10 - - 1.23 1.64 4.34 5.74
12 Inter-corporate deposits outstanding - 3.20 - - - - - 3.20
13 Managerial remuneration
7.09 6.92 7.09 6.92
14 Letters of Comfort/Guarantee issued 1512.80 809.96 - - 95.50 - - - 1608.30 809.96
ii) Other related parties with whom transactions have taken place during the yearJoint VenturesMurugappa Morgan Thermal Ceramics Ltd [MMTCL]Ciria India Ltd. [Ciria]Wendt India Ltd. [Wendt]Jingri-CUMI Super-Hard Materials Co., Ltd. [Jingri]AssociatesLaserwords Pvt. Ltd. [Laserwords]Key Management PersonnelMr. K Srinivasan
Related party relationships are as identified by the management and relied upon by the auditors.
i) Parties where control exists - SubsidiariesCUMI America Inc. [CAI]Net Access (India) Pvt. Ltd. [Net Access]Southern Energy Development Corpn. Ltd. [SEDCO]Sterling Abrasives Ltd. [Sterling]CUMI (Australia) Pty Ltd. [CAPL]CUMI Middle East FZE [CME]CUMI Canada Inc. [CCI]CUMI Fine Materials Limited [CFML]CUMI International Limited [CIL]Volzhsky Abrasives Works [VAW][subsidiary’s subsidiary]Foskor Zirconia (Pty) Ltd [FZL][subsidiary’s subsidiary]
16 Related Party Disclosures
a) List of Related Parties
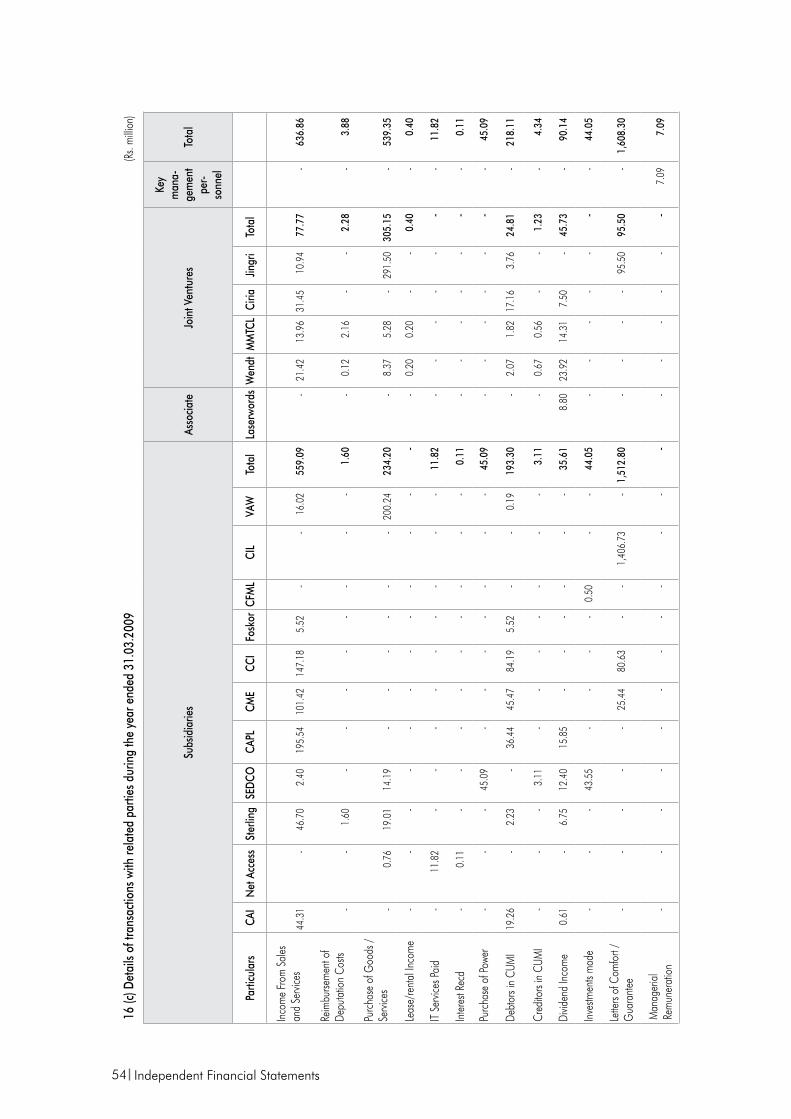
54
16 (c
) Det
ails
of tr
ansa
ctio
ns w
ith re
late
d pa
rties
dur
ing
the
year
end
ed 3
1.03
.200
9(R
s. m
illion
)
Subs
idia
ries
Asso
ciate
Join
t Ven
ture
s
Key
man
a-
gem
ent
per-
sonn
el
Tota
l
Parti
cula
rsCA
IN
et A
cces
sSt
erlin
gSE
DCO
CAPL
CME
CCI
Fosk
orCF
ML
CIL
VAW
Tota
lLa
serw
ords
Wen
dt M
MTC
LCi
riaJin
gri
Tota
l
Inco
me
From
Sal
es
and
Servi
ces
44
.31
- 46
.70
2.4
0 19
5.54
1
01.4
2 1
47.1
8 5
.52
- -
16.
02
559.
09
- 21
.42
13.
96
31
.45
10.
94
77.
77
- 6
36.8
6
Reim
burse
men
t of
Depu
tatio
n Co
sts-
- 1.
60
- -
- -
- -
- -
1.6
0 -
0.1
2 2
.16
- -
2.2
8 -
3.8
8
Purc
hase
of G
oods
/ Se
rvice
s-
0.7
6 19
.01
14.1
9 -
- -
- -
- 20
0.24
23
4.20
-
8.3
7 5
.28
- 2
91.5
0 3
05.1
5 -
539
.35
Leas
e/re
ntal
Inco
me
- -
- -
- -
- -
- -
- -
- 0
.20
0.2
0 -
- 0
.40
- 0
.40
IT Se
rvice
s Pai
d-
11.
82
- -
- -
- -
- -
- 11
.82
- -
- -
- -
- 1
1.82
Inter
est R
ecd
- 0
.11
- -
- -
- -
- -
- 0
.11
- -
- -
- -
- 0
.11
Purc
hase
of P
ower
- -
- 45
.09
- -
- -
- -
- 45
.09
- -
- -
- -
- 4
5.09
Debt
ors i
n CU
MI
19.2
6 -
2.23
-
36.4
4 4
5.47
84
.19
5.5
2 -
- 0
.19
193.
30
- 2
.07
1.8
2 17
.16
3.7
6 2
4.81
-
218
.11
Cred
itors
in C
UMI
- -
- 3
.11
- -
- -
- -
- 3
.11
- 0
.67
0.5
6 -
- 1
.23
- 4
.34
Divid
end
Inco
me
0.6
1 -
6.75
12
.40
15.8
5 -
- -
- -
- 35
.61
8.8
0 23
.92
14.
31
7.5
0 -
45.
73
- 9
0.14
Inve
stmen
ts m
ade
- -
- 43
.55
- -
- -
0.5
0 -
- 44
.05
- -
- -
- -
- 4
4.05
Lette
rs of
Com
fort
/ G
uara
ntee
- -
- -
- 2
5.44
80
.63
- -
1,4
06.7
3 -
1,51
2.80
-
- -
- 9
5.50
9
5.50
-
1,60
8.30
Man
ager
ial
Rem
uner
atio
n-
- -
- -
- -
- -
- -
- -
- -
- -
- 7.
09
7.0
9
Independent Financial Statements
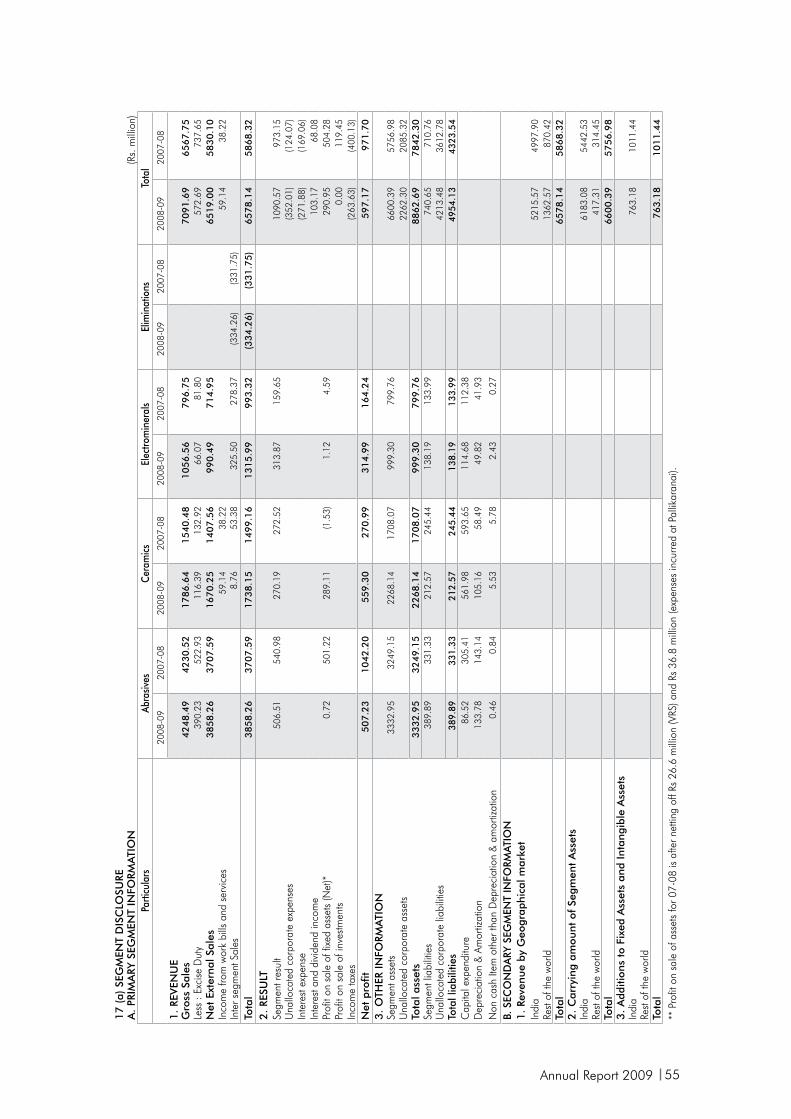
Annual Report 2009 55
17
(a)
SEG
MEN
T D
ISC
LOSU
REA
. PR
IMA
RY S
EGM
ENT
INFO
RMA
TIO
N
(Rs.
mill
ion)
Parti
cula
rsAb
rasiv
esC
eram
ics
Elec
trom
iner
als
Elim
inat
ions
Tota
l20
08-0
920
07-0
820
08-0
920
07-0
820
08-0
920
07-0
820
08-0
920
07-0
820
08-0
920
07-0
81
. RE
VEN
UE
Gro
ss S
ales
42
48
.49
42
30
.52
17
86
.64
15
40
.48
10
56
.56
79
6.7
57
09
1.6
96
56
7.7
5Le
ss :
Exci
se D
uty
390.
2352
2.93
116.
3913
2.92
66.0
781
.80
572.
6973
7.65
Net
Ext
erna
l Sal
es3
85
8.2
63
70
7.5
91
67
0.2
51
40
7.5
69
90
.49
71
4.9
56
51
9.0
05
83
0.1
0In
com
e fro
m w
ork
bills
and
ser
vice
s59
.14
38.2
259
.14
38.2
2In
ter s
egm
ent S
ales
8.76
53.3
832
5.50
278.
37(3
34.2
6)(3
31.7
5)
Tota
l3
85
8.2
63
70
7.5
91
73
8.1
51
49
9.1
61
31
5.9
99
93
.32
(33
4.2
6)
(33
1.7
5)
65
78
.14
58
68
.32
2.
RESU
LTSe
gmen
t res
ult
506.
5154
0.98
270.
1927
2.52
313.
8715
9.65
1090
.57
973.
15U
nallo
cate
d co
rpor
ate
expe
nses
(352
.01)
(124
.07)
Inte
rest
exp
ense
(271
.88)
(169
.06)
Inte
rest
and
div
iden
d in
com
e10
3.17
68
.08
Prof
it on
sal
e of
fixe
d as
sets
(Net
)*0.
7250
1.22
289.
11(1
.53)
1.12
4.59
290.
9550
4.28
Prof
it on
sal
e of
inve
stm
ents
0.00
119.
45
Inco
me
taxe
s(2
63.6
3)(4
00.1
3)
Net
pro
fit5
07
.23
10
42
.20
55
9.3
02
70
.99
31
4.9
91
64
.24
59
7.1
79
71
.70
3.
OTH
ER IN
FORM
ATI
ON
Segm
ent a
sset
s33
32.9
532
49.1
522
68.1
417
08.0
799
9.30
799.
7666
00.3
957
56.9
8U
nallo
cate
d co
rpor
ate
asse
ts22
62.3
020
85.3
2To
tal a
sset
s3
33
2.9
53
24
9.1
52
26
8.1
41
70
8.0
79
99
.30
79
9.7
68
86
2.6
97
84
2.3
0Se
gmen
t lia
bilit
ies
389.
8933
1.33
212.
5724
5.44
138.
1913
3.99
740.
6571
0.76
Una
lloca
ted
corp
orat
e lia
bilit
ies
4213
.48
3612
.78
Tota
l lia
bilit
ies
389.
8933
1.33
212.
5724
5.44
138.
1913
3.99
4954
.13
4323
.54
Cap
ital e
xpen
ditu
re86
.52
305.
4156
1.98
593.
6511
4.68
112.
38D
epre
ciat
ion
& A
mor
tizat
ion
133.
7814
3.14
105.
1658
.49
49.8
241
.93
Non
cas
h Ite
m o
ther
than
Dep
reci
atio
n &
am
ortiz
atio
n0.
460.
845.
535.
782.
430.
27
B. S
ECO
ND
ARY
SEG
MEN
T IN
FORM
ATIO
N1
. Re
venu
e by
Geo
grap
hica
l mar
ket
Indi
a52
15.5
749
97.9
0Re
st o
f the
wor
ld13
62.5
787
0.42
Tota
l6
57
8.1
45
86
8.3
22
. C
arry
ing
amou
nt o
f Se
gmen
t A
sset
sIn
dia
6183
.08
5442
.53
Rest
of t
he w
orld
417.
3131
4.45
Tota
l6
60
0.3
95
75
6.9
83
. A
dditi
ons
to F
ixed
Ass
ets
and
Inta
ngib
le A
sset
sIn
dia
763.
1810
11.4
4Re
st o
f the
wor
ldTo
tal
76
3.1
81
01
1.4
4
** P
rofit
on
sale
of a
sset
s fo
r 07-
08 is
afte
r net
ting
off R
s 26
.6 m
illio
n (V
RS) a
nd R
s 36
.8 m
illio
n (e
xpen
ses
incu
rred
at P
allik
aran
ai).
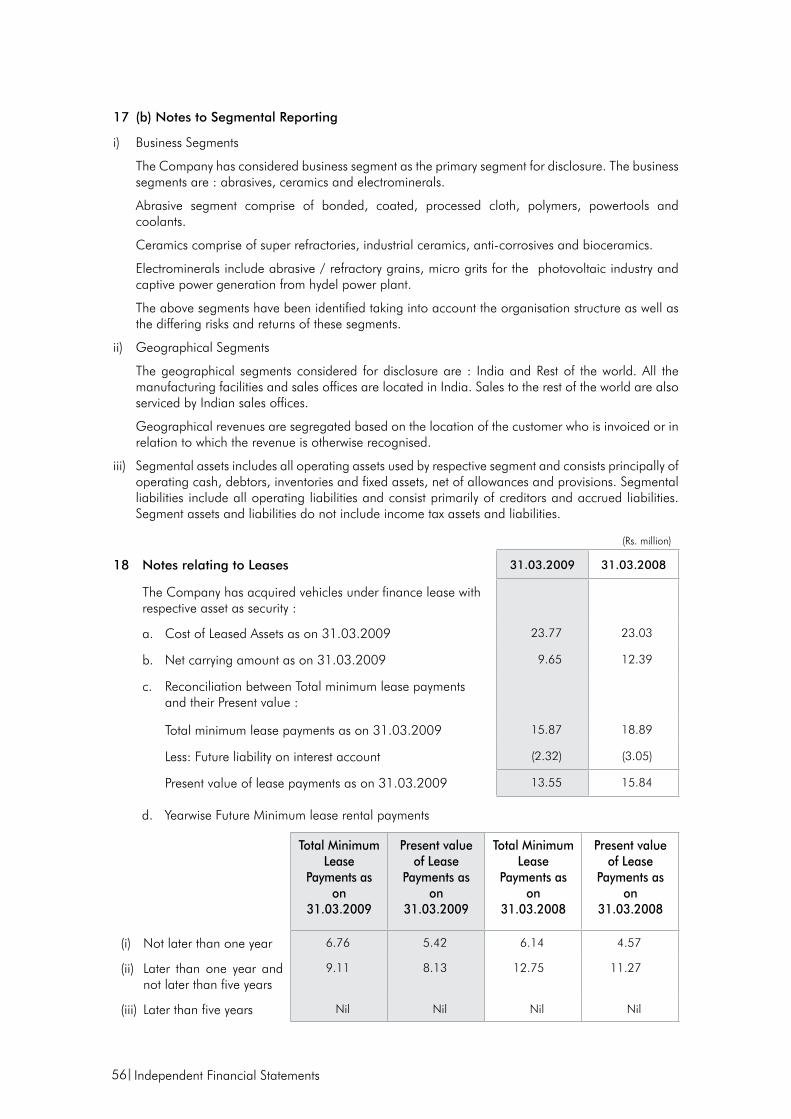
56
(Rs. million)
18 Notes relating to Leases 31.03.2009 31.03.2008
The Company has acquired vehicles under finance lease withrespective asset as security :
a. Cost of Leased Assets as on 31.03.2009 23.77 23.03
b. Net carrying amount as on 31.03.2009 9.65 12.39
c. Reconciliation between Total minimum lease payments and their Present value :
Total minimum lease payments as on 31.03.2009 15.87 18.89
Less: Future liability on interest account (2.32) (3.05)
Present value of lease payments as on 31.03.2009 13.55 15.84
d. Yearwise Future Minimum lease rental payments
Total Minimum Lease
Payments as on
31.03.2009
Present value of Lease
Payments as on
31.03.2009
Total Minimum Lease
Payments as on
31.03.2008
Present value of Lease
Payments as on
31.03.2008
(i) Not later than one year 6.76 5.42 6.14 4.57
(ii) Later than one year and not later than five years
9.11 8.13 12.75 11.27
(iii) Later than five years Nil Nil Nil Nil
17 (b) Notes to Segmental Reporting
i) Business Segments
The Company has considered business segment as the primary segment for disclosure. The business segments are : abrasives, ceramics and electrominerals.
Abrasive segment comprise of bonded, coated, processed cloth, polymers, powertools and coolants.
Ceramics comprise of super refractories, industrial ceramics, anti-corrosives and bioceramics.
Electrominerals include abrasive / refractory grains, micro grits for the photovoltaic industry and captive power generation from hydel power plant.
The above segments have been identified taking into account the organisation structure as well as the differing risks and returns of these segments.
ii) Geographical Segments
The geographical segments considered for disclosure are : India and Rest of the world. All the manufacturing facilities and sales offices are located in India. Sales to the rest of the world are also serviced by Indian sales offices.
Geographical revenues are segregated based on the location of the customer who is invoiced or in relation to which the revenue is otherwise recognised.
iii) Segmental assets includes all operating assets used by respective segment and consists principally of operating cash, debtors, inventories and fixed assets, net of allowances and provisions. Segmental liabilities include all operating liabilities and consist primarily of creditors and accrued liabilities. Segment assets and liabilities do not include income tax assets and liabilities.
Independent Financial Statements
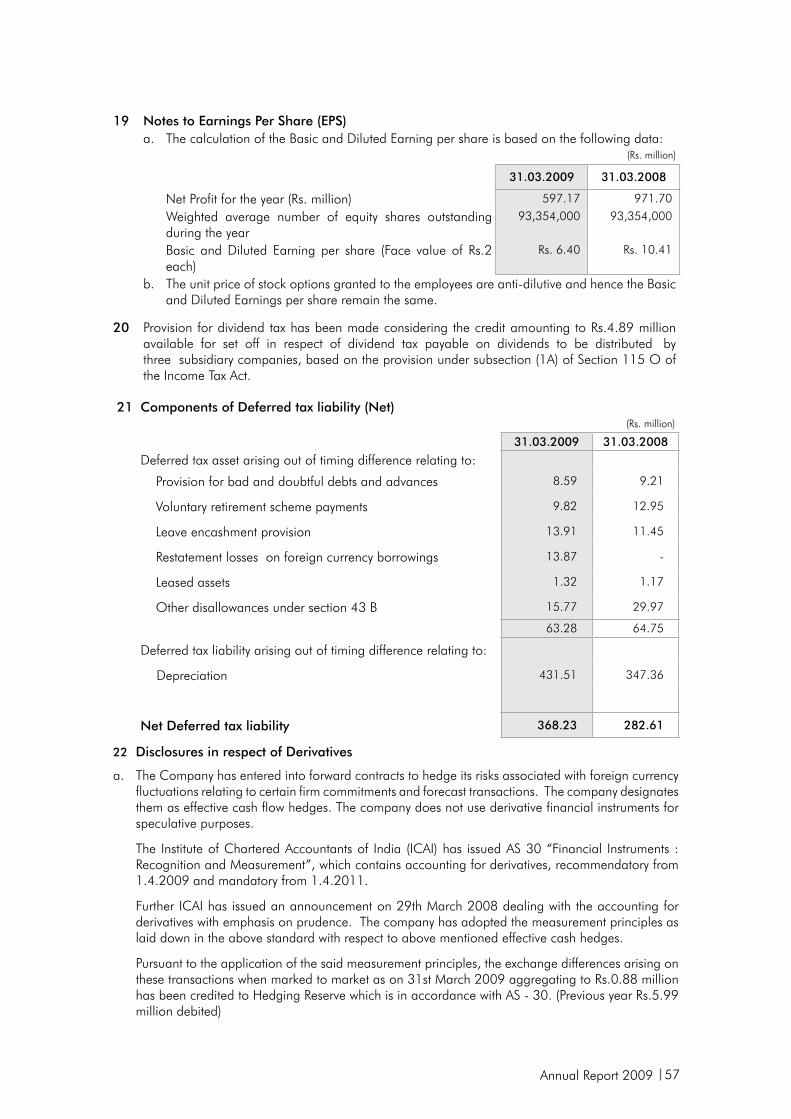
Annual Report 2009 57
19 Notes to Earnings Per Share (EPS)a. The calculation of the Basic and Diluted Earning per share is based on the following data:
(Rs. million)
31.03.2009 31.03.2008
Net Profit for the year (Rs. million) 597.17 971.70
Weighted average number of equity shares outstanding during the year
93,354,000 93,354,000
Basic and Diluted Earning per share (Face value of Rs.2 each)
Rs. 6.40 Rs. 10.41
b. The unit price of stock options granted to the employees are anti-dilutive and hence the Basic and Diluted Earnings per share remain the same.
20 Provision for dividend tax has been made considering the credit amounting to Rs.4.89 million available for set off in respect of dividend tax payable on dividends to be distributed by three subsidiary companies, based on the provision under subsection (1A) of Section 115 O of the Income Tax Act.
21 Components of Deferred tax liability (Net)(Rs. million)
31.03.2009 31.03.2008
Deferred tax asset arising out of timing difference relating to:
Provision for bad and doubtful debts and advances 8.59 9.21
Voluntary retirement scheme payments 9.82 12.95
Leave encashment provision 13.91 11.45
Restatement losses on foreign currency borrowings 13.87 -
Leased assets 1.32 1.17
Other disallowances under section 43 B 15.77 29.97
63.28 64.75
Deferred tax liability arising out of timing difference relating to:
Depreciation 431.51 347.36
Net Deferred tax liability 368.23 282.61
22 Disclosures in respect of Derivatives
a. The Company has entered into forward contracts to hedge its risks associated with foreign currency fluctuations relating to certain firm commitments and forecast transactions. The company designates them as effective cash flow hedges. The company does not use derivative financial instruments for speculative purposes.
The Institute of Chartered Accountants of India (ICAI) has issued AS 30 “Financial Instruments : Recognition and Measurement”, which contains accounting for derivatives, recommendatory from 1.4.2009 and mandatory from 1.4.2011.
Further ICAI has issued an announcement on 29th March 2008 dealing with the accounting for derivatives with emphasis on prudence. The company has adopted the measurement principles as laid down in the above standard with respect to above mentioned effective cash hedges.
Pursuant to the application of the said measurement principles, the exchange differences arising on these transactions when marked to market as on 31st March 2009 aggregating to Rs.0.88 million has been credited to Hedging Reserve which is in accordance with AS - 30. (Previous year Rs.5.99 million debited)
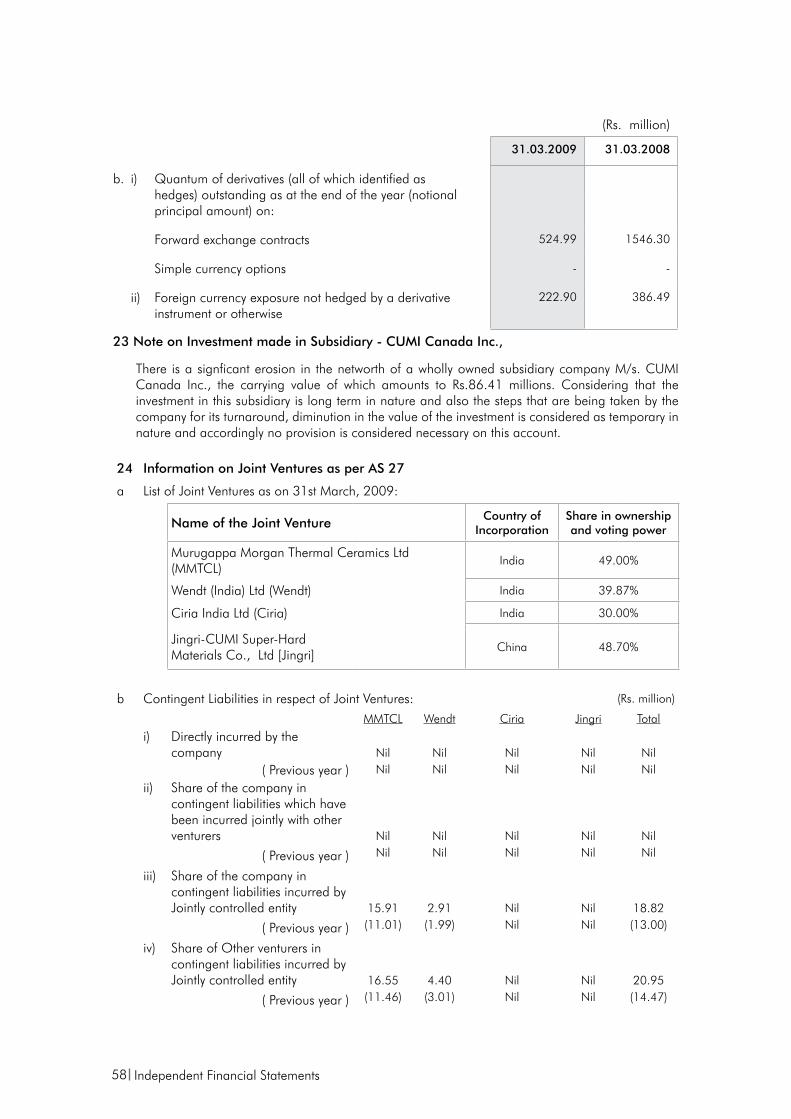
58
(Rs. million)
31.03.2009 31.03.2008
b. i) Quantum of derivatives (all of which identified ashedges) outstanding as at the end of the year (notionalprincipal amount) on:
Forward exchange contracts 524.99 1546.30
Simple currency options - -
ii) Foreign currency exposure not hedged by a derivativeinstrument or otherwise
222.90 386.49
23 Note on Investment made in Subsidiary - CUMI Canada Inc.,
There is a signficant erosion in the networth of a wholly owned subsidiary company M/s. CUMI Canada Inc., the carrying value of which amounts to Rs.86.41 millions. Considering that the investment in this subsidiary is long term in nature and also the steps that are being taken by the company for its turnaround, diminution in the value of the investment is considered as temporary in nature and accordingly no provision is considered necessary on this account.
24 Information on Joint Ventures as per AS 27
a List of Joint Ventures as on 31st March, 2009:
Name of the Joint Venture Country of Incorporation
Share in ownership and voting power
Murugappa Morgan Thermal Ceramics Ltd (MMTCL)
India 49.00%
Wendt (India) Ltd (Wendt) India 39.87%
Ciria India Ltd (Ciria) India 30.00%
Jingri-CUMI Super-Hard Materials Co., Ltd [Jingri]
China 48.70%
b Contingent Liabilities in respect of Joint Ventures: (Rs. million)
MMTCL Wendt Ciria Jingri Total
i) Directly incurred by the company Nil Nil Nil Nil Nil
( Previous year ) Nil Nil Nil Nil Nil
ii) Share of the company in contingent liabilities which have been incurred jointly with other venturers Nil Nil Nil Nil Nil
( Previous year ) Nil Nil Nil Nil Nil
iii) Share of the company in contingent liabilities incurred by Jointly controlled entity 15.91 2.91 Nil Nil 18.82
( Previous year ) (11.01) (1.99) Nil Nil (13.00)
iv) Share of Other venturers in contingent liabilities incurred by Jointly controlled entity 16.55 4.40 Nil Nil 20.95
( Previous year ) (11.46) (3.01) Nil Nil (14.47)
Independent Financial Statements
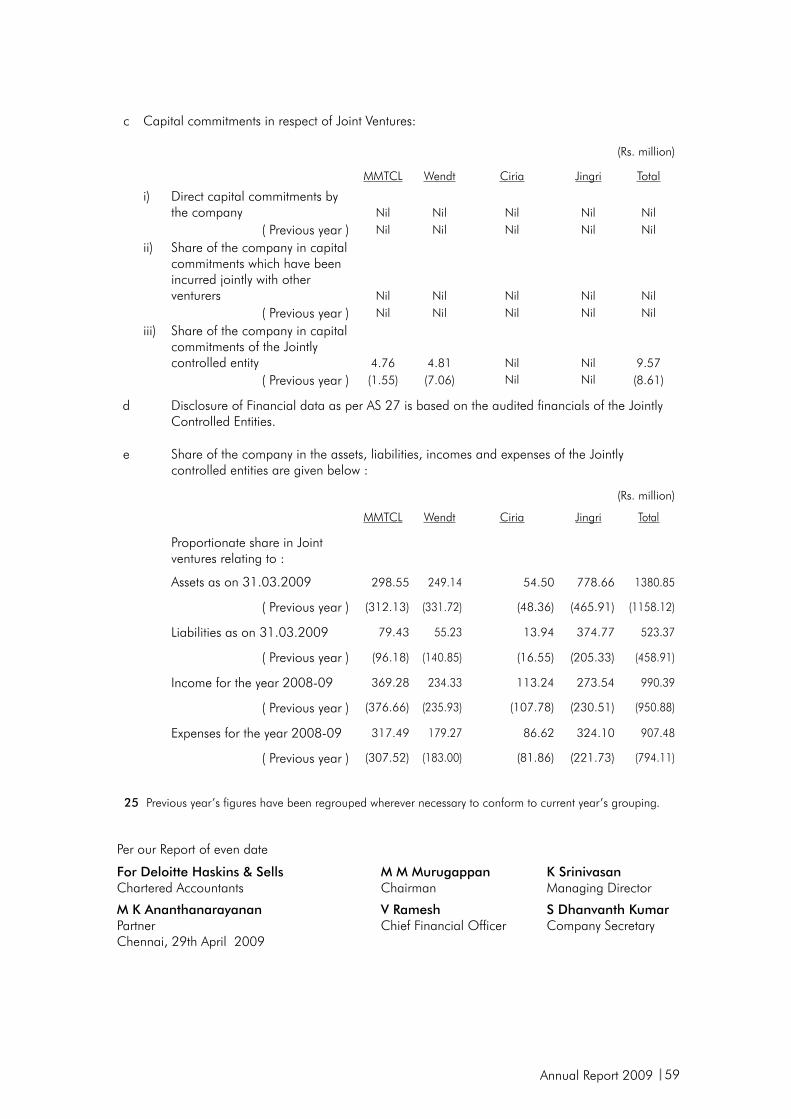
Annual Report 2009 59
c Capital commitments in respect of Joint Ventures:
(Rs. million)
MMTCL Wendt Ciria Jingri Total
i) Direct capital commitments by the company Nil Nil Nil Nil Nil
( Previous year ) Nil Nil Nil Nil Nil
ii) Share of the company in capital commitments which have been incurred jointly with other venturers Nil Nil Nil Nil Nil
( Previous year ) Nil Nil Nil Nil Nil
iii) Share of the company in capital commitments of the Jointly controlled entity 4.76 4.81 Nil Nil 9.57
( Previous year ) (1.55) (7.06) Nil Nil (8.61)
d Disclosure of Financial data as per AS 27 is based on the audited financials of the Jointly Controlled Entities.
e Share of the company in the assets, liabilities, incomes and expenses of the Jointly controlled entities are given below :
(Rs. million)
MMTCL Wendt Ciria Jingri Total
Proportionate share in Joint ventures relating to :
Assets as on 31.03.2009 298.55 249.14 54.50 778.66 1380.85
( Previous year ) (312.13) (331.72) (48.36) (465.91) (1158.12)
Liabilities as on 31.03.2009 79.43 55.23 13.94 374.77 523.37
( Previous year ) (96.18) (140.85) (16.55) (205.33) (458.91)
Income for the year 2008-09 369.28 234.33 113.24 273.54 990.39
( Previous year ) (376.66) (235.93) (107.78) (230.51) (950.88)
Expenses for the year 2008-09 317.49 179.27 86.62 324.10 907.48
( Previous year ) (307.52) (183.00) (81.86) (221.73) (794.11)
25 Previous year’s figures have been regrouped wherever necessary to conform to current year’s grouping.
Per our Report of even date
For Deloitte Haskins & SellsChartered Accountants
M M MurugappanChairman
K SrinivasanManaging Director
M K AnanthanarayananPartnerChennai, 29th April 2009
V RameshChief Financial Officer
S Dhanvanth KumarCompany Secretary
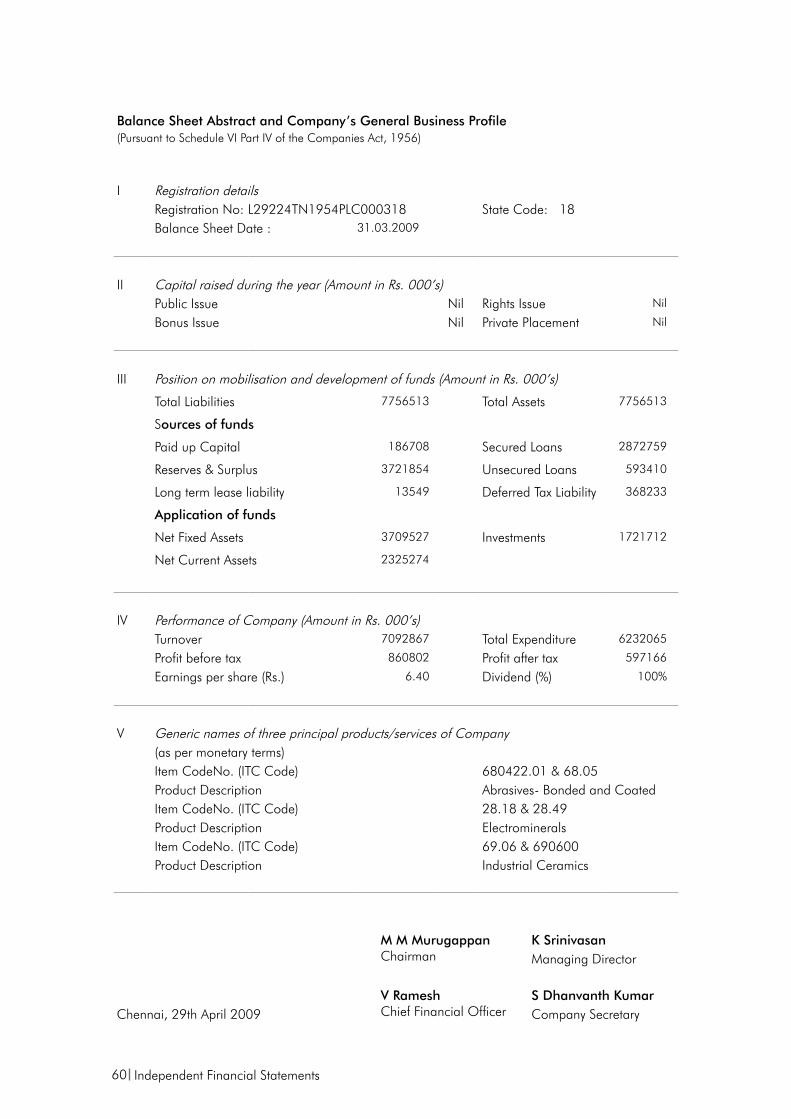
60
Balance Sheet Abstract and Company’s General Business Profile(Pursuant to Schedule VI Part IV of the Companies Act, 1956)
I Registration detailsRegistration No: L29224TN1954PLC000318 State Code: 18Balance Sheet Date : 31.03.2009
II Capital raised during the year (Amount in Rs. 000’s)Public Issue Nil Rights Issue Nil
Bonus Issue Nil Private Placement Nil
III Position on mobilisation and development of funds (Amount in Rs. 000’s)
Total Liabilities 7756513 Total Assets 7756513
Sources of funds
Paid up Capital 186708 Secured Loans 2872759
Reserves & Surplus 3721854 Unsecured Loans 593410
Long term lease liability 13549 Deferred Tax Liability 368233
Application of funds
Net Fixed Assets 3709527 Investments 1721712
Net Current Assets 2325274
IV Performance of Company (Amount in Rs. 000’s)Turnover 7092867 Total Expenditure 6232065
Profit before tax 860802 Profit after tax 597166
Earnings per share (Rs.) 6.40 Dividend (%) 100%
V Generic names of three principal products/services of Company (as per monetary terms)Item CodeNo. (ITC Code) 680422.01 & 68.05Product Description Abrasives- Bonded and CoatedItem CodeNo. (ITC Code) 28.18 & 28.49Product Description ElectromineralsItem CodeNo. (ITC Code) 69.06 & 690600Product Description Industrial Ceramics
M M MurugappanChairman
K SrinivasanManaging Director
V RameshChief Financial Officer
S Dhanvanth KumarChennai, 29th April 2009 Company Secretary
Independent Financial Statements
Annual Report 2009 61
1. We have audited the attached Consolidated Balance Sheet of Carborundum Universal Limited and its subsidiaries – CUMI America Inc., CUMI Australia Pty Ltd., CUMI Canada Inc, CUMI Middle East FZE, Net Access (India) Private Limited, Sterling Abrasives Limited, Southern Energy Development Corporation Limited, CUMI Fine Materials Limited, CUMI International Ltd, OAO Volzhsky Abrasive Works, Foskor Zirconia (Pty) Ltd, its joint ventures - Murugappa Morgan Thermal Ceramics Limited, Wendt (India) Limited, Ciria India Limited and Jingri CUMI Super Hard Materials Co., Ltd, China and its associate Laserwords Private Limited as at 31st March 2009 and the Consolidated Profit and Loss Account for the year then ended and the Consolidated Cash Flow Statement for the year ended on that date annexed thereto.
These financial statements are the responsibility of Carborundum Universal Limited’s management and have been prepared by the management on the basis of separate financial statements and other financial information regarding components. Our responsibility is to express an opinion on these financial statements based on our audit.
2. We conducted our audit in accordance with auditing standards generally accepted in India. Those standards require that we plan and perform the audit to obtain reasonable assurance about whether the financial statements are free of material misstatements. An audit includes examining, on a test basis, evidence supporting the amounts and disclosures in the financial statements. An audit also includes assessing the accounting principles used and significant estimates made by management, as well as evaluating the overall financial statement presentation. We believe that our audit provides a reasonable basis for our opinion.
3. We did not audit the financial statements of certain subsidiaries and the joint ventures whose financial statements reflect total assets of Rs. 5,438.58 million as at 31st March 2009 and total revenues of Rs. 5,873.01 million and net cash flows amounting to Rs. 330.58 million for the year then ended. These financial statements and other financial information have been audited by other auditors, whose reports have been furnished to us, and our opinion is based solely on the reports of other auditors.
4. We report that the consolidated financial statements have been prepared by the Carborundum Universal Limited’s management in accordance with the requirements of Accounting Standard (AS) 21 “Consolidated Financial Statements”, Accounting Standard (AS) 23 “Accounting for Investment in Associates” and Accounting Standard (AS) 27 “Financial Reporting of Interest in Joint Ventures”, notified by the Central Government of India under the Companies (Accounting Standards) Rules, 2006. Based on our audit and on consideration of reports of other auditors on separate financial statements and on the other financial information of the components, and to the best of our information and according to the explanations given to us, we are of the opinion that the attached Consolidated Financial Statements give a true and fair view in conformity with the accounting principles generally accepted in India:
(a) in the case of the Consolidated Balance Sheet, of the state of affairs of Carborundum Universal Limited and its Subsidiaries, Joint Ventures and Associate as on 31st March 2009;
(b) in the case of the Consolidated Profit and Loss Account, of the profit for the year ended on that date; and
(c) in the case of the Consolidated Cash Flow Statements, of the cash flows for the year ended on that date.
For Deloitte Haskins & SellsChartered Accountants
Place: Chennai M K AnanthanarayananDate: 29th April 2009 Partner
Membership No.19521
AUDITORS’ REPORTAuditors’ Report to The Board of Directors of Carborundum Universal Limited on the Consolidated Financial Statements of Carborundum Universal Limited and its Subsidiaries, Joint Ventures and Associate
CONsOLIDATED FINANCIAL sTATEMENTs 2008-09

62
(Rs.million)
ScheduleAs at As at
31.03.2009 31.03.2008SOURCES OF FUNDSShareholders’ Funds Share Capital 1 186.71 186.71
Capital Reserve on Consolidation : Joint ventures 20.56 20.56
Reserves and Surplus 2 4831.41 4260.41
5038.68 4467.68 Minority Interest 485.60 378.86
Loan Funds Secured Loans 3 3454.90 2400.24
Unsecured Loans 4 1678.53 1403.80
Long term Lease Liability (Note No.12) 17.06 18.21
5150.49 3822.25Deferred Tax Liability (Net) (Note No.14) 411.42 330.86
Total 11086.19 8999.65
APPLICATION OF FUNDSFixed Assets Gross block 5 7746.11 6132.72
Less: Depreciation 2895.53 2542.28 Net Block 4850.58 3590.44 Capital work-in-progress (including capital advances) 322.11 758.84
5172.69 4349.28 Goodwill on Consolidation - Subsidiaries 924.59 711.68
- Jointventures 111.67 111.67
Investments 6 609.88 564.28
Current Assets, Loans & Advances 7 Inventories 2445.32 1734.03
Sundry Debtors 2684.13 2261.37
Cash & Bank Balances 604.07 476.03
Loans & Advances 607.52 507.48
6341.04 4978.91 Less : Current Liabilities & Provisions 8 Current Liabilities 1860.13 1500.99
Provisions 213.55 215.18
2073.68 1716.17
Net Current Assets 4267.36 3262.74
Total 11086.19 8999.65
Significant Accounting Policies 13Notes on Accounts 14
The schedules referred to above form an integral part of the Balance Sheet
Consolidated Balance sheet as at 31st March 2009
Consolidated Financial Statements
Per our Report of even date
For Deloitte Haskins & SellsChartered Accountants
M M MurugappanChairman
K SrinivasanManaging Director
M K AnanthanarayananPartnerChennai, 29th April 2009
V RameshChief Financial Officer
S Dhanvanth KumarCompany Secretary

Annual Report 2009 63
(Rs million) For the year ended
Schedule 31.03.2009 31.03.2008INCOME Gross Sales 11382.63 8784.96 Less : Excise duty (599.47) (766.77) Net Sales 10783.16 8018.19 Income from processing charges 97.12 85.87 Profit on sale of Fixed Assets (Note No.9) 292.99 567.54 Income from work bills & services 59.14 38.22 Other income 9 328.10 256.62 Proportionate share of Income in Joint Ventures 990.39 951.19
12550.90 9917.63 ExPENDITURE Raw materials consumed 3432.19 3044.54
Accretion to stock 10 (226.74) (265.39)
Employee cost 11 1279.57 1064.02
Other costs 12 4882.56 3048.80
Depreciation 352.13 301.16
Less: Transfer from fixed assets revaluation reserve 0.90 0.90
351.23 300.26
Interest and finance charges (Note No.8) 323.78 189.04
Proportionate share of Expense in Joint Ventures 907.48 796.03
10950.07 8177.30
PROFIT BEFORE TAx 1600.83 1740.33
Less: Provision for income tax Current tax 449.57 444.73
Deferred tax 87.94 81.70
Fringe Benefit tax 13.22 16.11 PROFIT AFTER TAx(before Share of profit from Associates & minority interest)
1050.10 1197.79
Add: Share of Profit from Associates 95.01 54.46
Less: Minority Interest 107.92 63.52
PROFIT AFTER TAx 1037.19 1188.73
Add:Unappropriated profits from previous year 2045.48 1169.11
Profit available for appropriation 3082.67 2357.84
APPROPRIATIONS Transfer to: General Reserve 59.72 97.17
Debenture Redemption Reserve 31.25 0.00 Dividend: Proposed @ 100 % (Previous year 100%) 186.71 186.71 Dividend Tax (Note No.15) 26.84 28.48 Balance carried over to Balance Sheet 2 2778.15 2045.48
3082.67 2357.84
E P S - Basic and Diluted (Rs.) Face value Rs.2 11.11 12.73
SIGNIFICANT ACCOUNTING POLICIES 13
NOTES ON ACCOUNTS 14
The schedules referred to above form an integral part of the Profit & Loss Account
Consolidated Profit and Loss Account for the year ended 31st March 2009
Per our Report of even date
For Deloitte Haskins & SellsChartered Accountants
M M MurugappanChairman
K SrinivasanManaging Director
M K AnanthanarayananPartnerChennai, 29th April 2009
V RameshChief Financial Officer
S Dhanvanth KumarCompany Secretary
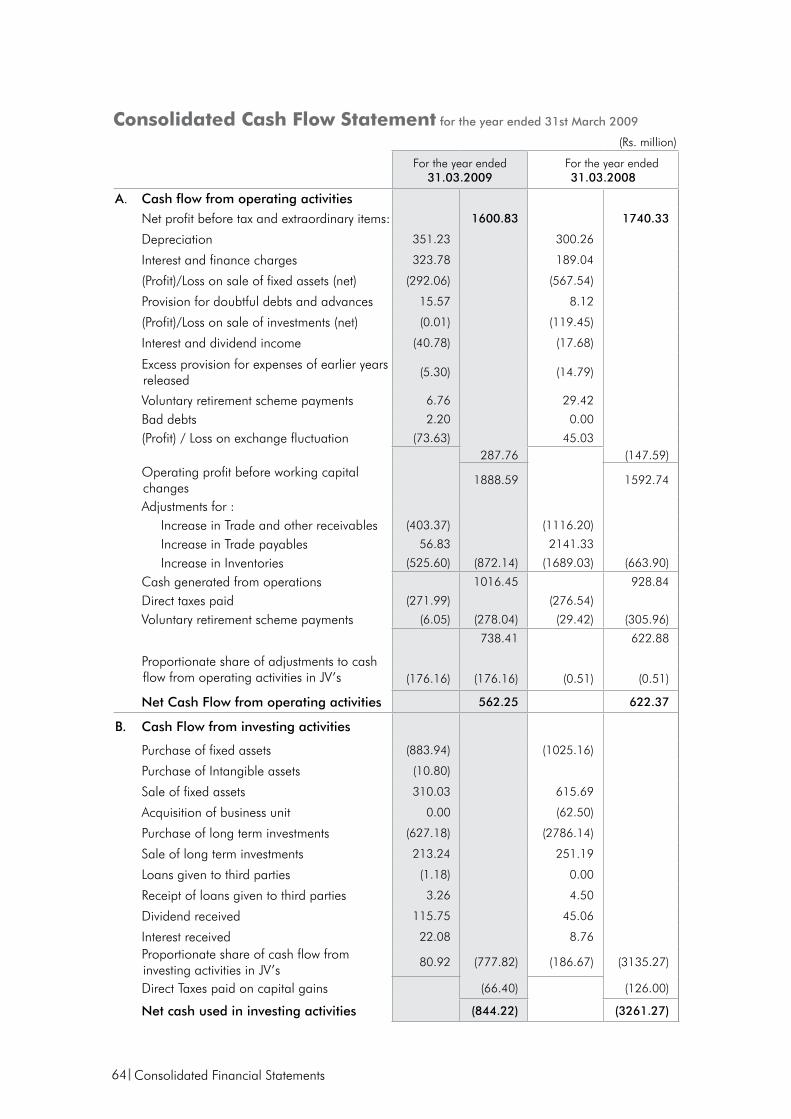
64
(Rs. million)
For the year ended31.03.2009
For the year ended31.03.2008
A. Cash flow from operating activities Net profit before tax and extraordinary items: 1600.83 1740.33
Depreciation 351.23 300.26
Interest and finance charges 323.78 189.04
(Profit)/Loss on sale of fixed assets (net) (292.06) (567.54)
Provision for doubtful debts and advances 15.57 8.12
(Profit)/Loss on sale of investments (net) (0.01) (119.45)
Interest and dividend income (40.78) (17.68)
Excess provision for expenses of earlier years released
(5.30) (14.79)
Voluntary retirement scheme payments 6.76 29.42
Bad debts 2.20 0.00
(Profit) / Loss on exchange fluctuation (73.63) 45.03 287.76 (147.59)
Operating profit before working capital changes
1888.59 1592.74
Adjustments for : Increase in Trade and other receivables (403.37) (1116.20)
Increase in Trade payables 56.83 2141.33
Increase in Inventories (525.60) (872.14) (1689.03) (663.90)
Cash generated from operations 1016.45 928.84
Direct taxes paid (271.99) (276.54)
Voluntary retirement scheme payments (6.05) (278.04) (29.42) (305.96)
738.41 622.88
Proportionate share of adjustments to cash flow from operating activities in JV’s (176.16) (176.16) (0.51) (0.51)
Net Cash Flow from operating activities 562.25 622.37
B. Cash Flow from investing activities
Purchase of fixed assets (883.94) (1025.16)
Purchase of Intangible assets (10.80)
Sale of fixed assets 310.03 615.69
Acquisition of business unit 0.00 (62.50)
Purchase of long term investments (627.18) (2786.14)
Sale of long term investments 213.24 251.19
Loans given to third parties (1.18) 0.00
Receipt of loans given to third parties 3.26 4.50
Dividend received 115.75 45.06
Interest received 22.08 8.76 Proportionate share of cash flow from
investing activities in JV’s80.92 (777.82) (186.67) (3135.27)
Direct Taxes paid on capital gains (66.40) (126.00)
Net cash used in investing activities (844.22) (3261.27)
Consolidated Cash Flow statement for the year ended 31st March 2009
Consolidated Financial Statements
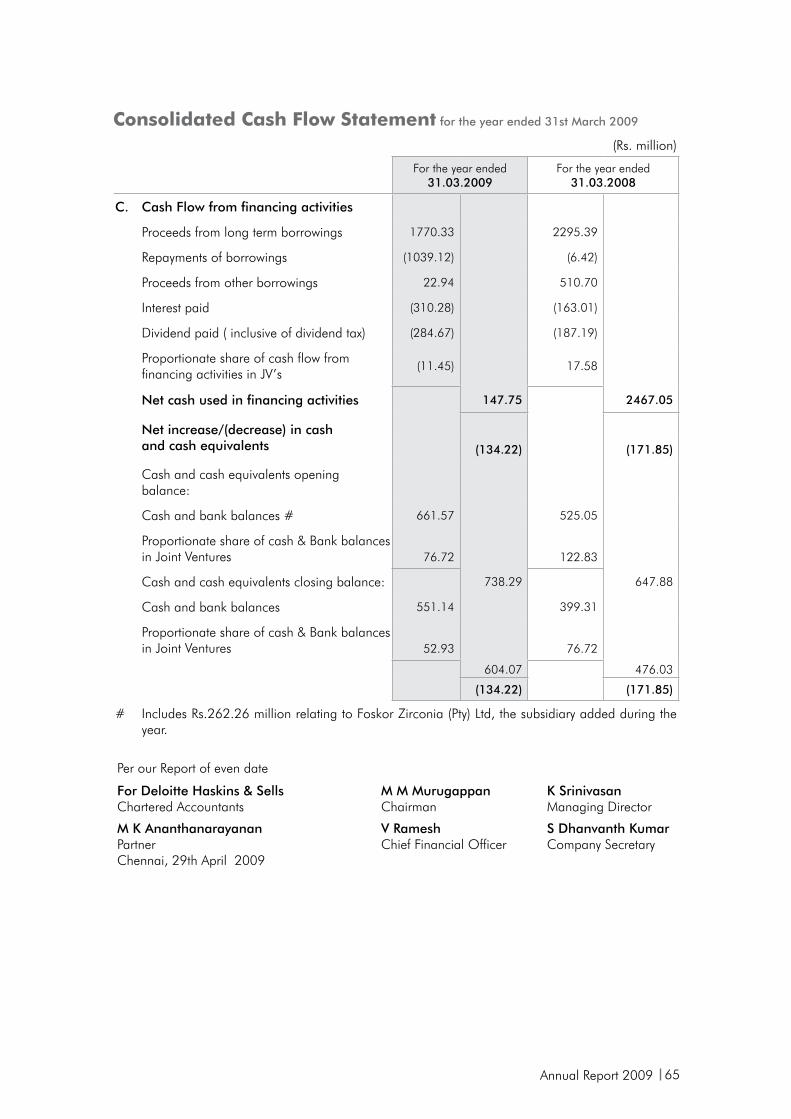
Annual Report 2009 65
Consolidated Cash Flow statement for the year ended 31st March 2009
(Rs. million)
For the year ended31.03.2009
For the year ended31.03.2008
C. Cash Flow from financing activities
Proceeds from long term borrowings 1770.33 2295.39
Repayments of borrowings (1039.12) (6.42)
Proceeds from other borrowings 22.94 510.70
Interest paid (310.28) (163.01)
Dividend paid ( inclusive of dividend tax) (284.67) (187.19)
Proportionate share of cash flow from financing activities in JV’s
(11.45) 17.58
Net cash used in financing activities 147.75 2467.05
Net increase/(decrease) in cash and cash equivalents (134.22) (171.85)
Cash and cash equivalents opening balance:
Cash and bank balances # 661.57 525.05
Proportionate share of cash & Bank balances in Joint Ventures 76.72 122.83
Cash and cash equivalents closing balance: 738.29 647.88
Cash and bank balances 551.14 399.31
Proportionate share of cash & Bank balances in Joint Ventures 52.93 76.72
604.07 476.03
(134.22) (171.85)
# Includes Rs.262.26 million relating to Foskor Zirconia (Pty) Ltd, the subsidiary added during the year.
Per our Report of even date
For Deloitte Haskins & SellsChartered Accountants
M M MurugappanChairman
K SrinivasanManaging Director
M K AnanthanarayananPartnerChennai, 29th April 2009
V RameshChief Financial Officer
S Dhanvanth KumarCompany Secretary

66
(Rs. million)
1. Share Capital As at31.03.2009
As at31.03.2008
Authorised125,000,000 equity shares of Rs.2 each 250.00 250.00
Issued, Subscribed and Paid-up107,193,000 equity shares of Rs. 2 each fully paid up 214.39 214.39
Above includes - 893,565 shares of Rs. 2 each allotted as fully paid up for consideration other than cash pursuant to contracts - 2,339,295 shares of Rs. 2 each allotted to shareholders of amalgamated companies - 82,825,120 shares of Rs. 2 each allotted as fully paid up
bonus shares by capitalisation of share premium and general reserve
Less: 13,839,000 shares of Rs. 2 each bought back from the 27.68 27.68
shareholders pursuant to the offer for buy-back of shares made in 2000-01 93,354,000 shares of Rs. 2 each fully paid 186.71 186.71
186.71 186.71
(Rs.million)
2. Reserves and Surplus As at 31stMarch 2008
Additions Deductions /Adjustments
As at 31stMarch 2009
Capital Reserve Fixed assets revaluation reserve 28.50 0.68 27.82
Capital subsidy 10.08 10.08 # 0.00
Profit on Forfeiture of Shares / Warrants 6.03 6.03
Capital redemption reserve 27.68 27.68
Other Reserves General reserve 1944.04 69.80 # - 2013.84
Hedging Reserve (5.99) 6.87 @ 0.88
Debenture redemption reserve - 31.25 31.25
2010.34 107.92 10.76 2107.50
Surplus as shown in Profit and Loss Account 2045.48 2778.15
Less : Dividend Tax paid by Subsidiaries & JV (7.40) 7.40 9.88 (9.88)
Less : Adjustment arising on desubsidiarisation of subsidiaries (30.11) (30.11)Less : Adjustment arising on merger of a subsidiary (30.81) (30.81)Add : Adjustment arising on account of proposed dividend by a subsidiary 14.51 - 14.51 - Foreign Currency Translation Reserve 68.44 - 172.40 (103.96)
Investment by a subsidiary in fellow subsidiary - 48.02 (48.02)
Buyback of shares by a subsidiary - 21.42 (21.42)
Proportionate share in Joint ventures 189.96 189.964260.41 4831.41
# Transfer to Parent company’s General Reserve on completion of the stipulated statutory period@ Represents the Parent company’s adjustment towards effective cash flow hedges as per AS 30.
schedules to Consolidated Accounts
Consolidated Financial Statements
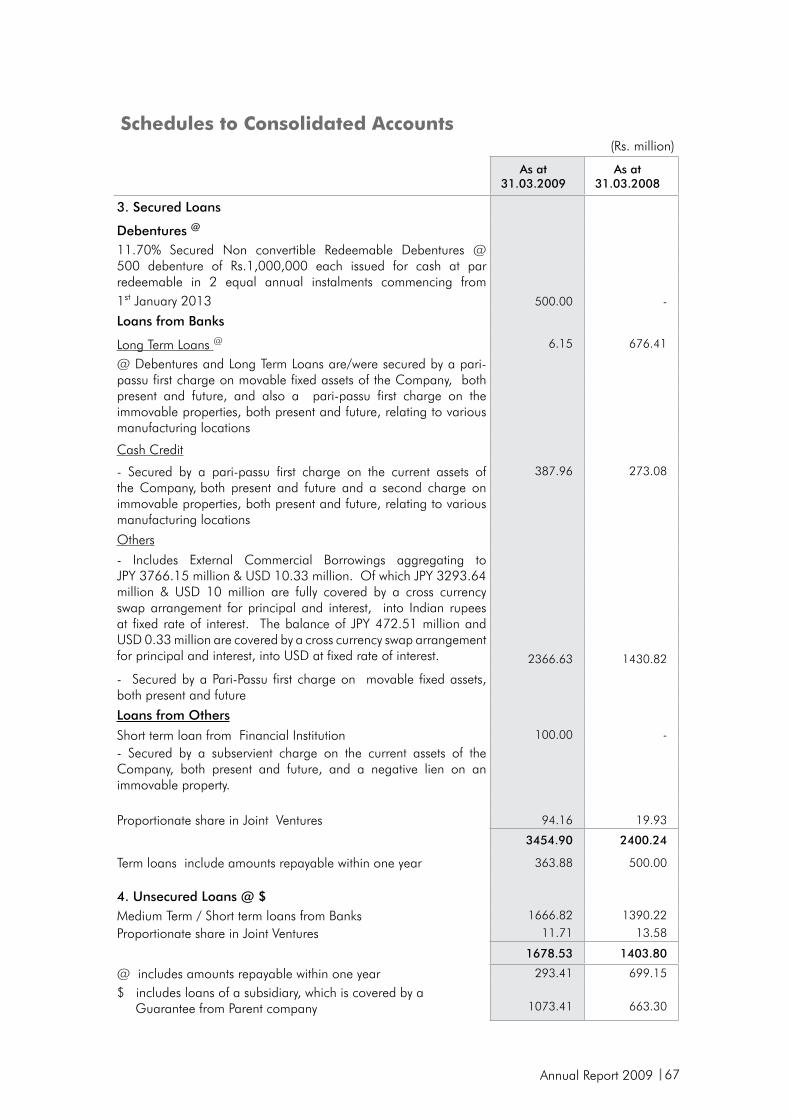
Annual Report 2009 67
schedules to Consolidated Accounts(Rs. million)
As at31.03.2009
As at31.03.2008
3. Secured Loans
Debentures @
11.70% Secured Non convertible Redeemable Debentures @ 500 debenture of Rs.1,000,000 each issued for cash at par redeemable in 2 equal annual instalments commencing from 1st January 2013 500.00 -
Loans from Banks
Long Term Loans @ 6.15 676.41
@ Debentures and Long Term Loans are/were secured by a pari-passu first charge on movable fixed assets of the Company, both present and future, and also a pari-passu first charge on the immovable properties, both present and future, relating to various manufacturing locations
Cash Credit
- Secured by a pari-passu first charge on the current assets of the Company, both present and future and a second charge on immovable properties, both present and future, relating to various manufacturing locations
387.96 273.08
Others
- Includes External Commercial Borrowings aggregating to JPY 3766.15 million & USD 10.33 million. Of which JPY 3293.64 million & USD 10 million are fully covered by a cross currency swap arrangement for principal and interest, into Indian rupees at fixed rate of interest. The balance of JPY 472.51 million and USD 0.33 million are covered by a cross currency swap arrangement for principal and interest, into USD at fixed rate of interest.
- Secured by a Pari-Passu first charge on movable fixed assets, both present and future
2366.63 1430.82
Loans from Others
Short term loan from Financial Institution 100.00 -
- Secured by a subservient charge on the current assets of the Company, both present and future, and a negative lien on an immovable property.
Proportionate share in Joint Ventures 94.16 19.93
3454.90 2400.24
Term loans include amounts repayable within one year 363.88 500.00
4. Unsecured Loans @ $Medium Term / Short term loans from Banks 1666.82 1390.22
Proportionate share in Joint Ventures 11.71 13.58
1678.53 1403.80
@ includes amounts repayable within one year 293.41 699.15
$ includes loans of a subsidiary, which is covered by a Guarantee from Parent company 1073.41
663.30
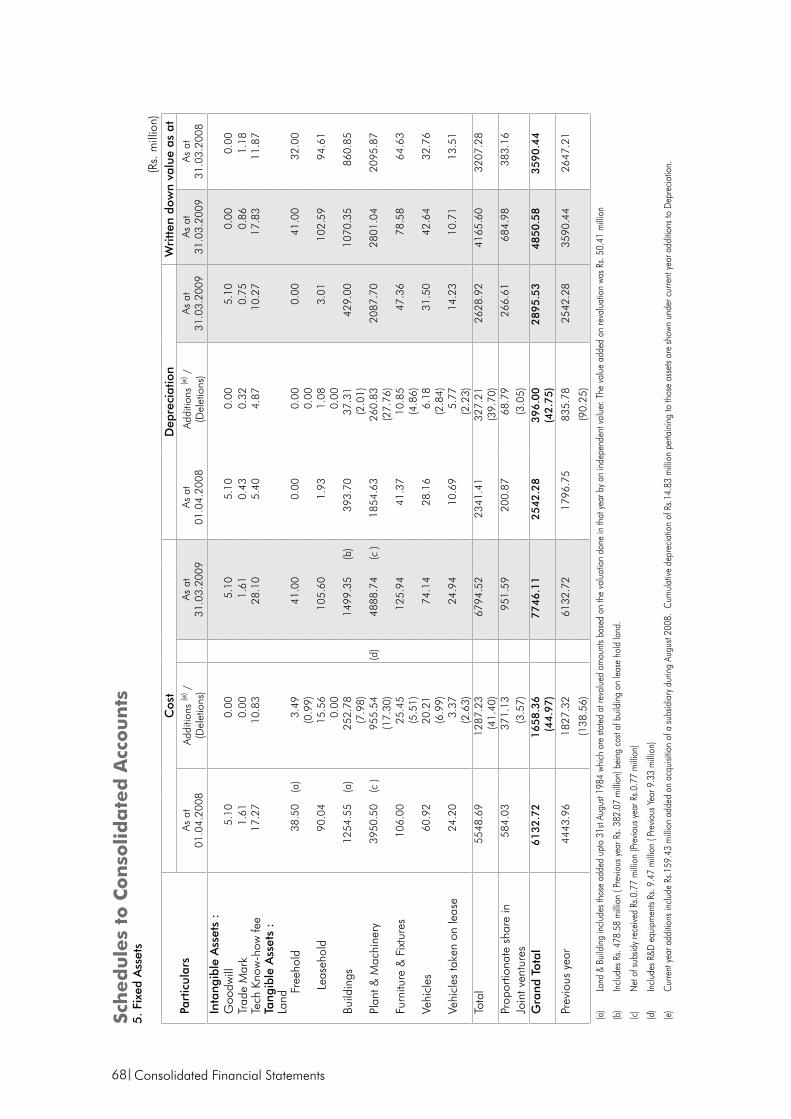
68
(Rs.
mill
ion)
Part
icul
ars
Cos
tD
epre
ciat
ion
Wri
tten
dow
n va
lue
as a
tAs
at
01.0
4.20
08Ad
ditio
ns (e
) /(D
elet
ions
)As
at
31.0
3.20
09As
at
01.0
4.20
08Ad
ditio
ns (e
) /(D
elet
ions
)As
at
31.0
3.20
09As
at
31.0
3.20
09As
at
31.0
3.20
08In
tang
ible
Ass
ets
:G
oodw
ill5.
10
0.00
5.
10
5.10
0.
00
5.10
0.
00
0.00
Tr
ade
Mar
k1.
61
0.00
1.
61
0.43
0.
32
0.75
0.
86
1.18
Te
ch K
now
-how
fee
17.2
7 10
.83
28.1
0 5.
40
4.87
10
.27
17.8
3 11
.87
Tang
ible
Ass
ets
:La
nd
Fr
eeho
ld38
.50
(a)
3.49
41
.00
0.00
0.
00
0.00
41
.00
32.0
0 (0
.99)
0.00
L
ease
hold
90
.04
15.5
6 10
5.60
1.
93
1.08
3.
01
102.
59
94.6
1 0.
00
0.00
Bu
ildin
gs
1254
.55
(a)
252.
78
1499
.35
(b)
393.
70
37.3
1 42
9.00
10
70.3
5 86
0.85
(7
.98)
(2.0
1)Pl
ant &
Mac
hine
ry
3950
.50
(c )
955.
54
(d)
4888
.74
(c )
1854
.63
260.
83
2087
.70
2801
.04
2095
.87
(17.
30)
(27.
76)
Furn
iture
& F
ixtu
res
106.
00
25.4
5 12
5.94
41
.37
10.8
5 47
.36
78.5
8 64
.63
(5.5
1)(4
.86)
Vehi
cles
60.9
2 20
.21
74.1
4 28
.16
6.18
31
.50
42.6
4 32
.76
(6.9
9)(2
.84)
Vehi
cles
take
n on
leas
e24
.20
3.37
24
.94
10.6
9 5.
77
14.2
3 10
.71
13.5
1 (2
.63)
(2.2
3)To
tal
5548
.69
1287
.23
6794
.52
2341
.41
327.
21
2628
.92
4165
.60
3207
.28
(41.
40)
(39.
70)
Prop
ortio
nate
sha
re in
584.
03
371.
13
951.
59
200.
87
68.7
9 26
6.61
68
4.98
38
3.16
Join
t ven
ture
s(3
.57)
(3.0
5)
Gra
nd T
otal
61
32
.72
1
65
8.3
6
77
46
.11
2
54
2.2
8
396.0
0
2895.5
3
4850.5
8
3590.4
4
(44
.97
)(4
2.7
5)
Prev
ious
yea
r44
43.9
6 18
27.3
2 61
32.7
2 17
96.7
5 83
5.78
25
42.2
8 35
90.4
4 26
47.2
1
(138
.56)
(90.
25)
(a)
Land
& B
uild
ing
inclu
des t
hose
add
ed u
pto
31st
Augu
st 19
84 w
hich
are
stat
ed a
t rev
alue
d am
ount
s bas
ed o
n th
e va
luat
ion
done
in th
at ye
ar b
y an
inde
pend
ent v
alue
r. Th
e va
lue
adde
d on
reva
luat
ion
was R
s. 50
.41
milli
on
(b)
Inclu
des R
s. 47
8.58
milli
on (
Prev
ious
year
Rs.
382.
07 m
illion
) bei
ng c
ost o
f bui
ldin
g on
leas
e ho
ld la
nd.
(c)
Net
of s
ubsid
y rec
eive
d Rs
.0.7
7 m
illion
(Pre
vious
year
Rs.0
.77
milli
on)
(d)
Inclu
des R
&D e
quip
men
ts Rs
. 9.4
7 m
illion
( Pr
evio
us Y
ear 9
.33
milli
on)
(e)
Cur
rent
year
add
ition
s inc
lude
Rs.1
59.4
3 m
illion
add
ed o
n ac
quisi
tion
of a
subs
idia
ry d
urin
g Au
gust
2008
. C
umul
ative
dep
recia
tion
of R
s.14.
83 m
illion
per
tain
ing
to th
ose
asse
ts ar
e sh
own
unde
r cur
rent
year
add
ition
s to
Depr
ecia
tion.
sch
ed
ule
s to
Con
solid
ate
d A
ccou
nts
Consolidated Financial Statements
5.
Fixe
d A
sset
s
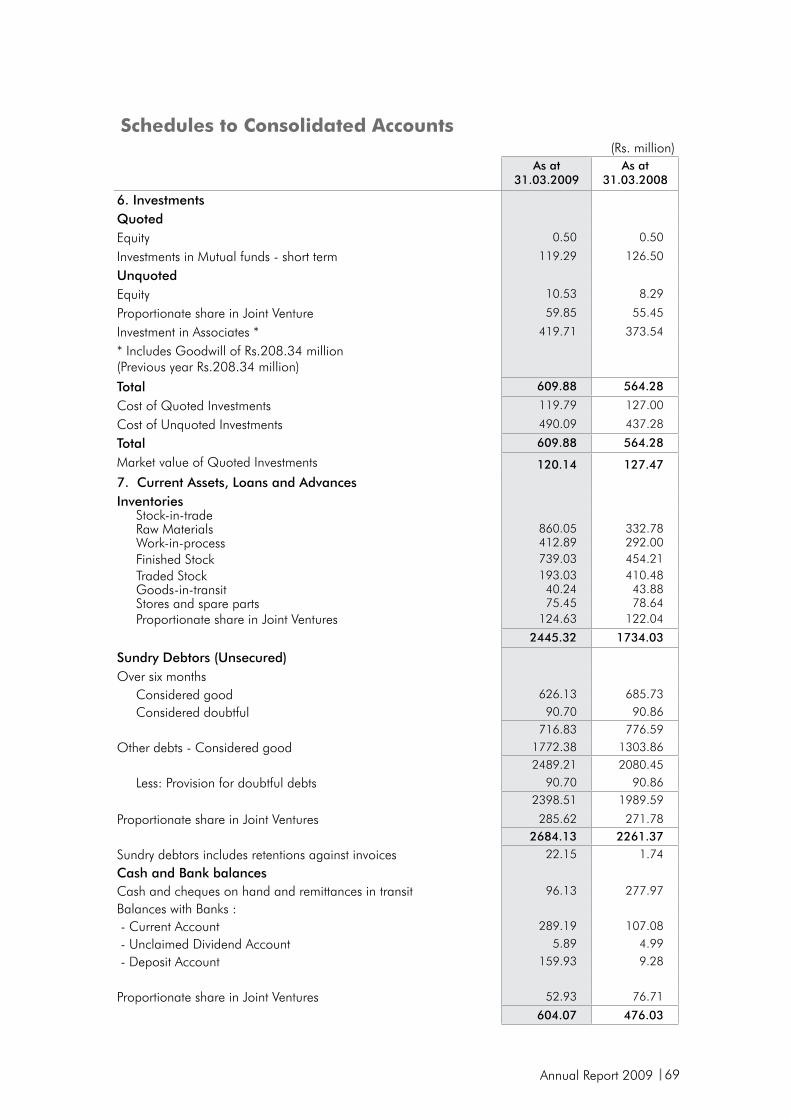
Annual Report 2009 69
schedules to Consolidated Accounts(Rs. million)
As at31.03.2009
As at31.03.2008
6. InvestmentsQuotedEquity 0.50 0.50
Investments in Mutual funds - short term 119.29 126.50
UnquotedEquity 10.53 8.29
Proportionate share in Joint Venture 59.85 55.45
Investment in Associates * 419.71 373.54
* Includes Goodwill of Rs.208.34 million (Previous year Rs.208.34 million)
Total 609.88 564.28
Cost of Quoted Investments 119.79 127.00
Cost of Unquoted Investments 490.09 437.28
Total 609.88 564.28
Market value of Quoted Investments 120.14 127.47
7. Current Assets, Loans and AdvancesInventories Stock-in-trade Raw Materials 860.05 332.78 Work-in-process 412.89 292.00 Finished Stock 739.03 454.21 Traded Stock 193.03 410.48 Goods-in-transit 40.24 43.88 Stores and spare parts 75.45 78.64 Proportionate share in Joint Ventures 124.63 122.04
2445.32 1734.03
Sundry Debtors (Unsecured)Over six months Considered good 626.13 685.73
Considered doubtful 90.70 90.86716.83 776.59
Other debts - Considered good 1772.38 1303.862489.21 2080.45
Less: Provision for doubtful debts 90.70 90.862398.51 1989.59
Proportionate share in Joint Ventures 285.62 271.782684.13 2261.37
Sundry debtors includes retentions against invoices 22.15 1.74
Cash and Bank balancesCash and cheques on hand and remittances in transit 96.13 277.97
Balances with Banks : - Current Account 289.19 107.08
- Unclaimed Dividend Account 5.89 4.99
- Deposit Account 159.93 9.28
Proportionate share in Joint Ventures 52.93 76.71
604.07 476.03
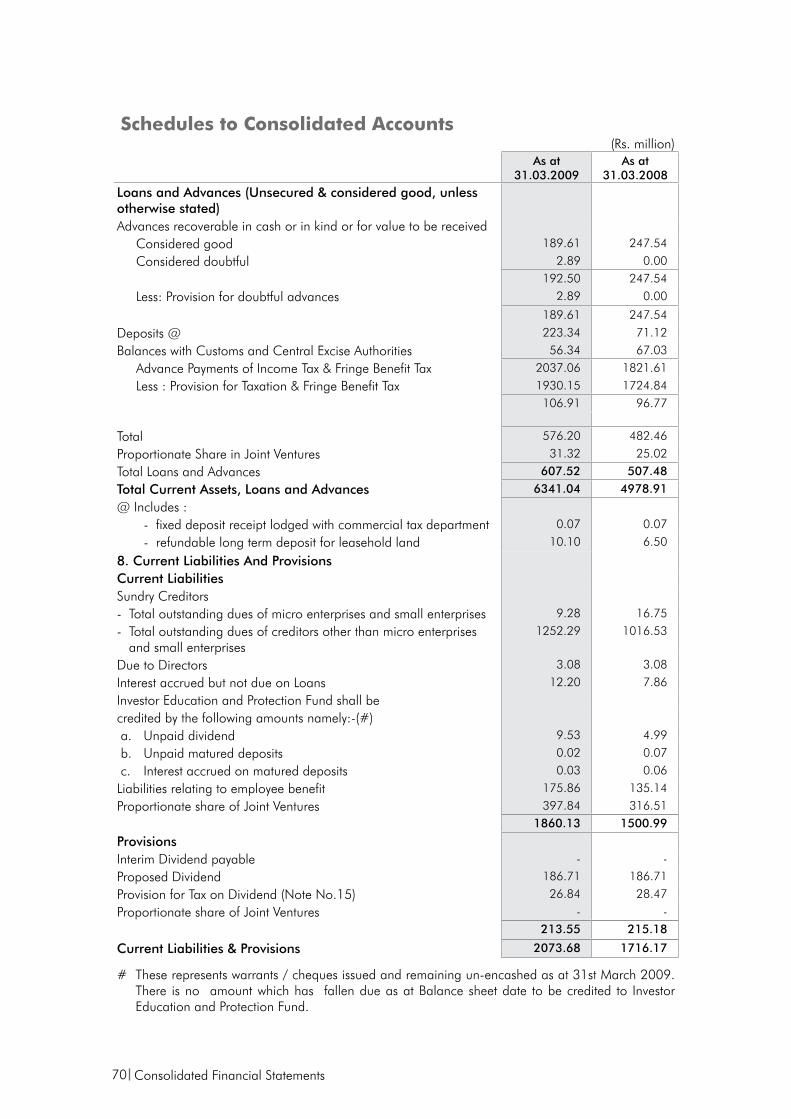
70
schedules to Consolidated Accounts(Rs. million)
As at31.03.2009
As at31.03.2008
Loans and Advances (Unsecured & considered good, unless otherwise stated)Advances recoverable in cash or in kind or for value to be received Considered good 189.61 247.54
Considered doubtful 2.89 0.00192.50 247.54
Less: Provision for doubtful advances 2.89 0.00
189.61 247.54
Deposits @ 223.34 71.12
Balances with Customs and Central Excise Authorities 56.34 67.03
Advance Payments of Income Tax & Fringe Benefit Tax 2037.06 1821.61
Less : Provision for Taxation & Fringe Benefit Tax 1930.15 1724.84106.91 96.77
Total 576.20 482.46
Proportionate Share in Joint Ventures 31.32 25.02
Total Loans and Advances 607.52 507.48
Total Current Assets, Loans and Advances 6341.04 4978.91
@ Includes : - fixed deposit receipt lodged with commercial tax department 0.07 0.07
- refundable long term deposit for leasehold land 10.10 6.50
8. Current Liabilities And ProvisionsCurrent Liabilities Sundry Creditors - Total outstanding dues of micro enterprises and small enterprises 9.28 16.75
- Total outstanding dues of creditors other than micro enterprises and small enterprises
1252.29 1016.53
Due to Directors 3.08 3.08
Interest accrued but not due on Loans 12.20 7.86
Investor Education and Protection Fund shall becredited by the following amounts namely:-(#) a. Unpaid dividend 9.53 4.99
b. Unpaid matured deposits 0.02 0.07
c. Interest accrued on matured deposits 0.03 0.06
Liabilities relating to employee benefit 175.86 135.14
Proportionate share of Joint Ventures 397.84 316.511860.13 1500.99
ProvisionsInterim Dividend payable - -
Proposed Dividend 186.71 186.71
Provision for Tax on Dividend (Note No.15) 26.84 28.47
Proportionate share of Joint Ventures - - 213.55 215.18
Current Liabilities & Provisions 2073.68 1716.17
# These represents warrants / cheques issued and remaining un-encashed as at 31st March 2009. There is no amount which has fallen due as at Balance sheet date to be credited to Investor Education and Protection Fund.
Consolidated Financial Statements
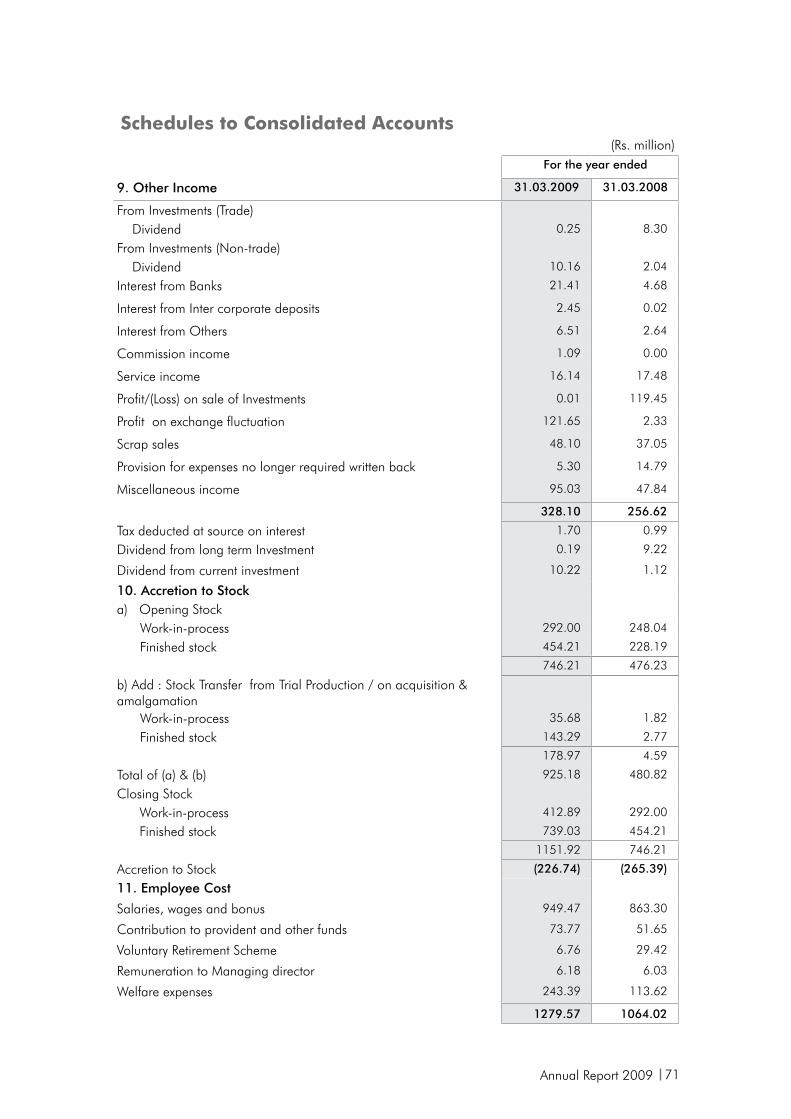
Annual Report 2009 71
10. Accretion to Stocka) Opening Stock Work-in-process 292.00 248.04
Finished stock 454.21 228.19
746.21 476.23
b) Add : Stock Transfer from Trial Production / on acquisition & amalgamation Work-in-process 35.68 1.82
Finished stock 143.29 2.77
178.97 4.59
Total of (a) & (b) 925.18 480.82
Closing Stock Work-in-process 412.89 292.00
Finished stock 739.03 454.21
1151.92 746.21
Accretion to Stock (226.74) (265.39)
schedules to Consolidated Accounts(Rs. million)
For the year ended
9. Other Income 31.03.2009 31.03.2008
From Investments (Trade) Dividend 0.25 8.30
From Investments (Non-trade) Dividend 10.16 2.04
Interest from Banks 21.41 4.68
Interest from Inter corporate deposits 2.45 0.02
Interest from Others 6.51 2.64
Commission income 1.09 0.00
Service income 16.14 17.48
Profit/(Loss) on sale of Investments 0.01 119.45
Profit on exchange fluctuation 121.65 2.33
Scrap sales 48.10 37.05
Provision for expenses no longer required written back 5.30 14.79
Miscellaneous income 95.03 47.84
328.10 256.62
Tax deducted at source on interest 1.70 0.99
Dividend from long term Investment 0.19 9.22
Dividend from current investment 10.22 1.12
11. Employee Cost
Salaries, wages and bonus 949.47 863.30
Contribution to provident and other funds 73.77 51.65
Voluntary Retirement Scheme 6.76 29.42
Remuneration to Managing director 6.18 6.03
Welfare expenses 243.39 113.62
1279.57 1064.02
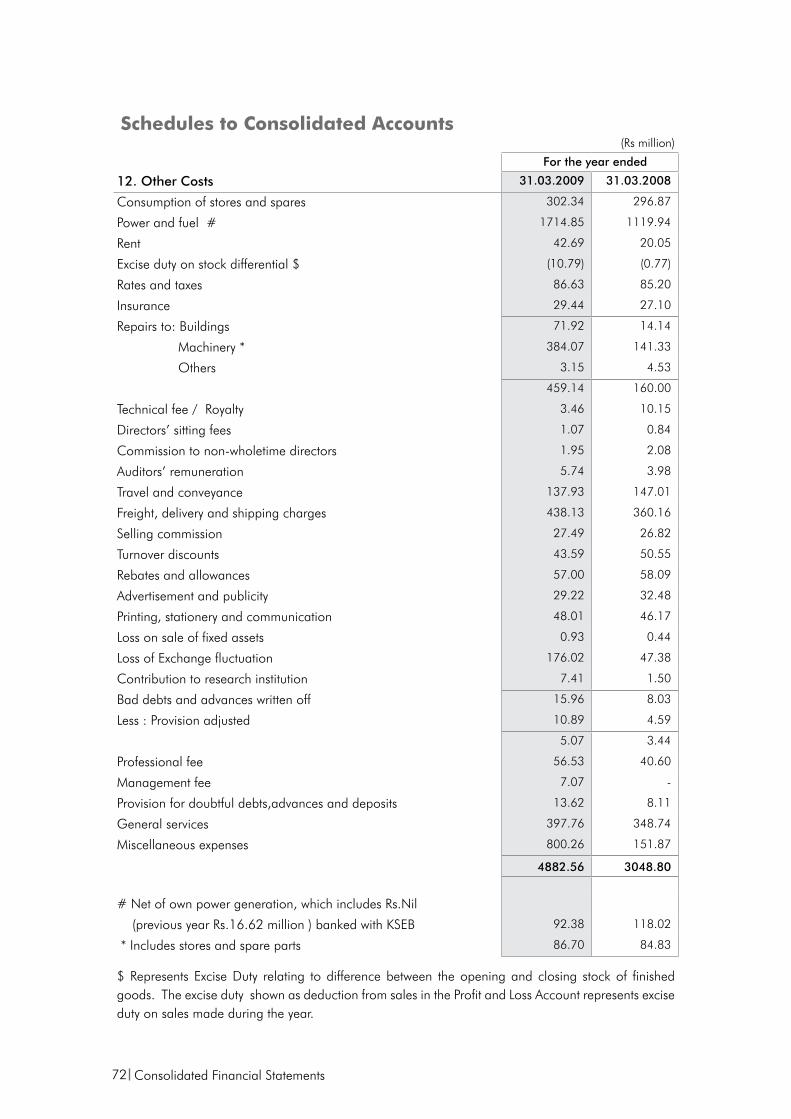
72
schedules to Consolidated Accounts(Rs million)
For the year ended
12. Other Costs 31.03.2009 31.03.2008
Consumption of stores and spares 302.34 296.87
Power and fuel # 1714.85 1119.94
Rent 42.69 20.05
Excise duty on stock differential $ (10.79) (0.77)
Rates and taxes 86.63 85.20
Insurance 29.44 27.10
Repairs to: Buildings 71.92 14.14
Machinery * 384.07 141.33
Others 3.15 4.53
459.14 160.00
Technical fee / Royalty 3.46 10.15
Directors’ sitting fees 1.07 0.84
Commission to non-wholetime directors 1.95 2.08
Auditors’ remuneration 5.74 3.98
Travel and conveyance 137.93 147.01
Freight, delivery and shipping charges 438.13 360.16
Selling commission 27.49 26.82
Turnover discounts 43.59 50.55
Rebates and allowances 57.00 58.09
Advertisement and publicity 29.22 32.48
Printing, stationery and communication 48.01 46.17
Loss on sale of fixed assets 0.93 0.44
Loss of Exchange fluctuation 176.02 47.38
Contribution to research institution 7.41 1.50
Bad debts and advances written off 15.96 8.03
Less : Provision adjusted 10.89 4.59
5.07 3.44
Professional fee 56.53 40.60
Management fee 7.07 -
Provision for doubtful debts,advances and deposits 13.62 8.11
General services 397.76 348.74
Miscellaneous expenses 800.26 151.87
4882.56 3048.80
# Net of own power generation, which includes Rs.Nil
(previous year Rs.16.62 million ) banked with KSEB 92.38 118.02
* Includes stores and spare parts 86.70 84.83
$ Represents Excise Duty relating to difference between the opening and closing stock of finished goods. The excise duty shown as deduction from sales in the Profit and Loss Account represents excise duty on sales made during the year.
Consolidated Financial Statements
Annual Report 2009 73
13. Accounting policies to consolidated accounts of CUMI with its subsidiaries, joint ventures and associate
i. Basis of preparation
The consolidated financial statement of Carborundum Universal Limited with its subsidiaries, interest in Joint ventures and associate have been prepared under his-torical cost convention with the exception of Land and Buildings (which were revalued) on accrual basis and in accordance with Generally Accepted Accounting Principles in India (Indian GAAP). The said financial statements comply with the relevant provi-sions of the Companies Act, 1956 (the Act) and the mandatory Accounting Standards notified by the Central Government of India under Companies (Accounting Standards) Rules, 2006
ii. Basis of Consolidation
The financial statements are prepared in accordance with the principles and procedures for the preparation and presentation of consolidated financial statements as laid down under Accounting standards – 21, 23 and 27. Consolidated financial statements are prepared using uniform accounting policies except as stated in (iv)(f) , (vii)(b) and (xii)(b) & (d) of this Schedule, the adjustments arising out of the same are not considered material.
In respect of foreign subsidiaries viz CUMI America Inc, CUMI Australia Pty Ltd, CUMI Middle East FZE and CUMI Canada Inc. which are classified as integral foreign operations, the financials were translated into Indian Currency as per Accounting Standard 11 (revised) and the exchange gains / (losses) arising on conversion are recognised in the Profit & Loss Account. With respect of overseas joint venture Jingri-CUMI Super Hard Materials Company Limited, CUMI International Limited and its subsidiaries Volzhsky Abrasives Works and Foskor Zirconia Pty Ltd which are classified as Non-Integral foreign Operation, the financials were translated into Indian Currency as per the aforesaid Accounting Standard and the exchange gains/ (losses) arising on conversion are accumulated under “Foreign Currency Translation Reserve”.
iii. Use of Estimates
The preparation of financial statements requires estimates and assumptions to be made that affect the reported amount of assets and liabilities on the date of the financial statements and the reported amount of revenues and expenses during the reporting period. Management believes that the estimates used in the preparation of financial statements are prudent and reasonable. Future results may vary from these estimates.
iv. Fixed assets and depreciation/ amortisation
a. Fixed assets are stated at historical cost (net of CENVAT / VAT wherever appli-cable) less accumulated depreciation except land and buildings added up to 31st August 1984 which are shown as per the revaluation done in that year; and land and buildings of Sterling Abra-sives Limited which are shown as per the revaluation done on 31st December 1993.
b. Cost comprises of direct cost, related taxes, duties, freight and attributable finance costs (Refer (vi) below) till such assets are ready for its intended use. Subsidy received from State Government towards specific assets is reduced from the cost of fixed assets. Fixed Assets taken on finance lease are capitalised.
c. Capital work in progress is stated at the amount expended up to the Balance sheet date.
d. Machinery spares used in connection with a particular item of fixed asset and the use of which is irregular, are capitalized at cost net of CENVAT / VAT, as applicable.
e. Expenditure directly relating to new projects prior to commencement of commercial production is capitalised. Indirect expenditure (net of income) attributable to the new projects or which are incidental thereto are also capitalised.
f. Depreciation on fixed assets has been provided on straight-line method at rates specified in Schedule XIV of the Companies Act 1956, except that:
74
i. Leased vehicles which are depreciated over four years and Lease hold improvements are depreciated over six years, are higher than Schedule XIV rates.
ii. In respect of Assets held by Indian Subsidiaries & Overseas Subsidiaries, Joint Ventures and Associate, depreciation is provided based on the estimated useful life of those assets as estimated by the respective Companies.
iii. Assets held by Ciria India Limited are depreciated at Schedule XIV rates on Written Down Value basis.
iv. Assets held by CUMI Canada Inc are depreciated over their estimated useful life as estimated by that company.
v. The difference between the depreciation for the year on the revalued assets and depreciation calculated on the original cost is recouped from the fixed assets revaluation reserve.
g. Individual assets costing less than Rs.5,000 are depreciated in full in the year of acquisition.
h. Intangible assets are amortised over the estimated useful life of the assets on straight line basis.
v. Impairment of assets
At each balance sheet date, the carrying values of the tangible and intangible assets are reviewed to determine whether there is any indication that those assets have suffered an impairment loss. If any such indication exists, the recoverable amount of the asset is estimated in order to determine the extent of the impairment loss (if any). Where there is an indication that there is a likely impairment loss for a group of assets, the company estimates the recoverable amount of the group of assets as a whole, and the impairment loss is recognised.
vi. Borrowing costs
Borrowing costs are capitalised as part of qualifying fixed assets when it is possible that they will result in future economic benefits. Other borrowing costs are expensed.
vii. Inventories
a. Inventories are valued at lower of cost and net realisable value. Cost includes all direct costs and applicable production overheads to bring the goods to the present location and condition. Excise duty on the finished goods is added to the cost.
b. In respect of raw materials, accessories and stores and spares cost is determined on weighted average basis which includes freight, taxes and duties net of CENVAT credit wherever applicable, except Ciria India Ltd (joint venture) where cost is determined on First in First out method. Customs duty payable on material in bond is added to cost.
c. Trading stocks are valued at First in First out method
d. Work-in-process relating to construction contracts are valued at cost. Direct expenses identifiable to a specific job are debited to that job. Indirect expenses are not allocated but charged as period cost in the year it is incurred.
viii. Investments
Long term investments are stated at cost/valuation and provision for diminution is made if such diminution is other than temporary in nature.
Short term investments are stated at lower of cost and market value. In the case of Ciria India Ltd (joint venture), cost is determined on weighted average basis.
ix. Revenue recognition
i. Domestic sales are accounted on despatch of products to customers and export sales are accounted on the basis of Bill of Lading. Sales are accounted net of Sales Tax / VAT, Discounts and Returns as applicable
ii. Service income is recognised on the basis of percentage of completion. Revenue for divisible contracts is recognised in respect of supplies as and when the supplies are completed and in respect of construction on the percentage completion method.
Consolidated Financial Statements
Annual Report 2009 75
Revenue from indivisible contracts is recognised on a percentage completion method based on the billing schedules agreed with customers. The relevant cost is recognised in Accounts in the year of recognition of revenue. Profit so recognised is adjusted to ensure that it does not exceed the estimated overall contract margin. The total costs of the contracts are estimated based on technical and other estimates. Foreseeable loss, if any, is recognized when it becomes probable and could be estimated.
iii. Benefits on account of entitlement to import goods free of duty under Duty Entitlement Pass Book Scheme, are accounted in the year of export
iv. Dividend income on investments is accounted for when the right to receive the payment is established.
x. Research and Development
All revenue expenditure related to research and development are charged to the respective heads on the Profit and Loss Account. Capital expenditure incurred on research and development is capitalised as fixed assets and depreciated in accordance with the depreciation policy of the Company.
xi. Voluntary Retirement Compensation
In the parent company compensation to employees who have retired under voluntary retirement scheme is written off to revenue.
xii. Employee Benefits
a. Defined Contribution Plan :
Fixed contributions to the Superan-nuation Fund and recognized Provident Fund are absorbed in the accounts.
b. Defined Benefit Plan :
The liability for Gratuity to employees of the Parent and its domestic subsidiaries and domestic joint ventures, as at Balance Sheet date is determined on the basis of actuarial valuation using Projected Unit Credit Method and is funded to a Gratuity fund administered by the trustees and managed by Life Insurance Corporation of India & SBI Life Insurance Ltd and the contribution
there of paid / payable is absorbed in the accounts.
Liability in respect of Long term portion of accumulated compensated absences is determined on actuarial basis and is provided for.
The Parent Company and its employees make monthly fixed contributions to Carborundum Universal Limited Employee’s Provident Fund Trust, equal to a specified percentage of the covered employee’s salary. In respect of domestic subsidiaries, the contribution is made to the Recognised Provident Fund. The interest rate payable by the Trust to the beneficiaries is being notified by the Government every year. The parent company has an obligation to make good the shortfall, if any, between the return from the investments of the trust and the notified interest rate.
c. Long term Compensated absences
In respect of long term portion of compensated absences [Leave benefits], the liability is determined on the basis of actuarial valuation and is provided for.
d. Short term employee benefits
Short term employee benefits determined as per company’s policy/scheme are recognised as expense based on expected obligation on undiscounted basis in the case of parent company and other Indian subsidiaries and joint ventures except in the case of Southern Energy Development Corporation Limited, an Indian subsidiary, where leave encashment benefit on retirement to eligible employees is ascertained on actual basis and provided for.
With respect to overseas subsidiaries & joint ventures the Company has provided for employee benefits as per the local regulations.
e. Employee Stock Option Scheme
Stock options granted to the employees under the stock option scheme by Parent company are evaluated as per the accounting treatment prescribed by the Employee Stock Option Scheme and Employee Stock Purchase Scheme Guidelines, 1999 issued by Securities
76
Exchange Board of India. The Parent Company follows the intrinsic value method of accounting for the options and accordingly, the excess of market value of the stock options as on date of grant, if any, over the exercise price of the options is recognized as deferred employee compensation and is charged to the Profit and Loss Account on graded vesting basis over the vesting period of the options
xiii. Foreign Currency Transaction
a. Foreign currency transactions are recorded at the rates of exchange prevailing on the date of transactions. Monetary assets & liabilities outstanding at the year-end are translated at the rate of exchange prevailing at the year end and profit or loss is recognised in the profit and loss account.
b. Exchange differences arising on actual payments / realisations and year end restatements are dealt with in the Profit & Loss Account.
c. The premium or discount arising at the inception of forward exchange contracts (other than those relating to a firm commitment or a highly probable forecast) are amortized as expense or income over the life of the contract.
xiv. Government Grants
Lump sum capital subsidies, not relating to any specific fixed asset, received from State Governments for setting up new projects are accounted as capital reserve.
xv. Excise Duty / Service Tax
CENVAT credit on materials purchased/ services availed for production / input services are taken into account at the time of purchase and CENVAT credit on purchase of capital items wherever applicable are taken into account as and when the assets are acquired. The CENVAT credits so taken are utilised for payment of excise duty on goods manufactured / service tax on output services. The unutilised CENVAT credit is carried forward in the books.
xvi. Segment reporting
a. The accounting policies adopted for Segment reporting are in line with the accounting policies of the Group with the following additional policies :
b. Inter-segment revenues have been accounted on the basis of prices charged to external customers.
c. Revenue and expenses have been identified to segments on the basis of their relationship to the operating activities of the Segment. Revenue and expenses, which relate to the enterprise as a whole and are not allocable to Segments on a reasonable basis have been included under “Un-allocated Corporate expenses”.
xvii.Income Tax
i. Current Tax is determined on income for the year chargeable to tax in accordance with the Tax laws in force in the country of incorporation of the respective companies into consolidation.
ii. Deferred tax is recognised for all the timing differences. Deferred tax assets are recognised when considered prudent.
xviii.Provisions, Contingent Liabilities and Contingent Assets
Provisions are recognised only when there is a present obligation as a result of past events and when a reliable estimate of the amount of obligation can be made. Contingent liability is disclosed for (i) Possible obligation which will be confirmed only by future events not wholly within the control of the Company or (ii) Present obligations arising from past events where it is not probable that an outflow of resources will be required to settle the obligation or a reliable estimate of the amount of the obligation cannot be made. Contingent assets are not recognised in the financial statements since this may result in the recognition of income that may never be realised.
Consolidated Financial Statements
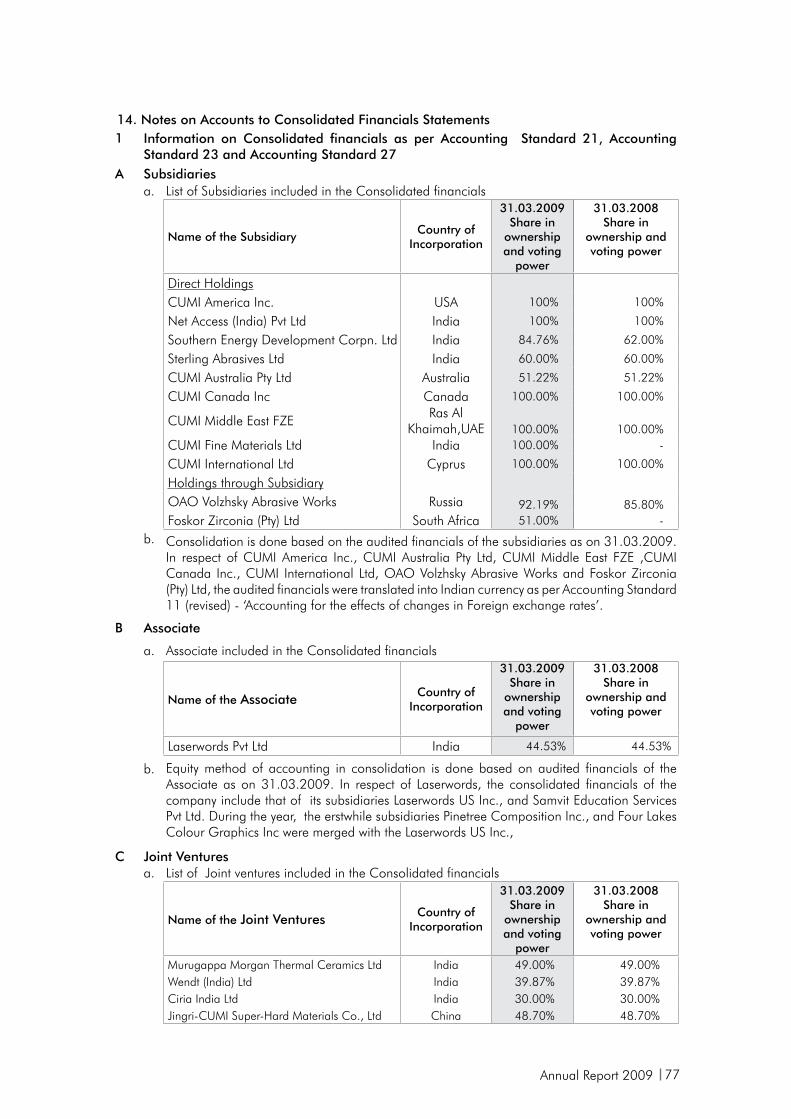
Annual Report 2009 77
14. Notes on Accounts to Consolidated Financials Statements1 Information on Consolidated financials as per Accounting Standard 21, Accounting
Standard 23 and Accounting Standard 27A Subsidiaries
a. List of Subsidiaries included in the Consolidated financials
Name of the SubsidiaryCountry of
Incorporation
31.03.2009Share in
ownership and voting
power
31.03.2008Share in
ownership and voting power
Direct HoldingsCUMI America Inc. USA 100% 100%
Net Access (India) Pvt Ltd India 100% 100%
Southern Energy Development Corpn. Ltd India 84.76% 62.00%
Sterling Abrasives Ltd India 60.00% 60.00%
CUMI Australia Pty Ltd Australia 51.22% 51.22%
CUMI Canada Inc Canada 100.00% 100.00%
CUMI Middle East FZERas Al
Khaimah,UAE 100.00% 100.00%CUMI Fine Materials Ltd India 100.00% -
CUMI International Ltd Cyprus 100.00% 100.00%
Holdings through SubsidiaryOAO Volzhsky Abrasive Works Russia 92.19% 85.80%Foskor Zirconia (Pty) Ltd South Africa 51.00% -
b. Consolidation is done based on the audited financials of the subsidiaries as on 31.03.2009. In respect of CUMI America Inc., CUMI Australia Pty Ltd, CUMI Middle East FZE ,CUMI Canada Inc., CUMI International Ltd, OAO Volzhsky Abrasive Works and Foskor Zirconia (Pty) Ltd, the audited financials were translated into Indian currency as per Accounting Standard 11 (revised) - ‘Accounting for the effects of changes in Foreign exchange rates’.
B Associate
a. Associate included in the Consolidated financials
Name of the Associate Country of Incorporation
31.03.2009Share in
ownership and voting
power
31.03.2008Share in
ownership and voting power
Laserwords Pvt Ltd India 44.53% 44.53%
b. Equity method of accounting in consolidation is done based on audited financials of the Associate as on 31.03.2009. In respect of Laserwords, the consolidated financials of the company include that of its subsidiaries Laserwords US Inc., and Samvit Education Services Pvt Ltd. During the year, the erstwhile subsidiaries Pinetree Composition Inc., and Four Lakes Colour Graphics Inc were merged with the Laserwords US Inc.,
C Joint Ventures a. List of Joint ventures included in the Consolidated financials
Name of the Joint Ventures Country of Incorporation
31.03.2009Share in
ownership and voting
power
31.03.2008Share in
ownership and voting power
Murugappa Morgan Thermal Ceramics Ltd India 49.00% 49.00%Wendt (India) Ltd India 39.87% 39.87%Ciria India Ltd India 30.00% 30.00%Jingri-CUMI Super-Hard Materials Co., Ltd China 48.70% 48.70%
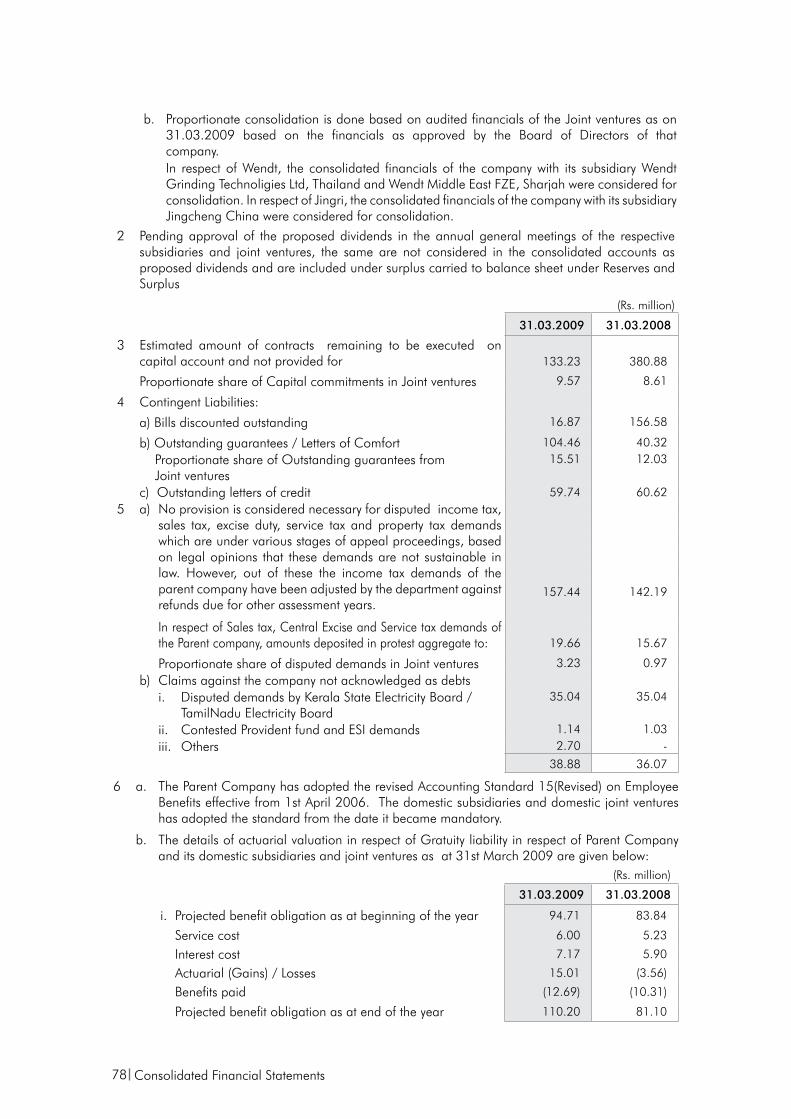
78
2 Pending approval of the proposed dividends in the annual general meetings of the respective subsidiaries and joint ventures, the same are not considered in the consolidated accounts as proposed dividends and are included under surplus carried to balance sheet under Reserves and Surplus
(Rs. million)
31.03.2009 31.03.2008
3 Estimated amount of contracts remaining to be executed on capital account and not provided for 133.23 380.88
Proportionate share of Capital commitments in Joint ventures 9.57 8.61
4 Contingent Liabilities:
a) Bills discounted outstanding 16.87 156.58
b) Outstanding guarantees / Letters of Comfort 104.46 40.32 Proportionate share of Outstanding guarantees from Joint ventures
15.51 12.03
c) Outstanding letters of credit 59.74 60.62 5 a) No provision is considered necessary for disputed income tax,
sales tax, excise duty, service tax and property tax demands which are under various stages of appeal proceedings, based on legal opinions that these demands are not sustainable in law. However, out of these the income tax demands of the parent company have been adjusted by the department against refunds due for other assessment years.
157.44 142.19
In respect of Sales tax, Central Excise and Service tax demands of the Parent company, amounts deposited in protest aggregate to: 19.66 15.67
Proportionate share of disputed demands in Joint ventures 3.23 0.97 b) Claims against the company not acknowledged as debts
i. Disputed demands by Kerala State Electricity Board / TamilNadu Electricity Board
35.04 35.04
ii. Contested Provident fund and ESI demands 1.14 1.03 iii. Others 2.70 -
38.88 36.07
6 a. The Parent Company has adopted the revised Accounting Standard 15(Revised) on Employee Benefits effective from 1st April 2006. The domestic subsidiaries and domestic joint ventures has adopted the standard from the date it became mandatory.
b. The details of actuarial valuation in respect of Gratuity liability in respect of Parent Company and its domestic subsidiaries and joint ventures as at 31st March 2009 are given below:
(Rs. million)
31.03.2009 31.03.2008
i. Projected benefit obligation as at beginning of the year 94.71 83.84
Service cost 6.00 5.23
Interest cost 7.17 5.90
Actuarial (Gains) / Losses 15.01 (3.56)
Benefits paid (12.69) (10.31)
Projected benefit obligation as at end of the year 110.20 81.10
Consolidated Financial Statements
b. Proportionate consolidation is done based on audited financials of the Joint ventures as on 31.03.2009 based on the financials as approved by the Board of Directors of that company.In respect of Wendt, the consolidated financials of the company with its subsidiary Wendt Grinding Technoligies Ltd, Thailand and Wendt Middle East FZE, Sharjah were considered for consolidation. In respect of Jingri, the consolidated financials of the company with its subsidiary Jingcheng China were considered for consolidation.
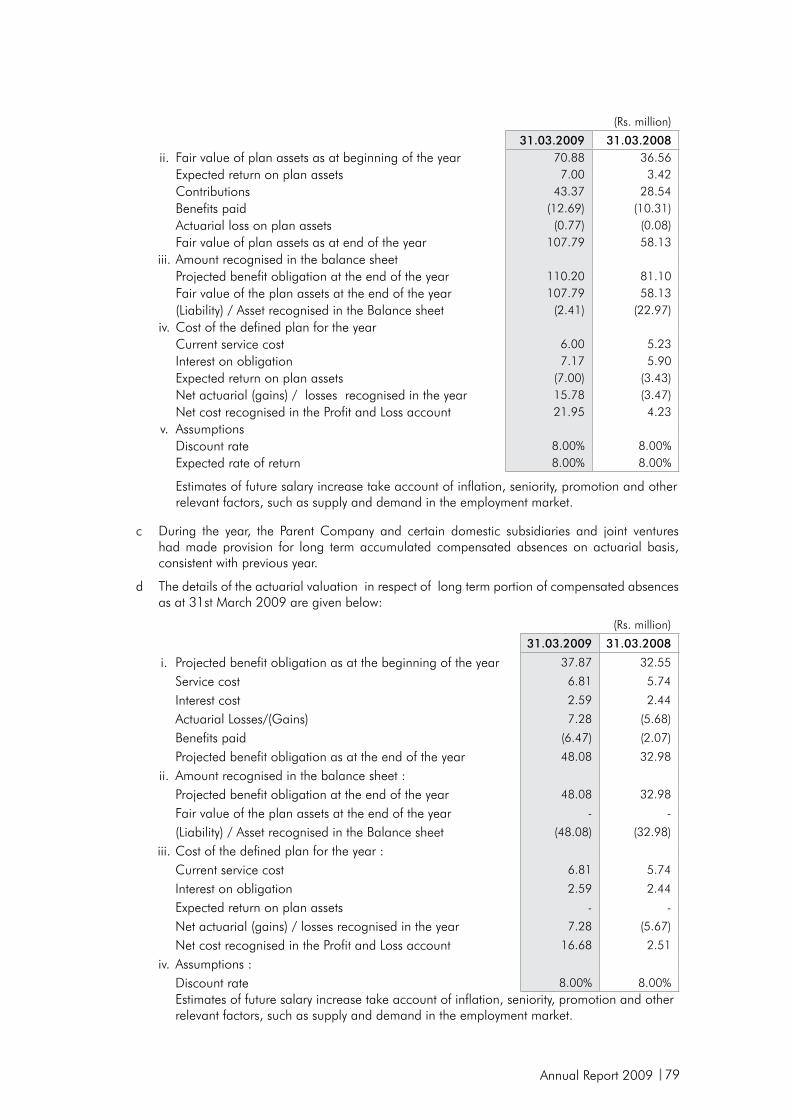
Annual Report 2009 79
c During the year, the Parent Company and certain domestic subsidiaries and joint ventures had made provision for long term accumulated compensated absences on actuarial basis, consistent with previous year.
d The details of the actuarial valuation in respect of long term portion of compensated absences as at 31st March 2009 are given below:
(Rs. million)
31.03.2009 31.03.2008
i. Projected benefit obligation as at the beginning of the year 37.87 32.55
Service cost 6.81 5.74
Interest cost 2.59 2.44
Actuarial Losses/(Gains) 7.28 (5.68)
Benefits paid (6.47) (2.07)
Projected benefit obligation as at the end of the year 48.08 32.98
ii. Amount recognised in the balance sheet :Projected benefit obligation at the end of the year 48.08 32.98
Fair value of the plan assets at the end of the year - -
(Liability) / Asset recognised in the Balance sheet (48.08) (32.98)
iii. Cost of the defined plan for the year :Current service cost 6.81 5.74
Interest on obligation 2.59 2.44
Expected return on plan assets - -
Net actuarial (gains) / losses recognised in the year 7.28 (5.67)
Net cost recognised in the Profit and Loss account 16.68 2.51
iv. Assumptions :Discount rate 8.00% 8.00%Estimates of future salary increase take account of inflation, seniority, promotion and other relevant factors, such as supply and demand in the employment market.
(Rs. million)
31.03.2009 31.03.2008ii. Fair value of plan assets as at beginning of the year 70.88 36.56
Expected return on plan assets 7.00 3.42 Contributions 43.37 28.54 Benefits paid (12.69) (10.31)Actuarial loss on plan assets (0.77) (0.08)Fair value of plan assets as at end of the year 107.79 58.13
iii. Amount recognised in the balance sheetProjected benefit obligation at the end of the year 110.20 81.10 Fair value of the plan assets at the end of the year 107.79 58.13 (Liability) / Asset recognised in the Balance sheet (2.41) (22.97)
iv. Cost of the defined plan for the yearCurrent service cost 6.00 5.23 Interest on obligation 7.17 5.90 Expected return on plan assets (7.00) (3.43)Net actuarial (gains) / losses recognised in the year 15.78 (3.47)Net cost recognised in the Profit and Loss account 21.95 4.23
v. AssumptionsDiscount rate 8.00% 8.00%Expected rate of return 8.00% 8.00%
Estimates of future salary increase take account of inflation, seniority, promotion and other relevant factors, such as supply and demand in the employment market.
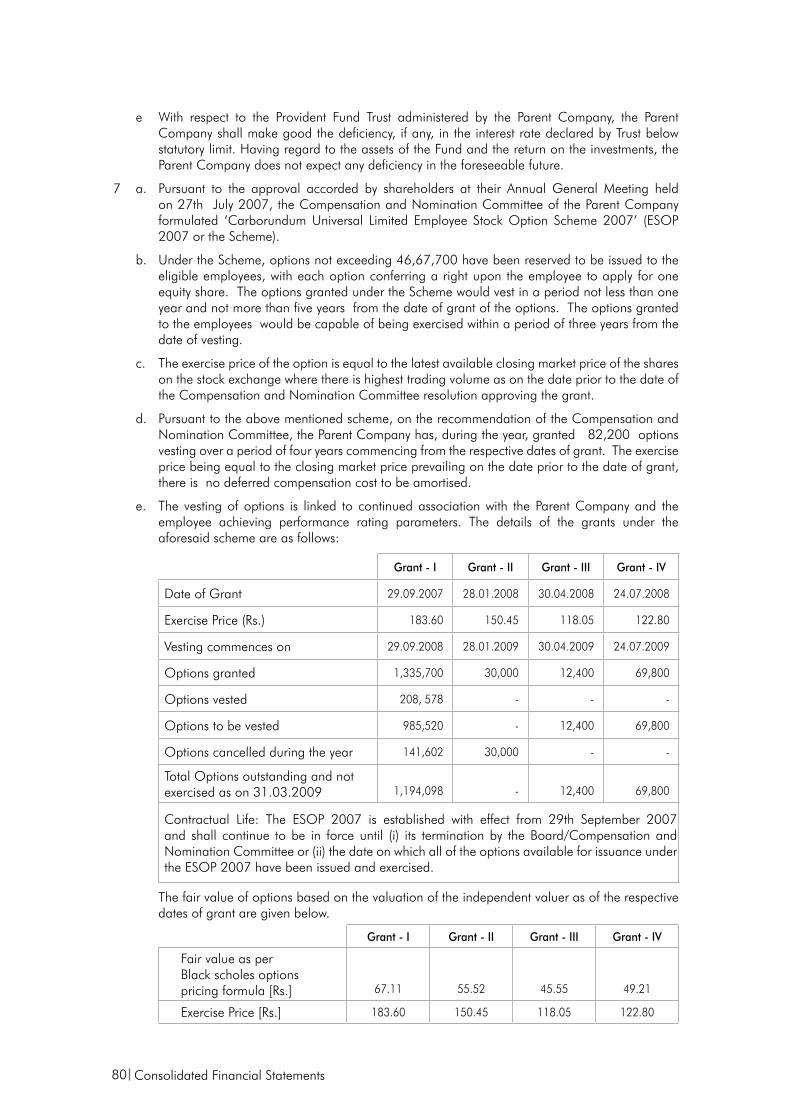
80
e With respect to the Provident Fund Trust administered by the Parent Company, the Parent Company shall make good the deficiency, if any, in the interest rate declared by Trust below statutory limit. Having regard to the assets of the Fund and the return on the investments, the Parent Company does not expect any deficiency in the foreseeable future.
7 a. Pursuant to the approval accorded by shareholders at their Annual General Meeting held on 27th July 2007, the Compensation and Nomination Committee of the Parent Company formulated ‘Carborundum Universal Limited Employee Stock Option Scheme 2007’ (ESOP 2007 or the Scheme).
b. Under the Scheme, options not exceeding 46,67,700 have been reserved to be issued to the eligible employees, with each option conferring a right upon the employee to apply for one equity share. The options granted under the Scheme would vest in a period not less than one year and not more than five years from the date of grant of the options. The options granted to the employees would be capable of being exercised within a period of three years from the date of vesting.
c. The exercise price of the option is equal to the latest available closing market price of the shares on the stock exchange where there is highest trading volume as on the date prior to the date of the Compensation and Nomination Committee resolution approving the grant.
d. Pursuant to the above mentioned scheme, on the recommendation of the Compensation and Nomination Committee, the Parent Company has, during the year, granted 82,200 options vesting over a period of four years commencing from the respective dates of grant. The exercise price being equal to the closing market price prevailing on the date prior to the date of grant, there is no deferred compensation cost to be amortised.
e. The vesting of options is linked to continued association with the Parent Company and the employee achieving performance rating parameters. The details of the grants under the aforesaid scheme are as follows:
Grant - I Grant - II Grant - III Grant - IV
Date of Grant 29.09.2007 28.01.2008 30.04.2008 24.07.2008
Exercise Price (Rs.) 183.60 150.45 118.05 122.80
Vesting commences on 29.09.2008 28.01.2009 30.04.2009 24.07.2009
Options granted 1,335,700 30,000 12,400 69,800
Options vested 208, 578 - - -
Options to be vested 985,520 - 12,400 69,800
Options cancelled during the year 141,602 30,000 - -
Total Options outstanding and not exercised as on 31.03.2009 1,194,098 - 12,400 69,800
Contractual Life: The ESOP 2007 is established with effect from 29th September 2007 and shall continue to be in force until (i) its termination by the Board/Compensation and Nomination Committee or (ii) the date on which all of the options available for issuance under the ESOP 2007 have been issued and exercised.
The fair value of options based on the valuation of the independent valuer as of the respective dates of grant are given below.
Grant - I Grant - II Grant - III Grant - IV
Fair value as per Black scholes options pricing formula [Rs.] 67.11 55.52 45.55 49.21
Exercise Price [Rs.] 183.60 150.45 118.05 122.80
Consolidated Financial Statements
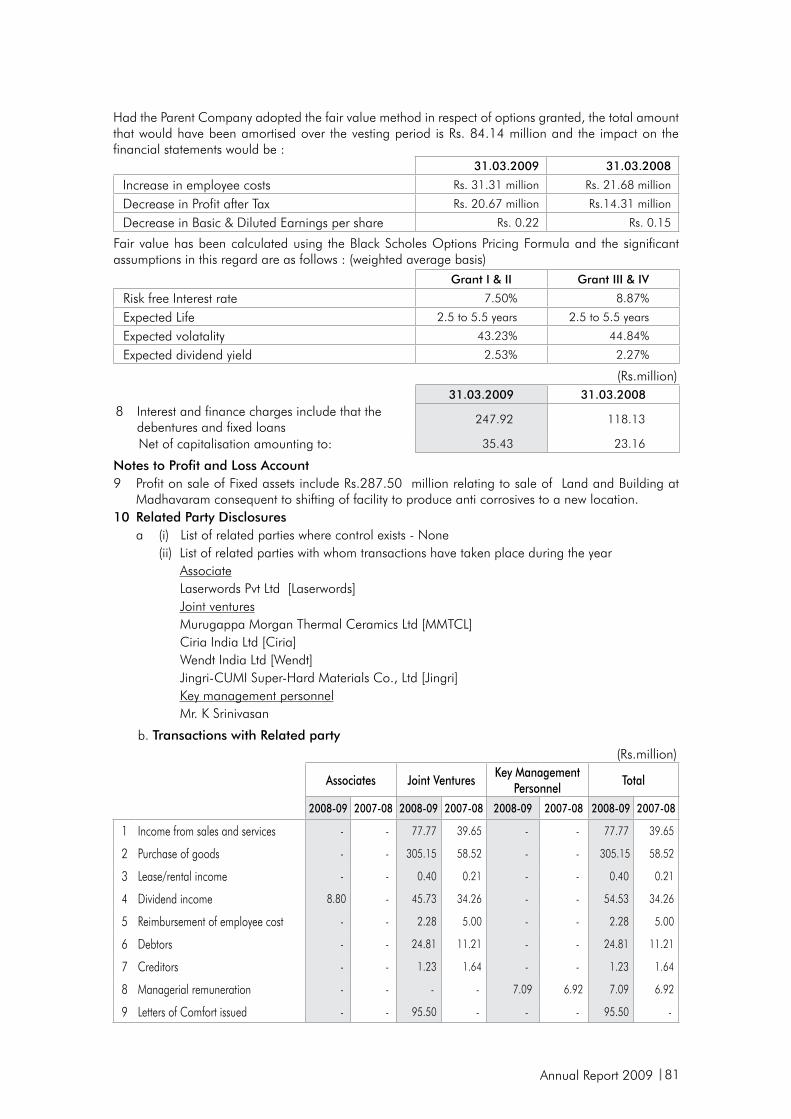
Annual Report 2009 81
31.03.2009 31.03.2008
Increase in employee costs Rs. 31.31 million Rs. 21.68 million
Decrease in Profit after Tax Rs. 20.67 million Rs.14.31 million
Decrease in Basic & Diluted Earnings per share Rs. 0.22 Rs. 0.15
Fair value has been calculated using the Black Scholes Options Pricing Formula and the significant assumptions in this regard are as follows : (weighted average basis)
Grant I & II Grant III & IV
Risk free Interest rate 7.50% 8.87%
Expected Life 2.5 to 5.5 years 2.5 to 5.5 years
Expected volatality 43.23% 44.84%
Expected dividend yield 2.53% 2.27%
(Rs.million)31.03.2009 31.03.2008
8 Interest and finance charges include that the debentures and fixed loans
247.92 118.13
Net of capitalisation amounting to: 35.43 23.16
Notes to Profit and Loss Account9 Profit on sale of Fixed assets include Rs.287.50 million relating to sale of Land and Building at
Madhavaram consequent to shifting of facility to produce anti corrosives to a new location.10 Related Party Disclosures a (i) List of related parties where control exists - None (ii) List of related parties with whom transactions have taken place during the year Associate Laserwords Pvt Ltd [Laserwords] Joint ventures Murugappa Morgan Thermal Ceramics Ltd [MMTCL] Ciria India Ltd [Ciria] Wendt India Ltd [Wendt] Jingri-CUMI Super-Hard Materials Co., Ltd [Jingri] Key management personnel Mr. K Srinivasan
b. Transactions with Related party(Rs.million)
Associates Joint VenturesKey Management
PersonnelTotal
2008-09 2007-08 2008-09 2007-08 2008-09 2007-08 2008-09 2007-08
1 Income from sales and services - - 77.77 39.65 - - 77.77 39.65
2 Purchase of goods - - 305.15 58.52 - - 305.15 58.52
3 Lease/rental income - - 0.40 0.21 - - 0.40 0.21
4 Dividend income 8.80 - 45.73 34.26 - - 54.53 34.26
5 Reimbursement of employee cost - - 2.28 5.00 - - 2.28 5.00
6 Debtors - - 24.81 11.21 - - 24.81 11.21
7 Creditors - - 1.23 1.64 - - 1.23 1.64
8 Managerial remuneration - - - - 7.09 6.92 7.09 6.92
9 Letters of Comfort issued - - 95.50 - - - 95.50 -
Had the Parent Company adopted the fair value method in respect of options granted, the total amount that would have been amortised over the vesting period is Rs. 84.14 million and the impact on the financial statements would be :
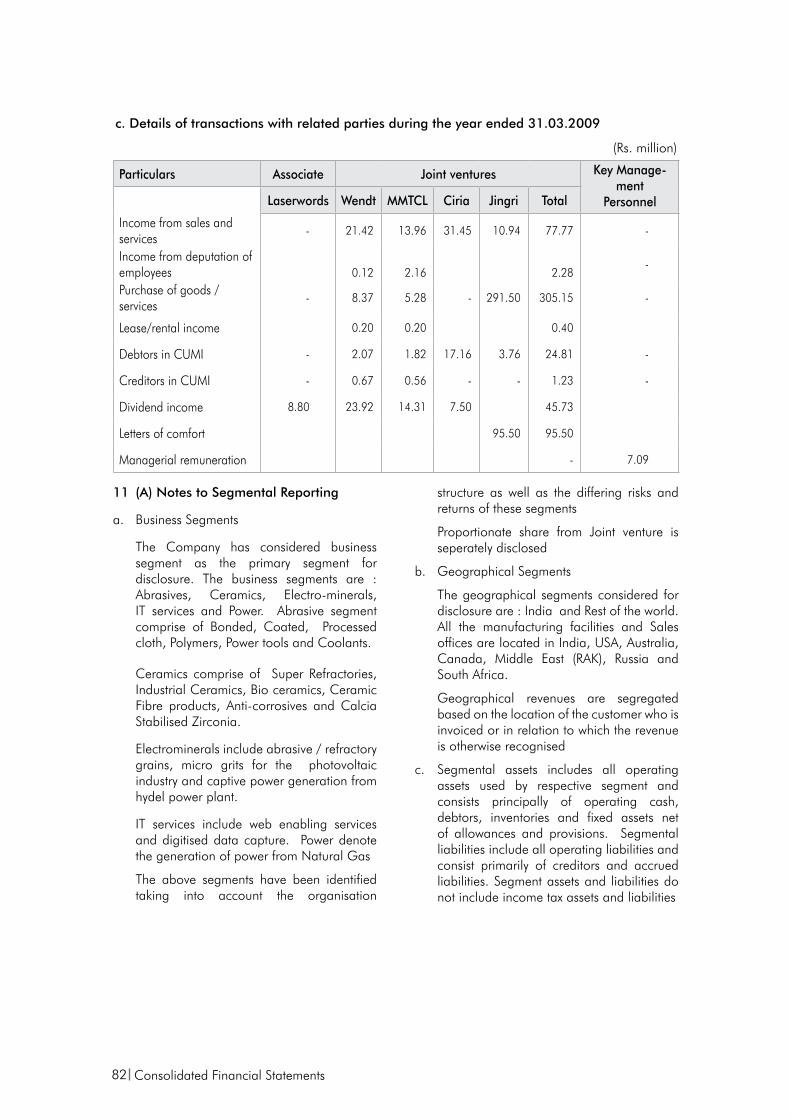
82
c. Details of transactions with related parties during the year ended 31.03.2009
(Rs. million)
Particulars Associate Joint ventures Key Manage-ment
PersonnelLaserwords Wendt MMTCL Ciria Jingri Total
Income from sales and services
- 21.42 13.96 31.45 10.94 77.77 -
Income from deputation of employees
0.12 2.16 2.28
-
Purchase of goods / services
- 8.37 5.28 - 291.50 305.15 -
Lease/rental income 0.20 0.20 0.40
Debtors in CUMI - 2.07 1.82 17.16 3.76 24.81 -
Creditors in CUMI - 0.67 0.56 - - 1.23 -
Dividend income 8.80 23.92 14.31 7.50 45.73
Letters of comfort 95.50 95.50
Managerial remuneration - 7.09
11 (A) Notes to Segmental Reporting
a. Business Segments
The Company has considered business segment as the primary segment for disclosure. The business segments are : Abrasives, Ceramics, Electro-minerals, IT services and Power. Abrasive segment comprise of Bonded, Coated, Processed cloth, Polymers, Power tools and Coolants.
Ceramics comprise of Super Refractories, Industrial Ceramics, Bio ceramics, Ceramic Fibre products, Anti-corrosives and Calcia Stabilised Zirconia.
Electrominerals include abrasive / refractory grains, micro grits for the photovoltaic industry and captive power generation from hydel power plant.
IT services include web enabling services and digitised data capture. Power denote the generation of power from Natural Gas
The above segments have been identified taking into account the organisation
structure as well as the differing risks and returns of these segments
Proportionate share from Joint venture is seperately disclosed
b. Geographical Segments
The geographical segments considered for disclosure are : India and Rest of the world. All the manufacturing facilities and Sales offices are located in India, USA, Australia, Canada, Middle East (RAK), Russia and South Africa.
Geographical revenues are segregated based on the location of the customer who is invoiced or in relation to which the revenue is otherwise recognised
c. Segmental assets includes all operating assets used by respective segment and consists principally of operating cash, debtors, inventories and fixed assets net of allowances and provisions. Segmental liabilities include all operating liabilities and consist primarily of creditors and accrued liabilities. Segment assets and liabilities do not include income tax assets and liabilities
Consolidated Financial Statements
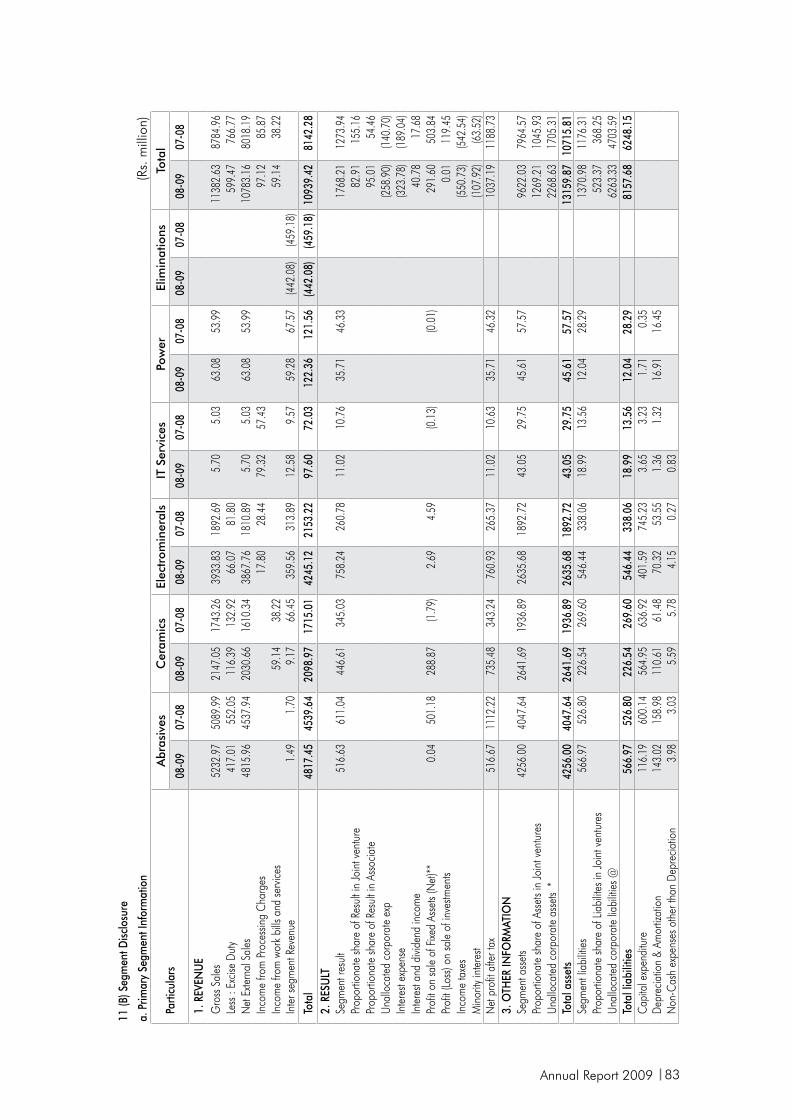
Annual Report 2009 83
11 (B
) Seg
men
t Disc
losu
re
a. P
rimar
y Se
gmen
t Inf
orm
atio
n (R
s. m
illio
n)
Parti
cula
rsA
bras
ives
Cer
amic
sEl
ectr
omin
eral
sIT
Ser
vice
sPo
wer
Elim
inat
ions
Tota
l
08-0
907
-08
08-0
907
-08
08-0
907
-08
08-0
907
-08
08-0
907
-08
08-0
907
-08
08-0
907
-08
1. R
EVEN
UE
Gro
ss S
ales
5232
.97
5089
.99
2147
.05
1743
.26
3933
.83
1892
.69
5.70
5.03
63.0
853
.99
1138
2.63
8784
.96
Less
: Ex
cise
Duty
417.
0155
2.05
116.
3913
2.92
66.0
781
.80
599.
4776
6.77
Net
Exte
rnal
Sal
es48
15.9
645
37.9
420
30.6
616
10.3
438
67.7
618
10.8
95.
705.
0363
.08
53.9
910
783.
1680
18.1
9In
com
e fro
m P
roce
ssin
g C
harg
es17
.80
28.4
479
.32
57.4
397
.12
85.8
7In
com
e fro
m w
ork
bills
and
serv
ices
59.1
438
.22
59.1
438
.22
Inte
r seg
men
t Rev
enue
1.49
1.70
9.17
66.4
535
9.56
313.
8912
.58
9.57
59.2
867
.57
(442
.08)
(459
.18)
Tota
l48
17.4
545
39.6
420
98.9
717
15.0
142
45.1
221
53.2
297
.60
72.0
312
2.36
121.
56(4
42.0
8)(4
59.1
8)10
939.
4281
42.2
82.
RES
ULT
Segm
ent r
esul
t51
6.63
611.
0444
6.61
345.
0375
8.24
260.
7811
.02
10.7
635
.71
46.3
317
68.2
112
73.9
4Pr
opor
tiona
te sh
are
of R
esul
t in
Join
t ven
ture
82.9
115
5.16
Prop
ortio
nate
shar
e of
Res
ult i
n As
socia
te95
.01
54.4
6Un
allo
cate
d co
rpor
ate
exp
(258
.90)
(140
.70)
Inte
rest
expe
nse
(323
.78)
(189
.04)
Inte
rest
and
divid
end
inco
me
40.7
817
.68
Prof
it on
sale
of F
ixed
Asse
ts (N
et)**
0.04
501.
1828
8.87
(1.7
9)2.
694.
59(0
.13)
(0.0
1)29
1.60
503.
84Pr
ofit
(Loss
) on
sale
of i
nves
tmen
ts0.
0111
9.45
In
com
e ta
xes
(550
.73)
(542
.54)
Min
ority
inte
rest
(107
.92)
(63.
52)
Net
pro
fit a
fter t
ax51
6.67
1112
.22
735.
4834
3.24
760.
9326
5.37
11.0
210
.63
35.7
146
.32
1037
.19
1188
.73
3. O
THER
INFO
RMAT
ION
Segm
ent a
sset
s42
56.0
040
47.6
426
41.6
919
36.8
926
35.6
818
92.7
243
.05
29.7
545
.61
57.5
796
22.0
379
64.5
7Pr
opor
tiona
te sh
are
of A
sset
s in
Join
t ven
ture
s
1269
.21
1045
.93
Unal
loca
ted
corp
orat
e as
sets
*22
68.6
317
05.3
1To
tal a
sset
s42
56.0
040
47.6
426
41.6
919
36.8
926
35.6
818
92.7
243
.05
29.7
545
.61
57.5
713
159.
8710
715.
81Se
gmen
t lia
biliti
es56
6.97
526.
8022
6.54
269.
6054
6.44
338.
0618
.99
13.5
612
.04
28.2
913
70.9
811
76.3
1Pr
opor
tiona
te sh
are
of Li
abilit
es in
Join
t ven
ture
s52
3.37
368.
25Un
allo
cate
d co
rpor
ate
liabi
lities
@62
63.3
347
03.5
9To
tal l
iabi
litie
s56
6.97
526.
8022
6.54
269.
6054
6.44
338.
0618
.99
13.5
612
.04
28.2
981
57.6
862
48.1
5C
apita
l exp
endi
ture
116.
1960
0.14
564.
9563
6.92
401.
5974
5.23
3.65
3.23
1.71
0.35
Depr
ecia
tion
& Am
ortiz
atio
n14
3.02
158.
9811
0.61
61.4
870
.32
53.5
51.
361.
3216
.91
16.4
5N
on-C
ash
expe
nses
oth
er th
an D
epre
ciatio
n3.
983.
035.
595.
784.
150.
270.
83
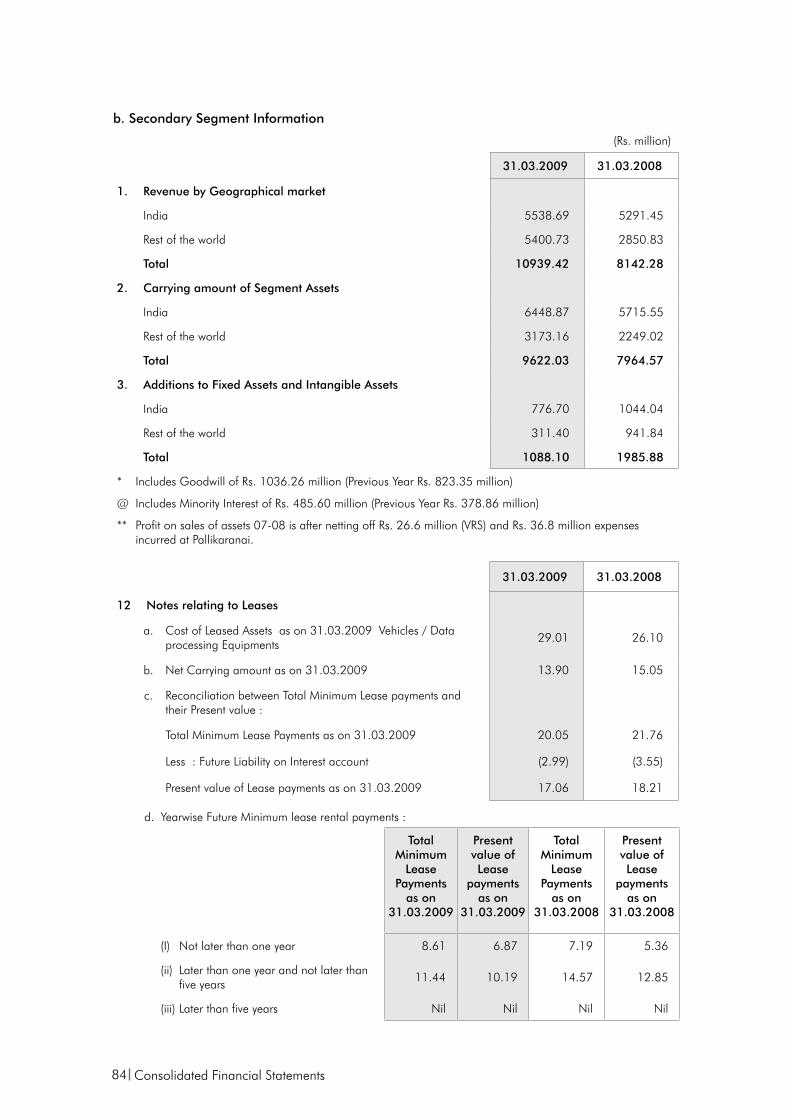
84
b. Secondary Segment Information
(Rs. million)
31.03.2009 31.03.2008
1. Revenue by Geographical market
India 5538.69 5291.45
Rest of the world 5400.73 2850.83
Total 10939.42 8142.28
2. Carrying amount of Segment Assets
India 6448.87 5715.55
Rest of the world 3173.16 2249.02
Total 9622.03 7964.57
3. Additions to Fixed Assets and Intangible Assets
India 776.70 1044.04
Rest of the world 311.40 941.84
Total 1088.10 1985.88
* Includes Goodwill of Rs. 1036.26 million (Previous Year Rs. 823.35 million)
@ Includes Minority Interest of Rs. 485.60 million (Previous Year Rs. 378.86 million)
** Profit on sales of assets 07-08 is after netting off Rs. 26.6 million (VRS) and Rs. 36.8 million expenses incurred at Pallikaranai.
d. Yearwise Future Minimum lease rental payments :
Total Minimum
Lease Payments
as on 31.03.2009
Present value of Lease
payments as on
31.03.2009
Total Minimum
Lease Payments
as on 31.03.2008
Present value of Lease
payments as on
31.03.2008
(I) Not later than one year 8.61 6.87 7.19 5.36
(ii) Later than one year and not later than five years
11.44 10.19 14.57 12.85
(iii) Later than five years Nil Nil Nil Nil
31.03.2009 31.03.2008
12 Notes relating to Leases
a. Cost of Leased Assets as on 31.03.2009 Vehicles / Data processing Equipments
29.01 26.10
b. Net Carrying amount as on 31.03.2009 13.90 15.05
c. Reconciliation between Total Minimum Lease payments and their Present value :
Total Minimum Lease Payments as on 31.03.2009 20.05 21.76
Less : Future Liability on Interest account (2.99) (3.55)
Present value of Lease payments as on 31.03.2009 17.06 18.21
Consolidated Financial Statements
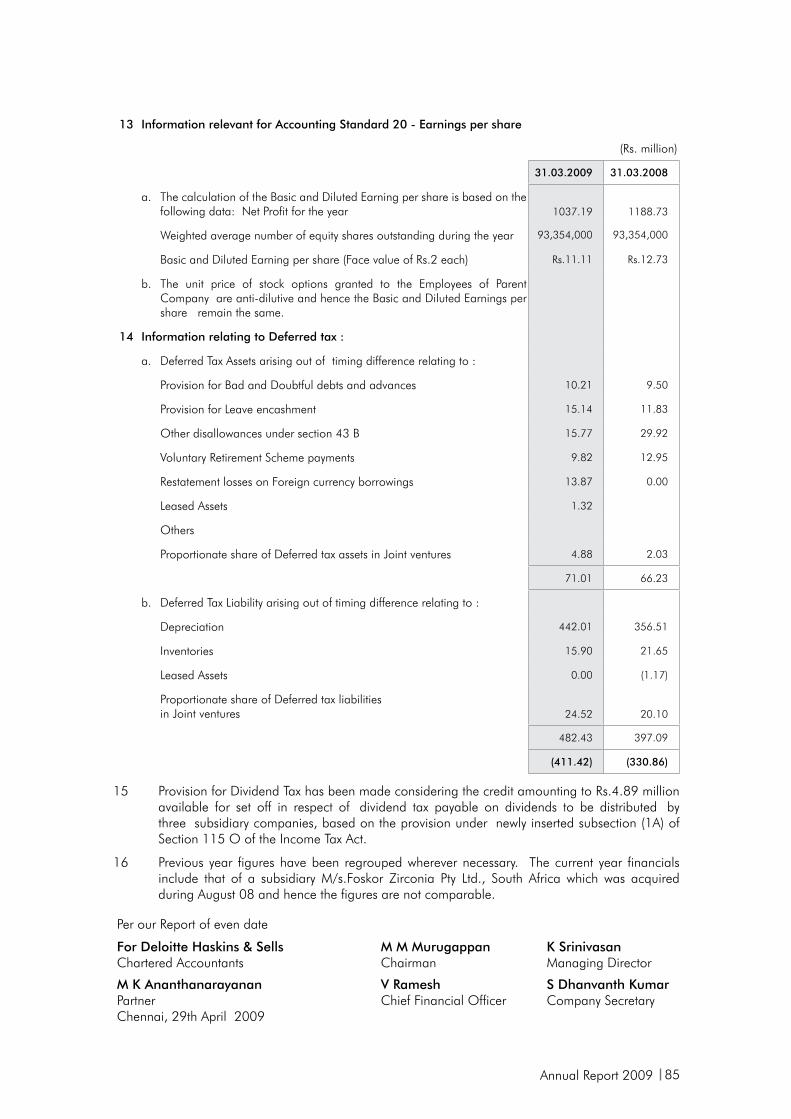
Annual Report 2009 85
13 Information relevant for Accounting Standard 20 - Earnings per share
(Rs. million)
31.03.2009 31.03.2008
a. The calculation of the Basic and Diluted Earning per share is based on the following data: Net Profit for the year 1037.19 1188.73
Weighted average number of equity shares outstanding during the year 93,354,000 93,354,000
Basic and Diluted Earning per share (Face value of Rs.2 each) Rs.11.11 Rs.12.73
b. The unit price of stock options granted to the Employees of Parent Company are anti-dilutive and hence the Basic and Diluted Earnings per share remain the same.
14 Information relating to Deferred tax :
a. Deferred Tax Assets arising out of timing difference relating to :
Provision for Bad and Doubtful debts and advances 10.21 9.50
Provision for Leave encashment 15.14 11.83
Other disallowances under section 43 B 15.77 29.92
Voluntary Retirement Scheme payments 9.82 12.95
Restatement losses on Foreign currency borrowings 13.87 0.00
Leased Assets 1.32
Others
Proportionate share of Deferred tax assets in Joint ventures 4.88 2.03
71.01 66.23
b. Deferred Tax Liability arising out of timing difference relating to :
Depreciation 442.01 356.51
Inventories 15.90 21.65
Leased Assets 0.00 (1.17)
Proportionate share of Deferred tax liabilities in Joint ventures 24.52 20.10
482.43 397.09
(411.42) (330.86)
15 Provision for Dividend Tax has been made considering the credit amounting to Rs.4.89 million available for set off in respect of dividend tax payable on dividends to be distributed by three subsidiary companies, based on the provision under newly inserted subsection (1A) of Section 115 O of the Income Tax Act.
16 Previous year figures have been regrouped wherever necessary. The current year financials include that of a subsidiary M/s.Foskor Zirconia Pty Ltd., South Africa which was acquired during August 08 and hence the figures are not comparable.
Per our Report of even date
For Deloitte Haskins & SellsChartered Accountants
M M MurugappanChairman
K SrinivasanManaging Director
M K AnanthanarayananPartnerChennai, 29th April 2009
V RameshChief Financial Officer
S Dhanvanth KumarCompany Secretary
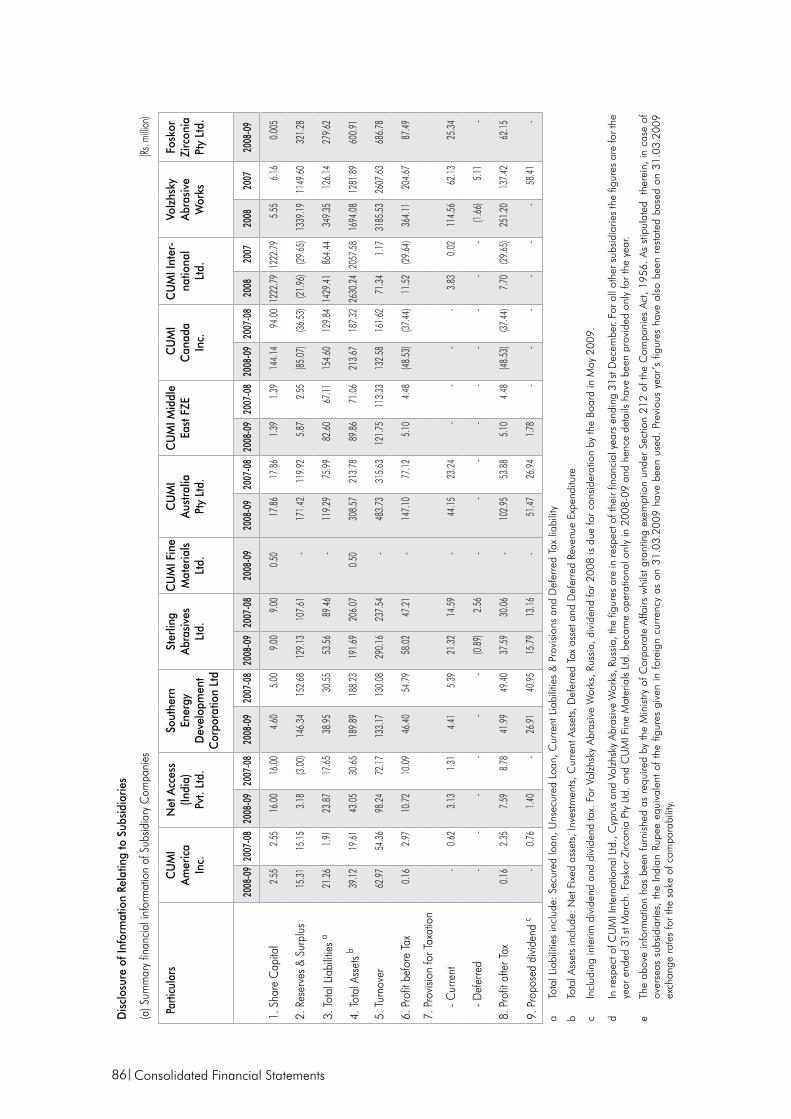
86
Dis
clos
ure
of In
form
atio
n Re
latin
g to
Sub
sidi
arie
s
(a) S
umm
ary
finan
cial
info
rmat
ion
of S
ubsid
iary
Com
pani
es(Rs
. milli
on)
Parti
cula
rsC
UM
I Am
eric
aIn
c.
Net
Acc
ess
(Indi
a)Pv
t. Lt
d.
Sout
hern
En
ergy
D
evel
opm
ent
Cor
pora
tion
Ltd
Ster
ling
Abra
sive
sLt
d.
CU
MI F
ine
Mat
eria
ls
Ltd.
CU
MI
Aust
ralia
Pty
Ltd.
CU
MI M
iddl
eEa
st F
ZE C
UM
IC
anad
a In
c.
CU
MI I
nter
-na
tiona
l Lt
d.
Volz
hsky
Ab
rasi
veW
orks
Fosk
orZi
rcon
ia
Pty
Ltd.
2008
-09
2007
-08
2008
-09
2007
-08
2008
-09
2007
-08
2008
-09
2007
-08
2008
-09
2008
-09
2007
-08
2008
-09
2007
-08
2008
-09
2007
-08
2008
2007
2008
2007
2008
-09
1. S
hare
Cap
ital
2.55
2.
55
16.0
0 16
.00
4.60
5.
00
9.00
9.
00
0.50
17.8
6 17
.86
1.39
1.39
14
4.14
94.0
0 12
22.7
912
22.7
95.
556.
160.
005
2. R
eser
ves
& Su
rplu
s15
.31
15.1
5 3.
18
(3.00
)14
6.34
15
2.68
12
9.13
10
7.61
-
171.
42
119.
92
5.8
7 2.
55
(85.0
7)(36
.53)
(21.
96)
(29.
65)
1339
.19
1149
.60
321
.28
3. T
otal
Lia
bilit
ies
a21
.26
1.91
23
.87
17.6
5 38
.95
30.5
5 53
.56
89.4
6 -
119.
29
75.9
9 82
.60
67.1
1 15
4.60
129.
84 1
429.
4186
4.44
349.
3512
6.14
279.
62
4. T
otal
Ass
ets
b39
.12
19.6
1 43
.05
30.6
5 18
9.89
18
8.23
19
1.69
20
6.07
0.
5030
8.57
21
3.78
89
.86
71.0
6 21
3.67
187.
32 2
630.
2420
57.5
816
94.0
812
81.8
960
0.91
5. T
urno
ver
62.9
7 54
.36
98.2
4 72
.17
133.
17
130.
08
290.
16
237.
54
-48
3.73
31
5.63
12
1.75
113.
33
132.
5816
1.62
71
.34
1.17
3185
.53
2607
.63
686.
78
6. P
rofit
bef
ore
Tax
0.16
2.
97
10.7
2 10
.09
46.4
0 54
.79
58.0
2 47
.21
- 14
7.10
77
.12
5.1
0 4.
48
(48.5
3)(37
.44)
11.
52
(29.
64)
364.
1120
4.67
87.
49
7. P
rovis
ion
for T
axat
ion
-
Cur
rent
- 0.
62
3.13
1.
31
4.41
5.
39
21.3
2 14
.59
- 44
.15
23.2
4 -
- -
- 3
.83
0.0
2 11
4.56
62.1
3 2
5.34
-
Def
erre
d-
- -
--
-(0.
89)
2.56
-
- -
- -
--
--
(1.66
)5.
11-
8. P
rofit
afte
r Tax
0.16
2.
35
7.59
8.
78
41.9
9 49
.40
37.5
9 30
.06
- 10
2.95
53
.88
5.10
4.
48
(48.5
3)(37
.44)
7.7
0 (2
9.65
)25
1.20
13
7.42
62
.15
9. P
ropo
sed
divid
end
c-
0.76
1.
40-
26.9
1 40
.95
15.7
913
.16
-51
.47
26.9
4 1
.78
- -
--
--
58.4
1-
a To
tal L
iabi
litie
s in
clud
e: S
ecur
ed lo
an, U
nsec
ured
Loa
n, C
urre
nt L
iabi
litie
s &
Pro
visi
ons
and
Def
erre
d Ta
x lia
bilit
y
b To
tal A
sset
s in
clud
e: N
et F
ixed
ass
ets,
Inve
stm
ents
, Cur
rent
Ass
ets,
Def
erre
d Ta
x as
set a
nd D
efer
red
Reve
nue
Expe
nditu
re
c In
clud
ing
inte
rim d
ivid
end
and
divi
dend
tax.
For
Vol
zhsk
y Ab
rasi
ve W
orks
, Rus
sia,
div
iden
d fo
r 20
08 is
due
for
cons
ider
atio
n by
the
Boar
d in
May
200
9.
d In
resp
ect o
f CU
MI I
nter
natio
nal L
td.,
Cyp
rus
and
Volz
hsky
Abr
asiv
e W
orks
, Rus
sia,
the
figur
es a
re in
resp
ect o
f the
ir fin
anci
al y
ears
end
ing
31st
Dec
embe
r. Fo
r all
othe
r sub
sidi
arie
s th
e fig
ures
are
for t
he
year
end
ed 3
1st M
arch
. Fos
kor
Zirc
onia
Pty
Ltd
. and
CU
MI F
ine
Mat
eria
ls L
td. b
ecam
e op
erat
iona
l onl
y in
200
8-09
and
hen
ce d
etai
ls h
ave
been
pro
vide
d on
ly fo
r th
e ye
ar.
e Th
e ab
ove
info
rmat
ion
has
been
furn
ishe
d as
req
uire
d by
the
Min
istry
of C
orpo
rate
Affa
irs w
hils
t gra
ntin
g ex
empt
ion
unde
r Se
ctio
n 21
2 of
the
Com
pani
es A
ct,
1956
. As
stip
ulat
ed
ther
ein,
in c
ase
of
over
seas
sub
sidi
arie
s, th
e In
dian
Rup
ee e
quiv
alen
t of
the
figur
es g
iven
in f
orei
gn c
urre
ncy
as o
n 31
.03.
2009
hav
e be
en u
sed.
Pre
viou
s ye
ar’s
fig
ures
hav
e al
so b
een
rest
ated
bas
ed o
n 31
.03.
2009
ex
chan
ge r
ates
for
the
sake
of c
ompa
rabi
lity.
Consolidated Financial Statements
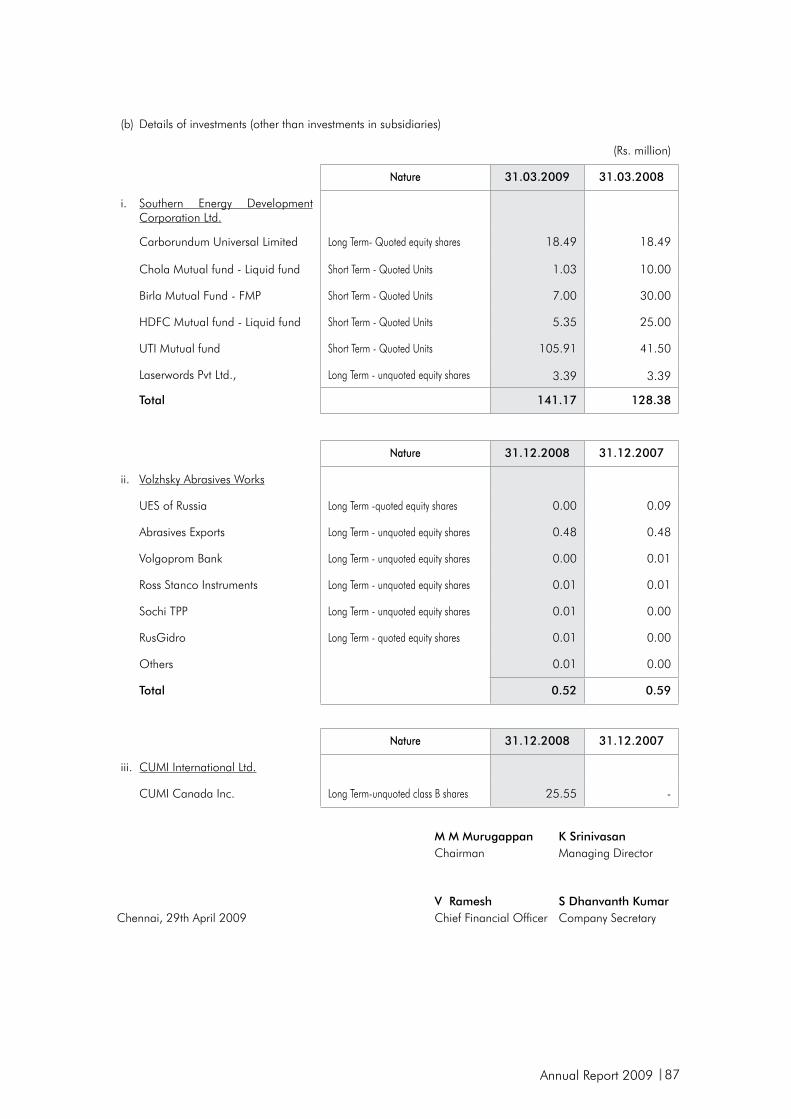
Annual Report 2009 87
(b) Details of investments (other than investments in subsidiaries)
(Rs. million)
Nature 31.03.2009 31.03.2008
i. Southern Energy Development Corporation Ltd.
Carborundum Universal Limited Long Term- Quoted equity shares 18.49 18.49
Chola Mutual fund - Liquid fund Short Term - Quoted Units 1.03 10.00
Birla Mutual Fund - FMP Short Term - Quoted Units 7.00 30.00
HDFC Mutual fund - Liquid fund Short Term - Quoted Units 5.35 25.00
UTI Mutual fund Short Term - Quoted Units 105.91 41.50
Laserwords Pvt Ltd., Long Term - unquoted equity shares 3.39 3.39
Total 141.17 128.38
Nature 31.12.2008 31.12.2007
ii. Volzhsky Abrasives Works
UES of Russia Long Term -quoted equity shares 0.00 0.09
Abrasives Exports Long Term - unquoted equity shares 0.48 0.48
Volgoprom Bank Long Term - unquoted equity shares 0.00 0.01
Ross Stanco Instruments Long Term - unquoted equity shares 0.01 0.01
Sochi TPP Long Term - unquoted equity shares 0.01 0.00
RusGidro Long Term - quoted equity shares 0.01 0.00
Others 0.01 0.00
Total 0.52 0.59
M M Murugappan K SrinivasanChairman Managing Director
V Ramesh S Dhanvanth KumarChennai, 29th April 2009 Chief Financial Officer Company Secretary
Nature 31.12.2008 31.12.2007
iii. CUMI International Ltd.
CUMI Canada Inc. Long Term-unquoted class B shares 25.55 -
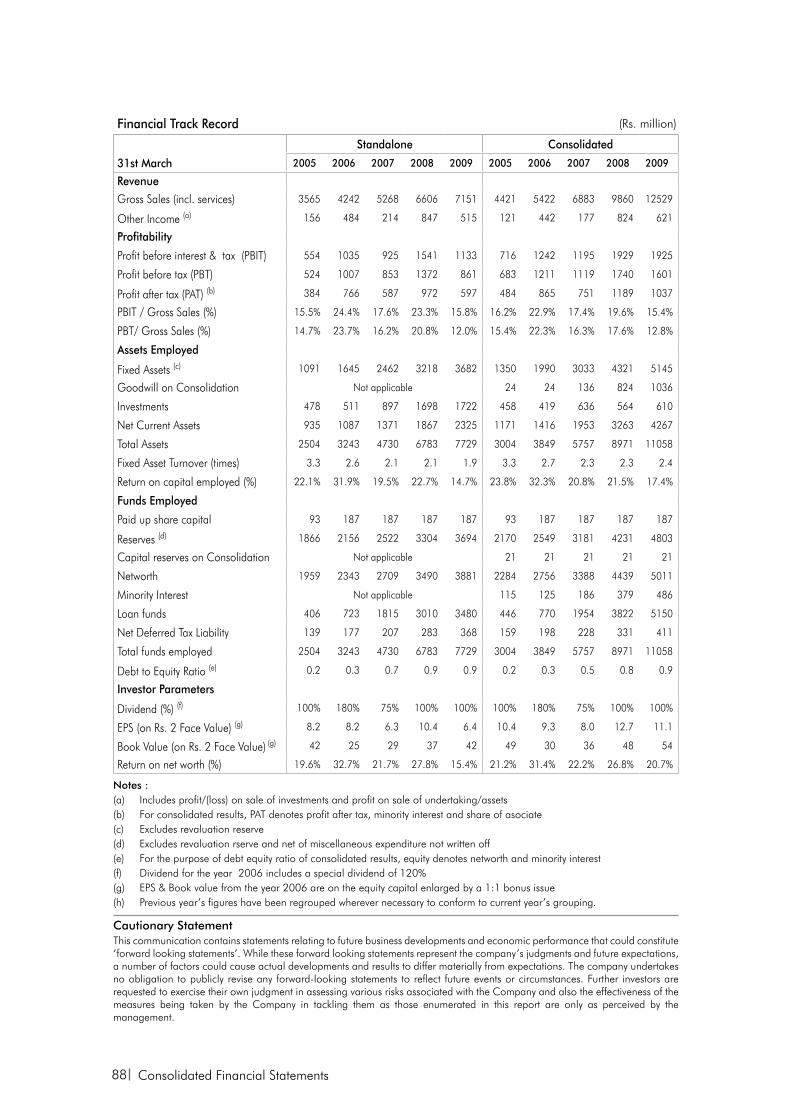
88
Financial Track Record (Rs. million)
Standalone Consolidated
31st March 2005 2006 2007 2008 2009 2005 2006 2007 2008 2009
RevenueGross Sales (incl. services) 3565 4242 5268 6606 7151 4421 5422 6883 9860 12529
Other Income (a) 156 484 214 847 515 121 442 177 824 621
Profitability
Profit before interest & tax (PBIT) 554 1035 925 1541 1133 716 1242 1195 1929 1925
Profit before tax (PBT) 524 1007 853 1372 861 683 1211 1119 1740 1601
Profit after tax (PAT) (b) 384 766 587 972 597 484 865 751 1189 1037
PBIT / Gross Sales (%) 15.5% 24.4% 17.6% 23.3% 15.8% 16.2% 22.9% 17.4% 19.6% 15.4%
PBT/ Gross Sales (%) 14.7% 23.7% 16.2% 20.8% 12.0% 15.4% 22.3% 16.3% 17.6% 12.8%
Assets Employed
Fixed Assets (c) 1091 1645 2462 3218 3682 1350 1990 3033 4321 5145
Goodwill on Consolidation Not applicable 24 24 136 824 1036
Investments 478 511 897 1698 1722 458 419 636 564 610
Net Current Assets 935 1087 1371 1867 2325 1171 1416 1953 3263 4267
Total Assets 2504 3243 4730 6783 7729 3004 3849 5757 8971 11058
Fixed Asset Turnover (times) 3.3 2.6 2.1 2.1 1.9 3.3 2.7 2.3 2.3 2.4
Return on capital employed (%) 22.1% 31.9% 19.5% 22.7% 14.7% 23.8% 32.3% 20.8% 21.5% 17.4%
Funds Employed
Paid up share capital 93 187 187 187 187 93 187 187 187 187
Reserves (d) 1866 2156 2522 3304 3694 2170 2549 3181 4231 4803
Capital reserves on Consolidation Not applicable 21 21 21 21 21
Networth 1959 2343 2709 3490 3881 2284 2756 3388 4439 5011
Minority Interest Not applicable 115 125 186 379 486
Loan funds 406 723 1815 3010 3480 446 770 1954 3822 5150
Net Deferred Tax Liability 139 177 207 283 368 159 198 228 331 411
Total funds employed 2504 3243 4730 6783 7729 3004 3849 5757 8971 11058
Debt to Equity Ratio (e) 0.2 0.3 0.7 0.9 0.9 0.2 0.3 0.5 0.8 0.9
Investor Parameters
Dividend (%) (f) 100% 180% 75% 100% 100% 100% 180% 75% 100% 100%
EPS (on Rs. 2 Face Value) (g) 8.2 8.2 6.3 10.4 6.4 10.4 9.3 8.0 12.7 11.1
Book Value (on Rs. 2 Face Value) (g) 42 25 29 37 42 49 30 36 48 54
Return on net worth (%) 19.6% 32.7% 21.7% 27.8% 15.4% 21.2% 31.4% 22.2% 26.8% 20.7%
Notes :(a) Includes profit/(loss) on sale of investments and profit on sale of undertaking/assets(b) For consolidated results, PAT denotes profit after tax, minority interest and share of asociate(c) Excludes revaluation reserve(d) Excludes revaluation rserve and net of miscellaneous expenditure not written off(e) For the purpose of debt equity ratio of consolidated results, equity denotes networth and minority interest(f) Dividend for the year 2006 includes a special dividend of 120%(g) EPS & Book value from the year 2006 are on the equity capital enlarged by a 1:1 bonus issue(h) Previous year’s figures have been regrouped wherever necessary to conform to current year’s grouping.
Cautionary StatementThis communication contains statements relating to future business developments and economic performance that could constitute ‘forward looking statements’. While these forward looking statements represent the company’s judgments and future expectations, a number of factors could cause actual developments and results to differ materially from expectations. The company undertakes no obligation to publicly revise any forward-looking statements to reflect future events or circumstances. Further investors are requested to exercise their own judgment in assessing various risks associated with the Company and also the effectiveness of the measures being taken by the Company in tackling them as those enumerated in this report are only as perceived by the management.
Consolidated Financial Statements