Culture fair intelligence test
35
Running Head: Pupillary Responses and Cognitive Ability In Press, International Journal of Psychophysiology Pupillary Responses on the Visual Backward Masking Task Reflect General Cognitive Ability Steven P. Verney Veterans Affairs San Diego Healthcare System Eric Granholm Veterans Affairs San Diego Healthcare System, and University of California, San Diego and Sandra P. Marshall San Diego State University Corresponding Author: Steven P. Verney, Ph.D. VA San Diego Healthcare System (116B) 3350 La Jolla Village Drive San Diego, CA 92161 [email protected] TEL: (858) 552-8585 x2316 FAX: (858) 642-6416 1
-
Upload
polytechnic-university-of-the-philippines -
Category
Documents
-
view
5.923 -
download
12
Transcript of Culture fair intelligence test

Running Head: Pupillary Responses and Cognitive Ability
In Press, International Journal of Psychophysiology
Pupillary Responses on the Visual Backward Masking Task
Reflect General Cognitive Ability
Steven P. Verney
Veterans Affairs San Diego Healthcare System
Eric Granholm
Veterans Affairs San Diego Healthcare System, and
University of California, San Diego
and
Sandra P. Marshall
San Diego State University
Corresponding Author: Steven P. Verney, Ph.D. VA San Diego Healthcare System (116B) 3350 La Jolla Village Drive San Diego, CA 92161 [email protected] TEL: (858) 552-8585 x2316 FAX: (858) 642-6416
1

Pupillary Responses and Cognitive Ability 2
Abstract
Cognitive processing efficiency requires both an ability to attend to task-relevant stimuli with
quickness and accuracy, while also filtering distracting or task-irrelevant stimuli. This study
investigated cognitive processing efficiency by using pupillary responses as an index of
attentional allocation to relevant target and irrelevant masks on a visual backward masking task.
The relationship between attentional allocation on this task and general cognitive ability on the
scholastic aptitude test (SAT) was examined in college students (n=67). A principle components
analysis of the pupillary response waveform isolated a late component that appeared to index the
attentional demands associated with processing masks on the backward masking task. This
pupillary response index of wasteful resource allocation to the mask accounted for significant
variance in SAT scores over and above that accounted for by socio-economic status and target
detection accuracy scores. Consistent with the neural efficiency hypothesis, individuals who
allocated more resources to processing irrelevant information performed more poorly on
cognitive ability tests.
Word Count =158
Pupillary Responses and Cognitive Ability 3
Introduction
The neural efficiency hypothesis states that more intelligent individuals process
information and solve problems more efficiently (i.e., with less mental effort) than less
intelligent individuals (Davidson & Downing, 2000; Haier, Siegel, Tang, Abel, & Buchsbaum,
1992; Hendrickson, 1982a; Hendrickson, 1982b; Schafer, 1982). This hypothesis has received
some support in the psychophysiological literature on pupillary responses. The extent of pupil
dilation recorded during a cognitive task is a psychophysiological measure of task processing
load and resource allocation, with larger pupil dilation reflecting greater processing load or
mental effort (Beatty, 1982). Ahern and Beatty (1979) showed an association between pupillary
responses and cognitive ability by showing that pupillary responses recorded in college students
while they performed a multiplication task were negatively correlated with cognitive ability.
That is, college students with lower scores on the Scholastic Aptitude Test (SAT) exhibited
greater pupil dilation to the multiplication problems than students with higher SAT scores.
Consistent with the neural efficiency hypothesis, they concluded that individuals with greater
cognitive ability process information with greater efficiency or less mental effort.
One information-processing task tapping speed and efficiency of processing is the visual
backward masking task, which has received substantial notoriety in the intelligence literature
(for reviews see Deary & Stough, 1996; Deary, 2000). The backward masking task is used to
quantify the amount of time that information is passed through the sensory register. This task
consists of a rapidly presented target stimulus (e.g. letters, or different length lines), a varying
length of vacant time (e.g., 20 to 700 ms), and a masking stimulus that typically completely
covers the spatial presence of the target stimulus (Saccuzzo, 1993). Participants are typically
asked to identify the target stimuli (e.g., which line is longer or what was the letter). Successful

Pupillary Responses and Cognitive Ability 4
completion of the task, therefore, requires not only efficient processing of the target stimuli, but
also the ability to filter the effects of the masking stimulus. Inspection time, the amount of time
needed for an individual to reliable perceive the target stimulus, has been touted as the best
information-processing measure in terms of having a reliable, substantial correlation with
performance on standard tests of psychometric intelligence (Deary & Stough, 1996). This
measure derived from the backward masking paradigm accounts for about 20% of the variance
in intelligence tests (Deary & Stough, 1996; Kranzler & Jensen, 1989; Longstreth, Walsh,
Alcorn, Szeszulski, & Manis, 1986; Nettlebeck, Edwards & Vreugdenhil, 1986).
In a previous study, we recorded pupil dilation responses in college students while they
performed a visual backward masking task with 33, 50, 67, 117, and 317 ms stimulus onset
asynchronies (SOA) between the target and mask stimuli and a no-mask condition (Verney,
Granholm, & Dionisio, 2001). Pupil dilation was significantly greater during task performance
(cognitive load) relative to a condition where participants passively viewed the stimuli (cognitive
no-load), and there were no significant differences between SOA conditions during passive
viewing of the stimuli (no-load). This finding further validates pupil dilation as an index of
cognitive resource allocation. Moreover, significantly greater pupil dilation was found in the
longest (317 ms) SOA condition compared to the no-mask condition. Dilation in all other SOA
conditions did not exceed that of the no-mask condition. The only difference between the longest
SOA condition and the no-mask condition was the presence of the mask. Therefore, this finding
suggested that the presence of the mask increased task processing load beyond that of target
detection alone (no-mask condition) only in the longest (317) SOA condition. This finding was
consistent with backward masking task models that suggest the mask demands extra processing
resources, or a shifting and sharing of stimulus identification resources between the target and

Pupillary Responses and Cognitive Ability 5
mask, only when the mask follows a target by more than about 120 ms (Loftus, 1989; Michaels
& Turvey, 1979; Phillips, 1974).
The total pupil dilation response reflects the sum of all processing demands associated
with the task. In an attempt to isolate the separate processing demands associated with specific
task stimuli (e.g., targets and masks), a principal components analysis (PCA) was computed on
the Verney et al. (2001) data set, as well as on pupillary response data sets from two additional
backward masking task studies from our lab (Granholm & Verney, this issue; Verney, 2001).
PCA is often used as a method of reducing the large number of data time points in
psychophysiological data to a small number of meaningful factors. Three factors consistently
emerged from the PCA analyses in all three of these studies, which appeared to isolate the
specific resource demands associated with target and mask processing. The three factors formed
a linear time course of the pupillary response waveform: (1) An early factor from about 0 to 0.7
sec; (2) a middle factor from about 0.7 to 1.5 sec; and (3) a late factor from about 1.5 to 3.0 sec.
The middle factor occurred in the time window when peak dilation responses to cognitive task
stimuli are commonly found to reflect resource allocation to task performance (e.g.,
discriminating and evaluating the target lines; Beatty, 1982; Beatty & Lucero-Wagoner, 2000;
Steinhauer & Hakerem, 1992). Middle factor dilation was smaller in conditions where target
detection was poorest and larger in conditions where target detection was greatest. The middle
factor, therefore, was interpreted as reflecting target processing. The late factor was interpreted
as reflecting resources allocated to mask processing. In longer SOA conditions (i.e., greater than
about 120 ms), when the masking stimulus becomes a distinct percept from the target stimulus
(Michaels & Turvey, 1979; Phillips, 1974), late factor pupil dilation was significantly greater
than in the no-mask condition. We interpreted this difference in the late factor between longer

Pupillary Responses and Cognitive Ability 6
SOA masking conditions (with both target and mask) and the no-mask condition (containing
only a target) as reflecting the additional processing demands of the mask. Therefore, the late
factor dilation score could be used to measure resource allocation to mask processing.
The present study attempted to replicate and extend Ahern and Beatty’s (1979) finding
that cognitive task-evoked pupillary responses are negatively associated with general cognitive
ability. In contrast to the Ahern and Beatty (1979) study, which used a higher-order processing
task (multiplication), the visual backward masking task was used in this study to tap speed and
efficiency of processing. This task was thought to be a better test of the neural efficiency
hypothesis, because it has been used exclusively for this purpose in the intelligence literature and
does not tap cognitive abilities directly measured on the SAT (e.g., math abilities). It was
hypothesized that greater cognitive ability (SAT scores) would be associated with greater task
detection accuracy. If confirmed, this would replicate previous findings that behavioral
measures of information processing efficiency are strongly related to cognitive ability (Deary &
Stough, 1996; Kranzler & Jensen, 1989). It was also hypothesized that pupillary dilation
responses elicited by the task’s non-informational masking stimulus (i.e., inefficient or wasteful
mask processing) would significantly add to the prediction in SAT scores above that provided by
detection accuracy and socio-economic status. That is, consistent with Ahern and Beatty (1979),
greater cognitive ability should be associated with less pupil dilation to the masking stimulus,
especially in the longer SOA conditions where resource allocation to the mask is greatest. This
finding would be consistent with the neural efficiency hypothesis that individuals with greater
cognitive abilities perform tasks with less mental effort and do not wastefully allocate resources
to task-irrelevant information (e.g., Cha & Merrill, 1994; Merrill & Taube, 1996; McCall, 1994).

Pupillary Responses and Cognitive Ability 7
Methods
Participants
Undergraduate male and female students (n = 101) were recruited from introductory
psychology courses at San Diego State University (SDSU) to participate in a larger study
(Verney, 2001; Verney, Granholm, Marshall, Malcarne, & Saccuzo, submitted). The
Institutional Review Boards at the University of California, San Diego, and San Diego State
University approved this study. Participants were offered class credit and monetary
compensation for their time and efforts and provided informed consent.
Participant Exclusion Criteria. Participants in this study were recruited as part of a larger
study on cultural differences in intelligence, which required that participants be either Caucasian
or Mexican American (Verney, 2001). The race/ethnicity findings are reported elsewhere
(Verney et al., submitted). Briefly, pupillary responses and detection accuracy scores on the
visual backward masking task in that study were both significantly correlated with Wechsler
Adult Intelligence Scale – Revised (WAIS-R) Full Scale IQ scores in a sample of Caucasian
participants, but weaker, nonsignificant associations were found in Mexican American
participants, even though the two ethnic groups did not differ significantly on detection accuracy
or pupillary responses. This differential predictive validity between measures of information
processing efficiency and intelligence test scores suggested that the WAIS-R test may contain a
cultural component that reduces its validity as a measure of IQ for Mexican American students.
Because specific health factors, such as drug or alcohol abuse, might lead to impairment
on cognitive tasks, all participants completed a drug and alcohol use questionnaire and a brief
physical and mental health background interview. No subject reported significant patterns of
drug or alcohol use. Of the 101 participants who reported to the testing site, five individuals

Pupillary Responses and Cognitive Ability 8
were dropped from the study due to medical or physical reasons. One Peruvian student did not
meet criteria for inclusion into that study (Verney, 2001), and thus, was dropped. Twelve
participants who presented for the study were excluded from all the analyses due to excessive
eye blink artifacts (analyzable trials less than 40%; n = 2;), technical difficulties with the eye-
tracking instrument (n = 2), abnormal tonic pupil measurements (resting diameter outliers greater
than 3 standard deviations from the mean of all subjects; n = 2;), or unreasonably poor visual
backward masking performance (at-chance No-Mask condition or No-Mask performance outliers
greater than 3 standard deviations from the mean of all subjects; n = 6). All participants
demonstrated at least 20/30 visual acuity (corrected or non-corrected) as assessed by a Snellen
wall chart. No participant reported smoking cigarettes or drinking caffeinated beverages within
two hours prior to the testing session. Of the 75 students who qualified for the study, 67 students
had SAT scores on record at San Diego State University and provided written consent to obtain
access to their records. These students comprised the final sample, which consisted of Caucasian
American (53.7%) and Mexican American (46.3%) undergraduate students (52.2% female, mean
age = 18.4 ± SD = 0.9, mean education = 12.4 ± 0.7). Scores on the combined Verbal and
Quantitative SAT ranged from 540 to 1260 total points (mean SAT score = 985.8 ± 150.1). The
average family income was reportedly $46,567 ± $18,241, the average father’s education level
was 12.5 ± 3.8 years, and the average mother’s education level was 12.8 ± 3.4 years.
Apparatus
Pupillometric data were gathered from the left eye via an Applied Science Laboratories
Model 4000SU HMO head mounted eye-tracking system during the visual backward masking
task performance. This infrared corneal-reflection-pupil-center system sampled pupil area
measurements at 60 Hz (approximately every 16.7 ms) and saved the data for subsequent off-line

Pupillary Responses and Cognitive Ability 9
analysis. Pupil area measurements were translated to diameter for consistency with other
pupillographic studies. The resolution of the pupillometer was 0.05 mm diameter. A 17-inch
Super Video Graphics Adapter (SVGA) monitor controlled by a PC was used to administer the
visual backward masking task, and the participants used the left and right arrow keys on the
keyboard to make their responses.
Procedure
Following the brief background interview, substance use questionnaire, and visual acuity
testing, the visual backward masking task was administered. The Scale of Ethnic Experience
(SEE; Malcarne, Chavira, Fernandez & Liu, in press), which provided the participants’ socio-
economic information (i.e., family income, parent’s educational level), was also administered.
Visual Backward Masking Task. The visual backward masking task was implemented on
a PC-based system. Participants were asked to identify which of two target lines was longer
(i.e., forced-choice paradigm). Target and masking stimuli consisted of black lines on a white
background to reduce screen glare effects and minimize changes that could be associated with
the pupil light reflex. The target stimulus consisted of two adjacent vertical lines presented in
the center of the computer screen, 1.7 cm apart. For every trial, one of the two lines (right or
left) was longer than the other (2.7 vs. 2 cm) and vertically offset in height in one of six different
target configurations varying from 2 to 4 cm in offset height (Verney, 2001; Verney, et al.,
2001). The upper endpoint of the “short” line could be higher, equal, or lower than the upper
endpoint of the “long” line and only one endpoint (either upper or lower) of one target line could
be in alignment with the same endpoints of the masking lines. The long and short lines were
randomly blocked in series of 12 trials (so that each of the six offset configurations was
presented twice in every sequence of 12 trials). The masking stimulus was comprised of two 4

Pupillary Responses and Cognitive Ability 10
cm long, parallel lines which completely spatially replaced the target stimulus lines with SOAs
of either 50, 67, 100, 134, 317, or 717 ms, or infinity (No-Mask condition). These SOAs,
comprising a typical range in the backward masking literature, were bounded by the 60 Hz
refresh rate of the monitor and were timed to display in accordance with the top of the refresh
cycle. Twenty trials were administered for each condition resulting in 140 test trials. The seven
SOA conditions were presented in blocks of 5 trials in the following counterbalanced sequence:
134, No-Mask, 67, 100, 317, 717, 50, 134, 717, 317, 50, No-Mask, 100, 67, 50, No-Mask 717,
100, 317, 67, 134, 317, 50, 67, 717, 134, No-Mask, 100 ms. The target and mask had equal
duration (16.7 ms; one 60 Hz screen refresh rate). The participants were seated at approximately
61 cm from the computer monitor resulting in 2.79 and 3.75 vertical degrees of visual angle for
the target stimulus and masking stimulus, respectively.
A calibration was first conducted to ensure participant-pupillometer agreement on center
of visual field. At the beginning of each trial, a blue fixation square (0.85 cm x 0.85 cm) was
presented in the center of the monitor (with a white screen background) for 1 sec along with a
high-pitched tone (1500 Hz for 500 ms). The fixation square and tone served as visual and
auditory cues to warn the participant to prepare for the trial’s target stimulus. Instructions were
given to press either the right or left arrow keys on the keyboard to indicate which of the two test
lines was longer. Both detection accuracy and speed was emphasized with the instruction, “Try
to be as accurate as you can, but also be as fast as you can.” Three seconds after the onset of the
target stimulus, a low-pitched tone (800 Hz for 500 ms) functioned as an auditory cue signaling
the end of the trial. The inter-trial interval was set at 3 sec. Participants were asked to refrain
from blinking during the trial period marked by the two auditory signals (i.e., high and low
beeps).

Pupillary Responses and Cognitive Ability 11
Prior to the test portion of the task, participants were given 21 practice trials. The
practice trials began with the easiest conditions; namely, a No-Mask trial followed by a 717 ms
and a 317 ms SOA trial. The conditions of the remaining 18 trials were randomly blocked. The
first 12 practice trials provided computer-automated feedback regarding correctness of the
participant’s response. Feedback was not provided during the test phase of the study. A moment
of rest (approximately 15 sec, unless the participant requested a longer break) was allowed after
each presentation of 10 trials for the participant to rest and blink their eyes. Each participant was
also allowed a few minutes to rest halfway through the test. The entire task (i.e., instructions,
practice, and test) took typically less than 35 minutes, with the test portion taking about 22
minutes.
Data Reduction
Graphic displays of raw pupil diameter data were first visually inspected for gross
artifacts by a trained technician. Pupillary response data for the individual task trials were
divided into 3 sec recording epochs triggered by the target onset. Fewer than 4.3% of the test
trials were discarded due to major artifacts or excessive eye blinking. A computer algorithm was
used to remove eye blinks and other minor artifacts from other trials by linear interpolation. A
7-point smoothing filter was then passed over the data. For each participant, an average
pupillary-response from baseline was calculated for the artifact-free trials of each SOA
condition. Baseline pupil size was defined as the average of 5 samples of pupil diameter
recorded 100 ms prior to each trial onset.
All variables were analyzed for evaluation of assumptions and transformed when
necessary to reduce skewness, reduce the number of outliers, and improve the normality,
linearity, and homoscedasticity of residuals. Bivariate and multivariate outliers were identified

Pupillary Responses and Cognitive Ability 12
through studentized residuals (studentized residual > than 2) and were dropped. Four
participants were dropped as multivariate outliers.
A principle components anaylsis (PCA) was used to analyze the pupillary response
waveform based on the findings from our previous studies (Granholm & Verney, this issue;
Verney, 2001). Analysis of variance (ANOVA) was used to analyze the within subjects
conditions for detection accuracy and pupillary responses on the visual backward masking task.
Dunnett’s test was used to protect type-I error in the ANOVA follow-up analyses comparing the
masked conditions with the no-mask condition. Finally, a hierarchical regression was used to
test our hypotheses that visual backward masking detection accuracy and pupillary responses
would account for significant variance in combined Verbal dn Quantitative SAT scores over and
above that accounted for by socioeconomic status (SES). Three variables were regressed onto
combined SAT scores: (1) SES was defined as the average of the categorical variables of Family
Income, Fathers Education Level, and Mothers Education Level as reported by the participant on
the SEE. (2) Overall Detection Accuracy was defined as the total percentage correct for the
intermediate and longer SOA conditions (i.e., 100, 134, 317 and 717 ms conditions). To
maximize the sensitivity of detection accuracy scores in the regression analyses, conditions with
floor and ceiling effects were discarded (based on a 95% confidence interval around 50% and
100%, respectively). Both the 50 and 67 ms SOA conditions were at chance level detection
accuracy and performance in the No-Mask condition did not differ significantly from perfect
accuracy. (3) Mask Pupillary Response was defined as the difference between the late PCA
factor of the longer SOA conditions (averaged 317 and 717 ms conditions) and the No-Mask
condition.

Pupillary Responses and Cognitive Ability 13
Results
Detection Accuracy
Figure 1 presents detection accuracy for the six SOA masking conditions and the No-
Mask condition on the visual backward masking task. A one-way ANOVA indicated a
significant main effect of condition, F(6,61)=97.11, p < .001, η2 = .90. Follow-up analyses
(Dunnett’s test; p < .05) showed that the early and middle (50 - 134 ms), but not the longer (317
and 717 ms) SOA conditions were significantly different from the No-Mask condition.
___________________________
Insert Figure 1 about here
___________________________
Pupillary Response
Figure 2 presents the averaged raw pupillary responses adjusted to baseline at stimulus
onset for the six masking conditions and the No-Mask condition across the three-sec window
following stimulus onset. To fully and objectively examine the pupillary response waveform
across the 3-sec trial, and to eliminate the effects of individual differences in resting pupil size
and pupil mobility, a varimax rotation principle components analysis (PCA) was performed on
180 time-points (i.e., 3 sec) of the pupil response waveform time-locked to stimulus onset across
the seven masked and no-mask conditions for all participants. The same 3 prominent stable
factors found in our larger sample (Verney, 2001) emerged in this sub-sample from that study
(see Figure 2), accounting for 95.3% of the variance in the pupillary response data. As indicated
by the squared multiple correlations, all factors were internally consistent and well defined by
the data (the lowest of the squared multiple correlations for factors from data was .67). The PCA
divided the pupillary response waveform into three time-dependent components: (1) An early

Pupillary Responses and Cognitive Ability 14
component from 0 to 0.7 sec (the 3rd rotated factor; eigenvalue = 5.8); (2) A middle component
from 0.7 to 1.53 sec (2nd rotated factor; eigenvalue = 20.8); and (3) A late component from 1.53
to 3.0 sec (1st rotated factor; eigenvalue = 68.7). As described above, we interpreted the middle
factor as indexing target processing and the late factor as indexing mask processing, especially in
the longer SOA conditions when the masking stimulus becomes a distinct percept from the target
stimulus.
___________________________
Insert Figure 2 about here
___________________________
Figure 3 presents the early, middle, and late PCA mean factor scores for the pupillary
responses in the six masking conditions and the No-Mask condition. A 3 (PCA factor) X 7
(masking condition) ANOVA conducted on the factor scores resulted in significant effects for
condition, F(6,61)=4.10, p<.01, η2 = .29, and the PCA factor X condition interaction,
F(12,55)=4.73, p<001, η2 = .51, but not for PCA factor, F(2,65)=.07, ns, η2 = .00. A one-way
ANOVA conducted on the early factor scores did not show a significant SOA effect, F(6,61)=
1.40, ns, η2 = .12, suggesting comparable early factor score amplitude in all conditions.
A one-way ANOVA conducted on the middle factor scores resulted in a significant
condition effect, F(6,61)= 12.81, p < .01, η2 = .56. Follow-up analyses (Dunnett’s test; p<.05)
showed that the middle factor amplitude in the No-Mask condition was significantly greater than
the responses in the 50 and 67 ms SOA conditions, 50 ms vs. No-Mask, t(66) = 3.63, p < .01, 67
ms vs. No-Mask, t(66) = 3.75, p < .01. This finding was consistent with our interpretation of the
middle factor as indexing resources allocated to target processing. That is, greater resources
were allocated to target processing in the No-Mask and longer SOA conditions, where target

Pupillary Responses and Cognitive Ability 15
detection accuracy was high, than in the two shortest masking conditions where target detection
was at chance performance.
A one-way ANOVA conducted on the late factor scores also resulted in a significant
SOA effect, F(6,61)= 3.52, p < .01, η2 = .26. Follow-up analyses (Dunnett’s test; p<.05) showed
that the late factor amplitude in the No-Mask condition was significantly less than in the 717 ms
condition, t(66) = 3.41, p < .01. This finding is consistent with our interpretation of the late
factor as indexing resources allocated to the masking stimulus. That is, in the longest SOA,
where the mask is thought to demand the most attention (Michaels & Turvey, 1979; Phillips,
1974), late factor amplitude was significantly greater than in the No-Mask condition.
___________________________
Insert Figure 3 about here
___________________________
Relationship Between Pupillary Response and Detection Accuracy
If the late factor indexes mask processing load, then the difference between masked and
no-mask conditions on late factor scores (e.g., 317 ms SOA – No-Mask and 717 ms SOA – No-
Mask late factor difference scores) should be inversely correlated with detection accuracy. That
is, more wasteful allocation of resources to masks should be associated with less efficient target
processing. These late (mask) factor difference scores were significantly inversely correlated
with detection accuracy in the 317 ms, r(65) = -.34, p< .01, and the 717 ms, r(65) = -.33, p< .01,
SOA conditions, but not in any other condition. In addition, if the middle factor indexes target
processing, the extent of dilation on the middle factor should be positively correlated with target
detection. Detection accuracy was significantly positively correlated with dilation on the middle
factor in the 717 ms SOA condition, r(65) = .32, p<.01, but not in any other condition. In longer

Pupillary Responses and Cognitive Ability 16
SOA conditions, therefore, participants who allocated more resources to targets and less to
masks showed more accurate target detection.
Cognitive Ability
SAT scores were significantly correlated with SES, r(65) = .60, p < .01, Overall
Detection Accuracy, r(65) = .36, p < .01, and Mask Pupillary Response, r(65) = -.46, p < .01.
Participants who scored higher on the SAT were from higher SES backgrounds, detected more
target stimuli during the visual backward masking task, and exhibited less dilation to the
masking stimulus in the longer SOA conditions than participants who scored lower on the SAT.
SES was significantly correlated with Overall Detection Accuracy, r(65) = .39, p < .01, and
Mask Pupillary Response, r(65) = - .31, p < .01. Participants who were from higher SES
backgrounds detected more target stimuli and allocated less attention to the masking stimulus in
the longer SOA conditions than did participants who were from lower socio-economic
backgrounds. Overall Detection Accuracy was also significantly correlated with Mask Pupillary
Response, r(65) = -.42, p < .01. Participants who detected more target stimuli exhibited less
dilation to the masking stimulus in the longer SOA conditions than did participants who detected
fewer target stimuli.
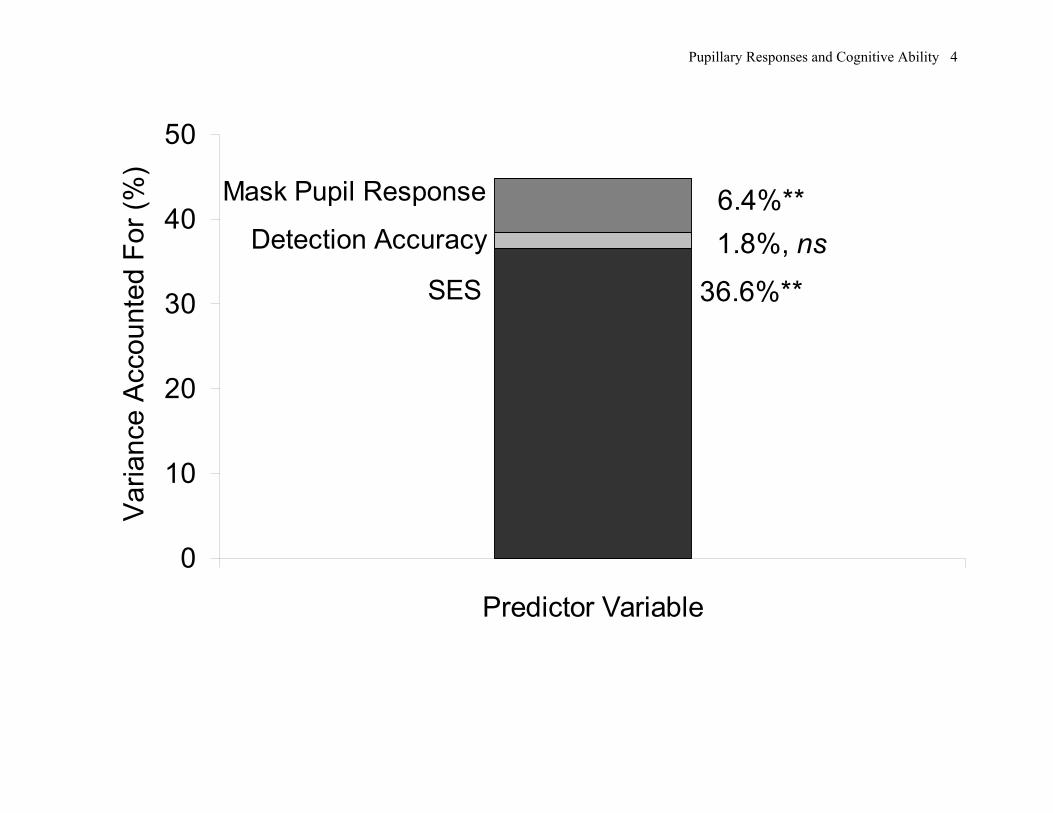
The results of the hierarchical regression are presented in Table 1 and Figure 4. Step 1 of
the regression showed that SES accounted for significant amount of variance in SAT scores, R2
= .366, F(1, 65) = 37.46, p < .01, Adjusted R2 = .356. Step 2 added Overall Detection Accuracy
and resulted in a significant model, R2 = .384, F(2, 64) = 19.96, p < .01, Adjusted R2 = .365;
however, the change in R2 was not significant, ∆R2 = .018, F(1, 64) = 1.92, ns. Overall
Detection Accuracy did not account for significantly greater variance in SAT scores over that
accounted for by SES.

Pupillary Responses and Cognitive Ability 17
Step 3 of the regression added Mask Pupillary Response and resulted in a significant
model, R2 = .422, F(3, 62) = 17.07, p < .01, Adjusted R2 = .422, and the change in R2 over Step 2
was also significant, ∆R2 = .064, F(1, 63) = 7.35, p <.01. The addition of the Mask Pupillary
Response uniquely accounted for 7.3% of the variance in SAT scores above that of SES and
detection accuracy. SES significantly accounted for 20.5% and Mask Pupil Response accounted
for 6.4% of the full model variance in SAT scores, while Overall Detection Accuracy accounted
for a nonsignificant 1.8% of the variance in SAT scores.
___________________________
Insert Table 1 and Figure 4 about here
___________________________
Discussion
A psychophysiological measure, pupillary response, was used in conjunction with a
behavioral measure, detection accuracy, on the visual backward masking task to investigate the
neural efficiency hypothesis that individuals with greater cognitive ability process information
more efficiently than individuals with lower cognitive ability. As predicted, a pupillary response
component that likely indexed attentional allocation to the masking stimulus significantly added
to the prediction of SAT scores by uniquely accounting for 6.4% of variance in SAT scores
above and beyond that accounted by SES and detection accuracy. This finding is consistent with
the hypothesis that individuals who wastefully allocate attention to irrelevant information, the
masking stimulus in this study, have lower scores on standardized cognitive ability tests (e.g.,
Cha & Merrill, 1994; Merrill & Taube, 1996; McCall, 1994). Thus, this study replicated and

Pupillary Responses and Cognitive Ability 18
extended the findings of Ahern and Beatty (1979) and supported the neural efficiency
hypothesis.
A late PCA component of the pupillary waveform was found in this study, which
appeared to isolate the amount of resource allocation to mask processing. The PCA factor
structure found in the present study was replicated in the other two data sets (Granholm &
Verney, this issue; Verney et al., 2001), suggesting stability of the factor structure across
psychiatric and non-psychiatric samples, different stimulus presentations (i.e., white stimuli on
dark background vs. dark stimuli on white background), and different ethnic backgrounds (i.e.,
Caucasian and Mexican American). The PCA divided the pupillary response waveform into
three meaningful factors. The middle factor occurred in the time window when peak dilation
responses to cognitive tasks are typically found to reflect task processing load (Beatty, 1982;
Beatty & Lucero-Wagoner, 2000; Steinhauer & Hakerem, 1992). Middle factor amplitude in the
shortest (i.e., 50 and 67 ms) SOA conditions was significantly smaller than in the no-mask
condition, and detection accuracy was at chance in these brief SOA conditions. Middle factor
amplitude was much greater in longer SOA and No-Mask conditions, where detection accuracy
was nearly perfect. That is, the middle factor showed less dilation in brief SOA conditions,
where target images were not yet fully formed (Breitmeyer, 1984; Breitmeyer & Ganz, 1976)
and target detection was poor, but showed greater dilation when targets were fully formed and
accurately detected. This pattern of results suggests that the middle factor indexed target
processing.
In contrast, late factor amplitude was significantly greater in the longest (717) SOA
condition relative to the no-mask condition. Models of early visual information processing
suggest that, in longer SOA conditions, the masking stimulus becomes a distinct percept from

Pupillary Responses and Cognitive Ability 19
the target stimulus and stimulus identification resources must be shifted and shared between
targets and masks (Michaels & Turvey, 1979; Phillips, 1974). Therefore, the finding of greater
late factor amplitude in the longest SOA condition (distinct target and mask percepts) and the
no-mask condition (only target percept), suggests the late factor indexed the additional
processing demands of the mask. Furthermore, the difference between longer SOA and No-
Mask condition late factor amplitude was significantly inversely correlated with detection
accuracy. Participants who allocated more resources to masks showed less accurate target
detection. In contrast, middle factor amplitude was significantly positively correlated with
detection accuracy in longer SOA conditions. Participants who allocated more resources to
target detection showed more accurate target detection. Taken together, these findings suggest
that allocating more resources to mask processing comes at the cost of fewer spare resources for
accurate target processing. Importantly, this pattern of results was found only in longer SOA
conditions, when competition between targets and masks for stimulus identification resources is
thought to be greatest (Michaels & Turvey, 1979; Phillips, 1974).
It is important to stress that middle and late factor amplitudes did not simply reflect
psychophysical aspects of the stimuli, rather than active cognitive processing of targets and
masks. In Verney et al. (2001), participants passively viewed the visual backward masking task
stimuli, and were told not to process them in any way (cognitive no-load condition). Pupil
dilation responses were significantly smaller in this no-load condition, relative to the cognitive
load condition when participants made judgments about target line length. Moreover, middle
and late factor scores did not differ significantly between any SOA and No-Mask conditions in
the no-load condition. Simply viewing targets and masks in rapid succession, regardless of
whether they were perceived as single (or merged) or separate percepts, did not produce the

Pupillary Responses and Cognitive Ability 20
pattern of results for the middle and late factors found in this study. Rather, the middle and late
factors reflected the active cognitive processing of targets and masks, respectively.
The early PCA factor was initially interpreted in our other studies (Granholm & Verney,
this issue; Verney et al., 2001) as indexing a light reflex response to change in display light. In
both of those studies, a bright target stimulus was presented on a dark background and a brief
constriction response was found in the time window when pupillary light reflexes are typically
observed (Loewenfeld, 1992). However, in the present study, dark stimuli were presented on a
bright background and a dilation response, not a constriction, was observed in the time window
of the early factor (see Figure 2). This is not consistent with a light reflex interpretation of the
early factor.
A model proposed by Steinhauer and Hakerem (1992), which describes the contributions
of parasympathetic and sympathetic components to overall pupillary dilation during cognitive
tasks, may provide an alternative interpretation of the early factor. The early factor occurred in
a time window when early dilation to a cognitive task is thought to result from inhibition of
parasympathetic pathways leading to relaxation of the sphincter pupillae (Steinhauer &
Hakerem, 1992). When there is light in the visual display of a cognitive task, a pupillary light
reflex may be observed in this time window, which is primarily due to activation of
parasympathetic pathways leading to constriction of the sphincter pupillae (Loewenfeld, 1992).
Regardless of whether an initial dilation or constriction is observed, the first factor may reflect
an early, rapid parasympathetic contribution to the waveform. In the Steinhauer and Hakerem
(1992) model, slower contributions to pupil dilation during cognitive tasks (e.g., to middle and
late factor scores in this study) are due to sympathetic activation of the dilator pupillae. The
PCA factor structure we have found in all three studies, regardless of display luminance, all

Pupillary Responses and Cognitive Ability 21
identified an early factor that ended at approximately the same time point that parasympathetic
contributions subside and the sympathetic component begins to dominate in the Steinhauer and
Hakerem (1992) model. This study was not, however, designed to investigate this model.
Future studies could help delineate the parasympathetic and sympathetic contributions to the
PCA factors found in this study by blocking the parasympathetic and sympathetic systems
separately during backward masking task performance and observing the impact on the different
PCA factors.
A few other studies have shown that the wasteful allocation of resources to distracting or
irrelevant information is associated with poorer performance on cognitive tests (Cha & Merrill,
1984; McCall, 1994; Merrill & Taube, 1996). This study replicates those findings. One possible
explanation for this finding is that individuals with lower cognitive ability actively and routinely
process stimuli before determining the information to be irrelevant. Thus, the mask, as a
separate, distinct percept in the longer SOA conditions (Michaels & Turvey, 1979, Phillips,
1974), would demand more resources for such individuals to process it. This might be due to
reduced active selection of relevant information or reduced filtering of irrelevant information in
individuals with lower cognitive ability relative to individuals with higher cognitive ability.
Theories of this type of information processing efficiency emphasize not only selectively
encoding the relevant information, but also actively inhibiting the irrelevant information (e.g.,
Neill, 1977, 1989; Neill & Westberry, 1987; Tipper, 1985; Tipper & Cranston, 1985). The
ability to quickly automate the processing of irrelevant information by individuals with higher
cognitive abilities is another related possibility. Automatic processing requires minimal mental
effort while controlled processing requires resources (Schneider & Shiffrin, 1977). The smaller
pupillary responses in individuals with higher cognitive abilities may reflect greater or faster

Pupillary Responses and Cognitive Ability 22
automation of mask inhibition, while the larger pupillary responses in individuals with lower
cognitive abilities may reflect a failure to automatically dismiss the mask, requiring the use of
controlled processing to determine its identity and relevance. Further research is needed to
investigate these possible mechanisms and to determine the role of processing irrelevant
information in cognitive abilities.
Performance on the backward masking task has reliably been shown to substantially
correlate with measures of cognitive ability (reviewed in Deary & Stough, 1996; Kranzler &
Jensen, 1989). This study, however, did not find detection accuracy to be a significantly
correlated to SAT scores in the presence of SES. A weak relationship between detection
accuracy and SAT scores has been previously reported (Longstreth, Walsh, Alcorn, Szeszulski,
and Manis, 1986). Although greater detection accuracy was significantly correlated with higher
SAT scores, this relationship was not significant when controlling for SES or in the context of
the more powerful pupillary response predictor. A few possibilities for this discrepancy exist.
For the average participant (i.e., freshman college status), the SAT would have been
administered one to two years prior to the lab testing for this study. The long time period
between measures likely would diminish the correlation between them. In addition, the SAT
was designed to be an achievement measure, and as such, may be less effective at tapping the
“intelligence” construct than measures of cognitive ability (e.g., IQ tests) that have been used in
most previous studies. Achievement tests such as the SAT have nonetheless been closely
associated with general intelligence (Reschly, 1990). Also, the administration of the masking
task in this study differs from most studies because the PC-based stimulus presentation limited
display rates to those bound by a 60 Hz refresh cycle. In contrast, most previous studies have
utilized a tachistiscope-administered task. The refresh cycle also determined the use of a
Pupillary Responses and Cognitive Ability 23
standard target exposure duration procedure in this study rather than an individually determined
critical stimulus duration (CSD) procedure and measurement of Inspection Time (IT) as the
dependent variable, as in most studies investigating the relationship between masking
performance and cognitive ability. Target duration for the CSD procedure in IQ studies has
typically ranged from about 10 ms to a few hundred ms (Deary & Stough, 1996). Michaels &
Turvey (1979) in their early studies outlining masking effects reported no significant differences
between target durations of 10, 20, and 50 ms in a sample of healthy college students. The target
duration used in this study (i.e. 16.7 ms), therefore, is consistent with most studies using a CSD
procedure and the lack of association between detection accuracy and SAT scores is not likely
due to the standard target duration procedure used in this study. Detection accuracy on the same
computerized, standard target exposure visual backward masking task used in this study did
significantly predict IQ scores (i.e., Wechsler Adult Intelligence Scale – Revised, WAIS-R, Full
Scale scores; Wechsler, 1981) in our larger study (Verney, 2001; Verney et al., submitted).
The combination of a psychophysiological measure, indexing attentional allocation to the
task, with traditional behavioral measures, indexing individual performance level, is a powerful
approach to study cognitive mechanisms involved in human information processing and the
breakdown of processing with illness. For example, we examined pupillary responses during the
backward masking task in schizophrenia (Granholm & Verney, this issue). Relative to healthy
controls, patients with schizophrenia were found to over-allocate attentional resources to the
irrelevant masking stimulus (i.e., greater late factor amplitude in longer SOA conditions) and
under-allocate resources to the relevant target stimulus (i.e., smaller middle factor amplitude).
This attentional allocation problem in patients with schizophrenia might account, in part, for
more general cognitive and intellectual deficits found in schizophrenia, given the finding from

Pupillary Responses and Cognitive Ability 24
the present study that lower general cognitive ability was associated with this type of allocation
problem. We have also used this paradigm to investigate cultural bias in cognitive ability
assessment (Verney, et al., submitted). Psychophysiological measures, such as pupillary
responses, and early visual information-processing tasks, such as the backward masking task,
appear to be less influenced by cultural and social learning factors associated with other
cognitive measures (Deary & Stough, 1996). We found differential validity in predicting WAIS-
R scores from these measures between Caucasian American and Mexican American students,
suggesting that the WAIS-R test contains a cultural component that reduces the validity of the
WAIS-R as a measure of cognitive ability for Mexican American students (Verney, et al.,
submitted). Information processing and psychophysiological approaches, therefore, may be
helpful in developing culture-fair cognitive ability measures and in better understanding
information processing deficits and abilities in both psychiatric and non-psychiatric populations.
Pupillary Responses and Cognitive Ability 25
References
Ahern, S., & Beatty, J. (1979). Pupillary responses during information processing vary with
scholastic aptitude test scores. Science, 205, 1289-1292.
Beatty, J. (1982). Task-evoked pupillary responses, processing load, and the structure of
processing resources. Psychological Bulletin, 91, 276-292.
Breitmeyer, B. G. (1984). Visual masking: An integrative approach. New York: Oxford
University Press.
Breitmeyer, B. G., & Ganz, L. (1976). Implications of sustained and transient channels for
theories of visual pattern masking, saccadic suppression, and information processing.
Psychological Review, 83, 1-36.
Cha, K. H., & Merrill, E. C. (1994). Facilitation and inhibition effects in visual selective
attention processes of persons with and without mental retardation. American Journal of
Mental Retardation, 98, 594-600.
Davidson, J. E., & Downing, C. L. (2000). Contemporary models of intelligence. In R. J.
Sternberg (Ed.), Handbook of Intelligence (pp. 34-49). Cambridge, United Kingdom:
Cambridge University Press.
Deary, I. J. (2000). Simple information processing and intelligence. In Sternberg, R. J. (Ed.),
Handbook of Intelligence (pp. 176-193). Cambridge, United Kingdom: Cambridge
University Press.
Deary, I. J., & Stough, C. (1996). Intelligence and inspection time: Achievements, prospects,
and problems. American Psychologist, 51, 599-608.

Pupillary Responses and Cognitive Ability 26
Granholm, E., & Verney, S. P. (2003). Pupillary responses and attentional allocation on the
visual backward masking task in schizophrenia. International Journal of
Psychophysiology, this issue.
Haier, R. J., Siegel, B., Tang, C., Abel, L., & Buchsbaum, M. S. (1992). Intelligence and
changes in regional cerebral glucose metabolic rate following learning. Intelligence, 16,
415-426.
Hendrickson, A. E. (1982). The biological basis of intelligence, Part I: Theory. In H. J. Eysenck
(Ed.), A model for intelligence (pp. 151-196). New York: Springer-Verlag.
Hendrickson, D. E. (1982). The biological basis of intelligence, Part II: Measurement. In H. J.
Eysenck (Ed.), A model for intelligence (pp. 197-228). New York: Springer-Verlag.
Kranzler, J., & Jensen, A. R. (1989). Inspection time and intelligence: A meta-analysis.
Intelligence, 13, 329-347.
Loewenfeld, I. E. (1999). The pupil: Anatomy, Physiology, and Clinical Applications. Boston:
Butterworth Heinemann.
Loftus, G. R., Hanna, A. M., & Lester, L. (1988): Conceptual masking: How one picture
captures attention from another picture. Cognitive Psychology, 20, 237-282.
Longstreth, L. E., Walsh, D. A., Alcorn, M. D., Szeszulski, P. A., & Manis, F. R. (1986).
Backward masking, IQ, SAT, and reaction time: Interrelationships and theory.
Personality and Individual Differences, 7, 643-651.
Malcarne, V., Chavira, D., Fernandez, S. & Liu, P. (in press). The Scale of Ethnic Experience:
Development and Psychometric Properties.

Pupillary Responses and Cognitive Ability 27
McCall, R. (1994). What process mediates predictions of childhood IQ from infant habituation and
recognition memory? Speculations on the roles of inhibition and rate of information
processing. Intelligence, 18, 107-125.
Merrill, E. C., & Taube, M. (1996). Negative priming and mental retardation: The process of
distractor information. American Journal of Mental Retardation, 101, 63-71.
Michaels, C. F., & Turvey, M. T. (1979). Central sources of visual masking: Indexing
structures supporting seeing at a single, brief glance. Psychological Research, 41, 1-61.
Neill, W. T. (1977). Inhibitory and facilitory processes in selective attention. Journal of
Experimental Psychology: Human Perception and Performance, 3, 444-450.
Neill, W. T., & Westberry, R. L. (1987). Selective attention and the suppression of cognitive
noise. Journal of Experimental Psychology: Learning, Memory, and Cognition, 13, 327-
334.
Nettlebeck, T., Edwards, C., & Vreugdenhil, A. (1986). Inspection time and IQ: Evidence for a
mental speed-ability association. Personality and Individual Differences, 7, 633-641.
Phillips, W. A. (1974). On the distinction between sensory storage and short-term visual
memory. Perception and Psychophysics, 16, 283-290.
Reschly, D. J. (1990). Aptitude tests in educational classification and placement. In G.
Goldstein & M. Hersen (Eds.), Handbook of psychological assessment (2nd ed., pp. 148-
172). New York: Pergamon Press.
Saccuzzo, D. P. (1993). Measuring individual differences in cognition in schizophrenia and
other disordered states: Backward masking paradigm. In Detterman, D. K. (Ed.),
Individual Differences in Cognition. Current Topics in Human Intelligence, Vol. 3 (pp.
219-237). Norwood, NJ: Ablex Publishing Corp.

Pupillary Responses and Cognitive Ability 28
Schafer, E. W. P. (1982). Neural adaptability: A biological determinant of behavioral
intelligence. International Journal of Neuroscience, 17, 183-191.
Schneider, W., & Shiffrin, R. M. (1977). Controlled and automatic human information
processing: I. Detection, Search, and Attention. Psychology Review, 84, 1-66.
Steinhauer, S. R., & Hakerem. G. (1992). The pupillary response in cognitive psychophysiology
and schizophrenia. In D. Friedman & G. E. Bruder (Eds.), Psychophysiology and
experimental psychopathology: A tribute to Samuel Sutton. New York, NY: New York
Academy of Sciences
Tipper, S. P. (1985). The negative priming effect: Inhibitory effect of ignored primes.
Quarterly Journal of Experimental Psychology, 37A, 591-611.
Tipper, S. P., & Cranston, M. (1985). Selective attention and priming: Inhibitory and facilitory
effects of ignored primes. Quarterly Journal of Experimental Psychology, 37A, 591-611.
Verney, S. P. (2001). Pupillary responses index: Information processing efficiency across
cultures. Dissertation Abstracts International: Section B: The Sciences & Engineering,
61, 6152.
Verney, S. P., Granholm, E., & Dionisio, D. P. (2001). Pupillary response indexes cognitive
processing in the visual backward masking task. Psychophysiology, 38,76-83.
Verney, S. P., Granholm, E., Marshall, S. P., Malcarne, V. L., & Saccuzzo, D. P. (submitted).
Culture-fair cognitive ability assessment: An information processing and
psychophysiological approach.
Wechsler, D. (1981). Wechsler Adult Intelligence Scale-Revised. New York: Psychological
Corporation.

Pupillary Responses and Cognitive Ability 29
Acknowledgements
This research comprised a portion of the 1st author’s dissertation project in partial fulfillment of a
doctoral degree in the SDSU/UCSD Joint Doctoral Program in Clinical Psychology and is
registered with Dissertation Abstracts International. Portions of the information contained in this
report were presented at the Fortieth Annual Meeting of the Society for Psychophysiological
Research, San Diego, CA, October, 2000.
This study was supported by a Minority Dissertation Research Grant in Mental Health
from the National Institute of Mental Health (MH58476) and the Special MIRECC Fellowship
Program in Advanced Psychiatry and Psychology, Department of Veterans Affairs, to the first
author. Additional support was provided by the Department of Defense’s Multidiscipline
University Research Initiative (MURI) in collaboration with George Mason University, National
Institute of Mental Health grants MH19934, and MH61381, and by the Department of Veterans
Affairs.
Address reprint requests to: Steven P. Verney, Ph.D., Psychology Services (116B), San
Diego VA Healthcare System, 3350 La Jolla Village Dr., San Diego, CA, 92161, USA. E-mail:

Pupillary Responses and Cognitive Ability 1
Table 1 Hierarchical Regression Predicting SAT scores
Full Model Regression Statistics Hierarchical Regression Statistics Mode
l Variable β t Value
of ß Semi-partial,
sr2
F Value of sr2
R2 F Value of R2 ∆R2 F Value of ∆R2 Adjusted R2
Step 1 SES .50** 4.84 .205** 23.40 .366**
F(1, 65) = 37.46
.356
Step 2 Det. Acc. .05 .42 .001 .01 .384**
F(2, 64) = 19.96
.018 F(1, 64) = 1.92 .365
Step 3 Mask PR -.28** 2.77 .064** 7.35 .448**
F(3, 63) = 17.07
.064**
F(1, 63) = 7.35 .422
NOTE: ** p < .01; * p < .05; SES = Socio-Economic Status; Det. Acc. = Overall Detection Accuracy; Mask PR = Mask Pupillary
Response.
Pupillary Responses and Cognitive Ability 1
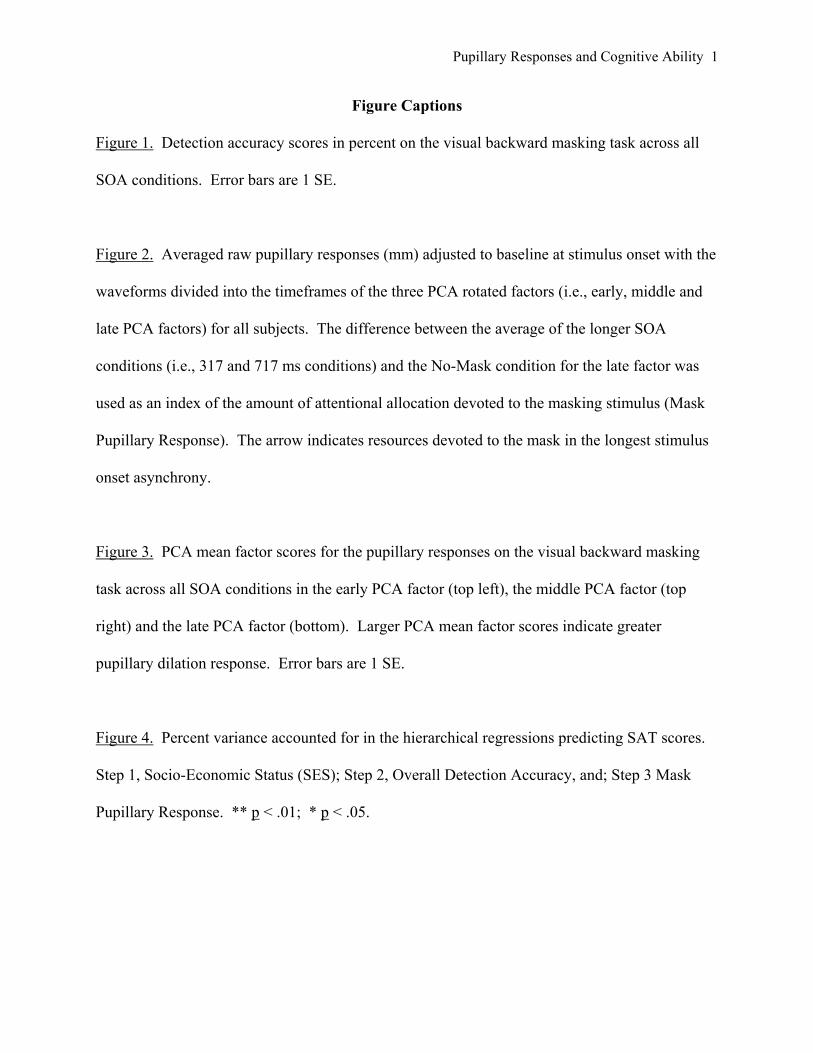
Figure Captions
Figure 1. Detection accuracy scores in percent on the visual backward masking task across all
SOA conditions. Error bars are 1 SE.
Figure 2. Averaged raw pupillary responses (mm) adjusted to baseline at stimulus onset with the
waveforms divided into the timeframes of the three PCA rotated factors (i.e., early, middle and
late PCA factors) for all subjects. The difference between the average of the longer SOA
conditions (i.e., 317 and 717 ms conditions) and the No-Mask condition for the late factor was
used as an index of the amount of attentional allocation devoted to the masking stimulus (Mask
Pupillary Response). The arrow indicates resources devoted to the mask in the longest stimulus
onset asynchrony.
Figure 3. PCA mean factor scores for the pupillary responses on the visual backward masking
task across all SOA conditions in the early PCA factor (top left), the middle PCA factor (top
right) and the late PCA factor (bottom). Larger PCA mean factor scores indicate greater
pupillary dilation response. Error bars are 1 SE.
Figure 4. Percent variance accounted for in the hierarchical regressions predicting SAT scores.
Step 1, Socio-Economic Status (SES); Step 2, Overall Detection Accuracy, and; Step 3 Mask
Pupillary Response. ** p < .01; * p < .05.

Pupillary Responses and Cognitive Ability 1
60
70
80
90
100
50 67 100 134 317 717 NoMask
Stimulus Onset Asynchrony (SOA; ms)
Cor
rect
Res
pons
es (%
)
No Mask Performance Level
Detection Accuracy

Pupillary Responses and Cognitive Ability 2
0
0.05
0.1
0.15
0.2
0.25
0.3
0.35
0.4
0.45
0 1 2 3Stimulus Onset Asynchrony (sec)
Pupi
llary
Res
pons
e (m
m) 50
67100134317717No Mask
Early Middle Late PCA Factor

Pupillary Responses and Cognitive Ability 3
-0.4
-0.3
-0.2
-0.1
0
0.1
0.2
0.3
0.4
50 67 100 134 317 717 No-Mask
Stimulus Onset Asynchrony (SOA; ms)
Mea
n Fa
ctor
Sco
re
No-Mask Performance Level
-0.4
-0.3
-0.2
-0.1
0
0.1
0.2
0.3
0.4
50 67 100 134 317 717 No-Mask
Stimulus Onset Asynchrony (SOA; ms)
Mea
n Fa
ctor
Sco
re
No-Mask Performance Level
-0.4
-0.3
-0.2
-0.1
0
0.1
0.2
0.3
0.4
Mea
n Fa
ctor
Sco
re
No-Mask Performance Level
Early PCA Factor Middle PCA Factor
Late PCA Factor
50 67 100 134 317 717 No-Mask
Stimulus Onset Asynchrony (SOA; ms)
Pupillary Responses and Cognitive Ability 4
36.6%**
1.8%, ns6.4%**
0
10
20
30
40
50
Predictor Variable
Var
ianc
e A
ccou
nted
For
(%)
SES
Detection Accuracy
Mask Pupil Response