CTI LOGISTICS LIMITED · CTI Logistics Limited is a company limited by shares, incorporated and...
47
CTI LOGISTICS LIMITED ABN 69 008 778 925 ANNUAL REPORT 2015
Transcript of CTI LOGISTICS LIMITED · CTI Logistics Limited is a company limited by shares, incorporated and...
CTI LOGISTICS LIMITED
ABN 69 008 778 925
ANNUAL REPORT 2015
Page 1
Contents
2 Directory 3-7 Directors’ Report
8 Lead Auditor’s Independence Declaration 9
Consolidated Statement of Profit or Loss and other Comprehensive Income
10 Consolidated Statement of Financial Position 11 Consolidated Statement of Changes in Equity 12 Consolidated Statement of Cash Flows
13-43 Notes to the Financial Statements 44 Directors’ Declaration
45-46 Independent Auditor’s Report
Page 2
Directory DIRECTORS David Robert Watson (Executive Chairman) David Anderson Mellor (Executive) Bruce Edmond Saxild (Executive) Peter James Leonhardt (Non-Executive) Matthew David Watson (Non-Executive) SECRETARY David Anderson Mellor AUDITORS KPMG 235 St. Georges Terrace Perth WA 6000 Telephone (08) 9263 7171 SHARE REGISTRY Computershare Investor Services Pty Ltd Level 11, 172 St. Georges Terrace Perth WA 6000 Telephone (08) 9323 2000 REGISTERED OFFICE AND PRINCIPAL PLACE OF BUSINESS 1 Drummond Place West Perth WA 6005 Telephone (08) 9422 1100 Facsimile (08) 9227 8000 E-mail [email protected] Web www.ctilogistics.com The financial report covers the group consisting of CTI Logistics Limited and its subsidiaries. The financial report is presented in the Australian currency. The financial report was authorised for issue by the directors on 27 August 2015. The directors have the power to amend and reissue the financial report. CTI Logistics Limited is a company limited by shares, incorporated and domiciled in Australia.
Directors’ Report
Page 3
YOUR DIRECTORS PRESENT THEIR REPORT ON THE GROUP CONSISTING OF CTI LOGISTICS LIMITED AND THE ENTITIES IT CONTROLLED AT THE END OF, OR DURING, THE YEAR ENDED 30 JUNE 2015.
Directors Directors of the Company were in office during the whole of the financial year and up to the date of this report are: David Robert Watson (Executive Chairman) Mr Watson is the founder, executive chairman and chief executive officer of the group. Mr Watson is a member of the remuneration committee. Mr Watson has not held any other directorships in listed companies over the past 4 years. David Anderson Mellor (Executive Director) Mr Mellor is a Chartered Accountant who has been with the group since 1978. He is responsible for the group’s finances and accounts. Mr Mellor has not held any other directorships in listed companies over the past 4 years. Bruce Edmond Saxild (Executive Director) Mr Saxild has been with the group since 1977. He is responsible for the group’s logistics and transport operations. He is a member of the audit and risk committee. Mr Saxild has not held any other directorships in listed companies over the past 4 years. Peter James Leonhardt (Non-Executive Director) Mr Leonhardt is a non-executive director of CTI Logistics Limited and has been with the group since 1999. During the past 4 years Mr Leonhardt has served as a director of Carnarvon Petroleum Limited (March 2005 and continuing). Mr Leonhardt is a former managing partner of Coopers & Lybrand (now PricewaterhouseCoopers). Mr Leonhardt is the chairman of the audit and risk committee and the remuneration committee. Matthew David Watson (Non-Executive Director) Mr Watson is a non-executive director of CTI Logistics Limited and has been with the group since 2010. He has a Post Graduate Diploma of Business Information Systems and is a Chartered Management Accountant (CIMA). He is a member of the audit and risk committee. Mr Watson has not held any other directorships in listed companies since his appointment. Principal activities of the group The principal activities of the group during the year were the provision of logistics and transport services, rental of property and provision of security services. Dividends Dividends paid or declared by the Company to members since the end of the previous financial year were: Declared and paid during the year
Cents per
share
Total amount Franked
Date of payment
Interim 2015 ordinary
4.0 $2,561,836 17 April 2015
Final 2014 ordinary
4.0 $2,549,867 31 October 2014
Declared after end of year After the balance sheet date the directors have declared the following dividend. The dividend has not been provided and there are no income tax consequences. Declared Cents
per share
Total amount Franked
Date of payment
Final 2015 ordinary 4.0 $2,633,228 20 November 2015 The financial effect of this post year dividend has not been brought to account in the financial statements for the year ended 30 June 2015 and will be recognised in subsequent financial reports. Review of operations and results The group is a transport and logistics provider in couriers, parcels, taxi trucks, fleet management and general and contract warehousing. On 10 June 2015 the group expanded its logistics operations nationally by acquiring all of the share capital of Logico Operations Group Limited and its wholly owned subsidiary G.M. Kane & Sons Pty Ltd (GMK), a specialist logistics provider to the commercial and residential flooring sector. The group also disposed of its plastics business in May 2015. Revenue from operations was down 11.9% to $123,959,117. Profit before tax for the year was $8,647,989, down 32.4% on the previous year after adjusting for the net gain in the property portfolio in the previous year. Net profit after tax was down 26.4% on the same basis. The results for the period were impacted by a combination of: • the continued slowdown in business activity and
increased pressure on margins across the group reflecting the ongoing difficult market conditions in Western Australia
• the downturn in Western Australian minerals and energy project work along with the move towards lower margin ongoing maintenance work for completed construction projects
• weaker than expected throughput in demand from our warehousing client base in the lead up to Christmas in part offset by higher volumes and increased utilisation towards the end of the financial year
• successful completion of the acquisition of GMK in June 2015 into the logistics segment contributing $3,450,230 of revenue and $273,823 profit in the period
• a strong result for the transport segment with profit marginally up despite lower courier, truck and freight volumes offset by continued growth in parcel volumes and a significant planned improvement in regional road freight margins
• a $20 million investment earlier in the year through the acquisition of an additional 67,000 square metres of land adjoining the Hazelmere warehouse and distribution centre, increasing this strategic CTI site to a total of 154,000 square metres for future growth
Directors’ Report
Page 4
The group’s net assets increased by 7% compared with the previous year which is largely attributable to the current year’s profit after tax, an issue of 1.4 million shares to vendors of GMK in June 2015 and the issue of shares from the Company’s dividend re-investment plan in October 2014 and April 2015. Operating cash flow improved to $13.1 million from $11.6 million, reflecting ongoing improvements in working capital and the cash contribution of GMK in June 2015. The group’s receivables and cash flow management remained well controlled with receivables increasing only marginally when compared to decline in revenue. With a diverse and large customer base including GMK the strength of the group’s focus on receivable management is reflected in the value of receivables written off during the year representing only 0.1% of revenue consistent with the previous year. Interest bearing debt has increased by $29.5 million following the acquisition of GMK, additional land adjacent to the Hazelmere facility, a Karratha property and the cost of plant, equipment and motor vehicles. Trade and other payables include a deferred payment to the vendors of GMK for $14.2 million payable in September 2015. The Company has increased its facility limit to $87.2 million and is addressing the debt levels through the sale of property, with the view to significantly reducing gearing levels to more conservative levels. The board has declared a final dividend payment of 4.0 cents per share, fully franked. This together with the interim dividend of 4.0 cents, is in line with the previous year. The 2015/16 year will see the Company integrate GMK and look to expand its operations nationally, expand the warehousing footprint in South Australia in support of client demand, expand the metropolitan transport network and continue to explore further opportunities for the acquisition of businesses in fields related to or compatible with the group’s existing core operations. Changes in the state of affairs No other significant changes in the state of affairs of the group have occurred other than those matters referred to elsewhere in this report. Events subsequent to balance date The directors are not aware of any other matters or circumstances that has significantly or may significantly affect the operations of the group, the results of those operations, or the affairs of the group in subsequent financial years. Likely developments The major objectives encompassed in the Business Plan of the group are: (i) expansion of existing operations by aggressive marketing
and by acquisition; (ii) establishment or acquisition of businesses in fields
related to or compatible with the group’s existing core operations; and
(iii) to maximise the profits and returns to shareholders by constant review of existing operations.
Company secretary The company secretary is Mr D A Mellor, who was appointed to the position in 1987. He is a Chartered Accountant. Directors’ meetings The number of directors’ meetings held in the period each director held office during the financial year and the number of meetings attended by each director were: Board of Directors
Number Held Number Attended P J Leonhardt 9 9 D A Mellor 9 9 B E Saxild 9 9 D R Watson 9 9 M D Watson 9 9 Audit and Risk Committee
Number Held Number Attended P J Leonhardt 3 3 B E Saxild 3 3 M D Watson 3 3 Remuneration Committee
Number Held Number Attended P J Leonhardt 2 2 D R Watson 2 2 Particulars of directors’ interests in shares of CTI Logistics Limited at the date of this report The relevant interest of each director in the shares issued by the Company as notified by the directors to the ASX in accordance with S205G(1) of the Corporations Act 2001, at the date of this report is as follows:
Direct Holding
Indirect Holding
P J Leonhardt - 544,076 D A Mellor 522,080 5,183,088 B E Saxild 347,120 4,438,058 D R Watson 18,062,683 11,518,375 M D Watson 324,512 - Directors’ and officers’ indemnity insurance The Company’s directors’ and officers’ indemnity insurance policy indemnifies the directors named in this report in respect of their potential liability to third parties for wrongful acts committed by them in their capacity as directors (as defined in the policy). The disclosure of the premium paid in respect of the insurance policy is prohibited under the terms of the policy. The Company has entered into an agreement with their current auditors, KPMG, indemnifying them against any claims by third parties arising from their report on the Annual Financial Report, except where the liability arises out of conduct involving a lack of good faith. Environmental regulation The operations of CTI Logistics Limited and its controlled entities are not subject to any particular or significant environmental regulation. However, the board believes that CTI Logistics Limited and its controlled entities have adequate
Directors’ Report
Page 5
systems in place for the management of its environmental requirements and is not aware of any breach of those environmental requirements as they apply to CTI Logistics Limited and its controlled entities. Non-audit services The Company may decide to employ the auditor on assignments additional to their statutory audit duties where the auditor’s expertise and experience with the Company and/or the group are important. Details of the amounts paid or payable to the auditor, KPMG, for audit services provided during the year are set out in Note 24 of the financial statements. There were no non-audit services provided during the year. The directors are satisfied the auditor did not therefore compromise the auditor independence requirements of the Corporations Act 2001.
A copy of the auditor’s independence declaration as required under section 307C of the Corporations Act 2001 is set out on page 8.
Page 6
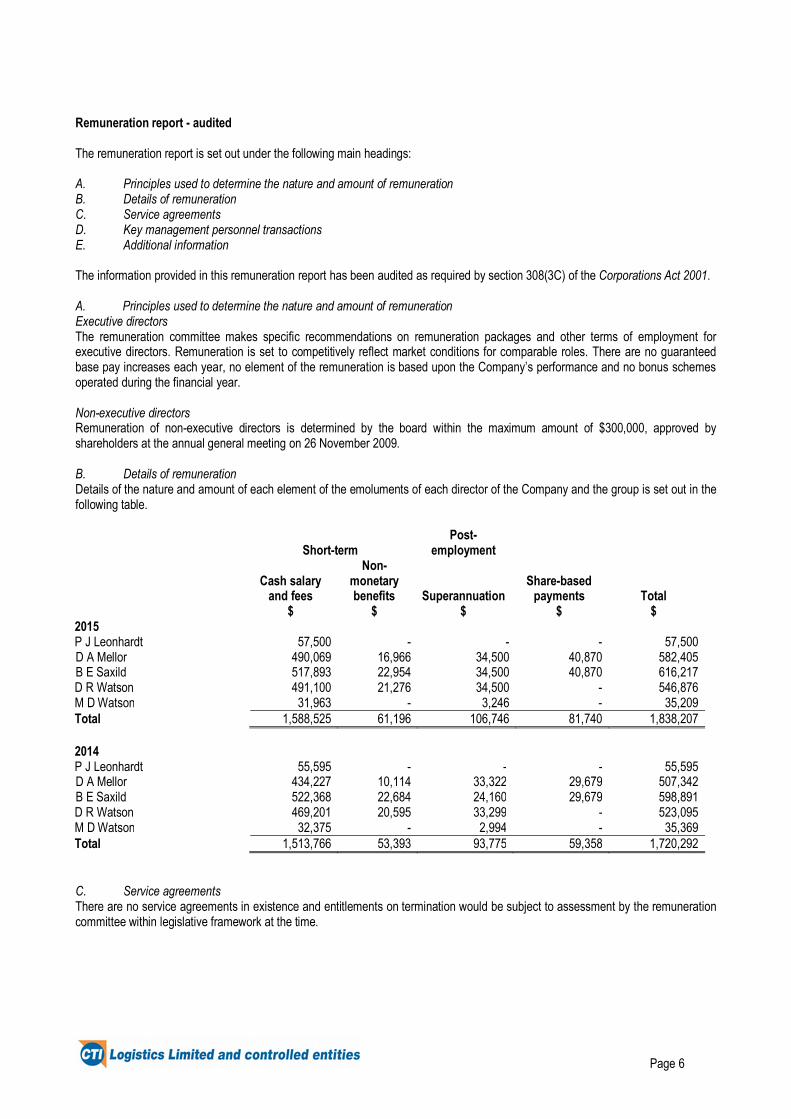
Remuneration report - audited The remuneration report is set out under the following main headings: A. Principles used to determine the nature and amount of remuneration B. Details of remuneration C. Service agreements D. Key management personnel transactions E. Additional information The information provided in this remuneration report has been audited as required by section 308(3C) of the Corporations Act 2001. A. Principles used to determine the nature and amount of remuneration Executive directors The remuneration committee makes specific recommendations on remuneration packages and other terms of employment for executive directors. Remuneration is set to competitively reflect market conditions for comparable roles. There are no guaranteed base pay increases each year, no element of the remuneration is based upon the Company’s performance and no bonus schemes operated during the financial year. Non-executive directors Remuneration of non-executive directors is determined by the board within the maximum amount of $300,000, approved by shareholders at the annual general meeting on 26 November 2009. B. Details of remuneration Details of the nature and amount of each element of the emoluments of each director of the Company and the group is set out in the following table.
Short-term Post-
employment
Cash salary and fees
$
Non-monetary benefits
$ Superannuation
$
Share-based
payments $
Total
$ 2015 P J Leonhardt 57,500 - - - 57,500 D A Mellor 490,069 16,966 34,500 40,870 582,405 B E Saxild 517,893 22,954 34,500 40,870 616,217 D R Watson 491,100 21,276 34,500 - 546,876 M D Watson 31,963 - 3,246 - 35,209 Total 1,588,525 61,196 106,746 81,740 1,838,207 2014 P J Leonhardt 55,595 - - - 55,595 D A Mellor 434,227 10,114 33,322 29,679 507,342 B E Saxild 522,368 22,684 24,160 29,679 598,891 D R Watson 469,201 20,595 33,299 - 523,095 M D Watson 32,375 - 2,994 - 35,369 Total 1,513,766 53,393 93,775 59,358 1,720,292 C. Service agreements There are no service agreements in existence and entitlements on termination would be subject to assessment by the remuneration committee within legislative framework at the time.
Page 7
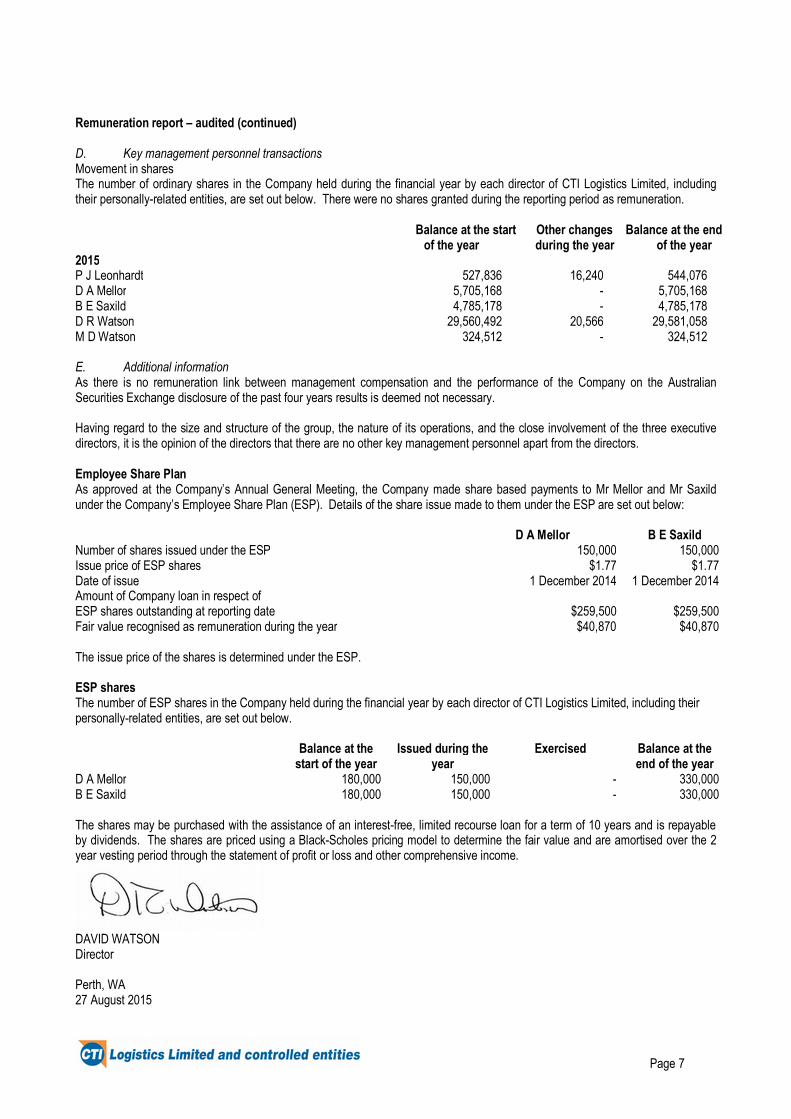
Remuneration report – audited (continued) D. Key management personnel transactions Movement in shares The number of ordinary shares in the Company held during the financial year by each director of CTI Logistics Limited, including their personally-related entities, are set out below. There were no shares granted during the reporting period as remuneration.
Balance at the start
of the year
Other changes during the year
Balance at the end
of the year 2015 P J Leonhardt 527,836 16,240 544,076D A Mellor 5,705,168 - 5,705,168B E Saxild 4,785,178 - 4,785,178D R Watson 29,560,492 20,566 29,581,058M D Watson 324,512 - 324,512 E. Additional information As there is no remuneration link between management compensation and the performance of the Company on the Australian Securities Exchange disclosure of the past four years results is deemed not necessary. Having regard to the size and structure of the group, the nature of its operations, and the close involvement of the three executive directors, it is the opinion of the directors that there are no other key management personnel apart from the directors. Employee Share Plan As approved at the Company’s Annual General Meeting, the Company made share based payments to Mr Mellor and Mr Saxild under the Company’s Employee Share Plan (ESP). Details of the share issue made to them under the ESP are set out below: D A Mellor B E Saxild Number of shares issued under the ESP 150,000 150,000 Issue price of ESP shares $1.77 $1.77 Date of issue 1 December 2014 1 December 2014 Amount of Company loan in respect of ESP shares outstanding at reporting date
$259,500
$259,500
Fair value recognised as remuneration during the year The issue price of the shares is determined under the ESP.
$40,870 $40,870
ESP shares The number of ESP shares in the Company held during the financial year by each director of CTI Logistics Limited, including their personally-related entities, are set out below. Balance at the
start of the year Issued during the
year Exercised Balance at the
end of the year D A Mellor 180,000 150,000 - 330,000 B E Saxild 180,000 150,000 - 330,000 The shares may be purchased with the assistance of an interest-free, limited recourse loan for a term of 10 years and is repayable by dividends. The shares are priced using a Black-Scholes pricing model to determine the fair value and are amortised over the 2 year vesting period through the statement of profit or loss and other comprehensive income.
DAVID WATSON Director Perth, WA 27 August 2015
Lead Auditor’s Independence Declaration under Section 307C of the Corporations Act 2001
To: the directors of CTI Logistics Limited
I declare that, to the best of my knowledge and belief, in relation to the audit for the financial year ended 30 June 2015 there have been:
(i) no contraventions of the auditor independence requirements as set out in the Corporations Act 2001 in relation to the audit; and
(ii) no contraventions of any applicable code of professional conduct in relation to the audit.
KPMG
Brent Steedman Partner
Perth
27 August 2015
KPMG, an Australian partnership and a member firm of the KPMG network of independent member firms affiliated with KPMG International Cooperative (“KPMG International”), a Swiss entity.
Liability limited by a scheme approved under Professional Standards Legislation.
Page 9
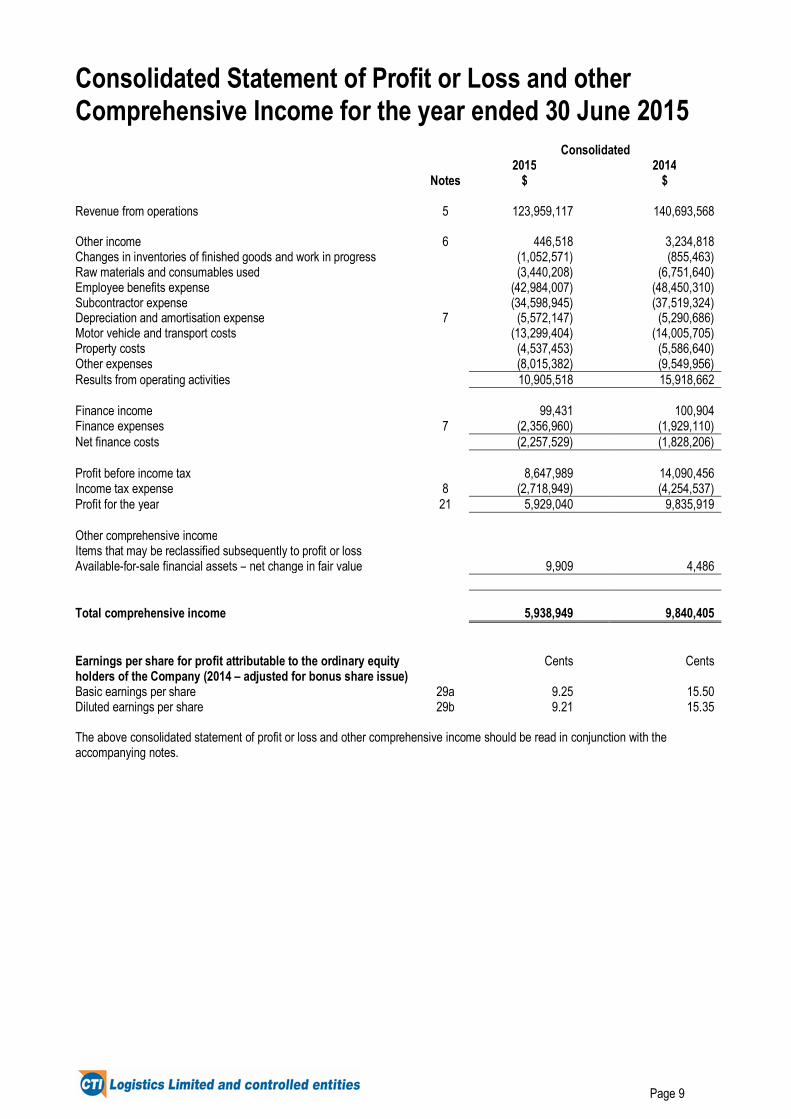
Consolidated Statement of Profit or Loss and other Comprehensive Income for the year ended 30 June 2015 Consolidated 2015 2014 Notes $ $ Revenue from operations 5 123,959,117 140,693,568 Other income 6 446,518 3,234,818 Changes in inventories of finished goods and work in progress (1,052,571) (855,463) Raw materials and consumables used (3,440,208) (6,751,640) Employee benefits expense (42,984,007) (48,450,310) Subcontractor expense (34,598,945) (37,519,324) Depreciation and amortisation expense 7 (5,572,147) (5,290,686) Motor vehicle and transport costs (13,299,404) (14,005,705) Property costs (4,537,453) (5,586,640) Other expenses (8,015,382) (9,549,956) Results from operating activities 10,905,518 15,918,662 Finance income 99,431 100,904 Finance expenses 7 (2,356,960) (1,929,110) Net finance costs (2,257,529) (1,828,206) Profit before income tax 8,647,989 14,090,456 Income tax expense 8 (2,718,949) (4,254,537) Profit for the year 21 5,929,040 9,835,919 Other comprehensive income Items that may be reclassified subsequently to profit or loss Available-for-sale financial assets – net change in fair value 9,909 4,486
Total comprehensive income
5,938,949 9,840,405 Earnings per share for profit attributable to the ordinary equity holders of the Company (2014 – adjusted for bonus share issue)
Cents
Cents
Basic earnings per share 29a 9.25 15.50 Diluted earnings per share 29b 9.21 15.35
The above consolidated statement of profit or loss and other comprehensive income should be read in conjunction with the accompanying notes.
Page 10
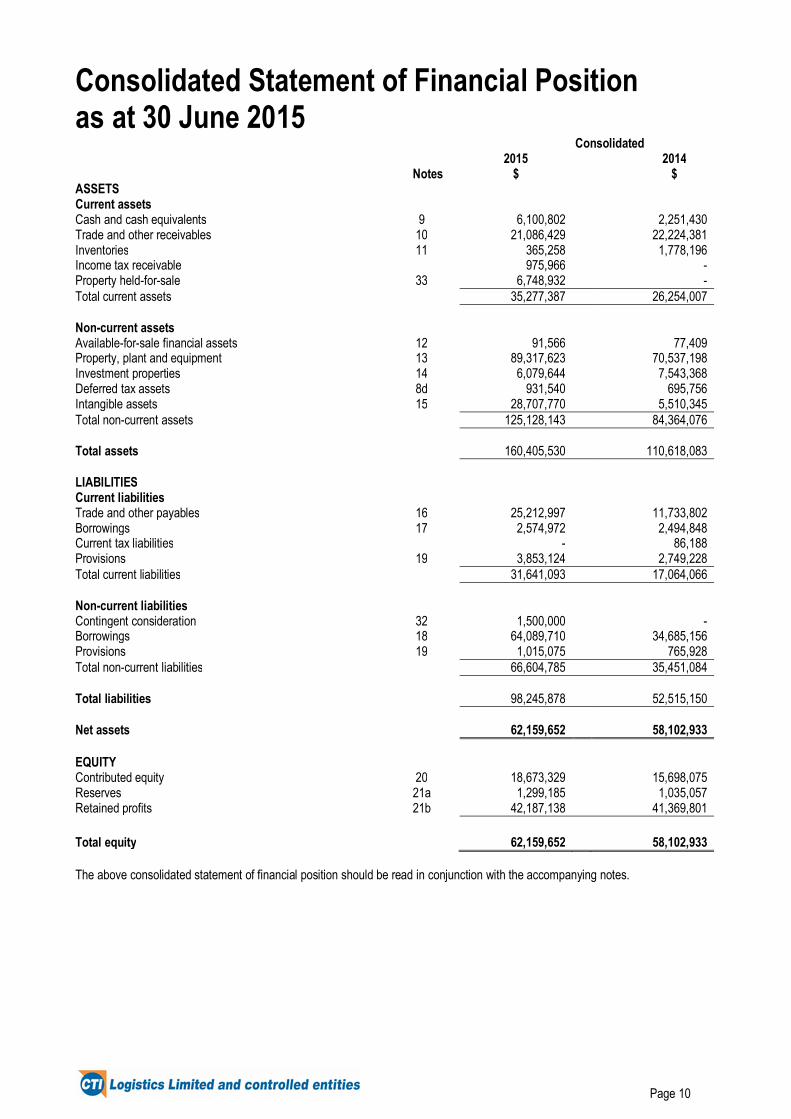
Consolidated Statement of Financial Position as at 30 June 2015 Consolidated 2015 2014 Notes $ $ ASSETS Current assets Cash and cash equivalents 9 6,100,802 2,251,430 Trade and other receivables 10 21,086,429 22,224,381 Inventories 11 365,258 1,778,196 Income tax receivable 975,966 - Property held-for-sale 33 6,748,932 - Total current assets 35,277,387 26,254,007 Non-current assets Available-for-sale financial assets 12 91,566 77,409 Property, plant and equipment 13 89,317,623 70,537,198 Investment properties 14 6,079,644 7,543,368 Deferred tax assets 8d 931,540 695,756 Intangible assets 15 28,707,770 5,510,345 Total non-current assets 125,128,143 84,364,076 Total assets 160,405,530 110,618,083 LIABILITIES Current liabilities Trade and other payables 16 25,212,997 11,733,802 Borrowings 17 2,574,972 2,494,848 Current tax liabilities - 86,188 Provisions 19 3,853,124 2,749,228 Total current liabilities 31,641,093 17,064,066 Non-current liabilities Contingent consideration 32 1,500,000 - Borrowings 18 64,089,710 34,685,156 Provisions 19 1,015,075 765,928 Total non-current liabilities 66,604,785 35,451,084 Total liabilities 98,245,878 52,515,150 Net assets 62,159,652 58,102,933 EQUITY Contributed equity 20 18,673,329 15,698,075 Reserves 21a 1,299,185 1,035,057 Retained profits 21b 42,187,138 41,369,801 Total equity 62,159,652 58,102,933
The above consolidated statement of financial position should be read in conjunction with the accompanying notes.
Page 11
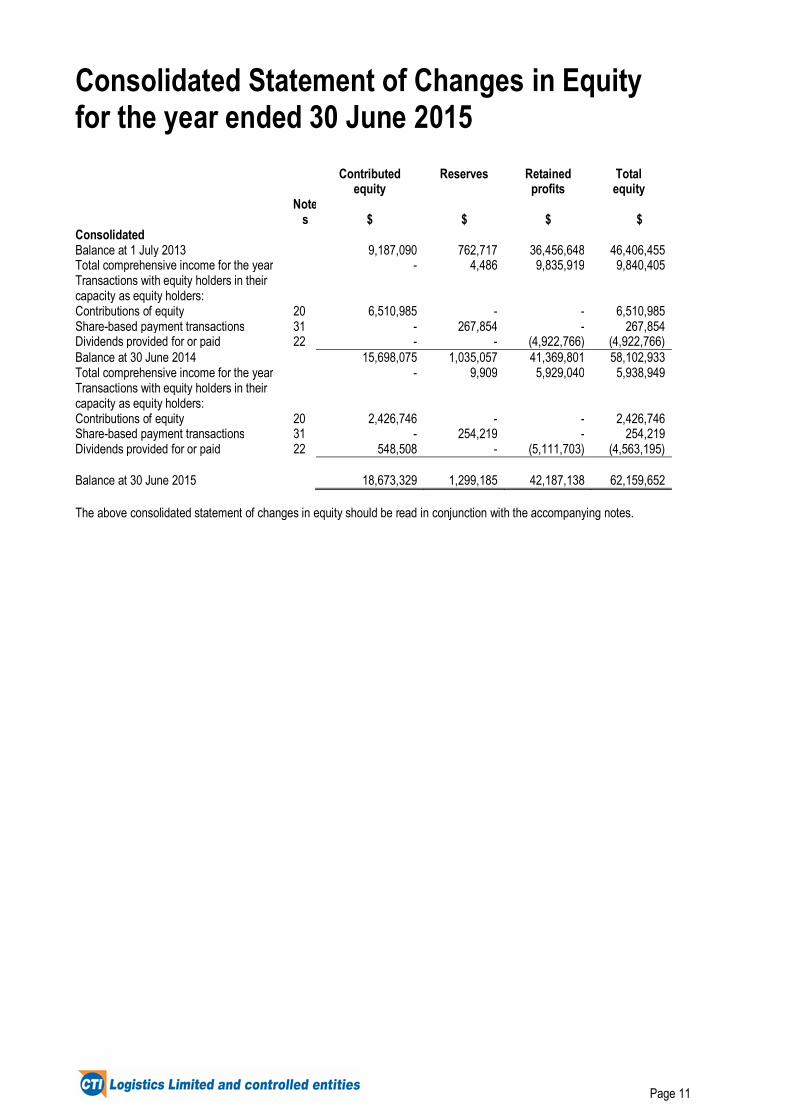
Consolidated Statement of Changes in Equity for the year ended 30 June 2015
Contributed
equity
Reserves
Retained profits
Total equity
Note
s $ $ $ $ Consolidated Balance at 1 July 2013 9,187,090 762,717 36,456,648 46,406,455 Total comprehensive income for the year - 4,486 9,835,919 9,840,405 Transactions with equity holders in their capacity as equity holders:
Contributions of equity 20 6,510,985 - - 6,510,985 Share-based payment transactions 31 - 267,854 - 267,854 Dividends provided for or paid 22 - - (4,922,766) (4,922,766) Balance at 30 June 2014 15,698,075 1,035,057 41,369,801 58,102,933 Total comprehensive income for the year - 9,909 5,929,040 5,938,949 Transactions with equity holders in their capacity as equity holders:
Contributions of equity 20 2,426,746 - - 2,426,746 Share-based payment transactions 31 - 254,219 - 254,219 Dividends provided for or paid 22 548,508 - (5,111,703) (4,563,195)
Balance at 30 June 2015
18,673,329 1,299,185 42,187,138 62,159,652
The above consolidated statement of changes in equity should be read in conjunction with the accompanying notes.
Page 12
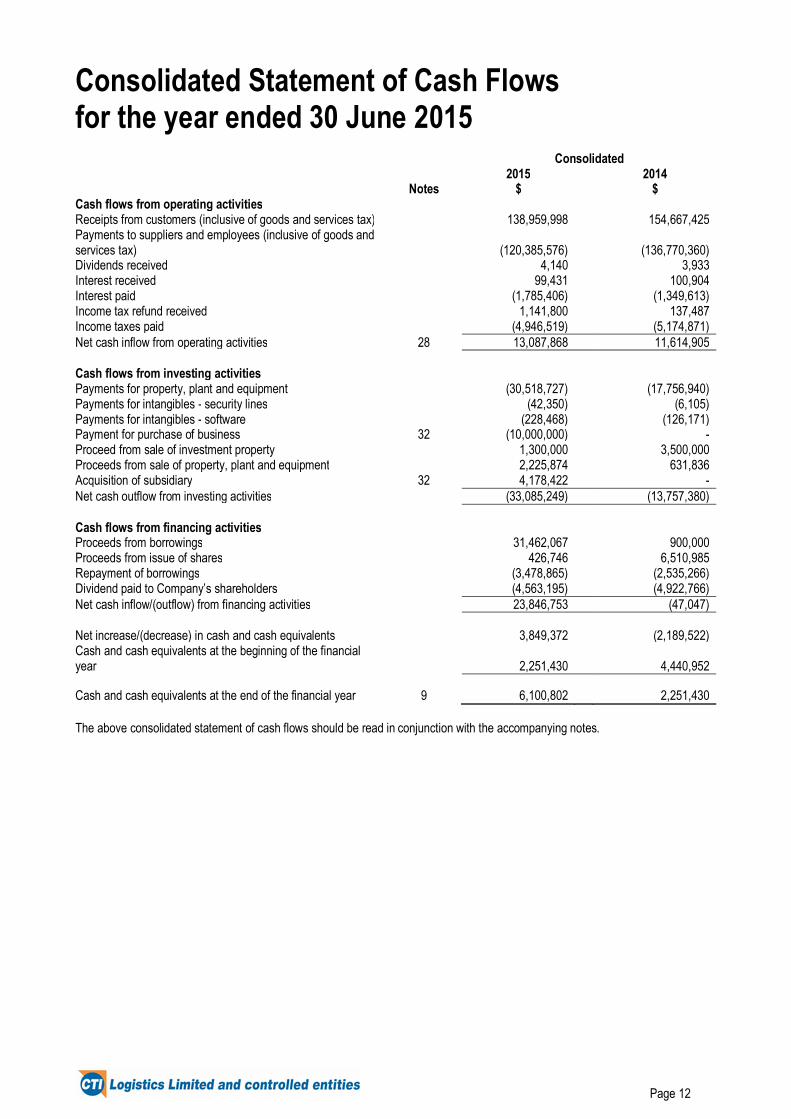
Consolidated Statement of Cash Flows for the year ended 30 June 2015 Consolidated 2015 2014 Notes $ $ Cash flows from operating activities Receipts from customers (inclusive of goods and services tax) 138,959,998 154,667,425 Payments to suppliers and employees (inclusive of goods and services tax) (120,385,576) (136,770,360) Dividends received 4,140 3,933 Interest received 99,431 100,904 Interest paid (1,785,406) (1,349,613) Income tax refund received 1,141,800 137,487 Income taxes paid (4,946,519) (5,174,871) Net cash inflow from operating activities 28 13,087,868 11,614,905 Cash flows from investing activities Payments for property, plant and equipment (30,518,727) (17,756,940) Payments for intangibles - security lines (42,350) (6,105) Payments for intangibles - software (228,468) (126,171) Payment for purchase of business 32 (10,000,000) - Proceed from sale of investment property 1,300,000 3,500,000 Proceeds from sale of property, plant and equipment 2,225,874 631,836 Acquisition of subsidiary 32 4,178,422 - Net cash outflow from investing activities (33,085,249) (13,757,380) Cash flows from financing activities Proceeds from borrowings 31,462,067 900,000 Proceeds from issue of shares 426,746 6,510,985 Repayment of borrowings (3,478,865) (2,535,266) Dividend paid to Company’s shareholders (4,563,195) (4,922,766) Net cash inflow/(outflow) from financing activities 23,846,753 (47,047) Net increase/(decrease) in cash and cash equivalents 3,849,372 (2,189,522) Cash and cash equivalents at the beginning of the financial year 2,251,430 4,440,952
Cash and cash equivalents at the end of the financial year 9 6,100,802 2,251,430
The above consolidated statement of cash flows should be read in conjunction with the accompanying notes.
Notes to the Financial Statements
Page 13
REPORTING ENTITY CTI Logistics Limited (the “Company”) is a company domiciled in Australia. The address of the Company’s registered office is 1 Drummond Place, West Perth, Western Australia. The consolidated financial statements of the Company as at and for the year ended 30 June 2015 comprise the Company and its subsidiaries (together referred to as the “group” and individually as “group entities”). The group is a for-profit entity and primarily is involved in the provision of logistics and transport services, rental of property and provision of security services. 1. SUMMARY OF SIGNIFICANT ACCOUNTING POLICIES The principal accounting policies adopted in the preparation of the consolidated financial report are set out below. These policies have been consistently applied to all the years presented, unless otherwise stated. The financial report is for the consolidated entity consisting of CTI Logistics Limited and its subsidiaries. (a) BASIS OF PREPARATION OF FINANCIAL REPORT This general purpose financial report has been prepared in accordance with Australian Accounting Standards adopted by the Australian Accounting Standards Board and the Corporations Act 2001. Compliance with IFRS The consolidated financial statements of the CTI Logistics Limited group also comply with International Financial Reporting Standards (IFRS) as issued by the International Accounting Standards Board (IASB). The consolidated financial statements were authorised for issue by the board of directors on 27 August 2015. Historical cost convention These financial statements have been prepared under the historical cost convention except for available-for-sale financial assets which are measured at fair value. Functional and presentation currency All group entities are based in Australia. The consolidated financial statements are presented in Australian dollars, which is the group’s functional and presentation currency. (b) PRINCIPLES OF CONSOLIDATION Subsidiaries The financial statements incorporate the assets and liabilities of all entities controlled by CTI Logistics Limited ("Company") as at 30 June 2015 and the results of all subsidiaries for the period the Company controlled them during the year then ended. Subsidiaries are entities controlled by the group. The group controls an entity when it is exposed to, or has rights to, variable returns from its involvement with the entity and has the ability to affect those returns through its power over the entity. The financial statements of subsidiaries are included in the consolidated financial statements from the date on which control commences until the date on which control ceases. The acquisition method of accounting is used to account for business combinations by the group (refer to note 1(g)). Intercompany transactions, balances and unrealised gains on transactions within the group are eliminated. Unrealised losses are also eliminated unless the transaction provides evidence of the impairment of the asset transferred. (c) SEGMENT REPORTING Determination and presentation of operating segments An operating segment is a component of the group that engages in business activities from which it may earn revenues and incur expenses, including revenues and expenses that relate to transactions with any of the group’s other components. All operating segments’ operating results are reviewed regularly by the group’s executive chairman (“CEO”) to make decisions about resources to be allocated to the segment and to assess its performance, and for which discrete financial information is available.
Notes to the Financial Statements
Page 14
1. SUMMARY OF SIGNIFICANT ACCOUNTING POLICIES (continued)
(c) SEGMENT REPORTING (continued) Segment results that are reported to the CEO include items directly attributable to a segment as well as those that can be allocated on a reasonable basis. Unallocated items comprise mainly parent company and items that cannot be allocated to specific segments in respect of revenue, profit, assets and liabilities. (d) REVENUE RECOGNITION
Revenue is measured at the fair value of the consideration received or receivable. Amounts disclosed as revenue are net of returns, trade allowances and duties and taxes paid. Revenue is recognised for the major business activities as follows: (i) Logistics and transport
A sale is recorded when the goods or services have been delivered to or collected by a customer in accordance with the arrangements made with the group.
(ii) Security, manufacturing and other A sale is recorded when goods have been despatched to a customer pursuant to a sales order and the associated risks of ownership have transferred to the customer. A sale is recorded for services when the service has been performed.
(iii) Interest income Interest income is recognised on a time proportion basis using the effective interest method.
(iv) Dividends Dividends are recognised as revenue when the right to receive payment is established.
(v) Other revenue Revenue from outside the operating activities includes rent. This revenue is recognised on a straight-line basis in accordance with note 1(f).
(e) INCOME TAX Income tax expense comprises current and deferred tax. Current and deferred tax are recognised in profit or loss except to the extent that it relates to a business combination, or items recognised directly in equity or in other comprehensive income. The income tax expense or benefit for the period is the tax payable on the current period’s taxable income based on the notional income tax rate adjusted by changes in deferred tax assets and liabilities attributable to temporary differences between the tax bases of assets and liabilities and their carrying amounts in the financial statements, and to unused tax losses. Deferred income tax is provided in full, using the liability method, on temporary differences arising between the tax bases of assets and liabilities and their carrying amounts in the consolidated financial statements. However, the deferred income tax is not accounted for if it arises from initial recognition of an asset or liability in a transaction other than a business combination that at the time of the transaction affects neither accounting nor taxable profit or loss. Deferred income tax is determined using tax rates (and laws) that have been enacted or substantially enacted by the balance sheet date and are expected to apply when the related deferred income tax asset is realised or the deferred income tax liability is settled. Deferred tax assets are recognised for deductible temporary differences and unused tax losses only if it is probable that future taxable amounts will be available to utilise those temporary differences and losses. Deferred tax assets and liabilities are offset when there is a legally enforceable right to offset current tax assets and liabilities and when the deferred tax balances relate to the same taxation authority. Current tax assets and tax liabilities are offset where the entity has a legally enforceable right to offset and intends either to settle on a net basis or to realise the asset and settle the liability simultaneously. Tax consolidation CTI Logistics Limited and its wholly-owned Australian controlled entities have implemented the tax consolidation legislation. As a consequence, these entities are taxed as a single entity and the deferred tax assets and liabilities of these entities are set off in the consolidated financial statements. Assets or liabilities arising under tax funding agreements with the tax consolidated entities are recognised as amounts receivable from or payable to other entities in the group. Any difference between the amounts assumed and amounts receivable or payable under the tax funding agreement are recognised as a contribution to (or distribution from) wholly-owned tax consolidated entities.
Notes to the Financial Statements
Page 15
1. SUMMARY OF SIGNIFICANT ACCOUNTING POLICIES (continued) (f) LEASES Leases of property, plant and equipment where the group has substantially all the risks and rewards of ownership, are classified as finance leases. Finance leases are capitalised at the lease’s inception at the lower of the fair value of the leased property and the present value of the minimum lease payments. The corresponding rental obligations, net of finance charges are included in other long term payables. Each lease payment is allocated between the liability and finance cost. The finance cost is charged to profit and loss over the lease period so as to produce a constant periodic rate of interest on the remaining balance of the liability for each period. The property, plant and equipment acquired under finance leases is depreciated over the shorter of the asset’s useful life and the lease term. Leases in which a significant portion of the risks and rewards of ownership are retained by the lessor are classified as operating leases. Payments made under operating leases (net of any incentives received from the lessor) are charged to profit and loss on a straight-line basis over the period of the lease. Lease income from operating leases is recognised in income on a straight-line basis over the lease term. (g) BUSINESS COMBINATIONS The acquisition method of accounting is used to account for all business combinations entities regardless of whether equity instruments or other assets are acquired. The consideration transferred for the acquisition of a subsidiary comprises the fair values of the assets transferred, the liabilities incurred and the equity interests issued by the group. The consideration transferred also includes the fair value of any asset or liability resulting from a contingent consideration arrangement and the fair value of any pre-existing equity interest in the subsidiary. Acquisition-related costs are expensed as incurred. Identifiable assets acquired and liabilities and contingent liabilities assumed in a business combination are, with limited exceptions, measured initially at their fair values at the acquisition date. On an acquisition-by-acquisition basis, the group recognises any non-controlling interest in the acquiree either at fair value or at the non-controlling interest’s proportionate share of the acquiree’s net identifiable assets. The excess of the consideration transferred, the amount of any non-controlling interest in the acquiree and the acquisition-date fair value of any previous equity interest in the acquiree over the fair value of the group’s share of the net identifiable assets acquired is recorded as goodwill. If those amounts are less than the fair value of the net identifiable assets of the subsidiary acquired and the measurement of all amounts has been reviewed, the difference is recognised directly in profit or loss as a bargain purchase. Where settlement of any part of cash consideration is deferred, the amounts payable in the future are discounted to their present value as at the date of exchange. The discount rate used is the entity’s incremental borrowing rate, being the rate at which a similar borrowing could be obtained from an independent financier under comparable terms and conditions. Contingent consideration is classified either as equity or a financial liability. Amounts classified as a financial liability are subsequently remeasured to fair value with changes in fair value recognised in profit or loss. (h) IMPAIRMENT OF ASSETS Non-derivative financial assets The group assesses at the end of each reporting period whether there is objective evidence that a financial asset or group of financial assets is impaired. A financial asset or a group of financial assets is impaired and impairment losses are incurred only if there is objective evidence of impairment as a result of one or more events that occurred after the initial recognition of the asset (a ‘loss event’) and that loss event (or events) has an impact on the estimated future cash flows of the financial asset or group of financial assets that can be reliably estimated. In the case of equity investments classified as available-for-sale, a significant or prolonged decline in the fair value of the security below its cost is considered an indicator that the assets are impaired. (i) Assets carried at amortised cost For loans and receivables, the amount of the loss is measured as the difference between the asset’s carrying amount and the present value of estimated future cash flows discounted at the financial asset’s original effective interest rate. The carrying amount of the asset is reduced and the amount of the loss is recognised in the consolidated statement of profit or loss. If a loan or held-to-maturity investment has a variable interest rate, the discount rate for measuring any impairment loss is the current effective interest rate determined under the contract. As a practical expedient, the group may measure impairment on the basis of an instrument’s fair value using an observable market price. If, in a subsequent period, the amount of the impairment loss decreases and the decrease can be related objectively to an event occurring after the impairment was recognised, the reversal of the previously recognised impairment loss is recognised in the consolidated income statement. Impairment testing of trade receivables is described in note 1(j).
Notes to the Financial Statements
Page 16
1. SUMMARY OF SIGNIFICANT ACCOUNTING POLICIES (continued) (ii) Assets classified as available-for-sale Impairment losses on available-for-sale financial assets are recognised by reclassifying the losses accumulated in the fair value reserve in equity, to profit or loss. The cumulative loss that is reclassified from equity to profit or loss is the difference between the acquisition cost, net of any principal repayment and amortisation, and the current fair value, less any impairment loss previously recognised in profit or loss. Changes in impairment provisions attributable to application of the effective interest method are reflected as a component of interest income. Any subsequent recovery in the fair value of an impaired available-for-sale equity security is recognised in other comprehensive income. Non-financial assets Goodwill and intangible assets that have an indefinite useful life are not subject to amortisation and are tested annually for impairment, or more frequently if events or changes in circumstances indicate that they might be impaired. Other assets are tested for impairment whenever events or changes in circumstances indicate that the carrying amount may not be recoverable. An impairment loss is recognised for the amount by which the asset's carrying amount exceeds its recoverable amount. The recoverable amount is the higher of an asset's fair value less costs to sell and value in use. For the purposes of assessing impairment, assets are grouped at the lowest levels for which there are separately identifiable cash inflows which are largely independent of the cash inflows from other assets or groups of assets (cash-generating units). Non-financial assets other than goodwill that suffered an impairment are reviewed for possible reversal of the impairment at the end of each reporting period. Value-in-use calculations are described in note 15. (i) CASH AND CASH EQUIVALENTS Cash and cash equivalents includes cash on hand, deposits held at call with financial institutions, other short-term, highly liquid investments with original maturities of three months or less that are readily convertible to known amounts of cash and which are subject to an insignificant risk of changes in value, and bank overdrafts. Bank overdrafts are shown within borrowings in current liabilities on the statement of financial position. (j) TRADE RECEIVABLES Trade receivables are recognised initially at fair value and subsequently measured at amortised cost using the effective interest method, less provision for impairment. Trade receivables are generally due for settlement within 30 days. They are presented as current assets unless collection is not expected for more than 12 months after the reporting date. Collectability of trade receivables is reviewed on an ongoing basis. Debts which are known to be uncollectible are written off by reducing the carrying amount directly. An allowance account (provision for impairment of trade receivables) is used when there is objective evidence that the group will not be able to collect all amounts due according to the original terms of the receivables. Significant financial difficulties of the debtor, probability that the debtor will enter bankruptcy or financial reorganisation, and default or delinquency in payments (more than 60 days overdue) are considered indicators that the trade receivable is impaired. The amount of the impairment allowance is the difference between the asset's carrying amount and the present value of estimated future cash flows, discounted at the original effective interest rate. Cash flows relating to short-term receivables are not discounted if the effect of discounting is immaterial. The amount of the impairment loss is recognised in profit or loss within other expenses. When a trade receivable for which an impairment allowance had been recognised becomes uncollectible in a subsequent period, it is written off against the allowance account. Subsequent recoveries of amounts previously written off are credited against other expenses in profit or loss. (k) INVENTORIES Raw materials, work in progress and finished goods are stated at the lower of cost and net realisable value. Cost comprises direct materials, direct labour and an appropriated proportion of variable and fixed overhead expenditure, the latter being allocated on the basis of normal operating capacity. Costs are assigned to individual items of inventory on the basis of weighted average costs. Net realisable value is the estimated selling price in the ordinary course of business less the estimated costs of completion and the estimated costs necessary to make the sale. (l) INVESTMENTS AND OTHER FINANCIAL ASSETS Classification The group classifies its investments in available-for-sale financial assets. The classification depends on the purpose for which the investments were acquired. Management determines the classification of its investments at initial recognition and re-evaluates this designation at each reporting date. (i) Available-for-sale financial assets Available-for-sale financial assets, comprising principally marketable equity securities, are non-derivatives that are either designated in this category or not classified in any of the other categories. They are included in non-current assets unless management intends to dispose of the investment within 12 months of the balance sheet date.
Notes to the Financial Statements
Page 17
1. SUMMARY OF SIGNIFICANT ACCOUNTING POLICIES (continued) (l) INVESTMENTS AND OTHER FINANCIAL ASSETS (continued) Recognition and derecognition Purchases and sales of financial assets are recognised on trade-date – the date on which the group commits to purchase or sell the asset. Financial assets are initially recognised at fair value plus transaction costs. Financial assets are derecognised when the rights to receive cash flows from the financial assets have expired or have been transferred and the group has transferred substantially all the risks and rewards of ownership. When securities classified as available-for-sale are sold, the accumulated fair value adjustments recognised in other comprehensive income are reclassified to profit and loss as gains and losses from investment securities. Measurement At initial recognition, the group measures a financial asset at its fair value plus, in the case of a financial asset not at fair value through profit or loss, transaction costs that are directly attributable to the acquisition of the financial asset. Transaction costs of financial assets carried at fair value through profit or loss are expensed in profit or loss. Loans and receivables and held-to-maturity investments are subsequently carried at amortised cost using the effective interest method. Available-for-sale financial assets and financial assets at fair value through profit or loss are subsequently carried at fair value. Gains or losses arising from changes in the fair value of the ‘financial assets at fair value through profit or loss' category are presented in profit or loss within other income or other expenses in the period in which they arise. Dividend income from financial assets at fair value through profit or loss is recognised in profit or loss as part of revenue from continuing operations when the group's right to receive payments is established. Interest income from these financial assets is included in the net gains/(losses). Changes in the fair value of monetary securities classified as available-for-sale are recognised in other comprehensive income. Impairment Impairment testing of financial assets is described in note 1(h). (m) PROPERTY, PLANT AND EQUIPMENT Property, plant and equipment other than freehold land is stated at historical cost less depreciation. Historical cost includes expenditure that is directly attributable to the acquisition of the items. Subsequent costs are included in the asset’s carrying amount or recognised as a separate asset, as appropriate, only when it is probable that future economic benefits associated with the item will flow to the group and the cost of the item can be measured reliably. All other repairs and maintenance are charged to profit and loss during the financial period in which they are incurred. Land is not depreciated. Depreciation on other assets is calculated using the straight line method to allocate their cost net of their residual values, over their estimated useful lives, as follows: Buildings 25 - 40 years Plant and equipment 5 - 15 years Motor vehicles 5 - 10 years Furniture and fittings 3 - 8 years The assets’ residual values and useful lives are reviewed, and adjusted if appropriate, at each balance sheet date. An asset’s carrying amount is written down immediately to its recoverable amount if the asset’s carrying amount is greater than its estimated recoverable amount (note 1(h)). Gains and losses on disposals are determined by comparing proceeds with carrying amounts. These are included in profit or loss under other income and other expenses. (n) INVESTMENT PROPERTY Investment property, principally comprising freehold land and buildings, is held for long-term rental yields and is not occupied by the group. Investment property is held at historical cost less depreciation. Investment property includes properties that are under construction for future use as investment property and is carried at historical cost. Investment buildings are depreciated using the straight line method over their estimated useful lives of 10 to 40 years.
Notes to the Financial Statements
Page 18
1. SUMMARY OF SIGNIFICANT ACCOUNTING POLICIES (continued) (o) INTANGIBLE ASSETS (i) Goodwill Goodwill represents the excess of the cost of an acquisition over the fair value of the group’s share of the net identifiable assets acquired. Goodwill is not amortised. Instead, goodwill is tested for impairment annually, or more frequently if events or changes in circumstances indicate that it might be impaired, and is carried at cost less accumulated impairment losses. Gains and losses on the disposal of an entity include the carrying amount of goodwill relating to the entity sold. Goodwill is allocated to cash-generating units for the purpose of impairment testing. The allocation is made to those cash-generating units or groups of cash-generating units that are expected to benefit from the business combination in which the goodwill arose, identified according to operating segments (note 4). (ii) Security Lines Security lines have a finite useful life and are carried at cost less accumulated amortisation and impairment losses. (iii) Software Costs incurred in acquiring software and licences that will contribute to future period financial benefits through revenue generation and/or cost reduction are capitalised to software. (iv) Trade names Trade names have a finite useful life and are carried at cost less accumulated amortisation and impairment losses. (v) Customer relationships Customer relationships acquired as part of a business combination are recognised separately from goodwill. The customer relationships are carried at their fair value at the date of acquisition less accumulated amortisation and impairment losses. Subsequent expenditure Subsequent expenditure is capitalised only when it increases the future economic benefits embodied in the specific asset to which it relates. All other expenditure, including expenditure on internally generated goodwill is recognised in profit or loss as incurred. Amortisation Amortisation is calculated over the cost of the asset less its residual value. Amortisation is recognised in profit or loss on a straight-line basis over the estimated useful lives of intangible assets, other than goodwill, from the date that they are available for use. The estimated useful lives for the current and comparative periods are as follows: Security lines 5 - 7 yearsSoftware 2.5 - 4 yearsTrade names 8 yearsCustomer relationships 5 years
Amortisation methods, useful lives and residual values are reviewed at each financial year-end and adjusted if appropriate. (p) TRADE AND OTHER PAYABLES These amounts represent liabilities for goods and services provided to the group prior to the end of the financial year and which are unpaid. The amounts are unsecured and are paid based on the terms of trade which are usually 30 to 60 days from the date of recognition. Trade and other payables are presented as current liabilities unless payment is not due within 12 months from the reporting date. They are recognised initially at their fair value and subsequently measured at amortised cost using the effective interest method. (q) BORROWINGS Borrowings are initially recognised at fair value, net of transaction costs incurred. Borrowings are subsequently measured at amortised cost. Any difference between the proceeds (net of transaction costs) and the redemption amount is recognised in profit or loss over the period of the borrowings using the effective interest method. The group derecognises a financial liability when its contractual obligations are discharged or cancelled or expire. Borrowings are classified as current liabilities unless the group has an unconditional right to defer settlement of the liability for at least 12 months after the reporting date.
Notes to the Financial Statements
Page 19
1. SUMMARY OF SIGNIFICANT ACCOUNTING POLICIES (continued) (r) BORROWING COSTS Borrowing costs incurred for the construction of any qualifying asset are capitalised during the period of time that is required to complete and prepare the asset for its intended use or sale. Other borrowing costs are expensed. (s) PROVISIONS Provisions are recognised when the group has a present legal or constructive obligation as a result of past events, it is more likely than not that an outflow of resources will be required to settle the obligation, and the amount has been reliably estimated. Provisions are not recognised for future operating losses. Provisions are measured at the present value of management’s best estimate of the expenditure required to settle the present obligation at the reporting date. (t) EMPLOYEE BENEFITS (i) Short-term obligations Liabilities for wages and salaries, including non-monetary benefits and annual leave expected to be settled within 12 months after the end of the period in which the employees render the related service are recognised in respect of employees' services up to the end of the reporting period and are measured at the amounts expected to be paid when the liabilities are settled. The liability for annual leave is recognised in the provision for employee benefits. All other short-term employee benefit obligations are presented as payables. (ii) Other long-term employee benefit obligations The liability for long service leave and annual leave which is not expected to be settled within 12 months after the end of the period in which the employees render the related service is recognised in the provision for employee benefits and measured as the present value of expected future payments to be made in respect of services provided by employees up to the end of the reporting period. Consideration is given to expected future wage and salary levels, experience of employee departures and periods of service. Expected future payments are discounted using market yields at the end of the reporting period on national government bonds with terms to maturity and currency that match, as closely as possible, the estimated future cash outflows. (iii) Retirement benefit obligations Contributions to the defined contribution fund are recognised as an expense as they become payable. Prepaid contributions are recognised as an asset to the extent that a cash refund or a reduction in the future payments is available. (iv) Bonus The group recognises a liability and an expense for bonuses where contractually obliged or when past events have created a constructive obligation. (v) Share-based payment transactions An Employee Share Plan (“ESP”) allows certain group employees to acquire shares of the Company. The grant date fair value of the shares granted to employees is recognised as an employee expense with a corresponding increase in equity, over the period during which the employees become unconditionally entitled to the shares. The fair value of the shares granted is measured using a Black-Scholes pricing model, taking into account the terms and conditions upon which the shares were granted. The amount recognised as an expense is adjusted to reflect the actual number of shares that vest. Employees have been granted a limited recourse 10 year interest-free loan in which to acquire the shares. The loan has not been recognised as the Company only has recourse to the value of the shares. (u) CONTRIBUTED EQUITY Ordinary shares are classified as equity. Incremental costs directly attributable to the issue of ordinary shares and share options are recognised as a deduction from equity, net of any tax effects. (v) DIVIDENDS Provision is made for the amount of any dividend declared, determined or publicly recommended by the directors on or before the end of the year but not distributed at balance date. (w) EARNINGS PER SHARE (i) Basic earnings per share Basic earnings per share is determined by dividing profit for the year by the weighted average number of ordinary shares outstanding during the year.
Notes to the Financial Statements
Page 20
1. SUMMARY OF SIGNIFICANT ACCOUNTING POLICIES (continued) (ii) Diluted earnings per share Diluted earnings per share adjusts the figures used in the determination of basic earnings per share to take into account the after income tax effect of interest and other financing costs associated with dilutive potential ordinary shares and the weighted average number of additional ordinary shares that would have been outstanding assuming the conversion of all dilutive potential ordinary shares. (x) GOODS AND SERVICES TAX (GST) Revenues, expenses and assets are recognised net of the amount of associated GST, unless the GST incurred is not recoverable from the taxation authority. In this case it is recognised as part of the cost of acquisition of the asset or as part of the expense. Receivables and payables are stated inclusive of the amounts of GST receivable or payable. The net amount of GST recoverable from, or payable to, the taxation authority is included with other receivables or payables in the balance sheet. Cash flows are presented on a gross basis. The GST components of cash flows arising from investing or financing activities which are recoverable from, or payable to the taxation authority, are presented as operating cash flow. (y) PARENT ENTITY FINANCIAL INFORMATION The financial information for the parent entity, CTI Logistics Limited, disclosed in note 30 has been prepared on the same basis as the consolidated financial statements, except as set out below. (i) Investments in subsidiaries Investments in subsidiaries are accounted for at cost in the financial statements of CTI Logistics Limited. (ii) Tax consolidation legislation CTI Logistics Limited and its wholly-owned Australian controlled entities have implemented the tax consolidation legislation. The head entity, CTI Logistics Limited, and the controlled entities in the tax consolidated group continue to account for their own current and deferred tax amounts. These tax amounts are measured as if each entity in the tax consolidated group continues to be a stand alone taxpayer in its own right. In addition to its own current and deferred tax amounts, CTI Logistics Limited also recognises the current tax liabilities (or assets) and the deferred tax assets arising from unused tax losses and unused tax credits assumed from controlled entities in the tax consolidated group. The entities have also entered into tax sharing and funding agreements. Under the terms of these agreements, the controlled entities will reimburse the Company for any current tax payable by the Company arising in respect of their activities and the Company will reimburse the controlled entities for any tax refund due to the Company arising in respect of their activities. The reimbursements are payable by the Company and will limit the joint and several liability of the controlled entities in the case of default by the Company. Assets or liabilities arising under tax funding agreements with the tax consolidated entities are recognised as amounts receivable from or payable to other entities in the group. Any difference between the amounts assumed and amounts receivable or payable under the tax funding agreement are recognised as a contribution to (or distribution from) wholly-owned tax consolidated entities. (iii) Financial guarantees Where the parent entity has provided financial guarantees in relation to loans and payables of subsidiaries for no compensation, the fair values of these guarantees is not recognised as contributions or as part of the cost of the investment. (z) ASSETS HELD FOR SALE Non-current assets are classified as held-for-sale if it is highly probable that they will be recovered primarily through sale rather than through continuing use. Such assets are generally measured at the lower of their carrying amount and fair value less costs to sell. Impairment losses on initial classification as held-for-sale and subsequent gains and losses on re-measurement are recognised in profit or loss. Once classified as held-for-sale, property, plant and equipment are no longer depreciated.
Notes to the Financial Statements
Page 21
1. SUMMARY OF SIGNIFICANT ACCOUNTING POLICIES (continued) (aa) NEW ACCOUNTING STANDARDS AND INTERPRETATIONS NOT YET ADOPTED A number of new standards, amendments to standards and interpretations are effective for annual periods beginning after 1 July 2015, and have not been applied in preparing these consolidated financial statements. Those which may be relevant to the group are set out below. The group does not plan to adopt these standards early. The impact of these new standards are not yet known.
(i) AASB 9 Financial Instruments AASB 9 includes revised guidance on the classification and measurement of financial instruments, including a new expected credit loss model for calculating impairment on financial assets, and the new general hedge accounting requirements. AASB 9 is effective for annual reporting periods beginning on or after 1 January 2018. The group is assessing the potential impact on its consolidated financial statements resulting from the application of AASB 9.
(ii) AASB 15 Revenue from Contracts with Customers
AASB 15 establishes a comprehensive framework for determining whether, how much and when revenue is recognised. It replaces existing revenue recognition guidance, including AASB 118 Revenue, AASB 111 Construction Contracts and IFRIC 13 Customer Loyalty Programmes. AASB 15 is effective for annual reporting periods beginning on or after 1 January 2017, with early adoption permitted. 2. CRITICAL ACCOUNTING ESTIMATES AND JUDGEMENTS Estimates, assumptions and judgements may be used to assess the measurement of certain items of income and expense, and assets and liabilities. Such estimates, assumptions and judgements are regularly evaluated and are based on historical experience and other factors, including expectations of future events that are believed to be reasonable under the circumstances. Where estimates and assumptions are made concerning the future, the resulting accounting estimates may not equal the related actual outcome. The estimates and assumptions which give rise to a risk of causing an adjustment to the carrying amounts of assets and liabilities within the next financial year are discussed below. Impairment of goodwill The group tests annually whether goodwill has suffered any impairment, in accordance with the accounting policy stated in note 1(h). The recoverable amounts of cash-generating units have been determined based on value-in-use calculations as described in note 15. 3. FINANCIAL RISK MANAGEMENT Overview The group has exposure to the following risks from their use of financial instruments: (a) Market risk (b) Credit risk (c) Liquidity risk This note presents information about the group’s exposure to each of the above risks, the group’s objectives, policies and processes for measuring and managing risk, and the group’s management of capital. Risk management framework The board of directors has overall responsibility for the establishment and oversight of the risk management framework. Risk management is carried out by the director responsible for finance under the guidance of the board of directors. The board of directors considers principles for overall risk management, as well as determining policies covering specific areas, such as mitigating interest rate and credit risks and investing excess liquidity. The group’s risk management policies are established to identify and analyse the risks faced by the group. These policies are reviewed regularly to reflect changes in market conditions and the group’s activities. (a) Market risk i) Price risk The group is exposed to equity securities price risk. This arises from investments held by the group and classified on the balance sheet as available-for-sale.
Notes to the Financial Statements
Page 22
3. FINANCIAL RISK MANAGEMENT (continued) The price risk for listed and unlisted securities is immaterial in terms of the possible impact on profit or loss or total equity. Therefore no sensitivity analysis is completed. The group is not exposed to commodity price risk, or foreign exchange risk from currency exposure. (ii) Cash flow and fair value interest rate risk The group’s interest rate risk arises from borrowings. Borrowings issued at variable rates expose the group to cash flow interest rate risk. Borrowings issued at fixed rates expose the group to fair value interest rate risk. At the year end, 15% (2014 – 13.93%) of borrowings were at fixed rates. (iii) Borrowings and cash and cash equivalents At the reporting date the group had the following borrowings and cash and cash equivalents. Consolidated Weighted
average interest rate
2015 %
2015 $
Weighted average
interest rate 2014
%
2014 $
Bank loans and other loans 3.12 62,635,000 3.65 32,000,000 Cash and cash equivalents 2.22 6,100,802 2.38 2,251,430 Hire purchase liabilities 4.76 4,029,682 5.44 5,180,004 An analysis by maturities is provided in 3(c) below. The group manages interest rate risk by assessing the appropriateness of fixed or floating rate debt when funding is required. The group monitors loan covenants on a regular basis to ensure compliance with agreements. Group sensitivity The group’s main interest rate risk arises from loans and cash and cash equivalents. At 30 June 2015, if the interest rates had changed by -/+ 100 basis points from the year-end rates with all other variables held constant, post-tax profit for the year would have been higher/lower by $438,445 (2014 - change of 100bps: $224,000 higher/lower) for loans and higher/lower by $42,706 (2014 - change of 100bps: $15,760 higher/lower) for cash and cash equivalents, mainly as a result of higher/lower interest expense from borrowings and higher/lower interest income from cash and cash equivalents. (b) Credit risk Credit risk is managed on a group basis. Credit risk arises from cash and cash equivalents and deposits with banks and financial institutions, as well as credit exposures to wholesale and retail customers, including outstanding receivables and committed transactions. The group has policies in place to ensure that sales of products and services are made to customers with an appropriate credit history. The group has no significant concentrations of credit risk. Cash transactions are limited to high credit quality financial institutions. The group has policies that limit the amount of credit exposure to any one financial institution. There is no independent rating of individual customers. Financial institutions have credit ratings of AA* and higher at 30 June 2015. Risk control assesses the credit quality of the customer, taking into account its financial position, past experience and other factors. Customers that are graded as “high risk” are placed on a restricted customer list and monitored on a weekly basis. Receivables balances are monitored on an ongoing basis. *Standard and Poor credit rating
Notes to the Financial Statements
Page 23
3. FINANCIAL RISK MANAGEMENT (continued) The maximum exposure to credit risk at the reporting date is the carrying amount of the financial assets as follows: Consolidated 2015
$ 2014
$ Cash and cash equivalents 6,100,802 2,251,430 Trade receivables 17,201,595 20,028,997 Other receivables 1,597,013 397,503 24,899,410 22,677,930 Trade receivables are non-interest bearing and terms of trade are 30 days from month end. At 30 June 2015, 2.84% (2014 – 6.65%) of trade receivables of the group exceed 30 days. Other receivables are non-interest bearing and have repayment terms exceeding 30 days but are not considered impaired. The ageing of receivables that are past due but not impaired at the reporting date is as follows: Past due but not impaired 30-60 days
$ > 60 days
$ Total
$ 2015 Consolidated Trade receivables 259,957 248,648 508,605 Other - 23,578 23,578 Total 259,957 272,226 532,183 2014 Consolidated Trade receivables 1,874,101 535,352 2,409,453 Total 1,874,101 535,352 2,409,453 At the reporting date the group has impaired trade receivables of $91,400 (2014 - $82,676) (refer note 10). The individually impaired receivables mainly relate to customers which are in unexpectedly difficult economic situations and they were fully provided for at reporting date. The ageing of the impaired receivables is as follows: Consolidated 2015
$ 2014
$ 1 to 30 days 20,621 4,052 30 to 60 days 11,219 43,143 Over 60 days 59,560 35,481 Total 91,400 82,676 Provision for impairment of trade receivables Movements in the provision for impairment of receivables are as follows: Balance 1 July 82,676 98,566 Provision for impairment recognised during the year 91,380 81,649 Receivables written off during the year as uncollectable (23,569) (61,636) Unused amount reversed (59,087) (35,903) Balance 30 June 91,400 82,676 The creation and release of the provision for impaired receivables has been included in ‘other expenses’ in profit or loss. Amounts charged to the allowance account are generally written off when there is no expectation of recovering cash.
Notes to the Financial Statements
Page 24
3. FINANCIAL RISK MANAGEMENT (continued) (c) Liquidity risk Prudent liquidity risk management implies maintaining sufficient cash and marketable securities and the availability of funding through an adequate amount of committed credit facilities. The group manages liquidity risk by continuously monitoring forecast and actual cash flows and matching the maturity profiles of current financial assets and liabilities. Due to the dynamic nature of the underlying businesses, the board of directors aims at maintaining flexibility in funding by keeping committed credit lines available with a variety of counterparties. On 30 June 2015 the Company obtained approval from its bankers to increase the facility limit to $86,594,000 and to extend the repayment term to 30 September 2018. This was executed in August 2015. Surplus funds are generally only invested in instruments that are tradeable in highly liquid markets. Financing arrangements The group had access to the following undrawn borrowing facilities at the reporting date: Consolidated 2015
$ 2014
$ Floating rate Expiring within one year (bill facility) - 7,750,000 Expiring beyond one year (bill facility) - 6,000,000 - 13,750,000 The bank loan facilities may be drawn at any time and are subject to annual review. The bill acceptance facilities have defined maturity dates. Subject to the continuance of satisfactory credit ratings, the bank loan facilities may be drawn at any time. Maturities of financial liabilities The table below sets out the group’s financial liabilities into relevant maturity groupings based on the remaining period at the reporting date to the contractual maturity date. The amounts disclosed in the table are the contractual undiscounted cash flows. Maturity Consolidated
1 year or less
$ 1 to 2 years
$ 2 to 5 years
$
Total contractual cash flows
$
Carrying amount
$ 2015 Non-interest bearing 25,212,997 1,500,000 - 26,712,997 26,712,997 Variable rate 1,661,055 1,661,055 54,280,439 57,602,549 52,635,000 Fixed rate 2,974,454 1,356,588 10,581,474 14,912,516 14,029,682 Total 29,848,506 4,517,643 64,861,913 99,228,062 93,377,679 2014 Non-interest bearing 11,733,802 - - 11,733,802 11,733,802 Variable rate 1,167,400 23,112,619 10,796,467 35,076,486 32,000,000 Fixed rate 2,709,499 2,395,366 370,804 5,475,669 5,180,004 Total 15,610,701 25,507,985 11,167,271 52,285,957 48,913,806 (d) Fair value estimation The fair value of financial assets and financial liabilities must be estimated for recognition and measurement or for disclosure purposes. The group has not disclosed the fair value for financial instruments such as short-term trade receivables and payables, because their carrying amounts are a reasonable approximation of fair values. The following tables present the group’s assets measured and recognised at fair value at 30 June 2015. Consolidated 2015 2014 Level 1 Level 1 Available-for-sale financial assets $ $ Equity securities 91,566 77,409
Notes to the Financial Statements
Page 25
3. FINANCIAL RISK MANAGEMENT (continued) Capital risk management The group’s objectives when managing capital are to safeguard their ability to continue as a going concern, so that they continue to provide returns for shareholders and benefits for other stakeholders and to maintain an optimal capital structure to reduce the cost of capital. In order to maintain or adjust the capital structure, the group may adjust the amount of dividends paid to shareholders, return capital to shareholders, issue new shares or sell assets to reduce debt. Consistently with others in the industry, the group monitors capital on the basis of the gearing ratio. This ratio is calculated as net debt divided by total capital. Net debt is calculated as total borrowings (including ‘borrowings’ and ‘trade and other payables’ as shown in the statement of financial position) less cash and cash equivalents. Total capital is calculated as ‘equity’ as shown in the statement of financial position plus net debt. During 2015, the group’s gearing ratio increased due to acquisition of business and property offset by a share issue and shareholders taking up the dividend reinvestment plan. The gearing ratios at 30 June 2015 and 30 June 2014 were as follows: Consolidated Notes 2015 2014 $ $ Total payables and borrowings 16,17,18, 32 93,377,679 48,913,806 Less: cash and cash equivalents 9 (6,100,802) (2,251,430) Net debt 87,276,877 46,662,376 Total equity 62,159,652 58,102,933 Total capital 149,436,529 104,765,309 Gearing ratio 58% 45% 4. SEGMENT INFORMATION (a) Description of segments Management has determined the operating segments based on the reports reviewed by the Chief Executive Officer (CEO). The group’s CEO considers the business from a product and services perspective and has identified three reportable segments: logistics, transport and property. The reportable segments operate solely in Australia and are involved in the following operations: � Transport services - includes the provision of courier, taxi truck, parcel distribution and fleet management. � Logistics services - includes the provision of warehousing and distribution, supply based management services and
document storage services. � Property - rental of owner-occupied and investment property. “Other” segments include the manufacturing of plastic products (sold during the period) and provision of security services. Neither of these segments meets any of the quantitative thresholds for determining reportable segments. The group does not have a single external customer which represents greater than 10% of the entity’s revenue. The group’s CEO assesses the performance of the operating segments based on segment profit before income tax, as included in internal management reports. Segment profit is used to measure performance as management believes that such information is the most relevant in evaluating the results of certain segments relative to other entities that operate within these industries. (b) Accounting policies Segment information is prepared in conformity with the accounting policies of the entity as disclosed in note 1(c) and accounting standard AASB 8 Operating Segments.
Notes to the Financial Statements
Page 26
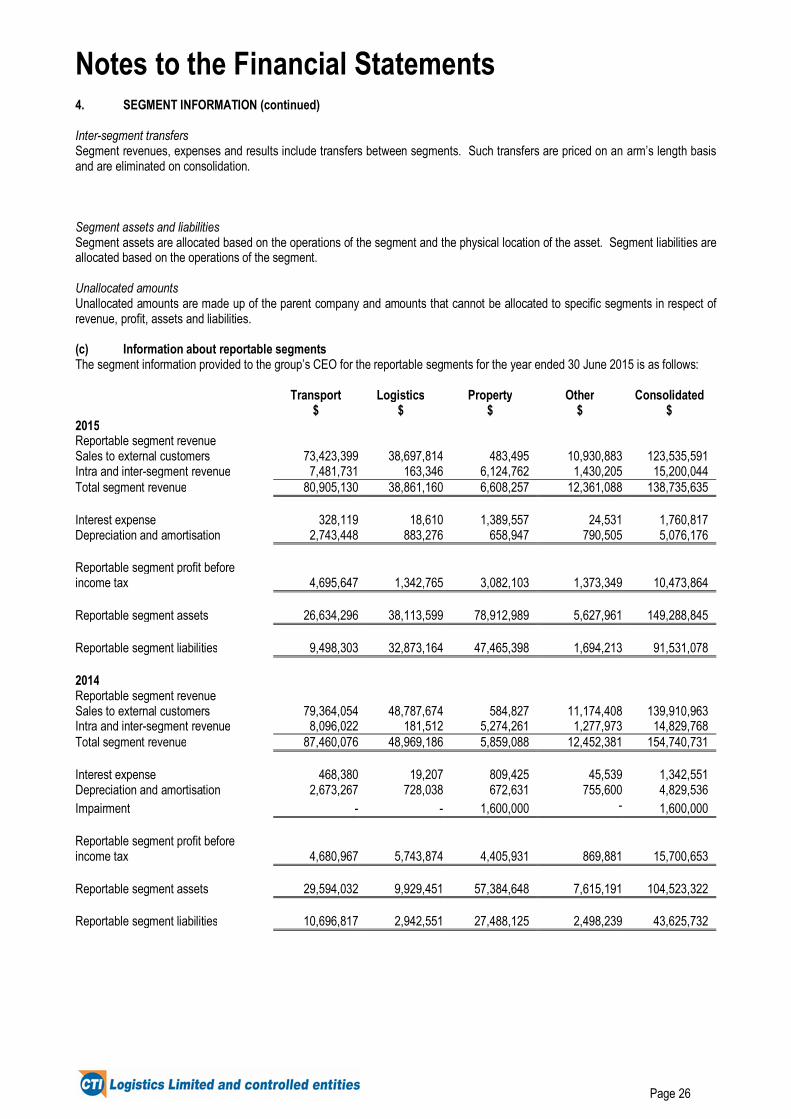
4. SEGMENT INFORMATION (continued) Inter-segment transfers Segment revenues, expenses and results include transfers between segments. Such transfers are priced on an arm’s length basis and are eliminated on consolidation. Segment assets and liabilities Segment assets are allocated based on the operations of the segment and the physical location of the asset. Segment liabilities are allocated based on the operations of the segment. Unallocated amounts Unallocated amounts are made up of the parent company and amounts that cannot be allocated to specific segments in respect of revenue, profit, assets and liabilities. (c) Information about reportable segments The segment information provided to the group’s CEO for the reportable segments for the year ended 30 June 2015 is as follows:
Transport
$ Logistics
$ Property
$ Other
$ Consolidated
$ 2015 Reportable segment revenue Sales to external customers 73,423,399 38,697,814 483,495 10,930,883 123,535,591 Intra and inter-segment revenue 7,481,731 163,346 6,124,762 1,430,205 15,200,044 Total segment revenue 80,905,130 38,861,160 6,608,257 12,361,088 138,735,635 Interest expense 328,119 18,610 1,389,557 24,531 1,760,817 Depreciation and amortisation 2,743,448 883,276 658,947 790,505 5,076,176 Reportable segment profit before income tax 4,695,647 1,342,765 3,082,103 1,373,349 10,473,864 Reportable segment assets 26,634,296 38,113,599 78,912,989 5,627,961 149,288,845 Reportable segment liabilities 9,498,303 32,873,164 47,465,398 1,694,213 91,531,078 2014 Reportable segment revenue Sales to external customers 79,364,054 48,787,674 584,827 11,174,408 139,910,963 Intra and inter-segment revenue 8,096,022 181,512 5,274,261 1,277,973 14,829,768 Total segment revenue 87,460,076 48,969,186 5,859,088 12,452,381 154,740,731 Interest expense 468,380 19,207 809,425 45,539 1,342,551 Depreciation and amortisation 2,673,267 728,038 672,631 755,600 4,829,536 Impairment - - 1,600,000 - 1,600,000 Reportable segment profit before income tax 4,680,967 5,743,874 4,405,931 869,881 15,700,653 Reportable segment assets 29,594,032 9,929,451 57,384,648 7,615,191 104,523,322 Reportable segment liabilities 10,696,817 2,942,551 27,488,125 2,498,239 43,625,732
Notes to the Financial Statements
Page 27
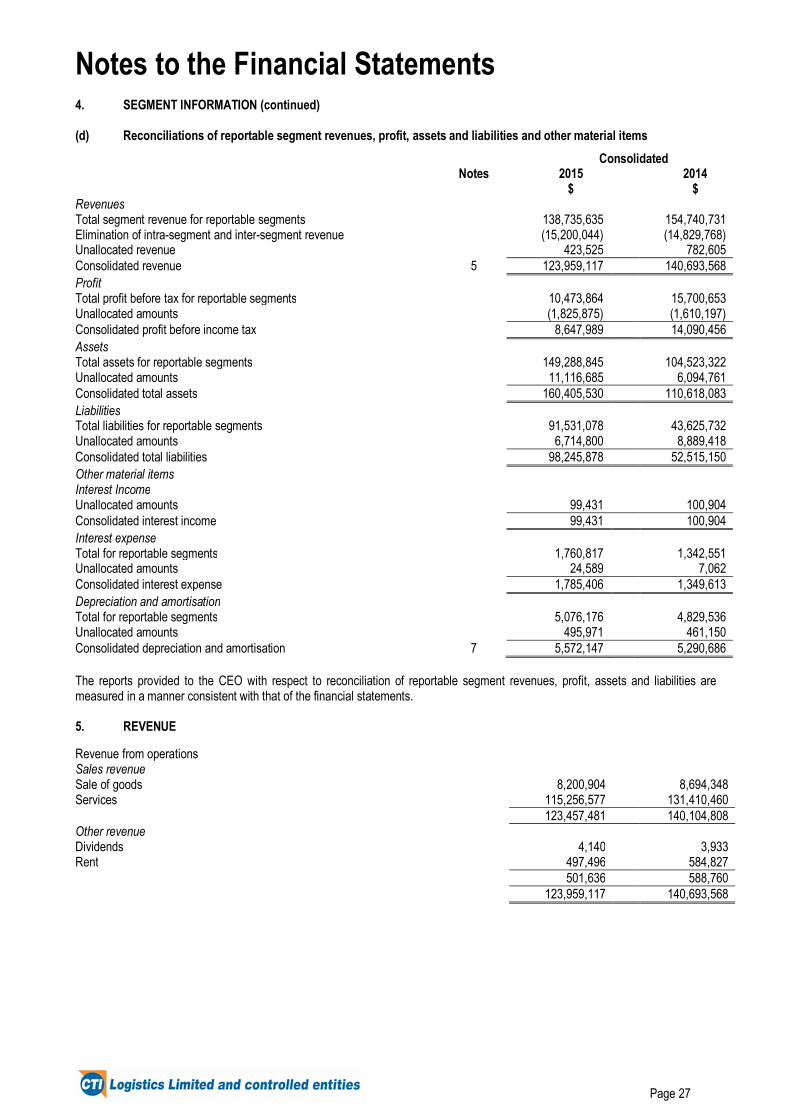
4. SEGMENT INFORMATION (continued) (d) Reconciliations of reportable segment revenues, profit, assets and liabilities and other material items
Consolidated
Notes 2015 $
2014 $
Revenues Total segment revenue for reportable segments 138,735,635 154,740,731 Elimination of intra-segment and inter-segment revenue (15,200,044) (14,829,768) Unallocated revenue 423,525 782,605 Consolidated revenue 5 123,959,117 140,693,568 Profit Total profit before tax for reportable segments 10,473,864 15,700,653 Unallocated amounts (1,825,875) (1,610,197) Consolidated profit before income tax 8,647,989 14,090,456 Assets Total assets for reportable segments 149,288,845 104,523,322 Unallocated amounts 11,116,685 6,094,761 Consolidated total assets 160,405,530 110,618,083 Liabilities Total liabilities for reportable segments 91,531,078 43,625,732 Unallocated amounts 6,714,800 8,889,418 Consolidated total liabilities 98,245,878 52,515,150 Other material items Interest Income Unallocated amounts 99,431 100,904 Consolidated interest income 99,431 100,904 Interest expense Total for reportable segments 1,760,817 1,342,551 Unallocated amounts 24,589 7,062 Consolidated interest expense 1,785,406 1,349,613 Depreciation and amortisation Total for reportable segments 5,076,176 4,829,536 Unallocated amounts 495,971 461,150 Consolidated depreciation and amortisation 7 5,572,147 5,290,686 The reports provided to the CEO with respect to reconciliation of reportable segment revenues, profit, assets and liabilities are measured in a manner consistent with that of the financial statements. 5. REVENUE Revenue from operations Sales revenue Sale of goods 8,200,904 8,694,348 Services 115,256,577 131,410,460 123,457,481 140,104,808 Other revenue Dividends 4,140 3,933 Rent 497,496 584,827 501,636 588,760 123,959,117 140,693,568
Notes to the Financial Statements
Page 28
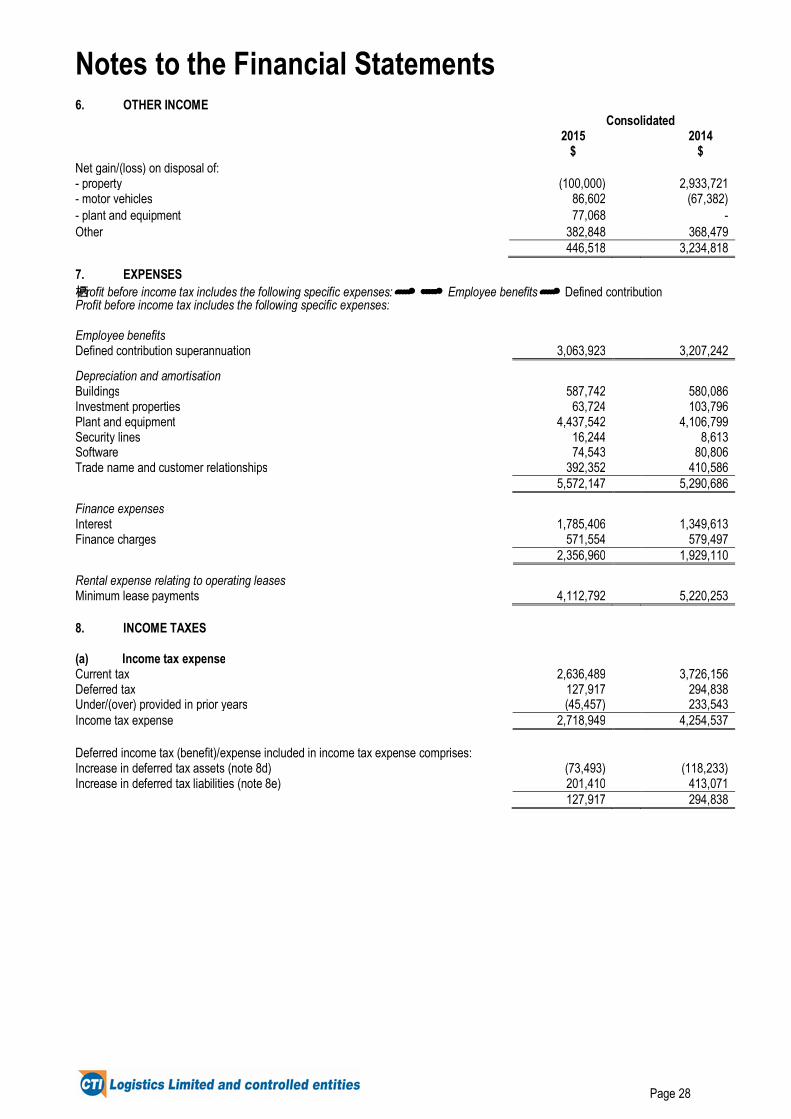
6. OTHER INCOME Consolidated
2015
$ 2014
$ Net gain/(loss) on disposal of: - property (100,000) 2,933,721 - motor vehicles 86,602 (67,382) - plant and equipment 77,068 - Other 382,848 368,479 446,518 3,234,818
7. EXPENSES 栖Profit before income tax includes the following specific expenses:������ ������ Employee benefits������ Defined contribution Profit before income tax includes the following specific expenses: Employee benefits Defined contribution superannuation 3,063,923 3,207,242
Depreciation and amortisation Buildings 587,742 580,086 Investment properties 63,724 103,796 Plant and equipment 4,437,542 4,106,799 Security lines 16,244 8,613 Software 74,543 80,806 Trade name and customer relationships 392,352 410,586 5,572,147 5,290,686
Finance expenses Interest 1,785,406 1,349,613 Finance charges 571,554 579,497 2,356,960 1,929,110
Rental expense relating to operating leases Minimum lease payments 4,112,792 5,220,253 8. INCOME TAXES (a) Income tax expense Current tax 2,636,489 3,726,156 Deferred tax 127,917 294,838 Under/(over) provided in prior years (45,457) 233,543 Income tax expense 2,718,949 4,254,537 Deferred income tax (benefit)/expense included in income tax expense comprises: Increase in deferred tax assets (note 8d) (73,493) (118,233) Increase in deferred tax liabilities (note 8e) 201,410 413,071 127,917 294,838
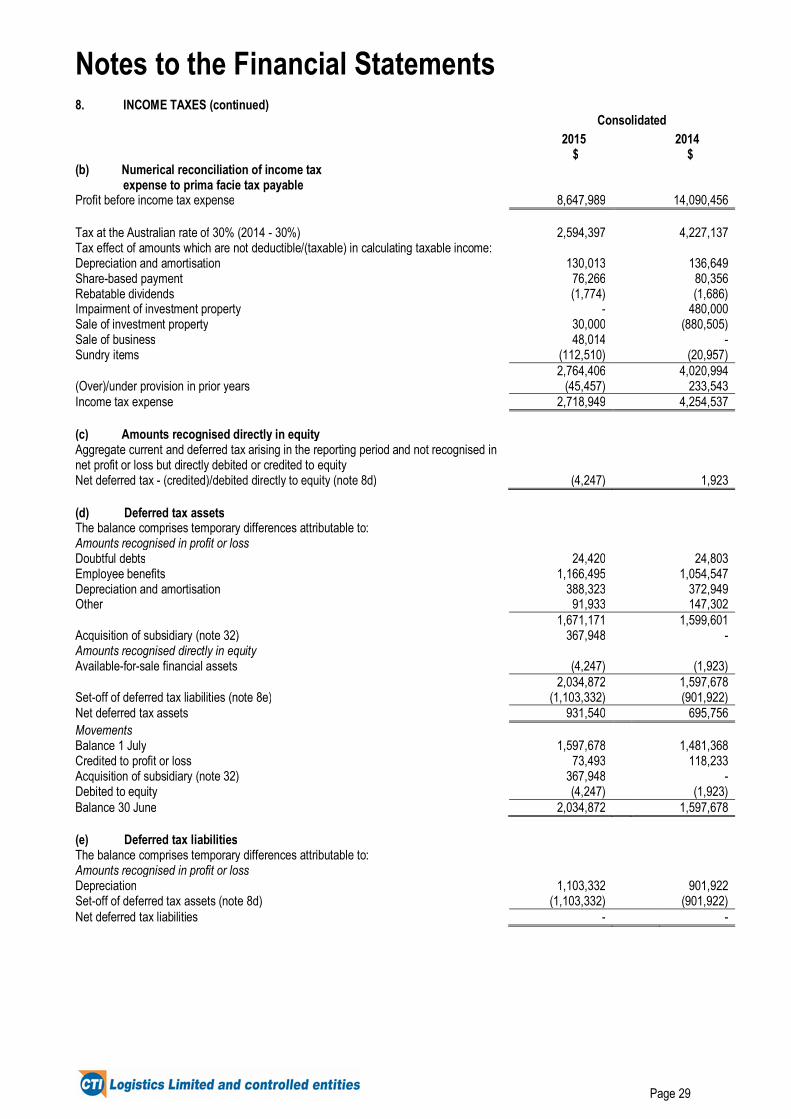
Notes to the Financial Statements
Page 29
8. INCOME TAXES (continued) Consolidated 2015 2014 $ $ (b) Numerical reconciliation of income tax expense to prima facie tax payable Profit before income tax expense 8,647,989 14,090,456 Tax at the Australian rate of 30% (2014 - 30%) 2,594,397 4,227,137 Tax effect of amounts which are not deductible/(taxable) in calculating taxable income: Depreciation and amortisation 130,013 136,649 Share-based payment 76,266 80,356 Rebatable dividends (1,774) (1,686) Impairment of investment property - 480,000 Sale of investment property 30,000 (880,505) Sale of business 48,014 - Sundry items (112,510) (20,957) 2,764,406 4,020,994 (Over)/under provision in prior years (45,457) 233,543 Income tax expense 2,718,949 4,254,537 (c) Amounts recognised directly in equity Aggregate current and deferred tax arising in the reporting period and not recognised in net profit or loss but directly debited or credited to equity Net deferred tax - (credited)/debited directly to equity (note 8d) (4,247) 1,923 (d) Deferred tax assets The balance comprises temporary differences attributable to: Amounts recognised in profit or loss Doubtful debts 24,420 24,803 Employee benefits 1,166,495 1,054,547 Depreciation and amortisation 388,323 372,949 Other 91,933 147,302 1,671,171 1,599,601 Acquisition of subsidiary (note 32) 367,948 - Amounts recognised directly in equity Available-for-sale financial assets (4,247) (1,923) 2,034,872 1,597,678 Set-off of deferred tax liabilities (note 8e) (1,103,332) (901,922) Net deferred tax assets 931,540 695,756 Movements Balance 1 July 1,597,678 1,481,368 Credited to profit or loss 73,493 118,233 Acquisition of subsidiary (note 32) 367,948 - Debited to equity (4,247) (1,923) Balance 30 June 2,034,872 1,597,678 (e) Deferred tax liabilities The balance comprises temporary differences attributable to: Amounts recognised in profit or loss Depreciation 1,103,332 901,922 Set-off of deferred tax assets (note 8d) (1,103,332) (901,922) Net deferred tax liabilities - -
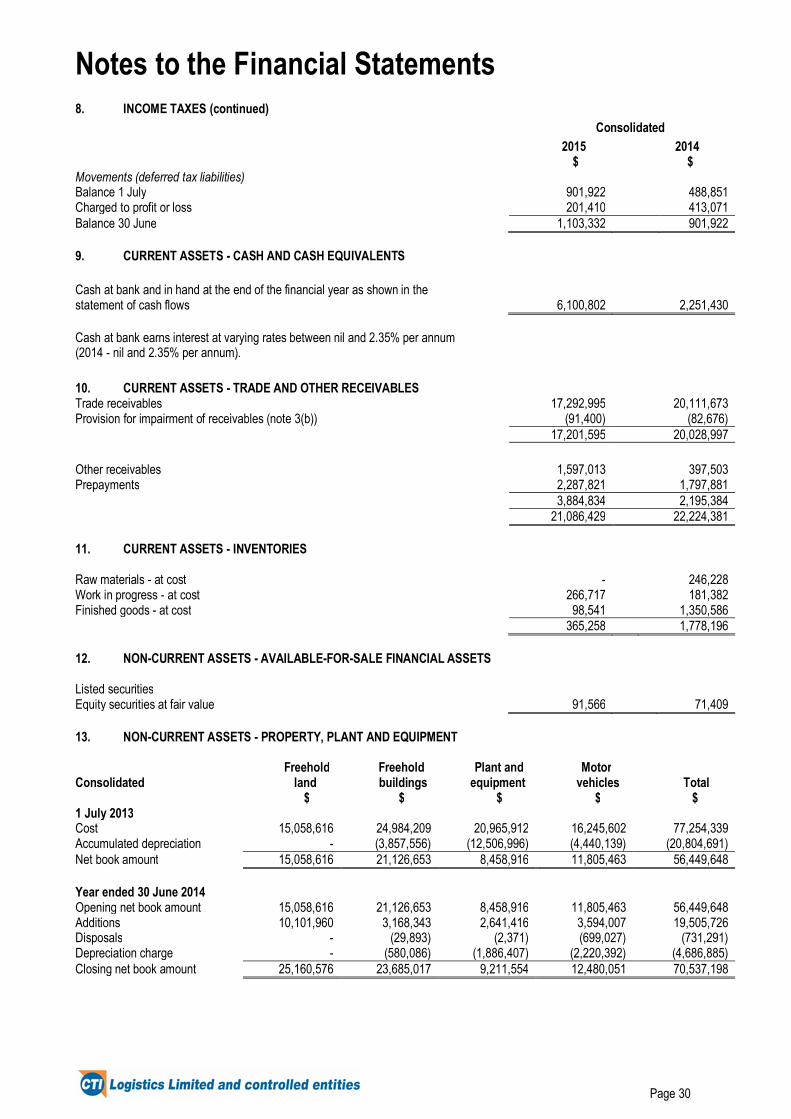
Notes to the Financial Statements
Page 30
8. INCOME TAXES (continued) Consolidated 2015 2014 $ $ Movements (deferred tax liabilities) Balance 1 July 901,922 488,851 Charged to profit or loss 201,410 413,071 Balance 30 June 1,103,332 901,922 9. CURRENT ASSETS - CASH AND CASH EQUIVALENTS Cash at bank and in hand at the end of the financial year as shown in the statement of cash flows 6,100,802 2,251,430 Cash at bank earns interest at varying rates between nil and 2.35% per annum (2014 - nil and 2.35% per annum).
10. CURRENT ASSETS - TRADE AND OTHER RECEIVABLES Trade receivables 17,292,995 20,111,673 Provision for impairment of receivables (note 3(b)) (91,400) (82,676) 17,201,595 20,028,997 Other receivables 1,597,013 397,503 Prepayments 2,287,821 1,797,881 3,884,834 2,195,384 21,086,429 22,224,381 11. CURRENT ASSETS - INVENTORIES Raw materials - at cost - 246,228 Work in progress - at cost 266,717 181,382 Finished goods - at cost 98,541 1,350,586 365,258 1,778,196 12. NON-CURRENT ASSETS - AVAILABLE-FOR-SALE FINANCIAL ASSETS
Listed securities Equity securities at fair value 91,566 71,409 13. NON-CURRENT ASSETS - PROPERTY, PLANT AND EQUIPMENT
Consolidated Freehold
land Freehold buildings
Plant and equipment
Motor vehicles
Total
$ $ $ $ $ 1 July 2013 Cost 15,058,616 24,984,209 20,965,912 16,245,602 77,254,339 Accumulated depreciation - (3,857,556) (12,506,996) (4,440,139) (20,804,691) Net book amount 15,058,616 21,126,653 8,458,916 11,805,463 56,449,648 Year ended 30 June 2014 Opening net book amount 15,058,616 21,126,653 8,458,916 11,805,463 56,449,648 Additions 10,101,960 3,168,343 2,641,416 3,594,007 19,505,726 Disposals - (29,893) (2,371) (699,027) (731,291) Depreciation charge - (580,086) (1,886,407) (2,220,392) (4,686,885) Closing net book amount 25,160,576 23,685,017 9,211,554 12,480,051 70,537,198
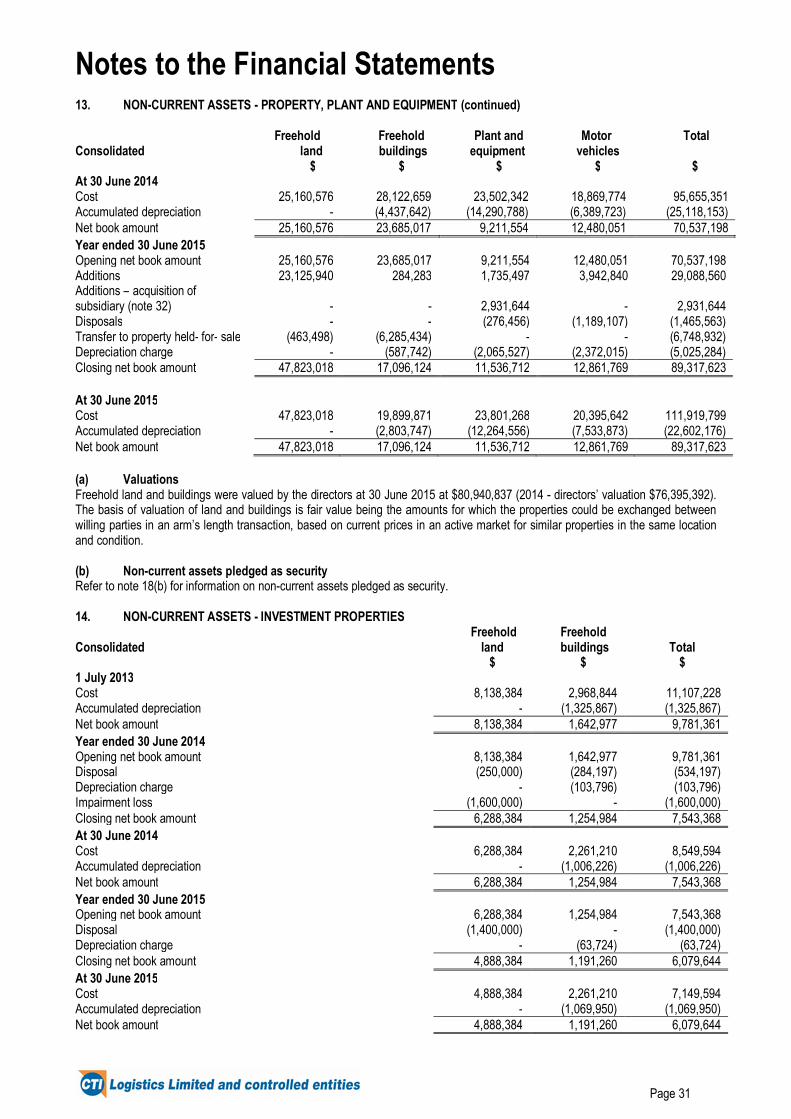
Notes to the Financial Statements
Page 31
13. NON-CURRENT ASSETS - PROPERTY, PLANT AND EQUIPMENT (continued)
Consolidated
Freehold land
Freehold buildings
Plant and equipment
Motor vehicles
Total
$ $ $ $ $ At 30 June 2014 Cost 25,160,576 28,122,659 23,502,342 18,869,774 95,655,351 Accumulated depreciation - (4,437,642) (14,290,788) (6,389,723) (25,118,153) Net book amount 25,160,576 23,685,017 9,211,554 12,480,051 70,537,198 Year ended 30 June 2015 Opening net book amount 25,160,576 23,685,017 9,211,554 12,480,051 70,537,198 Additions 23,125,940 284,283 1,735,497 3,942,840 29,088,560 Additions – acquisition of subsidiary (note 32) - - 2,931,644 -
2,931,644
Disposals - - (276,456) (1,189,107) (1,465,563) Transfer to property held- for- sale (463,498) (6,285,434) - - (6,748,932) Depreciation charge - (587,742) (2,065,527) (2,372,015) (5,025,284) Closing net book amount 47,823,018 17,096,124 11,536,712 12,861,769 89,317,623 At 30 June 2015 Cost 47,823,018 19,899,871 23,801,268 20,395,642 111,919,799 Accumulated depreciation - (2,803,747) (12,264,556) (7,533,873) (22,602,176) Net book amount 47,823,018 17,096,124 11,536,712 12,861,769 89,317,623 (a) Valuations Freehold land and buildings were valued by the directors at 30 June 2015 at $80,940,837 (2014 - directors’ valuation $76,395,392). The basis of valuation of land and buildings is fair value being the amounts for which the properties could be exchanged between willing parties in an arm’s length transaction, based on current prices in an active market for similar properties in the same location and condition. (b) Non-current assets pledged as security Refer to note 18(b) for information on non-current assets pledged as security. 14. NON-CURRENT ASSETS - INVESTMENT PROPERTIES
Consolidated Freehold
land Freehold buildings Total
$ $ $ 1 July 2013 Cost 8,138,384 2,968,844 11,107,228 Accumulated depreciation - (1,325,867) (1,325,867) Net book amount 8,138,384 1,642,977 9,781,361 Year ended 30 June 2014 Opening net book amount 8,138,384 1,642,977 9,781,361 Disposal (250,000) (284,197) (534,197) Depreciation charge - (103,796) (103,796) Impairment loss (1,600,000) - (1,600,000) Closing net book amount 6,288,384 1,254,984 7,543,368 At 30 June 2014 Cost 6,288,384 2,261,210 8,549,594 Accumulated depreciation - (1,006,226) (1,006,226) Net book amount 6,288,384 1,254,984 7,543,368 Year ended 30 June 2015 Opening net book amount 6,288,384 1,254,984 7,543,368 Disposal (1,400,000) - (1,400,000) Depreciation charge - (63,724) (63,724) Closing net book amount 4,888,384 1,191,260 6,079,644 At 30 June 2015 Cost 4,888,384 2,261,210 7,149,594 Accumulated depreciation - (1,069,950) (1,069,950) Net book amount 4,888,384 1,191,260 6,079,644
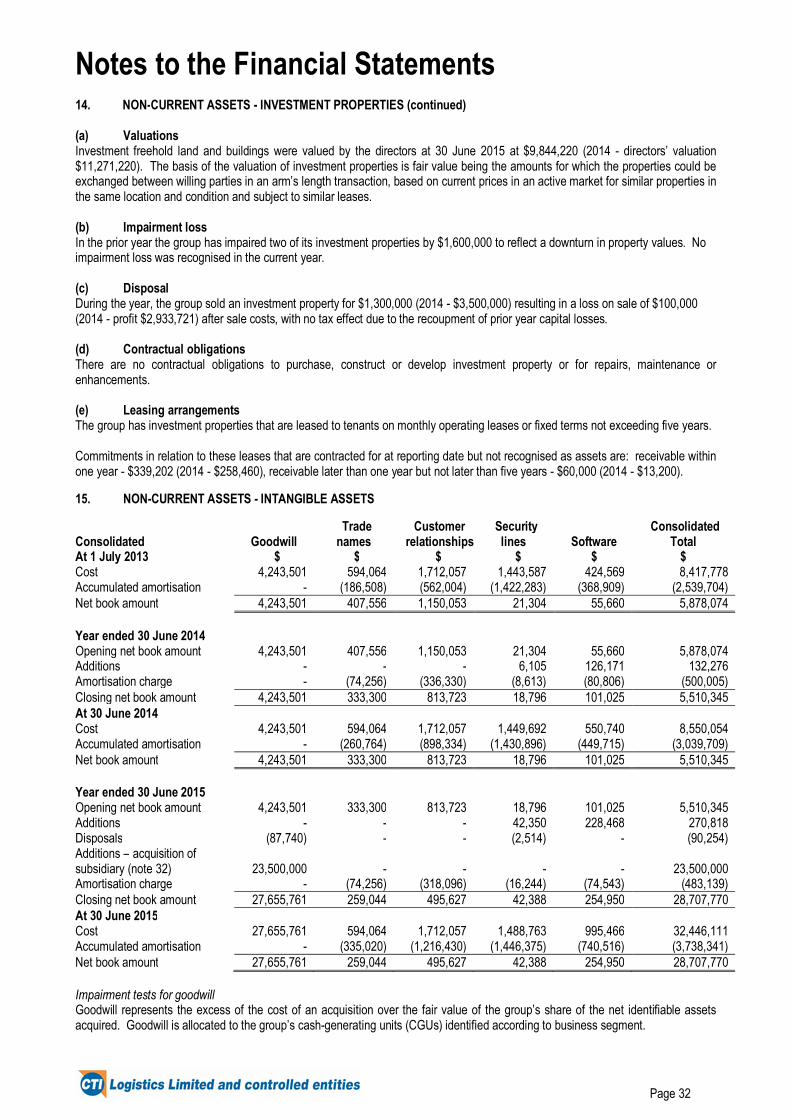
Notes to the Financial Statements
Page 32
14. NON-CURRENT ASSETS - INVESTMENT PROPERTIES (continued) (a) Valuations Investment freehold land and buildings were valued by the directors at 30 June 2015 at $9,844,220 (2014 - directors’ valuation $11,271,220). The basis of the valuation of investment properties is fair value being the amounts for which the properties could be exchanged between willing parties in an arm’s length transaction, based on current prices in an active market for similar properties in the same location and condition and subject to similar leases. (b) Impairment loss In the prior year the group has impaired two of its investment properties by $1,600,000 to reflect a downturn in property values. No impairment loss was recognised in the current year. (c) Disposal During the year, the group sold an investment property for $1,300,000 (2014 - $3,500,000) resulting in a loss on sale of $100,000 (2014 - profit $2,933,721) after sale costs, with no tax effect due to the recoupment of prior year capital losses. (d) Contractual obligations There are no contractual obligations to purchase, construct or develop investment property or for repairs, maintenance or enhancements. (e) Leasing arrangements The group has investment properties that are leased to tenants on monthly operating leases or fixed terms not exceeding five years. Commitments in relation to these leases that are contracted for at reporting date but not recognised as assets are: receivable within one year - $339,202 (2014 - $258,460), receivable later than one year but not later than five years - $60,000 (2014 - $13,200). 15. NON-CURRENT ASSETS - INTANGIBLE ASSETS
Consolidated Goodwill Trade names
Customer relationships
Security lines Software
Consolidated Total
At 1 July 2013 $ $ $ $ $ $ Cost 4,243,501 594,064 1,712,057 1,443,587 424,569 8,417,778 Accumulated amortisation - (186,508) (562,004) (1,422,283) (368,909) (2,539,704) Net book amount 4,243,501 407,556 1,150,053 21,304 55,660 5,878,074 Year ended 30 June 2014 Opening net book amount 4,243,501 407,556 1,150,053 21,304 55,660 5,878,074 Additions - - - 6,105 126,171 132,276 Amortisation charge - (74,256) (336,330) (8,613) (80,806) (500,005) Closing net book amount 4,243,501 333,300 813,723 18,796 101,025 5,510,345 At 30 June 2014 Cost 4,243,501 594,064 1,712,057 1,449,692 550,740 8,550,054 Accumulated amortisation - (260,764) (898,334) (1,430,896) (449,715) (3,039,709) Net book amount 4,243,501 333,300 813,723 18,796 101,025 5,510,345 Year ended 30 June 2015 Opening net book amount 4,243,501 333,300 813,723 18,796 101,025 5,510,345 Additions - - - 42,350 228,468 270,818 Disposals (87,740) - - (2,514) - (90,254) Additions – acquisition of subsidiary (note 32) 23,500,000 - - -
- 23,500,000
Amortisation charge - (74,256) (318,096) (16,244) (74,543) (483,139) Closing net book amount 27,655,761 259,044 495,627 42,388 254,950 28,707,770 At 30 June 2015 Cost 27,655,761 594,064 1,712,057 1,488,763 995,466 32,446,111 Accumulated amortisation - (335,020) (1,216,430) (1,446,375) (740,516) (3,738,341) Net book amount 27,655,761 259,044 495,627 42,388 254,950 28,707,770 Impairment tests for goodwill Goodwill represents the excess of the cost of an acquisition over the fair value of the group’s share of the net identifiable assets acquired. Goodwill is allocated to the group’s cash-generating units (CGUs) identified according to business segment.

Notes to the Financial Statements
Page 33
15. NON-CURRENT ASSETS - INTANGIBLE ASSETS (continued) The segment-level summary of goodwill allocation is presented below. Transport Logistics Property Other Total
$ $ $ $ $
2015 4,111,690 23,500,000 - 44,071 27,655,761 2014 4,111,690 - - 131,811 4,243,501 The recoverable amount of a CGU is determined based on value-in-use calculations which are based on budgets. These calculations use cash flow projections based on current sustainable earnings and financial budgets approved by management. Cash flows indicate that the carrying amounts are substantially recoverable and that there is no impairment. Key assumptions used for value-in-use calculations Growth rate of 3.5% (2014-3.5%) based on the inflation rate is used to extrapolate cash flows beyond the one year budget for an additional four years and a terminal value was calculated after 5 years. Nominal post tax discount rate of 10.5% (2014-10.5%), (equivalent nominal pre-tax rate 15% (2014 - 15%)), is used to discount the forecast future attributable post-tax cash flows when performing the value-in-use calculations. The same post-tax and pre-tax discount rates were applied in both 2015 and 2014. 16. CURRENT LIABILITIES - TRADE AND OTHER PAYABLES Consolidated 2015 2014 $ $ Trade and other payables 9,864,161 11,532,352 Deferred consideration payable (note 32) 14,178,422 - Trade payable - secured 1,170,414 201,450 25,212,997 11,733,802 17. CURRENT LIABILITIES - BORROWINGS Secured Hire purchase liabilities (note 25b) 2,574,972 2,494,848 18. NON-CURRENT LIABILITIES - BORROWINGS Secured Bank loans 62,635,000 32,000,000 Hire purchase liabilities (note 25b) 1,454,710 2,685,156 Total secured non-current interest-bearing borrowings 64,089,710 34,685,156 (a) Total secured liabilities The total secured liabilities (current and non-current) are as follows: Secured Bank loans 62,635,000 32,000,000 Hire purchase liabilities (note 25b) 4,029,682 5,180,004 Total secured liabilities 66,664,682 37,180,004 (b) Assets pledged as security Bank overdrafts and bank loans are secured by mortgages over the group’s freehold land and buildings, investment properties and fixed and floating charges over the remaining group assets. Hire purchase liabilities are effectively secured as the rights to the assets recognised in the financial statements revert to the financier in the event of default.
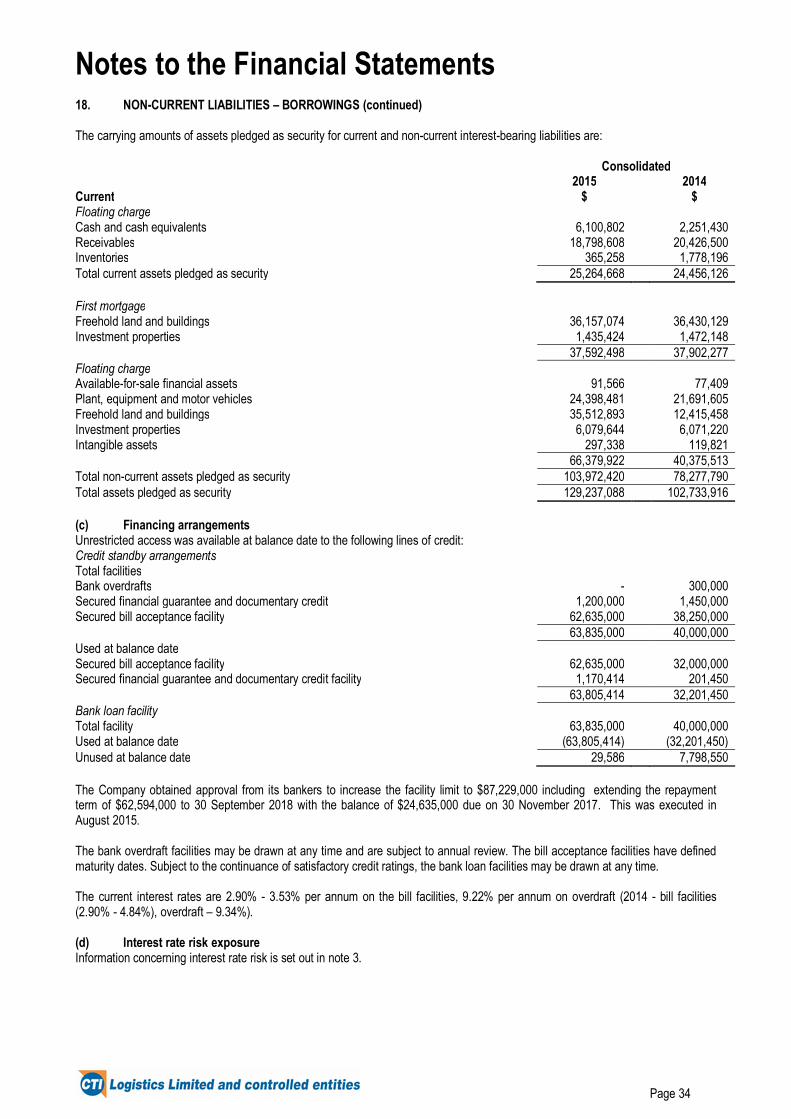
Notes to the Financial Statements
Page 34
18. NON-CURRENT LIABILITIES – BORROWINGS (continued) The carrying amounts of assets pledged as security for current and non-current interest-bearing liabilities are: Consolidated 2015 2014 Current $ $ Floating charge Cash and cash equivalents 6,100,802 2,251,430 Receivables 18,798,608 20,426,500 Inventories 365,258 1,778,196 Total current assets pledged as security 25,264,668 24,456,126 First mortgage Freehold land and buildings 36,157,074 36,430,129 Investment properties 1,435,424 1,472,148 37,592,498 37,902,277 Floating charge Available-for-sale financial assets 91,566 77,409 Plant, equipment and motor vehicles 24,398,481 21,691,605 Freehold land and buildings 35,512,893 12,415,458 Investment properties 6,079,644 6,071,220 Intangible assets 297,338 119,821 66,379,922 40,375,513 Total non-current assets pledged as security 103,972,420 78,277,790 Total assets pledged as security 129,237,088 102,733,916 (c) Financing arrangements Unrestricted access was available at balance date to the following lines of credit: Credit standby arrangements Total facilities Bank overdrafts - 300,000 Secured financial guarantee and documentary credit 1,200,000 1,450,000 Secured bill acceptance facility 62,635,000 38,250,000 63,835,000 40,000,000 Used at balance date Secured bill acceptance facility 62,635,000 32,000,000 Secured financial guarantee and documentary credit facility 1,170,414 201,450 63,805,414 32,201,450 Bank loan facility Total facility 63,835,000 40,000,000 Used at balance date (63,805,414) (32,201,450) Unused at balance date 29,586 7,798,550 The Company obtained approval from its bankers to increase the facility limit to $87,229,000 including extending the repayment term of $62,594,000 to 30 September 2018 with the balance of $24,635,000 due on 30 November 2017. This was executed in August 2015. The bank overdraft facilities may be drawn at any time and are subject to annual review. The bill acceptance facilities have defined maturity dates. Subject to the continuance of satisfactory credit ratings, the bank loan facilities may be drawn at any time. The current interest rates are 2.90% - 3.53% per annum on the bill facilities, 9.22% per annum on overdraft (2014 - bill facilities (2.90% - 4.84%), overdraft – 9.34%). (d) Interest rate risk exposure Information concerning interest rate risk is set out in note 3.
Notes to the Financial Statements
Page 35
18. NON-CURRENT LIABILITIES – BORROWINGS (continued) (e) Fair value The carrying amounts and fair values of interest-bearing liabilities at balance date are: 2015 2014 Carrying Fair Carrying Fair Consolidated amount value amount value $ $ $ $ On-balance sheet Non-traded financial liabilities Bank loans 62,635,000 62,635,000 32,000,000 32,000,000 Hire purchase liabilities 4,029,682 4,277,258 5,180,004 5,519,796 Total secured liabilities 66,664,682 66,912,258 37,180,004 37,519,796 19. NON-CURRENT LIABILITIES - PROVISIONS Consolidated 2015 2014 Employee benefits $ $ Current 3,853,124 2,749,228 Non-current 1,015,075 765,928 4,868,199 3,515,156 20. CONTRIBUTED EQUITY (a) Share capital Consolidated Ordinary shares (fully paid)
Number of shares $
At 30 June 2014 Opening balance 60,164,921 9,187,090 Shares issued 3,065,820 5,665,678 Dividend reinvestment plan 441,773 845,307 Bonus share plan 74,167 - Closing balance 63,746,681 15,698,075 At 30 June 2015 Opening balance 63,746,681 15,698,075 Shares issued (note 33) 1,428,571 2,000,000 Employee share plan 10,000 17,600 Dividend reinvestment plan 280,448 409,146 Bonus share plan 364,991 548,508 Closing balance 65,830,691 18,673,329 During the year the Company made bonus issues of 364,991(2014 – 74,167) new ordinary shares under the Company’s Bonus Share Plan. At 30 June 2015 there were 2,210,000 contingently issuable shares (2014 – 1,590,000) relating to shares issued under the Company’s Employee Share Plan (refer to note 31). (b) Ordinary shares All ordinary shares are fully paid and entitle the holder to participate in dividends and the proceeds on winding up of the Company in proportion to the number of shares held. On a show of hands every holder of ordinary shares present at a meeting in person or by proxy, is entitled to one vote, and upon a poll each share is entitled to one vote.
Notes to the Financial Statements
Page 36
21. RESERVES AND RETAINED PROFITS Consolidated 2015 2014 $ $ (a) Reserves Available-for-sale investments revaluation reserve 10,174 265 Share-based payment reserve 1,289,011 1,034,792 1,299,185 1,035,057 Movements Available-for-sale investments revaluation reserve Balance 1 July 265 (4,221) Revaluation, net of tax 9,909 4,486 Balance 30 June 10,174 265 Share-based payment reserve Balance 1 July 1,034,792 766,938 Share-based payment transactions 254,219 267,854 Balance 30 June 1,289,011 1,034,792 (b) Retained profits Movements Balance 1 July 41,369,801 36,456,648 Profit for the year 5,929,040 9,835,919 Dividends (5,111,703) (4,922,766) Balance 30 June 42,187,138 41,369,801 (c) Nature and purpose of reserves Available-for-sale investments revaluation reserve Changes in the fair value of investments, such as equities, classified as available-for-sale financial assets, are taken to the available-for-sale investments revaluation reserve, as described in note 1(l). Amounts are recognised in profit or loss when the associated assets are sold or impaired. Share-based payment reserve The share-based payment reserve comprises the expenses incurred from the issue of the Company’s shares under the Employee Share Plan. Refer to note 31 and note 1(t). 22. DIVIDENDS Parent Entity 2015 2014 $ $ (a) Ordinary shares Final dividend for the year ended 30 June 2014 of 4.0 cents (2013 – 4.0 cents) per fully paid share, paid on 31 October 2014 (2013 - 15 November 2013) Fully franked dividend (2013 - fully franked) based on tax paid @ 30% (2013 - 30%) 2,549,867 2,529,229 Less – bonus issue of ordinary shares under the Company’s Bonus Share Plan. (308,721) (71,573) 2,241,146 2,457,656 Interim dividend for the year ended 30 June 2015 of 4.0 cents (2014 – 4.0 cents) per fully paid share, paid on 17 April 2015 (2014 - 15 April 2014) Fully franked dividend (2014 - fully franked) based on tax paid @ 30% (2014 - 30%) 2,561,836 2,536,585 Less – bonus issue of ordinary shares under the Company’s Bonus Share Plan. (239,787) (71,475) 2,322,049 2,465,110 (b) Dividends not recognised at the end of the reporting period In addition to the above dividends, since year end the directors have declared the payment of a final dividend of 4.0 cents per fully paid ordinary share, (2014 – 4.0 cents) fully franked based on tax paid at 30% (2014 - 30%). The aggregate amount of the proposed dividend expected to be paid on 20 November 2015 out of retained profits at 30 June 2015, but not recognised as a liability at year end, is 2,633,228 2,549,867
Notes to the Financial Statements
Page 37
22. DIVIDENDS (continued) (c) Franked dividends The franked portion of the final dividend recommended after 30 June 2015 will be franked out of existing franking credits or out of franking credits arising from the payment of income tax in the year ending 30 June 2015. Franking credits available for subsequent financial years based on a tax rate of 30% - $16,658,488 (2014 - $16,308,420 - 30%). The above amounts represent the balance of the franking account as at the end of the financial year, adjusted for: (a) franking credits that will arise from the payment of the amount of the provision for income tax (b) franking debits that will arise from the payment of dividends recognised as a liability at the reporting date, and (c) franking credits that will arise from the receipt of dividends recognised as receivables at the reporting date. The consolidated amounts include franking credits that would be available to the parent entity if distributable profits of subsidiaries were paid as dividends. The impact on the franking account of the dividend declared by the directors since year end, but not recognised as a liability at year end, will be a reduction in the franking account of $1,128,526 (2014 - $1,092,800). 23. RELATED PARTIES (a) Parent entity CTI Logistics Limited is the ultimate Australian parent entity of the group and head entity of the tax consolidated group. (b) Transactions with key management personnel Key management personnel compensation Consolidated 2015 2014
$ $ Key management personnel compensation comprised the following: Short-term 1,649,721 1,567,159 Post-employment 106,746 93,775 Share-based payments 81,740 59,358 1,838,207 1,720,292 24. REMUNERATION OF AUDITORS During the year the following fees were paid or payable for services provided by the auditor of the parent entity, its related practices and non-related audit firms: Audit services KPMG Australia Audit and review of financial reports 108,000 98,000 25. COMMITMENTS (a) Capital commitments Capital expenditure contracted for at the reporting date but not recognised as liabilities: Property, plant and equipment Payable within one year 873,690 1,071,035 (b) Lease commitments: group company as lessee Commitments in relation to leases contracted for at the reporting date are as follows: (i) Operating leases The group leases offices and warehouses under non-cancellable operating leases. Commitments for minimum lease payments in relation to non-cancellable operating leases are payable as follows: Less than one year 9,060,379 4,255,858 Between one and five years 26,906,324 15,086,445 Later than five years 11,259,661 338,045 47,226,364 19,680,348
Notes to the Financial Statements
Page 38
25. COMMITMENTS Consolidated 2015 2014
$ $ (ii) Hire purchase commitments Commitments in relation to hire purchase are payable as follows: Less than one year 2,574,972 2,494,848 Between one and five years 1,454,710 2,685,156 Recognised as a liability 4,029,682 5,180,004 26. SUBSIDIARIES
All subsidiaries are incorporated in Australia. The consolidated financial statements incorporate the assets, liabilities and results of the following subsidiaries in accordance with the accounting policy described in note 1(b): Country of
Incorporation Equity holding
(Ordinary shares) Name of entity 2015
% 2014
% CTI Logistics Limited Australia Directly controlled by CTI Logistics Limited Controlled entities Bring Transport Industries Pty Ltd Australia 100 100 Mercury Messengers Pty Ltd Australia 100 100 CTI Security Services Pty Ltd Australia 100 100 CTI Transport Systems Pty Ltd Australia 100 100 CTI Taxi Trucks Pty Ltd Australia 100 100 CTI Security Systems Pty Ltd Australia 100 100 CTI Transport Services Pty Ltd (formerly CTI Fleet Management Pty Ltd)
Australia
100
100
CTI Freight Management Pty Ltd Australia 100 100 Action Logistics (WA) Pty Ltd Australia 100 100 CTI Freight Systems Pty Ltd Australia 100 100 CTI Couriers Pty Ltd Australia 100 100 CTI Swinglift Services Pty Ltd Australia 100 100 CTI Xpress Systems Pty Ltd Australia 100 100 CTI Investments Pty Ltd Australia 100 100 Consolidated Transport Industries Pty Ltd Australia 100 100 Logico Operations Group Limited (acquired 10 June 2015) Australia 100 - Other controlled entities Directly controlled by CTI Investments Pty Ltd Lafe (WA) Pty Ltd Australia 100 100 CTI Freightlines Pty Ltd Australia 100 100 Blackwood Industries Pty Ltd Australia 100 100 Australian Fulfilment Services Pty Ltd Australia 100 100 Directly controlled by Blackwood Industries Pty Ltd Efal Pty Ltd Australia 100 100 CTI Online Pty Ltd (formerly Ausplastics Pty Ltd) Australia 100 100 CTI Records Management Pty Ltd Australia 100 100 CTI Quarantine & Fumigation Services Pty Ltd (formerly CTI Waste Management Pty Ltd)
Australia
100
100
Directly controlled by Consolidated Transport Industries Pty Ltd
Foxline Logistics Pty Ltd Australia 100 100 Directly controlled by Logico Operations Group Limited G.M. Kane & Sons Pty Ltd (acquired 10 June 2015) Australia 100 - These subsidiaries have been granted relief from the necessity to prepare financial reports in accordance with Class Order 98/1418 (as amended) issued by the Australian Securities and Investments Commission. For further information refer to note 27.
Notes to the Financial Statements
Page 39
27. DEED OF CROSS GUARANTEE CTI Logistics Limited and its wholly-owned entities are parties to a deed of cross guarantee under which each company guarantees the debts of the others. By entering into the deed, the wholly-owned entities have been relieved from the requirement to prepare a financial report and directors’ report under Class Order 98/1418 (as amended) issued by the Australian Securities and Investments Commission. The above companies represent a ‘Closed Group’ for the purposes of the Class Order, and as there are no other parties to the Deed of Cross Guarantee, they also represent the Extended Closed Group. The consolidated results of the Company and all the parties to the Deed are the same as the consolidated results of the group. 28. RECONCILIATION OF PROFIT AFTER INCOME TAX TO NET CASH INFLOW FROM OPERATING ACTIVITIES Consolidated 2015 2014 $ $ Profit for the year 5,929,040 9,835,919 Depreciation and amortisation 5,572,146 5,290,686 Impairment of property - 1,600,000 Provision for doubtful debts 8,724 (15,890) Net gain on sale of non-current assets 96,376 (2,866,339) Share-based payment expense 254,219 267,854 Change in operating assets and liabilities Increase in trade and other debtors 2,304,517 (603,851) Decrease in inventories 1,412,938 855,463 Decrease in provision for income taxes payable (1,062,154) (1,077,685) (Increase)/decrease in provision for deferred tax assets (235,784) 294,838 Decrease in trade creditors, employee benefits and other provisions (1,192,154) (1,966,090) Net cash inflow from operating activities 13,087,868 11,614,905 29. EARNINGS PER SHARE Consolidated 2015 2014 (a) Basic earnings per share Cents per share Basic earnings per share attributable to the ordinary equity holders of the Company (2014 – adjusted for bonus share issue). 9.25 15.50 $ $Profit attributable to ordinary shareholders used in calculating basic earnings per share. 5,929,040 9,835,919 Number Number Weighted average number of ordinary shares used as the denominator in calculating basic earnings per share (2014 – adjusted for bonus share issue). 64,067,763 63,451,813 2015 2014 (b) Diluted earnings per share Cents per share Diluted earnings per share attributable to the ordinary equity holders of the Company (2014 – adjusted for bonus share issue). 9.21 15.35 $ $ Profit attributable to ordinary shareholders used in calculating diluted earnings per share. 5,929,040 9,835,919
Notes to the Financial Statements
Page 40
29. EARNINGS PER SHARE (continued) 2015 2014 Number Number Weighted average number of ordinary shares used as the denominator in calculating diluted earnings per share. Weighted average number of shares (basic) (2014 - adjusted for bonus share issue). 64,067,763 63,451,813 The effect of the vesting of contingently issuable shares 287,893 618,712 Weighted average number of shares (diluted) 64,355,656 64,070,525 The average market value of the Company’s shares for the purposes of calculating the dilutive effect of the vesting of contingently issuable shares was based on quoted market prices for the period during which the contingently issuable shares were outstanding. 30. PARENT ENTITY FINANCIAL INFORMATION (a) Summary financial information The individual financial statements for the parent entity show the following aggregate amounts: 2015 2014 $ $ Balance sheet Current assets 18,364,246 28,395,669 Total assets 57,938,399 40,444,941 Current liabilities 9,607,811 1,382,462 Total liabilities 31,938,235 11,632,837 Net assets 26,000,164 28,812,104 Shareholders’ equity Issued capital 18,124,821 15,698,075 Reserves 1,315,446 1,052,247 Retained earnings 6,559,897 12,061,782 26,000,164 28,812,104 Profit for the year 938,691 10,550,832 Total comprehensive income 947,673 10,540,404 (b) Guarantees entered into by the parent entity 2015 2014 $ $ Carrying amount included in - current liabilities 2,531,902 2,454,036 - non-current liabilities 43,428,543 24,615,919 45,960,445 27,069,955 The parent entity has provided financial guarantees in respect of loans and hire purchase commitments of subsidiaries amounting to $45,960,445 (2014 - $27,069,955). The loans are secured by registered mortgages over the freehold properties of the subsidiaries. In addition, there are cross guarantees given by CTI Logistics Limited, as described in note 27. No deficiencies of assets exist in any of these entities. (c) Contingent liabilities of the parent entity The parent entity did not have any contingent liabilities as at 30 June 2015 (30 June 2014 - $nil). For information about guarantees given by the parent entity, refer note (b). (d) Contractual commitments for the acquisition of property, plant or equipment The parent entity had no contractual commitments for the acquisition of property, plant or equipment at 30 June 2015 (2014 - $nil).
Notes to the Financial Statements
Page 41
31. SHARE-BASED PAYMENT PLAN Employee Share Plan Senior employees are offered the opportunity to purchase shares in the Company under the Employee Share Plan (ESP). The shares may be purchased with the assistance of an interest-free, limited recourse loan for a term of 10 years for key management personnel and 5 years for senior employees and is repayable by dividends. Measurement of fair values The fair value of the shares granted under the ESP was measured based on the Black-Scholes formula. Expected volatility is estimated by considering historic average share price volatility. The fair value is amortised over the two year vesting period through the statement of profit or loss and other comprehensive income. The inputs used in the measurement of the fair values at grant date of the share-based payment plan were as follows. Employee Share Plan
Key management
personnel Senior
employees
Key management
personnel Senior
employees 2015 2015 2014 2014 Fair value at grant date $0.93 $0.66 - - Share price at grant date $1.77 $1.76 - - Exercise price $1.77 $1.76 - - Expected volatility (weighted average) 40% 40% - - Loan amount $531,000 $580,800 - - Term 10 years 5 years - - Risk-free interest rate 2.8% 2.8% - - Fair value recognised as remuneration during the year
$81,740
$172,479
$59,359
$208,495
Expected volatility has been based on an evaluation of the historical volatility of the Company’s share price, particularly over the historical period commensurate with the expected term. ESP shares The number of ESP shares under the Employee Share Plan were as follows: Balance at the start
of the year Issued during the
year Exercised Balance at the
end of the year Key management personnel 360,000 300,000 - 660,000Senior employees 1,230,000 330,000 (10,000) 1,550,000 1,590,000 630,000 (10,000) 2,210,000 32. ACQUISITION OF SUBSIDIARY On 10 June 2015 the group acquired Logico Operations Group Limited and its subsidiary G.M. Kane & Sons Pty Ltd (GMK). In the month of June 2015, GMK contributed revenue of $3,450,230 and profits after tax of $273,823 to the group’s results. If the acquisition had occurred on 1 July 2014, management estimates that consolidated revenue would have been $36,195,263, and consolidated profit for the year would have been $2,270,250. In determining these amounts, management has assumed that the fair value adjustments, determined provisionally, that arose on the date of acquisition would have been the same if the acquisition had occurred on 1 July 2014. Details of the purchase consideration, the net assets acquired and goodwill were as follows:
(a) Purchase consideration $ Cash paid 10,000,000Equity instruments (1,428,571 ordinary shares) 2,000,000Deferred consideration 14,178,422Contingent consideration 1,500,000Total purchase consideration 27,678,422
Notes to the Financial Statements
Page 42
32. ACQUISITION OF SUBSIDIARY (continued)
In accordance with the terms of the acquisition agreement, the deferred consideration is adjusted based on the net tangible assets at the acquisition date. The group included $678,422 as consideration relating to the net tangible assets adjustment based on the identified assets acquired and liabilities assumed at acquisition date, which has been measured on a provisional basis. The adjusted amount is payable by September 2015. (i) Equity instruments issued The fair value of the ordinary shares issued was based the listed price of the Company at 10 June 2015 of $1.40 per share. (ii) Deferred consideration
The deferred consideration is payable to the vendors on or before 15 September 2015.
(iii) Contingent consideration The contingent consideration of $1,500,000 is payable to the vendors in July 2016 dependent of achieving earnings thresholds for the year to 30 June 2016. The group has included $1,500,000 as contingent consideration related to the additional consideration which represents its fair value at the date of acquisition. The contingent consideration is payable to the vendor up to $1,500,000.
(b) Identifiable assets acquired and liabilities assumed
The assets recognised as a result of the acquisition were as follows: Fair value $
Property, plant and equipment 2,931,644 Trade receivables 4,021,140 Cash 622,036 Prepayments 681,512 Deferred tax assets 367,948 Loans and borrowings (133,054) Provisions (1,194,660) Trade and other payables (3,118,144) Total identifiable assets 4,178,422
(i) Measurement of fair values
The valuation techniques used for measuring the fair value of material assets acquired were as follows: Property, plant and equipment Market comparison technique and cost technique: The model considers quoted market prices for similar items when available, and depreciated replacement cost when appropriate. Depreciated replacement cost reflects adjustments for physical deterioration as well as functional and economic obsolescence. Fair values measured on a provisional basis The fair value of assets acquired has been measured provisionally, pending the completion of a valuation. If new information obtained within one year of the acquisition date about facts and circumstances that existed at the acquisition date identifies adjustments to the above amounts, or any additional provisions that existed at the acquisition date, then the accounting for the acquisition will be revised. $
(c) Goodwill Goodwill recognised as a result of the acquisition were as follows: Total consideration 27,678,422 Less fair value of identifiable assets (4,178,422) Goodwill 23,500,000
The goodwill was attributable to the workforce, synergies, mutual client base and profitability of the acquired business. (d) Acquisition-related costs
Acquisition-related costs of $25,106 have been included in “other expenses”.
Notes to the Financial Statements
Page 43
33. PROPERTY HELD FOR SALE In June 2015, management committed to a plan to sell property which is disclosed as part of the reportable segment assets in the Property segment in Note 4. Efforts to sell property are continuing in the 2016 financial year. 34. EVENTS OCCURRING AFTER THE BALANCE SHEET DATE Other than financing arrangements executed in August 2015 (note 18c) no other events have occurred since the end of the financial year that provide additional evidence of conditions that existed at the end of the financial year or that reveal for the first time a condition that existed at the end of the financial year.
Page 44
Directors’ Declaration In the opinion of the directors of CTI Logistics Limited (‘the Company’): (a) the consolidated financial statements and notes that are set out on pages 9 to 43 and the remuneration report on pages 6 to 7 in
the Directors’ Report, are in accordance with the Corporations Act 2001, including:
(i) giving a true and fair view of the group’s financial position as at 30 June 2015 and of its performance, for the financial year ended on that date; and
(ii) complying with Australian Accounting Standards and the Corporations Regulations 2001; and (b) there are reasonable grounds to believe that the Company will be able to pay its debts as and when they become due and
payable. There are reasonable grounds to believe that the Company and the group entities identified in note 27 will be able to meet any obligations or liabilities to which they are or may become subject to by virtue of the Deed of Cross Guarantee between the Company and those group entities pursuant to ASIC Class Order 98/1418. Note 1(a) confirms that the financial statements also comply with International Financial Reporting Standards as issued by the International Accounting Standards Board. The directors have been given the declarations by the chief executive officer and chief financial officer required by section 295A of the Corporations Act 2001. This declaration is made in accordance with a resolution of the directors.
DAVID WATSON Director Perth, WA 27 August 2015
Independent auditor’s report to the members of CTI Logistics Limited
Report on the financial report We have audited the accompanying financial report of CTI Logistics Limited (the company), which comprises the consolidated statement of financial position as at 30 June 2015, and consolidated statement of profit or loss and other comprehensive income, consolidated statement of changes in equity and consolidated statement of cash flows for the year ended on that date, notes comprising a summary of significant accounting policies and other explanatory information and the directors’ declaration of the Group comprising the company and the entities it controlled at the year’s end or from time to time during the financial year.
Directors’ responsibility for the financial report
The directors of the company are responsible for the preparation of the financial report that gives a true and fair view in accordance with Australian Accounting Standards and the Corporations Act 2001 and for such internal control as the directors determine is necessary to enable the preparation of the financial report that is free from material misstatement whether due to fraud or error. In note 1, the directors also state, in accordance with Australian Accounting Standard AASB 101 Presentation of Financial Statements, that the financial statements of the Group comply with International Financial Reporting Standards.
Auditor’s responsibility
Our responsibility is to express an opinion on the financial report based on our audit. We conducted our audit in accordance with Australian Auditing Standards. These Auditing Standards require that we comply with relevant ethical requirements relating to audit engagements and plan and perform the audit to obtain reasonable assurance whether the financial report is free from material misstatement.
An audit involves performing procedures to obtain audit evidence about the amounts and disclosures in the financial report. The procedures selected depend on the auditor’s judgement, including the assessment of the risks of material misstatement of the financial report, whether due to fraud or error. In making those risk assessments, the auditor considers internal control relevant to the entity’s preparation of the financial report that gives a true and fair view in order to design audit procedures that are appropriate in the circumstances, but not for the purpose of expressing an opinion on the effectiveness of the entity’s internal control. An audit also includes evaluating the appropriateness of accounting policies used and the reasonableness of accounting estimates made by the directors, as well as evaluating the overall presentation of the financial report.
We performed the procedures to assess whether in all material respects the financial report presents fairly, in accordance with the Corporations Act 2001 and Australian Accounting Standards, a true and fair view which is consistent with our understanding of the Group’s financial position and of its performance.
We believe that the audit evidence we have obtained is sufficient and appropriate to provide a basis for our audit opinion.
KPMG, an Australian partnership and a member firm of the KPMG network of independent member firms affiliated with KPMG International Cooperative (“KPMG International”), a Swiss entity.
Liability limited by a scheme approved under Professional Standards Legislation.
Independence
In conducting our audit, we have complied with the independence requirements of the Corporations Act 2001.
Auditor’s opinion In our opinion:
(a) the financial report of the Group is in accordance with the Corporations Act 2001, including:
(i) giving a true and fair view of the Group’s financial position as at 30 June 2015 and of its performance for the year ended on that date; and
(ii) complying with Australian Accounting Standards and the Corporations Regulations 2001.
(b) the financial report also complies with International Financial Reporting Standards as disclosed in note 1.
Report on the remuneration report We have audited the Remuneration Report included in the directors’ report for the year ended 30 June 2015. The directors of the company are responsible for the preparation and presentation of the remuneration report in accordance with Section 300A of the Corporations Act 2001. Our responsibility is to express an opinion on the remuneration report, based on our audit conducted in accordance with auditing standards.
Auditor’s opinion
In our opinion, the remuneration report of CTI Logistics Limited for the year ended 30 June 2105, complies with Section 300A of the Corporations Act 2001.
KPMG
Brent Steedman Partner
Perth
27 August 2015