CTF RESULTS REPORT - climateinvestmentfunds.org · B3, B4, and B5 depends on the nature of the...
44
CTF/TFC.20/4/Rev.1 December 5, 2017 Meeting of the CTF Trust Fund Committee Washington DC Friday, December 15,2017 CTF RESULTS REPORT
Transcript of CTF RESULTS REPORT - climateinvestmentfunds.org · B3, B4, and B5 depends on the nature of the...

CTF/TFC.20/4/Rev.1
December 5, 2017
Meeting of the CTF Trust Fund Committee Washington DC
Friday, December 15,2017
CTF RESULTS REPORT

2
PROPOSED DECISION
The CTF Trust Fund Committee reviewed document, CTF/TFC.20/4, CTF Results Report, and welcomes the
progress that has been made in implementing CTF-financed activities leading to results on the ground.
3
CTF Results Report
2017

4
Contents
Introduction
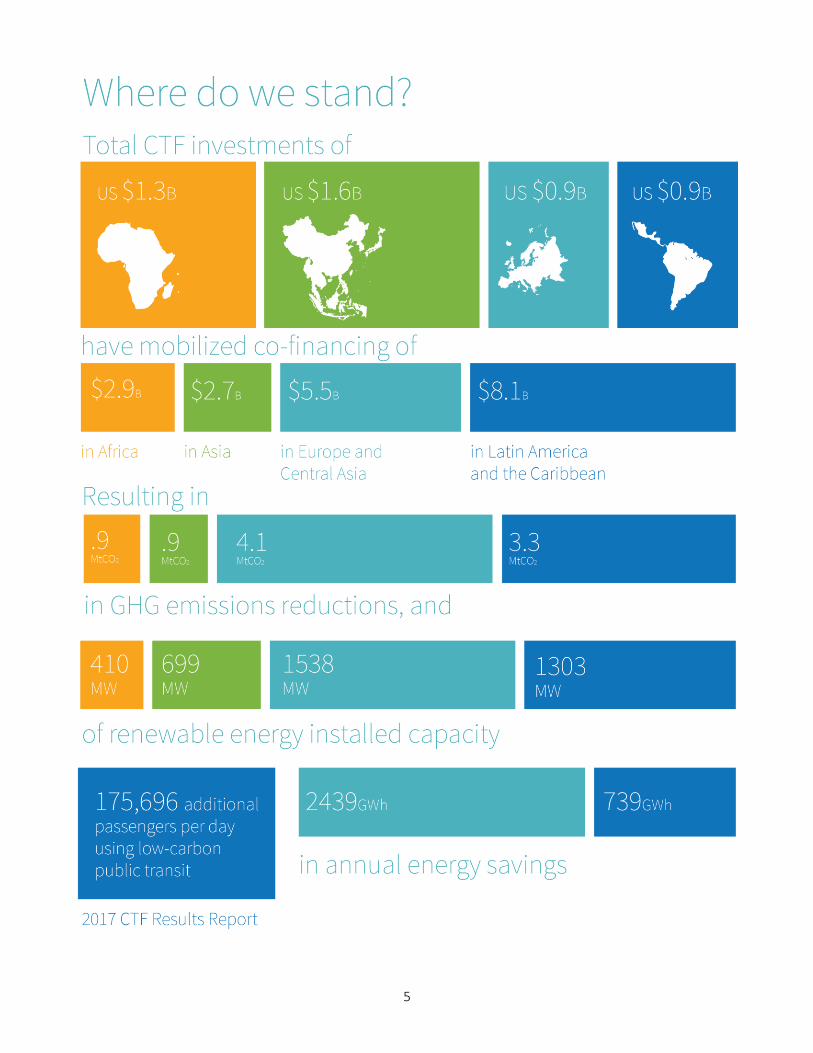
Global Overview
Results Comparison: Current vs. Previous Reporting Year
Africa
Asia
Europe and Central Asia
Latin America and the Caribbean
Private and Public Sector
Topics of Further Interest
Data Annexes
5
7
12
14
16
19
22
25
27
28
5

6

7
Introduction
The Clean Technology Fund (CTF) provides scaled-up financing to contribute to the demonstration, deployment, and transfer of low carbon technologies with a significant potential for long-term greenhouse gas emissions (GHG) reductions. It provides concessional financing, channeled through six partner multilateral development banks (MDB), to large-scale, country-led projects and programs in renewable energy, energy efficiency, and transport. The CTF supports countries and regions through strategic investment plans of their own design, totaling 16, and its Dedicated Private Sector Programs (DPSP), which includes projects in additional countries.
Countries
This Results Report is based on results originating from projects and programs hosted in the following countries: Chile, Colombia, Egypt, Honduras1, India, Indonesia, Kazakhstan, Mexico, Morocco, Nicaragua2, Nigeria, Philippines, South Africa, Thailand, Turkey, Ukraine, and Vietnam.
For the purposes of this report, these countries are grouped into the following regions:
• Africa: Egypt, Morocco, Nigeria, South Africa
• Asia: India, Indonesia, the Philippines, Thailand, Vietnam
• Europe and Central Asia: Kazakhstan, Turkey, Ukraine
• Latin America and the Caribbean: Chile, Colombia, Honduras, Mexico, Nicaragua
Scope
This report is based on 85 MDB-approved projects/programs reporting over a one-year period3 and is divided into three main sections: a global overview of the results across the five core indicators, followed by details on a regional and public-private sector basis, and finally, topics that may be of further interest to the readers based on findings of the current reporting cycle. Within the set of 85 reporting projects/programs, the International Bank for Reconstruction and Development (IBRD) has the largest share of CTF-funding at 39 percent of the total funding allocation, followed by the Asian Development Bank (ADB) (19 percent), Inter-American Development Bank (IDB) (13 percent), African Development Bank (AfDB) (11 percent), European Bank for Reconstruction and Development (EBRD) (10 percent), and the International Finance Corporation (IFC) (8 percent).
Approach
The results presented herein are based on the CTF Revised Results Framework4, which includes the following core indicators measured at the project level and reported on annually:
• [B1] Tons of greenhouse gas emissions reduced or avoided (tCO2e)
• [B2] Volume of direct finance leveraged through CTF funding, disaggregated by public and private finance (US$ million, US$ m)
• [B3] Installed capacity as a result of CTF interventions (Megawatt, MW)
• [B4] Number of additional passengers, disaggregated by men and women if feasible, using low carbon transport as a result of CTF intervention (passengers per day)
• [B5] Annual energy savings as a result of CTF interventions (Gigawatt hours, GWh)
1 Honduras is a non-CTF country but has benefited from the CTF through the DPSP. 2 Nicaragua is a non-CTF country but has benefited from the CTF through the DPSP. 3 Reporting year: Depending on the MDB, the reporting year “RY2017” covers the period from January 1, 2016 to December 31, 2016 (AfDB, EBRD, IDB, and IFC) or July 1 2016 to June 30 2017 (ADB, IBRD). 4 CTF Revised Results Framework

8
Each project and program is also required to identify and report on at least one indicator for a development co-benefit. It may include, but is not limited to, access to energy or health and employment co-benefits, preferably disaggregated by gender.
The MDBs collect results data on an annual basis using a template provided by the CIF Administrative Unit. The template lists indicators for projects and programs approved by the corresponding cut-off date for reporting. The MDB completes these by July 31 each year. The data are then collated, clarified, analyzed, and presented in the Results Report.
Key points
• Indicators: B1 and B2 are core indicators that every project and program must report on, while reporting on B3, B4, and B5 depends on the nature of the project (i.e., whether the project involves renewable energy, transport, or energy efficiency measures).
• Reporting: Targets across all indicators are included when comparing results. Depending on the stage of implementation, not all indicators from a project may be reporting actual results. For example, a project that just met financial closure might only be reporting on the co-financing indicator, while a more mature project that is under operation may be reporting GHG emission reductions. In addition, some projects face challenges in collecting data in time for the Results Report, and some data may change after being reported to the CIF Administrative Unit. This may be due, for example, to differences in reporting period, or differences in available data (e.g., a project that moves from ex-ante estimations to actual measurements).
• Actuals: Refers to the actual results reported by a project for the latest 12-month reporting period. Actual (cumulative) refers to total (actual) results since the project started reporting results.
• Targets: In case of B1 and B5, targets refer to GHG reductions or energy savings expected to be achieved on an annual basis. For other indicators, targets refer to absolute results expected to be achieved during the course of the project. The words “target results” and “expected results” are used interchangeably. They refer to a mix of targets for public sector projects (from MDB board approved documents) and for private sector programs (from TFC approved documents).
• Co-financing: Different MDBs take different approaches to reporting on actual co-financing. This includes establishing milestones when MDBs recognize co-financing and identifying the relevant co-financing amounts. While some MDBs report the full amount once a project is approved by the respective board, others do not report until the project reaches financial close or starts operation. Some co-financing figures may not be reported for confidentiality reasons.
• GHG reduction: MDBs use different methodologies for estimating GHG emission reductions, therefore aggregated data are subject to further refinement as MDBs continue developing more harmonized methodologies.
• Co-benefits indicators: For more holistic insight into the impact of CTF funding, co-benefit indicators have been included, which look beyond the primary required indicators. These have been aggregated and presented on a regional level and only include results from those projects that have reported these (60 percent of all projects covered in this report).
• Analysis: The analysis is based on both annual (for the latest reporting year) as well as cumulative results reported as of the current period. The graphs on sources of co-financing and installed capacity by technology are based on cumulative results reported thus far.
• Online reporting: Results data from RY2017 will be uploaded to the CTF’s results database, an online platform that provides convenient open access to CTF results data since 2016. It builds on the World Bank Open Data platform and can be accessed here. The development of a single, integrated system for CIF project data collection and results reporting (the FIF system) continues to progress. The beta version of this integrated platform is under detailed review.

9
US$4,688M in CTF funding 85 projects reporting results, of which 13 new projects this reporting year
GHG Emissions Reductions
With 30 of the 85 projects reporting achieved5 annual results in RY2017, GHG emissions reductions total 9.3 MtCO2
6, equivalent to taking 1.8 million cars off the road7. Cumulatively, projects have resulted in 41.3 MtCO2 in GHG emissions reductions. Around a third of projects and programs (28 of 85) are resulting in GHG emissions reductions in at least one year of reporting. The majority of cumulative emissions reductions can be
5 For the purposes of this report, “achieved” is used to differentiate between three categories of projects:
1. projects that have not reported actual emissions reductions 2. projects that have reported actual emissions reductions that are zero 3. projects that have reported actual emissions reductions that are more than zero.
“Achieved” refers specifically to the third category. 6 Throughout this report, MtCO2 refers to million tons of CO2. 7 Source: US EPA Greenhouse Gas Equivalencies Calculator https://www.epa.gov/energy/greenhouse-gas-equivalencies-calculator
Global Overview
(GHG reductions/ Energy savings) Targets ANNUAL (Co-financing/ Installed capacity) Targets CUMULATIVE (PPD) Passengers per day UPON IMPLEMENTATION

10
attributed to projects in Europe and Central Asia (54 percent), and Latin America and the Caribbean (38 percent).8
As in RY2016, over half of RY2017 GHG emissions reductions came from just two projects: the IBRD’s Private Sector Renewable Energy and Energy Efficiency Project in Turkey (35 percent of the total) and Renewable Energy Financing Facility (REFF) in Mexico (16 percent). The Private Sector Renewable Energy and Energy Efficiency Project in Turkey also performs well cumulatively, producing 43 percent of cumulative GHG emissions reductions, followed by the Efficient Lighting and Appliance Project in Mexico (IBRD), which has produced 18 percent of cumulative GHG emissions reductions.9 RY2017 GHG emissions reductions are attributable primarily to renewable energy projects (50 percent), followed by renewable energy/energy efficiency projects (35 percent), energy efficiency (13 percent), and transport (2 percent).
While approximately 14 percent of funding is devoted to energy efficiency projects, they are delivering 26 percent of cumulative emissions reductions, representing a high-value impact for the sector in terms of emissions reductions per dollar of CTF funding. Similarly, combined renewable energy/energy efficiency projects consume about five percent of the funding allocation but produce 43 percent of the emissions reductions.
Co-financing
Fifty-nine of 85 projects are reporting achieved co-financing. In total, on a cumulative basis, 27 percent of almost $20 billion in co-financing has been provided by MDBs, 24 percent by governments, and 23 percent by the private sector. Other sources have provided 13 percent, and bilateral institutions 12 percent.
RY2017 co-financing amounted to US$4.5 billion over a one-year period, equivalent to the GDP of Barbados. The largest portion of RY2017 funding was from government sources. This increases the cumulative share of government co-financing, but it remains small relative to other sources. During RY2017, one
8 The uneven performance between regions is explained by a more mature portfolio in some regions. 9 These two projects contribute a large share of overall results partially because of their maturity – they were approved in 2009 and 2010 respectively, and have both reached completion.

11
project leveraged more than US$2 billion in total financing, almost half the year’s total: Private Sector Renewable Energy and Energy Efficiency Project in Turkey (IBRD).
Sources and amounts of co-financing vary by region. Cumulatively, Africa has received the largest portion of funding from bilateral institutions, while Asia and Europe and Central Asia have received most of their cumulative co-financing from MDB sources, and Latin America and the Caribbean from the private sector. This difference in funding sources is partially explained by funder activity between regions: bilaterals often times may focus on lower income countries, while MDBs may find demand also in middle income countries where bilaterals may not be as active. While Latin America and the Caribbean has leveraged the largest amount of co-financing on a cumulative basis, Europe and Central Asia leveraged the most in RY2017.
Cumulative co-financing by region by source
Installed Capacity
Twenty-two projects are reporting achieved installed capacity, of 56 projects where this indicator applies. The total, cumulative installed capacity across the portfolio of CTF projects is 3,950 MW, equivalent to the total installed capacity of the Dominican Republic.10 Of this, 794 MW came online in the RY2017 reporting cycle. To date, 15 percent of the target installed capacity has been implemented. Both cumulatively and
for RY2017 alone, the largest amount of installed capacity is in the wind sector, with 319 MW in RY2017 and
10 US EIA, 2012. https://www.eia.gov/cfapps/ipdbproject/IEDIndex3.cfm?tid=2&pid=2&aid=7
12
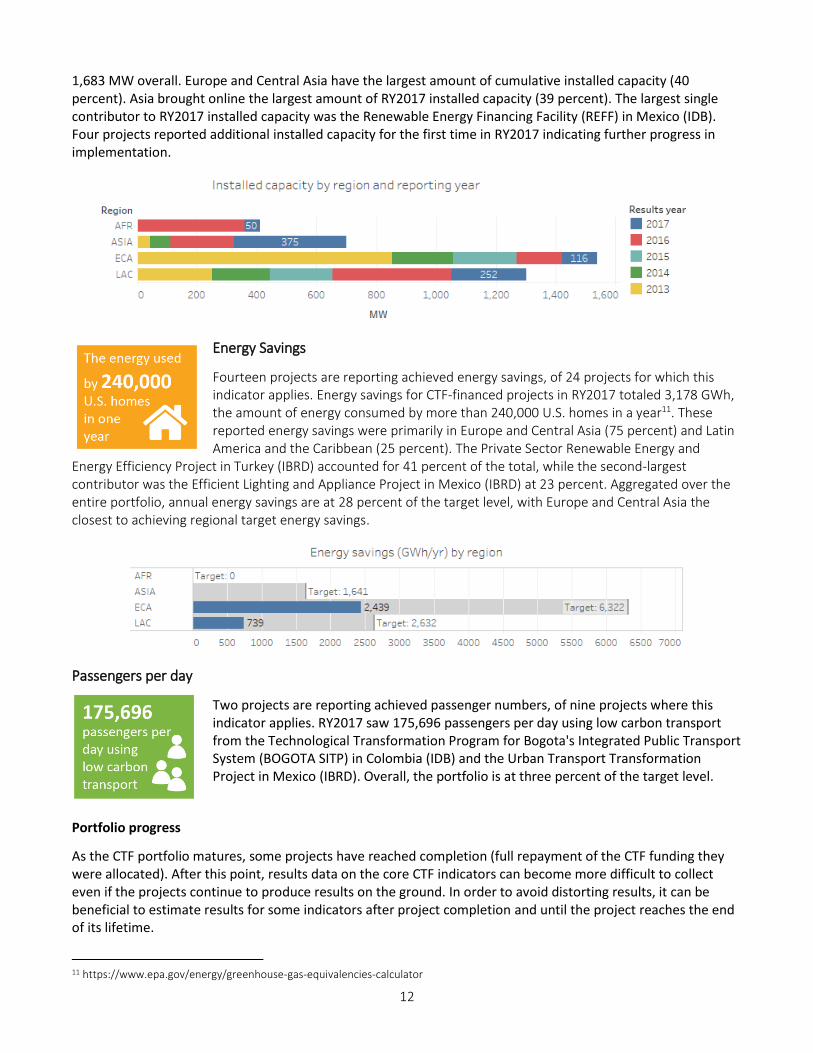
1,683 MW overall. Europe and Central Asia have the largest amount of cumulative installed capacity (40 percent). Asia brought online the largest amount of RY2017 installed capacity (39 percent). The largest single contributor to RY2017 installed capacity was the Renewable Energy Financing Facility (REFF) in Mexico (IDB). Four projects reported additional installed capacity for the first time in RY2017 indicating further progress in implementation.
Energy Savings
Fourteen projects are reporting achieved energy savings, of 24 projects for which this indicator applies. Energy savings for CTF-financed projects in RY2017 totaled 3,178 GWh, the amount of energy consumed by more than 240,000 U.S. homes in a year11. These reported energy savings were primarily in Europe and Central Asia (75 percent) and Latin America and the Caribbean (25 percent). The Private Sector Renewable Energy and
Energy Efficiency Project in Turkey (IBRD) accounted for 41 percent of the total, while the second-largest contributor was the Efficient Lighting and Appliance Project in Mexico (IBRD) at 23 percent. Aggregated over the entire portfolio, annual energy savings are at 28 percent of the target level, with Europe and Central Asia the closest to achieving regional target energy savings.
Passengers per day
Two projects are reporting achieved passenger numbers, of nine projects where this indicator applies. RY2017 saw 175,696 passengers per day using low carbon transport from the Technological Transformation Program for Bogota's Integrated Public Transport System (BOGOTA SITP) in Colombia (IDB) and the Urban Transport Transformation Project in Mexico (IBRD). Overall, the portfolio is at three percent of the target level.
Portfolio progress
As the CTF portfolio matures, some projects have reached completion (full repayment of the CTF funding they were allocated). After this point, results data on the core CTF indicators can become more difficult to collect even if the projects continue to produce results on the ground. In order to avoid distorting results, it can be beneficial to estimate results for some indicators after project completion and until the project reaches the end of its lifetime.
11 https://www.epa.gov/energy/greenhouse-gas-equivalencies-calculator

13
Once a project is complete, MDBs employ different approaches to reporting results data. For annual GHG emissions reductions, IDB used a historical average to estimate RY2017 actuals, while IBRD assumed flat GHG reductions equal to the last implementation year. EBRD elected to omit RY2017 actuals. IFC used historical average over the last two years of data collection.
For co-financing, annual actual results for completed projects are zero, as co-financing leverage has been fully realized. Similarly, renewable energy projects that report on installed capacity report no new installed capacity after project completion, as they have typically already reached the planned amount of total installed capacity. No completed projects have reported on passengers per day or energy savings, so approaches for these indicators have not been developed.
As the table indicates, projects begin to leverage co-financing in their early stages of implementation. Considering the total CTF portfolio covered in this report, (by $-vol), 53 projects (77 percent of allocations) have reached this stage and 17 projects (16 percent of allocations) have achieved their overall co-financing targets. During implementation, projects begin to produce GHG emissions reductions. As of RY2017, twelve percent of the funding allocation has reached target levels of annual GHG emissions reductions. Thirteen percent of the funding allocation has reached completion.12
CTF portfolio progress in terms of results reporting
12 To date, there are eight completed (fully repaid) CTF projects: IDB Mexico Renewable Energy Program AfDB/IBRD South Africa ESKOM Renewable Support Project-Wind EBRD Turkey Turkish Private Sector Sustainable Energy Financing Facility(TurSEFF) IFC Thailand Renewable Energy Accelerator Program(TSEFF) IBRD India Himachal Pradesh Environmentally Sustainable Development Policy Loan IBRD Mexico Efficient Lighting and Appliance Project IBRD/AfDB MENA-CSP Ouarzazate I Concentrated Solar Power Project IBRD Turkey Private Sector Renewable Energy and Energy Efficiency Project
Progress Number CTF$M Percent of allocation
Projects that have begun leveraging co-financing as of RY2017 53 $3,602 77%
Projects that have achieved Co-financing target (including completed) 17 $750 16%
Projects that have achieved GHG emissions reductions annual target (including completed) 8 $567 12%
Completed projects 8 $606 13%

14
Results Comparison Current vs. Previous Years
The following section is based on RY2015 to RY2017 data for 85 projects currently reporting results. It should be
noted that RY2016 figures were adjusted to account for new data that were not available when the 2016 report
was released.
GHG Emissions Reductions:
There was a 16 percent
improvement in GHG
emissions reductions
between RY2016 and
RY2017. Four projects, at
various stages of
implementation since
RY2015, reported achieved
GHG emissions reductions
for the first time in RY2017
(Two in Latin America and
the Caribbean, one in Asia,
and one in Europe and
Central Asia).
Stable or improving trends
in GHG emissions
reductions across all three
years can be seen in eight
projects, three in Latin
America and the Caribbean,
two in Asia and three in
Europe and Central Asia.
Co-financing: Overall annual co-financing decreased by 6 percent from RY2016 to RY2017. Three projects
leveraged more than US$700M each in RY2017: the Noor II and III Concentrated Solar Power Project in Morocco
(IBRD/AfDB), Private Sector Renewable Energy and Energy Efficiency Project in Turkey (IBRD), and the
Sustainable Energy Acceleration Program in South Africa (IFC/AfDB).
Installed Capacity: While additional installed capacity declined between RY2016 and RY2017 by 29 percent, the
absolute amount of installed capacity increased by 71 percent. Three projects reported achieved installed
capacity for the first time in RY2017, and six reported additions to previous installed capacity.
Energy Savings: There was a 8 percent increase in energy savings between RY2016 and RY2017, from 2,940 GWh
to 3,178 GWh. From RY2016 to RY2017 there were increases in energy savings in two projects: the Turkish
Private Sector Sustainable Energy Financing Facility (TurSEFF) (EBRD) and the ECOCASA Program-Energy
Efficiency Program Part II in Mexico (IDB).
Passengers per Day: After the first achieved results for passenger numbers were reported in RY2016, RY2017
showed additions to passengers per day using low carbon public transport. The Technological Transformation
Program for Bogota's Integrated Public Transport System (BOGOTA SITP) in Colombia (IDB) reported 42,696
15
passengers per day, and the Mexico Urban Transport Transformation Project (IBRD) reported 133,000
passengers per day.
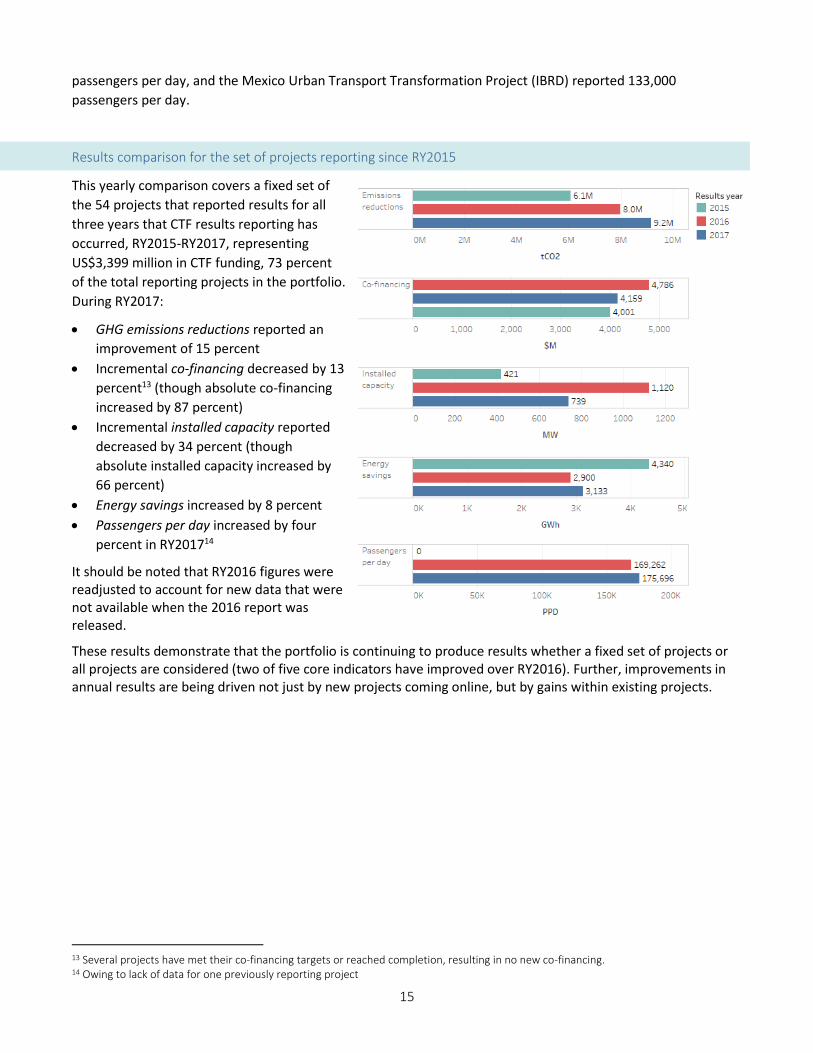
Results comparison for the set of projects reporting since RY2015
This yearly comparison covers a fixed set of
the 54 projects that reported results for all
three years that CTF results reporting has
occurred, RY2015-RY2017, representing
US$3,399 million in CTF funding, 73 percent
of the total reporting projects in the portfolio.
During RY2017:
• GHG emissions reductions reported an
improvement of 15 percent
• Incremental co-financing decreased by 13
percent13 (though absolute co-financing
increased by 87 percent)
• Incremental installed capacity reported
decreased by 34 percent (though
absolute installed capacity increased by
66 percent)
• Energy savings increased by 8 percent
• Passengers per day increased by four
percent in RY201714
It should be noted that RY2016 figures were readjusted to account for new data that were not available when the 2016 report was released.
These results demonstrate that the portfolio is continuing to produce results whether a fixed set of projects or all projects are considered (two of five core indicators have improved over RY2016). Further, improvements in annual results are being driven not just by new projects coming online, but by gains within existing projects.
13 Several projects have met their co-financing targets or reached completion, resulting in no new co-financing. 14 Owing to lack of data for one previously reporting project

16
US$1,287M in CTF funding 12 projects reporting results 0 new projects this reporting year
GHG Emissions Reductions: Annual GHG emissions reductions in the African region come exclusively from renewable energy projects (100 percent) and are currently at ten percent of the target level. Cumulative GHG emissions reductions total 1.3 MtCO2, with 69 percent produced in RY2017. Three projects generated the majority of RY2017 reductions: the Sustainable Energy Acceleration Program in South Africa (IFC/AfDB) (39 percent), ESKOM Renewable Support Project-Wind South Africa (IBRD/AfDB) (33 percent), and Morocco Ouarzazate CSP (Noor I) MENA-CSP (IBRD/AfDB) (28 percent). Fifty percent of projects experienced an increase in GHG reductions over last year.
Co-financing: Six of the twelve projects in Africa leveraged co-financing in RY2017, totaling US$1,418 million. In RY2017, most of the co-financing was mobilized by the Noor II and III Concentrated Solar Power (CSP) Project in the Middle East and North Africa (MENA) region (IBRD/AfDB) (60 percent) and the Sustainable Energy Acceleration Program in South Africa (IFC/AfDB) (35 percent). RY2017 co-financing came primarily from bilateral sources (59%), with smaller portions from MDBs (21%), other sources (19%), and the private sector (3%). Cumulative co-financing is currently at 30 percent of the target level.
Africa

17
Installed Capacity: One project reported additions to installed capacity totaling 50 MW in RY2017. The largest portion of cumulative installed capacity in Africa is attributable to solar technology (76 percent) via the Ouarzazate CSP (Noor I) project in the MENA region (IBRD/AfDB) and the joint AfDB/IFC Sustainable Energy Acceleration Program in South Africa. The IBRD/AfDB ESKOM Renewable Support Project-Wind in South Africa project contributes the remaining 24 percent of cumulative installed capacity. Overall, cumulative installed capacity in the region is at 13 percent of the target level.
Energy Savings: While no projects in the region reported achieved energy savings in RY2016, two MDB-approved projects are expected to result in 150 MWh per year in energy savings, once implemented.
Passengers per Day: There are no currently reporting transport projects in the region.
Africa region co-benefits highlights
Environment
• US$27.3 million in avoided local pollution from Morocco’s Ouarzazate CSP (Noor I) and Morocco-Noor II and III CSP projects (IBRD)
• Promoting the development of sustainability in business by providing long term financing to projects that result in environmental benefits
Energy Security and Reliability
• Reducing likelihood of power losses and interruptions by improving supply quality
• Stabilizing economic activities such as agriculture, tourism, and crafts by increasing power availability
• Improving energy security by hybridization of conventional power plants running on gas and other fossil fuels and deployment of
concentrated solar technologies in industries for process heat/stream
Economy
• Increasing local manufacturing through local content requirements
Workforce
• Creating 1,511 jobs via the ESKOM Renewable Support Project-CSP and ESKOM Renewable Support Project-Wind projects in South Africa (IBRD)
• Building the capacity of the existing and future workforce in the MENA region to specialize in a renewable energy technology niche and the related manufacturing and services
Social
• Increasing participation by historically disadvantaged citizens and marginalized regions
• Improving households’ quality of life, in particular, for women

18
US$1593M in CTF funding 25 projects reporting results 6 new projects this reporting year
GHG Emissions Reductions: Five out of 25 projects reported achieved GHG emissions reductions, for a total of 0.9 MtCO2 in RY2017 and a cumulative total of 1.7 MtCO2. Most of the RY2017 GHG reductions were reported for the Himachal Pradesh Environmentally Sustainable Development Policy Loan15 in India (IBRD) (50 percent), followed by the Indonesia Geothermal Clean Energy Investment Project, implemented by IBRD (33 percent). Annual reductions are currently at 1 percent of the target level. Twelve percent of projects experienced an increase in GHG reductions over last year.
Co-financing: Ten of 25 projects in the Asia region leveraged co-financing in RY2017, totaling US$574 million. The majority of that co-financing was leveraged by two projects: Private Sector Geothermal Energy Program in Indonesia (ADB) (US$144 million), and Grid-Connected Rooftop Solar Program in India (IBRD) (US$126 million). The largest portion of RY2017 co-financing came from MDBs (62 percent), followed by bilateral sources (21
15 The incremental hydropower capacity during each year resulting from the accelerated development of projects through execution of reforms under DPL is calculated as follows: Annual Incremental Hydro Power Capacity (during each year) = (Annual Hydro Power Capacity Addition after DPL) – (Annual Hydro Power Capacity Addition in the Business as Usual Case (without CTF))
Asia
(GHG reductions/ Energy savings) Targets ANNUAL (Co-financing/ Installed capacity) Targets CUMULATIVE (Passengers per day) Targets UPON IMPLEMENTATION

19
percent), the private sector (12 percent), and government (5 percent). Cumulative co-financing is currently at 15 percent of the target level.
Installed capacity: Five projects (twenty percent of the total) in Asia reported additional installed capacity in RY2017, the largest being the Renewable Energy Accelerator Program (REAP) and REAP Expansion project in the Philippines (IFC) at 110 MW for the year. RY2017 installed capacity is 48 percent solar, 30 percent geothermal, and 21 percent wind.
Cumulative installed capacity in Asia is 699 MW, with the largest portion coming from geothermal (36 percent), followed by solar (31 percent), hydro (19 percent), and wind (13 percent). The largest single contributor to this total is the ADB-implemented Private Sector Renewable Energy program in Thailand, with 177 MW from wind and solar sub-projects. Cumulative installed capacity in the region is at 4 percent of the target level.
Energy Savings: While no projects in the region reported achieved energy savings in RY2017, three projects in the portfolio are expected to produce 1479 GWh in annual energy savings once fully implemented.
Passengers per Day: No projects in the region reported achieved passengers per day in RY2017, however, five projects are expected to result in 1,410,960 passengers per day using sustainable public transit once fully implemented.
#CIFImpact | Private Sector Geothermal Energy Program in Indonesia(ADB)
• CTF financing: US$150 million
• GHG emissions reductions: anticipated 88,000,000 tCO2 over the lifetime of the project
• Co-financing: US$2267.7 raised so far of US$2450 million target (93%)
• Installed capacity: 105.4MW of 750MW target (14%)
The ADB Private Sector Geothermal Energy Program aims to develop geothermal projects throughout Indonesia by overcoming traditional financial barriers to increase penetration and investment security. Financing geothermal developments will help de-risk the technology and country risk for other private sector investors and contribute to the Government’s target of increasing renewable energy from 5 to 23 percent of the country’s energy mix by 2025.
The program supports three sub-projects. The Sarulla Geothermal Power Project will construct and operate three geothermal power generation units with a total net capacity of approximately 320 MW south of Medan in North Sumatra. The Muara Laboh Geothermal Power Project will operate and maintain a single power generation unit with a capacity of about 80 MW southeast of Padang in the province of West Sumatra. The Rantau Dedap Geothermal Power Project is a phase 1 geothermal resource exploration involving early site development and drilling activities near Palembang in South Sumatra. Phase 1 activities have confirmed geothermal capacity to be 92MW, helping to de-risk phase 2 activities, including steam field development and power plant construction.
For this reporting period, the program has achieved 105 MW of installed capacity with one power generation unit under the Sarulla project reaching commercial operation in Q2 2017. This is equivalent to 14 percent of the target geothermal capacity. The program has also generated a total of 5,600 skilled and unskilled jobs during the projects' construction and operation phases, directly benefiting local communities.
Photo courtesy of Sarulla Operations Ltd.
20
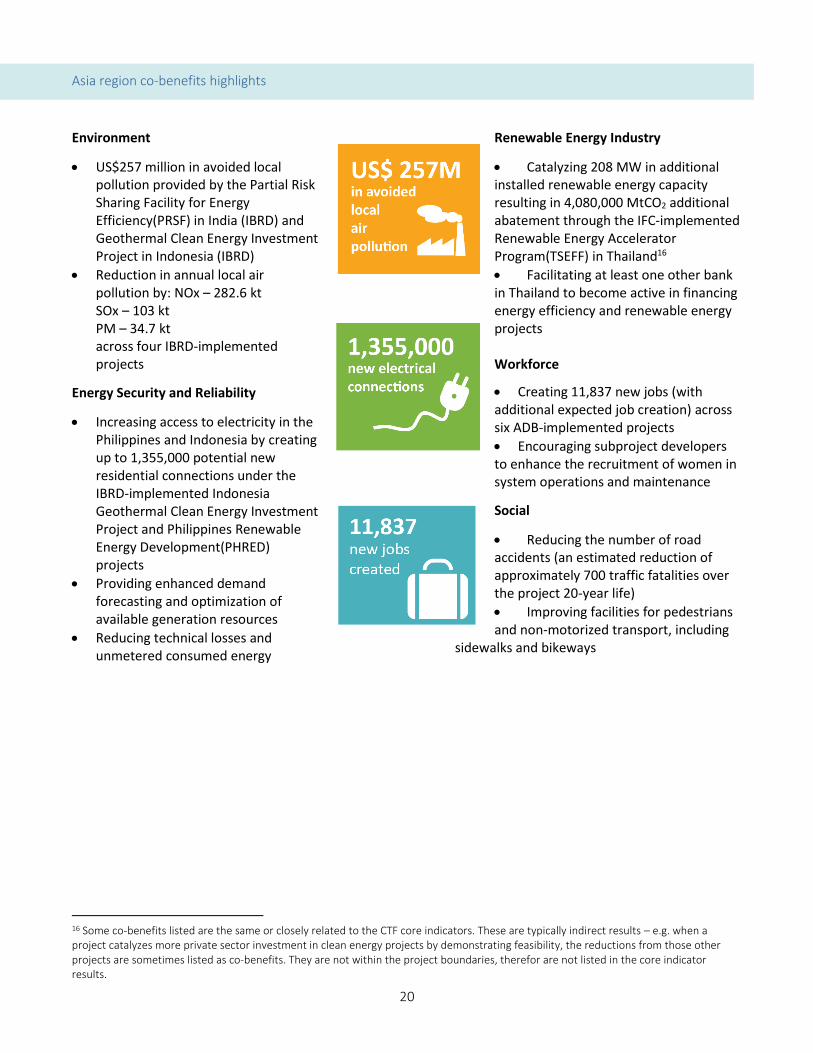
Asia region co-benefits highlights
Environment
• US$257 million in avoided local pollution provided by the Partial Risk Sharing Facility for Energy Efficiency(PRSF) in India (IBRD) and Geothermal Clean Energy Investment Project in Indonesia (IBRD)
• Reduction in annual local air pollution by: NOx – 282.6 kt SOx – 103 kt PM – 34.7 kt across four IBRD-implemented projects
Energy Security and Reliability
• Increasing access to electricity in the Philippines and Indonesia by creating up to 1,355,000 potential new residential connections under the IBRD-implemented Indonesia Geothermal Clean Energy Investment Project and Philippines Renewable Energy Development(PHRED) projects
• Providing enhanced demand forecasting and optimization of available generation resources
• Reducing technical losses and unmetered consumed energy
Renewable Energy Industry
• Catalyzing 208 MW in additional installed renewable energy capacity resulting in 4,080,000 MtCO2 additional abatement through the IFC-implemented Renewable Energy Accelerator Program(TSEFF) in Thailand16
• Facilitating at least one other bank in Thailand to become active in financing energy efficiency and renewable energy projects Workforce
• Creating 11,837 new jobs (with additional expected job creation) across six ADB-implemented projects
• Encouraging subproject developers to enhance the recruitment of women in system operations and maintenance
Social
• Reducing the number of road accidents (an estimated reduction of approximately 700 traffic fatalities over the project 20-year life)
• Improving facilities for pedestrians and non-motorized transport, including
sidewalks and bikeways
16 Some co-benefits listed are the same or closely related to the CTF core indicators. These are typically indirect results – e.g. when a project catalyzes more private sector investment in clean energy projects by demonstrating feasibility, the reductions from those other projects are sometimes listed as co-benefits. They are not within the project boundaries, therefor are not listed in the core indicator results.

21
US$905M in CTF funding 23 projects reporting results 1 new project this reporting year
GHG Emissions Reductions: Most of the RY2017 GHG emissions reductions (97 percent) in Europe and Central Asia came from projects in Turkey: 77 percent from the Private Sector Renewable Energy and Energy Efficiency Project (IBRD) and 8 percent from energy finance programs (Commercializing Sustainable Energy Finance Program (CSEF) (IFC) and Private Sector Bank-Intermediated Project (TURSEFF II, TurREFF, MunSEFF)) (EBRD). Ukraine and Kazakhstan contributed 3 percent and 11 percent, respectively. Annual GHG emissions reductions are currently at 32 percent of the target level. Seventeen percent of projects increased their annual GHG emissions reductions over last year.
Co-financing: Twelve of 23 projects in Europe and Central Asia leveraged co-financing in RY2017 totaling US$2,484 million. Government sources accounted for 83 percent of RY2017 co-financing in the region. The largest mobilizer of RY2017 co-financing was the Private Sector Renewable Energy and Energy Efficiency Project in Turkey (IBRD) at US$2117 million. This project has also leveraged the largest amount of co-financing cumulatively, at US$3 billion. Cumulative co-financing is currently at 62 percent of the target level.
Installed Capacity: Three projects in Europe and Central Asia reported additions to installed capacity in RY2017, totaling 116 MW. The Turkish Private Sector Sustainable Energy Financing Facility (TurSEFF) (EBRD) accounted
Europe and Central Asia

22
for 53 percent of this capacity. RY017 installed capacity was 88 percent solar, 8 percent hydro, and 4 percent other.
The region’s cumulative installed capacity of 9,689 MW comes in largest part from hydro projects (37 percent), followed by wind (24 percent), solar (21 percent), geothermal (14 percent), and other (3 percent). Cumulative installed capacity in the region is at 41 percent of the target level. Thirteen percent of projects added new installed capacity over last year.
Energy Savings: The majority of the annual energy savings reported in Europe and Central Asia (51 percent) came from the Private Sector Renewable Energy and Energy Efficiency Project in Turkey (IBRD). Energy savings for the region are at 39 percent of the target level.
Passengers per Day: The Europe and Central Asia region currently has no transport projects.
#CIFImpact | Near Zero Waste Program (EBRD)
• CTF funding: US$20 million
• GHG emissions reductions: 110,000 tCO2
per year
• Reduction in recycled packaging waste:
22,000 tons per year
• Reduction in landfilled waste: 55,000 tons
per year
In Turkey, the waste sector accounts for 8.5 percent of the country’s GHG emissions,
which is four times higher than many developed countries. These emissions are associated with landfill waste and wastewater. Over half of the waste generated in cities (54 percent) is sent to sanitary landfills, while the rest ends up in dumpsites. Rising standards of living in Turkey will increase the amount of waste generated, which will further increase emissions. Waste generation and management have been acknowledged as a priority for Turkey.
The EBRD and CTF are funding a multi-sector intervention in Turkey to promote waste minimization and improved waste management. The Near Zero Waste (NØW) program, launched in 2014, supports 10-12 innovative waste minimization and pollution prevention projects for an approximate value of US$125 million. It benefits from a dedicated allocation of US$20 million from the CTF. The EU IPA is funding technical assistance in the amount of €2 million.
Because Turkey does not yet have an established infrastructure and market for production, collection, transportation, processing, and storage of recycled waste, many companies face financial difficulties when implementing waste management schemes. The NØW program helps innovative companies in the private sector with such financing challenges, including compensating early mover costs. In addition, the EBRD also provides policy dialogue support to improve the current regulatory framework to connect sector associations, municipalities, and the government.

23
Europe and Central Asia region co-benefits highlights
Environment
• Reducing local pollution (SO2, NOx) through reductions of energy consumption and heat generation
• Decreasing pollution load on rivers and other surrounding waterways through improved sludge management
Energy Security and Reliability
• Increasing overall energy system reliability, minimizing downtime, and emergency responses
Renewable Energy Industry
• Increasing private sector involvement in the development and financing of clean energy and energy efficiency investments
• Changing the nature of district heating systems in participating utilities from inefficient, supply-driven, constant-flow systems to more efficient, demand-driven, variable flow systems
• Demonstrating potential for future replication and accelerating the uptake of more efficient technologies to bring gradual overall sector improvement through significant energy cost savings
Social
• Improving health due to avoided adverse effects of pollution
• Providing lower cost heat, which particularly benefits low-income families often headed by women (improved quality of heat supply most noticeable to women, who tend to take care of housekeeping activities)

24
US$904M in CTF funding 25 projects reporting results 6 new projects this reporting year
GHG Emissions Reductions: Cumulative GHG emissions reductions in Latin America and the Caribbean are primarily from the Efficient Lighting and Appliance program in Mexico (IBRD) (47 percent). In RY2017, 46 percent of GHG emissions reductions were attributable to the Renewable Energy Financing Facility (REFF) in Mexico (IDB). Annual GHG emissions reductions are at 36 percent of the target level. Twenty-five percent of projects increased their GHG emissions reductions over last year, while 13 percent of projects saw emissions reductions decline (although none by more than 12 percent).
Co-financing: Four of 25 projects in the Latin America and Caribbean region leveraged co-financing in RY2017, totaling US$36 million. The ECOCASA Program-Energy Efficiency Program Part II in Mexico (IDB) accounted for a majority of RY2017 co-financing (56 percent). The largest portion of cumulative co-financing in the region has been leveraged by the Mexico Urban Transport Transformation Project (IBRD) at US$3,550M (43 percent), primarily in RY2013 and RY2015. Private sector sources accounted for 83 percent of RY2017 co-financing, followed by MDBs at 17 percent. Cumulative co-financing is currently at 83 percent of the target level.
Installed Capacity: One project in the Latin America and Caribbean region reported additions to installed capacity in RY2017, totaling 252MW: the Renewable Energy Financing Facility (REFF) in Mexico (IDB).
Latin America and the Caribbean
(GHG reductions/ Energy savings) Targets ANNUAL (Co-financing/ Installed capacity) Targets CUMULATIVE (PPD) Passengers per day UPON IMPLEMENTATION

25
Cumulatively and in RY2017, wind is the primary source of installed capacity at 1,119 MW cumulatively (82 percent of the cumulative total).
Sixty-nine percent of cumulative installed capacity comes from the Renewable Energy Financing Facility (REFF) project in Mexico (IDB) through mostly wind and a small portion of solar (30 MW). Cumulative installed capacity in the region is at 7 percent of the target level. Four percent of projects added new installed capacity in the last year.
Energy Savings: Nearly all energy savings generated in Latin America and the Caribbean for RY2017 (92 percent) came from the Efficient Lighting and Appliance Project in Mexico (IBRD). Energy savings for the region are at 28 percent of the target level.
Passengers per Day: Two projects reported passengers per day using low carbon public transit in RY2017: the Mexico Urban Transport Transformation project in Mexico (IBRD) (133,000 passengers per day) and the Technological Transformation Program for Bogota’s Integrated Public Transport System in Colombia (IDB) (42,696 passengers per day). That puts the region at four percent of the target level.
#CIFImpact | Energy Efficiency Green Bonds project in Mexico (IDB)
CTF financing: US$19 million
GHG emissions reductions: anticipated 3,300,000 tCO2 over the lifetime of the project (CTF component)
Co-financing: US$114 million raised so far of US$63 million target (181%)
Energy savings: anticipated 1,120 GWh/year
This program seeks to provide an alternative financing mechanism for energy efficiency projects in Mexico through “green” asset-backed securities (ABSs). It involves a two-step financing mechanism. First, the IDB Group extended a senior revolving credit line (warehouse line) for up to US$50 million to a special purpose vehicle to purchase and accumulate receivables of energy efficiency
projects developed by two energy services companies (ESCOs) for their further securitization.
Second, the IDB Group provided a partial credit guarantee for up to US$56 million to support the securitization of the receivables issued in local and international capital markets. This mobilization step refinances the warehousing line through an offerings of green ABS in the local capital markets. The debt service of the green ABS is backed by the energy savings of the underlying projects. The guarantees provide additional credit comfort to bondholders.
The underlying projects include small-scale energy efficiency and renewable energy projects in Mexico. Each project must prove energy savings of at least 15 percent from their baseline and in average annual reductions of 3,000 tCO2.
The project is breaking new ground not only in Mexico but globally, as it is the first ever bond issuance backed by energy savings receivables. It promotes impact investing and opens a new financing channel for ESCOs to fund clean energy projects. The project mobilized blended financing from the CTF for US$19 million and from the Green Climate Fund (GCF) for US$20 million.
Energy efficiency equipment upgrades are being installed in six department stores as part of a project financed by green bonds Mexico.

26
Latin America and the Caribbean region co-benefits highlights
Environment
• Reducing pollution from thermal power generation, diesel generation, kerosene, candles, and batteries
• Reducing GHG emissions, preventing ozone depletion, and air pollution (NOX, SOX)
Energy Security and Reliability
• Enhancing energy security in the country by using indigenous resources
• Improving the financial sustainability of the state utility
• Lowering country energy cost and improving energy mix
Renewable Energy Industry
• Providing efficiency gains through improved renewable energy technology for domestic appliances and machinery for productive uses
• Improving reliability through locally adjusted renewable energy service provision models
• Providing potential solar PV manufacturing industry growth and stimulation of local employment
• Enabling development of additional 112.5 MW of wind power, possibly leading to an estimated 150 to 350 MW of incremental private wind power projects over a five-year period (abating additional 2.0 to 4.7 MtCO2) via the IDB-implemented Private Sector Wind Development (La Ventosa) in Mexico
Economy
• Increasing the capacity of the local banking sector to finance commercial investments in sustainable energy
• Demonstrating commercial viability of sustainable energy finance
• Developing local industry and increased employment from renewable energy expansion into rural areas
Social
• Providing social strengthening through gender-targeted interventions
• Increasing social inclusion and improving standards of living through increased affordability of efficient appliances
• Reducing exposure to airborne pollutants
• Improving traffic safety

27
US$1,517M / US$3,171M in CTF funding 43 private / 42 public projects reporting results 3 private / 10 public new projects this reporting year
Public vs. Private Sector
(GHG reductions/ Energy savings) Targets ANNUAL (Co-financing/ Installed capacity) Targets CUMULATIVE (PPD) Passengers per day UPON IMPLEMENTATION

28
Private sector Public sector GHG Emissions Reductions:
Share reporting achieved results in RY2017 (number of total)
16 of 43 private sector projects 10 of 42 public sector projects
Largest contributor in RY2017 (amount, share)
Projects in Mexico at almost 600,000 tCO2 (26% of the RY2017 actual)
Private Sector Renewable Energy and Energy Efficiency Project in Turkey (IBRD) 17 at more than 3 MtCO2/yr (43% of the RY2017 actual)
Co-financing:
Share leveraging co-financing in RY2017
11 of 43 projects 20 of 42 projects
Largest amount leveraged RY2017 (share)
The Sustainable Energy Acceleration Program in South Africa (IFC/AfDB) at $802 million (64% of the RY2017 total)
The Private Sector RE and EE Project (IBRD) in Turkey at $2,117 million (53% of the RY2017 total)
Largest amount leveraged cumulatively (share)
The Sustainable Energy Acceleration Program in South Africa (IFC/AfDB) at $2,027 million(28% of the cumulative total)
The Urban Transport Transformation Project in Mexico (IBRD) at $3,550 million (26% of the cumulative total)
Source of largest portion of RY2017 financing (percent)
Private sources, 43% Government sources, 52%
Cumulative co-financing percent of target
47% 38%
Installed Capacity:
Share with new capacity in RY2017
7 of 43 projects reported new installed capacity in RY2017.
3 of 42 projects reported new installed capacity in RY2017
Largest amount of RY2017 installed capacity
The Private Sector Geothermal Energy Program (Indonesia, ADB) reported the largest amount of new installed capacity at 105MW, 29 percent of the RY2017 total.
The Renewable Energy Financing Facility (REFF) (Mexico, IDB) reported the largest amount of new installed capacity at 252MW, 79 percent of the RY2017 total.
Largest amount of cumulative installed capacity
Projects in Mexico reported the largest amount of cumulative installed capacity at 318MW, 21 percent of the cumulative total.
The Private Sector RE and EE Project (Turkey, IBRD) reported the largest amount of new installed capacity at 937MW, 40 percent of the cumulative total.
Technology with largest share of RY2017 new capacity
Solar at 57 percent of new installed capacity.
Wind at 75 percent of new installed capacity
Cumulative percent of target
35% 11%
17 Note that while the project is aimed at catalyzing private sector investments in RE and EE, the project is implemented in cooperation with the Development Bank of Turkey and Industrial Development Bank of Turkey and therefore falls under the public sector designation within the CTF portfolio.

29
Energy Savings: Share with energy savings in RY2017
6 of 43 projects reported energy savings in RY2017.
2 of 42 projects reported energy savings in RY2017
Largest contributor (share)
District Heating Modernisation Framework (DHMFF) (Kazakhstan, EBRD) produced the largest amount of RY2017 energy savings at 398 GWh/yr, 37 percent of the total.
The Private Sector RE and EE Project (Turkey, IBRD) produced the largest amount of RY2017 energy savings at 1234 GWh/yr, 59 percent of the total.
Percent of target 22% 37% Passengers per Day:
Share reporting achieved results
NA (There are no private sector projects targeting passengers per day).
Two projects reported 175,696 passengers per day.
Percent of target NA 3%
Online Reporting
Results data from RY2017 will be uploaded to the CTF’s results database, an online platform that provides convenient open access to CTF results data since 2016. It builds on the World Bank Open Data platform and can be accessed here. The development of a single, integrated system for CIF project data collection and results reporting (the FIF system) continues to progress. The beta version of this integrated platform is under detailed review.
International Financial Institutions (IFI) Working Group on GHG Harmonization
Since its launch in October 2008, the MDBs have been working on GHG accounting through an IFI working group (IFIWG). The focus of the IFIWG’s efforts is on harmonizing approaches for GHG accounting. Outcomes of this group include an overall harmonization framework document published in 2012. In 2015, the IFIWG publicly released harmonized approaches for GHG accounting of renewable energy, energy efficiency, and transport sector projects.
In response to the CTF Trust Fund Committee request that MDBs report every two years, beginning in 2014, “on the current and planned work of each MDB in GHG analysis and the development and application of methodology for estimating GHG emissions reduction and their joint efforts to harmonize GHG estimation methodology among the MDBs,” a status update was compiled and presented to the CTF Trust Fund Committee as an information document at the December 2016 meeting. The next update will be produced in 2018.
Topics of Further Interest

30
Annex 1: Summary of Results (2017)18 Emissions reductions Co-financing Installed Capacity Passengers per day Energy savings
Country Project name Public / Private
MDB CTF
US$M 20
17
Cu
mu
lati
ve
Targ
et
20
17
Cu
mu
lati
ve
Targ
et
20
17
Cu
mu
lati
ve
Targ
et
20
17
Targ
et
20
17
Cu
mu
lati
ve
Targ
et
Chile Concentrated Solar Power Project (CSPP)
Private IDB 67 129,300 359 50
Chile Energy Efficiency and Self-Supply Renewable Energy Program
Private IDB 25 92,000 110 36 87
Chile Geothermal Risk Mitigation Program
Private IDB 75 290,000 500 100
Chile Large-Scale Photo-Voltaic Program (LSPVP)
Private IDB 25 152,718 326,549 185,000 335 72 155
Colombia Energy Efficiency Financing Program for the Services Sector
Public IDB 11 15,276 20 10 69
Colombia Energy Efficiency Program in the San Andrés, Providencia and Santa Catalina Archipelago
Public IDB 11 9,425 93 19,000 14
Colombia Innovative Instruments to Foster Energy Efficiency in SMEs in Colombia
Private IDB 5 38 63
Colombia Non-Conventional Renewable Energy
Public IDB 11 19,000 34 20
Colombia Renewable Energy Program for Colombia
Private IDB 10 21,760 52 28
Colombia Strategic Public Transportation Systems Program(SETP)
Public IDB 20 86,000 361 787,000
Colombia Sustainable Energy Finance Program
Private IFC 7 440,000 20 103
Colombia
Technological Transformation Program for Bogota's Integrated Public Transport System (BOGOTA SITP)
Public IDB 40 19,182 39,009 7,062 8 63 40 42,696 33,566
Colombia Utility Scale RE-geothermal Public IDB 10 165,000 100 50
DPSP-Regional
Energy Efficiency and Self-Supply Renewable Energy Program
Private IDB 20 80,000 100 35 4 4 43
DPSP-Regional
Private Sector Geothermal Program: Indonesia & Philippines
Private ADB 30 375,000 120 90
18 For private sector programs, targets refer to TFC approved proposal, while for public sector projects, targets refer to MDB approved documents. Redacted areas in some private sector projects contain confidential data.

31
Emissions reductions Co-financing Installed Capacity Passengers per day Energy savings
Country Project name Public / Private
MDB CTF
US$M 20
17
Cu
mu
lati
ve
Targ
et
20
17
Cu
mu
lati
ve
Targ
et
20
17
Cu
mu
lati
ve
Targ
et
20
17
Targ
et
20
17
Cu
mu
lati
ve
Targ
et
DPSP-Regional
Renewable Energy Mini-grids and Distributed Power Generation
Private ADB 34 1,513 2,146 71,000 3 12 20 2 30
DPSP-Regional
SEMed Private Renewable Energy Framework (SPREF)
Private EBRD 35 675,000 70 885 432
DPSP-Regional
Utility Scale Renewable Energy: Geothermal / Caribbean
Public IDB 20 250,000 200 62
DPSP-Regional
Utility Scale Renewable Energy: Solar Photovoltaic Financing
Private IFC 35 70,000 140 90
Egypt Wind Power Development Project(Transmission) T&D
Public IBRD 150 1,400,000 2 30 654 790
Honduras Utility Scale Renewable Energy: Solar Photovoltaic Financing
Private IFC 20 79,693 99,256 70,000 189 160 82 80
India Grid connected rooftop solar Public IBRD 125 1 126 126 675 4 4 400
India Himachal Pradesh Environmentally Sustainable Development Policy Loan
Public IBRD 100 470,000 940,000 3,780,000 113 2,058 135 1,334
India Partial Risk Sharing Facility in Energy Efficiency
Public IBRD 25 733,657 12 145 1,002
India Shared Infrastructure for Solar Parks
Public IBRD 50 5 4,420 3,500
India Solar Park Transmission Public ADB 50 7,060,273 400 4,200
India Solar Park: Rajasthan Public ADB 200 5,400,000 28 44 600 4,300
India Solar Rooftop PV Public ADB 175 441,700 830 400
Indonesia Geothermal Electricity Finance Private IFC 50 3,700,000 2,270 660
Indonesia Geothermal Energy Upstream Development Project
Public IBRD 50 330,000 445 65
Indonesia Indonesia Geothermal Clean Energy Investment Project
Public IBRD 125 305,555 305,555 1,100,000 80 122 450 75 150 150
Indonesia Private Sector Geothermal Energy Program
Private ADB 150 4,400,000 144 963 2,450 105 105 750
Kazakhstan District Heating Modernization Framework
Private EBRD 34 128,000 655,985 400,000 18 118 100 398 1,592 1,200
Kazakhstan Renewable Energy Finance Facility (KAZREFF)
Private EBRD 39 78,969 121,670 270,000 153 153 95 50 50 65 40 118
Kazakhstan Renewable Energy I-Waste Management Framework
Private EBRD 27 250,000 1,000,000 300,000 21 90 65 53 212 40

32
Emissions reductions Co-financing Installed Capacity Passengers per day Energy savings
Country Project name Public / Private
MDB CTF
US$M 20
17
Cu
mu
lati
ve
Targ
et
20
17
Cu
mu
lati
ve
Targ
et
20
17
Cu
mu
lati
ve
Targ
et
20
17
Targ
et
20
17
Cu
mu
lati
ve
Targ
et
Kazakhstan Renewable Energy II-Kazakh Railways Sustainable Energy Program
Private EBRD 1 80,000 45
Kazakhstan Yereymentau Large Wind Power Plant
Private EBRD 26 150,000 88 97 50
MENA-CSP Morocco Ouarzazate CSP (Noor I) Public IBRD + AfDB
197 254,800 257,555 240,000 716 1,230 160 160
MENA-CSP Morocco-Noor II and III CSP Public IBRD + AfDB
238 521,670 1,301 1,301 2,439 350
Mexico ECOCASA Program-Energy Efficiency Program Part II
Public IDB 52 6,836 10,580 25,000 20 217 160 16 25 36
Mexico Efficient Lighting and Appliance Project
Public IBRD 50 747,600 7,419,885 616,800 956 663 677 4,302 1,200
Mexico Energy Efficiency Program-Part 1 Private IDB 22 20,794 20,794 327,700 6 114 63 42 42 1,120
Mexico
Geothermal Financing and Risk Transfer Facility / Utility Scale RE-geothermal-Geothermal Financing and Risk Transfer facility
Public IDB 54 1,100,000 12 1,211 300
Mexico Private Sector Wind Development (La Ventosa)
Private IFC 16 97,900 574,619 180,000 180 172 68 68
Mexico Renewable Energy Financing Facility(REFF)
Public IDB 71 1,508,671 3,602,763 2,011,242 2,026 2,430 252 899 1,000
Mexico Renewable Energy Program Private IDB 53 900,000 650 251 350
Mexico Urban Transport Transformation Project
Public IBRD 200 150,000 436,464 1,960,000 1 3,550 2,494 133,000 3,960,000
Morocco Clean and Efficient Energy Project Public IBRD 25 78,018 32 32 134 75
Morocco One Wind Energy Plan Public AFDB 125 4,047,500 28 147 2,710 1,100
Nicaragua Geothermal Exploration and Transmission Improvement Program under the PINIC
Public IDB 10 110,655 16 22
Nigeria Line of Credit for Renewable Energy and Energy Efficiency Project
Private AFDB 25 158,580 3 3 271 107
Philippines Energy Efficient Electric Vehicles project
Public ADB 13 269,000 399 700,000
Philippines Philippines Cebu Bus Rapid Transit(BRT) Demonstration Project
Public IBRD 26 193,000 18 30 204 125,000
Philippines Philippines Manila BRT Public IBRD 24 206,892 86 300,000

33
Emissions reductions Co-financing Installed Capacity Passengers per day Energy savings
Country Project name Public / Private
MDB CTF
US$M 20
17
Cu
mu
lati
ve
Targ
et
20
17
Cu
mu
lati
ve
Targ
et
20
17
Cu
mu
lati
ve
Targ
et
20
17
Targ
et
20
17
Cu
mu
lati
ve
Targ
et
Philippines REAP and Expansion of the Approved RE Accelerator Program (REAP)
Private IFC 26 230,000 330 155
Philippines Renewable Energy Development (PHRED)
Public IBRD 45 523,370 500 71 162
Philippines Sustainable Energy Finance Program
Private IFC 4 300,000 63 63
South Africa EE Program Private IFC 3 78,667 9 7
South Africa ESKOM Renewable Support Project-CSP
Public IBRD + AfDB
264 570,000 1 415 100
South Africa ESKOM Renewable Support Project-Wind
Public IBRD + AfDB
86 298,000 536,000 238,000 195 787 100 100
South Africa Expansion of the Approved South Africa Sustainable Energy Acceleration Program (SEAP)
Private IFC 58 470,000 700 100
South Africa Sustainable Energy Acceleration Program
Private AFDB 39 430,000 52 525 1,100 125
South Africa Sustainable Energy Acceleration Program
Private IFC 43 350,616 511,285 430,000 751 1,501 1,100 50 150 125
Thailand Private Sector Renewable Energy program
Private ADB 100 150,491 378,384 1,000,000 20 424 1,097 81 178 520
Thailand Renewable Energy Accelerator Program(TSEFF)
Private IFC 6 11,598 52,696 13,800 27 15 12
Thailand Sustainable Energy Finance Program(T-SEF)
Private IFC 5 822 42,900 16
Turkey Commercial Sustainable Energy Finance(CSEF) Phase II
Private IFC 30 14,000 390 30
Turkey Commercializing Sustainable Energy Finance Program (CSEF)
Private IFC 22 145,800 633,500 280,000 95 80 110 508 220
Turkey Financial Innovation for Renewable Energy (FIRE) Project
Private IFC 18 62,000 102 75
Turkey Geothermal Development Lending Facility
Private EBRD 25 240,000 303 50 300
Turkey Private Sector Bank-Intermediated Project (TURSEFF II, TurREFF, Mun SEFF
Private EBRD 70 1,263 706,949 540,000 23 518 795 230 5 911 1,210
Turkey Private Sector RE and EE Project Public IBRD 100 3,214,583 17,666,499 3,507,000 2,117 3,000 1,450 -10 937 951 1,234 10,726 1,382
Turkey Turkey Renewable Energy Integration project (T&D)
Public IBRD 50 690,000 37 97 1,025 600

34
Emissions reductions Co-financing Installed Capacity Passengers per day Energy savings
Country Project name Public / Private
MDB CTF
US$M 20
17
Cu
mu
lati
ve
Targ
et
20
17
Cu
mu
lati
ve
Targ
et
20
17
Cu
mu
lati
ve
Targ
et
20
17
Targ
et
20
17
Cu
mu
lati
ve
Targ
et
Turkey Turkish Private Sector Sustainable Energy Financing Facility (TurSEFF)
Private EBRD 50 188,211 1,113,422 750,000 28 902 200 64 218 56 4,067
Turkey Utility Scale RE-geothermal Public IBRD 40 260,371 31 31 208
Ukraine District Heating Energy Efficiency Public IBRD 51 330,000 9 12 332 560
Ukraine District Heating Modernisation Program
Private EBRD 51 350,000 30 227 350
Ukraine Renewable Energy II - Novoazovsk Wind Project
Private EBRD 21 115,000 485,000 106,000 116 43 33 33 320 1,349
Ukraine Renewable Energy Program Private IFC 36 41,291 67 45
Ukraine Renewables Direct Lending Facility-Creating Markets for Renewable Power (USELF 1)
Private EBRD 27 23,649 280,144 350,000 46 155 49 16 74 115 44 627
Ukraine Residential Energy Efficiency Finance Facility (UREEFF)
Private EBRD 24 232 232 50,000 21 136 1 1 130
Ukraine Second Urban Infrastructure Project
Public IBRD 50 475,392 4 9 300 470
Ukraine Sustainable Energy Lending Facility Replenishment (USELF 2)
Private EBRD 28 250,000 113 60
Ukraine Ukraine Second Power Transmission Project
Public IBRD 49 2,800,000 12 13 1,733 1,100 430
Vietnam Ha Noi Sustainable Urban Transport Program
Public ADB 100 8,400 70 197 1,336 157,000
Vietnam Sustainable Urban Transport for HCMC MRT Line 2
Public ADB 50 4,025 20 20 1,391 128,960
Vietnam Vietnam Distribution Efficiency Project
Public IBRD 30 269,148 56 404 770 414
Annex 2: Direct Finance Leveraged by Source (US$M)

35
MDB1 MDB2 Government Private sector Bilateral Other
Country Project name Public / Private
MDB CTF
US$M 20
17
Cu
mu
lati
ve
Targ
et
20
17
Cu
mu
lati
ve
Targ
et
20
17
Cu
mu
lati
ve
Targ
et
20
17
Cu
mu
lati
ve
Targ
et
20
17
Cu
mu
lati
ve
Targ
et
20
17
Cu
mu
lati
ve
Targ
et
Chile Concentrated Solar Power Project (CSPP)
Private IDB 67 66 20 130 143
Chile Energy Efficiency and Self-Supply Renewable Energy Program
Private IDB 25 22 88
Chile Geothermal Risk Mitigation Program
Private IDB 75 140 220 140
Chile Large-Scale Photo-Voltaic Program (LSPVP)
Private IDB 25
Colombia Energy Efficiency Financing Program for the Services Sector
Public IDB 11 20 10
Colombia Energy Efficiency Program in the San Andrés, Providencia and Santa Catalina Archipelago
Public IDB 11 91 3
Colombia Innovative Instruments to Foster Energy Efficiency in SMEs in Colombia
Private IDB 5 22 15 1
Colombia Non-Conventional Renewable Energy
Public IDB 11 10 24
Colombia Renewable Energy Program for Colombia
Private IDB 10 26 13 13
Colombia Strategic Public Transportation Systems Program(SETP)
Public IDB 20 300 61
Colombia Sustainable Energy Finance Program
Private IFC 7 24 24 54
Colombia
Technological Transformation Program for Bogota's Integrated Public Transport System (BOGOTA SITP)
Public IDB 40 8 63 40
Colombia Utility Scale RE-geothermal Public IDB 10
DPSP-Regional
Energy Efficiency and Self-Supply Renewable Energy Program
Private IDB 20 50 9 50
DPSP-Regional
Private Sector Geothermal Program: Indonesia & Philippines
Private ADB 30 30 90
DPSP-Regional
Renewable Energy Mini-grids and Distributed Power Generation
Private ADB 34 3 12 18
DPSP-Regional
SEMed Private Renewable Energy Framework (SPREF)
Private EBRD 35 7 76 250 3 617
DPSP-Regional
Utility Scale Renewable Energy: Geothermal / Caribbean
Public IDB 20

36
MDB1 MDB2 Government Private sector Bilateral Other
Country Project name Public / Private
MDB CTF
US$M 20
17
Cu
mu
lati
ve
Targ
et
20
17
Cu
mu
lati
ve
Targ
et
20
17
Cu
mu
lati
ve
Targ
et
20
17
Cu
mu
lati
ve
Targ
et
20
17
Cu
mu
lati
ve
Targ
et
20
17
Cu
mu
lati
ve
Targ
et
DPSP-Regional
Utility Scale Renewable Energy: Solar Photovoltaic Financing
Private IFC 35 35 55 50
Egypt Wind Power Development Project(Transmission) T&D
Public IBRD 150 2 26 70 62 450 71
Honduras Utility Scale Renewable Energy: Solar Photovoltaic Financing
Private IFC 20 46 25 63 60 81 95
India Grid connected rooftop solar Public IBRD 125 126 126 500 2 150 23
India Himachal Pradesh Environmentally Sustainable Development Policy Loan
Public IBRD 100 100 100 185 13 1,958
India Partial Risk Sharing Facility in Energy Efficiency
Public IBRD 25 127 12 18
India Shared Infrastructure for Solar Parks
Public IBRD 50 420 500 3,500
India Solar Park Transmission Public ADB 50 175 225
India Solar Park: Rajasthan Public ADB 200 28 44 300 300
India Solar Rooftop PV Public ADB 175 330 200 300
Indonesia Geothermal Electricity Finance Private IFC 50 30
Indonesia Geothermal Energy Upstream Development Project
Public IBRD 50 150 49 240 6
Indonesia Indonesia Geothermal Clean Energy Investment Project
Public IBRD 125 80 122 175 275
Indonesia Private Sector Geothermal Energy Program
Private ADB 150 34 221 350 400 44 289 1,100 66 453 600 20
Kazakhstan District Heating Modernization Framework
Private EBRD 34 9 73 100 6 18 3 39
Kazakhstan Renewable Energy Finance Facility (KAZREFF)
Private EBRD 39 84 84 95 46 46 24 24
Kazakhstan Renewable Energy I-Waste Management Framework
Private EBRD 27 13 90 8
Kazakhstan Renewable Energy II-Kazakh Railways Sustainable Energy Program
Private EBRD 1 25 45
Kazakhstan Yereymentau Large Wind Power Plant
Private EBRD 26 62 73 26 24
MENA-CSP Morocco Ouarzazate CSP (Noor I) Public IBRD + AfDB
197 1 200 133 245 126 418 406 40 379

37
MDB1 MDB2 Government Private sector Bilateral Other
Country Project name Public / Private
MDB CTF
US$M 20
17
Cu
mu
lati
ve
Targ
et
20
17
Cu
mu
lati
ve
Targ
et
20
17
Cu
mu
lati
ve
Targ
et
20
17
Cu
mu
lati
ve
Targ
et
20
17
Cu
mu
lati
ve
Targ
et
20
17
Cu
mu
lati
ve
Targ
et
MENA-CSP Morocco-Noor II and III CSP Public IBRD + AfDB
238 118 118 135 89 89 400 357 831 831 1,547 263 263
Mexico ECOCASA Program-Energy Efficiency Program Part II
Public IDB 52 50 50 20 123 117 110 9
Mexico Efficient Lighting and Appliance Project
Public IBRD 50 251 251 603 230 96 176 7 7
Mexico Energy Efficiency Program-Part 1 Private IDB 22 5 113 24 1 1 39
Mexico
Geothermal Financing and Risk Transfer Facility / Utility Scale RE-geothermal-Geothermal Financing and Risk Transfer facility
Public IDB 54 54 12 66 1,091
Mexico Private Sector Wind Development (La Ventosa)
Private IFC 16 60 60
Mexico Renewable Energy Financing Facility(REFF)
Public IDB 71 122 70 204 70 1,700 2,290
Mexico Renewable Energy Program Private IDB 53 70 36 327 580
Mexico Urban Transport Transformation Project
Public IBRD 200 1 52 150 1,542 1,505 1,956 839
Morocco Clean and Efficient Energy Project Public IBRD 25 32 34 125 9
Morocco One Wind Energy Plan Public AFDB 125 28 147 512 87 1,498 613
Nicaragua Geothermal Exploration and Transmission Improvement Program under the PINIC
Public IDB 10 13 4
Nigeria Line of Credit for Renewable Energy and Energy Efficiency Project
Private AFDB 25 3 3 75 196
Philippines Energy Efficient Electric Vehicles project
Public ADB 13 300 99
Philippines Philippines Cebu Bus Rapid Transit(BRT) Demonstration Project
Public IBRD 26 18 30 116 88
Philippines Philippines Manila BRT Public IBRD 24 41 45
Philippines REAP and Expansion of the Approved RE Accelerator Program (REAP)
Private IFC 26 105 265 75
Philippines Renewable Energy Development (PHRED)
Public IBRD 45 500
Philippines Sustainable Energy Finance Program
Private IFC 4 54 155

38
MDB1 MDB2 Government Private sector Bilateral Other
Country Project name Public / Private
MDB CTF
US$M 20
17
Cu
mu
lati
ve
Targ
et
20
17
Cu
mu
lati
ve
Targ
et
20
17
Cu
mu
lati
ve
Targ
et
20
17
Cu
mu
lati
ve
Targ
et
20
17
Cu
mu
lati
ve
Targ
et
20
17
Cu
mu
lati
ve
Targ
et
South Africa EE Program Private IFC 3 9 7
South Africa ESKOM Renewable Support Project-CSP
Public IBRD + AfDB
264 220 195
South Africa ESKOM Renewable Support Project-Wind
Public IBRD + AfDB
86 13 45 23 65 4 42 123 635
South Africa Expansion of the Approved South Africa Sustainable Energy Acceleration Program (SEAP)
Private IFC 58 90 610
South Africa Sustainable Energy Acceleration Program
Private AFDB 39 11 38 5 20 36 214 253
South Africa Sustainable Energy Acceleration Program
Private IFC 43 78 228
Thailand Private Sector Renewable Energy program
Private ADB 100 173 292 20 251 805
Thailand Renewable Energy Accelerator Program(TSEFF)
Private IFC 6 9 17
Thailand Sustainable Energy Finance Program(T-SEF)
Private IFC 5 5 16
Turkey Commercial Sustainable Energy Finance(CSEF) Phase II
Private IFC 30 100 290
Turkey Commercializing Sustainable Energy Finance Program (CSEF)
Private IFC 22 95 80
Turkey Financial Innovation for Renewable Energy (FIRE) Project
Private IFC 18 30 72
Turkey Geothermal Development Lending Facility
Private EBRD 25 100 100 3 3
Turkey Private Sector Bank-Intermediated Project (TURSEFF II, TurREFF, Mun SEFF
Private EBRD 70 328 332 34 23 140 90 350 16 23
Turkey Private Sector RE and EE Project Public IBRD 100 68 951 1,000 2,049 2,049 450
Turkey Turkey Renewable Energy Integration project (T&D)
Public IBRD 50 37 97 300 125 600
Turkey Turkish Private Sector Sustainable Energy Financing Facility (TurSEFF)
Private EBRD 50 418 200 28 374 110
Turkey Utility Scale RE-geothermal Public IBRD 40 31 31 60 302 15
Ukraine District Heating Energy Efficiency Public IBRD 51 9 12 332
Ukraine District Heating Modernisation Program
Private EBRD 51 19 155 11 72

39
MDB1 MDB2 Government Private sector Bilateral Other
Country Project name Public / Private
MDB CTF
US$M 20
17
Cu
mu
lati
ve
Targ
et
20
17
Cu
mu
lati
ve
Targ
et
20
17
Cu
mu
lati
ve
Targ
et
20
17
Cu
mu
lati
ve
Targ
et
20
17
Cu
mu
lati
ve
Targ
et
20
17
Cu
mu
lati
ve
Targ
et
Ukraine Renewable Energy II - Novoazovsk Wind Project
Private EBRD 21 45 43 71
Ukraine Renewable Energy Program Private IFC 36 67
Ukraine Renewables Direct Lending Facility-Creating Markets for Renewable Power (USELF 1)
Private EBRD 27 23 91 22 13 54 19 9 9 8
Ukraine Residential Energy Efficiency Finance Facility (UREEFF)
Private EBRD 24 100 15 10 3 26 3
Ukraine Second Urban Infrastructure Project
Public IBRD 50 4 9 300
Ukraine Sustainable Energy Lending Facility Replenishment (USELF 2)
Private EBRD 28 68 41 5
Ukraine Ukraine Second Power Transmission Project
Public IBRD 49 12 13 333 1,400
Vietnam Ha Noi Sustainable Urban Transport Program
Public ADB 100 1 27 362 22 42 251 46 128 723
Vietnam Sustainable Urban Transport for HCMC MRT Line 2
Public ADB 50 12 12 550 8 8 333 9 9 508
Vietnam Vietnam Distribution Efficiency Project
Public IBRD 30 56 399 449 314 5 8
Annex 3: Installed Capacity by Technology (MW) Total Solar Wind Hydro Geothermal Other
Country Project name Public / Private
MDB CTF
US$M 20
17
Cu
mu
lati
ve
Targ
et
20
17
Cu
mu
lati
ve
Targ
et
20
17
Cu
mu
lati
ve
Targ
et
20
17
Cu
mu
lati
ve
Targ
et
20
17
Cu
mu
lati
ve
Targ
et
20
17
Cu
mu
lati
ve
Targ
et
Chile Concentrated Solar Power Project (CSPP)
Private IDB 67 50 50
Chile Energy Efficiency and Self-Supply Renewable Energy Program
Private IDB 25 36 36
Chile Geothermal Risk Mitigation Program
Private IDB 75 100 100

40
Total Solar Wind Hydro Geothermal Other
Country Project name Public / Private
MDB CTF
US$M 20
17
Cu
mu
lati
ve
Targ
et
20
17
Cu
mu
lati
ve
Targ
et
20
17
Cu
mu
lati
ve
Targ
et
20
17
Cu
mu
lati
ve
Targ
et
20
17
Cu
mu
lati
ve
Targ
et
20
17
Cu
mu
lati
ve
Targ
et
Chile Large-Scale Photo-Voltaic Program (LSPVP)
Private IDB 25 72 155 72 155
Colombia Energy Efficiency Financing Program for the Services Sector
Public IDB 11
Colombia Energy Efficiency Program in the San Andrés, Providencia and Santa Catalina Archipelago
Public IDB 11
Colombia Innovative Instruments to Foster Energy Efficiency in SMEs in Colombia
Private IDB 5
Colombia Non-Conventional Renewable Energy
Public IDB 11 20 20
Colombia Renewable Energy Program for Colombia
Private IDB 10 28 28
Colombia Strategic Public Transportation Systems Program(SETP)
Public IDB 20
Colombia Sustainable Energy Finance Program
Private IFC 7
Colombia
Technological Transformation Program for Bogota's Integrated Public Transport System (BOGOTA SITP)
Public IDB 40
Colombia Utility Scale RE-geothermal Public IDB 10 50
DPSP-Regional
Energy Efficiency and Self-Supply Renewable Energy Program
Private IDB 20 35 35
DPSP-Regional
Private Sector Geothermal Program: Indonesia & Philippines
Private ADB 30 90 90
DPSP-Regional
Renewable Energy Mini-grids and Distributed Power Generation
Private ADB 34 2 30 2 7 30
DPSP-Regional
SEMed Private Renewable Energy Framework (SPREF)
Private EBRD 35 432 432
DPSP-Regional
Utility Scale Renewable Energy: Geothermal / Caribbean
Public IDB 20 62 62
DPSP-Regional
Utility Scale Renewable Energy: Solar Photovoltaic Financing
Private IFC 35 90 90
Egypt Wind Power Development Project(Transmission) T&D
Public IBRD 150 790 790
Honduras Utility Scale Renewable Energy: Solar Photovoltaic Financing
Private IFC 20 82 80 82 80

41
Total Solar Wind Hydro Geothermal Other
Country Project name Public / Private
MDB CTF
US$M 20
17
Cu
mu
lati
ve
Targ
et
20
17
Cu
mu
lati
ve
Targ
et
20
17
Cu
mu
lati
ve
Targ
et
20
17
Cu
mu
lati
ve
Targ
et
20
17
Cu
mu
lati
ve
Targ
et
20
17
Cu
mu
lati
ve
Targ
et
India Grid connected rooftop solar Public IBRD 125 4 4 400 4 4 400
India Himachal Pradesh Environmentally Sustainable Development Policy Loan
Public IBRD 100 135 1,334 135 1,334
India Partial Risk Sharing Facility in Energy Efficiency
Public IBRD 25
India Shared Infrastructure for Solar Parks
Public IBRD 50 3,500 3,500
India Solar Park Transmission Public ADB 50 4,200 4,200
India Solar Park: Rajasthan Public ADB 200 4,300 4,300
India Solar Rooftop PV Public ADB 175 400 400
Indonesia Geothermal Electricity Finance Private IFC 50 660 660
Indonesia Geothermal Energy Upstream Development Project
Public IBRD 50 65 65
Indonesia Indonesia Geothermal Clean Energy Investment Project
Public IBRD 125 75 150 150 75 150 150
Indonesia Private Sector Geothermal Energy Program
Private ADB 150 105 105 750 105 105 750
Kazakhstan District Heating Modernization Framework
Private EBRD 34
Kazakhstan Renewable Energy Finance Facility (KAZREFF)
Private EBRD 39 50 50 65 50 50 65
Kazakhstan Renewable Energy I-Waste Management Framework
Private EBRD 27 65 65
Kazakhstan Renewable Energy II-Kazakh Railways Sustainable Energy Program
Private EBRD 1
Kazakhstan Yereymentau Large Wind Power Plant
Private EBRD 26 50 50
MENA-CSP Morocco Ouarzazate CSP (Noor I) Public IBRD + AfDB
197 160 160 160 160
MENA-CSP Morocco-Noor II and III CSP Public IBRD + AfDB
238 350 350
Mexico ECOCASA Program-Energy Efficiency Program Part II
Public IDB 52
Mexico Efficient Lighting and Appliance Project
Public IBRD 50
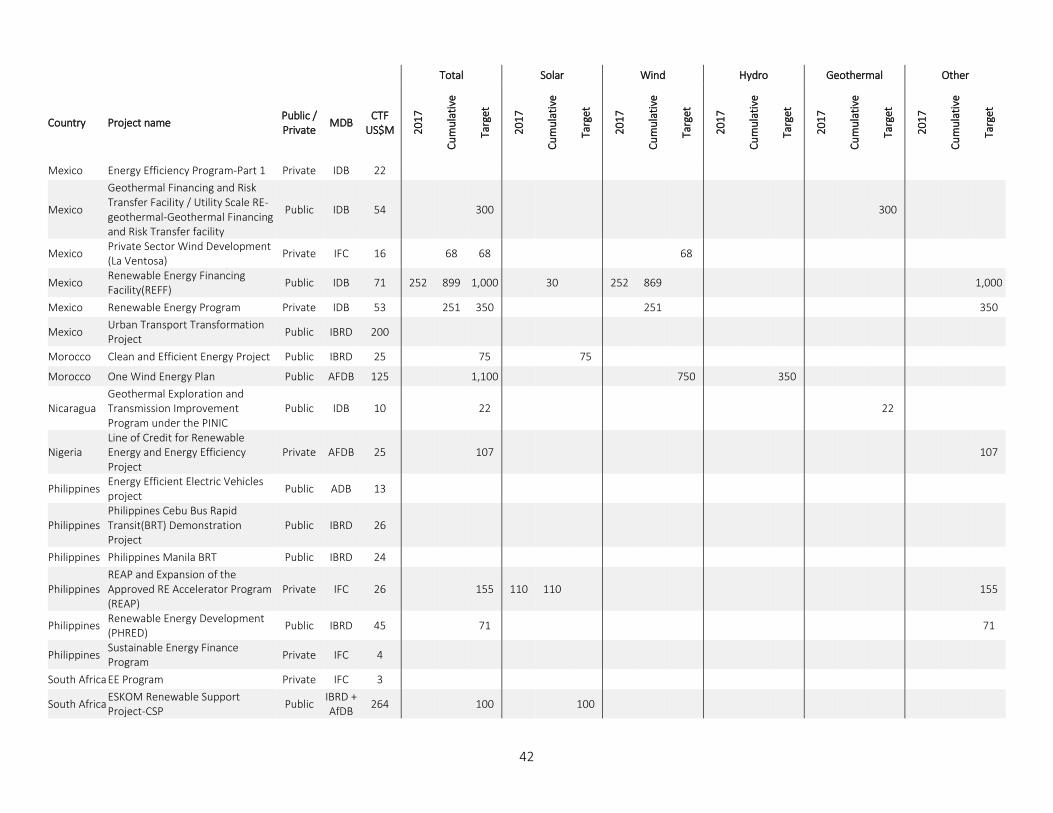
42
Total Solar Wind Hydro Geothermal Other
Country Project name Public / Private
MDB CTF
US$M 20
17
Cu
mu
lati
ve
Targ
et
20
17
Cu
mu
lati
ve
Targ
et
20
17
Cu
mu
lati
ve
Targ
et
20
17
Cu
mu
lati
ve
Targ
et
20
17
Cu
mu
lati
ve
Targ
et
20
17
Cu
mu
lati
ve
Targ
et
Mexico Energy Efficiency Program-Part 1 Private IDB 22
Mexico
Geothermal Financing and Risk Transfer Facility / Utility Scale RE-geothermal-Geothermal Financing and Risk Transfer facility
Public IDB 54 300 300
Mexico Private Sector Wind Development (La Ventosa)
Private IFC 16 68 68 68
Mexico Renewable Energy Financing Facility(REFF)
Public IDB 71 252 899 1,000 30 252 869 1,000
Mexico Renewable Energy Program Private IDB 53 251 350 251 350
Mexico Urban Transport Transformation Project
Public IBRD 200
Morocco Clean and Efficient Energy Project Public IBRD 25 75 75
Morocco One Wind Energy Plan Public AFDB 125 1,100 750 350
Nicaragua Geothermal Exploration and Transmission Improvement Program under the PINIC
Public IDB 10 22 22
Nigeria Line of Credit for Renewable Energy and Energy Efficiency Project
Private AFDB 25 107 107
Philippines Energy Efficient Electric Vehicles project
Public ADB 13
Philippines Philippines Cebu Bus Rapid Transit(BRT) Demonstration Project
Public IBRD 26
Philippines Philippines Manila BRT Public IBRD 24
Philippines REAP and Expansion of the Approved RE Accelerator Program (REAP)
Private IFC 26 155 110 110 155
Philippines Renewable Energy Development (PHRED)
Public IBRD 45 71 71
Philippines Sustainable Energy Finance Program
Private IFC 4
South Africa EE Program Private IFC 3
South Africa ESKOM Renewable Support Project-CSP
Public IBRD + AfDB
264 100 100

43
Total Solar Wind Hydro Geothermal Other
Country Project name Public / Private
MDB CTF
US$M 20
17
Cu
mu
lati
ve
Targ
et
20
17
Cu
mu
lati
ve
Targ
et
20
17
Cu
mu
lati
ve
Targ
et
20
17
Cu
mu
lati
ve
Targ
et
20
17
Cu
mu
lati
ve
Targ
et
20
17
Cu
mu
lati
ve
Targ
et
South Africa ESKOM Renewable Support Project-Wind
Public IBRD + AfDB
86 100 100 100 100
South Africa Expansion of the Approved South Africa Sustainable Energy Acceleration Program (SEAP)
Private IFC 58 100
South Africa Sustainable Energy Acceleration Program
Private AFDB 39 125 125
South Africa Sustainable Energy Acceleration Program
Private IFC 43 50 150 125 50 150 125
Thailand Private Sector Renewable Energy program
Private ADB 100 81 178 520 89 120 81 89 350 50
Thailand Renewable Energy Accelerator Program(TSEFF)
Private IFC 6 15 12 15 12
Thailand Sustainable Energy Finance Program(T-SEF)
Private IFC 5
Turkey Commercial Sustainable Energy Finance(CSEF) Phase II
Private IFC 30
Turkey Commercializing Sustainable Energy Finance Program (CSEF)
Private IFC 22
Turkey Financial Innovation for Renewable Energy (FIRE) Project
Private IFC 18 75
Turkey Geothermal Development Lending Facility
Private EBRD 25 50 50
Turkey Private Sector Bank-Intermediated Project (TURSEFF II, TurREFF, Mun SEFF
Private EBRD 70 230 173 16 18 23
Turkey Private Sector RE and EE Project Public IBRD 100 -10 937 951 13 -14 214 225 525 700 181 26
Turkey Turkey Renewable Energy Integration project (T&D)
Public IBRD 50 600 600
Turkey Turkish Private Sector Sustainable Energy Financing Facility (TurSEFF)
Private EBRD 50 64 218 50 61 100 10 28 15 4 14
Turkey Utility Scale RE-geothermal Public IBRD 40 208 208
Ukraine District Heating Energy Efficiency Public IBRD 51
Ukraine District Heating Modernisation Program
Private EBRD 51
Ukraine Renewable Energy II - Novoazovsk Wind Project
Private EBRD 21 33 33 33 33
Ukraine Renewable Energy Program Private IFC 36 45 45

44
Total Solar Wind Hydro Geothermal Other
Country Project name Public / Private
MDB CTF
US$M 20
17
Cu
mu
lati
ve
Targ
et
20
17
Cu
mu
lati
ve
Targ
et
20
17
Cu
mu
lati
ve
Targ
et
20
17
Cu
mu
lati
ve
Targ
et
20
17
Cu
mu
lati
ve
Targ
et
20
17
Cu
mu
lati
ve
Targ
et
Ukraine Renewables Direct Lending Facility-Creating Markets for Renewable Power (USELF 1)
Private EBRD 27 16 74 115 14 27 13 1 3 22 2 10 115
Ukraine Residential Energy Efficiency Finance Facility (UREEFF)
Private EBRD 24
Ukraine Second Urban Infrastructure Project
Public IBRD 50
Ukraine Sustainable Energy Lending Facility Replenishment (USELF 2)
Private EBRD 28 60 60
Ukraine Ukraine Second Power Transmission Project
Public IBRD 49 1,100 1,100
Vietnam Ha Noi Sustainable Urban Transport Program
Public ADB 100
Vietnam Sustainable Urban Transport for HCMC MRT Line 2
Public ADB 50
Vietnam Vietnam Distribution Efficiency Project
Public IBRD 30


![Cover Page for [a]CTF Project/Program Approval Requestpubdocs.worldbank.org/.../1825...Project-document.pdfBrief Description of Project/Program ... Part A. Project Profile CO-L1161](https://static.fdocuments.net/doc/165x107/5f3155cb1bcb7b5d0a2db019/cover-page-for-actf-projectprogram-approval-brief-description-of-projectprogram.jpg)